Embed Size (px)
Citation preview

J R04-051
経 済
The Master Plan Studyon
Rural ElectrificationUsing
Renewable Energy Resourcesin the
Northern Part of the Republic of Ghana
Final Report(Technical Background Report)
May 2006
Japan International Cooperation AgencyEconomic Development Department
No.
JR
ED
0 6 - 0 7 0
Th
e Master P
lan S
tudy on
Ru
ral Electrification
Usin
g Ren
ewable E
nergy R
esources in
the
North
ern P
art of the R
epu
blic of Gh
ana F
inal R
eport (T
echn
ical Back
groun
d R
eport )
May 2006

Preface
In response to the request from the Government of the Republic of Ghana, the Government of
Japan decided to conduct the Master Plan Study on Rural Electrification by Renewable Energy
Resources in the Northern Part of the Republic of Ghana, and entrusted the Study to the Japan
International Cooperation Agency (JICA).
JICA sent the Study Team, headed by Mr. Masayasu ISHIGURO of Nomura Research
Institute, Ltd. and organized by Nomura Research Institute, Ltd. and Chubu Electric Power., Inc. to
Ghana five times from February 2005 to May 2006.
The Study Team had a series of discussions with the officials concerned of the Government of
the Republic of Ghana and Ministry of Energy, and conducted related field surveys. After returning to
Japan, the Study Team conducted further studies and compiled the final results in this report.
I hope that this report will contribute to the promotion of the plan and to the enhancement of
amity between our two countries.
I wish to express my sincere appreciation to the officials concerned of the Government of the
Republic of Ghana, Ministry of Energy for their close cooperation throughout the Study.
May 2006
Tadashi IZAWA
Vice President
Japan International Cooperation Agency

May 2006
Mr. Tadashi IZAWA
Vice President
Japan International Cooperation Agency
Tokyo, Japan
Letter of Transmittal
We have concluded the Master Plan Study on Rural Electrification Using Renewable Energy
Resources in the Northern Part of the Republic of Ghana, and hereby present the final report for Study.
The Study was implemented on the basis of a contract with the Japan International
Cooperation Agency (JICA) by Nomura Research Institute, Ltd. and Chubu Electric Power Co., Inc.
over a period of approximately 16 months, from February 2005 to May 2006.
The Study consisted of preparation of a Master Plan premised on establishment of a setup
enabling promotion of off-grid electrification on a sustained basis utilizing photovoltaic (PV) power
generation systems in the three northern regions of Ghana. Besides taking up problems that have
affected past PV projects, the Study Team examined advisable approaches to rural electrification (RE)
through both on-grid and off-grid programs, and identified tasks for the future in the institutional and
organizational aspects as well. In parallel with this work, the Study Team made in-depth examinations
and analyses in the technical aspect, on subjects such as procedure for forecasting demand in RE
promotion, segmentation between on-grid and off-grid programs, postulation of electrification models,
and establishment of technical standards. As the culmination of these operations, the Study Team made
recommendations concerning the approach to RE through PV systems from a holistic standpoint.
We are convinced that the implementation of these recommendations will enable sustainable
RE promotion in Ghana and, by extension, make a substantial contribution to social advancement in the
northern regions.
We earnestly hope that the Ghanaian government will actively apply the technology and
know-how transferred through the Study and implement the recommendations in this report on a
priority basis.
We are deeply indebted to the concerned personnel of the JICA, the Ministry of Foreign
Affairs, and Ministry of Economy, Trade and Industry for their support and advice. We are also grateful
for the assistance and support received in the implementation of the Study from the Ghanaian
government and other concerned Ghanaian institutions as well as the JICA office and the Japanese
embassy in Ghana.
Very truly yours,
Masayasu ISHIGURO
Team Leader
The Master Plan Study on Rural Electrification
Using Renewable Energy Resources in the
Northern Part of the Republic of Ghana

Table of Contents
Chapter 1 Introduction
1.1 Backgroud and objectives of the study...................................................................................... 1-1
1.1.1 Particulars leading up to the study...................................................................................... 1-1
1.1.2 Study objectives.................................................................................................................. 1-2
1.1.3 Study regions ...................................................................................................................... 1-2
1.1.4 Counterpart organization .................................................................................................... 1-2
1.2 Membership of the Study Team................................................................................................. 1-2
1.3 Overall work and schedule ........................................................................................................ 1-3
1.3.1 Overall work ....................................................................................................................... 1-3
1.3.2 Overall schedule ................................................................................................................. 1-5
1.4 Organization of study groups..................................................................................................... 1-5
Chapter 2 Legislative framework of the power sector
2.1 Structure of the power sector..................................................................................................... 2-1
2.1.1 EC ....................................................................................................................................... 2-1
2.1.2 PURC.................................................................................................................................. 2-2
2.1.3 VRA.................................................................................................................................... 2-2
2.1.4 ECG .................................................................................................................................... 2-3
2.1.5 NED .................................................................................................................................... 2-4
2.2 Power sector policy ................................................................................................................... 2-5
2.2.1 Poverty reduction................................................................................................................ 2-5
2.2.2 Policy framework................................................................................................................ 2-6
2.2.3 Structural reform................................................................................................................. 2-8
2.2.4 Electrification financing ..................................................................................................... 2-9
2.2.5 Environmental concerns related to electrification and PV systems .................................... 2-9
2.3 Energy prices, power tariff scheme, and market prices ........................................................... 2-10
2.3.1 Energy prices .................................................................................................................... 2-10
2.3.2 Power tariff scheme .......................................................................................................... 2-12
2.3.3 NED financial status ......................................................................................................... 2-13
2.3.4 ECG financial status ......................................................................................................... 2-18
2.3.5 Operation and Maintenance (O&M) cost in RE ............................................................... 2-19
Chapter 3 RE program based on on-grid and off-grid electrification
3.1 On-grid electrification ............................................................................................................... 3-1
3.1.1 NES and SHEP policy schemes.......................................................................................... 3-1
3.1.2 Technical aspects of NES and SHEP .................................................................................. 3-2

3.2 Off-grid PV electrification......................................................................................................... 3-5
3.2.1 Policies and schemes related to off-grid PV electrification ................................................ 3-5
3.2.2 Review of past PV projects................................................................................................. 3-8
3.2.3 Summary of problem points in past PV projects .............................................................. 3-14
3.2.4 Technical discussion for off-grid PV electrification ......................................................... 3-17
Chapter 4 Current village socioecnomic status
4.1 Objective of the village socioeconomic study ........................................................................... 4-1
4.2 Procedure of the village socioeconomic study .......................................................................... 4-2
4.2.1 Collection and analysis of secondary data .......................................................................... 4-2
4.2.2 Execution of the sample survey .......................................................................................... 4-3
4.3 Results of analysis of the village socioeconomic study findings............................................. 4-11
4.3.1 Is electrification really necessary? (justification) ............................................................. 4-12
4.3.2 What are the proper choices for the type and scale of the electrification system? (Efficacy) ...... 4-19
4.3.3 What kind of impact will electrification have? (impact) .................................................. 4-22
4.3.4 Are there any problems as regards payment for system use and the setup for O&M?
(sustainability and spontaneous expansibility).................................................................. 4-23
Chapter 5 Off-grid PV RE plan
5.1 Renewable energy potential....................................................................................................... 5-1
5.1.1 Solar power potential .......................................................................................................... 5-1
5.1.2 Mini hydropower potential ................................................................................................. 5-4
5.1.3 Wind power and biomass potential ..................................................................................... 5-8
5.2 Clarification of PV RE needs and roles................................................................................... 5-14
5.2.1 Confirmation of the role played by RE in poverty reduction ........................................... 5-14
5.2.2 Concerns about differences of quality and capacity between on-grid electrification and
off-grid PV electrification ................................................................................................. 5-14
5.2.3 Identification and analysis of needs for PV electrification in the northern regions.......... 5-14
5.3 Power demand forecast............................................................................................................ 5-16
5.3.1 Objective and methodology of demand forecast .............................................................. 5-16
5.3.2 Perspective and procedure of demand forecast................................................................. 5-17
5.3.3 Electricity demand forecast (off-grid electrification) ....................................................... 5-19
5.3.4 Electricity demand forecast (on-grid electrification) ........................................................ 5-24
5.3.5 Calculation from population statistics .............................................................................. 5-29
5.3.6 Summary of the demand forecast results .......................................................................... 5-34
5.4 Demarcation of the target areas for on- and off-grid electrification ........................................ 5-34
5.4.1 On-grid approach .............................................................................................................. 5-34
5.4.2 Off-grid approach ............................................................................................................. 5-41

5.4.3 Demarcation based on cost analysis ................................................................................. 5-51
5.5 Criteria for selection of areas................................................................................................... 5-53
5.5.1 Criteria for selection of areas in past PV projects............................................................. 5-53
5.5.2 Criteria for selection of areas for off-grid PV electrification in northern Ghana.............. 5-53
5.6 Business model for PV system diffusion................................................................................. 5-55
5.6.1 Identification and analysis of issues in past PV projects .................................................. 5-55
5.6.2 Issues to be considered for improvement.......................................................................... 5-59
5.6.3 Proposal of business models for off-grid PV electrification............................................. 5-61
5.6.4 Proposal of electrification models adapted to the socioeconomic status of communities in the
northern regions ................................................................................................................ 5-61
5.7 Roles of the government and the private sector for the spread of off-grid PV electrification ....... 5-62
5.7.1 Role of the government..................................................................................................... 5-63
5.7.2 Role of the private sector .................................................................................................. 5-63
5.8 Perspectives on off-grid PV electrification programs.............................................................. 5-64
5.9 Discussion of incentives for PV system diffusion ................................................................... 5-65
5.9.1 Conditioning of the market environment in the institutional aspect ................................. 5-65
5.9.2 Study of economic incentives based on energy prices and tariff settings ......................... 5-66
Chapter 6 Action Plan
6.1 Rebuilding of RESPRO............................................................................................................. 6-1
6.1.1 Problems facing RESPRO .................................................................................................. 6-1
6.1.2 Downsizing of the business and disposal of existing SHS assets ....................................... 6-1
6.1.3 New business model for the RESPRO................................................................................ 6-3
6.2 Establishment of the quality guarantee scheme......................................................................... 6-4
6.2.1 Type of quality assurance scheme for credibility in the market.......................................... 6-4
6.2.2 Training and establishment of test facilities........................................................................ 6-5
6.2.3 Official regulations ............................................................................................................. 6-5
6.3 Improvement of technical capabilities for PV systems (techhnical standards, test centers, training)...... 6-6
6.3.1 Technical standards, code of practice, and end user manuals ............................................. 6-6
6.3.2 Test centers and training centers ......................................................................................... 6-7
6.4 Measures for promotion of the PV industry through institutional conditioning...................... 6-12
6.4.1 Market conditioning to be executed by the government................................................... 6-12
6.4.2 Market conditioning to be performed by the private sector.............................................. 6-15
6.4.3 Conditioning of local markets........................................................................................... 6-16
6.5 Improvement of the system of spent battery processing and recycling................................... 6-16
6.5.1 Current status of processing and recycling of spent batteries........................................... 6-16
6.5.2 Proposal for improvement of the battery processing and recycling system ..................... 6-18

Chapter 7 Construction of a GIS/data base
7.1 Need for a GIS/data base ........................................................................................................... 7-1
7.2 GIS development in Ghana........................................................................................................ 7-1
7.3 Construction of the GIS/data base ............................................................................................. 7-3
7.3.1 Information needed for the GIS/data base .......................................................................... 7-3
7.3.2 Composition of the GIS/data base ...................................................................................... 7-4
7.4 Structure of the completed GIS/data base ................................................................................. 7-5
7.4.1 Main Structure ..................................................................................................................... 7-5
7.4.2 Relationship between Access and Arcview......................................................................... 7-8
7.5 Transfer of technology related to GIS data base ....................................................................... 7-8
7.6 Setup for GIS/data base maintenance and management............................................................ 7-9
Appendices
1. Questionaire of the village socioeconomic study
a) Community Profiles
b) Households Questionaire
c) Commercial, Public and Social Facilities Questionaire
d) Focus Group Discussion Guide
2. Technical Standard, Code of Practice
a) Technical Standard for Off-grid Photovoltaic Systems (Draft)
b) Code of Practice for Off-grid Photovoltaic Systems (Draft)

Contents of Tables and Figures
<Tables>
Chapter 1
Table 1.2.1 Membership of the Study Team......................................................................................... 1-2
Table 1.4.1 Study groups and main activities ....................................................................................... 1-6
Chapter 2
Table 2.1.1 Power generation facility capacity in Ghana (as of 2004)................................................ 2-3
Table 2.1.2 Energy purchase and sales, and system loss of the ECG.................................................. 2-4
Table 2.1.3 Number of ECG customers............................................................................................... 2-4
Table 2.1.4 Status of NED projects ..................................................................................................... 2-5
Table 2.2.1 Energy policy framework (excerpt of those parts related to the power sector) ................ 2-6
Table 2.3.1 Power tariffs in May 2004 .............................................................................................. 2-13
Table 2.3.2 VRA-NED P/L calculation ............................................................................................. 2-14
Table 2.3.3 VRA-NED balance sheet................................................................................................ 2-16
Table 2.3.4 VRA-NED cash flow...................................................................................................... 2-18
Table 2.3.5 Balance of RESPRO revenue and expenditure .............................................................. 2-20
Chapter 3
Table 3.1.1 Status of NES achievement as of December 2000 ........................................................... 3-2
Table 3.1.2 Main technical standards for distribution facilities .......................................................... 3-4
Table 3.1.3 Project outline................................................................................................................... 3-4
Table 3.1.4 SHEP status ...................................................................................................................... 3-5
Table 3.2.1 Policy and legislation related to off-grid electrification in Ghana.................................... 3-6
Table 3.2.2 Current training for PV engineers..................................................................................... 3-8
Table 3.2.3 PV systems installed in the RESPRO............................................................................... 3-9
Table 3.2.4 Systems installed in the Spanish project......................................................................... 3-13
Table 3.2.5 PV electrification sites in the field study........................................................................ 3-15
Table 3.2.6 Summary of problems with past PV projects ................................................................. 3-16
Table 3.2.7 Number of PV systems installed in Ghana (as of 2003)................................................. 3-17
Table 3.2.8 Examples of material specifications ............................................................................... 3-18
Table 3.2.9 List of PV system companies ......................................................................................... 3-19
Table 3.2.10 Design parameters (RESPRO and BEST Solar)........................................................... 3-22
Table 3.2.11 Recommended design conditions (for off-grid PV systems) ........................................ 3-22
Table 3.2.12 Monthly average irradiation (hours) in various areas................................................... 3-23
Table 3.2.13 Power demand .............................................................................................................. 3-23

Chapter 4
Table 4.2.1 Survey of documentation on the village socioeconomic status ........................................ 4-3
Table 4.2.2 Sample survey objectives, subjects, and items ................................................................. 4-3
Table 4.2.3 Communities covered in the survey in the Northern Region............................................ 4-7
Table 4.2.4 Communities covered in the survey in the Upper East Region ........................................ 4-9
Table 4.2.5 Communities covered in the survey in the Upper West Region ..................................... 4-10
Table 4.3.1 Number of questionnaire survey respondents ................................................................ 4-12
Table 4.3.2 Communities covered by the focus group discussion (FGD)......................................... 4-12
Table 4.3.3 Electrification of public facilities (educational and medical) in the three northern regions ....... 4-18
Table 4.3.4 Use of electrical products ............................................................................................... 4-20
Table 4.3.5 Electrification preferred by villagers.............................................................................. 4-22
Table 4.3.6 Negative effects of electrification and items of apprehension ....................................... 4-23
Table 4.3.7 Energy expenditures by ordinary households ................................................................ 4-24
Table 4.3.8 Energy expenditures by ordinary households (detailed) ................................................ 4-25
Table 4.3.9 Amount ordinary households are willing to pay for electricity...................................... 4-25
Table 4.3.10 Monthly energy expenditures by commercial facilities................................................ 4-16
Table 4.3.11 Electrical products people want to buy ........................................................................ 4-27
Table 4.3.12 Electrical product capacity and market price................................................................ 4-28
Table 4.3.13 Knowledge about electrification .................................................................................. 4-30
Chapter 5
Table 5.1.1 Annual average irradiation in each district ....................................................................... 5-2
Table 5.1.2 Monthly irradiation........................................................................................................... 5-2
Table 5.1.3 Comparison of irradiation measurements by ground observation and satellite................ 5-3
Table 5.1.4 Hydropower sites on each water system........................................................................... 5-4
Table 5.1.5 Potential mini hydropower sites ....................................................................................... 5-5
Table 5.1.6 Irrigation dam specifications ............................................................................................ 5-7
Table 5.1.7 Monthly average wind velocity (at a height of 12 m) ...................................................... 5-8
Table 5.1.8 Example of windmill specifications ................................................................................. 5-9
Table 5.1.9 Wind velocity appearance rates and annual generated output ........................................ 5-10
Table 5.1.10 Main agricultural waste in Ghana................................................................................. 5-13
Table 5.2.1 Difference of quality between grid electrification and PV electrification ...................... 5-14
Table 5.2.2 Needs for off-grid PV electrification in northern Ghana ................................................ 5-16
Table 5.3.1 Ordinary techniques for estimating power demand........................................................ 5-17
Table 5.3.2 Unit demand associated with electrical products............................................................ 5-18
Table 5.3.3 Electrification of educational and medical facilities in the three northern regions ........ 5-21
Table 5.3.4 PV system demand in unelectrified communities .......................................................... 5-24
Table 5.3.5 Use of electrical products in the three northern regions................................................. 5-25

Table 5.3.6 On-grid electrification demand among unelectrified households .................................. 5-25
Table 5.3.7 On-grid electrification demand among commercial facilities ........................................ 5-27
Table 5.3.8 On-grid electrification demand among medical facilities .............................................. 5-28
Table 5.3.9 On-grid electrification demand in unelectrified communities........................................ 5-29
Table 5.3.10 Population and number of households, commercial facilities, and public facilities .... 5-30
Table 5.3.11 Demand forecasting procedure (when the number of facilities is clear) ...................... 5-34
Table 5.3.12 Procedure for estimating the number of facilities from population.............................. 5-34
Table 5.4.1 Standard demand model (the bold enclosure indicates on-grid electrification) ............. 5-37
Table 5.4.2 Premises of the cost calculation ..................................................................................... 5-38
Table 5.4.3 Distribution line costs at the NED.................................................................................. 5-38
Table 5.4.4 Cost to be shared by terminal communities ................................................................... 5-38
Table 5.4.5 Average distance between communities in the northern regions ................................... 5-39
Table 5.4.6 PV equipment prices (RESPRO) .................................................................................... 5-41
Table 5.4.7 PV equipment prices in Japan......................................................................................... 5-42
Table 5.4.8 PV standard system prices .............................................................................................. 5-43
Table 5.4.9 Battery prices ................................................................................................................. 5-43
Table 5.4.10 Estimated electricity demand for each type of subject facility..................................... 5-44
Table 5.4.11 Estimates for battery capacity and voltage in the modeled systems............................. 5-45
Table 5.4.12 Cost of off-grid PV electrification ................................................................................ 5-45
Table 5.4.13 Annual cost for each type of PV system....................................................................... 5-47
Table 5.4.14 Power generation .......................................................................................................... 5-47
Table 5.4.15 Standard demand model (the bold enclosure indicates off-grid electrification)........... 5-49
Table 5.4.16 Cost calculation conditions .......................................................................................... 5-50
Table 5.4.17 Electrification costs under the standard demand model ............................................... 5-51
Table 5.5.1 Criteria for selection of areas in existing PV projects .................................................... 5-53
Table 5.5.2 Items to be considered in establishment of standards for area selection ........................ 5-54
Table 5.5.3 Score sheet for standards for area selection (draft) ........................................................ 5-54
Table 5.6.1 Problems and tasks related to the organizational setup .................................................. 5-56
Table 5.6.2 (1) Problems and issues in each customer category for public sector ............................. 5-57
Table 5.6.2 (2) Problems and issues in each customer category for private sector ............................ 5-58
Table 5.6.3 Business model problems and issues.............................................................................. 5-59
Table 5.6.4 Prospective PV business principals and their characteristics ......................................... 5-60
Table 5.6.5 Prospective PV business models and their characteristics.............................................. 5-60
Table 5.6.6 Business principals and business model application possibilities .................................. 5-61
Table 5.7.1 Approaches and requests of PV enterprises and NGOs................................................ 5-64
Table 5.9.1 Incentives desired by enterprises and issues for their provision..................................... 5-66
Chapter 6
Table 6.3.1 PV training center curriculum ( Tentative plan ) .......................................................... 6-10

Table 6.3.2 List of PV training center facilities and/or Test center facilities ( Tentative plan ) ...... 6-11
Table 6.4.1 Initial cost of PV electrification of major public facilities in the three northern regions ..... 6-13
Chapter 7
Table 7.2.1 Results of interviews concerning GIS .............................................................................. 7-1
Table 7.2.2 Information included in the GIS owned by the EC .......................................................... 7-2
Table 7.2.3 Layers of the GIS data in the Survey Department ............................................................ 7-3

<Figures>
Chapter 1
Figure 1.3.1 Overall flow of the study work ........................................................................................ 1-4
Figure 1.3.2 Overall schedule............................................................................................................... 1-5
Chapter 2
Figure 2.3.1 ECG power purchase and cost (millions of cedi).......................................................... 2-10
Figure 2.3.2 Trend of wholesale power tariffs................................................................................... 2-11
Chapter 3
Figure 3.1.1 Transmission and distribution line systems in the northern regions ............................... 3-3
Figure 3.2.1 Cases of PV system installation .................................................................................... 3-17
Figure 3.2.2 Distribution lines directly connected to batteries (bypass of the charge controller) ..... 3-20
Figure 3.2.3 Broken connection box and battery .............................................................................. 3-20
Chapter 4
Figure 4.1.1 Concept behind the village socioeconomic study ........................................................... 4-2
Figure 4.2.1 Map of the Northern Region ........................................................................................... 4-7
Figure 4.2.2 Map of the Upper East Region........................................................................................ 4-9
Figure 4.2.3 Map of the Upper West Region..................................................................................... 4-10
Figure 4.3.1 Main types of occupation in rural communities............................................................ 4-13
Figure 4.3.2 Activity pattern in ordinary households........................................................................ 4-14
Figure 4.3.3 Activity pattern of commercial facilities ...................................................................... 4-15
Figure 4.3.4 Activity pattern of public (educational and medical) facilities ..................................... 4-15
Figure 4.3.5 Need for electrification in each facility category.......................................................... 4-16
Figure 4.3.6 Ranking of electrification need ..................................................................................... 4-17
Chapter 5
Figure 5.1.1 Irradiation map................................................................................................................ 5-1
Figure 5.1.2 Trend of monthly irradiation ........................................................................................... 5-2
Figure 5.1.3 Trend of irradiation based on ground observation and satellite data............................... 5-3
Figure 5.1.4 Map of potential mini hydropower sites ......................................................................... 5-6
Figure 5.1.5 Average monthly rainfall over the last three years (2002 - 2004) in the northern regions ...........5-6
Figure 5.1.6 Map of wind velocity (70 m above ground) based on satellite data ............................... 5-9
Figure 5.1.7 Example of a 2,000kW windmill power curve ............................................................. 5-10
Figure 5.1.8 System of biomass energy conversion technology ....................................................... 5-11
Figure 5.1.9 Energy use distribution diagram ................................................................................... 5-12
Figure 5.1.10 Pyrolytic gasification generation system .................................................................... 5-13

Figure 5.3.1 Study flow for power demand forecast ......................................................................... 5-17
Figure 5.3.2 Distribution of payable monthly sum among unelectrified households........................ 5-19
Figure 5.3.3 Average monthly energy cost among major commercial facilities............................... 5-20
Figure 5.3.4 Model for electrification with PV systems ................................................................... 5-23
Figure 5.3.5 Population and number of households (Northern Region) ........................................... 5-30
Figure 5.3.6 Population and number of households (Upper East Region) ........................................ 5-31
Figure 5.3.7 Population and number of households (Upper West Region)....................................... 5-31
Figure 5.3.8 Population and number of commercial facilities (three northern regions).................... 5-32
Figure 5.3.9 Population and number of commercial facilities (Northern Region)............................ 5-32
Figure 5.3.10 Population and number of commercial facilities (Upper East Region) ...................... 5-32
Figure 5.3.11 Population and number of commercial facilities (Upper West Region) ..................... 5-33
Figure 5.3.12 Population and number of grain mills (three northern regions) .................................. 5-33
Figure 5.4.1 Candidate on-grid electrification areas based on policy and physical approaches ....... 5-35
Figure 5.4.2 On-grid electrification model........................................................................................ 5-36
Figure 5.4.3 Annualized cost of on-grid electrification in the Northern Region............................... 5-40
Figure 5.4.4 Annualized cost of on-grid electrification in the Upper East Region ........................... 5-40
Figure 5.4.5 Annualized cost of on-grid electrification in the Upper West Region.......................... 5-40
Figure 5.4.6 PV system example....................................................................................................... 5-42
Figure 5.4.7 Unit generation cost for each system ............................................................................ 5-48
Figure 5.4.8 On- and off-grid costs of electrification in the three northern regions.......................... 5-53
Figure 5.4.8 On- and off-grid costs of electrification in the three northern regions (In the case that there
are no other communities on the route)......................................................................... 5-32
Figure 5.4.9 On- and off-grid costs of electrification in the three northern regions (In the case that there
are all communities on the route are electrified)........................................................... 5-53
Figure 5.6.1 Differentiation between civil use and public use .......................................................... 5-62
Chapter 6
Figure 6.2.1 Organization of the quality assurance scheme................................................................ 6-4
Figure 6.3.1 Diagram of test center operation..................................................................................... 6-8
Figure 6.4.1 Conceptual diagram of revolving funds in PV projects ................................................ 6-14
Figure 6.5.1 Flow of PV battery disposal.......................................................................................... 6-17
Figure 6.5.2 Spent batteries in storage at a PV business ................................................................... 6-17
Figure 6.5.3 Flow of the processing of automobile batteries ............................................................ 6-18
Figure 6.5.4 Placement in the flow of automobile battery processing .............................................. 6-19
Figure 6.5.5 Flow of the battery recycling system in Japan .............................................................. 6-20
Chapter 7
Figure 7.2.1 GIS owned by the EC (example) .................................................................................... 7-2
Figure 7.3.1 Information required for the GIS data base..................................................................... 7-3

Figure 7.3.2 GIS data base vision ....................................................................................................... 7-4
Figure 7.4.1 GIS data base, main screen ............................................................................................. 7-5
Figure 7.4.2 Basic community data..................................................................................................... 7-5
Figure 7.4.3 Renewable energy data ................................................................................................... 7-6
Figure 7.4.4 Generation facility data................................................................................................... 7-6
Figure 7.4.5 Distribution facility data ................................................................................................. 7-7
Figure 7.4.6 Socioeconomic data ........................................................................................................ 7-7
Figure 7.4.7 GIS map .......................................................................................................................... 7-8
Figure 7.4.8 Viewing of data with Arcview........................................................................................ 7-8
Figure 7.5.1 Scene of GIS data base instruction ................................................................................. 7-9
Figure 7.6.1 Setup for GIS data base maintenance and management (proposed) ............................. 7-10

Acronyms
AAC All Aluminum Conductor
AC Alternating Current
BCS Battery Charging Station
BOHS Battery Operated Home Systems
CDM Clean Development Mechanism
CEB Benin Electricity Community
CIE Compagnie Ivoirienne d' Electricite
DANIDA Danish Agency for Development Assistance
DC Direct Current
EC Energy Commission
ECG Electricity Company of Ghana
EIA Environmental Impact Assessment
EPA Environmental Protection Agency
ESCO Energy Service Company
EU European Union
FGD Focus Discussion Group
FS Feasibility Study
GDP Gross Domestic Product
GEF Global Environmental Facilities
GIS Geographic Information System
GNPC Ghana National Petroleum Corporation
GPRS Ghana Poverty Reduction Strategy
GSB Ghana Standards Board
HIPC Highly Indebted Poor Country
ICT Information and Communication Technology
IPP Independent Power Producer
JI Joint Implementation
JICA Japan International Cooperation Agency
JSS Junior Secondary School
KII Key Informant Interview
KNUST Kwame Nkhrumah University of Science and Technology
M/M Minutes of Meeting
MLGRD Ministry of Local Government and Rural Development
MME Ministry of Mines and Energy
MOE Ministry of Energy
MOEdu Ministry of Education
MOH Ministry of Health
MOI Ministry of Industry
NED Northern Electrification Department
NEDO New Enwrgy and Industrial Technology Development Organization
NEF National Electrification Fund
NEFB National electrification Fund Board
NES National Electrification Scheme

NGO Non Governmental Organization
O&M Operation and Maintenace
ODA Official Development Assistant
OJT On the Job Trainning
PURC Public Utilities Regulatory Commission
PV Photo Voltaic
RE Rural Electrification
RESCO Rural Energy Service Company
RESPRO Renewable Energy Service Project
RETs Renewable Energy Technologies
S/W Scope of Works
SHEP Self Help Electrification Programme
SHS Solar Home System
SNEP Strategic National Energy Plan
TAPCO Takoradi Power Company
TICO Takoradi International Company
TOR Tema Oil Refinery
UNDP United Nations Development Program
UNEP United Nations Environmental Program
USAID United States Agency for International Development
VRA Volta River Authority
WB World Bank

(Source) JICA Study Team
Figure: Transmission and Distribution Network in Ghana
Upper West Region
Upper East Region
Northern Region

1-1
Chapter 1 Introduction
1.1 Backgroud and objectives of the study
1.1.1 Particulars leading up to the study
The Republic of Ghana continues to have a serious problem of poverty in rural communities. The
Ghana Poverty Reduction Strategy (GPRS) paper not only positions rural electrification (RE) projects as
essential for improvement of the standard of living and eradication of poverty among residents of these
communities, but also points out the need for installation of renewable energy systems.
The Ghana Ministry of Energy (MOE) is targeting electrification of all communities with at least 500
residents by 2020 as a final objective. To this end, it has formulated the National Electrification Scheme
(NES) and the Self Help Electrification Project (SHEP, a NES component), and is promoting RE
through extension of distribution lines. However, the power sector has fallen into financial difficulties
due to factors such as the steep depreciation of the Ghana cedi and non-payment of power charges by
large-scale customers. As a result, RE projects are not making much headway in rural communities.
Specifically, the electrification rate in the rural areas centered in the northern part of the country is
extremely low at an average 20%, as compared to corresponding rates of 30% nationwide and 60% in
urban areas.
The northern savanna region, where poverty is concentrated, is characterized by a low population
density and scattered distribution of communities and houses. These attributes present cost-related
limits to electrification by extension of distribution lines. The region also offers a high and stable
amount of insolation, and consequently has good possibilities for electrification by dispersed power
sources utilizing photovoltaic (PV) and other renewable energy systems.
Under these circumstances, in June 2003, the Ghanaian government requested the Japanese
government to conduct a developmental study for the purpose of formulating a master plan for RE over
the medium and long terms utilizing renewable energy in the northern rural areas as well as examining
approaches to a sustainable implementing setup. The Japan International Cooperation Agency (JICA)
sent a project formation study team to Ghana in February 2004 and a preliminary study team there in
October 2004. The latter team considered the particulars behind the request as well as Ghanaian wishes
regarding the study, and confirmed its importance.
This study will be implemented in accordance with the Scope of Works (S/W) signed by the Ghana
government and JICA on 12 November 2004 and the minutes of meetings (M/M) signed by the same
two parties on 2 March and 6 October 2004.
1-2
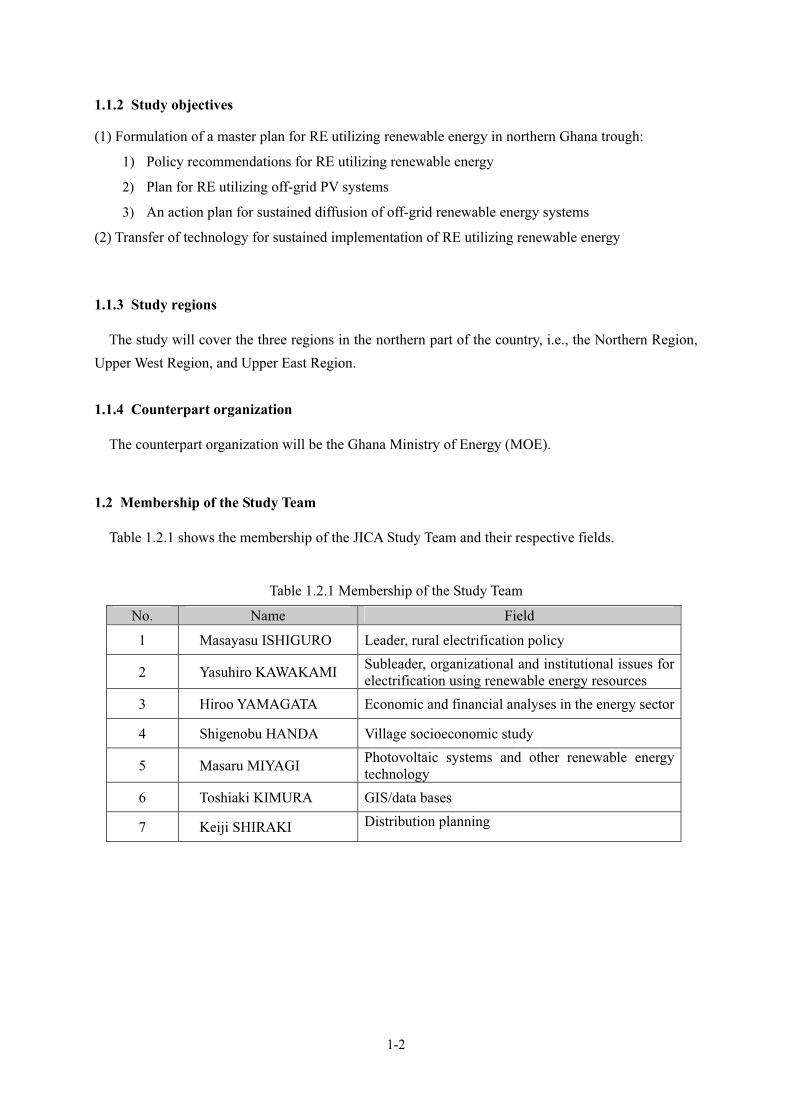
1.1.2 Study objectives
(1) Formulation of a master plan for RE utilizing renewable energy in northern Ghana trough:
1) Policy recommendations for RE utilizing renewable energy
2) Plan for RE utilizing off-grid PV systems
3) An action plan for sustained diffusion of off-grid renewable energy systems
(2) Transfer of technology for sustained implementation of RE utilizing renewable energy
1.1.3 Study regions
The study will cover the three regions in the northern part of the country, i.e., the Northern Region,
Upper West Region, and Upper East Region.
1.1.4 Counterpart organization
The counterpart organization will be the Ghana Ministry of Energy (MOE).
1.2 Membership of the Study Team
Table 1.2.1 shows the membership of the JICA Study Team and their respective fields.
Table 1.2.1 Membership of the Study Team
No. Name Field
1 Masayasu ISHIGURO Leader, rural electrification policy
2 Yasuhiro KAWAKAMI Subleader, organizational and institutional issues for
electrification using renewable energy resources
3 Hiroo YAMAGATA Economic and financial analyses in the energy sector
4 Shigenobu HANDA Village socioeconomic study
5 Masaru MIYAGI Photovoltaic systems and other renewable energy
technology
6 Toshiaki KIMURA GIS/data bases
7 Keiji SHIRAKI Distribution planning

1-3
1.3 Overall work and schedule
1.3.1 Overall work
The study consists of four stages.
Stage 1 (stage of target clarification)
The Study Team clarified the objective and framework of the study with the Ghanaian side through
discussion of the Inception Report and the first workshop.
Stage 2 (stage of basic study and RE policy study)
This stage was devoted to information collection and analysis in the following areas.
� Collection and review of basic information in areas such as RE policy, power development plans,
energy supply and demand, and renewable energy
� Commencement of the village socioeconomic study and reconsigned field study
� Study of comprehensive RE policy and the framework for off-grid PV RE
Stage 3 (stage of off-grid PV RE planning)
In this stage, the Study Team clarified specific strategies and guidelines for the autonomous and
sustained spread of off-grid PV RE, and prepare a plan for the same, through the following work.
� Formulation of comprehensive RE policy and the framework for off-grid PV RE
� Establishment of criteria for selection of off-grid PV RE sites
� Clarification of prerequisites of the off-grid PV RE model and conditions related to sustained
diffusion
� Clarification of the roles and responsibilities of the government, the RESPRO, and the
private-sector PV industry, and formulation of strategy for promotion
� Formulation of off-grid PV RE strategy consistent with public service improvement
Stage 4 (stage of action plan formulation)
Stage 4 consists of formulation of an action plan for execution of the Master Plan (for RE in northern
Ghana using renewable energy resources), i.e., a plan of action needed for achievement of the Master
Plan agenda and resolution of problems surfacing in the process of execution. Figure 1.3.1 shows the
overall flow of the study work.

1-4
Fig
ure
1.3
.1 O
ver
all
flo
w o
f th
e st
ud
y w
ork
1-4
Rep
ort
s
Sem
inar
s
54
32
11
21
11
09
87
65
43
2M
ont
h
Study
Sta
ge
Stu
die
s in
Gh
an
a
Tas
ks
in J
apa
n
Study
Sta
ge
May
Apr.
Mar
.F
eb.
Jan
.D
ec.
Nov
.O
ct.
Sep
.A
ug.
Jul.
Jun
.M
ayA
pr.
Mar
.F
eb.
Mont
h
2006
200
52
004
Fis
cal
Year
1st
task
in J
apan
1st
fie
ld s
tudy
in
Gh
ana
2n
d ta
sk i
n Ja
pan
2n
d f
ield
stu
dy in
Ghn
a
3rd
tas
k in
Jap
an 3
rd f
ield
stu
dy
in
Gha
na4th
fie
ld s
tudy i
n G
han
a
4th
task
in
Jap
an
5th
fie
ld s
tudy i
n G
han
a
5th
task
in J
apan
6th
task
in
Jap
an
C/P
Tra
inin
g
Fir
st task
in J
apan
■R
evie
w o
f av
aila
ble
do
cum
enta
tion
and
form
ula
tion
of
stud
y pl
ans
■P
rep
arat
ion
of
Ince
ptio
n R
epo
rt
■P
rep
arat
ion
of
the
firs
t wo
rksh
op
Fir
st f
ield
stu
dy
in G
hana
■P
rese
nta
tion
and
dis
cuss
ion
of t
he
Ince
ptio
n R
epo
rt
■O
rgan
izat
ion
of
stud
y g
roup
s
■C
oop
erat
ion
with
mee
ting
s o
f th
e
Co
ord
inat
ion
Co
mm
itte
e
■S
upp
ort
for t
he
stag
ing
of t
he
firs
t w
ork
shop
■S
tudy
of p
lan
s fo
r te
chno
log
y tr
ansf
er
■In
form
atio
n c
oll
ectio
n a
nd
anal
ysis
(1)
Fourt
h f
ield
stu
dy
in G
hana
■F
orm
ula
tion
of
an a
ctio
n pl
an f
or
imp
rov
emen
t of
RES
PRO
act
iviti
es
■F
orm
ula
tion
of
an a
ctio
n pl
an f
or
HR
D a
nd c
ond
ition
ing
of t
est f
acil
itie
s
■E
stab
lish
men
t of
(dra
ft)
tech
nic
al a
nd in
stal
latio
n st
and
ard
s fo
r PV
sys
tem
s
■F
orm
ula
tion
of
an a
ctio
n pl
an f
or
rein
forc
emen
t of
the
dom
esti
c P
V in
dus
try,
con
ditio
nin
g o
f th
e lo
cal
mar
ket
, and
pro
mo
tion
of
pro
du
ctio
n a
ctiv
ities
usi
ng
PV
sys
tem
s
■D
isse
min
atio
n o
f in
form
atio
n f
or p
rom
otio
n o
f off
-grid
PV
RE
and
pre
par
atio
n
of
a re
late
d ac
tion
plan
■F
orm
ula
tion
of
an a
ctio
n pl
an f
or
effe
ctiv
e an
d s
ust
ain
ed u
se o
fPV
sys
tem
s
con
trib
utin
g to
imp
rov
emen
t of p
ubli
c se
rvic
es
■F
orm
ula
tion
of
an a
ctio
n pl
an f
or
imp
rov
emen
t of
the
pro
cess
ing
and
rec
ycl
ing
of s
pen
t bat
teri
es
■C
ons
tru
ctio
n o
f a
dat
a b
ase
for p
lann
ing
and
im
ple
men
tatio
n o
f off
-grid
PV
RE
Fif
th task
in J
apan
■P
rep
arat
ion
of
the
dra
ft F
inal
Rep
ort
■P
rep
arat
ion
s fo
r th
e se
cond
wo
rksh
op
■P
ropo
sal o
f a
fram
ewo
rk f
or o
ngo
ing
TA
■S
upp
ort
for
acce
pta
nce
of
coun
terp
art
trai
nee
s
Fif
th f
ield
stu
dy
in G
hana
■P
rese
nta
tion
and
dis
cuss
ion
of t
he
dra
ft F
inal
Rep
ort
■S
upp
ort
for t
he
stag
ing
of t
he
thir
d w
ork
shop
■S
tag
ing
of
the
tech
nic
al s
emin
ar
Six
th task
in J
apan
■P
rep
arat
ion
of
the
Fin
al R
epo
rt
Th
e 1
st w
ork
sho
pT
he
2n
d w
ork
sho
pT
he
3rd
wo
rksh
op
T
ech
nic
al S
em
inar
Ince
pti
on R
epo
rt
Inte
rim
Rep
ort
Dra
ft F
inal
Rep
ort
▲P
rog
ress
rep
ort
▲T
echn
olog
y t
ran
sfer
rep
ort
▲T
T r
epo
rt
Sta
ge o
f B
asi
c S
tudie
s a
nd
RE
Poli
cy S
tudie
s
Sta
ge o
f o
ff-g
rid P
V R
E P
lan
nin
g
Sta
ge o
f A
cti
on
Pla
n
Fo
rmu
lati
on
Re-
con
sig
ned
fiel
d S
tud
y
1st
task
in J
apan
1st
fie
ld s
tudy
in
Gh
ana
2n
d ta
sk i
n Ja
pan
2n
d f
ield
stu
dy
in G
han
a
3rd
tas
k in
Jap
an
3rd
fie
ld s
tudy
in G
han
a
4th
fie
ld s
tudy i
n G
han
a
4th
task
in J
apan
5th
field
stu
dy i
n G
han
a
5th t
ask
in
Jap
an6th
tas
k in
Jap
an
C/P
trai
nin
g
Re-
con
sig
ned
fiel
d S
tud
y
Fourt
h task
in J
apan
■P
rep
arat
ion
s fo
r fo
rmu
latio
n o
f th
e ac
tion
pla
n
■E
stab
lish
men
t of
stan
dar
ds
for s
elec
tion
of
dist
rict
s fo
r off
-grid
PV
RE
■A
nal
ysi
s o
f m
eth
ods
of o
ff-g
rid P
V s
yste
m d
iffu
sion
■A
nal
ysi
s re
late
d to
th
e su
stai
ned
dif
fusi
on o
f off
-grid
PV
sy
stem
s
■A
nal
ysi
s o
f th
e ro
les
and
res
pons
ibil
itie
s o
f gov
ern
men
t, R
ESP
RO
, an
d p
riv
ate
indu
stry
, an
d f
orm
ula
tion
of
rela
ted
str
ateg
y
■F
orm
ula
tion
of
an o
ff-g
rid
PV
RE
str
ateg
y c
onsi
sten
t w
ith th
e ai
m o
f im
pro
ved
publ
ic s
erv
ices
■P
rep
arat
ion
an
d di
scu
ssio
n o
f th
e In
teri
m R
epo
rt
■S
upp
ort
for t
he
stag
ing
of t
he
seco
nd w
ork
shop
Second task
in J
apan
■P
rep
arat
ion
s fo
r th
e v
illa
ge
soci
o-e
cono
mic
stu
dy a
nd f
or t
he
reco
nsi
gn
edfi
eld
Stu
dy
Thir
d task
in J
apan
■P
rep
arat
ion
s fo
r th
e In
teri
m R
epo
rt
■P
rep
arat
ion
s fo
r th
e se
cond
wo
rksh
op
■A
nal
ysi
s o
f th
e re
cons
ign
edfi
led
stu
dy
Second f
ield
stu
dy in G
hana
■In
form
atio
n c
oll
ectio
n a
nd
anal
ysis
(2)
■R
evie
w o
f bas
ic i
nfo
rmat
ion
rela
ted
to R
E po
licy
■R
evie
w o
f pla
ns
for p
ow
er d
evel
op
men
t
■A
nal
ysi
s o
f bas
ic i
nfo
rmat
ion
on E
IA
■R
evie
w a
nd a
nal
ysis
of
exis
ting
PV
RE
pro
ject
s
■R
evie
w o
f G
IS/d
atab
ase
info
rmat
ion
and
pro
posa
l of a
mod
el
■B
asic
so
cio
-eco
no
mic
stu
dy
of v
illag
es
■S
tudy
of p
oten
tial
rela
ted
to r
enew
able
en
ergy
■S
tudy
of o
ff-g
rid P
V R
E m
odel
s
■P
ower
dem
and
fo
reca
st (d
iscu
ssio
n o
f m
eth
odo
logy
)
■C
om
par
ativ
e an
aly
sis
of
RE
cost
s (d
iscu
ssio
n o
f m
etho
dolo
gy
)
■C
om
par
ativ
e an
aly
sis
of
ener
gy p
rice
an
d R
E in
cen
tives
(dis
cuss
ion
of
met
hodo
log
y)
■P
rep
arat
ion
of
reco
mm
end
atio
n fo
r ra
te-s
etti
ng a
nd in
cen
tives
(dis
cuss
ion
of
met
hodo
log
y)
■E
stab
lish
men
t of
stan
dar
ds
for s
elec
tion
of
dist
rict
s
for o
ff-g
rid P
V R
E (d
iscu
ssio
n o
f met
hod
olo
gy
)
■Im
ple
men
tatio
n o
f th
e v
illag
e so
cio
-eco
no
mic
stu
dy
tho
roug
h
reco
nsi
gn
men
t
Thir
d f
ield
stu
dy in G
hana
■Im
ple
men
tatio
n o
f po
wer
dem
and
fore
cast
■C
om
par
ativ
e an
aly
sis
of
RE
cost
s
■C
lari
fica
tion
of
role
s fo
r off
-gri
d P
V R
E in
no
rther
n G
han
a
■C
om
par
ativ
e an
aly
sis
of
ener
gy p
rice
an
d R
E in
cen
tives
■P
rep
arat
ion
of
reco
mm
end
atio
n fo
r ra
te-s
etti
ng a
nd in
cen
tives
■C
lari
fica
tion
of p
ubli
c an
d p
rivat
e ro
les
for
PV s
yst
em d
iffu
sion
■S
um
mar
y o
f re
com
men
dat
ion
s fo
r co
mp
reh
ensi
ve
RE
po
licy
▲P
rog
ress
Rep
ort
▲T
echn
olog
y t
ran
sfer
rep
ort
Sta
ge o
f T
arg
et
Cla
rifi
cati
on
Fin
al R
epo
rt
Rep
ort
s
Sem
inar
s
54
32
11
21
11
09
87
65
43
2M
ont
h
Study
Sta
ge
Stu
die
s in
Gh
an
a
Tas
ks
in J
apa
n
Study
Sta
ge
May
Apr.
Mar
.F
eb.
Jan
.D
ec.
Nov
.O
ct.
Sep
.A
ug.
Jul.
Jun
.M
ayA
pr.
Mar
.F
eb.
Mont
h
2006
200
52
004
Fis
cal
Year
1st
task
in J
apan
1st
fie
ld s
tudy
in
Gh
ana
2n
d ta
sk i
n Ja
pan
2n
d f
ield
stu
dy in
Ghn
a
3rd
tas
k in
Jap
an 3
rd f
ield
stu
dy
in
Gha
na4th
fie
ld s
tudy i
n G
han
a
4th
task
in
Jap
an
5th
fie
ld s
tudy i
n G
han
a
5th
task
in J
apan
6th
task
in
Jap
an
C/P
Tra
inin
g
Fir
st task
in J
apan
■R
evie
w o
f av
aila
ble
do
cum
enta
tion
and
form
ula
tion
of
stud
y pl
ans
■P
rep
arat
ion
of
Ince
ptio
n R
epo
rt
■P
rep
arat
ion
of
the
firs
t wo
rksh
op
Fir
st f
ield
stu
dy
in G
hana
■P
rese
nta
tion
and
dis
cuss
ion
of t
he
Ince
ptio
n R
epo
rt
■O
rgan
izat
ion
of
stud
y g
roup
s
■C
oop
erat
ion
with
mee
ting
s o
f th
e
Co
ord
inat
ion
Co
mm
itte
e
■S
upp
ort
for t
he
stag
ing
of t
he
firs
t w
ork
shop
■S
tudy
of p
lan
s fo
r te
chno
log
y tr
ansf
er
■In
form
atio
n c
oll
ectio
n a
nd
anal
ysis
(1)
Fourt
h f
ield
stu
dy
in G
hana
■F
orm
ula
tion
of
an a
ctio
n pl
an f
or
imp
rov
emen
t of
RES
PRO
act
iviti
es
■F
orm
ula
tion
of
an a
ctio
n pl
an f
or
HR
D a
nd c
ond
ition
ing
of t
est f
acil
itie
s
■E
stab
lish
men
t of
(dra
ft)
tech
nic
al a
nd in
stal
latio
n st
and
ard
s fo
r PV
sys
tem
s
■F
orm
ula
tion
of
an a
ctio
n pl
an f
or
rein
forc
emen
t of
the
dom
esti
c P
V in
dus
try,
con
ditio
nin
g o
f th
e lo
cal
mar
ket
, and
pro
mo
tion
of
pro
du
ctio
n a
ctiv
ities
usi
ng
PV
sys
tem
s
■D
isse
min
atio
n o
f in
form
atio
n f
or p
rom
otio
n o
f off
-grid
PV
RE
and
pre
par
atio
n
of
a re
late
d ac
tion
plan
■F
orm
ula
tion
of
an a
ctio
n pl
an f
or
effe
ctiv
e an
d s
ust
ain
ed u
se o
fPV
sys
tem
s
con
trib
utin
g to
imp
rov
emen
t of p
ubli
c se
rvic
es
■F
orm
ula
tion
of
an a
ctio
n pl
an f
or
imp
rov
emen
t of
the
pro
cess
ing
and
rec
ycl
ing
of s
pen
t bat
teri
es
■C
ons
tru
ctio
n o
f a
dat
a b
ase
for p
lann
ing
and
im
ple
men
tatio
n o
f off
-grid
PV
RE
Fif
th task
in J
apan
■P
rep
arat
ion
of
the
dra
ft F
inal
Rep
ort
■P
rep
arat
ion
s fo
r th
e se
cond
wo
rksh
op
■P
ropo
sal o
f a
fram
ewo
rk f
or o
ngo
ing
TA
■S
upp
ort
for
acce
pta
nce
of
coun
terp
art
trai
nee
s
Fif
th f
ield
stu
dy
in G
hana
■P
rese
nta
tion
and
dis
cuss
ion
of t
he
dra
ft F
inal
Rep
ort
■S
upp
ort
for t
he
stag
ing
of t
he
thir
d w
ork
shop
■S
tag
ing
of
the
tech
nic
al s
emin
ar
Six
th task
in J
apan
■P
rep
arat
ion
of
the
Fin
al R
epo
rt
Th
e 1
st w
ork
sho
pT
he
2n
d w
ork
sho
pT
he
3rd
wo
rksh
op
T
ech
nic
al S
em
inar
Ince
pti
on R
epo
rt
Inte
rim
Rep
ort
Dra
ft F
inal
Rep
ort
▲P
rog
ress
rep
ort
▲T
echn
olog
y t
ran
sfer
rep
ort
▲T
T r
epo
rt
Sta
ge o
f B
asi
c S
tudie
s a
nd
RE
Poli
cy S
tudie
s
Sta
ge o
f o
ff-g
rid P
V R
E P
lan
nin
g
Sta
ge o
f A
cti
on
Pla
n
Fo
rmu
lati
on
Re-
con
sig
ned
fiel
d S
tud
y
1st
task
in J
apan
1st
fie
ld s
tudy
in
Gh
ana
2n
d ta
sk i
n Ja
pan
2n
d f
ield
stu
dy
in G
han
a
3rd
tas
k in
Jap
an
3rd
fie
ld s
tudy
in G
han
a
4th
fie
ld s
tudy i
n G
han
a
4th
task
in J
apan
5th
field
stu
dy i
n G
han
a
5th t
ask
in
Jap
an6th
tas
k in
Jap
an
C/P
trai
nin
g
Re-
con
sig
ned
fiel
d S
tud
y
Fourt
h task
in J
apan
■P
rep
arat
ion
s fo
r fo
rmu
latio
n o
f th
e ac
tion
pla
n
■E
stab
lish
men
t of
stan
dar
ds
for s
elec
tion
of
dist
rict
s fo
r off
-grid
PV
RE
■A
nal
ysi
s o
f m
eth
ods
of o
ff-g
rid P
V s
yste
m d
iffu
sion
■A
nal
ysi
s re
late
d to
th
e su
stai
ned
dif
fusi
on o
f off
-grid
PV
sy
stem
s
■A
nal
ysi
s o
f th
e ro
les
and
res
pons
ibil
itie
s o
f gov
ern
men
t, R
ESP
RO
, an
d p
riv
ate
indu
stry
, an
d f
orm
ula
tion
of
rela
ted
str
ateg
y
■F
orm
ula
tion
of
an o
ff-g
rid
PV
RE
str
ateg
y c
onsi
sten
t w
ith th
e ai
m o
f im
pro
ved
publ
ic s
erv
ices
■P
rep
arat
ion
an
d di
scu
ssio
n o
f th
e In
teri
m R
epo
rt
■S
upp
ort
for t
he
stag
ing
of t
he
seco
nd w
ork
shop
Second task
in J
apan
■P
rep
arat
ion
s fo
r th
e v
illa
ge
soci
o-e
cono
mic
stu
dy a
nd f
or t
he
reco
nsi
gn
edfi
eld
Stu
dy
Thir
d task
in J
apan
■P
rep
arat
ion
s fo
r th
e In
teri
m R
epo
rt
■P
rep
arat
ion
s fo
r th
e se
cond
wo
rksh
op
■A
nal
ysi
s o
f th
e re
cons
ign
edfi
led
stu
dy
Second f
ield
stu
dy in G
hana
■In
form
atio
n c
oll
ectio
n a
nd
anal
ysis
(2)
■R
evie
w o
f bas
ic i
nfo
rmat
ion
rela
ted
to R
E po
licy
■R
evie
w o
f pla
ns
for p
ow
er d
evel
op
men
t
■A
nal
ysi
s o
f bas
ic i
nfo
rmat
ion
on E
IA
■R
evie
w a
nd a
nal
ysis
of
exis
ting
PV
RE
pro
ject
s
■R
evie
w o
f G
IS/d
atab
ase
info
rmat
ion
and
pro
posa
l of a
mod
el
■B
asic
so
cio
-eco
no
mic
stu
dy
of v
illag
es
■S
tudy
of p
oten
tial
rela
ted
to r
enew
able
en
ergy
■S
tudy
of o
ff-g
rid P
V R
E m
odel
s
■P
ower
dem
and
fo
reca
st (d
iscu
ssio
n o
f m
eth
odo
logy
)
■C
om
par
ativ
e an
aly
sis
of
RE
cost
s (d
iscu
ssio
n o
f m
etho
dolo
gy
)
■C
om
par
ativ
e an
aly
sis
of
ener
gy p
rice
an
d R
E in
cen
tives
(dis
cuss
ion
of
met
hodo
log
y)
■P
rep
arat
ion
of
reco
mm
end
atio
n fo
r ra
te-s
etti
ng a
nd in
cen
tives
(dis
cuss
ion
of
met
hodo
log
y)
■E
stab
lish
men
t of
stan
dar
ds
for s
elec
tion
of
dist
rict
s
for o
ff-g
rid P
V R
E (d
iscu
ssio
n o
f met
hod
olo
gy
)
■Im
ple
men
tatio
n o
f th
e v
illag
e so
cio
-eco
no
mic
stu
dy
tho
roug
h
reco
nsi
gn
men
t
Thir
d f
ield
stu
dy in G
hana
■Im
ple
men
tatio
n o
f po
wer
dem
and
fore
cast
■C
om
par
ativ
e an
aly
sis
of
RE
cost
s
■C
lari
fica
tion
of
role
s fo
r off
-gri
d P
V R
E in
no
rther
n G
han
a
■C
om
par
ativ
e an
aly
sis
of
ener
gy p
rice
an
d R
E in
cen
tives
■P
rep
arat
ion
of
reco
mm
end
atio
n fo
r ra
te-s
etti
ng a
nd in
cen
tives
■C
lari
fica
tion
of p
ubli
c an
d p
rivat
e ro
les
for
PV s
yst
em d
iffu
sion
■S
um
mar
y o
f re
com
men
dat
ion
s fo
r co
mp
reh
ensi
ve
RE
po
licy
▲P
rog
ress
Rep
ort
▲T
echn
olog
y t
ran
sfer
rep
ort
Sta
ge o
f T
arg
et
Cla
rifi
cati
on
Rep
ort
s
Sem
inar
s
54
32
11
21
11
09
87
65
43
2M
ont
h
Study
Sta
ge
Stu
die
s in
Gh
an
a
Tas
ks
in J
apa
n
Study
Sta
ge
May
Apr.
Mar
.F
eb.
Jan
.D
ec.
Nov
.O
ct.
Sep
.A
ug.
Jul.
Jun
.M
ayA
pr.
Mar
.F
eb.
Mont
h
2006
200
52
004
Fis
cal
Year
1st
task
in J
apan
1st
fie
ld s
tudy
in
Gh
ana
2n
d ta
sk i
n Ja
pan
2n
d f
ield
stu
dy in
Ghn
a
3rd
tas
k in
Jap
an 3
rd f
ield
stu
dy
in
Gha
na4th
fie
ld s
tudy i
n G
han
a
4th
task
in
Jap
an
5th
fie
ld s
tudy i
n G
han
a
5th
task
in J
apan
6th
task
in
Jap
an
C/P
Tra
inin
g
Fir
st task
in J
apan
■R
evie
w o
f av
aila
ble
do
cum
enta
tion
and
form
ula
tion
of
stud
y pl
ans
■P
rep
arat
ion
of
Ince
ptio
n R
epo
rt
■P
rep
arat
ion
of
the
firs
t wo
rksh
op
Fir
st f
ield
stu
dy
in G
hana
■P
rese
nta
tion
and
dis
cuss
ion
of t
he
Ince
ptio
n R
epo
rt
■O
rgan
izat
ion
of
stud
y g
roup
s
■C
oop
erat
ion
with
mee
ting
s o
f th
e
Co
ord
inat
ion
Co
mm
itte
e
■S
upp
ort
for t
he
stag
ing
of t
he
firs
t w
ork
shop
■S
tudy
of p
lan
s fo
r te
chno
log
y tr
ansf
er
■In
form
atio
n c
oll
ectio
n a
nd
anal
ysis
(1)
Fourt
h f
ield
stu
dy
in G
hana
■F
orm
ula
tion
of
an a
ctio
n pl
an f
or
imp
rov
emen
t of
RES
PRO
act
iviti
es
■F
orm
ula
tion
of
an a
ctio
n pl
an f
or
HR
D a
nd c
ond
ition
ing
of t
est f
acil
itie
s
■E
stab
lish
men
t of
(dra
ft)
tech
nic
al a
nd in
stal
latio
n st
and
ard
s fo
r PV
sys
tem
s
■F
orm
ula
tion
of
an a
ctio
n pl
an f
or
rein
forc
emen
t of
the
dom
esti
c P
V in
dus
try,
con
ditio
nin
g o
f th
e lo
cal
mar
ket
, and
pro
mo
tion
of
pro
du
ctio
n a
ctiv
ities
usi
ng
PV
sys
tem
s
■D
isse
min
atio
n o
f in
form
atio
n f
or p
rom
otio
n o
f off
-grid
PV
RE
and
pre
par
atio
n
of
a re
late
d ac
tion
plan
■F
orm
ula
tion
of
an a
ctio
n pl
an f
or
effe
ctiv
e an
d s
ust
ain
ed u
se o
fPV
sys
tem
s
con
trib
utin
g to
imp
rov
emen
t of p
ubli
c se
rvic
es
■F
orm
ula
tion
of
an a
ctio
n pl
an f
or
imp
rov
emen
t of
the
pro
cess
ing
and
rec
ycl
ing
of s
pen
t bat
teri
es
■C
ons
tru
ctio
n o
f a
dat
a b
ase
for p
lann
ing
and
im
ple
men
tatio
n o
f off
-grid
PV
RE
Fif
th task
in J
apan
■P
rep
arat
ion
of
the
dra
ft F
inal
Rep
ort
■P
rep
arat
ion
s fo
r th
e se
cond
wo
rksh
op
■P
ropo
sal o
f a
fram
ewo
rk f
or o
ngo
ing
TA
■S
upp
ort
for
acce
pta
nce
of
coun
terp
art
trai
nee
s
Fif
th f
ield
stu
dy
in G
hana
■P
rese
nta
tion
and
dis
cuss
ion
of t
he
dra
ft F
inal
Rep
ort
■S
upp
ort
for t
he
stag
ing
of t
he
thir
d w
ork
shop
■S
tag
ing
of
the
tech
nic
al s
emin
ar
Six
th task
in J
apan
■P
rep
arat
ion
of
the
Fin
al R
epo
rt
Th
e 1
st w
ork
sho
pT
he
2n
d w
ork
sho
pT
he
3rd
wo
rksh
op
T
ech
nic
al S
em
inar
Ince
pti
on R
epo
rt
Inte
rim
Rep
ort
Dra
ft F
inal
Rep
ort
▲P
rog
ress
rep
ort
▲T
echn
olog
y t
ran
sfer
rep
ort
▲T
T r
epo
rt
Sta
ge o
f B
asi
c S
tudie
s a
nd
RE
Poli
cy S
tudie
s
Sta
ge o
f o
ff-g
rid P
V R
E P
lan
nin
g
Sta
ge o
f A
cti
on
Pla
n
Fo
rmu
lati
on
Re-
con
sig
ned
fiel
d S
tud
y
1st
task
in J
apan
1st
fie
ld s
tudy
in
Gh
ana
2n
d ta
sk i
n Ja
pan
2n
d f
ield
stu
dy
in G
han
a
3rd
tas
k in
Jap
an
3rd
fie
ld s
tudy
in G
han
a
4th
fie
ld s
tudy i
n G
han
a
4th
task
in J
apan
5th
field
stu
dy i
n G
han
a
5th t
ask
in
Jap
an6th
tas
k in
Jap
an
C/P
trai
nin
g
Re-
con
sig
ned
fiel
d S
tud
y
Fourt
h task
in J
apan
■P
rep
arat
ion
s fo
r fo
rmu
latio
n o
f th
e ac
tion
pla
n
■E
stab
lish
men
t of
stan
dar
ds
for s
elec
tion
of
dist
rict
s fo
r off
-grid
PV
RE
■A
nal
ysi
s o
f m
eth
ods
of o
ff-g
rid P
V s
yste
m d
iffu
sion
■A
nal
ysi
s re
late
d to
th
e su
stai
ned
dif
fusi
on o
f off
-grid
PV
sy
stem
s
■A
nal
ysi
s o
f th
e ro
les
and
res
pons
ibil
itie
s o
f gov
ern
men
t, R
ESP
RO
, an
d p
riv
ate
indu
stry
, an
d f
orm
ula
tion
of
rela
ted
str
ateg
y
■F
orm
ula
tion
of
an o
ff-g
rid
PV
RE
str
ateg
y c
onsi
sten
t w
ith th
e ai
m o
f im
pro
ved
publ
ic s
erv
ices
■P
rep
arat
ion
an
d di
scu
ssio
n o
f th
e In
teri
m R
epo
rt
■S
upp
ort
for t
he
stag
ing
of t
he
seco
nd w
ork
shop
Second task
in J
apan
■P
rep
arat
ion
s fo
r th
e v
illa
ge
soci
o-e
cono
mic
stu
dy a
nd f
or t
he
reco
nsi
gn
edfi
eld
Stu
dy
Thir
d task
in J
apan
■P
rep
arat
ion
s fo
r th
e In
teri
m R
epo
rt
■P
rep
arat
ion
s fo
r th
e se
cond
wo
rksh
op
■A
nal
ysi
s o
f th
e re
cons
ign
edfi
led
stu
dy
Second f
ield
stu
dy in G
hana
■In
form
atio
n c
oll
ectio
n a
nd
anal
ysis
(2)
■R
evie
w o
f bas
ic i
nfo
rmat
ion
rela
ted
to R
E po
licy
■R
evie
w o
f pla
ns
for p
ow
er d
evel
op
men
t
■A
nal
ysi
s o
f bas
ic i
nfo
rmat
ion
on E
IA
■R
evie
w a
nd a
nal
ysis
of
exis
ting
PV
RE
pro
ject
s
■R
evie
w o
f G
IS/d
atab
ase
info
rmat
ion
and
pro
posa
l of a
mod
el
■B
asic
so
cio
-eco
no
mic
stu
dy
of v
illag
es
■S
tudy
of p
oten
tial
rela
ted
to r
enew
able
en
ergy
■S
tudy
of o
ff-g
rid P
V R
E m
odel
s
■P
ower
dem
and
fo
reca
st (d
iscu
ssio
n o
f m
eth
odo
logy
)
■C
om
par
ativ
e an
aly
sis
of
RE
cost
s (d
iscu
ssio
n o
f m
etho
dolo
gy
)
■C
om
par
ativ
e an
aly
sis
of
ener
gy p
rice
an
d R
E in
cen
tives
(dis
cuss
ion
of
met
hodo
log
y)
■P
rep
arat
ion
of
reco
mm
end
atio
n fo
r ra
te-s
etti
ng a
nd in
cen
tives
(dis
cuss
ion
of
met
hodo
log
y)
■E
stab
lish
men
t of
stan
dar
ds
for s
elec
tion
of
dist
rict
s
for o
ff-g
rid P
V R
E (d
iscu
ssio
n o
f met
hod
olo
gy
)
■Im
ple
men
tatio
n o
f th
e v
illag
e so
cio
-eco
no
mic
stu
dy
tho
roug
h
reco
nsi
gn
men
t
Thir
d f
ield
stu
dy in G
hana
■Im
ple
men
tatio
n o
f po
wer
dem
and
fore
cast
■C
om
par
ativ
e an
aly
sis
of
RE
cost
s
■C
lari
fica
tion
of
role
s fo
r off
-gri
d P
V R
E in
no
rther
n G
han
a
■C
om
par
ativ
e an
aly
sis
of
ener
gy p
rice
an
d R
E in
cen
tives
■P
rep
arat
ion
of
reco
mm
end
atio
n fo
r ra
te-s
etti
ng a
nd in
cen
tives
■C
lari
fica
tion
of p
ubli
c an
d p
rivat
e ro
les
for
PV s
yst
em d
iffu
sion
■S
um
mar
y o
f re
com
men
dat
ion
s fo
r co
mp
reh
ensi
ve
RE
po
licy
▲P
rog
ress
Rep
ort
▲T
echn
olog
y t
ran
sfer
rep
ort
Sta
ge o
f T
arg
et
Cla
rifi
cati
on
Fin
al R
epo
rt

1-5
1.3.2 Overall schedule
This study was implemented over a period of about 16 months, from February 2005 to May 2006, and
to include a total of five field studies in Ghana.
Figure 1.3.2 shows the overall schedule.
I/R: Inception Report I/R’: Revised Inception Report It/R: Interim Report
DF/R: Draft Final Report F/R: Final Report
Figure 1.3.2 Overall schedule
1.4 Organization of study groups
This study is not aimed merely at the transfer of PV technology. There is a need for transfer of the
diverse assortment of technology required for the formulation of the Master Plan. This assortment
includes macro approaches in the aspects of policies and institutions, micro approaches with resident
participation, approaches with citizen participation, and approaches reflecting concern for the local
socioeconomic situation. As such, the study must be implemented in close coordination with the
counterpart and other concerned institutions right from the start. The Study Team decided to establish
study groups for effective transfer of practical technology through collaborative work and smooth
execution of the study.
Table 1.4.1 presents the main activities of each group.
▲Progress report
▲Technology transfer report ▲I/R’ ▲It/R
First year studies
▲Progress report ▲DF/R
▲DF/R ▲Technology transfer report ▲Technology transfer report
June
Second year studies Third year studies
September
February MayMarch April
June July
2005
2005 2006
February March April May
▲I/R
Second year studies
January August
October November December January
1st task
in Japan
1st fields study
in Ghana
2nd task
in Japan
3rd task
in Japan
4th task in
Japan
5th task in
Japan
6th task in
Japan
2nd fields study
in Ghana
3rd fields study
in Ghana
4th fields study
in Ghana
5th fields study
in Ghana
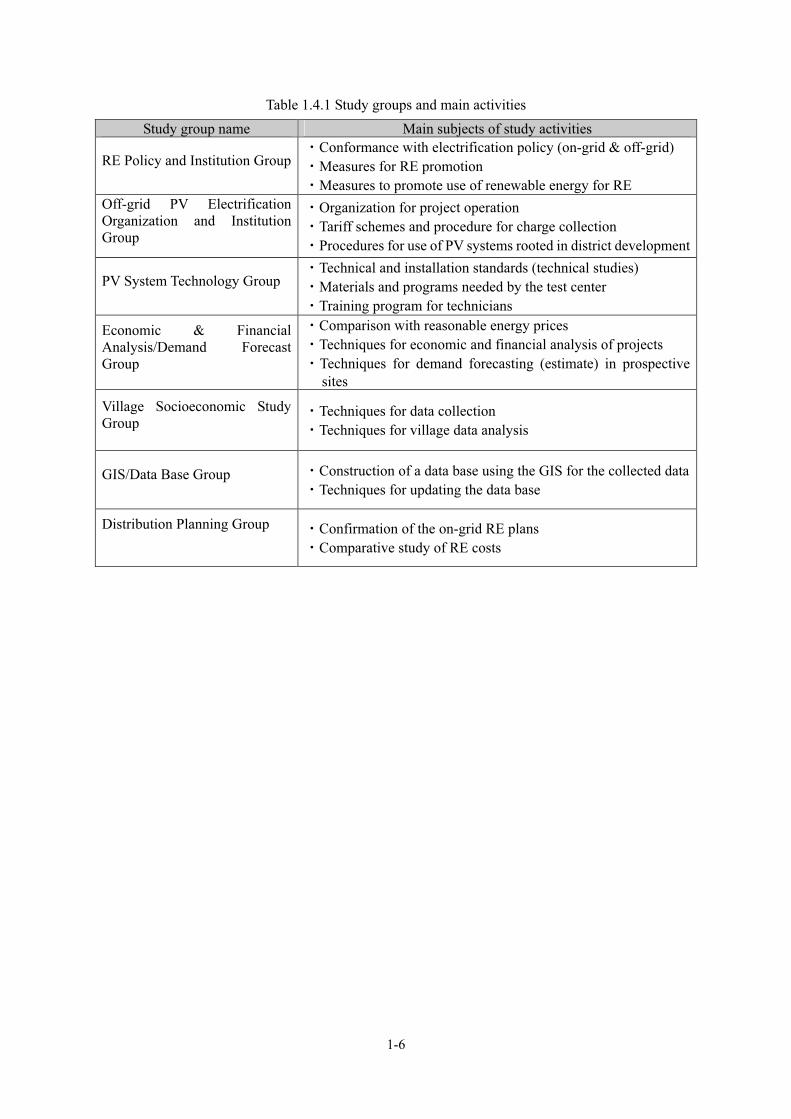
1-6
Table 1.4.1 Study groups and main activities
Study group name Main subjects of study activities
RE Policy and Institution Group ・Conformance with electrification policy (on-grid & off-grid)
・Measures for RE promotion
・Measures to promote use of renewable energy for RE
Off-grid PV Electrification Organization and Institution Group
・Organization for project operation
・Tariff schemes and procedure for charge collection
・Procedures for use of PV systems rooted in district development
PV System Technology Group ・Technical and installation standards (technical studies)
・Materials and programs needed by the test center
・Training program for technicians
Economic & Financial Analysis/Demand Forecast Group
・Comparison with reasonable energy prices
・Techniques for economic and financial analysis of projects
・Techniques for demand forecasting (estimate) in prospective
sites
Village Socioeconomic Study Group
・Techniques for data collection
・Techniques for village data analysis
GIS/Data Base Group ・Construction of a data base using the GIS for the collected data
・Techniques for updating the data base
Distribution Planning Group
・Confirmation of the on-grid RE plans
・Comparative study of RE costs

2-1
Chapter 2 Legislative framework of the power sector
2.1 Structure of the power sector
Ghana depends on electrical power for about 8% of its final energy consumption. The power source
mix consists mainly of hydropower, with some import from the neighboring Cote d'Ivoire. More
specifically, of the entire installed generation capacity of 1,652,000kW, hydropower accounts for
1,072,000kW, followed by thermal power at 550,000kW and an emergency-use diesel power generation
system in Tema at 30,000kW.
According to the 2002 census report, some 43% of the population have access to electricity, and about
80% of the civil power supply is confined to the urban areas.
Besides the Ministry of Energy (MOE), which is the policy-making body which has jurisdiction over
energy, the following five institutions are involved with the energy sector.
� Energy Commission (EC): advice, planning, regulation, and supervision related to energy
policy
� Public Utilities Regulatory Commission (PURC): tariff regulation
� Volta River Authority: power generation and transmission
� Electricity Company of Ghana (ECG): distribution (southern regions)
� Northern Electrification Department (NED): distribution (northern regions)
2.1.1 EC
The Energy Commission (EC) was established in accordance with the Energy Commission Act of
1997 (Act 541). Its role lies in regulation and administration related to use of energy resources, and
related policy coordination.
In particular, the EC offers recommendations regarding the development and use of domestic energy
resources, advises the Minister of Energy in the policy aspect, and builds frameworks for energy
industry regulation and supervision. The types of energy industry regulation include enterprise
licensing, inspection, and supervision.
As other parts of its role, the EC also reviews national plans, constructs data bases needed for
deciding policy for energy development, and encouragement of competition in the energy market.
The Minister of Energy is responsible to the EC, which has a membership of seven, consisting of the
chairperson and six members.
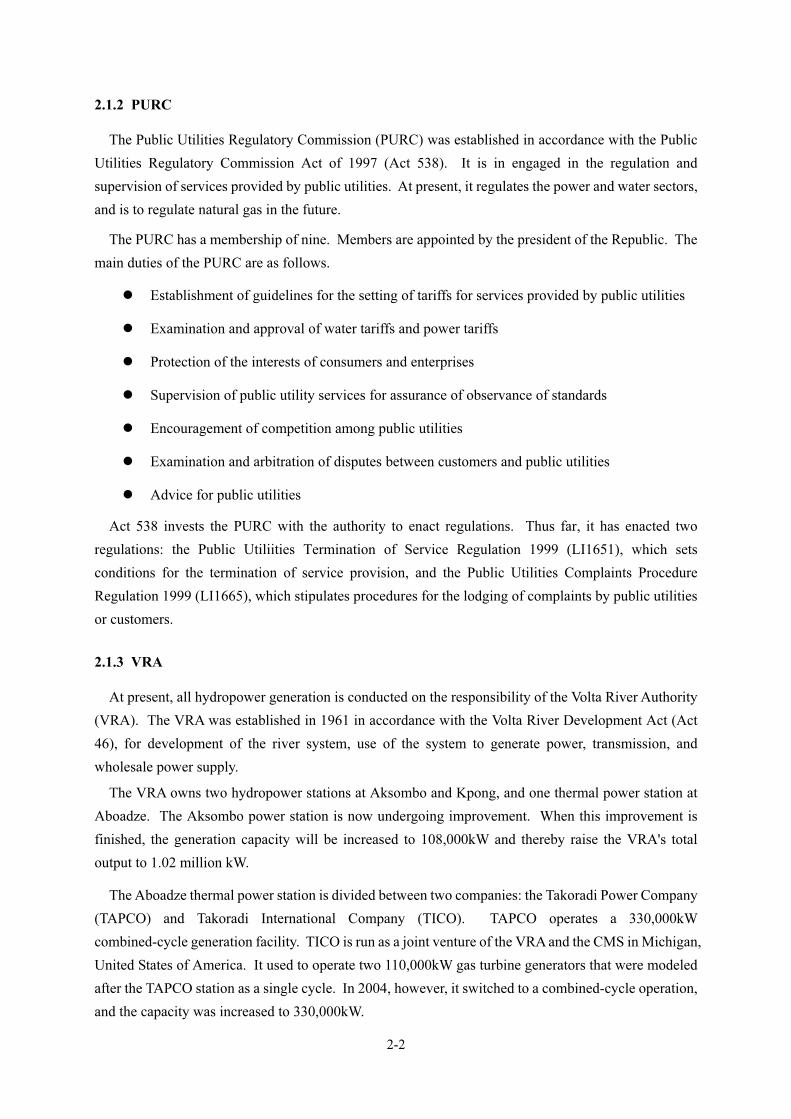
2-2
2.1.2 PURC
The Public Utilities Regulatory Commission (PURC) was established in accordance with the Public
Utilities Regulatory Commission Act of 1997 (Act 538). It is in engaged in the regulation and
supervision of services provided by public utilities. At present, it regulates the power and water sectors,
and is to regulate natural gas in the future.
The PURC has a membership of nine. Members are appointed by the president of the Republic. The
main duties of the PURC are as follows.
� Establishment of guidelines for the setting of tariffs for services provided by public utilities
� Examination and approval of water tariffs and power tariffs
� Protection of the interests of consumers and enterprises
� Supervision of public utility services for assurance of observance of standards
� Encouragement of competition among public utilities
� Examination and arbitration of disputes between customers and public utilities
� Advice for public utilities
Act 538 invests the PURC with the authority to enact regulations. Thus far, it has enacted two
regulations: the Public Utiliities Termination of Service Regulation 1999 (LI1651), which sets
conditions for the termination of service provision, and the Public Utilities Complaints Procedure
Regulation 1999 (LI1665), which stipulates procedures for the lodging of complaints by public utilities
or customers.
2.1.3 VRA
At present, all hydropower generation is conducted on the responsibility of the Volta River Authority
(VRA). The VRA was established in 1961 in accordance with the Volta River Development Act (Act
46), for development of the river system, use of the system to generate power, transmission, and
wholesale power supply.
The VRA owns two hydropower stations at Aksombo and Kpong, and one thermal power station at
Aboadze. The Aksombo power station is now undergoing improvement. When this improvement is
finished, the generation capacity will be increased to 108,000kW and thereby raise the VRA's total
output to 1.02 million kW.
The Aboadze thermal power station is divided between two companies: the Takoradi Power Company
(TAPCO) and Takoradi International Company (TICO). TAPCO operates a 330,000kW
combined-cycle generation facility. TICO is run as a joint venture of the VRA and the CMS in Michigan,
United States of America. It used to operate two 110,000kW gas turbine generators that were modeled
after the TAPCO station as a single cycle. In 2004, however, it switched to a combined-cycle operation,
and the capacity was increased to 330,000kW.

2-3
As of 2004, Ghana had a total installed power generation capacity of 1,762,000kW (see Table 2.1.1).
Table 2.1.1 Power generation facility capacity in Ghana (as of 2004)
Power station Facility capacity(MW)
Hydropower 1,072 (61%)
Aksombo hydropower 912
Kpong hydropower 160
Thermal power 690 (39%)
Aboadze thermal power 660
Tema diesel 30
(Source) VRA, MOE
In addition to these generation facilities, Ghana imports up to 250,000kW of power from Cote d'Ivoire
to meet the domestic demand.
Until 1995, Ghana had a surplus supply capacity and exported power to the CIE in Cote d'Ivoire as
well as to Togo and Benin. Thereafter, however, the supply capacity rapidly dropped with increase in
demand and inappropriate extension of distribution lines. Now, on the contrary, it has concluded a
contract with Cote d'Ivoire for import of a maximum of 250,000kW.
In June 2002, the VRA concluded a contract for export of power to SONABEL in Burkina Faso, and
commenced this export that October.
In addition to its grid power, the VRA has installed over 4,000 PV systems with a combined capacity
of about 1,000kW.
2.1.4 ECG
The Electricity Company of Ghana (ECG) was registered as a joint-stock company in October 1997,
in accordance with the 1993 Company Act (Act 461) and the 1963 Companies Code. It succeeded the
Electric Corporation of Ghana, which was established in 1967 by government ordinance (NLCD 125),
and the government holds all of its stock.
The ECG purchases all of its power from the VRA in bulk, and is one of the distribution firms selling
to final consumers. It is obligated to distribute and supply power in eight districts (Accra East, Accra
West, Tema, Eastern, Central, Western, Ashanti, and Volta).
Since 1997, the amount of ECG power sales has increased at an annualized rate of 3.9%. In 2002, it
came to 4.3 billion kWh. The number of customers, on the other hand, grew by a corresponding rate of
9.2% from 1999 to 2002, when it reached about 970,000. In other words, there was a rapid increase in
the pool of small customers.

2-4
The ECG has a high rate of distribution loss; in 2002, the rate came to 26% as compared to the
benchmark value of 18%. Much of this loss is caused by non-technical loss. The rate of charge
collection is no higher than about 80%, much lower than the rate of 95% established by the PURC as a
guideline. Improper meter reading accounts for about 50% of this loss, followed by meter bypassing at
25 %, direct connection from cables at 10%, charge errors at 5%, and unauthorized reconnection at 5%
(according to the 2001 Annual Report).
Table 2.1.2 Energy purchase and sales, and system loss of the ECG
(Unit: GWh)
1997 1998 1999 2000 2001 2002
Growth Rate
(97 - 02)
Total Energy Purchases 3,386 3,118 3,846 3,989 4,175 4,326 5.0%
Total Energy Sales 2,647 2,417 2,828 3,086 3,080 3,200 3.9%
System Loss 739 701 1,019 903 1,095 1,127 -
System Loss Rate 21.8% 22.5% 26.5% 22.6% 26.2% 26.0% -
(Source) ECG Annual Report
Table 2.1.3 Number of ECG customers
(Unit: customer units)
1997 1998 1999 2000 2001 2002
Growth Rate
(97 - 02)
Special load tariff - - - - - 827 -
Non-special load tariff - - - - - 936,299 -
Prepaid tariff - - - - - 32,548 -
Total - - 744,005 832,593 893,880 969,674 9.2%
(Source) ECG Annual Report
2.1.5 NED
The Northern Electrification Department (NED) was established in 1987 as a subsidiary of the VRA.
It took over the responsibility for distribution and supply to the northern regions (Brong Ahafo,
Northern, Upper East, and Upper West) from the ECG.
There has been a rapid rise in the number of NED customers and power sales. The number of
customers rose from 139,683 in 2002 to 174,144 in 2004, for an increase averaging 11.7% annually.
Over the same period, the power sales increased from 265.4 to 324.5 million kWh for a corresponding
increase rate of 10.6%. This increase in sales reflects that in the number of communities connected to
the distribution lines under the NES and the SHEP.
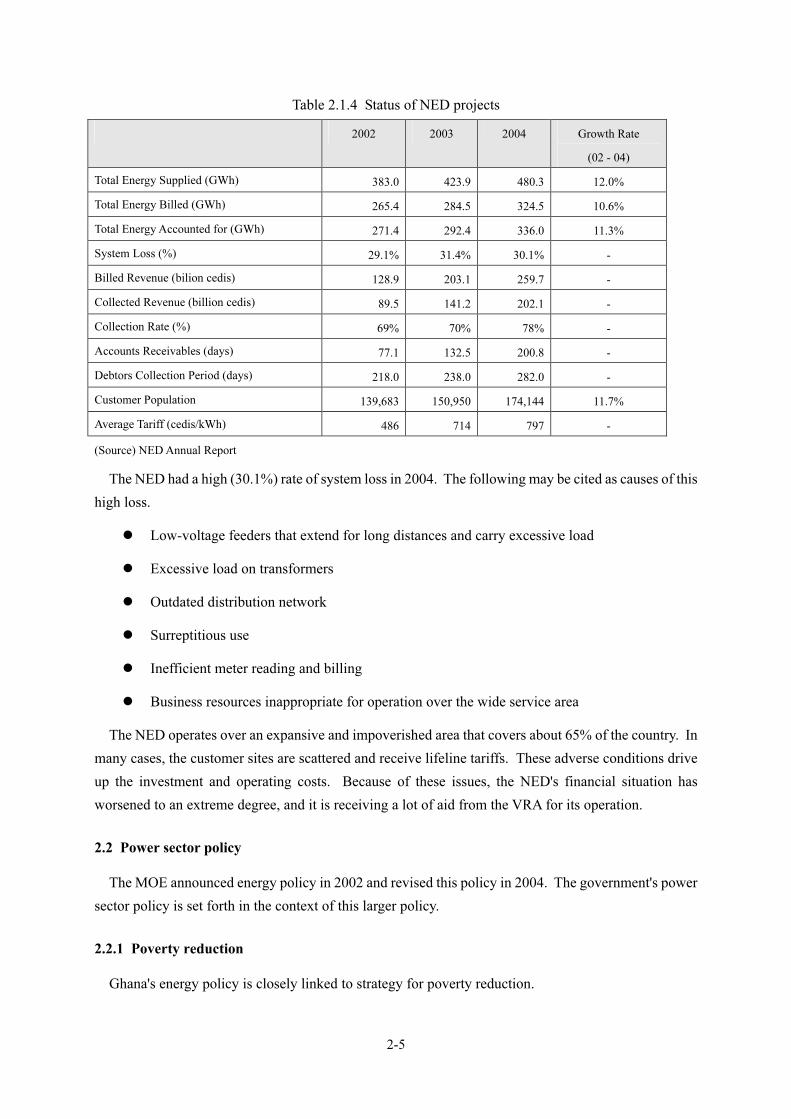
2-5
Table 2.1.4 Status of NED projects
2002 2003 2004 Growth Rate
(02 - 04)
Total Energy Supplied (GWh) 383.0 423.9 480.3 12.0%
Total Energy Billed (GWh) 265.4 284.5 324.5 10.6%
Total Energy Accounted for (GWh) 271.4 292.4 336.0 11.3%
System Loss (%) 29.1% 31.4% 30.1% -
Billed Revenue (bilion cedis) 128.9 203.1 259.7 -
Collected Revenue (billion cedis) 89.5 141.2 202.1 -
Collection Rate (%) 69% 70% 78% -
Accounts Receivables (days) 77.1 132.5 200.8 -
Debtors Collection Period (days) 218.0 238.0 282.0 -
Customer Population 139,683 150,950 174,144 11.7%
Average Tariff (cedis/kWh) 486 714 797 -
(Source) NED Annual Report
The NED had a high (30.1%) rate of system loss in 2004. The following may be cited as causes of this
high loss.
� Low-voltage feeders that extend for long distances and carry excessive load
� Excessive load on transformers
� Outdated distribution network
� Surreptitious use
� Inefficient meter reading and billing
� Business resources inappropriate for operation over the wide service area
The NED operates over an expansive and impoverished area that covers about 65% of the country. In
many cases, the customer sites are scattered and receive lifeline tariffs. These adverse conditions drive
up the investment and operating costs. Because of these issues, the NED's financial situation has
worsened to an extreme degree, and it is receiving a lot of aid from the VRA for its operation.
2.2 Power sector policy
The MOE announced energy policy in 2002 and revised this policy in 2004. The government's power
sector policy is set forth in the context of this larger policy.
2.2.1 Poverty reduction
Ghana's energy policy is closely linked to strategy for poverty reduction.
2-6
In 1999 Ghana suffered from a serious terms of trade shock, with prices for Ghana’s main exports,
gold and cocoa, falling and prices for oil imports rising. This, combined with a delay in adjusting fiscal
and monetary policy, led to sharp depreciation of the exchange rate and rapid increase in inflation rate.
Ghana faced difficult fiscal situation, and fiscal deficit reached an estimated 23% of gross domestic
product (GDP).
In February 2002, Ghana reached its highly-indebted-poor-country (HIPC) decision point. Under the
HIPIC initiative, it is implementing its macroeconomic reform agenda through the Ghana Poverty
Reduction Strategy (GPRS). The GPRS provides a new vision of Ghana that emphasizes creation of
wealth, improved governance, and reduced income and regional inequalities.
To this end, the government intends to maintain a stable macroeconomic environment with moderate
infraction, improve infrastructure and market access, increase the availability and quality of basic health
and education services, and strengthen protection mechanisms for the most vulnerable segments of
society.
The government regards conditioning of the fundamental infrastructure as indispensable for the
advancement of economic activities in rural areas. The power supply is particularly vital for assurance
of means of telecommunication or heightening of the reliability of the same. This, in turn, is expected to
assist expansion of local economies, creation of job opportunities, and increase in income levels.
2.2.2 Policy framework
The government has posted seven objectives as the framework of energy policy, and has clearly
defined action to be taken toward each (see Table 2.2.1). The focal points for policy steps to be taken in
the power sector are structural reform, rectification of power tariffs by adjustment to levels enabling
retrieval of costs, promotion of electrification and economic development in rural areas, and expanded
use of renewable energy such as solar power, wind power, and mini hydropower.
Table 2.2.1 Energy policy framework (excerpt of those parts related to the power sector)
Objective 1: Consolidate and improve existing energy supply system
� Secure private sector investment in partnership with the public sector for re-capitalization of the energy supply system.
� Ensure efficiency in the management of the existing energy supply system through the restructuring of the utilities and unbundling of electricity supply system and the deregulation of the petroleum sector. The restructuring of the Ghana National Petroleum Corporation (GNPC), ECG and the creation of the power transmission company will be completed.
� Ensure cost-recovery in energy supply through efficient pricing of all energy services. The utility companies, i.e., VRA, ECG and Tema Oil Refinery (TOR), all face very precarious financial position, which could lead to the complete breakdown of energy services delivery in the country. It is the intention of the Ministry of Energy to reverse this situation in order to ensure un-interrupted supply of energy to meet the requirement of the economy.
Objective 2: Increase access to high quality energy services
� The Ministry of Energy will continue to expand Government support for rural electrification
2-7
from both grid extension and decentralized sources such as solar PV and mini-hydro.
� The Ministry of Energy, in line with the objectives of creating jobs, will initiate a vigorous program support for productive uses of electricity in the rural areas.
� There are some remote rural communities that cannot be connected to the grid in the next 5 to 10 years. Under the rural electrification program, the Ministry of Energy in partnership with the utility companies and the private sector will initiate a program to provide these communities with Solar PV systems.
Objective 3: Secure future energy supplies
� Diversify Ghana’s energy supply sources by promoting the exploitation of alternative energy supply sources.
� The Ministry of Energy will promote the use of indigenous renewable energy such as wind energy, solar energy, small hydro as well as biomass energy.
� Promote end-use energy efficiency and conservation.
� The requisite legal and regulatory mechanisms will be put in place to facilitate the participation of Independent Power Producers (IPPs).
Objective 4: Stimulate economic development
� Export of energy: This is to be achieved through the sale of Ghanaian energy services to neighboring country markets. By this, the Ministry of Energy will pursue a strategy to expand electricity supply capacity in the country in order to become a net-exporter in the West African Power Pool. The Ministry of Energy also intends to expand petroleum product supply to neighboring countries by expanding the Tema Oil Refinery and, in the medium term, commission the building of a new and modern refinery.
� Enhance productive uses of electricity in rural areas: This activity will be pursued under the Rural Electrification Programme in collaboration with Ministry of Industries and Ministry of Local Government and Rural Development and is intended to ensure that electricity supplied to the rural communities is used to support agriculture and the establishment of small and medium scale businesses.
� Enhance government revenue generation: The Ministry of Energy will ensure that the energy sector will continue to provide a basis for the enhancement of government revenue through efficient taxes and levies on energy supply and consumption.
� Employment generation: This will be achieved through the expansion and operation of indigenous energy supply services such as electricity generation, electricity retailing and refining of crude oil.
Objective 5: Minimize environmental impacts of energy supply and consumption
� Promote the gradual increase of more environmentally friendly energy supply sources such as renewable energy (solar, wind and small hydro) in the energy mix of the country.
� Support and actively participate in international efforts and cooperation with international organizations that seek to ensure sustainable delivery of energy to mitigate climate change. The Ministry of Energy endorses the United Nations Joint Implementation (JI) and Clean Development Mechanism (CDM).
Objective 6: Strengthen institutional and human resource capacity and R & D in energy development
� Support institutional reforms in the energy sector in line with the provisions of Energy Commission (EC) Act 541 and Public Utility Regulatory Commission (PURC) Act 538.
� Strengthen existing regulatory agencies (Public Utility Regulatory Commission (PURC) and Energy Commission (EC)) to enhance the regulatory environment in the energy sector.

2-8
� Support the training of Ghanaians in all fields of energy development and management.
� Re-direct the use of the “Energy Fund” for the support of energy Research & Development activities.
Objective 7 - Special Concerns
� Renewable Energy Technologies (RETs)
・ Create a level playing field for renewable energy by removing all fiscal and market barriers.
・ Encourage utility companies to adopt renewable energy in their supply mix.
・ Institute a “RET-Friendly” pricing framework in competitive applications such as in electricity supply.
・ Provide Government funding support for non-grid connected renewable energy technologies for economic activities (such as agriculture) and social services (such as schools, health centers, provision of potable drinking water).
・ Support technological development and cost reduction through pilot demonstration projects and local manufacture of RETs .
� Power Sector Reform
・ The Energy Commission Act 541 and the Public Utility Commission (PURC) Act 538 passed in 1997 provide the legal framework for sweeping reforms in electric power generation, transmission, distribution and regulation in Ghana.
・ Under these Acts, the private sector is allowed to invest in and own electric power plants.
・ A publicly owned Transmission Utility Company (which has not yet been established) is to provide “open access” transmission services for all electric power generators to their prospective customers.
・ The private sector is being encouraged to invest in the distribution system in partnership with the Electricity Company of Ghana. Government is committed to the privatization of the distribution utilities to allow for strategic investors. The Ministry of Energy will finalize the process for the partial privatization of the distribution utilities.
・ Pricing of electricity has been vested in an independent regulatory body, the Public Utilities Regulatory Commission (PURC), established under PURC Act 538 1997. Government, as a matter of policy, will ensure that electricity prices reflect efficient economic costs of generation, transmission and distribution while making it “affordable” to the “poor” in society.
・ The existing regulatory environment will be strengthened in order to facilitate the entry into the power sector of IPPs in addition to ensuring improved performance of electric power utilities.
(Source) MOE
2.2.3 Structural reform
Structural reform is progressing in Ghana, as in other countries. Thus far, the investment required for
the operation of electric utilities has depended on the national finances and international institutions.
The government is trying to affect a shift from this setup in the direction of participation by private
capital.
The following measures have been implemented for the purpose of structural reform to this end.

2-9
� Establishment of a new regulatory setup
� Instatement of the competitive mechanism into wholesale (bulk) power supply
� Privatization of existing government-owned power companies and assurance of private-sector
participation
� Minimization of the governmental role and utilization of diverse social capabilities
� Input of diverse resources for cost-effective promotion of transmission and distribution
projects under the NES
Thus far, two regulatory institutions (the EC and the PURC) have been established through legislative
measures, and the regulatory environment consisting of enterprise licensing, formulation of technical
standards, tariff approval, and protection of demand is gradually taking shape. Nevertheless, while the
blueprint has been drawn for the fundamental structural reform resting on the functional unbundling and
rebuilding of the existing utilities (VRA, ECG, and NED), the detailed timetable has not yet been set.
(The plan calls for the unbundling of the VRA in terms of function (hydropower, thermal power, and
transmission), and the consolidation of the ECG and the NED as distribution companies.)
2.2.4 Electrification financing
At present, a special tax (government levy) is imposed on sales of power and other energy. The
revenue from this tax can be used for RE and the spread of PV systems.
There are two such funds: the Electrification Fund based on revenue from taxes on power charges in
use by final consumers, and the Energy Fund based on revenues from petroleum product taxes. The
former tax amounts to 1.7 cedi per kWh, and the latter, to 5 cedi per liter.
The objective of the Energy Fund is to promote use of oil-alternative energy, and disbursements are
recognized for development and use of PV systems and other renewable energy technologies.
In scale, however, such disbursements are fairly limited. In 2002, for example, the ECG and the NED
had combined sales of 3.465 billion kWh, and the revenue from taxes on these sales came to only about
5.9 billion cedi (about 650,000 dollars). In addition, the rate of charge collection is only about 80% at
the ECG and 69% at the NED. As such, a significant portion of these taxes are not collected.
The tax revenues funding the Energy Fund, too, amount to approximately 7 billion cedi, and the
disbursements that can be allotted for PV systems are naturally limited.
As this indicates, it would be financially difficult to fund electrification solely with tax revenues, and
the current RE projects are drawing on the HIPC Fund.
2.2.5 Environmental concerns related to electrification and PV systems
In Ghana, the Environmental Protection Agency (EPA) is in charge of regulations regarding
environmental impact assessment (EIA). Projects requiring EIAs and the related procedures are

2-10
stipulated by the Environmental Assessment Regulations 1999. In the power sector, EIAs are required
for the construction of transmission lines, thermal power stations, dams, and hydropower stations.
There is no particular requirement for PV systems. In the case of PV systems, the element with the most
impact on the environment is the battery. Facilities processing and recycling spent batteries are subject
to EIAs due to the risk of water pollution and soil contamination.
The EPA, the MOE, and the EC recognize the importance of properly disposing of and recycling spent
batteries, and are discussing arrangements in preparation for the future spread of PV systems as a means
of electrification. The provisional license currently issued to PV system dealers by the EC clearly
stipulates the obligation for observance of EPA environmental regulations, and requires businesses to
make reports on the occasion of battery disposal. At present, however, there are businesses disposing of
car batteries, but disposal of exclusively PV system batteries is not organized as a business.
2.3 Energy prices, power tariff scheme, and market prices
2.3.1 Energy prices
As noted above, in Ghana, the power supply structure consists of ECG purchase and distribution of
the power generated by the VRA and IPPs. In the northern regions that are covered by this study, the
VRA-NED purchases power from the VRA and supplies it to customers. The power purchases by the
VRA have steadily increased except for a dip due to the drought in 1998, and have expanded at an
average annual rate of 5.8% over the years 1996 - 2002.
0
500
1,000
1,500
2,000
2,500
3,000
3,500
4,000
4,500
5,000
0
200,000
400,000
600,000
800,000
1,000,000
1,200,000
GWh (left)
Million Cedi (right)
GWh (left) 3,080 3,385 3,118 3,846 3,989 4,175 4,326
Million Cedi (right) 372,268673,075 1,137,3
1996 1997 1998 1999 2000 2001 2002
(Source) ECG
Figure 2.3.1 ECG power purchase and cost (millions of cedi)
The power purchasing cost has also risen substantially. While the purchasing amount has increased
by 4 - 5 % since 2000, the cost has basically doubled by the year. Per unit of power as well, the cost
increased by 72% from 2000 to 2001 and 63% from 2001 to 2002. During this period, Ghana
experienced an extremely high inflation rate of about 25%. Although some of this cost increase can be
reflected in tariffs, the unit cost increase far outstrips the extent of tariff hikes.

2-11
The prices applied in bulk sales by the VRA and IPPs are regulated by the PURC. The wholesale price
authorized by the PURC in 2004 was ten times as high as that in 1998.
Bulk Supply Tarriff
050
100150200250300350400450500
Jun-98
Dec-98
Jun-99
Dec-99
Jun-00
Dec-00
Jun-01
Dec-01
Jun-02
Dec-02
Jun-03
Dec-03
Bulk Supply Tarriff 42 50 100 200 359 412 441 425
Feb-
98
Sep-
98
Aug-
00
Jun-
05
Aug-
02
Mar-
03
Oct-
03
Feb-
04
(Cedi/KWh)
(Cedi/KWh)
(Source) PURC
Figure 2.3.2 Trend of wholesale power tariffs
This increase derives largely from the change in the power source mix in Ghana. The mix, which
consisted mostly of hydropower, is gradually coming to center around thermal power. In 2002-2003,
each accounted for about half of the total. Because of this change, wholesale power tariffs must reflect
the fluctuation of international fuel prices. With hydropower, there are no fuel costs, which kept the
wholesale power tariff low. In contrast, in a situation of continual expenditures to purchase fuel, these
costs must be properly reflected.
The following tariff adjustment formula was applied in 2002-2003 to reflect the fuel price fluctuation.
P = P0 (a x FP/FP0 + ß x CPI/CPI0)
Here:
P: Adjusted Variable Energy Price
P0: Base Thermal Variable Energy Price
FP: Fuel Price
FP0: Base Fuel Price (US$2.2/bbl)
CPI: United States CPI
CPI0: 2%
a: 0.89
ß: 0.11
BST = (X1Hc+X2P2+X3P3) + nK) x ExchangeRate + Transmission Cost
Here:
P2: simple-cycle generation cost calculated by the above equation

2-12
P3: combined-cycle generation cost calculated by the above equation
X1: hydropower generation rate
X2: simple-cycle generation rate
X3: combined-cycle generation rate
K: System Capacity Price
n: thermal power generation rate
For a time, prices were automatically adjusted in accordance with the above formula. It can be seen
that all of the fuel cost (including exchange rate loss) can be transferred to the wholesale price.
Although this formula is not applied now, a similar line of thought is presumably being applied in
determination of wholesale prices.
2.3.2 Power tariff scheme
Table 2.3.1 shows the end-user power tariffs as of February 2004. The residential and non-residential
tariffs are based on a progressive scheme. Households pay a sum of 19,080 cedi for supply of up to
50kWh a month and 583 cedi per kWh over that. For example, a household using 80kWh for one month
would pay 36,570 cedi (19,080 + (80 - 50) x 530). Like the wholesale power tariffs, this scheme is
determined by the PURC.
The wholesale power tariff set by the PURC is 425 cedi per kWh, and the transmission cost is 315
cedi per kWh. As such, even calculated in simple terms, the supply cost is 740 cedi per kWh. In contrast,
the residential tariff is held to about 381 cedi per kWh, almost half as high, in the event of use of the
entire 50kWh in the lowest rank (i.e., the lifeline tariff). This is on a very low level that does not even
meet the wholesale price. Although the influence could be moderated slightly because the demand may
not reach 50kWh in actuality, this low level has an enormous effect on the financial situation in the
power sector. It may also be noted that, even in the next-highest rank, the tariff would not meet the
supply cost.

2-13
Table 2.3.1 Power tariffs in May 2004
Residential0-50kWh (lifeline) 19,080 Cedi/Month51-300kWh 583 Cedi/kWh/Month300+kWh 1,018 Cedi/kWh/Month
Non-Residential0-300kWh 848 Cedi/kWh/Month300+kWh 1,039 Cedi/kWh/MonthService Charge 21,200 Cedi/Month
Special Load Tariff- Low VoltageMax Demand 143,100 Cedi/kVA/monthEnergy Charge 403 Cedi/kWhService Charge 63,600 Cedi/Month
Special Load Tariff- Low VoltageMax Demand 97,520 Cedi/kVA/monthEnergy Charge 382 Cedi/kWhService Charge 63,600 Cedi/Month
Special Load Tariff- High VoltageMax Demand 89,040 Cedi/kVA/monthEnergy Charge 371 Cedi/kWhService Charge 63,600 Cedi/Month
(Source) PURC
As indicated by the name, the lifeline tariff is a policy-based tariff aimed at social equality. It is set
with consideration of factors such as the amount people are willing to pay and income levels. This
makes it difficult to hike tariffs through simple transfer of costs, and resulted in the current situation.
In 1998, the lifeline tariff was 2,250 cedi per month. At the time, the wholesale power price was 50
cedi per kWh, and the lifeline tariff was set on a level basically on a par with the wholesale power price.
As a result, the influence was comparatively small. While this tariff has been raised, the rise has not kept
abreast of that in supply costs. Because household income levels are not high in Ghana, many
households meet their needs with the lifeline tariff. The loss incurred by the ECG and the VRA-NED
only increases as the number of customers in this rank rises.
Furthermore, this low tariff is often abused. One group interviewed in this study indicated that it cut
its power charges by concluding contracts for four power connections and keeping use of each under the
lifeline tariff quota even though it was a single customer. Coupled with the insufficient capabilities for
customer management, such practices are putting power business into an extremely serious situation.
2.3.3 NED financial status
Based on the costs of power management and the tariff problem described above, this section views
the financial status of the VRA-NED, which is currently in charge of electrifying the northern regions.
(1) Profit-loss statement
Because the NED had not completed its annual report for fiscal 2004 and financial data were not
available even as of November 2005, this analysis is based on data up to and including 2003, which were

2-14
available when it was executed. Table 2.3.2 presents the profit-loss statement for the NED.
Table 2.3.2 VRA-NED P/L calculation
(million Cedi)
Profit and Loss
2002 2003
Total Sales 123,614 195,205Power Sales 120,000 191,053
Residential 59,896 104,600Non-Residential 41,626 58,057Low Voltage 9,228 13,397High Voltage 9,250 14,999
Other 3,614 4,152New Connection 1,498 1,241Other 343 543Interest 1,773 2,368
Operating Cost 127,426 216,590Power Purchase 101,645 175,008Salaries 15,686 25,393Materials 290 1,185Repairs&Maintenance 1,884 2,652Other 7,921 12,352
Depreciation 129,017 158,802
Total Cost 256,443 375,392
Net Profit -132,829 -180,187
(Source) VRE-NED
Sales increased substantially at an average annual rate of 58% from 2002 to 2003. On the gigaW-hour
basis, on the other hand, the demand grew at an annualized rate of about 7 %. The sales revenue increase
due to the tariff hike therefore had a big influence.
In spite of this, residential use occupied the biggest part of the sales. This part accounted for the
majority of the sales increase. Over the period in question, the number of residential customers
increased by about 13,000, almost all of whom are thought to be receiving the aforementioned lifeline
tariff. The increase in the number of customers consequently had the effect of further squeezing the
NED finances.
In the cost aspect, the biggest increase was recorded by power purchasing costs, which went up by
75%. These costs increased faster than sales. In terms of absolute numbers as well, the sales increase
was virtually cancelled out by this increase in the purchasing cost.
Other costs, too, exhibited significant increases. Considering that the inflation rate is over 20%,
however, the trend is virtually flat on the real basis; it is not the case that there was an explosive cost
increase. As such, the figures should be interpreted as evidencing much effort to hold down costs.
At the NED, which has facilities and plants with a book value of close to 3 trillion cedi, the repair and

2-15
maintenance cost appears to be very low at only 2.65 billion cedi, less than 0.1% as high. However, as
seen in the balance sheet analysis, this total value of nearly 3 trillion cedi is an apparent magnitude
resulting from repeated revaluation of assets along with inflationary accounting. For this reason, it
could not be concluded that the cost level is too low.
This problem is further compounded by the extremely high level of transmission loss. The rate of
transmission and distribution loss at the NED is over 30%. This is a problem at the ECG as well as the
NED.
Eventually, the NED deficit expanded in 2002 and 2003, and reached 180.2 billion cedi at the end of
2003. This trend has continued for over five years. Behind this deficit lies the fact that the increase in
the number of customers has been biggest in the residential division, where the structure is at a back
spread, and from the inability to make a tariff revenue hike commensurate with the rise in power
purchasing costs. In other words, the deficit is not a matter of NED capabilities; it is a structural
problem, in that it derives from the structure of tariffs and costs. Unless improvements are made in this
respect, there are no prospects for a turnaround in NED finances.
(2) Balance sheet
Table 2.3.3 shows the VRA-NED balance sheet. It should be noted that the figures do not match those
of the NED Annual Report in some cases, because the table converted the latter using ordinary
accounting methodology.
Total assets expanded from 2.5 trillion cedi to 2.9 million cedi. This increase is not due entirely to the
addition of new facilities. A look at the figure for work in progress in 2002 reveals a sum of about 3.9
billion cedi, much lower than that of 1.4 trillion cedi for the increase in facility assets to 2003. The big
increase in these assets resulted almost entirely from revaluation. Due to the high inflation, the NED
revaluates its assets every year, and the revaluation is responsible for almost all of the increase.
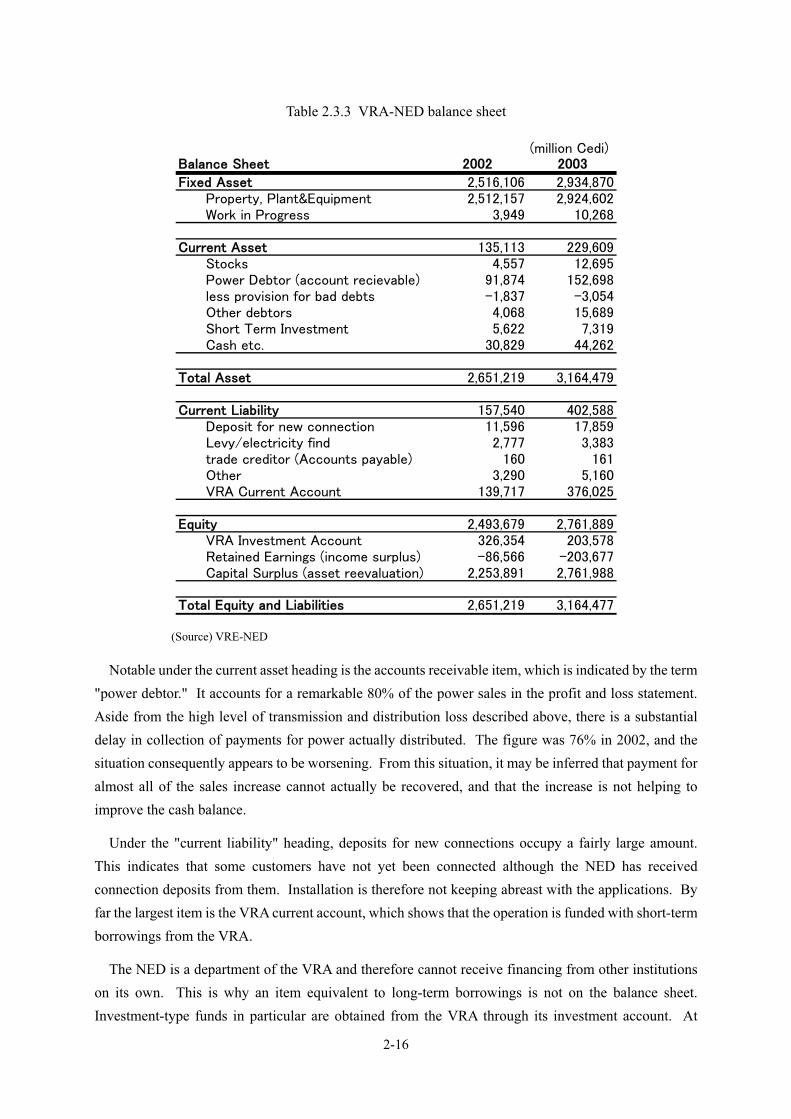
2-16
Table 2.3.3 VRA-NED balance sheet
(million Cedi)Balance Sheet 2002 2003
Fixed Asset 2,516,106 2,934,870Property, Plant&Equipment 2,512,157 2,924,602Work in Progress 3,949 10,268
Current Asset 135,113 229,609Stocks 4,557 12,695Power Debtor (account recievable) 91,874 152,698less provision for bad debts -1,837 -3,054Other debtors 4,068 15,689Short Term Investment 5,622 7,319Cash etc. 30,829 44,262
Total Asset 2,651,219 3,164,479
Current Liability 157,540 402,588Deposit for new connection 11,596 17,859Levy/electricity find 2,777 3,383trade creditor (Accounts payable) 160 161Other 3,290 5,160VRA Current Account 139,717 376,025
Equity 2,493,679 2,761,889VRA Investment Account 326,354 203,578Retained Earnings (income surplus) -86,566 -203,677Capital Surplus (asset reevaluation) 2,253,891 2,761,988
Total Equity and Liabilities 2,651,219 3,164,477
(Source) VRE-NED
Notable under the current asset heading is the accounts receivable item, which is indicated by the term
"power debtor." It accounts for a remarkable 80% of the power sales in the profit and loss statement.
Aside from the high level of transmission and distribution loss described above, there is a substantial
delay in collection of payments for power actually distributed. The figure was 76% in 2002, and the
situation consequently appears to be worsening. From this situation, it may be inferred that payment for
almost all of the sales increase cannot actually be recovered, and that the increase is not helping to
improve the cash balance.
Under the "current liability" heading, deposits for new connections occupy a fairly large amount.
This indicates that some customers have not yet been connected although the NED has received
connection deposits from them. Installation is therefore not keeping abreast with the applications. By
far the largest item is the VRA current account, which shows that the operation is funded with short-term
borrowings from the VRA.
The NED is a department of the VRA and therefore cannot receive financing from other institutions
on its own. This is why an item equivalent to long-term borrowings is not on the balance sheet.
Investment-type funds in particular are obtained from the VRA through its investment account. At

2-17
present, however, the amount is basically offset by the retained earnings. In the equity category, what
occupies the largest share and almost all of the righthand side of the balance sheet is capital surpluses,
which is the cumulative total of book value increase due to asset revaluation. It derives from
bookkeeping in inflation accounting as opposed to funds actually earned by the NED. This
manipulation through inflation accounting is worsening the outlook for the NED balance sheet
somewhat and requires caution.
(3) Cash flow
The figures for cash flow provide a basic picture of NED management. The cash balance indicates
that almost all of the operating deficit is offset by depreciation. Nevertheless, accounts receivable are
steadily increasing along with sales, and the figure for cash on hand is negative. This deficiency can be
met with provision of short-term funds from the VRA current account.
New investment is held to a low level. Over the last few years, it has been in the range of 6.3 - 7.0
billion cedi, on the order of maintenance costs. It apparently has not gone beyond large-scale repair of
certain facilities.
Financing activities depend on provision of funds from the VRA because there is no external
borrowing. In 2003, the cash flow from financing was negative as a total of 122.8 billion cedi was taken
out of the account.
On the bottom line, the NED is left with a certain amount of cash. As of the end of 2003, this cash on
hand came to 51.58 billion cedi, or about one-third as much as the total cost. While this level may be
termed sufficient, the NED has absolutely no reserve for a lot of new investment on its own resources,
and will have all it can do to continue operating on the current level.

2-18
Table 2.3.4 VRA-NED cash flow
(million Cedi)Cash Flow 2002 2003
Operating Profit -132,829 -180,187Adjustment
Depreciation 129,017 158,802Interest on Investment -1,773 -2,368Fixe asset sales proceeds 0
Decrease/(Increase)in :Stocks 764 -8,138Accounts recievable -41,262 -71,227
(Decrease)/Increase in:accounts payable 5,536 8,740VRA Current Account 62,549 236,308
Net CF from Operations 22,002 141,930
Cash Flow from Investment
Interest 1,773 2,368Purchase of plant -2,953 -74Work in Progress -3,958 -6,319Net Cash from Investment -5,138 -4,025
Cash Flow from financing
Investment from VRA 0 -122,776Net CF from financing 0 -122,776
Change in Cash etc. 16,864 15,129
Opening Cash etc. 19,587 36,451Closing Cash etc. 36,451 51,580
(Source) VRA-NED
2.3.4 ECG financial status
The ECG transmits and distributes power purchased from the NED. It is definitely not in a good
financial position. Data for it are for the situation in fiscal 2003, because its financial statement for fiscal
2004 had not been completed either as of the end of calendar 2005.
For this study, the ECG has less of a direct connection than the VRA-NED, and the Study Team
decided not to make an in-depth study of the various financial tables. However, it basically shares with
the VRA-NED the situation of operating loss on a current basis, because it cannot hike tariffs high
enough to compensate for the steep increase in the capital investment requirement related to the
transmission system along with demand expansion.
As of the end of 2003, ECG customers numbered 1.09 million, up 12.7% from the end of 2002. Its
power sales over the same period increased from 3,199 to 3,342 GWh, up only 4.4%. This low level of
sales relative to the increase in the number of customers evidences the fast-paced expansion of
small-volume customers.
Meanwhile, the ECG's aggregate assets rose by about 12%, from about 6.2 to 7.0 trillion cedi,

2-19
indicating that capital investment was more or less commensurate with the power sales. However, even
this level of investment may not have been fully sufficient, considering the dilapidation of existing
facilities and the need for additional ones.
Although the increase in power sales was limited, sales revenue increased from 1.55 trillion cedi in
2002 to 2.27 cedi in 2003, up a remarkable 46%, due to the two tariff hikes made in 2003. Nevertheless,
direct costs, which are occupied almost entirely by power purchasing from the NED, increased by an
even higher margin, while sales management costs also rose as the operation expanded. As a result, the
ECG recorded a net loss of 482.6 billion cedi. Net losses have continued to be recorded in every one of
the last few years, and have become chronic in nature.
As for cash flow, loss is essentially offset by depreciation, and does not produce a funding shortage.
Debts, however, are piling up, and make large-scale investment difficult. In response, in 2003, the ECG
was released from its obligations for repayment of a total of 792.4 billion cedi in long-term debt and
cumulative interest through governmental aid, in order to provide leverage for improvement of its
finances. Even so, under the current circumstances of continuous deficit, it could fall into the same
position sooner or later. As this indicates, it would be difficult for the ECG, too, to make extensive
investment.
2.3.5 Operation and Maintenance (O&M) cost in RE
The O&M cost for solar systems is virtually negligible, as long as owners/users perform the minimum
requisite cleaning. In reality, however, owners/users cannot be expected to perform even O&M work on
this level, and the business side must do the minimum requisite checking. Some detailed data on the
operation cost in electrification led by PV systems are available from the RESPRO, but long-term data
have not been compiled due to problems in aspects such as the transfer of work accompanying a change
of accountants. The RESPRO does not necessarily obtain highly reliable data itself because its scale is
fluctuating.
At present, RESPRO does maintenance for some 2,000 SHS, at a fee of two dollars per month per
system. The actual work is performed by a few engineers and staff. Their wages and operation cost are
met by expenditures. Table 2.3.5 outlines RESPRO expenditures relative to its revenue.

2-20
Table 2.3.5 Balance of RESPRO revenue and expenditure
Actual Cost/Income
Revenue 40,000,000
Salary 20,000,000Daily Service Allowance 30,000,000Equipment 5,000,000Vehicle 20,000,000Utility& Office Supply&Bank Charge 30,000,000Tax etc. 15,000,000
Total Cost 120,000,000
Profit/(Loss) -80,000,000
(Source) RESPRO
Table 2.3.5 shows averages figures for the few months for which data have been recorded. It can be
seen that RESPRO is still running a deficit of from 80 to 100 million cedi per month. This situation is
definitely not sustainable.
It might be added that the wages paid to RESPRO staff are very low, and that this is leading to a
serious loss of personnel. Current wage levels at the power utilities are about three times as high.
Although personnel expenses can be held down by measures such as employment of two or more novice
workers instead of seasoned ones, personnel expenses should be double the current level at the least.
Under these circumstances, monthly fees for maintenance of the approximately 2,000 systems would
have to come to about 200 million cedi (averaging 100,000 cedi per system) for the operation to break
even. This would be equivalent to 10 dollars per month and 120 dollars per year, or about five times as
much as at present. With the inclusion of a fee of about 300 dollars every five years for battery
replacement, the requisite expense would be increased by about 5 dollars per month.
This level of cost is by no means conducive to the operation of economy of scale given the nature of
RE, and SHS in particular. Although costs could be brought down somewhat through modification of
the collection method and posting of personnel, it is thought that the monthly fee would have to be
reduced to at least 11 or 12 dollars per month inclusive of battery replacement.

3-1
Chapter 3 RE program based on on-grid and off-grid electrification
3.1 On-grid electrification
3.1.1 NES and SHEP policy schemes
(1) NES
In parallel with its program of economic recovery initiated in 1989, the government of Ghana
formulated the National Electrification Scheme (NES) for attainment of the goal of nationwide
electricity supply over the 30-year period from 1990 to 2020. In the NES, the objectives of
electrification are promotion of economic development and increase in the standard of living. The
sources of the capital required for its promotion consist of grant and concessionary credit, taxes deriving
from the National Electrification Fund, and allocations from the national treasury.
The Canadian government provided grant funding for the NES formulation, and the study for national
power sector planning was executed with it. The study was made by the Canadian consultant firm Acres
International. This culminated in the preparation of the National Electrification Master Plan consisting
of six five-year plans and extending for the next 30 years. The Master Plan identified 4,221
communities with a population of at least 500 as sites eligible for electrification.
In the first phase of the NES, the subjects of electrification are all regional capitals and the
communities located on the way to them. In subsequent phases, work is to begin with projects offering
the best economic feasibility.
(2) SHEP
The Self Help Electrification Programme (SHEP) was prepared as a program to supplement the NES.
The SHEP supports electrification in communities that are no further than 20km away from 33- or 11-kV
distribution lines. The communities must purchase utility poles for low-voltage distribution lines. (At
present, the burden of low-voltage distribution line purchase is also borne by the government. In the
NED, residents pay 5,000 cedi on average as their burden of the cost for connection to the house and all
of the cost of in-house wiring, according to an interview with NED personnel.) The aim of this approach
was to attain system connection targets under the NES ahead of schedule.
In SHEP 1, which was implemented in 1990 - 1991, 50 communities were connected to the grid. In
SHEP 2, which was implemented from 1992 to 1994, some 250 communities were connected to the grid.
A nationwide survey was conducted in 1993 and 1994, and identified 1,400 communities as subjects
for SHEP 3. Because of the large scale, SHEP 3 was divided into three phases. The third phase was
completed at the end of 2004.

3-2
As of December 2000, a total of 1,877 communities (including all district capitals) had been
connected to the grid under the NES and SHEP projects.
In 2001, the government initiated SHEP 4. Applications were received from some 2,500
communities, and the government asked the ECG and VRA to make a feasibility study. The study
estimated the cost of electrification of all 2,500 communities at about 350 million dollars. The first
phase of SHEP 4 was conducted with materials left over from SHEP 3. As of the end of 2004, a total of
193 communities had been electrified.
The SHEP 4 is expected to be funded with soft loans and grant aid. At present, the only funding set is
the 15 million dollars from the Export-Import Bank of India determined in 2004.
Table 3.1.1 Status of NES achievement as of December 2000
Project Number of communities
NES 430
Other turnkey/bilateral aid projects 373
SHEP 1 100
SHEP 2 250
SHEP 3, Phase 1 280
SHEP 3, Phase 2 494
Total 1,877
(Source) MOE
Thanks to these electrification plans, the rate of household electrification nationwide, which was only
about 15% in 1989, reached 43% in 2000. This is the highest rate of any African country in Sub-Sahara
region.
The NES, however, is facing numerous problems. One particularly serious problem is the
non-payment of charges for power in rural areas. This is making it even more difficult to obtain the
income needed for investment to expand the power supply network.
3.1.2 Technical aspects of NES and SHEP
(1) Status of the distribution system
The distribution facilities in the northern part of Ghana are operated and managed by the regional
offices for each of the three regions. These offices are located in Tamale, Bolgatanga, and Wa.
Note: In addition to the three northern regions, the NED also supplies power in Techiman and Suyani.

3-3
These facilities are composed almost entirely of 34.5kV and 11kV lines (the former being equivalent
to 33 kV lines). The lines lead away from the substations in Tamale, Yendi, Bolgatanga, Wa, and Sawla,
the major towns in each region. The voltage is 11kV in all places except Sawla, where it is 34.5kV. In
some cases, distribution lines are extended directly from sub-transmission lines. This is the effective
method for transmitting power to scattered rural cities. The sub-transmission lines have a voltage of
34.5kV. In one exceptional case, current with a voltage to ground of 20kV or 30kV is put through two
aerial shield wires on the transmission line between Techiman and Bolgatanga, and the distribution lines
are fed from them.
Figure 3.1.1 shows the transmission and distribution line systems in the northern regions.
(Source) Prepared by JICA Study Team based on NED data
Figure 3.1.1 Transmission and distribution line systems in the northern regions
(2) Technical standards for distribution facilities
Ghana has established technical standards (Electrical Power System Specifications) that are common
to both the ECG and the NED. Facilities are constructed in accordance with these standards.
Electrification based on these standards would presumably leave facilities that would not present any
problems as regards safety or supply reliability.

3-4
Table 3.1.2 Main technical standards for distribution facilities
Item Standard
Frequency Voltage
33kV Rated voltage:33kV Peak voltage:36kV
11kV Rated voltage:11kV Peak voltage:12kV
Voltage
Low-voltage Rated voltage:433/250V Peak voltage:438/253V Low-voltage:358/207V
Cable High-voltage All Aluminum Conductor(AAC) Standard sizes
33kV trunk :400mm2、240mm2
、150mm2
feeder:240mm2、120mm2
、50mm2
11kV trunk :265mm2、150mm2
、120mm2
feeder:120mm2、50mm2
Supporting structures
High-voltage The standard structures are wooden poles or poles of galvanized steel pipe The standard height is 11 m, but 12- or 13-m poles are erected as necessary.
Design span High-voltage: 100 m in the case of 11-m poles Low-voltage: 46 m
(Source) ECG and NED
(3) NED projects and SHEP
1) Status of project implementation
Table 3.1.3 outlines the projects that have been initiated by the NED recently.
Table 3.1.3 Project outline
Project outline Site
Construction of one 2.5-MVA (33kV/11kV) substation Ntroso
Installation of one 315-kVA (33kV/0.433kV) distribution transformer Kenyasi
Installation of one 315-kVA (33kV/0.433kV) transformer for shield wire Installation of high-voltage line (5.2km)
Akomadan
Installation of two 200-kVA (34.5kV/0.433kV) distribution transformers Installation of one 200-kVA (11kV/0.433kV)distribution transformer
Tamale
Installation of eight 50-kVA (34.5kV/0.433kV) distribution transformers Tamale Airport Junction etc.
Extension of 11.5-kV high-voltage distribution line Installation of one 315-kVA distribution transformer
Watech
Installation of one 25-kVA distribuition transformer (single-phase) Kobedi
(Source) NED Annual Report
2) Status of SHEP implementation
Table 3.1.4 outlines the implementation of SHEP projects over the last few years at the NED.
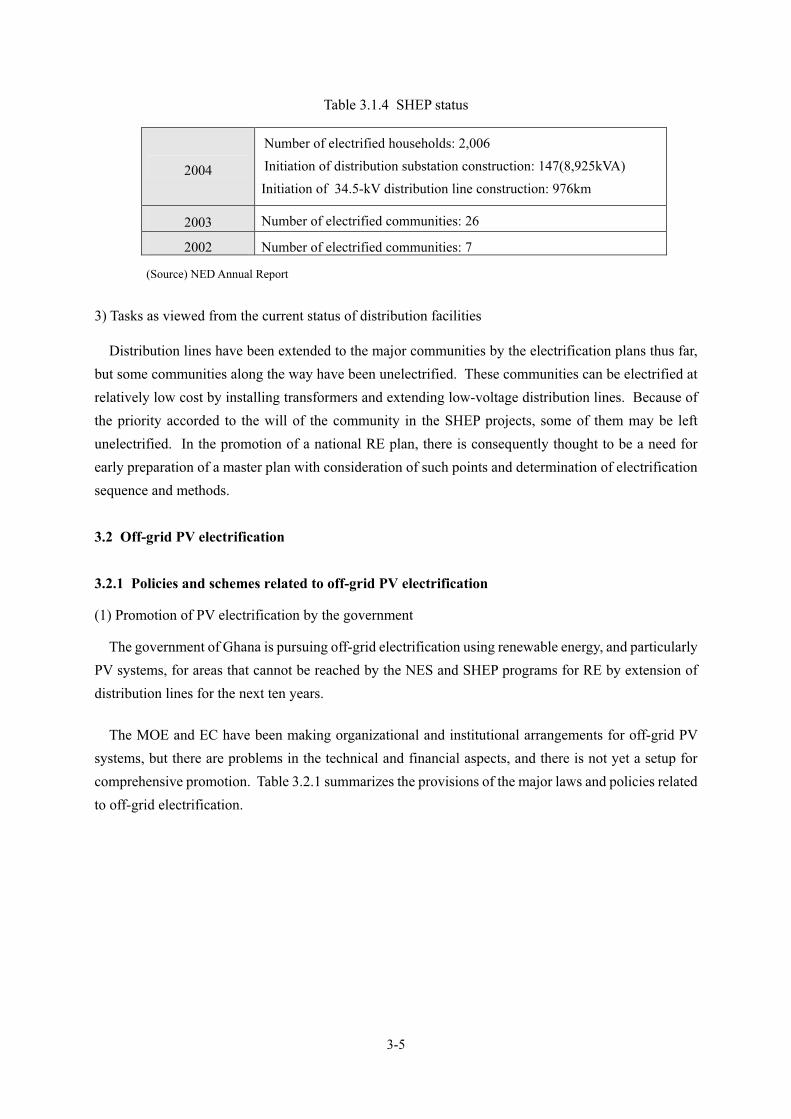
3-5
Table 3.1.4 SHEP status
2004
Number of electrified households: 2,006
Initiation of distribution substation construction: 147(8,925kVA)
Initiation of 34.5-kV distribution line construction: 976km
2003 Number of electrified communities: 26
2002 Number of electrified communities: 7
(Source) NED Annual Report
3) Tasks as viewed from the current status of distribution facilities
Distribution lines have been extended to the major communities by the electrification plans thus far,
but some communities along the way have been unelectrified. These communities can be electrified at
relatively low cost by installing transformers and extending low-voltage distribution lines. Because of
the priority accorded to the will of the community in the SHEP projects, some of them may be left
unelectrified. In the promotion of a national RE plan, there is consequently thought to be a need for
early preparation of a master plan with consideration of such points and determination of electrification
sequence and methods.
3.2 Off-grid PV electrification
3.2.1 Policies and schemes related to off-grid PV electrification
(1) Promotion of PV electrification by the government
The government of Ghana is pursuing off-grid electrification using renewable energy, and particularly
PV systems, for areas that cannot be reached by the NES and SHEP programs for RE by extension of
distribution lines for the next ten years.
The MOE and EC have been making organizational and institutional arrangements for off-grid PV
systems, but there are problems in the technical and financial aspects, and there is not yet a setup for
comprehensive promotion. Table 3.2.1 summarizes the provisions of the major laws and policies related
to off-grid electrification.

3-6
Table 3.2.1 Policy and legislation related to off-grid electrification in Ghana
Related policy and legislation Year Summary of provisions
Energy Commission (EC) Act 1997
Collection for the Energy Fund from income from sales of petroleum products, electricity, and natural gas. This fund is to be used to promote the development and use of PV and other renewable energy systems.
Ghana Poverty Reduction Strategy (GPRS)
2002 Stimulation of production activities among the poor in rural areas through supply of power to them with renewable energy systems, (PV, wind power, biomass)
Energy Policy (draft) 2004
For electrification of rural communities, the MOE shall promote off-grid electrification based on PV and mini hydropower systems, as well as on-grid electrification.
In cooperation with power utilities and private enterprises, the MOE shall initiate PV electrification programs for communities that would be difficult to electrify by extension of the grid.
(Source) Prepared by JICA Study Team from various documents
Funding for PV electrification may be obtained from the Energy Fund, but use of this fund is
negligible, partly because the annual income is very low at only 7 billion cedi, and the input of public
funds is limited. In sectors such as health care and education, PV projects are being promoted with
independent donor funds. For such reasons, it appears that the MOE does not have a full grasp of all
projects.
(2) Licensing scheme
The EC has instated a scheme of licensing for PV projects, and has already issued provisional licenses
to the two companies DENG Engineering and Terra Solar. These provisional licenses are issued to
enterprises that install PV systems and collect fees in the role of service providers. The scheme is not
adapted to the diverse components of the PV system industry, such as outright system sales and sales of
materials.
The scheme has not yet been solidly established, partly because of the lack of specific plans for
environment-friendly disposal of spent batteries and technical standards. According to the EC, the main
features of the provisional license scheme are as follows.
� The licensees must be qualified to engage in business in Ghana and satisfy the
environment-related requirements of the EPA.
� The license is valid for two years and must be renewed thereafter.

3-7
� The licensee must pay the prescribed licensing fee.
� The licensee must determine service fees inclusive of a financial plan.
� The licensee must observe the technical standards in procurement and installation.
� The licensee must submit reports on disposal of batteries.
� The licensee must submit periodic reports on its activities.
(3) Technical standards, code of prctice, and end user manuals
To maintain PV equipment quality on a certain level as well as to provide businesses and consumers
with proper technical information, it is indispensable to establish technical standards and a code of
practice on the national level. The Ghana government is also aware of this. With the support of the
Danish Agency for Development Assistance (DANIDA), the Ghana Solar Energy Society (GHASES)
and the Ghana Standards Board (GSB) collaborated in the drafting of technical standards (i.e., Draft
Standardized Requirements for the Application of PV Systems in Ghana). The EC has appropriated
budget for the completion of the standards, but they have not yet been approved, and the work is
consequently at a standstill.
At the first workshop held in March 2005, business representatives expressed apprehensions about a
tightening of governmental regulations due to the instatement of technical standards. The participants
eventually agreed to the idea after it was pointed out in discussions that the standards would not depart
from the conventional perspectives of international standards (i.e., that there would not be double
standards) and that the provision of correct knowledge to consumers in manuals would ultimately help
the PV industry to grow.
Because the technical standards and code of practice have not yet been established, the specifications
of the particular equipment and standards of the import source country are currently been applied on a
provisional basis. At present, the EC is leading the drafting of technical standards and a code of practice
targeted for completion at the end of 2005.
In the case of PV systems, users can extend the service life of their systems by carrying out proper
maintenance such as cleaning panels, reading charge controllers, and maintaining batteries. At present,
enterprises explain the use of systems to their customers in accordance with the manuals of their own
preparation. The first workshop also produced a basic agreement among the participants on a certain
degree of integration in preparation of these manuals.
(4) Study and training scheme, and equipment test center
In Ghana, there is no unified training for PV-related businesses on the national level; currently,
university institutions and enterprises put together their own curricula for it. In addition, technical
instruction is furnished by skilled engineers through on-the-job training (OJT).

3-8
However, there are strong needs for training at a national level and for a technical certification scheme
in order to improve technical capabilities and provide incentives for acquiring official qualifications.
Preparations are being made for establishment of a training scheme at Tamale Polytechnique, in the city
of Tamale in northern Ghana. Table 3.2.2 profiles the PV system training currently being offered.
Table 3.2.2 Current training for PV engineers
Implementing entity
Term Description
KNUST1
Two weeks
The KNUST provides training to technicians in response to an MOE request. It has not accepted any trainees over the last year. RESPRO technicians received this training. The KNUST offers classes on solar energy as part of its master's curriculum, and accepts students from other West African countries.
DENG Two
weeks
DENG Engineering provides training in the whole process of design and installation in line with the curriculum prepared by the Australian Institute for Sustainable Power (ISP). The text also covers mini hydropower and other types of renewable energy systems. The company plans to graduate about 100 technicians a year.
(Source) Prepared by the JICA Study Team based on interview findings.
Test centers for assurance of PV equipment quality are sited in the KNUST and DENG. Because they
are not on a large scale, however, they generally apply the results of plant testing at the import source.
3.2.2 Review of past PV projects
To promote off-gride electrification in districts where it would be difficult to extend the distribution
line under the SHEP, the government of Ghana executed pilot projects for off-grid PV electrification
with the support of donors from the second half of the 1990s. This section profiles four major projects.
(1) Renewable Energy Service Project (RESPRO)
The official name of this project is "Renewable Energy-based Electricity for Rural, Social and
Ecomonic Development in Ghana." Project expenditures for the first three years were met by 2.5
million dollars in grants from the Global Environmental Facility (GEF), 500,000 dollars from the
government of Ghana (including PV equipment worth 300,000 dollars) and 1 million dollars in technical
assistance funding from the National Renewable Energy Laboratory in the US Department of Energy.
The RESPRO was the largest single PV electrification project implemented in Ghana, and was
undertaken in the East Mamprussi District in the Northern Region. It promoted electrification of over
13 communities based on the fee-for-service model.
1 Kwame Nkrumah University of Science and Technology

3-9
The objectives of the project were as follows.
� Deepening of understanding in the Ghanaian government of requisite level of technology in
use of PV systems as stand-alone power sources and other factors involved in RE promotion,
in the areas of equipment selection, cost, and O&M costs
� Demonstration of the technical, economic, and institutional feasibility of extensive
installation of small PV systems to governmental authorities, the private sector, and aid
institutions
� Paving of the way for approaches to renewable energy in the context of the RE activities
currently being promoted to the MOE and power utilities
� Electrification of 13 unelectrified communities in remote areas
� Action as a catalyst for extensive use of PV technology
The idea underlying implementation of the project was the launch of power supply by PV systems
with models enabling full retrieval of costs on the private-sector basis.
Initially, the plan included the aim of getting the utilities deeply involved in the project. At the time,
however, the NED, which is in charge of the northern regions, was faced with a power crisis due to a
drop in hydropower output because of drought, and did not exhibit much interest as it lacked the margin
to support PV system projects.
The MOE consequently instituted a RESPRO unit to supervise the project and launched it in February
1999 without utility participation. The project installed about 1,400 PV systems (see Table 3.2.3).
Table 3.2.3 PV systems installed in the RESPRO
1. Household
District Town Total
Bolgatanga Tengzuk 40
Bolga 45
Bawku/East Pusiga 45
Navrongo 192
Tamale 108
Pishegu 40
E/Mamprusi Nakpanduri 310
Bunkpurugu 535
Upper West 34
Total 1,349

3-10
2. Non-Household
District Church
Mosque Bar Saloon Shop Office School Tailor
Fuel Shop
Total
Tamale 1 1 2
Kasena/Nankana 3 3
E/Mamprusi 6 8 1 7 1 1 1 2 27
E/Gonja 1 1 2
Gushegu/Karaga 3 3
Total 7 12 1 12 1 1 1 2 37
3. Public services
Street lights 13 Binde(4), Yunyoo (3), Tengzu (1)
Well pumps 1 Binde
Refrigerators for vaccine in clinics 3 Wantugu, Singa, Binde
(Source) New Energy, Renewable Energy Service Project (RESPRO)—Socio-Economic Impact Assessment Study of
Photovoltaic Electrification for Rural and Economic Development in Northern Ghana, September 2002
The RESPRO owns the PV systems and collects fees for performance of maintenance services
(fee-for-service model). In the case of residential supply, it received an initial installation cost of 10,000
cedi and monthly fee of 15,000 cedi for a 50W system, and corresponding sums of 15,000 and 25,000
cedi for a 100W system. Customers were obliged to pay a deposit equivalent to about six months of fees
at the time of installation. Because the monthly fee is held down to the lifeline fee for on-grid service,
the RESPRO cannot cover the cost of battery replacement, and there are plans for having this burden
assumed by the customers.
The following lessons were learned through the RESPRO.
� The energy service companies (ESCOs) installing and operating PV systems have a high
overhead.
� The RESPRO had a high operating cost because it was undertaken in a remote area.
� The government must determine definite policy to establish the PV market.
� Execution of PV programs requires a composite strategy.
� Wider spread of PV systems requires the construction of a policy framework accompanied
by a proper funding mechanism.
� The involvement of utilities is needed to maximize the benefits of PV systems.
� There is a need to improve the fee-for-service business model, which is reaching its limits in
use alone.
As a project promoted in this form with GEF funding, the RESPRO came to an end in 2002. The
RESPRO unit was registered as an NGO corporation and is currently active as an installer and operator
of PV facilities under the supervision of the MOE.

3-11
As of June 2005, the RESPRO was staffed with five technicians (two of whom are stationed in the
Upper East Region), one accountant, and one warehouse employee.
(2) Danish National International Development Agency (DANIDA) Project
The official name of this project is "Development of Renewable Energy Resources in Ghana." It was
conducted as a project of grant aid from the Government of Denmark, and part of the funding was
allocated for the construction of energy service centers. A total of 14 such centers were constructed and
installed with battery charge stations (BCS). Three of these centers were also equipped with solar
telephone offices. In this project, it was decided to install BCS instead of solar home systems (SHS),
which cost more, because of the low level of income among farmers as the beneficiaries.
In addition, rural banks provided loans to fund purchase of batteries and bulbs by beneficiaries.
The project was initiated in 1999 and operated centers for a period of two years between 2000 and
2002. In 2003, it was transferred to the EC, which transferred it to the regional assemblies in the
following year (2004). Thereafter, the regional assemblies were required to issue an annual report to the
EC on BCS operation and the financial status. The banks making loans to the beneficiaries were
required to submit financial statements.
The project was therefore transferred to the EC after a two-year proving period, which revealed the
following problems.
� Besides managing the collection of fees for use of the BCS on a daily basis, the personnel
operating the BCS had to make the rounds of households to ascertain the repayment of loans
made by the banks and collect them (this job was commissioned to the operators by the
banks because it would cost too much for them to make visits to households to retrieve
loans).
� The banks provided four-year loans and sought deposits as security from the loan recipients.
The borrowers merely paid the security deposits and made almost no effort to repay loans.
� As the beneficiaries who received loans refused to repay them, repayments to banks fell into
arrears. During the first three years, principal repayments were on the level of only about
10%.
� Even if banks sent officers to visit loan recipients in arrears to negotiate with them, the
recipients merely refused to make repayments. The operators commissioned to collect
repayments generally did not make a serious attempt to do so.
The following can be cited as prospective factors behind the decisive problems that occurred with
retrieval of bank loans.
� Because the banks did not participate right from the stage of project formation, the residents

3-12
did not regard them as project partners.
� The operator of the DANIDA Project did not clearly explain to the residents that the bank
loans carried a 10% interest and 1% commission, and that, as the borrowers, they were
obliged to repay these amounts.
� The banks, too, did not get a full explanation of the project from the project operator. As a
result, the residents were under the impression that the facilities were constructed with
grants, and did not realize that they had to repay the bank loans.
� The beneficiaries were dissatisfied that the batteries failed before the end of their service life.
When bulbs were burned out, they assumed that the BCS operators would replace them and
simply left them in the socket. Furthermore, the operators did not have a high level of skill.
These circumstances also dampened inclinations for repayment among the loan recipients.
� The communities are bound by ties of blood, and operators could not take a tough stance
when making rounds to collect loan repayments.
� Even if they succeeded in collecting repayments, operators sometimes ended up spending
the money themselves instead of handing it to the banks.
� Some operators even bought their own SHS, stopped using the unreliable BCS, and
connected the battery to the SHS. They asserted that they did not have to repay the loan
because they were not using the BCS.
� The loan sum was too big for the poor farmers. For banks, visits to borrowers in remote
areas to collect repayments entailed too much overhead.
As for the lessons, the project underscored the importance of seeing that participants have a clear
understanding of its meaning and are given the necessary knowledge in use of batteries. Because many
of the residents in the northern regions are poor, it is not easy to collect funds, and the project showed
that a "soft" financing system could very well lead to failure.
(3) Ministry of Mines and Energy/Spain off-grid project
This project was launched in July 1998, in advance of the RESPRO and DANIDA projects. It
consisted of installation work for the first two years and assurance by contractors for the last year. With
financial assistance from the Spanish government, it installed a total of 2,196 PV systems with a
combined output of 265kW in a total of ten communities. Systems were operated on the fee-for-service
basis.
The purpose was to prove the utilization possibilities of PV systems and identify the prerequisites for
incorporation of fee-for-service PV electrification into the NES.
The project cost was met by funding from the Spanish government split 50-50 between concessional
loans and export credits. The implementing institutions were the Ghanaian Ministry of Mines and

3-13
Energy (the predecessor of the MOE) and the Spanish firm ISOFOTON S.A. (whose Ghanaian
counterpart was Wilkins).
The project objectives were as follows.
• Supply of power to ten communities with dispersed PV systems
• Examination of issues in application of PV electrification based on the fee-for-service
model
• Examination of the influence of concentrated installation of PV systems connected in a
grid to government facilities
• Heightening of interest in PV systems and buildup of the needed human resources in
educational institutions
Table 3.2.4 Systems installed in the Spanish project
PV System Unit Capacity
(Wp) Number of Installation
Total Capacity (Wp)
Household use (A) 50 760 38,000
Household use (B) 100 1,163 116,300
Hospital 600 14 8,400
Street light 150 200 30,000
School/community 250 48 12,000
Water pump (tap water) 6,000 1 6,000
Water pump (irrigation) 1,200 1 1,200
Battery charging station 500 6 3,000
Centralized system 50,000 1 50,000
Total 2,194 264,900
(Source) Ahiataku-Togobo, Wisdom, MME/Spain Offgrid Sola PV Rural Electrification Project, Ministry of Mines and
Energy, November 2000
The district assemblies strongly supported the implementation of the project, which covered
communities that were at least 20km away from the existing grid. The project also stipulated instruction
about PV systems for the beneficiary communities and satisfaction of the following conditions.
� Residents desiring installation must pay a sum of 70,000 cedi (about 16 dollars at the time)
in initial costs through the district assembly within a prescribed time to cover the expense of
connection and indoor wiring.
� At least 30% of the parties desiring installation in the community must receive SHS.
� The monthly payment is 2 dollars per system.
The project selected communities able to meet these conditions within a certain period. A community
electrification committee (consisting of from three to six memberd including technicians) was
established with the cooperation of the assembly president or community chief, and managed the
facilities for the government. The committees were responsible for collection of monthly fees and

3-14
performance of O&M, and were to submit a list of all paying parties along with the fees collected to the
government. Parties failing to make payments for four months were informed that the system would be
removed unless payments were made within one month. To maintain the committee, 20% of the fee
revenue was paid to it as a commission.
A special account (the off-grid solar electrification account) was opened for management of all fee
revenue. Over the period of January 1999 - June 2000, this account accumulated about 150 million cedi
(about 30,000 dollars at the time).
The EC report entitled "Reconnaissance/Feasibility Studies for Solar PV Rural Electrification in
Off-grid Communities in Ghana" pointed to the following items as problems in the project.
� Of the ten communities, eight were in a re-settlement area of VRA. Although they were
reached by the grid after the PV systems had been installed, relocation of the PV systems
was not taken into account. As a result, users ended up having both on- and off-grid systems
regardless of their payment capabilities.
� While system ownership rights lay with the government, it was not possible to change
batteries and other parts due to the shortage of funds collected through the project. In
addition, community members sometimes neglected to return funds they collected to the
government.
� Due to the fierce resistance mounted by users, it was, in effect, impossible to remove
systems from non-paying users in a scheme under the direct jurisdiction of the government.
� To have the governmental staff directly perform system O&M and collect charges made
their work load excessive and was not realistic.
Upon the conclusion of the project term, the entire project was transferred to the RESPRO.
(4) MOE electrification project in junior secondary schools (JSS)
In 2004, the MOE began using the HIPC fund to install lighting systems in some 200 junior secondary
schools throughout the country. To eliminate interdistrict disparity, the project covered at least one or
two candidate schools in each district as a general rule, and ultimately finalized selections through
consultation with district leaders. The MOE procures the materials and consigns the installation work to
the RESPRO. Completion of the project is targeted for 2005.
3.2.3 Summary of problem points in past PV projects
Besides conducting interviews with the MOE and the RESPRO to determine the current status of PV
electrification projects, the Study Team carried out a field study in the areas shown in Table 3.2.5 to
confirm the state of past projects.

3-15
Table 3.2.5 PV electrification sites in the field study
Region District/community Systems studied
Northern Bunkpurugu Yunyoo/
Bunkpurugu ・SHS (residential and public facilities) and BCS installed by the
RESPRO
Upper West Wechiau/Wechiau ・SHS (residential and public facilities) and BCS installed by the
MOE with Spanish assistance
Upper West Wa/Wa ・SHS (installed by the RESPRO) of a comparatively affluent
home not electrified in the SHEP in the town of Wa2
Upper West Lawra/Babile ・Sites reached by the grid fairly soon after the installation of PV
systems by the RESPRO (at shops and households)
・SHS installed by the RESPRO at a junior secondary school Northern West Gonja/Busumu ・SHS at clinics and night schools installed in the DANIDA-New
Energy project Northern Central Gonje/Sankpala ・BCS installed in the DANIDA project Northern Tolon Kumubungu/
Wantulu ・SHS (for lighting, wireless equipment, and refrigerators) installed
at a clinic by the Ministry of Health (MOH)
(Source) Prepared by JICA Study Team based on project reports and interview findings
The field study of these sites additionally confirmed the following organizational and institutional
problems.
� In areas where the grid has been extended after PV electrification, some stores and
households used both systems (PV systems for lighting and the grid for other equipment) or
keep the PV systems for back-up. Users understand that the grid tariffs are commodity
tariffs and are oriented toward use of the PV systems for use at a flat rate.
� In public facilities, users did not understand the system ownership and in many cases left
systems out of order. In addition, users sometimes reported system failure to the district
assembly or national agency outpost in the district, but generally did not get any action in
return.
� Because many customers were petty farmers, they sometimes paid in lump sums when they
had income instead paying regularly.
� For BCS, operators were selected by the community to manage systems and collect charges.
For other systems, however, there was no such organized activity.
� In some areas, systems were not in operation due to the lack of supply spare material such as
Direct Current (DC) lighting bulb.
Through the PV pilot projects executed with the support of donors beginning in the late 1990s, Ghana
gained technical expertise and learned many lessons. Table 3.2.6 summarizes the problems identified in
past projects in the aspects of planning, O&M, tariffs/payments, and customers.
2 In this home, indoor wires had been installed for grid service and there was assortment electrical products including a
refrigerator, but a 300-W PV system was installed because of inability to pay the cost of 18 utility poles.

3-16
Table 3.2.6 Summary of problems with past PV projects
Project Spain/MME RESPRO DANIDA
System Solar home system (SHS) Solar home system (SHS) Battery charge station (BCS)
Project principal National government and
communities
Energy service company (ESCO)
Rural banks and communities
Business models Fee for service Fee for service Financing for customers from
rural banks
Plans
・The project selected areas
where extension of the grid
was expected as the
electrification subjects.
・ Attempts were made to
select areas unlikely to be
reached by the grid for
the foreseeable future,
but the grid service came
sooner than expected and
caused a problem of
relocation.
・Problems arose because the
project principal did not
explain matters fully to the
rural banks and customers in
advance.
O&M
・The area was too wide for
coverage by the
governmental technicians,
who consequently could
not offer enough support.
・The RESPRO is providing
technical support, but the
operating costs are high
because the work is
directly managed.
・ BCS operators perform
maintenance but did not have
the technical skills needed
for problem-solving.
Rate setting and
collection of
charges
・ The project failed
financially because the
tariffs were too low and
charges often could not be
collected.
・Communities did not return
the collected charges to the
government.
・Costs could not be retrieved
because the tariffs were
set on a par with the
lifeline tariff (2 dollars).
・Operating costs were high
because RESPRO
personnel collected
charges themselves.
・ BCS operators collected
charges, but could not take a
tough attitude due to ties of
blood.
・ Operators sometimes
pocketed the charges they
collected.
Customers
・Customers did not allow
systems to be removed
even though they were not
paying the charges.
・ Many of the customers
were poor farmers who
did not have a steady
income and paid in lump
sums after being in
arrears.
・Loans were made to residents
with low income levels.
・ Because of the lack of
in-depth advance
explanation, residents did
not understand their
repayment obligation.
(Source) JICA Study Team

3-17
3.2.4 Technical discussion for off-grid PV electrification
(1) Actual record of PV electrification in Ghana
1) Actual PV system installation
As of 2003, PV system installation in Ghana totaled 4,911 systems with a combined capacity of
1.0MW. Almost all of them were off-grid systems. Since 2004, the MOE has been promoting a project
for electrification of junior secondary schools. Ultimately, it plans to install PV systems in some 1,100
schools nationwide. As this indicates, PV systems are effective means of RE in Ghana.
Table 3.2.7 shows the number of PV systems installed in Ghana, and Figure 3.2.1, photos of two
systems.
Table 3.2.7 Number of PV systems installed in Ghana (as of 2003)
(Source) MOE CHALLENGES OF SOLAR PV FOR REMOTE ELECTRIFICATION IN GHANA
Clinic system (Busunu) Battery Charging Station system (Wacheu)
(Photo) JICA Study Team
Figure 3.2.1 Cases of PV system installation
Application No. of installation
Solar Home Systems 4,500
Water Pumping 80
Vaccine Refrigeration 210
Telecommunication(repeater stations) 63
Radio transceivers 34
Rural telephony 3
Battery charging stations 20
Grid connected (50kW) 1
Total Number of Installed Systems 4,911
Total Installed Capacity 1.0MWp

3-18
The specifications of the existing PV system equipment and materials vary with the project and with
the installer or manufacturer; they have not yet been unified. For the purpose of example, Table 3.2.8
shows specifications from the junior secondary school, DANIDA, and MME/Spain projects. The lack
of unified standards and specifications presents latent problems due to drawbacks in areas such as
equipment compatibility and availability. The establishment of standards and specifications is therefore
an urgent task.
Table 3.2.8 Examples of material specifications
Item MOE/JSS DANIDA MME/Spain
PV Module
Cell type Monocrystal Monocrystal
Peak power 50W 100W 50W 50W 100W
Peak power voltage 16.5-18.0V 16.5-18.0V
Peak power current 2.92-3.22A 5.98-6.29V
Short-circuit current 3.10-3.22A 6.53-6.87A 3.27A
Open-circuit voltage 21-22V 21-22V 21.6V
Warranty 15-20years 15-20years
Charge controller
Normal system voltage 12V 12V 12/24V
Normal current rating 10A 20A 10A 8A 15A
Maximum input current 15A 25A 25%
Input voltage range 12-25V 12-25V
Warranty 5years 5years
Battery
Type Flooded or
Sealed Flooded or
Sealed Flooded Sealed gel Sealed gel
Normal voltage 12V 12V 12V 12V 12V
Amp-hour capacity 80Ah-C10 144Ah-C10 60Ah-C20 105Ah 144Ah
Deep cycle capacity 2500cycle
at 50% 2500cycle
at 50%
Depth of discharge 50-60%
Warranty 5years 5years
DC/AC Inverter
Rated Power 250W
Surge power 600W
Efficiency 92%
Input current 22A
Output voltage 230V
Warranty 5years
(Source) MOE SECTION Ⅵ-TECHNIKCAL SPECIFICATIONS
SUPORT FOR THE DEVEROPMENT AND MANEMENT OF RENEWABLE ENERGY IN GHANA PROJECT
COMPLETION REPORT
MME, SPAIN OFF-GRID SOLAR PV RURAL ELECTRIFICATION PROJECT

3-19
2) PV enterprises in Ghana
The PV electrification project experience is cultivating the growth of many dependable PV
enterprises within Ghana. Table 3.2.9 lists those recommended by the MOE.
Table 3.2.9 List of PV system companies
No. Name No. Name
1 Wilkins Engineering Ltd. 5 DENG Engineering
2 SOLARCO Ltd. 6 Terra Solar
3 Gold River Solar Electric 7 WISE ENERGY
4 Solar Light Company 8 BEST Solar
(Source) MOE
The following is a profile of the major ones.
●Wilkins Engineering Ltd.
This company was founded in 1993 as an engineering consultant. It has been engaged in wiring,
PV system installation, and supply of related equipment since 1996. It imports material from the
Spanish company Isofoton. It has 28 full-time employees, 12 of whom are PV system technicians. It
also has 60 part-time employees. For PV systems, its main achievements were installation of the
50kW grid-connected system in the MOE and of 300 systems in schools across the country.
●DENG Engineering
DENG Engineering launched business in water heaters in 1995 and commenced business in PV
systems in 1998. It has about 50 employees, and maintains offices in Accra and Kumashi. It has
agencies in Donkorkrom, Nkoranza, and Tamale. It has also obtained a service provider license from
the EC. It began a comprehensive training course in the areas of system design, installation, and
maintenance for PV technicians in April 2005. Over the last five years, it has sold about 2,000 SHS
and 5,000 solar lanterns.
●Terra Solar
Established in 1998, Terra Solar obtained an EC license for service provision in 2004. It has three
employees, and imports equipment mainly from the United States, Canada, and Belgium.
●BEST Solar
BEST Solar grew out of PV projects implemented under the NGO New Energy beginning in 1989,
and was incorporated in 2002. It has seven employees, four of whom are PV technicians. It also acts
as an agent for DENG Engineering in Tamale. It purchases equipment mainly from DENG, but buys
seal batteries from WISE ENERGY. It installed PV systems in the RESPRO and DANIDA projects.

3-20
●WISE ENERGY
WISE ENERGY was established by the Dutch firm Stroomweak in 2001. It has 15 employees,
three of whom are engineers. It imports equipment from Stroomweak. It handles SHS, street lights,
pump systems, and back-up systems. Almost all of these products are standardized and sold in kits.
Stroomweak has installed about 10,000 SHS of the type it handles in Mali.
3) Problems with existing PV systems
In May 2005, the Study Team made a field study of PV systems installed in the northern regions.
Many of the users clean the panels once a week and are otherwise skillfully operating the systems.
Nevertheless, the following technical problems were observed in several cases. Some problems date
from the time of installation, while others arose in the process of maintenance and operation by users.
Examples are shown in Figure 3.2.2 and Figure 3.2.3, and descriptions are provided in items a) - i).
(Photo) JICA Study Team
Figure 3.2.2 Distribution lines directly connected to batteries (bypass of the charge controller)
(Photo) JICA Study Team
Figure 3.2.3 Broken connection box and battery

3-21
a) Because the charge controller failed, the PV panel and battery were directly connected.
- Battery damage and service life reduction due to overcharging and/or overdischarging
b) The battery is put out of action due to a lack of fluid, and the system does not operate.
c) The light is burnt out, but has not been replaced due to uncertainty about the party responsible for
replacement.
d) There is a mismatch of system components, e.g., too small battery capacity difference of
low-voltage guard operating values between the battery and inverter.
- Poor system effficiency, equipment damage due to differences in respect of operating
points.
e) Customers do not understand how to make routine checks, and do not know who to contact in
the event of breakdown.
- Induction of breakdown due to grime, etc.
- Escalation into more serious trouble due to delayed detection of defects
f) The PV panel supports are not long enough, and makeshift extensions are attached to them.
- Decrease in the strength of supporting parts.
g) Panels are not all headed in the right direction.
- Decrease in generation efficiency.
h) Spent or broken batteries are simply discarded.
- Soil contamination/water pollution due to the acid and lead contained in the batteries
i) Terminals are not used for connection of cable to the batteries. Terminals are exposed.
- System shutdown and shorting when cables slip off
- Shock due to contact with terminals
The technical causes of these problems include the difference of technical and installation standards
depending on the project and manufacturer, shortage of technicians, lack of education for users about
routine checking, lack of user manuals, and lack of basic knowledge about electricity and of PV system
knowledge among users and technicians. As such, the key tasks for resolution of these problems are the
establishment of uniform technical and installation standards, preparation of user manuals, user
education and information provision, and training of specialized technicians.
(2) Off-grid PV system design conditions
1) Recommended design conditions
In PV system design, it is important to set appropriate values for design parameters, because the PV
module output, battery capacity, and other factors differ depending on these values. Table 3.2.10 shows
design parameters and values applied by the RESPRO and BEST Solar.
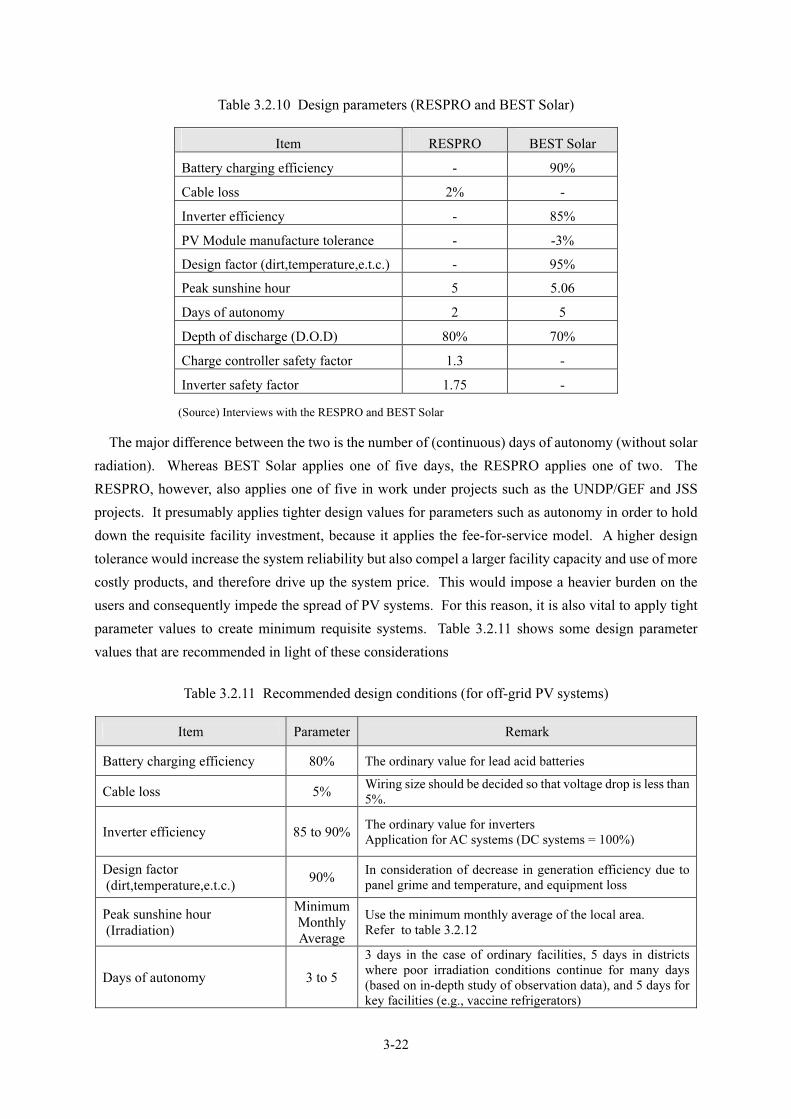
3-22
Table 3.2.10 Design parameters (RESPRO and BEST Solar)
Item RESPRO BEST Solar
Battery charging efficiency - 90%
Cable loss 2% -
Inverter efficiency - 85%
PV Module manufacture tolerance - -3%
Design factor (dirt,temperature,e.t.c.) - 95%
Peak sunshine hour 5 5.06
Days of autonomy 2 5
Depth of discharge (D.O.D) 80% 70%
Charge controller safety factor 1.3 -
Inverter safety factor 1.75 -
(Source) Interviews with the RESPRO and BEST Solar
The major difference between the two is the number of (continuous) days of autonomy (without solar
radiation). Whereas BEST Solar applies one of five days, the RESPRO applies one of two. The
RESPRO, however, also applies one of five in work under projects such as the UNDP/GEF and JSS
projects. It presumably applies tighter design values for parameters such as autonomy in order to hold
down the requisite facility investment, because it applies the fee-for-service model. A higher design
tolerance would increase the system reliability but also compel a larger facility capacity and use of more
costly products, and therefore drive up the system price. This would impose a heavier burden on the
users and consequently impede the spread of PV systems. For this reason, it is also vital to apply tight
parameter values to create minimum requisite systems. Table 3.2.11 shows some design parameter
values that are recommended in light of these considerations
Table 3.2.11 Recommended design conditions (for off-grid PV systems)
Item Parameter Remark
Battery charging efficiency 80% The ordinary value for lead acid batteries
Cable loss 5% Wiring size should be decided so that voltage drop is less than
5%.
Inverter efficiency 85 to 90%The ordinary value for inverters
Application for AC systems (DC systems = 100%)
Design factor (dirt,temperature,e.t.c.)
90% In consideration of decrease in generation efficiency due to
panel grime and temperature, and equipment loss
Peak sunshine hour (Irradiation)
MinimumMonthly Average
Use the minimum monthly average of the local area.
Refer to table 3.2.12
Days of autonomy 3 to 5
3 days in the case of ordinary facilities, 5 days in districts
where poor irradiation conditions continue for many days
(based on in-depth study of observation data), and 5 days for
key facilities (e.g., vaccine refrigerators)
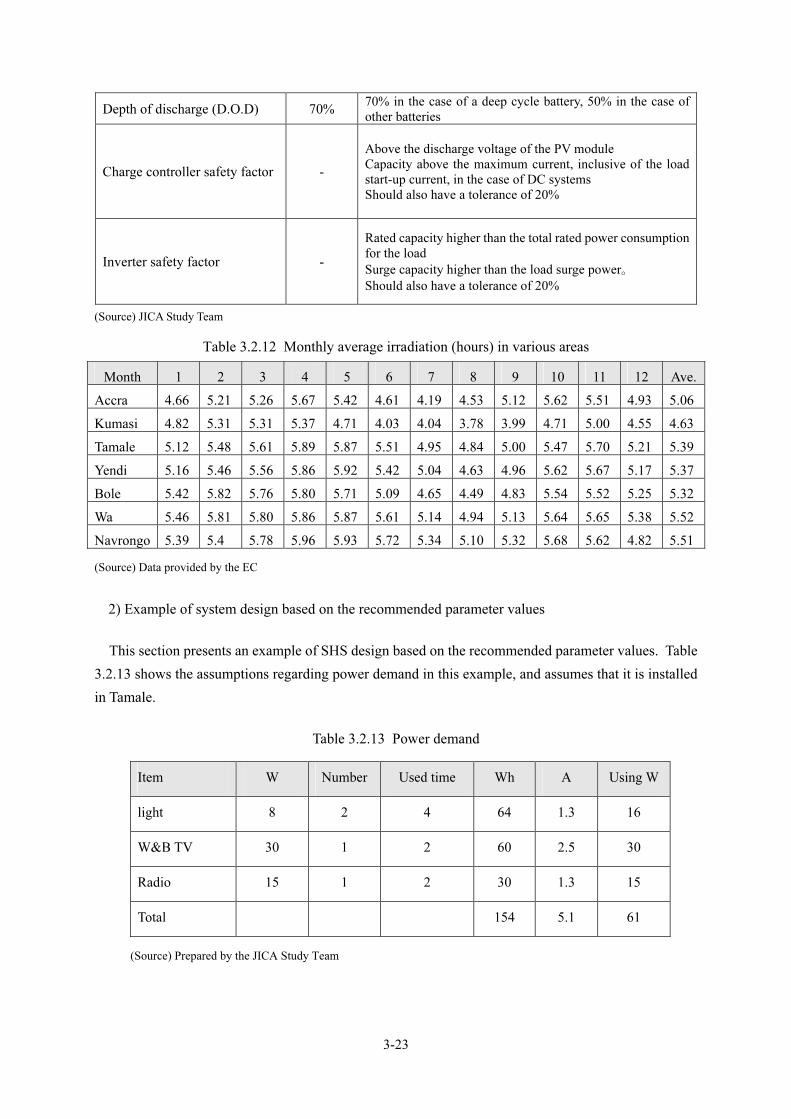
3-23
Depth of discharge (D.O.D) 70% 70% in the case of a deep cycle battery, 50% in the case of
other batteries
Charge controller safety factor -
Above the discharge voltage of the PV module
Capacity above the maximum current, inclusive of the load
start-up current, in the case of DC systems
Should also have a tolerance of 20%
Inverter safety factor -
Rated capacity higher than the total rated power consumption
for the load
Surge capacity higher than the load surge power。
Should also have a tolerance of 20%
(Source) JICA Study Team
Table 3.2.12 Monthly average irradiation (hours) in various areas
Month 1 2 3 4 5 6 7 8 9 10 11 12 Ave.
Accra 4.66 5.21 5.26 5.67 5.42 4.61 4.19 4.53 5.12 5.62 5.51 4.93 5.06
Kumasi 4.82 5.31 5.31 5.37 4.71 4.03 4.04 3.78 3.99 4.71 5.00 4.55 4.63
Tamale 5.12 5.48 5.61 5.89 5.87 5.51 4.95 4.84 5.00 5.47 5.70 5.21 5.39
Yendi 5.16 5.46 5.56 5.86 5.92 5.42 5.04 4.63 4.96 5.62 5.67 5.17 5.37
Bole 5.42 5.82 5.76 5.80 5.71 5.09 4.65 4.49 4.83 5.54 5.52 5.25 5.32
Wa 5.46 5.81 5.80 5.86 5.87 5.61 5.14 4.94 5.13 5.64 5.65 5.38 5.52
Navrongo 5.39 5.4 5.78 5.96 5.93 5.72 5.34 5.10 5.32 5.68 5.62 4.82 5.51
(Source) Data provided by the EC
2) Example of system design based on the recommended parameter values
This section presents an example of SHS design based on the recommended parameter values. Table
3.2.13 shows the assumptions regarding power demand in this example, and assumes that it is installed
in Tamale.
Table 3.2.13 Power demand
Item W Number Used time Wh A Using W
light 8 2 4 64 1.3 16
W&B TV 30 1 2 60 2.5 30
Radio 15 1 2 30 1.3 15
Total 154 5.1 61
(Source) Prepared by the JICA Study Team

3-24
a) Selection of PV modules
Used current Iu= = =12.83Ah
Requisited current In=
= = 18.9 Ah
Requisited PV output W = =
= 46.9
b) Calculation of battery capacity
Battery capacity =
= = 55
c) Selection of charge controller
The charge controller must have a higher capacity than the PV short-circuit current. In the case of a
DC system, the capacity has to be even higher because the load current flows through the charge
controller. The maximum load current varies with the equipment, but is generally as follows:
0.8×1.0×0.85
12.83
Sunshine hours h
Requisited current In×System Voltage V
4.84
18.9×12
0.7×1.0
Selection of a PV module with a maximum
power of at least 46.9 Wp
system voltage
Power consumption
12V
154Wh
Used current Iu
battery efficiency x inverter efficiency x design factor
depth of discharge x inverter efficiency
Use current Iu×Autonomy
12.8×3 Selection of a deep cycle
battery with a capacity of at
least 55 Ah

3-25
Lights: rated current x 1 – 2, TV sets: rated current x 2.5 - 5
Motors: rated current x 5 - 10
If the TV set is taken as the maximum, the calculation would be as follows.
Maximum load current = maximum TV set current + rated light current + rated radio current
=(2.5×5)+1.3+1.3 =15.1 A
If the short-circuit current of the PV module selected was 3.45 A, then:
3.45 < 15.1
A selection would be made of a charge
controller that had a capacity of at least
15.1 A.

4-1
Chapter 4 Current village socioeconomic status
4.1 Objective of the village socioeconomic study
Electrification projects are not a matter of merely supplying electrical materials and equipment; they
also require a determination of the circumstances among customers (including potential ones) as their
users. It is vital to ascertain all sorts of socioeconomic circumstances with attention to the following
questions.
1) Is electrification really necessary? (justification)
2) What are the proper choices for the type and scale of the electrification system? (efficacy)
3) What kind of impact will electrification have? (impact)
4) Are there any problems as regards payment for system use and the setup for O&M? (sustainability
and spontaneous expansibility)
The main indicators in regard to the first question are the pattern of life in the subject district, the level
of needs for electricity as compared to those for various other goods and services, and the level of
various development and economic activities.
Concerning the second question, the distribution of housing, use of electrical products, and type of
system preferred by the residents would be the main indicators for estimating the electrification method
and power demand.
The key indicator for the third question would be the diversity of circumstances induced by
electrification and the customer perception of them.
For the fourth question, the main indicators would be the amount of disposable income (based on
energy-related expenditures), relationship between electrical products people want to buy and their
disposable income, and the setup and capabilities for system O&M.
Objective data of this sort are of vital importance for estimation of power demand and establishment
of standards for the selection of areas and for the business models in formulation of the RE master plan.
They are also useful as material for judging relevance, effectiveness, and sustainability in discussion of
electrification policies by governmental authorities. In this master plan study as well, the Study Team
consequently collected and analyzed data concerning the socioeconomic status, and particularly that
related to power and energy, among customers in the three northern regions.
This socioeconomic study was under constraints of both time and budget. In the interest of efficient
collection and analysis of data, the Study Team decided to utilize secondary data including available
statistical documents and various reports for general socioeconomic data on the area level. For detailed
data on socioeconomic circumstances on the level of particular villages (especially as regards

4-2
electrification and energy, for which there are few data in available documents), it decided to collect data
through the field study of sample villages for analysis3. The Study Team therefore collected and
analyzed both quantitative and qualitative data through these two investigative components, in order to
achieve results that would assist formulation of the master plan for RE premised mainly on PV systems.
Figure 4.1.1 diagrams the concept of the village socioeconomic study.
1. Is electrification necessary?a. Life of people
b. Needs for electrification
c. Existence of community projects and
economical activities
2. What kind of system is suitable?a. Settlement patterns
b. Usage of electric appliancesc. Preferred electrification system
3. What impact will be caused
by electrification ?a. Impacts and problems caused
4. Is electric system affordable
and can be maintained?a. Capacity to pay
b. Electric appliances people want to
own
c. Maintenance ability
Residential Public&Social Commercial
Purpose of Socioeconomic Survey
Justification (Is electrification necessary?)Efficacy (What kind of system is suitable?)Impact (What impact will be caused by electrification)Sustainability & Spontaneous Expansibility (Is electric system affordable and can be maintained?)
Master Plan
Viewpoint from the customer-side
Target
(Source) JICA Study Team
Figure 4.1.1 Concept behind the village socioeconomic study
4.2 Procedure of the village socioeconomic study
4.2.1 Collection and analysis of secondary data
In Ghana, there have already been various studies portraying the socioeconomic status in villages, and
they have served as the basis for the preparation of documentation and statistical data. The Study Team
decided to make effective use of this material for more efficient execution of the socioeconomic study of
village life. More specifically, the materials shown in Table 4.2.1 were used to ascertain and analyze the
general socioeconomic situation in the three northern regions.
3 In available documentation, villages are termed "communities" or "localities."

4-3
Table 4.2.1 Survey of documentation on the village socioeconomic status
Document Description Remarks
District Medium Term Development Plan
General situation in each district and strategy for development
The chief edition is for the years 2002 - 2004, but there is also a 2001 - 2005 edition.
District Annual Development Plan 2005
General situation in each district and strategy for development
Although FY2005 has already begun, the Plan is still under preparation in many districts.
District Poverty Profiling and Mapping Report
General situation in each district and various data on poverty
Studies and reports are being prepared in the three northern regions with GTZ aid, but have not yet been completed in many districts.
(Source) JICA Study Team
4.2.2 Execution of the sample survey
The Study Team applied various techniques in implementing a sample survey with the objectives,
subjects, and study items noted below.
Table 4.2.2 Sample survey objectives, subjects, and items
1. Questionnaire survey
• Objective: Collection of socioeconomic data, both quantitative and qualitative, related to electrification and energy from households, public facilities, and commercial facilities, using questionnaire forms.
• Subjects: The survey was conducted with about 20 subjects in each community. The breakdown was generally 14 households, three public facilities, and three commercial facilities, but varied along with the number of public/commercial facilities in each community. Ordinarily, communities in rural areas take the form of "compounds" bringing together many households in a single site. However, the study took economically independent groups as the standard subjects instead of the compound. In the category of public facilities, the prospective survey subjects were mainly schools, health centers/clinics, water supply facilities, community centers, government facilities, mosques/churches, markets, automobile/bus stations, and institutions for management of outdoor lighting. In the category of commercial facilities, they were grocery stores, restaurants, lodging facilities, and household handicraft facilities as opposed to industrial plants and other large-scale facilities.
* The sample households representing each community were selected at fixed distances from the starting point calculated in correspondence with the total number of households in each community. The public and commercial facilities were selected at random.
• Survey items:
Households
1) General household information (membership, house build, occupation of the head, etc. 2) Information on power/energy (knowledge concerning electrification, lighting fixtures and expense, use
of electrical appliances, problems in power use and O&M, amount residents would be willing to pay, etc.3) Other important information (income/expenditure, needed services) *The questions may differ depending on whether the community is electrified or unelectrified)
Public/commercial facilities
1) Nature of business 2) Information on power/energy (lighting fixtures and expense, use of electrical appliances, problems
in power use and O&M, amount residents would be willing to pay, etc.)

4-4
2. Focus group discussion
• Objective: Collection of more detailed qualitative data that would be hard to obtain through conventional survey methods such as documentation surveys and questionnaire surveys. Based on certain guidelines, adjustments (e.g., change of question sequence or content, and deletions/additions) were made in the course of the discussion for correspondence with the membership and situation. There were two particular aims: 1) to determine the actual community awareness, expectations, and needs regarding electrification; and 2) to gauge the level of community power consumption and O&M capabilities.
• Subjects: The discussion was held in only 30 (15 for electrified and 15 for un-electrified) of the 93 communities studied. Each group had a membership of about ten residents in various positions, including the communitie heads, community assembly members, representatives of women's groups, representatives of youth groups, teachers, religious leaders, representatives of water management committees, farmers, and merchants.
• Discussion items: 1) General information (e.g., population, number of compounds, compound/facility density, activities
on a typical day, presence/absence of public/commercial facilities, presence/absence of community organizations, presence/absence of community development projects, and requisite services)
2) Information on power/energy (knowledge concerning electrification, problems in power use and O&M, reasons for lack of electricity, influence of electrification, amount residents would be willing to pay, etc.)
*The questions may differ depending on whether the community is electrified or unelectrified)
3. Interviews with key informants
• Objective: Collection of more detailed qualitative data that would be hard to obtain through conventional survey methods such as documentation surveys and questionnaire surveys. Based on certain guidelines, adjustments (e.g., change of question sequence or content, and deletions/additions) were made in the course of the discussion for correspondence with the membership and situation. Particular emphasis was placed on interviews with personnel concerned with facilities for education or health/medical care (Regional Offices in the Educaiton and Ghana Health Service), for which solar PV systems are anticipated to play an important role, to identify electrification problems and possibilities.
• Subjects: The interviews were held with personnel in the fields of education and health/medical care in 28 of the total 34 districts in the three northern regions.
• Discussion items: Electrification influence and problems in O&M (electrification facilities), electrification needs and possible O&M arrangements (unelectrified facilities), relationship with strategy in the fields of education and health/medical care, relationship with other development projects, etc.
(Source) JICA Study Team
The communities covered in the sample survey to represent the socioeconomic situation in the three
northern regions were determined by the following procedure.
Step 1
The survey population consisted of 3,246 communities remaining after exclusion of communities
with a population of no more than 250 from the total number of 6,585 communities (based on the fiscal
2000 census). (Communities with a population of no more than 250 were thought to be too small and so

4-5
excluded from the sample survey.)
On this basis, the following equation was utilized to determine a total of 93 communities considered
statistically significant.4
1)1(
1
)(
2
+−
−
=
PP
N
aK
Nn
ε
α=the probability (risk) of misestimation of the population characteristic value = ordinarily 5% = K (α) in
this case = 1.96
ε=margin of plus-or-minus error in the sampling ratio; a figure of plus-or-minus 10% was adopted in this
survey because one in excess of 10% makes it difficult to perform a comparative analysis with sufficient certainty.
n=the requisite number of samples
N=the size of the host population
P=population ratio; the share of the host population occupied by communities able to represent the
socioeconomic status in the three northern regions. To prevent the number of samples from becoming too small, the Study Team applied one of 50% to maximize the P (1-P) value (0.5 x 0.5 = 0.25).
Step 2
Next, the Study Team decided to classify the subject communities as follows in order to represent as many regional characteristics as follows.
Unelectrified communities
� Communities that can be electrified only by off-grid PV systems (meaning those other than the
communities that can be electrified by on-grid systems (SHEP) in the future)
� Communities that can be electrified by on-grid systems (SHEP) in the future (meaning
communities that are currently covered by SHEP and those that could physically be electrified
by extension of the grid if they so request)
Electrified communities
� Communities electrified by off-grid PV systems (in or before December 2001)
� Communities electrified by off-grid PV systems (in or after January 2002)
� Communities electrified by on-grid systems
Many off-grid PV projects were implemented in the late 1990s by other donors. As such, battery
problems, which greatly affect the sustainability of off-grid PV systems, may possibly have surfaced in
many communities so electrified by December 2001. The Study Team consequently decided to use the
start of 2002 as a boundary in classification of communities electrified by PV systems.
4 Statistical techniques for matters such as determination of the number of samples made reference to various social surveys and
documentation on statistical methods, and are not detailed here.

4-6
Furthermore, the Study Team excluded areas thought to present access problems, seeing that the field
study was to be conducted in the rainy season.
Step 3
The Study Team applied the broad classification noted above to the subject communities and then
randomly sampled them to select the communities to be covered by the survey. As the culmination of
this procedure it selected the communities noted below for the survey.
The samples numbered 93 in all. It was decided to determine the number in each class with
consideration of differences in respect of the number of communities in the three northern regions and
the small number of areas that have been electrified by off-grid PV systems since January 2002.
The following tables and figures show the communities covered in the sample survey.

4-7
Northern Region
Electrification Status Number of Sample Communities
Communities that can be electrified only by off-grid PV systems 21
Communities that can be electrified by on-grid systems (SHEP) in the future 6
Communities electrified by off-grid PV systems (in or before December 2001) 21
Communities electrified by off-grid PV systems (in or after January 2002) 0
Communities electrified by on-grid systems 9
Total 57
(Source) JICA Study Team
Figure 4.2.1 Map of the Northern Region
Table 4.2.3 Communities covered in the survey in the Northern Region
No. Community District Electrification Status*1
Population*2
1 Bimbini West Mamprusi 1 138
2 Duu West Mamprusi 1 4,500
3 Kpasenkpe West Mamprusi 1 14,200
4 Mpaha Central Gonja 1 7,000
5 Kafulwurape Central Gonja 1 465
6 Kusawgu Central Gonja 5 484
7 Sheri Central Gonja 1 1,978
8 Busunu West Gonja 1 2,572
9 Bethlehem West/Central Gonja 1 409
10 Butei West/Central Gonja 1 495
11 Lampur West/Central Gonja 1 261
12 Kokope West/Central Gonja 1 585
13 Kakale West/Central Gonja 1 350
14 Langatire West/Central Gonja 1 326
15 Kpabuso West/Central Gonja 1 1,443
16 Yapei West/Central Gonja 5 6,524
17 Kananto West/Central Gonja 2 506
18 Mandari Bole 1 2,790
19 Sawla Sawla 5 6,082
20 Yachadom Zabzugu/Tatale 2 872
35
36
3
2
5
4
1
97
37-57
28
30
29
31
18
14
8
1215
13
11 10
6
20
21
24
22
17
23
33
32
34
19
16
27
26
25
35
36
3
2
5
4
1
97
37-57
28
30
29
31
18
14
8
1215
13
11 10
6
20
21
24
22
17
23
33
32
34
19
16
27
26
25

4-8
No. Community District Electrification Status*1
Population*2
21 Nahuyili Zabzugu/Tatale 2 1,616
22 Kulkpaligu Zabzugu/Tatale 2 1,250
23 Sheini Zabzugu/Tatale 2 980
24 Kandin Zabzugu/Tatale 2 1,142
25 Zabzugu Zabzugu/Tatale 5 12,370
26 Tatale Zabzugu/Tatale 5 6,100
27 Sabare Zabzugu/Tatale 5 1,078
28 Wenchiki Saboba/Chereponi 1 1,131
29 Kpani Saboba/Chereponi 1 957
30 Kudani Saboba/Chereponi 1 549
31 Wapuli Saboba/Chereponi 1 1,695
32 Saboba Saboba/Chereponi 5 3,687
33 Demon Saboba/Chereponi 5 1,022
34 Sang Yendi 5 6,162
35 Tamaligu Savelugu/Nanton 1 1,720
36 Bagurugu Savelugu/Nanton 1 1664
37 Jilig No. 2 East Mamprusi 3 523
38 Jimbale East Mamprusi 3 1,590
39 Nanjong No.2 East Mamprusi 3 1,793
40 Nanjong No. 1 East Mamprusi 3 1,909
41 Binde East Mamprusi 3 1,759
42 Bunkpurugu East Mamprusi 3 1,234
43 Boufouk East Mamprusi 3 256
44 Bumbuna East Mamprusi 3 2,778
45 Chintilong East Mamprusi 3 924
46 Gbankoni East Mamprusi 3 6,000
47 Gbedank East Mamprusi 3 2,091
48 Gbetimopak East Mamprusi 3 418
49 Jiling East Mamprusi 3 520
50 Kambatiak East Mamprusi 3 1,064
51 Kambogu East Mamprusi 3 1,476
52 Kinkango East Mamprusi 3 859
53 Kpenteng East Mamprusi 3 528
54 Mangol East Mamprusi 3 481
55 Navier East Mamprusi 3 2,200
56 Pagnatik East Mamprusi 3 700
57 Tatara East Mamprusi 3 21
(Source) JICA Study Team
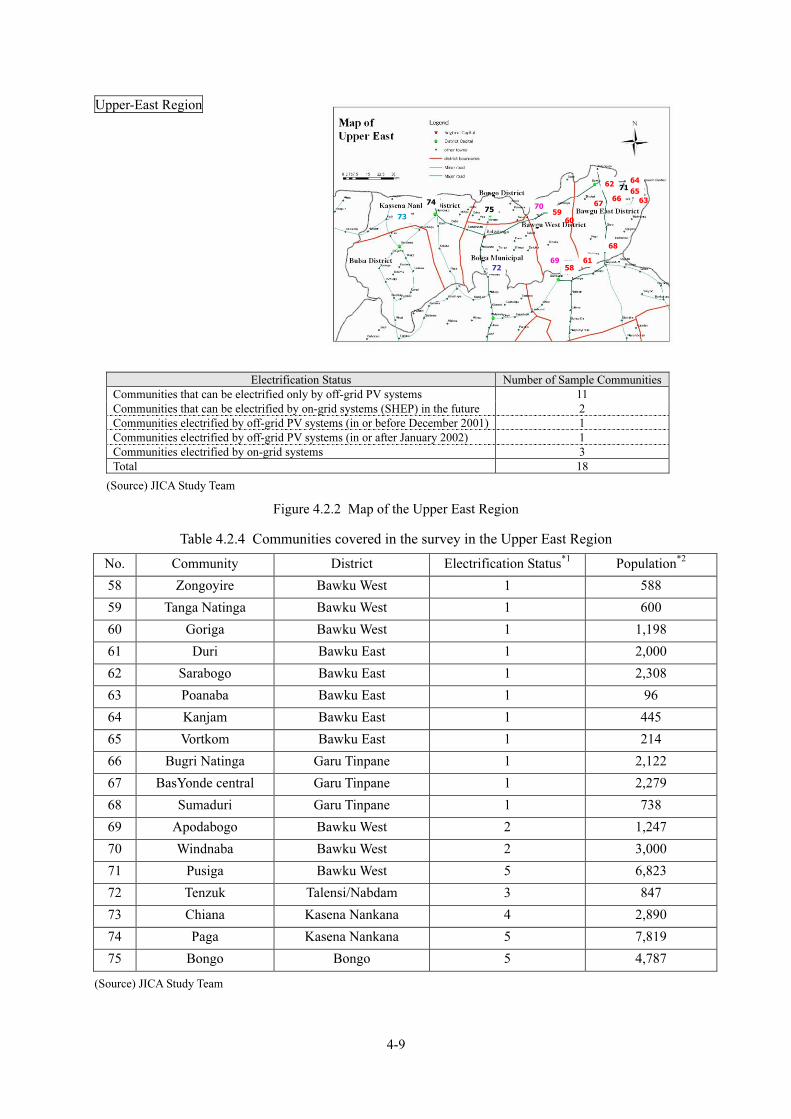
4-9
Upper-East Region
Electrification Status Number of Sample Communities
Communities that can be electrified only by off-grid PV systems 11
Communities that can be electrified by on-grid systems (SHEP) in the future 2
Communities electrified by off-grid PV systems (in or before December 2001) 1
Communities electrified by off-grid PV systems (in or after January 2002) 1
Communities electrified by on-grid systems 3
Total 18
(Source) JICA Study Team
Figure 4.2.2 Map of the Upper East Region
Table 4.2.4 Communities covered in the survey in the Upper East Region
No. Community District Electrification Status*1
Population*2
58 Zongoyire Bawku West 1 588
59 Tanga Natinga Bawku West 1 600
60 Goriga Bawku West 1 1,198
61 Duri Bawku East 1 2,000
62 Sarabogo Bawku East 1 2,308
63 Poanaba Bawku East 1 96
64 Kanjam Bawku East 1 445
65 Vortkom Bawku East 1 214
66 Bugri Natinga Garu Tinpane 1 2,122
67 BasYonde central Garu Tinpane 1 2,279
68 Sumaduri Garu Tinpane 1 738
69 Apodabogo Bawku West 2 1,247
70 Windnaba Bawku West 2 3,000
71 Pusiga Bawku West 5 6,823
72 Tenzuk Talensi/Nabdam 3 847
73 Chiana Kasena Nankana 4 2,890
74 Paga Kasena Nankana 5 7,819
75 Bongo Bongo 5 4,787
(Source) JICA Study Team
6462
6667
60
59
68
61
58
63
65
70
69
72
73
75
71
74
6462
6667
60
59
68
61
58
63
65
70
69
72
73
75
71
74

4-10
Upper-West Region
Electrification Status Number of Sample Communities
Communities that can be electrified only by off-grid PV systems 11
Communities that can be electrified by on-grid systems (SHEP) in the future 2
Communities electrified by off-grid PV systems (in or before December 2001) 1
Communities electrified by off-grid PV systems (in or after January 2002) 1
Communities electrified by on-grid systems 3
Total 18
(Source) JICA Study Team
Figure 4.2.3 Map of the Upper West Region
Table 4.2.5 Communities covered in the survey in the Upper West Region
No. Community District Electrification Status*1
Population*2
77 Wechau Wa 3 13,341
78 Fielmo Sissala 4 2,497
79 Kongo Jirapa 1 223
80 Buo Jirapa 1 2,100
81 Kogle Jirapa 2 839
82 Ketuo Jirapa 2 960
83 Kokoligo Jirapa 5 1,500
84 Jirapa Jirapa 5 8,060
85 Nadowli Nadowli 5 3,882
86 Banu Sissala 1 253
87 Wuru Sissala 1 370
88 Bichemboi Sissala 1 646
89 Puzene Sissala 1 611
90 Dasima Sissala 1 982
91 Duwie Sissala 1 759
92 Gbelle Sissala 1 229
93 Wasai Sissala 1 325
94 Kulkpong Sissala 1 1,455
87
91
89
90
92
88
7978
86
85
93
81
80
76
77
83
82
84
87
91
89
90
92
88
7978
86
85
93
81
80
76
77
83
82
84

4-11
*1Electrification Status is classified as follows;
1= Communities that can be electrified only by off-grid PV systems, 2 = Communities that can be electrified by on-grid systems
(SHEP) in the future, 3= Communities electrified by off-grid PV systems (in or before December 2001), 4= Communities
electrified by off-grid PV systems (in or after January 2002), 5= Communities electrified by on-grid systems
*2 Data on the number of population were acquired by the iterview in the sample survey. Therefore, communities with a
population of no more than 250 were included in the sample survey, although Population Census 2000 indicated those
communities as with a population of more than 250.
(Source) JICA Study Team
4.3 Results of analysis of the village socioeconomic study findings
The Study Team made an analysis of the various socioeconomic data from the documentation survey
and sample survey from the perspectives noted above, i.e.: 1) is electrification really necessary?
(propriety), 2) what are the proper choices for the type and scale of the electrification system? (efficacy),
3) what kind of impact will electrification have? (impact), and 4) are there any problems as regards
payment for system use and the setup for O&M? (sustainability and independent extensibility).
The Study Team initially divided the unelectrified communities into two categories: those that could
be electrified only by off-grid PV systems, and those that could be electrified by extension of the grid
(SHEP) in the future. It also expected to analyze and survey the communities electrified by off-grid PV
systems before and after 2002.
However, comparison revealed that there was not a lot of data difference between the categories of
unelectrified communities and communities electrified by off-grid PV systems. As such, to facilitate
comprehension of the results, it was decided to abolish the aforementioned categorization and apply a
division of three categories for the account in this chapter: unelectrified communities, communities
electrified by off-grid PV systems, and communities electrified by on-grid systems.
The sample survey was implemented from June to August of 2005. As noted above, it consisted of
the questionnaire survey, focus group discussion (FGD), and key informant interview (KII). Table 4.3.1
shows the breakdown of the number of questionnaire survey respondents (residences, commercial
facilities, and public facilities).
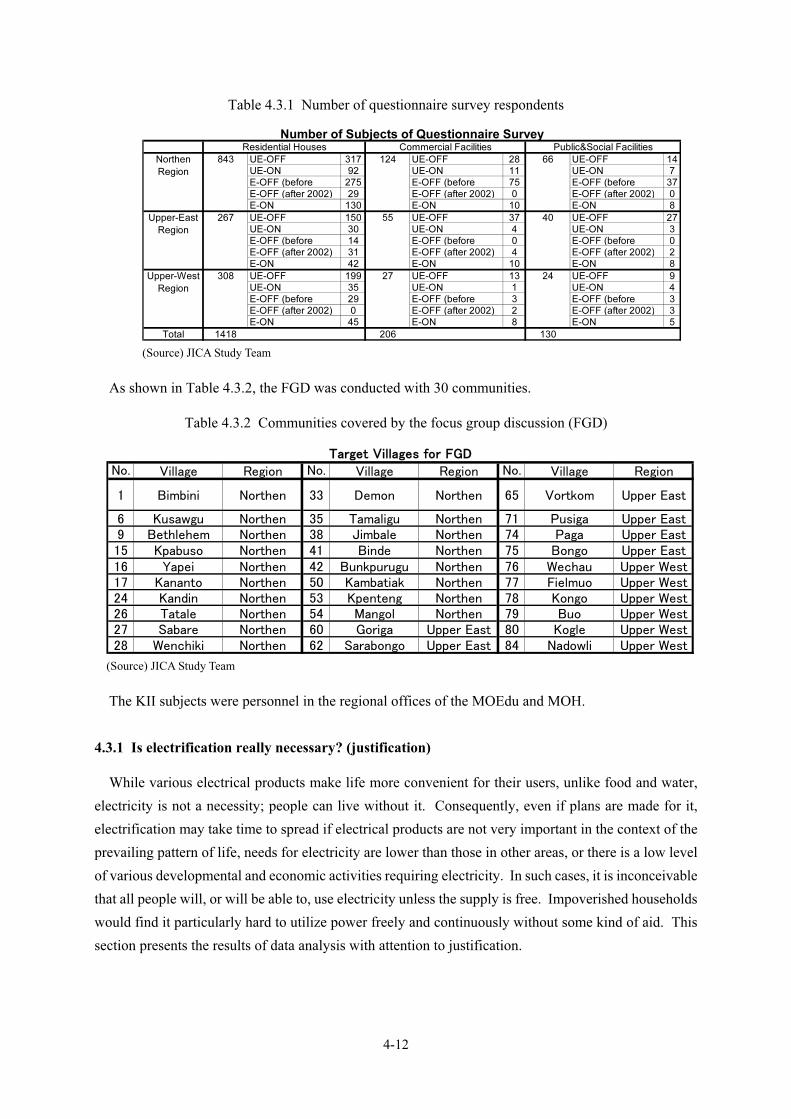
4-12
Table 4.3.1 Number of questionnaire survey respondents
(Source) JICA Study Team
As shown in Table 4.3.2, the FGD was conducted with 30 communities.
Table 4.3.2 Communities covered by the focus group discussion (FGD)
(Source) JICA Study Team
The KII subjects were personnel in the regional offices of the MOEdu and MOH.
4.3.1 Is electrification really necessary? (justification)
While various electrical products make life more convenient for their users, unlike food and water,
electricity is not a necessity; people can live without it. Consequently, even if plans are made for it,
electrification may take time to spread if electrical products are not very important in the context of the
prevailing pattern of life, needs for electricity are lower than those in other areas, or there is a low level
of various developmental and economic activities requiring electricity. In such cases, it is inconceivable
that all people will, or will be able to, use electricity unless the supply is free. Impoverished households
would find it particularly hard to utilize power freely and continuously without some kind of aid. This
section presents the results of data analysis with attention to justification.
No. Village Region No. Village Region No. Village Region
1 Bimbini Northen 33 Demon Northen 65 Vortkom Upper East
6 Kusawgu Northen 35 Tamaligu Northen 71 Pusiga Upper East
9 Bethlehem Northen 38 Jimbale Northen 74 Paga Upper East
15 Kpabuso Northen 41 Binde Northen 75 Bongo Upper East
16 Yapei Northen 42 Bunkpurugu Northen 76 Wechau Upper West
17 Kananto Northen 50 Kambatiak Northen 77 Fielmuo Upper West
24 Kandin Northen 53 Kpenteng Northen 78 Kongo Upper West
26 Tatale Northen 54 Mangol Northen 79 Buo Upper West
27 Sabare Northen 60 Goriga Upper East 80 Kogle Upper West
28 Wenchiki Northen 62 Sarabongo Upper East 84 Nadowli Upper West
Target Villages for FGD
UE-OFF 317 UE-OFF 28 UE-OFF 14
UE-ON 92 UE-ON 11 UE-ON 7
E-OFF (before 275 E-OFF (before 75 E-OFF (before 37
E-OFF (after 2002) 29 E-OFF (after 2002) 0 E-OFF (after 2002) 0
E-ON 130 E-ON 10 E-ON 8
UE-OFF 150 UE-OFF 37 UE-OFF 27
UE-ON 30 UE-ON 4 UE-ON 3
E-OFF (before 14 E-OFF (before 0 E-OFF (before 0
E-OFF (after 2002) 31 E-OFF (after 2002) 4 E-OFF (after 2002) 2
E-ON 42 E-ON 10 E-ON 8
UE-OFF 199 UE-OFF 13 UE-OFF 9
UE-ON 35 UE-ON 1 UE-ON 4
E-OFF (before 29 E-OFF (before 3 E-OFF (before 3
E-OFF (after 2002) 0 E-OFF (after 2002) 2 E-OFF (after 2002) 3
E-ON 45 E-ON 8 E-ON 5
Total 1418 206 130
66
40
24
267
308
55
27
Number of Subjects of Questionnaire SurveyResidential Houses Commercial Facilities Public&Social Facilities
Northen
Region
124
Upper-East
Region
Upper-West
Region
843

4-13
(1) Life situation of community residents
It is vital to make an analysis and decision as to whether people have a life pattern that really requires
a supply of electricity, through examination of their daily life.
Ordinary households
In the questionnaire survey, about 89% of the respondents in unelectrified communities were farmers
who grew crops for their own subsistence. The corresponding figures for communities electrified by
off-grid PV systems and on-grid systems were about 70 and 57%, respectively. The main crops are
peanuts, potatoes, cassava, corn, sorghum, grains, rice, and vegetables. The cash crops are shea nuts,
cotton, cashews, and onions. The main types of livestock are sheep, goats, fowl, pigs, and cows.
Farming depends on rainwater. The amount of production is generally low, and it is difficult to predict
harvests. In many cases, it is consequently not easy for farmers even to produce their own food supply.
Less than 1% utilize irrigation facilities.
Some households are engaging in activities to improve their livelihood, such as running drinking bars
or brewing pito, operating small general goods/drug stores, and extracting vegetable oil. Such economic
activity is more common among electrified communities than among unelectrified ones. There are also
some residents engaged in non-farming occupations, e.g., governmental employment (about 5% in
unelectrified communities, 18% in communities electrified by off-grid PV systems, and 20% in
communities electrified by on-grid systems), handicrafts (corresponding figures of about 1, 2, and 5%),
and retail sales (corresponding figures of about 1, 3, and 10%). Figure 4.3.1 shows the main types of
occupation in rural communities.
(Source) JICA Study Team
Figure 4.3.1 Main types of occupation in rural communities
The daily life pattern varies with the local tradition and religion. For this study, the Study Team
attempted to ascertain the general activity pattern through FGD. Figure 4.3.2 shows the typical activity
Classification of Household Heads by Occupation
0.0%
10.0%
20.0%
30.0%
40.0%
50.0%
60.0%
70.0%
80.0%
90.0%
100.0%
Un-
electrified
Electrified
on grid
Electrified
off grid
Electrification status
Occupations/Electrified and Unelectrified Communities
Govt official/wage employee
Artisan- self employed
Businessman/Trader
Farmer/Fisherman
labourer/unskilled worker
Others

4-14
pattern in ordinary households (by adult men and women in rural communities) in the three northern
regions.
(Source) JICA Study Team
Figure 4.3.2 Activity pattern in ordinary households
As compared to adult females, adult males in rural communities tend to be more active outside the
home and compound. The main activities of adult females are housework-type chores (inside the home
and compound) and socializing.
The best prospective times for use of electricity, and especially electric lights, are early morning and
nighttime. The activities in question are prayer sessions for a few hours beginning at about 5:00 AM,
cooking and cleaning at night, eating, and socializing. Power could also be used for listening to the
radio and viewing TV, but people generally use battery-powered radios and few of them have TV sets.
During the day, people are often at work in fields or other outside locations, and needs for power are
low.
Considering this situation in ordinary households in rural communities in Ghana, there are thought to
be needs for power for lighting about six hours in the morning and at night, and for entertainment (about
six hours' worth of radio and three hours' worth of TV per day).
Nevertheless, the prevalence of people engaged in subsistence-level farming indicates that many
people do not have significant cash and would find it hard to pay power tariffs on a both regular and
continuous basis. At the same time, there are also some households whose members are engaged in
economic activitis on a both regular and continuous basis, and some economically affluent households
in the vicinity of urbanized districts. It would be easy for them to purchase electrical products, and they
have rising needs for other products in addition to lights and TV sets.
MALE & FEMALE ADULTS DAILY ACTIVITY PATTERN
Activity *05 *06 *07 *08 *09 *10 *11 *12 *13 *14 *15 *16 *17 *18 *19 *20 *21 *22 *23 *24 *01 *02 *03
Rise from bed
Prayer
Collecting water
Listening to radio
Cooking and cleaning at home
Meal times
Attend to livestock
Prepare farm tools materials
Socializing at home
Community meetings
Working in the fields
Resting
Watching Television
Socializing outside
Meetings/literacy classes
Retire to bed after days work
Sleeping
Male
Female

4-15
Commercial facilities
Figure 4.3.3 shows the daily pattern of activity among commercial facilities in the three northern
regions (applying particularly to small stores and bars in rural communities).
(Source) JICA Study Team
Figure 4.3.3 Activity pattern of commercial facilities
Small stores are generally open for 12 or 13 hours beginning about 7:00 AM. Although the field
study found that some were open until late at night, it was enough to supply them with power for a few
hours at night if use was confined to lighting (but not if it included refrigerators and fans). Bars have the
same business hours as small stores, but usually are equipped with refrigerators and fans. As such, they
tend to consume more power for uses other than lighting.
Public facilities
Figure 4.3.4 shows the daily pattern of activity among public facilities in the three northern regions
(applying particularly to JSS and clinics).
(Source) JICA Study Team
Figure 4.3.4 Activity pattern of public (educational and medical) facilities
JSSs are typically open from 8:00 AM to 3:00 PM. Although some are installed with electrical
lighting, classes can be held with natural lighting from outside (through windows), and needs for the
former are not very high. Teachers use radios to hear the news, but there are not strong needs for other
GENERAL GOODS STORE & DRINKING BAR
Activity *05 *06 *07 *08 *09 *10 *11 *12 *13 *14 *15 *16 *17 *18 *19 *20 *21 *22 *23 *24 *01 *02
Store opens, usually stays open all
day
Store closes just after sundown
Bars open
Usually stay open till late
( till supplies are exhausted) Busy time for drinking bars
PUBLIC & SOCIAL SERVICES
Activity *05 *06 *07 *08 *09 *10 *11 *12 *13 *14 *15 *16 *17 *18 *19 *20 *21 *22 *23 *24 *01 *02
School opens
Cleaning classrooms and
compound
Classes begin
Recreation Break
Classes
Sporting activities
Closing
Evening adult literacy classes
Clinics opens
Stays open for consultation and
treatment
Family planning counselling
Busy time for clinics
Opens after hours to deal with
emergencies

4-16
electrical products. As such, needs for a supply of power in connection with formal schooling are low.
In contrast, there are higher needs for electrical lighting for facilities that are used at night for study by
students in higher grades or for adult literacy classes.
Like schools, clinics and other medical facilities are busiest around the middle of the day. For health
reasons, however, it is not recommended for them to open their windows, and they therefore have
stronger needs for electrical lighting even during the daytime. Naturally, electrical lighting is extremely
important at night both for ordinary care and for coping with emergencies such as childbirth. They also
have strong needs for electricity for applications such as storage of vaccine and blood, storage of bodies,
and wireless communications with medical institutions on a higher level.
Religious facilities have higher needs for electricity during times of worship, but the duration of use
of items such as lights, cassette players, microphones, and speakers is fairly short. The study found that
they generally used kerosene lamps for lighting at night (this was the case among 67% of the responding
facilities).
Figure 4.3.5 shows the degree of need for and urgency of electrification for each type of facility.
(Source) JICA Study Team
Figure 4.3.5 Need for electrification in each facility category
Ideally, a supply of electricity would be available to all people. In light of the current life and activity
circumstances, however, it would be more practical to promote electrification beginning with the areas
marked by the highest degrees of need and urgency. Ordinary households and impoverished homes in
rural communities would find it especially difficult to use electricity on a continuous basis, to the point
of paying the tariffs to do so. In contrast, electrification is more justified among more affluent
households with a regular income, or households near urbanized districts that presumably have higher
motivation for electrification because they know the convenience of a power supply and have
experienced entertainment applying electrical products. In addition, the electrification of public
facilities should be given a high priority because they exert a simultaneous impact on many users.
(Degree of electrification need/urgency Low)
Impoverished households
(engaged in subsistence-
level farming)
Affluent households (regular
income, location close to
urbanized districts)
Commercial
facilities (small
stores)
Commercial
facilities (bars)
Public facilities
(medical)
Public facilities
(schools and religious
facilities)
(Degree of electrification need/urgency High)

4-17
(2) Goods and services regarded as necessary at present
Life-enriching electricity is in the circle of various goods and services people want to have in the
future, but the order of priority accorded to these goods and services varies with the type of household.
When electricity has a lower priority than other items, it is possible that electrification will not spread in
the case of unelectrified communities and that power consumption will fail to rise in that of electrified
ones. For this reason, it is important to make full surveys and checks of actual needs for electricity in
preparation of the master plan.
Ordinary households
Figure 4.3.6 shows the results of the ordering of priority of various goods and services in respect of
need, obtained through the questionnaire survey and FGD in this study.
(Source) JICA Study Team
Figure 4.3.6 Ranking of electrification need
The top five responses as regards the goods and services most in need in unelectrified communities
were as follows: 1) good educational services and facilities, 2) safe water, 3) good health services, 4)
electricity, and 5) good public infrastructure (roads, bridges, etc.).
In communities already electrified by off-grid PV systems, on the other hand, the top five responses
were: 1) safe water, 2) good educational services and facilities, 3) good health services, 4) home
ownership, and 5) "others."
In communities electrified by on-grid systems, the top five responses were: 1) good educational
services and facilities, 2) good public infrastructure (roads, bridges, etc.), 3) safe water, 4) good health
services, and 5) electricity.
The respondents expressed strong needs for good educational services and facilities, safe water, and
good health services regardless of the community electrification status. The same trend emerged from
the FGD. This is because education, water, and health are basic human needs (BHN) indispensable for
life. In addition, these needs are not satisfied in many districts of the three northern regions.
Needs Ranking
First priority
0
5
10
15
20
25
30
Unelectrified Electrified on grid Electrified off grid
Priority needs by electrification status
House ownership
Good Educational
services and facilitiesPublic transportation
System for getting
clean waterIrrigation
Roads, bridges and
other infrastructureGood electricity
Good health services
and facilitiesLatrines
Job opportunities
Others, specify

4-18
In contrast, although the needs for it are by no means weak, electricity is not perceived as a BHN on
the level of education, water, and health services, because people can get along without it. Only when
they live in circumstances assuring a supply of educational services, safe water, and health services do
people begin to feel the need for electricity.
Conversely, as long as the major BHN apart from electrification are not satisfied, perceived needs for
electricity remain low and work against diffusion. For this reason, the further development and spread
of good educational services, safe water, and good health services must accompany the diffusion of
electricity. It could also be observed that the positioning of electrification would probably rise by using
it as a tool for the promotion of good educational services, safe water, and good health services.
Public facilities
Table 4.3.3 shows the current status of electrification of two major types of public facility
(educational and medical) based on the results of the KII.
Table 4.3.3 Electrification of public facilities (educational and medical) in the three northern regions
(Source) JICA Study Team
Educational and medical facilities that require a high level of electrical products have almost all been
electrified already. The reason is that these facilities are located in urbanized districts where there is a
good supply of electricity, because they cannot fully function without it. A policy factor is also at work
here: the MOE is promoting electrification for the diffusion of information and communication
technology (ICT) on the district level. In contrast, the low-level educational and medical facilities sited
in rural areas have not yet been electrified. Among them, electrification is justified.
The FGD as well as the KII underscored the need for electrification of the staff houses attached to
educational and health facilities. Electrification was found to be important for the performance of
various work within the housing (e.g., research of educational materials by teachers) and improvement
of personnel motivation in posting from urbanized districts through the increase in convenience and
comfort, and therefore is thought to have the requisite justification.
EDUCATIONAL FACILITIES HEALTH FACILITIES
No. District Pre/
Prim.JSS SSS Voc
Trg
Col.Tertiary
Adult
Lit.CHPS Clinic
Health
Cen.Hosp.
Dist.
Hosp.
Reg.
Hosp.
Nut.
Cen.
Trg
Inst.
1 SUMMARY-NR 2013 354 37 3 3 2 3797 12 46 89 7 6 1 9 3
2 SUMMARY-UER 719 218 22 2 2 2 2015 17 48 26 0 2 1 3 4
3 SUMMARY-UWR 619 264 17 7 2 2 1858 30 5 50 5 3 1 ? 2
Total 3351 836 76 12 7 6 7670 59 99 165 12 11 3 12 9
Electrified grid 455 211 74 12 7 6 455 8 22 54 12 11 3 10 9
Electrified PV 2 144 1 1350 1 11 28
Unelectrified 2894 481 0 0 0 0 6320 50 66 83 0 0 0 2 0
% Unelectrified 86% 58% 0% 0% 0% 0% 82% 85% 67% 50% 0% 0% 0% 17% 0%
Electrification Status of Educational & Health Facilities in the Northern Part
SUMMARY-UER

4-19
(3) Degree of development and economic activity
The degree of diverse development and economic activity in communities is another barometer of
electrification justification. In other words, if communities have extensive development and economic
activities requiring electricity, they presumably have higher electrification needs that would drive the
diffusion of electricity.
The FGD enabled determination of the development and economic activities in communities. It was
learned that various activities are being promoted by the community development committees, unit
committees (involved in infrastructural conditioning), and self-help groups.
The main development activities were construction of waterworks, schools, and health facilities;
installation of latrines; and construction of irrigation facilities. The main economic activities were shea
butter production, grain banking, soap making, grain milling, and other food processing. In addition,
groups offered literacy classes.
Judging from the need for electricity, the chief subjects of electrification in the context of
development activities would be waterworks and irrigation facilities utilizing electric-powered well
pumps. There are also strong needs for lighting and refrigerators in health facilities and lighting in the
conduct of literacy classes. For such reasons, electricity could very possibly contribute to the quality of
public facilities in communities.
In the context of economic activities, on the other hand, needs for electricity are lower because of
extensive utilization of traditional manual methods. The sole conceivable exception is the utilization of
electric-powered flour mills for grains, as evidenced by communities reached by the grid. However,
such mills consume a lot of electricity and cannot be powered by off-grid PV systems.
As indicated by the above, electrification is thought to have a high justification in the case of public
facilities in communities, but is not strongly needed for general economic activities at present. Although
needs for electrical motive power clearly cannot be denied, they could not be met without large-capacity
on-grid systems.
4.3.2 What are the proper choices for the type and scale of the electrification system? (efficacy)
If electrification is found to be justified, a study must be made of the proper type of system and scale
both at present and into the future. In examination of the cost-effectiveness of on-grid and off-grid PV
systems, the distribution of subject housing and facilities is one parameter. Likewise, the utilization of
electrical products serves as an indicator for forecastting the size of the power demand both at present
and into the future. Another parameter in system selection is the preferences of residents.
(1) Distribution of housing
While duration of sunshine is an important datum for assessing prospects for PV systems, from the
socioeconomic standpoint, the distribution of housing is also a vital item. Housing distribution affects
decisions on the method of electrification and planning for expansion of transmission and distribution

4-20
facilities. For example, if many unelectrified houses are located far from the existing distribution lines,
installation of stand-alone systems (such as solar PV systems) would probably be more effective,
considering the cost of line extension and O&M. As this suggests, it is crucial to ascertain the
distribution of houses and other facilities in each particular community. The three northern regions that
are the subject of this report have a combined population of about 3.5 million and a population density
averaging about 44 persons per square kilometer, lower than the national average of 79. On-site
observation through the field studies showed that, in many communities, housing is concentrated in the
central part and only sparsely scattered for a few kilometers around in other parts. There is a certain
interregional difference in respect of density that was also confirmed in the FGD. Whereas about 80%
of the housing is concentrated in the central part of the community, close to the home of the community
head and the market, in the Northern Region, the corresponding figure for the Upper East and Upper
West regions ranges from about 20 to 30%, with the remainder being scattered over a wide area. In this
respect, stand-alone systems such as solar PV would be especially effective in the Upper East and Upper
West regions.
(2) Use of electrical products
Ordinary households
The types of electrical product that people would or could buy after electrification and the demand for
electricity associated with the hours of product use can be estimated by viewing the use of electrical
products. Table 4.3.4 shows the rates of household diffusion (penetration) for various electrical
products. Although electrical products are ordinarily not available for use in unelectrified communities,
several households have small-scale generators of their own, and some possess electrical products that
can be powered by battery.
Table 4.3.4 Use of electrical products
(Source) JICA Study Team
N PenetrationHours
of useN Penetration
Hours
of useN Penetration
Hours
of use
Small colour tv 4 0% 5 5 1% 2.3 14 6% 3.42
Big colour tv 9 1% 2.9 9 2% 1.9 43 20% 3.95
Black and White tv 17 2% 2.2 23 6% 3.5 21 10% 3.41
VCR 11 1% 3.2 15 4% 2.4 30 14% 2.71
Radio 563 68% 5.9 225 60% 5 96 44% 4.52
Radio cassette player 401 49% 4.2 185 49% 3.7 123 57% 4.35
Small refrigerator 1 0% 6 3 1% 12 20 9% 16.2
Big Refrigerator 0 0% 0 2 1% 8 12 6% 15.09
Small freezer 0 0% 0 0 0% 0 6 3% 17.2
Big Freezer 0 0% 0 1 0% 24 5 2% 17
Cell phone charger 3 0% 24 0 0% 0 7 3% 17.14
Incadescent lights 3 0% 3 8 2% 8 107 49% 8.1
Flourescent lights 2 0% 7.5 60 16% 7.6 50 23% 8.8
Fan 7 1% 2.6 8 2% 2.8 55 25% 5.4
Flash light 453 55% 5.3 328 87% 3.4 91 42% 3.8
Sewing machine 1 0% 0 0 0% 0 1 0% 0
Electric iron 1 0% 0 4 1% 1 28 13% 1
Coil heater 0 0% 0 2 1% 1.2 19 9% 1.6
Table-top single burner cooker 0 0% 0 0 0% 0 0 0% 0
4 burner electric cooker 0 0% 0 0 0% 0 0 0% 0
Total No. of Respondents 823 378 217
Appliance owned and in use
Unelectrified Electrified on gridElectrified off-grid

4-21
From Table 4.3.4, it can be seen that the top three electrical products in each electrification category
are lights (including flashlights), radios, and cassette players (including those with a radio function).
Lights have obvious benefits and are the primary type of electrical product used by villagers. There is
a deep need for flashlights in communities where many residents are active outside and many areas are
dark at night due to the lack of outdoor lighting.
Radios are popular products because they are easy to carry around and provide all sorts of information
and entertainment. In rural areas, they are generally powered by battery. Cassette players are also
highly popular, partly because of their radio function but also because they match the general love of
music and promote social communication through singing and dancing.
Once they decide to further pursue their objectives in use of radios and cassette players, people may
be expected to consider purchase of TV sets. TV sets are highly popular as means of information and
entertainment, and may be considered status symbols in rural districts. The widespread diffusion of TV
sets, however, also requires broadcasting services (TV waves) with nationwide coverage.
The rate of electric fan ownership rises along with the level of electrification. Ghana's temperatures
make fans suitable for purchase as electrical products. There would seem to be strong needs for
refrigerators, but the diffusion rates for them are not very high. This appears to indicate that, in rural
communities, people mainly produce their own food and do not have enough disposable income to
readily purchase refrigerators.
The electric power demand can be estimated from the duration (hours per day) of use of these major
electrical products.
Commercial facilities
The major types of electrical product used in small stores are lights, radios, cassette players (with a
radio function), and fans. In terms of the daily average, these stores use lights for about 9 hours, radios
and cassette players for about 6 hours, and fans for about 7 hours.
Public facilities
The major types of electrical product used in SSS are lights and radios. On the average, junior high
schools use lights for 7.5 hours a day, and radios, for about 1 hour a day. High schools are already
electrified by on-grid facilities. Besides lights and radios, some also have fans, TV sets, and
refrigerators. In terms of the daily average, high schools use lights for 13 hours, cassette players with a
radio function for about 4 hours, and fans for about 10 hours.
Heath centers use lights, refrigerators, fans, water pumps, and other products. The duration of light
use is long (more than 10 hours per day on the average). As evidenced by refrigerators, the centers may
also use electrical products that utilize other types of energy (e.g., gas and kerosene) in addition to
electricity. They would like to use refrigerators for a longer duration, but generally limit their use to a
few hours a day because of the high energy costs.

4-22
Religious facilities make use of lights, fans, radios, cassette players with a radio function,
microphones, and speakers, each for 2 - 4 hours per day on the average.
(3) System preferences
Table 4.3.5 presents figures for the type of electrification system preferred by communitiers, based on
the responses to the questionnaire survey.
Table 4.3.5 Electrification preferred by villagers
(Source) JICA Study Team
Although other data indicate a low degree of understanding of electrification systems, most
respondents preferred on-grid systems because they felt that the tariffs for off-grid PV systems were
high considering their low capacity. Many (about 55%) of the questionnaire survey respondents
residing in communities electrified with off-grid PV systems indicated that service personnel were slow
to respond to trouble with the systems.
The promotion of off-grid PV electrification therefore demands campaign to erase the impression that
off-grid PV systems are inferior to on-grid systems.
4.3.3 What kind of impact will electrification have? (impact)
The perceived impact of electrification is a good indicator of its significance and a means of gleaning
lessons of value to future electrification. Nevertheless, electrification is generally regarded as having
positive effects for making life more comfortable; very few people deny its inherent value. This is
because electricity does indeed benefit people provided that the O&M and supply are properly
performed. In the category of public facilities, medical facilities gave the highest ratings of the positive
impact of electricity for facilitating their work.
In light of the above considerations, the socioeconomic study questioned respondents about the
negative impact of electrification and items of apprehension about it instead of its positive impact.
Table 4.3.6 profiles the awareness of the respondents about the influence of electrification from the
qualitative survey activities (KII, FGD, etc.).
On-grid SHS BCS I don't know
Unelectrified 60.8 31.2 1.6 6.4
Electrified off-grid 92.5 5.2 0.7 1.5
Electrified on-grid 82.7 13.5 0.0 3.8
Preferred eledctrification system (%)

4-23
Table 4.3.6 Negative effects of electrification and items of apprehension
Ordinary households
(Unelectrified communities)
- There is no access to the grid system.
(Communities electrified by off-grid PV systems)
- The supply is unstable.
- There is no access to the grid.
- The capacity is not sufficient for running mills.
- The number of homes electrified by off-grid PV systems in the community is still small.
- The systems are not suited for use to power refrigerators and TV sets.
(Communities electrified by on-grid systems)
- The number of homes electrified by on-grid systems in the community is still small.
- Power consumption results in a heavier monetary burden (because other energy costs do not decline even if
electrical systems are used).
- Youth are going to entertainment facilities with electricity and seem to do little else but view TV and video
programs. As a result, they spend less time at home and help out less in the home, and do less studying. This
points to the risk of a decline in traditional community culture.
- There is more noise at night due to the increase in various activity made possible by the supply of electricity.
(Source) Prepared by the JICA Study Team based on FGD results
The perceived negative influences of and apprehensions about electrification in the case of
commercial and public facilities are similar to those in the case of ordinary households. The main ones
are system capacity and tariffs. In the case of public facilities, it is often unclear which party (national
government, regional government, facility operator, or user) bears the responsibility for O&M. As such,
it may take time to make arrangements for payment of tariffs and O&M.
4.3.4 Are there any problems as regards payment for system use and the setup for O&M?
(sustainability and spontaneous expansibility)
Even if electrification is justified, electricity cannot be supplied free of charge. Therefore, the level of
payment ability among customers (actual and latent) is a critical factor for the spontaneous spread of
electrification.
With on-grid systems, O&M does not entail much time or trouble for customers, and is ordinarily
performed by the provider (business) side. With off-grid PV systems, on the other hand, the provider
may perform O&M, but the customer generally has to do a certain amount of work, e.g., clean the panels,
control the daily amount of electricity use, and manage the battery. For this reason, the availability of a
setup sufficient for O&M and elements needed for its skillful functioning is a key factor for spontaneous
expansion of electrification systems among households and communities.
This section considers data related to the self-propelled spread of electrification.

4-24
(1) Payable tariff
Ordinary households
Data for the economic situation related to payment for on-grid electrification systems are important
particularly for forecasting demand and estimating payable tariff rates in the preparation of master plans
for electrification. Nevertheless, it would be extremely difficult to obtain suitable economic data within
a short time, for the following reasons.
1) Residents do not have accurate records for their own income and expenditures.
2) Many residents are engaged in farming for their own subsistence and do not have a fixed regular
income.
3) Residents do not want to let others know much about their economic situation, and there may be
problems of credibility with their information.
In light of the above considerations, the Study Team decided to infer the payable electricity tariff rate
from the payment situation for various energy (electricity, kerosene, candles, batteries, etc.) instead of
data for general income and expenditure. (It should be added that, according to the monthly income data
obtained from a questionnaire survey with, however, a small number of samples yielded figures of about
903,000, or 99.1 dollars, in districts electrified by on-grid systems and about 511,000 cedi, or 56.1
dollars, in unelectrified communities. As regards the rate of land and housing ownership, which is an
indicator of income disparity, it may be noted that the figure approaches 90 % for individual and family
(or compound) ownership taken together. In respect of ownership of land and housing, the situation in
Ghana communities is therefore quite favorable.) It is also vital to compare the results of this last
socioeconomic study with those of previous ones.
Table 4.3.7 shows data for expenditures for various types of energy obtained from the questionnaire
survey.
Table 4.3.7 Energy expenditures by ordinary households
(Source) JICA Study Team
The monthly household expenditures for lighting (including kerosene lamps and other non-electrical
items) and use of electrical products averaged about 59,000 cedi (6.5 dollars) in unelectrified
communities, 80,000 cedi (8.8 dollars) in communities electrified with off-grid PV systems, and 77,000
cedi (8.6 dollars) in communities electrified with on-grid systems.
Table 4.3.8 presents more detailed figures for monthly energy expenditures.
Initial Running Cost ratio
Unelectrified households 986 120,000 59,000 14,000
PV electrified households 193 291,000 80,000 19,000 23.8%
Grid electrified households 216 296,000 77,000
Available
running costValid number
Avarage total energy cost Running cost for PV

4-25
Table 4.3.8 Energy expenditures by ordinary households (detailed)
Grid Generator Kerosene Candle Dry cell SHS BCS Lantern Others
Unelectrified households 0 0 37,617 166 20,712 0 0 0 572 120,124 59,067
PV electrified households 0 0 34,730 149 25,126 13,155 6,028 92 318 291,434 79,598
Grid electrified households 43,181 0 20,574 207 12,439 138 565 0 37 295,869 77,141
Monthly avarage cost
Total
(Source) JICA Study Team
Even when households are electrified, they do not stop using kerosene or batteries. This is because:
1) the existing electrification system is not adapted to products that are carried around, and 2) there is
parallel use of other energy due to considerations involving the tariffs for electricity.
At any rate, average monthly expenditures for kerosene, the main non-electrical energy, came to
about 37,000 cedi (4.1 dollars) in unelectrified communities, 34,000 cedi (about 3.7 dollars) in
communities electrified with off-grid PV systems, and 20,000 cedi (about 2.2 dollars) in communities
electrified with on-grid systems. The corresponding figures for batteries were about 20,000 cedi (2.2
dollars), 25,000 cedi (2.7 dollars), and 12,000 cedi (1.3 dollars), respectively.
In light of the level of expenditures for various types of energy in unelectrified communities, and
particularly for kerosene and batteries, the major non-electrical energies, the payable tariff level can be
inferred as follows.
1) When electricity can replace kerosene and batteries for all applications: about 58,000 cedi (6.4
dollars)
2) When electrification can replace half of the current applications: about 29,000 cedi (3.2 dollars)
3) When electrification can replace one-fourth of the current applications: about 14,000 cedi (1.5
dollars)
Even if electricity becomes available, households are unlikely to stop all spending for kerosene and
batteries. It may also be observed that electricity expenditures in communities electrified by PV systems
currently account for only about one-fourth of their total energy expenditures (the average for SHS and
BCS households taken together is about 19,000 cedi, or 2.1 dollars). As such, the monthly PV system
tariff level that could be paid without undue strain would be the third, i.e., about 14,000 cedi (1.5
dollars).The Study Team also collected data on the amount people would be willing to pay on energy, as
shown in Table 4.3.9.
Table 4.3.9 Amount ordinary households are willing to pay for electricity
Number Number
Unelectrified households 214 480
SHS electrified households 4 11
BCS electrified households 11 49
Grid electrified households 17 39
21,818
20500
Willing to pay less
Difference from
present cost(average: cedis)
58,893
42,654
Willing to pay more
Difference from
present cost(average: cedis)
28,841
35000
32,445
34,077
(Source) JICA Study Team

4-26
All households want to hold down their expenditures, and it is no surprise that the households wanting
to reduce energy expenditures are more numerous than those willing to pay more. The notable point is
the gap between the two. The ratio of the households willing to pay more to the those wanting to pay
less is 30 to 70 among unelectrified households and households electrified by grid systems, but 26 to 74
among those electrified with SHS and 18 to 82 among those using BCS.
While energy expenditures include spending on energy other than electricity, these results imply that
many customers are dissatisfied with PV system tariffs. The FGD in communities electrified with
off-grid PV systems also revealed pronounced feelings of unfair treatment as compared to on-grid
systems, which have a larger capacity and are eligible for official aid.
Commercial facilities
Table 4.3.10 shows monthly energy expenditures by various types of commercial facilities.
Table 4.3.10 Monthly energy expenditures by commercial facilities
Generalgoods/drug
store
Restaurant/bar
Drinkingbar/pitobrewing
BakeryFurniture/carpentar
HandicraftTailor/
seamstress
Hairsalon/barbe
r shopRepair shop
Grainmilling
Veg. oilextraction
Guesthouse
(Reference)households
Num. of facilities 23 1 26 2 3 2 21 6 5 34 4 10 986
Avg. mont. proft. 1,205,882 1,250,000 997,619 1,000,000 2,875,000 1,250,000 681,818 750,000 450,000 751,250 350,000 - -
Avg. engy. cost 38,870 19,000 38,327 - - 30,000 52,588 18,000 17,500 374,303 115,826 24,700 59,000
Num. of facilities 9 - 6 - 1 - 2 1 - - - 2 193
Avg. mont. proft. 1,812,500 - 1,125,000 - 1,250,000 - 462,500 - - - - - -
Avg. engy. cost 44,556 - 72,667 - 56,000 - 25,000 15,000 - - - 57,500 80,000
Num. of facilities 4 1 3 - 2 - 3 4 2 2 - 1 216
Avg. mont. proft. 600,000 500,000 3,750,000 - - - 250,000 625,000 1,000,000 625,000 - - -
Avg. engy. cost 75,000 80,500 191,667 - 160,000 - 61,000 60,250 60,250 355,000 - 75,000 77,000
Un-electrified
PVelectrified
On-gridelectrified
(Source) JICA Study Team
Among the commercial facilities, monthly energy expenditures by small stores, for which there were
fairly many samples, averaged about 52,800 cedi (5.8 dollars) overall. The corresponding figures were
about 38,000 cedi (4.2 dollars) in unelectrified communities, 44,000 cedi (4.8 dollars) in communities
electrified by PV systems, and 75,000 cedi (8.2 dollars) in communities electrified by on-grid systems.
Monthly energy expenditures by drinking bars averaged about 108,000 cedi (11.1 dollars) overall.
The corresponding figures were about 38,000 cedi (4.2 dollars) in unelectrified communities, 72,000
cedi (7.9 dollars) in communities electrified by PV systems, and 191,000 cedi (21 dollars) in
communities electrified by grid systems.
Tailor shops made monthly energy expenditures averaging about 46,100 cedi (5.1 dollars) overall.
The corresponding figures were about 52,000 cedi (5.7 dollars) in unelectrified communities, 25,000
cedi (2.7 dollars) in communities electrified by PV systems, and 61,000 cedi (6.7 dollars) in
communities electrified by on-grid systems.
Public facilities
Among public facilities, monthly energy expenditures averaged about 11,500 cedi (1.3 dollars) on the
junior secondary school level and 150,000 cedi (16.5 dollars) on the high school level. Religious

4-27
facilities spent an average of 113,000 cedi (12.4 dollars) per month for use of electrical lights and small
electrical products.
(2) Electrical products people want to buy
Electricity is used for all sorts of electrical product that make life more convenient. Data showing the
kinds of product people want to buy can consequently serve as indicators of the degree of need for
electricity and the advisable type of system.
Ordinary households
Table 4.3.11 lists the electrical products people want to buy, based on the results of the questionnaire
survey.
Table 4.3.11 Electrical products people want to buy
(Source) JICA Study Team
From Table 4.3.11, it can be seen that: 1) needs for electric lights are highest in unelectrified
communities, 2) needs for refrigerators and fans are highest in communities already electrified, and 3)
needs for TV sets are strong regardless of the electrification status.
It is often said that, as electrification spreads, people come to desire more sophisticated types of
electrical product. The second and third observations above, however, indicate that wants for TV sets
and refrigerators remain strong, and that all sorts of electrical product are not in widespread diffusion
even after electrification. In other words, it cannot be assumed that, once electricity is available, people
will use all sorts of electrical product right from the start or gradually expand the scope of products they
buy; in general, usage remains on the level of lights and TV sets.
N Penetration N Penetration N Penetration
Small colour tv 182 21% 60 30% 56 16%
Big colour tv 308 36% 66 33% 151 43%
Black and White tv 86 10% 6 3% 41 12%
VCR 61 7% 23 12% 17 5%
Radio 31 4% 15 8% 10 3%
Radio cassette player 157 18% 36 18% 68 19%
Small refrigerator 180 21% 39 20% 97 27%
Big Refrigerator 192 22% 63 32% 111 31%
Small freezer 41 5% 10 5% 19 5%
Big Freezer 50 6% 23 12% 28 8%
Cell phone charger 31 4% 13 7% 3 1%
Incadescent lights 228 27% 12 6% 35 10%
Flourescent lights 233 27% 15 8% 74 21%
Fan 177 21% 61 31% 93 26%
Flash light 6 1% 2 1% 1 0%
Sewing machine 26 3% 9 5% 8 2%
Electric iron 65 8% 22 11% 131 37%
Coil heater 73 8% 13 7% 41 12%
Table-top single burner cooker 38 4% 7 4% 45 13%
4 burner electric cooker 12 1% 5 3% 10 3%
Total No. of Respondents 859 200 353
Unelectrified Electrifid off gridElectrified on gridAppliance want to own
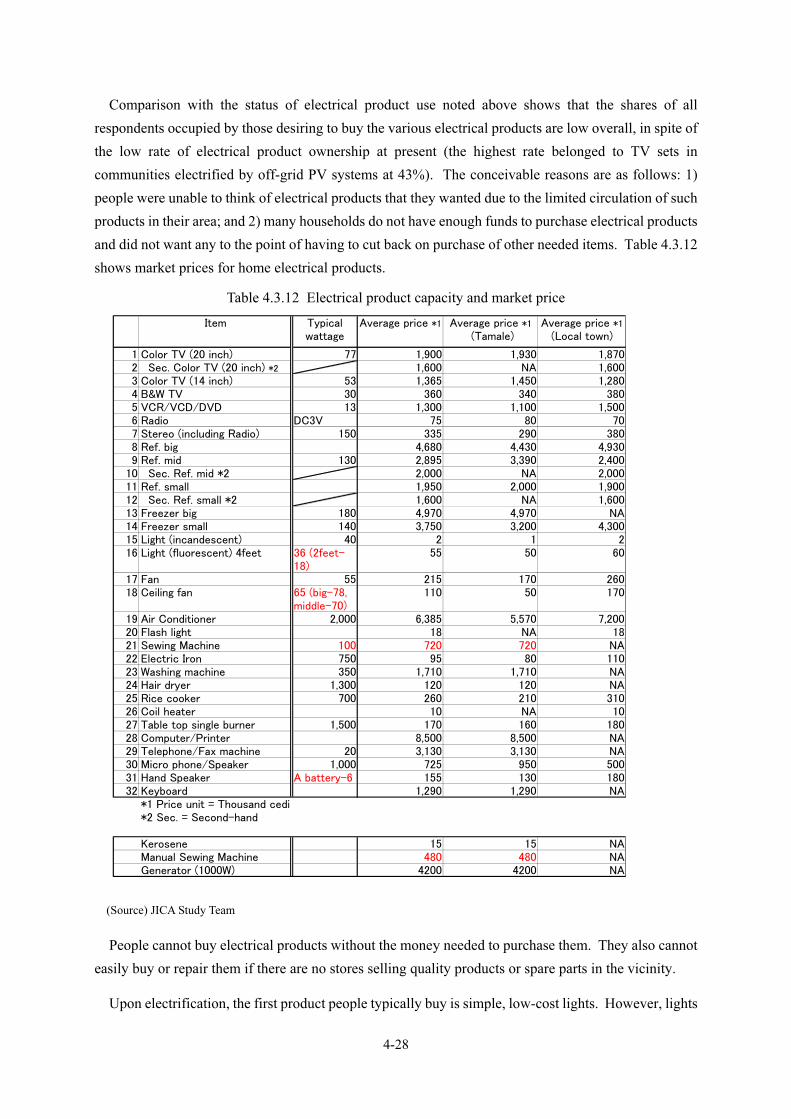
4-28
Comparison with the status of electrical product use noted above shows that the shares of all
respondents occupied by those desiring to buy the various electrical products are low overall, in spite of
the low rate of electrical product ownership at present (the highest rate belonged to TV sets in
communities electrified by off-grid PV systems at 43%). The conceivable reasons are as follows: 1)
people were unable to think of electrical products that they wanted due to the limited circulation of such
products in their area; and 2) many households do not have enough funds to purchase electrical products
and did not want any to the point of having to cut back on purchase of other needed items. Table 4.3.12
shows market prices for home electrical products.
Table 4.3.12 Electrical product capacity and market price
Item Typicalwattage
Average price *1 Average price *1 (Tamale)
Average price *1(Local town)
1 Color TV (20 inch) 77 1,900 1,930 1,8702 Sec. Color TV (20 inch) *2 1,600 NA 1,6003 Color TV (14 inch) 53 1,365 1,450 1,2804 B&W TV 30 360 340 3805 VCR/VCD/DVD 13 1,300 1,100 1,5006 Radio DC3V 75 80 707 Stereo (including Radio) 150 335 290 3808 Ref. big 4,680 4,430 4,9309 Ref. mid 130 2,895 3,390 2,400
10 Sec. Ref. mid *2 2,000 NA 2,00011 Ref. small 1,950 2,000 1,90012 Sec. Ref. small *2 1,600 NA 1,60013 Freezer big 180 4,970 4,970 NA14 Freezer small 140 3,750 3,200 4,30015 Light (incandescent) 40 2 1 216 Light (fluorescent) 4feet 36 (2feet-
18)55 50 60
17 Fan 55 215 170 26018 Ceiling fan 65 (big-78,
middle-70)110 50 170
19 Air Conditioner 2,000 6,385 5,570 7,20020 Flash light 18 NA 1821 Sewing Machine 100 720 720 NA22 Electric Iron 750 95 80 11023 Washing machine 350 1,710 1,710 NA24 Hair dryer 1,300 120 120 NA25 Rice cooker 700 260 210 31026 Coil heater 10 NA 1027 Table top single burner 1,500 170 160 18028 Computer/Printer 8,500 8,500 NA29 Telephone/Fax machine 20 3,130 3,130 NA30 Micro phone/Speaker 1,000 725 950 50031 Hand Speaker A battery-6 155 130 18032 Keyboard 1,290 1,290 NA
*1 Price unit = Thousand cedi*2 Sec. = Second-hand
Kerosene 15 15 NAManual Sewing Machine 480 480 NAGenerator (1000W) 4200 4200 NA
(Source) JICA Study Team
People cannot buy electrical products without the money needed to purchase them. They also cannot
easily buy or repair them if there are no stores selling quality products or spare parts in the vicinity.
Upon electrification, the first product people typically buy is simple, low-cost lights. However, lights

4-29
alone are not enough to produce a feeling of contentment. Use of electricity gradually increases once
they are able to purchase various other electrical products and come to appreciate their convenience and
entertainment value.
This, in turn, depends on the existence of disposable income, i.e., income beyond the minimum
requisite for subsistence. With disposable income, people can buy various electrical products. In rural
communities of Ghana, however, the livelihood of most households is on the subsistence level; few have
sufficient disposable income. The household diffusion of electricity is consequently anticipated to
proceed only gradually.
While the questionnaire survey did not probe the kinds of electrical product for which there were
strong needs among commercial and public facilities, the KII revealed strong needs for TV sets and
video decks among junior secondary schools, which want to make use of educational programs for
remote education. Because of the high indoor temperatures, many interviewees also expressed desires
for electric fans to make classrooms more comfortable.
(3) O&M setup and capabilities
The availability of O&M setups and capabilities on the local level is another key factor for the spread
of PV electrification systems. The main parameters of such setups and capabilities are: 1) whether or
not various organizations already established are functioning properly, and 2) degree of knowledge
about electricity among residents.
The FGD obtained data about the activities of various existing organizations. These data evidence
vigorous activity by community development committees, infrastructural improvement committees, and
various self-help groups, as described above. Efforts are also being made by local and international
NGOs. This situation indicates the potential for some orchestrated activity.
The activities led by communities (such as the operation of mills and BCS), however, do not always
proceed well, due to causes including a lack of capabilities for management of funds and other items,
lack of technology, and insufficient awareness of ownership. As regards PV system O&M, in contrast,
small service enterprises handling local PV systems are functioning smoothly in some cases.
In other words, communities have various organizations with the potential for PV system O&M, but
there is an undeniable shortage of management and technical capabilities that demands further education
and training for correction. On the question of the key personnel for O&M performance, the FGD and
other sources produced opinions in favor of effective use of the energies of small local service
enterprises and proposals for education and employment of women as O&M supervisors, in keeping
with the goal of empowerment.
The degree of knowledge about electricity is another vital factor for estimating O&M setups and
capabilities. Table 4.3.13 shows the results of the questionnaire survey for this item.

4-30
Table 4.3.13 Knowledge about electrification
About National
Electricity Grid
About SHEP About SHS
Unelectrified 19.5 25.1 69.3
Electrified off-grid 8.8 30.0 84.1
Electrified on-grid 36.5 22.6 50.0
Knowledge about Electrification (%)
(Source) JICA Study Team
Understanding of on-grid electrification and access to the SHEP is low regardless of the
electrification status. In the case of communities that have already been electrified by on-grid systems,
this finding indicates that many residents still do not have access to electricity. In other words, even
among electrified communities, there are gaps in respect of the electrification level.
In the questionnaire survey, about 89% of the respondents in communities electrified with off-grid PV
systems said they had not received any particular O&M instruction.
These findings underscore the importance of conducting campaigns for enlightenment and publicity
about electricity among the end-user customers as well.

5-1
Chapter 5 Off-grid PV RE plan
5.1 Renewable energy potential
5.1.1 Solar power potential
(1) Irradiation
In Ghana, annual average irradiation is high; it ranges from 4.57 to 5.52kWh/m2・day and averages
5.10kWh/m2・day nationwide. This is about 1.5 times as high as in Japan (Tokyo), where the
corresponding average is 3.34kWh/m2・day. These figures underscore its high PV power generation
potential.
To estimate the generation potential from the average irradiation, use of 0.1% of the national area of
238,537km2 for PV power generation with a conversion efficiency of 10% would translate into an output
of 44,400 million kWh/year. This is equivalent to a power station in the 5 million kW class.
Figure 5.1.1 presents an irradiation map, and Table 5.1.1, the average annual levels in individual
districts. The levels tend to be higher in the northern districts and lower in the southwestern districts.
They are highest in Wa (in the Upper West Region), where they average 5.52kWh/m2・day. In the three
northern regions, irradiation averages 5.42kWh/m2・day, higher than the nationwide average.
(Source) EC Annual Report
Figure 5.1.1 Irradiation map

5-2
Table 5.1.1 Annual average irradiation in each district
(kWh/m2・day)
Navrongo Wa Yendi Tamale Bole
5.51 5.52 5.37 5.39 5.32
Krachi Wenchi Ho Abetifi Kumasi
5.28 5.02 5.12 5.15 4.63
Akuse Koforidua Akim Oda Bekwai Ada
4.81 4.84 4.57 4.73 5.41
Accra Saltpond Takoradi Axim average
5.06 5.17 5.01 4.91 5.10
(Source) EC data
(2) Trend of irradiation
In Ghana, insolation gradually increases beginning in January and peaks in April. It begins to decline
in June and is at its lowest in August. It starts to increase again from October to November, and declines
slightly in December. The ratio of the minimum to the maximum averages 1:1.29 nationwide and 1:1.22
in the three northern regions. The level is stable throughout the year.
Table 5.1.2 shows the monthly trend of irradiation, and Figure 5.1.2, a graph of the same (including
a line for Tokyo for the purpose of comparison).
Table 5.1.2 Monthly irradiation
(kWh/m2・day)
Jan Feb Mar Apr May Jun Jul Aug Sep Oct Nov Dec Average
GHANA 4.97 5.36 5.48 5.65 5.46 4.83 4.56 4.38 4.73 5.36 5.41 4.98 5.10
Northern Part 5.31 5.59 5.70 5.87 5.86 5.47 5.02 4.80 5.05 5.59 5.63 5.17 5.42
TOKYO 2.40 2.85 3.59 4.02 4.60 4.05 3.98 4.26 3.20 2.76 2.23 2.12 3.34
(Source) EC data and the NEDO national insolation data book
(Source) Prepared from Table 5.1.2
Figure 5.1.2 Trend of monthly irradiation

5-3
(3) Influence of climatic phenomena (harmattan)
As described above, irradiation is higher in the dry season and lower in the rainy season. This section
takes up the influence of harmattans, a meteorological phenomenon distinctive to Ghana (and
neighboring countries), on PV power generation. Harmattans arise in the dry season, when fine sand
from the Sahara is carried up by the seasonal winds and transported down to the vicinity of the equator.
They cloud the air for days, and occur mainly from November to February. They resemble the fallout of
yellowish dust from China in Japan.
Table 5.1.3 and Figure 5.1.3 show the levels of irradiation based on ground observation and satellite
data. The two sets of data exhibit basically the same trends. However, although the levels are about the
same from April to October, that based on satellite data is about 10% higher from November to March.
This is thought to be because of the diffusion and absorption of sunlight in the atmosphere due to
harmattans, resulting in a decline in the amount that reaches the surface of the ground. The amount of
insolation peaks in February according to the satellite data and from March to May according to the
ground observation data. This difference reflects the influence of harmattans. Even during the
harmattan season, however, there is a sufficient amount of insolation, and it appears that PV generation
would not be significantly affected by the decrease.
The influence of harmattans on PV generation would derive less from the decrease in insolation and
more from the fine sand brought by them. The fallout of this sand on solar panels would reduce the
generation efficiency. Harmattans arise in the dry season, and there is no rain to wash away the fallout
on panels, which brings down the efficiency. Cleaning the panels is consequently an important task.
Table 5.1.3 Comparison of irradiation measurements by ground observation and satellite
(kWh/m2・day)
Jan Feb Mar Apr May Jun Jul Aug Sep Oct Nov Dec Average
GHANA (ground data)
4.97 5.36 5.48 5.65 5.46 4.83 4.56 4.38 4.73 5.36 5.41 4.98 5.10
Northern Part (ground data)
5.31 5.59 5.70 5.87 5.86 5.47 5.02 4.80 5.05 5.59 5.63 5.17 5.42
GHANA (satellite data)
5.56 6.09 5.86 5.62 5.36 4.87 4.66 4.51 4.73 5.42 5.65 5.41 5.31
Northern Part (satellite data)
5.56 6.32 6.26 6.15 6.00 5.51 5.10 4.78 5.23 5.91 5.77 5.41 5.67
(Source) EC data
(Source) Prepared from Table 5.1.3
Figure 5.1.3 Trend of irradiation based on ground observation and satellite data

5-4
5.1.2 Mini hydropower potential
(1) Large-scale hydropower potential
Ghana has usable hydropower resources of about 2,400MW. About half of this potential has been
developed by stations at Akosombo (912MW) and Kpong (160MW) downstream of it in the
southeastern part of the country. The rivers possible hydropower development are the Volta (whose
catchment area accounts for almost two-thirds of the national land area of about 240,000km2), Pra, Tano,
and Ancobra. The undeveloped hydropower output is estimated at 1,240MW for a yearly generated
output of 4,500GWh. Table 5.1.4 shows the plans for development on each water system.
Table 5.1.4 Hydropower sites on each water system
River Basin Catchment Area
(km2)
Potential
(MW)
Annual Generation
(GWh)
Black Volta 148,820
- Kouibi 68 392
- Ntereso 64 257
- Lanka 95 319
- Bui 400 1,000
- Jambito 55 180
Total 682 2,148
White Volta 105,540
- Pwalugu 50 184
- Kulpawn 40 166
- Daboya 43 194
Total 133 544
Oti 71,940
- Juabo 90 405
Tano River 14,700
- Asuaso 25 129
- Sdukrom 17 67
- Jomuro 20 85
- Tasnoso 56 259
Total 118 540
River Basin Catchment Area
(km2)
Potential
(MW)
Annual Generation
(GWh)
Pra River 22,290
- Awisam 50 205
- Heman 90 336
- Abaumesu 50 233
- Kojokrom 30 136
Total 220 910
Grand total 1,243 4,547
(Source) MOE, Hydropower Development in Ghana, Summery Description of Potential Sites, January 2004
Of these sites, those at Bui (400MW) and on the Pra and Tano rivers are under the direct jurisdiction
of the MOE. The VRA handles mainly the stations on the Volta river system. In 1993, it implemented
preliminary feasibilty studies at the three sites of Juale, Pwalugu and Kulpawn. The plan for a station at
Bui is faced with problems because of the presence of a protected zone (national park) and necessity of
relocating residents, and those for other sites are confronting funding difficulties. As such, the
development is not moving ahead.

5-5
(2) Mini hydropower potential
The Ghana government is promoting the development of mini-hydropower projects to encourage the
utilization of renewable energy. Since 1999, the Energy Foundation has been reviewing the existing
reports and surveying promising sites for mini-hydropower in the southern part of the country5. The
Ghanaian government is promoting mini hydropower development as part of its policy for use of
renewable energy, and regards such development as possible at 21 sites. All of these sites, however, are
located in the southern part of the country; no potential sites have been confirmed in the northern regions
that are the subject of this study6. Table 5.1.5 shows the potential sites for mini hydropower stations, and
Figure 5.1.4, their location.
Table 5.1.5 Potential mini hydropower sites
No. Name Firm capacity
(kW) No. Name
Firm capacity
(kW)
1 Wli Falls 325 12 Woranae Falls A 12
2 Nuboi D/S of Wli
Falls 45 13 Woranae Falls B 20
3 Tsatsadu Falls I 100 14 Randall Falls 4
4 Tsatsadu Falls II 75 15 Fuller Falls 7
5 Tsatsadu Falls III 170 16 Kokuma Falls 60
6 Mensu 65 17 Nkoranza 35
7 Ahamansu 125 18 Maabang 15
8 Dodi Papase I 210 19 Buofuom Falls 10
9 Dodi Papase
II/Abuoe 100 20 Wurudu Falls A 30
10 Dodi Papase lia 210 21 Wurudu Falls B 45
11 Sanwu Falls 20
(Source) MOE, Hydropower Development in Ghana, Summery Description of Potential Sites, January 2004
5 Mini Hydro Power in Ghana Prospect and Challenges, October 2002, Energy Foundation, 6 According to the MOE, which is in charge of mini hydropower development, and information from the NGO Energy
Foundation, which is conducting the field study

5-6
(Source) Prepared by JICA Study Team
Figure 5.1.4 Map of potential mini hydropower sites
(3) Mini hydropower potential in the three northern regions
1) Consideration from the meteorological and geographical aspects
As noted above, there are no confirmed potential mini hydropower sites in the three northern regions.
The terrain is flat and virtually devoid of areas with the head needed for hydropower development. In
addition, in the dry season (from December to March), almost no rain falls and rivers dry up, thereby
ruling out generation throughout the year7. Figure 5.1.5 shows the average rainfall over the last three
years at Bolgatanga in the Upper East Region and Tamale in the Northern Region.
Average raingfall 2002-2004
0.0
50.0
100.0
150.0
200.0
250.0
300.0
Jan. Feb. Mar. Apr. May Jun. Jul. Aug. Sep. Oct. Nov. Dec. (Month)
(mm)
Bolgatanga
Tamale
Accra
(Source) Meteorological Department
Figure 5.1.5 Average monthly rainfall over the last three years (2002 - 2004) in the northern regions
7 Even at Nakpanduri, a site thought to have a sufficient head on the border between the Upper East and Northern regions, the
river was completely dried up at the time of the study in May 2005.

5-7
2) Irrigation dam utilization possibilities
A study was made of the irrigation dams that could possibly have a flow throughout the year in the
northern regions of Ghana. The dams studied were the Botanga Dam in the Northern Region and the
Tono Dam in the Upper East Region (see Table 5.1.6). Both dams supply water to irrigation projects
downstream by gravity flow, mainly in the dry season.
Table 5.1.6 Irrigation dam specifications
Dam Botanga Tono
Location Northern Region Upper East Region
Year of completion 1980 1985
Catchment area(km2) 168 650
Inundation area(km2) 7.7 18.6
Total capacity(×106m3) 25.0 93.0
Effective capacity ( ×
106m3)
20.0 83.0
Dam height(m) 12 9
(Source) Botanga:Ministry of Agriculture,Tono:ICOUR(Irrigation Company of Upper Region)
Because the area is flat and would make it difficult to use the discharge head, the study considered the
prospects for power generation using the dam head. It found that the dam could not be expected to have
much potential. Even at the maximum, the output in the dry season would come to only about 26.5kW.
* Outline study of possible generation output at the Tono Dam 8
- The requisite monthly flow in the dry season at the Tono Dam would be 2.4×10⁶m3 = 0.9m3/s
- The half-day (12-hour) discharge would be 1.8m3/s.
- The possible output would be Q (kw) = 2 (dry season head, m) x 1.8 (amount of water used, m3/s) x
9.8 (gravity acceleration) x 0.75 (turbine and generator efficiency) = 26.5kW
In addition, as both dams have almost no surplus water in the dry season, it would, in effect, be
impossible to increase the amount of water use for power generation9. An increase in the dam height
would present a problem as regards the burden of construction costs. It would also increase the dam
water area and create apprehensions about impact on the residents and environment in the surrounding
area. As such, the situation would be difficult to resolve in the near future.
The three northern regions are consequently thought to have no mini hydropower potential that could
be developed at an early date.
8 Based on ICOUR(Irrigation Company of Upper Region)annual operation statistic 9 Downstream of the Botanga Dam, for example, residents cultivate rice, and water for farming is circulated in accordance with agreements among the users in the dry season, when water is in short supply.

5-8
5.1.3 Wind power and biomass potential
(1) Wind power potential
1) Average wind velocity
Figure 5.1.6 presents a map of wind velocities 70m above ground, based on satellite data. In most
parts of Ghana, the wind velocity is less than 5m/s. Areas with comparatively good wind circumstances
are confined to the southeastern coast, the Volta basin, the highlands stretching from the southeastern
coast to the midwestern area, and the mountainous area near the northern border. Table 5.1.7 shows the
average monthly wind velocitties 12m above the ground. The ground observation data exhibit the same
trend as the satellite data. In Ada, which has the best wind, the average velocity is 5.1m/s. In the
Northern Region, it is 3.9m/s in Tamale and 3.0m/s in the other points. The generation potential is
therefore not thought to be high.
Table 5.1.7 Monthly average wind velocity (at a height of 12 m)
(m/s)
Station Jan Feb Mar Apr May Jun Jul Aug Sep Oct Nov Dec Average
Abetifi 3.9 4.4 4.7 4.5 4.2 4.4 4.7 4.6 4.2 4.0 4.0 3.7 4.3
Accra 3.3 3.8 4.0 4.0 3.5 3.7 4.6 4.9 5.0 4.2 3.4 3.1 4.0
Ada 4.6 5.5 5.6 5.2 4.7 4.7 4.9 4.9 5.7 5.7 5.2 4.7 5.1
Akatsi 2.6 2.9 2.9 2.8 2.5 2.5 3.3 3.5 3.3 2.6 2.2 2.6 2.8
Akim Oda 2.3 2.5 3.0 3.1 2.4 2.4 3.0 2.8 2.8 2.5 3.3 2.7 2.7
Akuse 3.5 4.1 4.4 4.4 3.7 3.5 4.1 4.3 4.0 3.4 3.0 3.2 3.8
Axim 2.9 3.4 3.6 3.4 3.2 3.5 3.5 3.4 3.5 3.6 3.3 3.1 3.4
Bekwai 2.0 2.2 2.3 2.2 2.1 2.0 2.1 2.2 2.2 2.1 2.1 2.0 2.1
Bole 3.3 3.5 3.7 3.6 3.2 2.9 3.0 2.6 2.1 2.3 2.6 3.1 3.0
Ho 2.5 2.7 2.8 2.7 2.5 2.5 2.5 2.5 2.5 2.4 2.4 2.4 2.5
Koforidua 2.3 2.4 2.5 2.4 2.4 2.4 2.5 2.6 2.5 2.4 2.3 2.2 2.4
Krachi 2.8 3.4 3.7 3.6 3.2 2.8 2.8 2.6 2.5 3.0 2.6 2.5 2.9
Kumasi 3.2 3.8 4.2 4.0 3.7 3.7 4.4 4.3 4.1 3.6 3.4 3.2 3.8
Navorongo 3.6 3.7 3.1 3.2 3.2 2.9 2.8 2.8 2.6 2.7 2.8 3.3 3.0
Saltpond 3.6 4.3 4.2 3.9 3.7 3.7 3.9 4.2 4.5 4.2 3.8 3.5 4.0
Sunyani 3.5 3.9 4.4 4.2 3.8 3.9 4.1 4.1 3.7 3.5 3.4 3.4 3.8
Takoradi 3.5 3.9 4.4 4.4 3.9 4.1 4.2 4.6 4.9 4.4 4.0 3.3 4.1
Tamale 4.1 4.6 4.7 4.9 4.3 3.9 4.0 3.6 3.0 3.1 3.3 3.8 3.9
Tema 4.3 4.7 4.8 4.5 4.2 4.4 5.0 4.9 5.1 5.0 4.6 4.2 4.6
Wa 3.9 4.1 3.8 4.0 3.7 3.5 3.3 2.7 2.3 2.8 2.9 3.2 3.3
Wenchi 3.4 3.7 4.1 3.9 3.7 3.7 3.7 3.7 3.5 3.1 3.1 3.1 3.6
Yendi 2.9 3.2 3.0 3.2 3.0 2.8 2.8 2.7 2.4 2.4 2.3 2.7 2.8
(Source) EC Data

5-9
(Source) EC Annual Report
Figure 5.1.6 Map of wind velocity (70 m above ground) based on satellite data
2) Estimate of generated output
The Study Team estimated the output in the event of installation of wind power generation systems in
Ada, which has the best wind in Ghana, and Tamale, which has the best in the three northern regions.
(a) Windmill specifications
It was assumed that the systems would use windmills in the class of 2,000kW, the mainsteam type in
recent years. Table 5.1.8 shows the windmill specifications, and Figure 5.1.7, the windmill power curve.
Table 5.1.8 Example of windmill specifications
Type Upwind
Rotor diameter 70m
Hub height 65m
Number of blades 3
Cut-in wind velocity 2m/s
Cut-out wind velocity 25m/s
(Source) Enelcon

5-10
(Souce) Enelcon
Figure 5.1.7 Example of a 2,000kW windmill power curve
(b) Calculation of generated output
Calculation of the windmill generated output requires a conversion of the wind velocity at the
observation height to that at the rotor height. The observation height is 12m, and the average velocity at
a rotor height of 65m was estimated at 6.5m/s in Ada and 5.5m/s in Tamale. Table 5.1.9 shows the wind
velocity appearance rates calculated from the converted average velocity and annual generated output.
Table 5.1.9 Wind velocity appearance rates and annual generated output
Wind velocity Appearance rate Annual generated output
(kWh)
(m/s) Ada Tamale Ada Tamale
0 0.0% 0.0% 0 0
1 3.7% 5.1% 0 0
2 6.9% 9.5% 0 0
3 9.4% 12.4% 6,208 8,171
4 11.1% 13.8% 46,499 58,015
5 11.7% 13.6% 106,490 124,038
6 11.4% 12.2% 200,201 214,404
7 10.5% 10.1% 311,643 302,211
8 9.0% 7.8% 407,930 352,772
9 7.4% 5.6% 485,574 368,795
10 5.8% 3.8% 518,887 340,872
11 4.3% 2.4% 507,555 284,026
12 3.1% 1.4% 446,853 209,779
13 2.1% 0.8% 320,187 124,192
14 or more 3.7% 1.3% 580,344 206,060
Total 100.0% 100.0% 3,938,372 2,593,335
* The empirical rule V = V0 x (H/H0) 1/n was used for the wind velocity altitude distribution. The n value ranges
from 2 to 10 based on terrain. It was 7 in Ada, a coastal area, and 4 in Tamale, a rural area.
** The appearance rates were calculated on the basis of a Reyleight distribution.
(Souce) JICA Study Team

5-11
The calculation yielded a wind power generation output of 3,938MWh for Ada and 2,593MWh for
Tamale. Because it assumed use of a windmill with a rated output of 1,800kW, the capacity factor would
be 25% at Ada and 16.5% at Tamale.
These results indicate that, even in the coastal area, which has the best wind conditions in Ghana,
wind power generation would have a low capacity factor and not be very viable. Nevertheless, the
output figures were estimated from the average wind velocity, and the question requires a more in-depth
study of the wind situation.
(2) Biomass potential
1) Biomass utilization technology
In terms of energy conversion technology, the methods of using biomass resources can be broadly
divided into the classes of direct combustion, thermochemical conversion, and biochemical conversion.
Figure 5.1.8 shows the system of technology for biomass energy conversion.
(Source) NEDO guidebook for biomass energy utilization
Figure 5.1.8 System of biomass energy conversion technology
Combustion Direct combustion
Mixed combustion
Solid fuel
Thermochemical conversion Gasification
Ethanol fermentation
Liquefaction
Carbonation
Esterization
Biochemical conversion Methane
Two-stage fermentation
Fusion gasification
Partial oxidation gasification
Low-temperature fluid bed gasification
Supercritical water gasification
Rapid pyrolysis
Slurry fuel
Wet methane fermentation
Dry methane fermentation
Wooden scrap, unused wood, livestock manure
Wooden scrap, unused wood
Wooden scrap, unused wood, kitchen waste
Wooden scrap, unusedwood
Wooden scrap, unusedwood
Wooden scrap, unusedwood
Livestock manure, foodwaste, sewage sludge
Wooden scrap, unusedwood
Wooden scrap, unusedwood
Wooden scrap, unused wood
Waste food oil
Livestock manure, foodwaste, sewage sludge
Livestock manure, foodwaste, sewage sludge
Kitchen waste
(Sugar/starch: corn, sugar beet (in practical utilization)
Cellulose: wooden scrap, unused wood (in the proving stage)
*Dotted lines indicate technology at the stage of R&D or proving.

5-12
2) Actual biomass power generation in Ghana
In Ghana, the MME executed a biomass generation research and demonstration project in Appolonia,
in the district of Tema. It fermented livestock manure and human excreta, and used the resulting
methane as fuel for cooking and power generation. Figure 5.1.9 shows a distribution diagram for energy
use in this project.
(Source) MME, BIOGAS ELECTRIFICATION FOR RURAL APPLICATION:THE APPOLONIA EXPERIENCE
Figure 5.1.9 Energy use distribution diagram
In this system, facilities are connected to two generators in a local grid with an extended length of
about 1km. The facilities consist of 21 households, two churches, one mosque, one video center, two
bars, one school, and 20 street lights. The generation cost was calculated to be 0.34 dollars/kWh with
biomass generation, 0.25 dollars/kWh with diesel generation, and 0.48 dollars/kWh with PV generation.
The main problems encountered in the project were an imbalance between supply and demand, and
the high cost of transporting the base material. After the end of the project, a transition was made to a
biogas-based toilet system with the generator removed.
The project proved that biogas power generation would be effective and workable technology in
Ghana. The spread of biogas power generation requires the development of ways to collect material
efficiently.
3) Other biomass potential
In Ghana, there is a lot of agricultural and wooden waste that could serve as raw material for biomass
power generation, and this points to a high potential for generation by pyrolysis (thermal
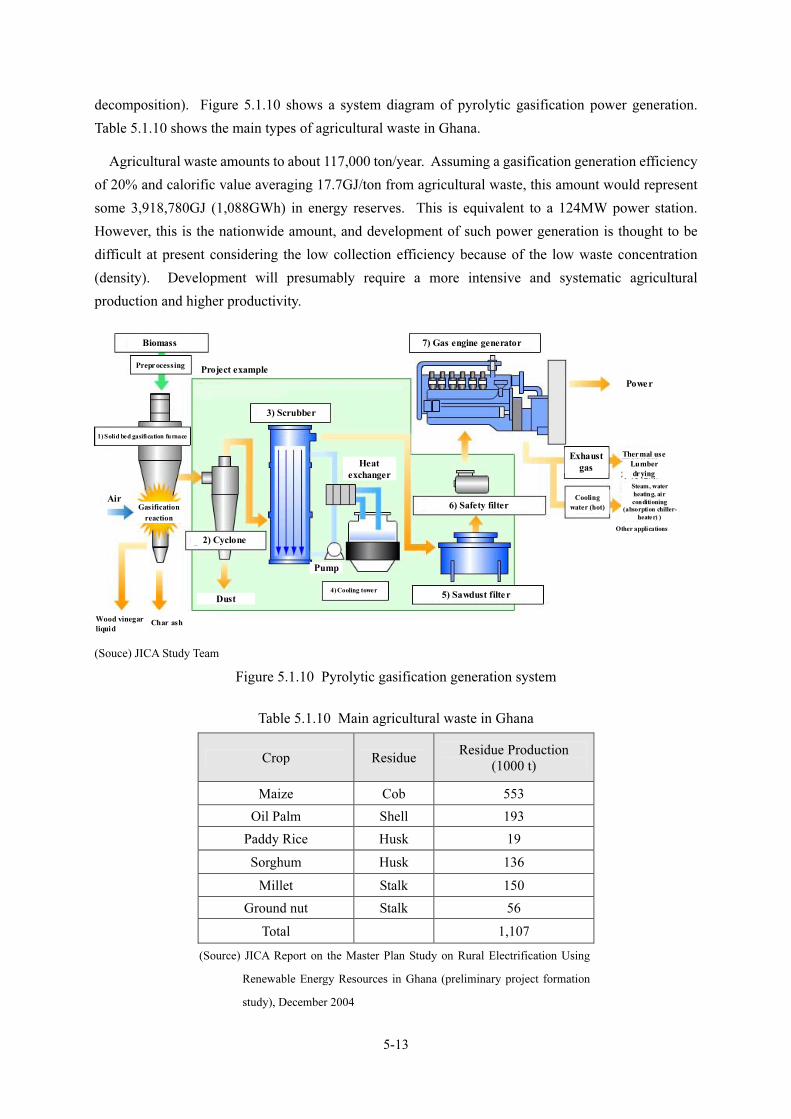
5-13
decomposition). Figure 5.1.10 shows a system diagram of pyrolytic gasification power generation.
Table 5.1.10 shows the main types of agricultural waste in Ghana.
Agricultural waste amounts to about 117,000 ton/year. Assuming a gasification generation efficiency
of 20% and calorific value averaging 17.7GJ/ton from agricultural waste, this amount would represent
some 3,918,780GJ (1,088GWh) in energy reserves. This is equivalent to a 124MW power station.
However, this is the nationwide amount, and development of such power generation is thought to be
difficult at present considering the low collection efficiency because of the low waste concentration
(density). Development will presumably require a more intensive and systematic agricultural
production and higher productivity.
(Souce) JICA Study Team
Figure 5.1.10 Pyrolytic gasification generation system
Table 5.1.10 Main agricultural waste in Ghana
Crop Residue Residue Production
(1000 t)
Maize Cob 553
Oil Palm Shell 193
Paddy Rice Husk 19
Sorghum Husk 136
Millet Stalk 150
Ground nut Stalk 56
Total 1,107
(Source) JICA Report on the Master Plan Study on Rural Electrification Using
Renewable Energy Resources in Ghana (preliminary project formation
study), December 2004
BiomassBiomass
Project example
AirGasification
reaction
Wood vinegar
liquid
2) Cyclone
Dust
3) Scrubber
Pump
Heat
exchanger
5) Sawdust filter
6) Safety filter
7) Gas engine generator
Thermal use
Lumber
drying
Steam, water
heating, air
conditioning (absorption chiller-
heater) )
Other applications
Preprocessing
1) Solid bed gasification furnace
Char ash
4) Cooling tower
Power
Exhaust
gas
Cooling
water (hot)

5-14
5.2 Clarification of PV RE needs and roles
5.2.1 Confirmation of the role played by RE in poverty reduction
The GPRS deems RE necessary as a component of the social infrastructure supporting public services
for assurance of health/medical care, education, and supply of water for drinking and irrigation, as well
as of the economic infrastructure for stimulation of local economic activity. RE plans must be drafted
only after getting a firm grasp of how power will be utilized in response to these socioeconomic needs.
5.2.2 Concerns about differences of quality and capacity between on-grid electrification and
off-grid PV electrification
This study is premised on the preparation
of plans for off-grid PV RE in communities
in northern Ghana that would be hard to
electrify by on-grid electrification under the
SHEP. Care is required due to the difference
between PV and grid power in respect of
quality and capacity (see Table 5.2.1).
Users and dealers must acquire a deeper
understanding of these differences and
devise methods for use of the limited power
supply as fairly as possible.
In reality, according to the NED, which
provides distribution services in the northern regions, there are the following apprehensions about the
commencement of off-grid PV electrification services.
� Conformance with tariffs for grid service (income aspect)
� Difference between off-grid PV and on-grid power in respect of quality and quantity
� User concerns about the lack of grid power supply if PV systems are installed
5.2.3 Identification and analysis of needs for PV electrification in the northern regions
Interviews were conducted with community residents, public facilities, commercial facilities, and
other parties to ascertain problems encountered in daily life and work, and the attendant electrification
needs. These may be summarized as follows.
Table 5.2.1 Difference of quality between grid electrification and PV electrification
Grid power PV (SHS) power
Power capacity
High Low (usually no
higher than 100W)
Scope of use
Capable of use for large-capacity products such as cookers, refrigerators, and motors
Small-capacity products such as lights, radios, and B/W TV sets
Use duration per day
24 hours A few hours
O&M Performed by the utility
Need for a separate entity
(Source) JICA Study Team

5-15
� Among public facilities, there are strong needs for lighting, vaccine refrigerators, and
communications facilities in clinics for better primary care. Schools expressed desires for
lighting for more night classes.
� Electricity is wanted by commercial facilities for lights and audio facilities that would be
linked directly to increased income. There are also needs for power for grain mills, but PV
systems cannot address them.
� Households have needs for lights to enable study and communication at night, and for
entertainment devices such as radios and TV sets.
� Ideas for ways of utilizing PV power to produce additional income include mobile telephone
stations and driers for agricultural crops, but they have not yet been put into practice.
Table 5.2.2 presents a more detailed summary of problems, electrification needs, and tasks for
fulfilling them.
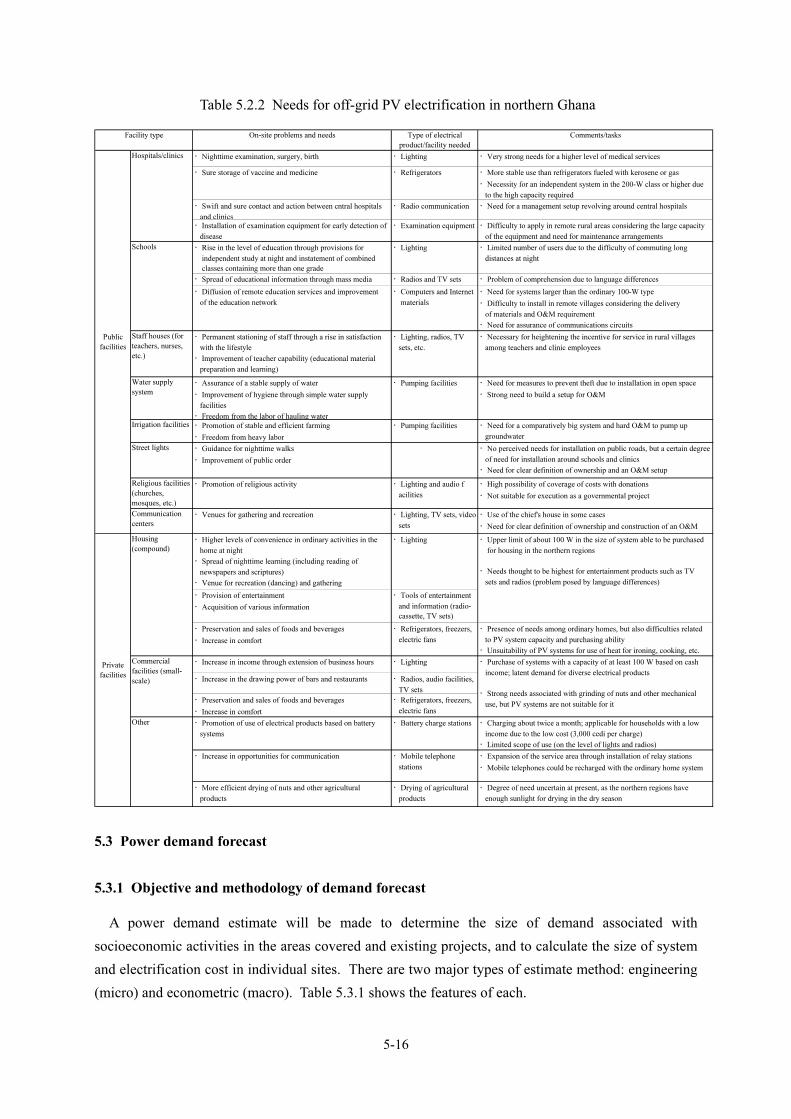
5-16
Table 5.2.2 Needs for off-grid PV electrification in northern Ghana
On-site problems and needs Type of electrical
product/facility needed
Comments/tasks
・Nighttime examination, surgery, birth ・Lighting ・Very strong needs for a higher level of medical services
・Sure storage of vaccine and medicine ・Refrigerators ・More stable use than refrigerators fueled with kerosene or gas
・Necessity for an independent system in the 200-W class or higher due
to the high capacity required
・Swift and sure contact and action between cntral hospitals
and clinics
・Radio communication ・Need for a management setup revolving around central hospitals
・Installation of examination equipment for early detection of
disease
・Examination equipment ・Difficulty to apply in remote rural areas considering the large capacity
of the equipment and need for maintenance arrangements
・Rise in the level of education through provisions for
independent study at night and instatement of combined
classes containing more than one grade
・Lighting ・Limited number of users due to the difficulty of commuting long
distances at night
・Spread of educational information through mass media ・Radios and TV sets ・Problem of comprehension due to language differences
・Diffusion of remote education services and improvement
of the education network
・Computers and Internet
materials
・Need for systems larger than the ordinary 100-W type
・Difficulty to install in remote villages considering the delivery
of materials and O&M requirement
・Need for assurance of communications circuits
Staff houses (for
teachers, nurses,
etc.)
・Permanent stationing of staff through a rise in satisfaction
with the lifestyle
・Improvement of teacher capability (educational material
preparation and learning)
・Lighting, radios, TV
sets, etc.
・Necessary for heightening the incentive for service in rural villages
among teachers and clinic employees
Water supply
system・Assurance of a stable supply of water
・Improvement of hygiene through simple water supply
facilities
・Freedom from the labor of hauling water
・Pumping facilities ・Need for measures to prevent theft due to installation in open space
・Strong need to build a setup for O&M
Irrigation facilities ・Promotion of stable and efficient farming
・Freedom from heavy labor
・Pumping facilities ・Need for a comparatively big system and hard O&M to pump up
groundwater
Street lights ・Guidance for nighttime walks
・Improvement of public order
・No perceived needs for installation on public roads, but a certain degree
of need for installation around schools and clinics
・Need for clear definition of ownership and an O&M setup
Religious facilities
(churches,
mosques, etc.)
・Promotion of religious activity ・Lighting and audio f
acilities
・High possibility of coverage of costs with donations
・Not suitable for execution as a governmental project
Communication
centers・Venues for gathering and recreation ・Lighting, TV sets, video
sets
・Use of the chief's house in some cases
・Need for clear definition of ownership and construction of an O&M
・Higher levels of convenience in ordinary activities in the
home at night
・Spread of nighttime learning (including reading of
newspapers and scriptures)
・Venue for recreation (dancing) and gathering
・Lighting
・Provision of entertainment
・Acquisition of various information
・Tools of entertainment
and information (radio-
cassette, TV sets)
・Preservation and sales of foods and beverages
・Increase in comfort
・Refrigerators, freezers,
electric fans
・Presence of needs among ordinary homes, but also difficulties related
to PV system capacity and purchasing ability
・Unsuitability of PV systems for use of heat for ironing, cooking, etc.
・Increase in income through extension of business hours ・Lighting
・Increase in the drawing power of bars and restaurants ・Radios, audio facilities,
TV sets
・Preservation and sales of foods and beverages
・Increase in comfort
・Refrigerators, freezers,
electric fans
・Promotion of use of electrical products based on battery
systems
・Battery charge stations ・Charging about twice a month; applicable for households with a low
income due to the low cost (3,000 cedi per charge)
・Limited scope of use (on the level of lights and radios)
・Increase in opportunities for communication ・Mobile telephone
stations
・Expansion of the service area through installation of relay stations
・Mobile telephones could be recharged with the ordinary home system
・More efficient drying of nuts and other agricultural
products
・Drying of agricultural
products
・Degree of need uncertain at present, as the northern regions have
enough sunlight for drying in the dry season
Facility type
Schools
Public
facilities
Hospitals/clinics
・Purchase of systems with a capacity of at least 100 W based on cash
income; latent demand for diverse electrical products
・Strong needs associated with grinding of nuts and other mechanical
use, but PV systems are not suitable for it
・Upper limit of about 100 W in the size of system able to be purchased
for housing in the northern regions
・Needs thought to be highest for entertainment products such as TV
sets and radios (problem posed by language differences)
Other
Private
facilities
Commercial
facilities (small-
scale)
Housing
(compound)
5.3 Power demand forecast
5.3.1 Objective and methodology of demand forecast
A power demand estimate will be made to determine the size of demand associated with
socioeconomic activities in the areas covered and existing projects, and to calculate the size of system
and electrification cost in individual sites. There are two major types of estimate method: engineering
(micro) and econometric (macro). Table 5.3.1 shows the features of each.
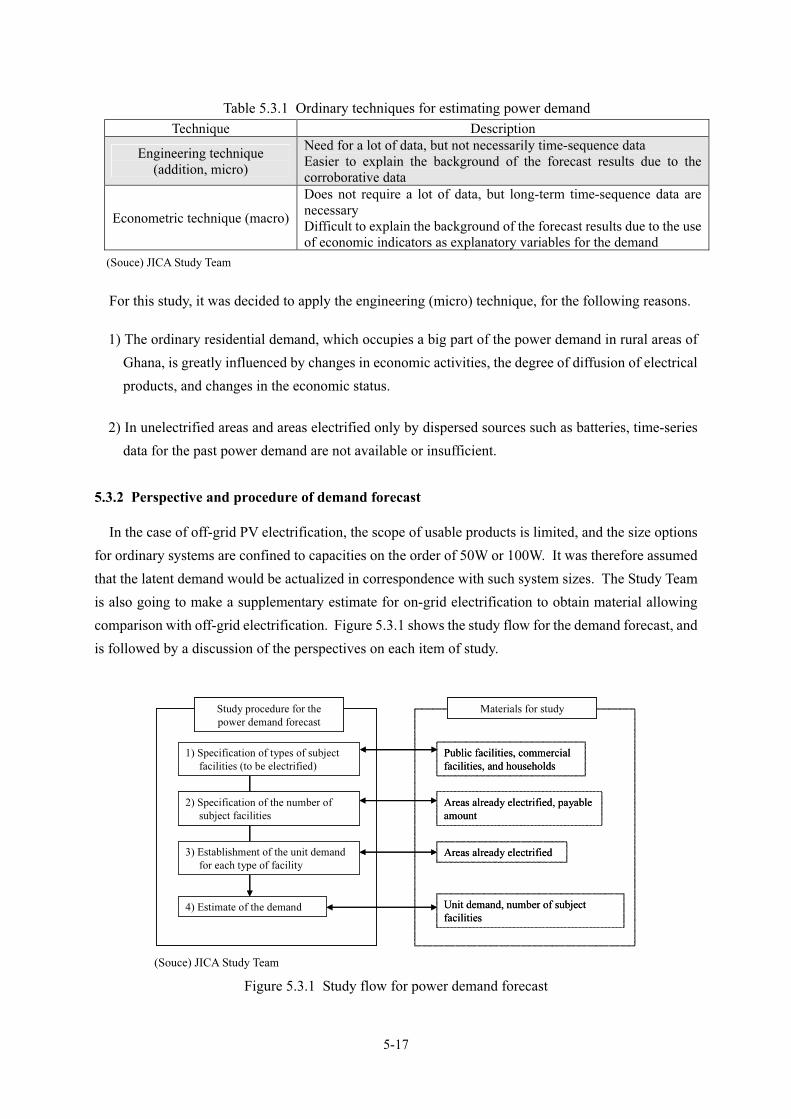
5-17
Table 5.3.1 Ordinary techniques for estimating power demand
Technique Description
Engineering technique (addition, micro)
Need for a lot of data, but not necessarily time-sequence data
Easier to explain the background of the forecast results due to the corroborative data
Econometric technique (macro)
Does not require a lot of data, but long-term time-sequence data are necessary
Difficult to explain the background of the forecast results due to the use of economic indicators as explanatory variables for the demand
(Souce) JICA Study Team
For this study, it was decided to apply the engineering (micro) technique, for the following reasons.
1) The ordinary residential demand, which occupies a big part of the power demand in rural areas of
Ghana, is greatly influenced by changes in economic activities, the degree of diffusion of electrical
products, and changes in the economic status.
2) In unelectrified areas and areas electrified only by dispersed sources such as batteries, time-series
data for the past power demand are not available or insufficient.
5.3.2 Perspective and procedure of demand forecast
In the case of off-grid PV electrification, the scope of usable products is limited, and the size options
for ordinary systems are confined to capacities on the order of 50W or 100W. It was therefore assumed
that the latent demand would be actualized in correspondence with such system sizes. The Study Team
is also going to make a supplementary estimate for on-grid electrification to obtain material allowing
comparison with off-grid electrification. Figure 5.3.1 shows the study flow for the demand forecast, and
is followed by a discussion of the perspectives on each item of study.
1) Specification of types of subject
facilities (to be electrified)
2) Specification of the number of
subject facilities
3) Establishment of the unit demand
for each type of facility
4) Estimate of the demand
Public facilities, commercial
facilities, and households
Areas already electrified, payable
amount
Areas already electrified
Unit demand, number of subject
facilities
Study procedure for the
power demand forecast
Materials for study
(Souce) JICA Study Team
Figure 5.3.1 Study flow for power demand forecast

5-18
(1) Specification of subject facilities and estimate of the number
It is the goal of the Ghanaian government to make electricity accessible nationwide; it has not set a
specific target for the household electrification rate. For the number of houses and commercial facilities
to be electrified by off-grid PV systems, the Study Team set an electrification rate with consideration of
the following items, based on the findings of the village socioeconomic survey.
� Points already electrified by PV systems
� Points electrified by extension of the grid 10
� Amount of money residents can pay
In the case of public facilities, the number of subject facilities were determined with reference to the
size, necessity of electrification, and other factors for schools, health care facilities, water supply
facilities, and other types.
(2) Establishment of the unit demand for each type of facility
The Study Team used the figures shown in Table 5.3.2 for the capacity of electrical products that form
the basis of the unit demand for each type of facility. These figures are based on the data obtained from
the survey of electrification products and the village socioeconomic survey in the second field study.
Generally speaking, products with a large capacity are not amenable to PV power, and are shown in the
separate table for on-grid electrification.
Table 5.3.2 Unit demand associated with electrical products
PV electrification products On-grid electrification products
Electrical product Capacity(W) Electrical products Capacity(W)
Fluorescent bulb (small) 8 Color TV set (14-inch) 53
Fluorescent bulb (large) 18 Color TV set (20-inch) 77
B/W TV set 30 Stereo set 150
Radio-cassette player 15 Medium-sized refrigerator 140
Electric Fan 55 Incanjdescent bulb 40
Vaccine refrigerator 54 Fluorescent bulb (4 feets) 36
Radio communication 5.4 Fluorescent bulb (2 feets) 18
Ceiling fan (small) 65
Air conditioner 2,000
Electric Iron 750
Washing machine 350
Drier 1,300
Rice cooker 700
Electric stove (for cooking) 1,500 (Source) JICA Study Team estimates Sewing machine 100
Concerning the unit demand (maximum power) in each house, it can be noted that, in the case of PV
electrification, the system size is determined to a certain degree by the capacity of the panels. The Study
Team posited prime units for the system sizes generally installed in houses (50W and 100W) based on
analysis of existing PV projects.
10 According to New Energy, which implemented the village socioeconomic survey in electrified areas of the northern regions,
the household electrification rate in the pertinent communities is about 30 %.

5-19
5.3.3 Electricity demand forecast (off-grid electrification)
(1) PV electrification demand among unelectrified households
As was noted in the section on the results of the village socioeconomic study, households electrified
with PV systems still use kerosene and batteries as sources of energy, and the PV systems account for
only about one fourth of their entire energy expenditures. Assuming that PV systems would occupy the
same share of energy spending among currently unelectrified households, the monthly expenditure on
them would come to about 14,000 cedi (1.5dollars) per month on the average.
As for the question of the amount unelectrified households would be willing to pay, the village
socioeconomic study found that many residents would not be willing to pay a larger sum for energy even
if electricity became available, and the average amount of tolerable increase is lower than that of desired
decrease. In addition, many users of SHS and BCS do not want to pay any more than at present. For
these reasons, not much can be expected as regards expenditures even if PV systems are installed among
unelectrified households.
Virtually no households would be able to make cash payments for the initial cost of about 650 dollars
(6 million cedi) for a 50W SHS. The study on household electrification consequently focused on BCS.
Assuming that batteries are charged at the rate of once a week for a fee of 3,000 cedi (0.3 dollars), the
cost could be met by the aforementioned sum of 14,000 (1.5 dollars) cedi per month. This is about the
same as that of 15,500 (1.7 dollars) cedi per month spent by BCS households, and therefore indicates
that households could be electrified by BCS.
However, the distribution of unelectrified households shows that few of them have a lot of energy
expenditures. Only about 30% of the total number would be able to pay a sum of 14,000 (1.5dollars)
cedi per month (see Figure 5.3.2).
0
20,000
40,000
60,000
80,000
100,000
0 200 400 600 800
Number of household
(cedi/month)
(Source) Prepared by the JICA Study Team based on the results of the village socioeconomic study
Figure 5.3.2 Distribution of payable monthly sum among unelectrified households
14,000cedi
30% of unelectrified households can
pay more than 14,000cedi

5-20
As for initial cost, whereas total payments are held to 120,000 cedi (13.3 dollars) per month on the
average among unelectrified households, the corresponding figure for households electrified with PV
systems is more than twice as high at 291,000 cedi (32.3 dollars). While this is not as high as the cost of
a car battery (about 50 dollars or 450,000 cedi), there are thought to be some households capable of
purchase.
Judging from these points and the monthly sum capable of payment, it is estimated that about 30% of
the households in unelectrified communities could be electrified with BCS. It would be more realistic to
put the figure at about 20%, considering the ability to pay the initial cost for batteries.
(2) PV electrification demand among commercial facilities
Figure 5.3.3 compares the average energy cost per month among the types of commercial facilties
with a fairly large number of samples, i.e., stores (general goods/drug stores), bars (drinking bars/pito
brewing), and tailor shops (tailor/seamstress), and unelectrified households.
Comparsion for monthly energy cost
0
10,000
20,000
30,000
40,000
50,000
60,000
70,000
80,000
90,000
1 2 3 4
Cedis/month
Un-electrified
PV electrified
(Source) JICA Study Team
Figure 5.3.3 Average monthly energy cost among major commercial facilities
Among both commercial facilities that are unelectrified and those that are electrified with PV systems,
energy expenditures are lower than among households. This is mainly because of the small size (the
facilities are generally single-room buildings) and the relatively low level of power consumption as
occupants leave for their homes after closing. In the case of restaurants, another factor is that food is
prepared in the residence behind them. For this reason, it would not be appropriate to estimate
capability for purchase of PV systems on the basis of their current energy expenditures. It may also be
noted that a fairly large proportion of the stores with SHS receive RESPRO services, and their monthly
PV energy expenditures are therefore about 25,000 cedi (2.8 dollars). This figure, too, is consequently
not a good indication of payment capabilities.
Unelectrified stores and bars have monthly income in the range of about 1.0 - 1.2 million cedi (110 -
General goods/
drug store
Drinking bar/pito
brewing
Tailor/seamstress Households

5-21
130 dollars) from a daily cash income, and are thought to have a higher latent ability to purchase PV
systems than ordinary households. If they directed 10% of their income to energy expenditures and 25%
of their energy expenditures to PV electricity, stores could pay from 25,000 to 30,000 cedi (2.8 - 3.3
dollars) per month on PV systems. This is slightly higher than the corresponding figure for households.
The electrical products used by stores electrified with PV systems are basically on the level of lighting
and stereo (audio) sets, and the scope of system use is limited. (According to New Energy, which
conducted the village socioeconomic study, people generally use dry cell batteries for radios instead of
connecting them to the PV system because the requisite voltage varies (from 4.5 to 12.0 volts)
depending on the radio size.) Considering all of these factors, it is thought that, of the total number of
stores, about 25% could use BCS electricity, and 5%, SHS.
(3) PV electrification demand among public facilities
The electrification of public facilities must be promoted by the government as a means of mitigating
poverty through improvement of social services. However, the status of the national finances makes it
impossible to electrify all such facilities and compels selection of the minimum requisite ones to be
electrified.
Table 5.3.3 shows the electrification status of educational and medical (health) facilities. While some
of the unelectrified facilities could be electrified through SHEP, detailed data were not available on this
point, and it was therefore assumed that all of them were potential candidates for PV electrification.
Table 5.3.3 Electrification of educational and medical facilities in the three northern regions
(Source) JICA Study Team
• Medical facilities
According to the results of the village socioeconomic study, almost all medical facilities on the order
of hospitals or higher have been electrified. A total of 199 facilities (CHIPS compounds, clinics, and
health centers) have not been electrified. In interviews conducted as part of the second field study, the
MOH indicated that it was promoting the electrification of all of these unelectrified facilities. This study
therefore proposes all unelectrified medical facilities as subjects of electrification with PV systems.
EDUCATIONAL FACILITIES HEALTH FACILITIES
No. District Pre/
Prim.JSS SSS Voc
Trg
Col.Tertiary
Adult
Lit.CHPS Clinic
Health
Cen.Hosp.
Dist.
Hosp.
Reg.
Hosp.
Nut.
Cen.
Trg
Inst.
1 SUMMARY-NR 2013 354 37 3 3 2 3797 12 46 89 7 6 1 9 3
2 SUMMARY-UER 719 218 22 2 2 2 2015 17 48 26 0 2 1 3 4
3 SUMMARY-UWR 619 264 17 7 2 2 1858 30 5 50 5 3 1 ? 2
Total 3351 836 76 12 7 6 7670 59 99 165 12 11 3 12 9
Electrified grid 455 211 74 12 7 6 455 8 22 54 12 11 3 10 9
Electrified PV 2 144 1 1350 1 11 28
Unelectrified 2894 481 0 0 0 0 6320 50 66 83 0 0 0 2 0
% Unelectrified 86% 58% 0% 0% 0% 0% 82% 85% 67% 50% 0% 0% 0% 17% 0%
Electrification Status of Educational & Health Facilities in the Northern Part
SUMMARY-UER

5-22
• Educational facilities
In the category of educational facilities, the study found that electricity was not available to 481 junior
secondary schools and 2,894 primary schools (58 and 86% of the respective totals). It also found that
electrification by connection to the grid is not making much headway, that electrification of the 2,894
primary schools by such means would carry an enormous cost, and that the MOEdu is pushing
electrification for the diffusion of ICT on the district level. In light of these factors, the Study Team
proposes all junior secondary schools as subjects of electrification with PV systems.
• Staff houses
Along with the improvement of services through electrification of medical and educational facilities,
it is also important to electrify staff houses in order to encourage personnel to work in remote
communities. Seeing that these staff are transferred from urbanized districts, the Study Team proposes
the installation of one 100W SHS for each of three houses for staff of educational and medical facilities
(one house in the case of CHIPS compounds) and for one house for staff of police and equivalent
governmental facilities.
• Other public facilities
Other public facilities that are prospective subjects of PV electrification are police stations and street
lights whose purpose is to preserve law and order, and pumping facilities for wells and bore holes. The
Study Team decided to exclude street lights because of the relatively high cost of measures for
protection of the battery, for example, and the virtual impossibility of constructing an O&M setup
because the beneficiaries are not clearly defined. Similarly, it also essentially excluded pumping
facilities because of the need for design of systems for each separately and the few cases of actual
installation. Although their electrification requires the agreement of the MOE and other stakeholders,
police and other such governmental facilities are subjects of electrification given their official status.
(4) Proposal of a model for electrification with PV systems in unelectrified communities in the northern
regions
Figure 5.3.4 shows the electrification model taking account of the aforementioned electrification
subjects and proportions (the estimated rate of all potential subjects occupied by those that would
actually be electrified). Public facilities would be electrified mainly by SHS, and households and
commercial facilities, by BCS.

5-23
BCS
JSS
20% households: 25W BCS
Health facility
25% commercial: 50W BCS5% commercial: 50W SHS
(Police)
BCSBCS
JSS
20% households: 25W BCS
Health facilityHealth facility
25% commercial: 50W BCS5% commercial: 50W SHS
(Police)
(Source) JICA Study Team
Figure 5.3.4 Model for electrification with PV systems
(5) Demand forecast for PV electrification
The Study Team made the following assumptions about the size of PV systems for the various
subjects.
a) Households: 25W, envisioning use mainly for lighting
b) Commercial facilities: 50W, envisioning use mainly for lighting, but also for small fans and radio
cassettes
c) Public facilities: as follows, based on the MOE proposal
• Clinics and health centers: Buildings: 100W x 2 = 200W (including wireless equipment),
Refrigerators: 200W, Staff houses: 100W x 3
• CHIPS compounds: Buildings: 100W, Staff houses: 100W x 3
• Junior secondary schools: Buildings: 250W, Staff houses: 100W x 3
• Police facilities: Building: 100W, Staff houses: 100W x 11
Table 5.3.4 presents the forecast figures (estimates) for the PV system demand in unelectrified
communities covered by the reconsigned village study. Churches and mosques are included in the
category of commercial facilities.

5-24
Table 5.3.4 PV system demand in unelectrified communities
Community
name
District
NameRegion Name
Total
Population
Num. of
Compounds
Demand HH
(25W)
(W)
Total
business
entitiy
Demand
business ent.
(5%SHS,25%
BCS,50W)
Junior
secondary
school
Chips
compoundClinic
Health
center/health
post
Governmental
officeStaff house
Demand for
public
facilities
(W) *
Total demand
(W)
Bimbini West Mamprusi Northern 138 14 100 7 100 0 0 0 0 0 0 0 200
Lampur West/Central Gonja Northern 261 49 300 3 50 0 0 0 0 0 0 0 350
Langatire West/Central Gonja Northern 326 31 200 5 50 0 0 0 0 0 0 0 250
Kakale West/Central Gonja Northern 350 30 200 7 100 0 0 0 0 0 0 0 300
Bethlehem West/Central Gonja Northern 409 35 225 8 100 0 0 0 0 0 0 0 325
Kafulwurape West/Central Gonja Northern 465 83 525 4 50 0 0 0 0 0 0 0 575
Butei West/Central Gonja Northern 495 43 275 1 0 0 0 0 0 0 0 0 275
Kananto West/Central Gonja Northern 506 50 325 13 200 0 0 0 0 0 0 0 525
Kudani Saboba/Chereponi Northern 549 87 550 19 300 0 0 0 0 0 0 0 850
Kokope West/Central Gonja Northern 585 81 500 11 200 0 0 0 0 0 0 0 700
Yachadom Zabzugu/Tatale Northern 872 109 675 30 500 1 0 0 0 1 4 750 1,925
Kpani Saboba/Chereponi Northern 957 83 525 8 100 0 0 0 0 0 0 0 625
Sheini Zabzugu/Tatale Northern 980 130 825 28 400 1 0 0 0 0 3 550 1,775
Wenchiki Saboba/Chereponi Northern 1,131 168 1,050 17 250 1 0 0 1 1 7 1,450 2,750
Kandin Zabzugu/Tatale Northern 1,142 170 1,075 47 700 1 0 0 1 0 6 1,250 3,025
Kulkpaligu Zabzugu/Tatale Northern 1,250 173 1,075 23 350 1 0 0 1 0 6 1,250 2,675
Kpabuso West/Central Gonja Northern 1,443 378 2,375 34 550 1 0 0 0 1 4 750 3,675
Nahuyili Zabzugu/Tatale Northern 1,616 135 850 23 350 0 0 0 0 0 0 0 1,200
Wapuli Saboba/Chereponi Northern 1,695 291 1,825 40 600 1 0 0 1 0 6 1,250 3,675
Tamaligu Gushiegu/Karaga Northern 1,720 150 950 32 500 0 0 0 0 0 0 0 1,450
Sheri West/Central Gonja Northern 1,978 207 1,300 12 200 1 0 0 0 0 3 550 2,050
Busunu West/Central Gonja Northern 2,572 576 3,600 27 400 1 0 0 1 0 6 1,250 5,250
Mandari Bole Northern 2,790 356 2,225 41 600 1 0 0 0 0 3 550 3,375
Duu West Mamprusi Northern 4,500 57 350 32 500 1 0 1 0 0 6 1,250 2,100
Kusawgu West/Central Gonja Northern 4,848 175 1,100 41 600 1 0 0 1 0 6 1,250 2,950
Mpaha West/Central Gonja Northern 7,000 711 4,450 32 500 1 0 0 1 1 7 1,450 6,400
Kpasenkpe West Mamprusi Northern 14,200 498 3,125 40 600 1 1 0 1 0 7 1,450 5,175
Vortkom Bawku East Upper East 214 18 125 1 0 0 0 0 0 0 0 0 125
Kanjam Bawku East Upper East 445 52 325 20 300 0 0 0 0 0 0 0 625
Tanga Natinga Bawku East Upper East 600 78 500 79 1,200 1 0 1 0 1 7 1,450 3,150
Sumaduri Garu Tempane Upper East 738 200 1,250 23 350 0 0 0 1 0 3 700 2,300
Zongoyire Bawku East Upper East 768 33 200 29 400 0 0 0 0 0 0 0 600
Goriga Bawku East Upper East 1,198 105 650 168 2,500 0 0 1 0 0 3 700 3,850
Apodabogo Garu Tempane Upper East 1,247 228 1,425 23 350 0 0 0 0 0 0 0 1,775
Duuri Garu Tempane Upper East 2,000 122 775 39 600 0 0 0 0 0 0 0 1,375
Bugri Natinga Garu Tempane Upper East 2,122 183 1,150 145 2,150 2 0 2 0 1 13 2,700 6,000
Windnaba Garu Tempane Upper East 3,000 160 1,000 66 1,000 0 0 1 0 0 3 700 2,700
Bas Yonde
CentralGaru Tempane Upper East 5,209 875 5,475 90 1,400 0 0 1 0 1 4 900 7,775
Kongo Jirapa/Nandom Upper West 223 19 125 11 200 0 0 0 0 0 0 0 325
Gbelle Sissala Upper West 229 17 100 13 200 0 0 0 0 0 0 0 300
Banu Sissala Upper West 253 36 225 3 50 1 0 0 0 0 3 550 825
Wasai Sissala Upper West 325 21 125 12 200 0 0 0 0 0 0 0 325
Wuru Sissala Upper West 370 32 200 1 0 0 0 0 0 0 0 0 200
Puzene Sissala Upper West 611 30 200 5 50 0 0 0 0 0 0 0 250
Bichemboi Sissala Upper West 646 56 350 9 100 1 0 0 0 0 3 550 1,000
Duwie Sissala Upper West 759 75 475 25 350 0 0 0 0 0 0 0 825
Kogle Jirapa/Nandom Upper West 839 92 575 32 500 1 0 0 0 0 3 550 1,625
Ketuo Jirapa/Nandom Upper West 960 102 650 56 850 1 0 0 1 0 6 1,250 2,750
Dasima Sissala Upper West 982 189 1,175 42 650 1 0 0 0 0 3 550 2,375
Kulkpong Wa Upper West 1,455 94 600 26 400 0 1 0 0 0 1 200 1,200
Buo Sissala Upper West 2,100 90 575 31 500 1 1 0 0 0 4 750 1,825
* Demand for public facilities: 250W@JSS + 100W@CHIPS compound + 400W@Clinic + 400W@Health center + 100W@Governmental office + 100W@staff house
(Source) JICA Study Team
5.3.4 Electricity demand forecast (on-grid electrification)
Through the reconsigned study, the Study Team collected data from a total of 12 communities
connected to the grid on items such as the types of electrical products used and the duration of use. It
should be noted, however, that the number of community samples was low because the study's main
subject is communities electrified with off-grid PV systems, and that the data are not sufficient
reflection of all communities because the lowest population of those sampled was 1,022 (whereas
91.74% of all communities have a population of less than 1,000). These factors were borne in mind in
examination of the results, as follows.
(1) Demand for on-grid electrification among unelectrified households
For the communities that furnished responses for this item in the FGD, the average rate of household
electrification was 32% (when the unrealistic responses of 100 and 90% are excluded). Even in districts
connected to the grid, it appears that household electrification is being held down by factors such as
payment capabilities and physical distribution of compounds.
Table 5.3.5 presents figures for the use rates and hours for electrical products in unelectrified

5-25
communities, communities connected to the grid, and districts electrified with PV systems. It can be
seen that, even in on-grid communities, the main electrical products are lights, radios, and radio
cassettes, and that other products are not in widespread use. In addition, there is not a big difference
between the communities electrified by on-grid systems and those electrified by off-grid ones in respect
of the use duration. This indicates the lack of a major change in the economic structure even in
communities connected to the grid in the northern regions.
Table 5.3.5 Use of electrical products in the three northern regions
(Source) JICA Study Team
The Study Team analyzed the data for the 156 on-grid households that were actually using power
from the grid when the interviews were held. Because information was not available on the times (of
day) of electrical product use, the Study Team calculated the average household demand (W) by
multiplying the average number of electrical products per household (among all on-grid households) by
the capacity, and multiplying the resultant product by a diversity factor (= 0.5). It also calculated the
demand in kWh based on the use durations (hours) shown in Table 5.3.6. At 107 W, the average
demand was larger than in the case of households electrified with PV systems, due to the use of color TV
sets and fans.
Table 5.3.6 On-grid electrification demand among unelectrified households
TV
(colour) -
big
VCRR/
VCD
Radio
cassette
Radio
cassette
Incandesc
ent light
Flourresc
ent lightFan
Capacity(W)
77 13 15 15 40 18 55
Number 0.29 0.21 0.88 0.88 3.08 0.76 0.46
Subtotal(W)
22.7 2.7 13.3 13.3 123.3 13.7 25.0 0.5 107.0
Usage
hour3.95 2.71 4.35 4.35 8.1 8.8 5.4
Annual
Demand
(kWh)32.7 2.6 21.1 21.1 364.6 44.1 49.3
Diversityfactor
Total demand(kWh)
TotalCapacity
(W)
535.6
(Source) JICA Study Team
N PenetrationHours
of useN Penetration
Hours
of useN Penetration
Hours
of use
Small colour tv 4 0% 5 14 7% 3.42 5 1% 2.3
Big colour tv 9 1% 2.9 43 22% 3.95 9 3% 1.9
Black and White tv 17 2% 2.2 21 11% 3.41 23 7% 3.5
VCR 11 1% 3.2 30 15% 2.71 15 4% 2.4
Radio 563 66% 5.9 96 48% 4.52 225 64% 5
Radio cassette player 401 47% 4.2 123 62% 4.35 185 52% 3.7
Small refrigerator 1 0% 6 20 10% 16.2 3 1% 12
Big Refrigerator 0 0% 0 12 6% 15.09 2 1% 8
Small freezer 0 0% 0 6 3% 17.2 0 0% 0
Big Freezer 0 0% 0 5 3% 17 1 0% 24
Cell phone charger 3 0% 24 7 4% 17.14 0 0% 0
Incadescent lights 3 0% 3 107 54% 8.1 8 2% 8
Flourescent lights 2 0% 7.5 50 25% 8.8 60 17% 7.6
Fan 7 1% 2.6 55 28% 5.4 8 2% 2.8
Flash light 453 53% 5.3 91 46% 3.8 328 93% 3.4
Sewing machine 1 0% 0 1 1% 0 0 0% 0
Electric iron 1 0% 0 28 14% 1 4 1% 1
Coil heater 0 0% 0 19 10% 1.6 2 1% 1.2
Table-top single burner cooker 0 0% 0 0 0% 0 0 0% 0
4 burner electric cooker 0 0% 0 0 0% 0 0 0% 0
Total No. of Respondents 859 200 353
Appliance owned and in use
Unelectrified Electrified on grid Electrified off-grid

5-26
Therefore, multiplication of 32% of the total number of households by 107.0W would yield the scale
of the demand in the community. In light of the low payment capabilities of unelectrified households in
communities with a population of under 1,000, it was decided to adopt a level 80% as high as the 50kWh
per month for which the lifeline tariff is applied as the ceiling demand (equivalent to 480kWh per year).
(2) On-grid electrification demand among commercial facilities
Grain mills must be considered demand for on-grid electrification because they each use motive
power amounting to 20kW (and 58,4000kWh in operation for eight hours per day). This is a significant
point of difference from communities electrified with PV systems. Of the 116 grain mills in
communities connected to the grid, 31 (27%) were electrified.
Other commercial facilities (i.e., excluding grain mills) electrified through connection to the grid that
were covered by the detailed questionnaire survey categorized 22 in all, but used fewer types of
electrical products than households. Properly speaking, demand should be estimated by adding up totals
for individual facilities, but there are few (or no) data on the individual level. In response, the Study
Team decided not to treat commercial facilities other than grain mills separately and instead to ascertain
the overall trend for them.
As was done for households, the Study Team averaged the totals for electrical products used in the
various facilities by the number of the latter, and multiplied the result by the diversity factor. This
yielded a figure of 195.7W for the average commercial facility (see Table 5.3.7). In this case as well,
products with an appearance rate of less than 10% were not taken into account. The level 80% as high as
the 50kWh per month for which the lifeline tariff is applied was again adopted as the ceiling demand
(equivalent to 480kWh per year) in the case of unelectrified commercial facilities in communities with a
population of less than 1,000, as in the case of households.

5-27
Table 5.3.7 On-grid electrification demand among commercial facilities
Capacity
(W)
General
goods/
drug
store
Drinking
bar/pito
brewing
Tailor/
seamstre
ss
Hair
salon/
barber
shop
Repair
shop
Guest
houseOthers
Mosuque/
churchTotal
Avarage
Cap.(W)
Total
Cap.(W)
Div.
factor
Cap. for
commerci
al (W)
3 2 2 4 2 1 3 5 22
180 1 1 2 4 32.7
40 2 19 1 1 2 4 29 52.7
18 2 2 2 6 3 2 21 38 31.1
55 1 7 1 3 2 25 39 97.5
1300 3 3 177.3
0.5 195.7
Num. of facilities
Fan
Hair dryer
391.3
Big freezer
Incand. light
Flours. light
Big
freezer
Incandesc
ent light
Flourresc
ent lightFan Hair dryer
Total
demand
(kWh)
Capacity(W)
180 40 18 55 750
Averagecap. (W)
32.7 52.7 31.1 97.5 177.3
Usage
hour17.0 8.1 8.8 5.4 1.00
Annual
Demand
(kWh)202.9 155.8 99.9 192.2 64.7
715.5
(Source) JICA Study Team
The on-grid electrification rate among commercial facilities other than grain mills came to 31%. The
scale of the demand in the community was obtained by multiplying the aforementioned average demand
by 31%.
(3) On-grid electrification demand among public facilities
In the case of public facilities, policy for electrification of subject facilities ranks alongside actual
electrification as a key factor in the preparation of a demand model. The reconsigned study was not able
to obtain data on the electrification status of public facilities other than medical ones. The Study Team
therefore prepared an electrification model for public facilities in accordance with the following
guidelines.
• Educational facilities
Among primary schools, the reconsigned study found that the electrification rate was only 1.9%
in the 12 communities connected to the grid (54 schools in all). It can also be noted that the
government is not taking active steps to raise this rate as a matter of policy. As a result, the Study
Team decided not to take primary schools into account as demand. As for junior secondary
schools, the government is expected to actively execute policy for their electrification, which is
anticipated to be on the level of lighting, as in the case of electrification with PV systems.
To estimate the demand per junior secondary school, the Study Team assumed the installation
of eight 18-W fluorescent bulbs and one 77W color TV set, for a total of 221W. Application of the
diversity factor (50%) yielded a total facility capacity of 110.5W. The amount of power use was
put at 321.2kWh per year on the premise of use of lighting for a duration of four hours a day.
• Medical facilities
Medical facilities were studied as electrification subjects regardless of their size, because the

5-28
government has posted electrification of all of them as a policy objective. Based on the results
obtained for three facilities in the reconsigned study, the demand (facility capacity) was put at
278.2W per facility. The calculation of the amount of power use assumed a lighting duration of
four hours (see Table 5.3.8). For CHIPS compounds, the facility capacity was put half as high at
139.1W.
Table 5.3.8 On-grid electrification demand among medical facilities
(For 3facilities)
Big clourTV
Big
refrigerator
Incandes
centlight
Flourscent light
Fan
Capacity(W)
77 130 40 18 55
Total
number1 2 16 14 8
Capacity
for 1
facility(W)25.7 86.7 213.3 84.0 146.7 0.5 278.2
Usage
hour3.95 16.2 4 4 5.4
Annual
Demand
(kWh)37.0 512.5 311.5 122.6 289.1
Div.Factor
TotalCapacity
(W)
Total demand
(kWh)
1,272.7
(Source) JICA Study Team
• Other public facilities
As for other types of public facility, the reconsigned survey found that 89.7% of all
governmental offices (39 total) had been electrified. The Study Team considered facilities in this
category as electrification subjects because their electrification could presumably be promoted as a
matter of official policy. The level of electrification (capacity) was put on a par with that for
households.
(4) On-grid electrification demand
Table 5.3.9 presents figures for the on-grid electrification demand in unelectrified communities
covered by the in-depth survey in the village socioeconomic study. This demand is higher than the PV
electrification demand.

5-29
Table 5.3.9 On-grid electrification demand in unelectrified communities
Community
name
District
NameRegion Name
Num. of
Compounds
Demand HH
(107@32%)
(W)
Num. of grain
milling
Demand for
grain milling
(20000@27%)
(W)
Num. of
other
business
entitiy
Demand for
business ent.
(195.7@31%)
(W)
Total demand
for business
ent. (W)
Junior
secondary
school
Chips
compoundClinic
Health
center/health
post
Governmental
office
Demand for
public
facilities
(W) *
Total demand
(W)
Bimbini West Mamprusi Northern 14 479 0 0 7 425 425 0 0 0 0 0 0 904
Lampur West/Central Gonja Northern 49 1,678 0 0 3 182 182 0 0 0 0 0 0 1,860
Langatire West/Central Gonja Northern 31 1,061 1 5,400 4 243 5,643 0 0 0 0 0 0 6,704
Kakale West/Central Gonja Northern 30 1,027 1 5,400 6 364 5,764 0 0 0 0 0 0 6,791
Bethlehem West/Central Gonja Northern 35 1,198 2 10,800 6 364 11,164 0 0 0 0 0 0 12,362
Kafulwurape West/Central Gonja Northern 83 2,842 1 5,400 3 182 5,582 0 0 0 0 0 0 8,424
Butei West/Central Gonja Northern 43 1,472 1 5,400 0 0 5,400 0 0 0 0 0 0 6,872
Kananto West/Central Gonja Northern 50 1,712 1 5,400 12 728 6,128 0 0 0 0 0 0 7,840
Kudani Saboba/Chereponi Northern 87 2,979 6 32,400 13 789 33,189 0 0 0 0 0 0 36,168
Kokope West/Central Gonja Northern 81 2,773 3 16,200 8 485 16,685 0 0 0 0 0 0 19,459
Yachadom Zabzugu/Tatale Northern 109 3,732 12 64,800 18 1,092 65,892 1 0 0 0 1 218 69,842
Kpani Saboba/Chereponi Northern 83 2,842 1 5,400 7 425 5,825 0 0 0 0 0 0 8,667
Sheini Zabzugu/Tatale Northern 130 4,451 6 32,400 22 1,335 33,735 1 0 0 0 0 111 38,296
Wenchiki Saboba/Chereponi Northern 168 5,752 4 21,600 13 789 22,389 1 0 0 1 1 496 28,637
Kandin Zabzugu/Tatale Northern 170 5,821 0 0 47 2,851 2,851 1 0 0 1 0 389 9,061
Kulkpaligu Zabzugu/Tatale Northern 173 5,924 5 27,000 18 1,092 28,092 1 0 0 1 0 389 34,404
Kpabuso West/Central Gonja Northern 378 12,943 7 37,800 27 1,638 39,438 1 0 0 0 1 218 52,598
Nahuyili Zabzugu/Tatale Northern 135 4,622 4 21,600 19 1,153 22,753 0 0 0 0 0 0 27,375
Wapuli Saboba/Chereponi Northern 291 9,964 5 27,000 35 2,123 29,123 1 0 0 1 0 389 39,476
Tamaligu Gushiegu/Karaga Northern 150 5,136 3 16,200 29 1,759 17,959 0 0 0 0 0 0 23,095
Sheri West/Central Gonja Northern 207 7,088 4 21,600 8 485 22,085 1 0 0 0 0 111 29,284
Busunu West/Central Gonja Northern 576 19,722 2 10,800 25 1,517 12,317 1 0 0 1 0 389 32,428
Mandari Bole Northern 356 12,189 4 21,600 37 2,245 23,845 1 0 0 0 0 111 36,145
Duu West Mamprusi Northern 57 1,952 7 37,800 25 1,517 39,317 1 0 1 0 0 389 41,657
Kusawgu West/Central Gonja Northern 175 5,992 10 54,000 31 1,881 55,881 1 0 0 1 0 389 62,261
Mpaha West/Central Gonja Northern 711 24,345 0 0 32 1,941 1,941 1 0 0 1 1 496 26,782
Kpasenkpe West Mamprusi Northern 498 17,052 8 43,200 32 1,941 45,141 1 1 0 1 0 528 62,721
Vortkom Bawku East Upper East 18 616 1 5,400 0 0 5,400 0 0 0 0 0 0 6,016
Kanjam Bawku East Upper East 52 1,780 1 5,400 19 1,153 6,553 0 0 0 0 0 0 8,333
Tanga Natinga Bawku East Upper East 78 2,671 3 16,200 76 4,611 20,811 1 0 1 0 1 496 23,977
Sumaduri Garu Tempane Upper East 200 6,848 3 16,200 20 1,213 17,413 0 0 0 1 0 278 24,540
Zongoyire Bawku East Upper East 33 1,130 4 21,600 25 1,517 23,117 0 0 0 0 0 0 24,247
Goriga Bawku East Upper East 105 3,595 3 16,200 165 10,010 26,210 0 0 1 0 0 278 30,083
Apodabogo Garu Tempane Upper East 228 7,807 5 27,000 18 1,092 28,092 0 0 0 0 0 0 35,899
Duuri Garu Tempane Upper East 122 4,177 7 37,800 32 1,941 39,741 0 0 0 0 0 0 43,919
Bugri Natinga Garu Tempane Upper East 183 6,266 15 81,000 130 7,887 88,887 2 0 2 0 1 884 96,037
Windnaba Garu Tempane Upper East 160 5,478 5 27,000 61 3,701 30,701 0 0 1 0 0 278 36,457
Bas Yonde
CentralGaru Tempane Upper East 875
29,9608 43,200 82 4,975 48,175 0 0 1 0 1 385 78,520
Kongo Jirapa/Nandom Upper West 19 651 1 5,400 10 607 6,007 0 0 0 0 0 0 6,657
Gbelle Sissala Upper West 17 582 1 5,400 12 728 6,128 0 0 0 0 0 0 6,710
Banu Sissala Upper West 36 1,233 2 10,800 1 61 10,861 1 0 0 0 0 111 12,204
Wasai Sissala Upper West 21 719 2 10,800 10 607 11,407 0 0 0 0 0 0 12,126
Wuru Sissala Upper West 32 1,096 1 5,400 0 0 5,400 0 0 0 0 0 0 6,496
Puzene Sissala Upper West 30 1,027 3 16,200 2 121 16,321 0 0 0 0 0 0 17,349
Bichemboi Sissala Upper West 56 1,917 2 10,800 7 425 11,225 1 0 0 0 0 111 13,253
Duwie Sissala Upper West 75 2,568 1 5,400 24 1,456 6,856 0 0 0 0 0 0 9,424
Kogle Jirapa/Nandom Upper West 92 3,150 1 5,400 31 1,881 7,281 1 0 0 0 0 111 10,541
Ketuo Jirapa/Nandom Upper West 102 3,492 2 10,800 54 3,276 14,076 1 0 0 1 0 389 17,957
Dasima Sissala Upper West 189 6,471 3 16,200 39 2,366 18,566 1 0 0 0 0 111 25,148
Kulkpong Wa Upper West 94 3,219 3 16,200 23 1,395 17,595 0 1 0 0 0 139 20,953
Buo Sissala Upper West 90 3,082 4 21,600 27 1,638 23,238 1 1 0 0 0 250 26,569
* Demand for public facilities: 110.5W@JSS + 139.1W@CHIPS compound + 278.2W@Clinic + 278.2W@Health center + 107.0W@Governmental office
(Source) JICA Study Team
5.3.5 Calculation from population statistics
Demand can be estimated through the procedure outlined in the previous section when the number of
subject public facilities, commercial facilities, and households can be obtained through a village
socioeconomic study. Ordinarily, however, such data are not fully available at the stage of planning
formulation.
This section therefore presents the procedure for calculation of the approximate demand from
population statistics. It should be emphasized that the procedure described in this section is to be used
solely for getting a rough grasp of the demand for PV systems in communities; for actual electrification,
it is necessary to determine the presence or absence and number of facilities. In order to grasp the trend
by the simplest possible expression, the correlation with population may be expressed by means of a
linear function passing through the origin.
For this purpose, the Study Team made an analysis of 30 communities for which more reliable data were
obtained through confirmation of the number of facilities in the FGD. The data were compiled
separately for each region in consideration of differences of community structure. Table 5.3.10 presents
data for population, number of households, number of commercial facilities, and number of facilities
that are candidates for electrification with PV systems in the communities in each region.
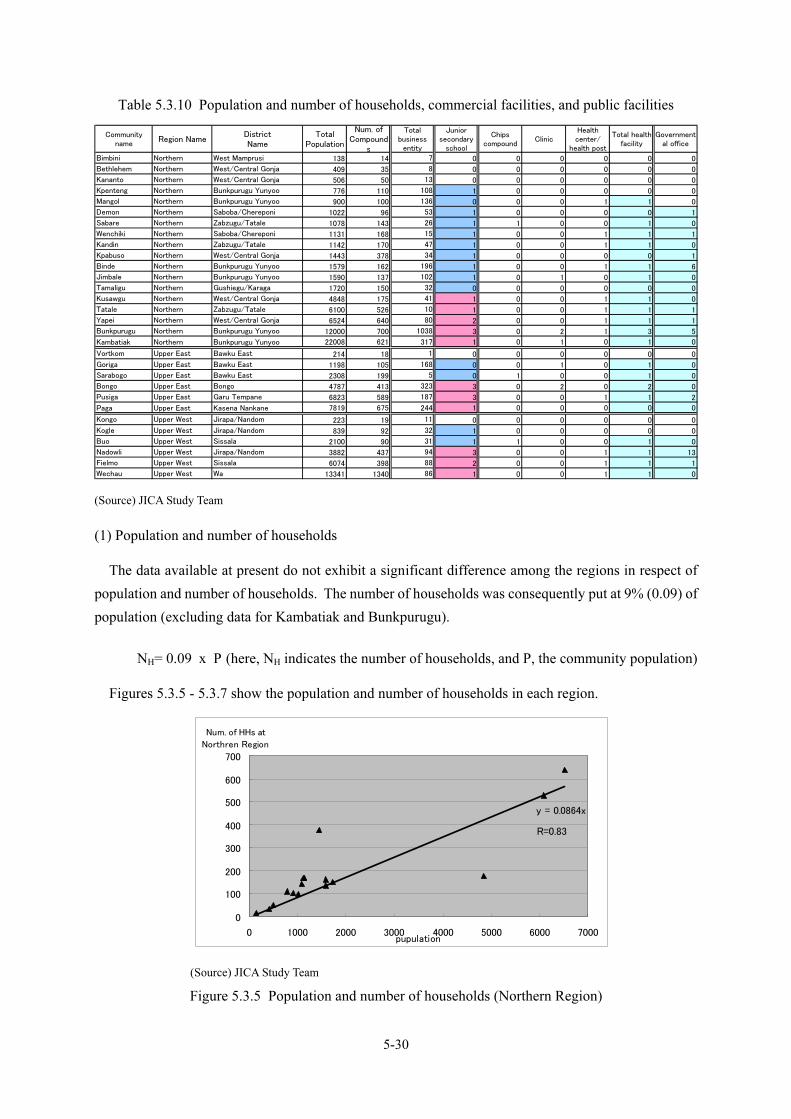
5-30
Table 5.3.10 Population and number of households, commercial facilities, and public facilities
Community
nameRegion Name
District
Name
Total
Population
Num. of
Compound
s
Total
business
entity
Junior
secondary
school
Chips
compoundClinic
Health
center/
health post
Total health
facility
Government
al office
Bimbini Northern West Mamprusi 138 14 7 0 0 0 0 0 0
Bethlehem Northern West/Central Gonja 409 35 8 0 0 0 0 0 0
Kananto Northern West/Central Gonja 506 50 13 0 0 0 0 0 0
Kpenteng Northern Bunkpurugu Yunyoo 776 110 108 1 0 0 0 0 0
Mangol Northern Bunkpurugu Yunyoo 900 100 136 0 0 0 1 1 0
Demon Northern Saboba/Chereponi 1022 96 53 1 0 0 0 0 1
Sabare Northern Zabzugu/Tatale 1078 143 26 1 1 0 0 1 0
Wenchiki Northern Saboba/Chereponi 1131 168 15 1 0 0 1 1 1
Kandin Northern Zabzugu/Tatale 1142 170 47 1 0 0 1 1 0
Kpabuso Northern West/Central Gonja 1443 378 34 1 0 0 0 0 1
Binde Northern Bunkpurugu Yunyoo 1579 162 196 1 0 0 1 1 6
Jimbale Northern Bunkpurugu Yunyoo 1590 137 102 1 0 1 0 1 0
Tamaligu Northern Gushiegu/Karaga 1720 150 32 0 0 0 0 0 0
Kusawgu Northern West/Central Gonja 4848 175 41 1 0 0 1 1 0
Tatale Northern Zabzugu/Tatale 6100 526 10 1 0 0 1 1 1
Yapei Northern West/Central Gonja 6524 640 80 2 0 0 1 1 1
Bunkpurugu Northern Bunkpurugu Yunyoo 12000 700 1038 3 0 2 1 3 5
Kambatiak Northern Bunkpurugu Yunyoo 22008 621 317 1 0 1 0 1 0
Vortkom Upper East Bawku East 214 18 1 0 0 0 0 0 0
Goriga Upper East Bawku East 1198 105 168 0 0 1 0 1 0
Sarabogo Upper East Bawku East 2308 199 5 0 1 0 0 1 0
Bongo Upper East Bongo 4787 413 323 3 0 2 0 2 0
Pusiga Upper East Garu Tempane 6823 589 187 3 0 0 1 1 2
Paga Upper East Kasena Nankane 7819 675 244 1 0 0 0 0 0
Kongo Upper West Jirapa/Nandom 223 19 11 0 0 0 0 0 0
Kogle Upper West Jirapa/Nandom 839 92 32 1 0 0 0 0 0
Buo Upper West Sissala 2100 90 31 1 1 0 0 1 0
Nadowli Upper West Jirapa/Nandom 3882 437 94 3 0 0 1 1 13
Fielmo Upper West Sissala 6074 398 88 2 0 0 1 1 1
Wechau Upper West Wa 13341 1340 86 1 0 0 1 1 0
(Source) JICA Study Team
(1) Population and number of households
The data available at present do not exhibit a significant difference among the regions in respect of
population and number of households. The number of households was consequently put at 9% (0.09) of
population (excluding data for Kambatiak and Bunkpurugu).
NH= 0.09 x P (here, NH indicates the number of households, and P, the community population)
Figures 5.3.5 - 5.3.7 show the population and number of households in each region.
y = 0.0864x
0
100
200
300
400
500
600
700
0 1000 2000 3000 4000 5000 6000 7000pupulation
Num. of HHs at
Northren Region
(Source) JICA Study Team
Figure 5.3.5 Population and number of households (Northern Region)
R=0.83

5-31
y = 0.0863x
0
100
200
300
400
500
600
700
800
0 1000 2000 3000 4000 5000 6000 7000 8000 9000pupulation
Num. of HHs at
Upper Est. Region
(Source) JICA Study Team
Figure 5.3.6 Population and number of households (Upper East Region)
y = 0.0947x
0
200
400
600
800
1000
1200
1400
1600
0 2000 4000 6000 8000 10000 12000 14000 16000pupulation
Num. of HHs at
Upper Wst. Region
(Source) JICA Study Team
Figure 5.3.7 Population and number of households (Upper West Region)
(2) Population and number of commercial facilities
As for households, there was also no major difference among the three regions in respect of the
correlation between population and the number of commercial facilities. The number of commercial
facilities was put at 2.5% (0.025) of the population. Figure 5.3.8 shows the correlation between
population and the number of commercial facilities in the three northern regions taken together, and
Figure 5.3.9 - 5.3.11, that in each region taken separately.
NB= 0.025 x P (here NB indicates the number of commercial facilities, and P, community population)
R=0.99
R=0.98

5-32
y = 0.0252x
0
200
400
600
800
1000
1200
0 5000 10000 15000 20000 25000pupulation
Num. of business
entity for 3 Regions
(Source) JICA Study Team
Figure 5.3.8 Population and number of commercial facilities (three northern regions)
y = 0.036x
0
50
100
150
200
250
300
350
0 1000 2000 3000 4000 5000 6000 7000 8000 9000pupulation
Num. of business
entity at Upper Est.
Region
(Source) JICA Study Team
Figure 5.3.9 Population and number of commercial facilities (Northern Region)
y = 0.036x
0
50
100
150
200
250
300
350
0 1000 2000 3000 4000 5000 6000 7000 8000 9000pupulation
Num. of business
entity at Upper Est.
Region
(Source) JICA Study Team
Figure 5.3.10 Population and number of commercial facilities (Upper East Region)
R=0.52
R=0.56
R=0.64

5-33
y = 0.0174x
0
20
40
60
80
100
120
0 1000 2000 3000 4000 5000 6000 7000pupulation
Num. of business
entity at Upper Wst.
Region
(Source) JICA Study Team
Figure 5.3.11 Population and number of commercial facilities (Upper West Region)
The number of communities with grain mills was found by multiplying the population by a factor of
0.0021. Figure 5.3.12 shows the correlation between population and the number of grain mills.
NG= 0.0021 x P (here NG indicates the number of grain mills, and P, community population)
y = 0.0021x
0
20
40
60
80
100
120
140
0 5000 10000 15000 20000 25000pupulation
Number of grain mill
(Source) JICA Study Team
Figure 5.3.12 Population and number of grain mills (three northern regions)
(3) Population and number of public facilities
• Junior secondary schools: one in communities with a population of 1,000 - 5,000, and two in
those with a population of more than 5,000.
• Medical facilities: one in communities with a population of over 1,000; these facilities were all
assumed to be health centers or clinics due to the appearance of few CHIPS compounds in the
communities covered by the socioeconomic study.
• Other public facilities: one in communities with a population of over 5,000 (the number is hard
R=0.87
R=0.56

5-34
to estimate from the data, but this assumption was made considering the presence of police
stations in district capitals and major cities).
5.3.6 Summary of the demand forecast results
Table 5.3.11 presents totals for the results of the forecast by the method described above (when the
number of subject facilities was clear). Table 5.3.12 outlines the procedure for estimating the number of
facilities from population.
Table 5.3.11 Demand forecasting procedure (when the number of facilities is clear)
Facilities Electrification with PV systems Electrification with on-grid systems
Households 25W x number of households x 20% 107.0W × number of households ×32%
Commercial facilities 50W x number of facilities x 30% (25%BCS, 5%SHS)
195.7W× number of facilities ×31%
Grain mills NA 20,000W× number of facilities ×27%
Junior secondary schools 250W x number of facilities 110.5W× number of facilities
Clinics and health centers 400W x number of facilities (including refrigerators and wireless systems)
278.2W× number of facilities
CHIPS compounds 100W x number of facilities 139.1W× number of facilities
Offices 100W× number of facilities 107.0W× number of facilities
Staff houses
100W x 3 x (number of clinics and health centers) + 100W x 1 x (number of CHIPS compounds) + 100W x 3 x (number of junior secondary schools) + 100W x 1 (offices)
NA
(Source) JICA Study Team
Table 5.3.12 Procedure for estimating the number of facilities from population
Facilities Procedure for estimating the number (P = population)
Households NH= 0.09 x P
Commercial facilities NB= 0.025 x P
Grain mills NG= 0.0021 x P
Junior secondary schools
One in communities with a population of 1,000 - 5,000, and two for those with one of over 5,000
Clinics and health centers
One for communities with a population of over 1,000
CHIPS compounds NA
Offices One in communities with a population of over 5,000
(Source) JICA Study Team
5.4 Demarcation of the target areas for on- and off-grid electirification
5.4.1 On-grid approach
(1) Perspectives on selection of candidate areas for on-grid electrification
In Ghana, RE is proceeding in the context of the SHEP. The SHEP itself is more of a selection of sites
for implementation than a plan, and it would not be going too far to say that Ghana in effect lacks a
master plan for RE. In light of this situation, the Study Team made a trial selection of on-grid
electrification from three approaches, as follows.

5-35
1) Economic approach
This approach lies in comparison of on-grid and off-grid electrification costs, and selection of the
sites where the former is lower. Because the on-grid electrification cost varies greatly with the
community location and demand, it would, strictly speaking, be necessary to make the calculation on the
basis of the actual on-grid electrification plan. At present, however, no such plan exists. The Study
Team therefore decided to calculate the electrification cost through a study utilizing the simple
distribution line model and standard community model for comparison of economic merit. It also
decided to make use of the following two other approaches in a supplemental manner as needed to
estimate the on-grid electrification areas.
2) Policy approach
In SHEP policy, candidate areas for on-grid electrification must be located no more than 20km from an
existing distribution line.
3) Physical approach
Considering physical factors such as the thickness of ordinary cable, current, and voltage drop, it was
assumed that candidate areas for on-grid electrification would have to be located within a 50-km radius of a
33-kV distribution substation or a 30km radius of an 11kV substation. Figure 5.4.1 shows the scope of the
policy and physical approaches.
(Source) JICA Study Team
Figure 5.4.1 Candidate on-grid electrification areas based on policy and physical approaches
(2) Method of calculating on-grid electrification costs
Regarding on-grid electrification, the Study Team considered two model cases. One is to electrify
only the target community like SHEP (i.e., other communities on the route will not be electrified); the
other is to electrify all communities on the route (see Figure 5.4.2).
All communities on the route can share the costs of high-voltage (HV) distribution line equally for the

5-36
latter case, while only the target community must pay all the electrification costs. Therefore it will be
possible to reduce cost burden for "the case of electrifying all communities on the route" to increase
beneficial lies compared to "the case of no other communities on the route".
In the case that there are no other communities on the route (SHEP)
In the case that all communities on the route are electrified
(Source) JICA Study Team
Figure 5.4.2 On-grid electrification model
1) Initial cost
(a) Distribution line construction cost (material cost, transportation cost, construction cost, etc.)
There are two major categories of construction cost: that which rises along with extension of
distribution lines, like that for high-voltage distribution facilities (HV conductors, supports, etc.), and
that which rises along with the scale of the community, like that for low-voltage distribution facilities
(distribution transformers, LV conductors, supports, etc.). The Study Team made calculations of each
and converted the results into annual cost.
(b) Running cost
Maintenance cost, transmission and distribution loss, fuel cost, and generation and transmission cost
(3) Specific calculation method
The Study Team made a calculation of the electrification cost in a standard community in each of the
three northern regions, based on the costs in the three demand patterns in the standard model and in
accordance with the distribution estimated from the results of the village socioeconomic study. Table
5.4.1 shows the makeup of the standard demand model, and Table 5.4.2, the premises of the cost
calculation.
Existing HV line
Community Community Community
New HV line
Existing HV line
Community Community Community
New HV line
X X

5-37
Table 5.4.1 Standard demand model (the bold enclosure indicates on-grid electrification)
Share of the total
number of communities
Off-grid On-grid
Demand pattern 1 (Population = 500)
91.74% (communities with a population of less
than 1,000)
* Households: 25 W x 10 households (BCS use); 23 kWh/year x 10 households) * Commercial facilities: 50 W x 3 facilities (BCS use); 40 kWh/year x 3 facilities * Grain mills: none * Clinics: none * JSS: none * Offices: none * Staff houses: none
* Households: 107 W x 10 households; 480 kWh/year x 10 households * Commercial facilities: 50 W x 3 facilities (BCS use); 40 kWh/year x 3 facilities * Grain mills: none * Clinics: none * JSS: none * Offices: none * Staff houses: none * 50-kVA transformers: 1
Demand pattern 2 (Population = 2,000)
- 7.55% (communities with
a population of 1,000 - 4,999)
* Households: 25 W x 40 households (BCS use); 23 kWh/year x 40 households) * Commercial facilities: 50 W x 13 facilities (BCS use); 40 kWh/year x 13 facilities - 50 W x 3 facilities (SHS); 56 kWh/year x 3 facilities * Grain mills: none * Clinics: 400 W x 1 * JSS: 250 W x 1; 277 kWh/year x 1 facility * Offices: 100 W x 1; 100 kWh/year x facility * Staff houses: 100 W x 7; 106 kWh/year x 7 facilities
* Households: 107 W x 60 households; 535.6 kWh/year x 60 households) * Commercial facilities: 195.7 W x 15 facilities; 715.5 kWh/year x 15 facilities * Grain mills: 20,000 W x 1; 58,400 kWh/year x 1 * Clinics: 280 W x 1; 1,272 kWh/year x 1 * JSS: 110.5 W x 1; 321.3 kWh/year x 1 * Offices: 107 W x 1; 535.6 kWh/year x 1 * Staff houses: none * 50-kVA transformers: 1
Demand pattern 3 (Population = 5,000)
- 0.71% (communities with
a population of 5,000 or more)
* Households: 25 W x 100 households (BCS use); 23 kWh/year x 100 households) * Commercial facilities: 50 W x 31 facilities (BCS use); 40 kWh/year x 31 facilities - 50 W x 6 facilities (SHS); 56 kWh/year x 6 facilities * Grain mills: none * Clinics: 400 W x 1; 381 kWh/year x 1 facility * JSS: 250 W x 2; 277 kWh/year x 2 facilities * Offices: 100 W x 1; 100 kWh/year x 1 facility * Staff houses: 100 W x 10; 106 kWh/year x 10 facilities
* Households: 107 W x 150 households; 535.6 kWh/year x 150 households) * Commercial facilities: 195.7 W x 38 facilities; 715.5 kWh/year x 38 facilities * Grain mills: 20,000 W x 2 facilities; 58,400 kWh/year x 2 * Clinics: 280 W x 1; 1,272.7 kWh/year x 1 * JSS: 110.5 W x 2; 321.3 kWh/year x 2 * Offices: 107 W x 1; 535.6 kWh/year x 1 * Staff houses: none * 50-kVA transformers: 2
** It was assumed that the number of transformers would increase by one every 50 kW (50,000 W) of capacity.
(Source) JICA Study Team

5-38
Table 5.4.2 Premises of the cost calculation
Service life 30 years
Maintenance cost 2% of the initial cost
Loss rate 12%
Interest rate 8%
Exchange rate 1 dollar = 9,000 cedi
(Source) JICA Study Team
1) Initial cost
The Study Team calculated the initial cost for high- and low-voltage distribution lines based on actual
costs at the NED.
Table 5.4.3 Distribution line costs at the NED
(Unit: dollars)
Materials Personnel expenses
Total
High-voltage lines 11,649 1,096 12,745
Low-voltage lines 12,190 595 12,785
50-kVA transformers 7,993 195 8,188
(Source) NED
(a) High-voltage distribution line cost
Table 5.4.4 shows the cost (C) of high-voltage distribution facilities that would have to be shared by
the communities on the termini of the lines in the case of the above model.
Table 5.4.4 Cost to be shared by terminal communities
Total number of communities electrified per feeder
1 2 3
High-voltage distribution line cost to be shared by terminal communities
C0L 1.5C0L 1.83C0L
4 5 6 7 8 9 10
2.08C0L 2.28C0L 2.45C0L 2.59C0L 2.72C0L 2.83C0L 2.93C0L
(Note) Co: cost of construction of high-voltage distribution lines per kilometer (12,745 dollars)
L: average distance between communities (see Table 5.4.5)
(Source) JICA Study Team
Approximation of the relationship between the total number of communities electrified and Ch (the
high-voltage distribution line cost to be shared by terminal communities) in Table 5.4.4 may be
expressed by the following equation.
Ch=C0L×(0.934×Ln(N) + 0.8158)

5-39
Table 5.4.5 shows the results of an estimate of the average distance between communities in each
region based on the regional area and number of communities.
Table 5.4.5 Average distance between communities in the northern regions
Region Average distance between communities (L)
Northern 6.05km
Upper East 2.66km
Upper West 5.47km
Average 5.14km
(Source) JICA Study Team
(b) Low-voltage distribution line cost
The Study Team calculated the cost of transformers on the assumption that it would require a 50
meter low-voltage distribution line (including the service line) to supply electricity to a single household.
The low-voltage distribution line cost (C1) may be expressed by the following formula.
C1 = (50* number of households electrified/1,000) *12,785 + 8,188* number of transformers
(c) Conversion into annualized cost
Applying the interest rate and service life figures used in Table 5.4.2, the annualized initial cost (Ci) is
as follows.
Ci = (Ch + C1) *annualized cost rate (30 years: 0.088827)
2) Running cost
(a) Maintenance cost
The maintenance cost (Cm) is as follows assuming that it is 2% of the initial cost.
Cm = (Ch + C1) *2%
(b) Transmission and distribution line loss
Assuming that it occupies 12% of the technical loss, the transmission and distribution line loss (Cs)
is as follows.
Cs = amount of power loss *0.046 dollars/kWh
(c) Fuel cost and generation/transmission cost
The fuel and generation/transmission cost (Cb) was calculated by the following equation, based on
the figure of 0.046 dollars per kWh derived from the VRA income from power sales to the NED in
fiscal 2003.
Cb = amount of power sales *0.046 dollars/kWh

5-40
3) On-grid lifecycle cost
Based on the results above, the life cycle cost of on-grid electrification may be expressed as follows.
C = Ci + Cm + Cs + Cb
Figures 5.4.3 - 5.4.5 graph the results for the three northern regions.
0
10,000
20,000
30,000
40,000
50,000
60,000
0 10 20 30 40 50 60 70
Distance from distibution line(km)
Annualized C
ost(
$)
Model1 Model2 Model3
(Source) JICA Study Team
Figure 5.4.3 Annualized cost of on-grid electrification in the Northern Region
0
5,000
10,000
15,000
20,000
25,000
30,000
35,000
40,000
45,000
50,000
0 5 10 15 20 25 30
Distance from distribution line(km)
Annualized c
ost(
$)
Model1 Model2 Model3
(Source) JICA Study Team
Figure 5.4.4 Annualized cost of on-grid electrification in the Upper East Region
0
10,000
20,000
30,000
40,000
50,000
60,000
0 10 20 30 40 50 60
Distance from distribution line(km)
Annualized c
ost(
$)
Model1 Model2 Model3
(Source) JICA Study Team
Figure 5.4.5 Annualized cost of on-grid electrification in the Upper West Region

5-41
5.4.2 Off-grid approach
(1) PV equipment prices
At present, PV equipment is not sold in the open market; specified PV system enterprises sell them
directly to the customers. Equipment prices are set with reference to the specific customer and case.
The enterprises were reluctant to displose their prices for this study. Be that as it may, many PV systems
have been installed in Ghana, and price gaps between suppliers are apparently being diminished. Table
5.4.6 presents PV equipment prices of the RESPRO.
Table 5.4.6 PV equipment prices (RESPRO)
(Source) RESPRO
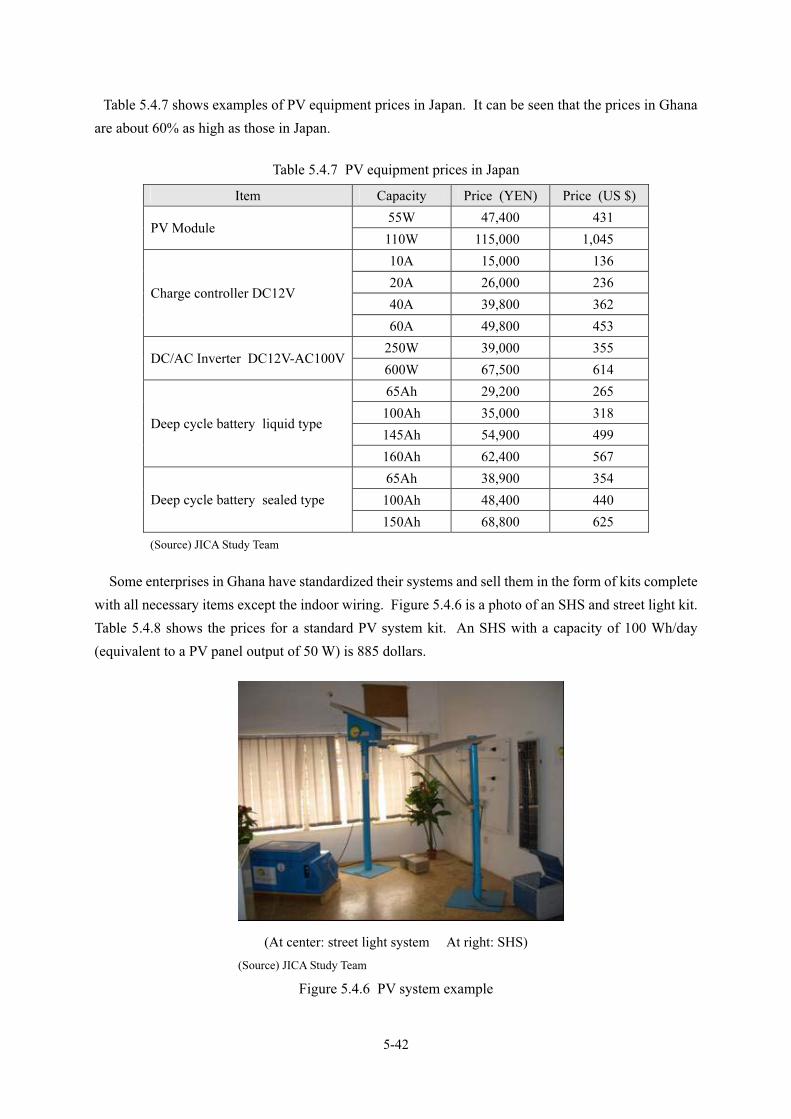
5-42
Table 5.4.7 shows examples of PV equipment prices in Japan. It can be seen that the prices in Ghana
are about 60% as high as those in Japan.
Table 5.4.7 PV equipment prices in Japan
Item Capacity Price (YEN) Price (US $)
55W 47,400 431 PV Module
110W 115,000 1,045
10A 15,000 136
20A 26,000 236
40A 39,800 362 Charge controller DC12V
60A 49,800 453
250W 39,000 355 DC/AC Inverter DC12V-AC100V
600W 67,500 614
65Ah 29,200 265
100Ah 35,000 318
145Ah 54,900 499 Deep cycle battery liquid type
160Ah 62,400 567
65Ah 38,900 354
100Ah 48,400 440 Deep cycle battery sealed type
150Ah 68,800 625
(Source) JICA Study Team
Some enterprises in Ghana have standardized their systems and sell them in the form of kits complete
with all necessary items except the indoor wiring. Figure 5.4.6 is a photo of an SHS and street light kit.
Table 5.4.8 shows the prices for a standard PV system kit. An SHS with a capacity of 100 Wh/day
(equivalent to a PV panel output of 50 W) is 885 dollars.
(At center: street light system At right: SHS)
(Source) JICA Study Team
Figure 5.4.6 PV system example

5-43
Table 5.4.8 PV standard system prices
(Source) JICA Study Team
Ordinarily, deep-cycle batteries are used with PV systems. These batteries carry a high price and are
hard to obtain because they are not handled by regular battery stores. In some cases, PV system and
BCS users instead utilize automobile batteries, which are not exactly suited to PV systems due to their
shallow discharge depth and short life. In light of their low price (about one-third as high as that of
deep-cycle batteries) and ready availability, though, they are thought to be effective for use in the
transitional period before widespread PV system diffusion. Table 5.4.9 shows battery prices in Ghana.
Table 5.4.9 Battery prices
(Note) $1 = 9,000 Cedi
(Sourc) JICA Study Team
(2) PV system models
Calculation of the cost of electrification by means of off-grid PV systems requires an estimate of the
subject facilities and modeling of the systems based on the demand associated with those facilities. The
Study Team performed such modeling on the assumption of the following subject facilities: SHS1
households (with a low demand equivalent to 50W), SHS2 households (with a medium demand
equivalent to 100W), governmental offices, clinics, junior secondary schools, BCS households (with a
demand equivalent to 25W), and BCS stores (with a demand equivalent to 50W). Table 5.4.10 shows
the estimated (forecast) electricity demand for each type of subject facility.
System Price
(US $) note
100Wh/day
SHS system 660
Contain to 25W PV Module DC system
200Wh/day
SHS system 885
Contain to 50W PV Module DC system
400Wh/day
SHS system 1,335
Contain to 100W PV Module DC system
Street light system 1,200 Automatic On-Off
Deep cycle battery Auto motive battery (in Accra)
Capacity US $ Capacity Cedi US $
12V 60Ah 94.00 12V 55Ah 380,000 42.22
12V 100Ah 121.00 12V 66Ah 400,000 44.44
12V 102Ah 152.00 12V 77Ah 450,000 50.00
12V 105Ah 158.00 12V 88Ah 520,000 57.78
12V 170Ah 254.10 12V 120Ah 750,000 83.33
12V 250Ah 375.10 12V 150Ah 950,000 105.56
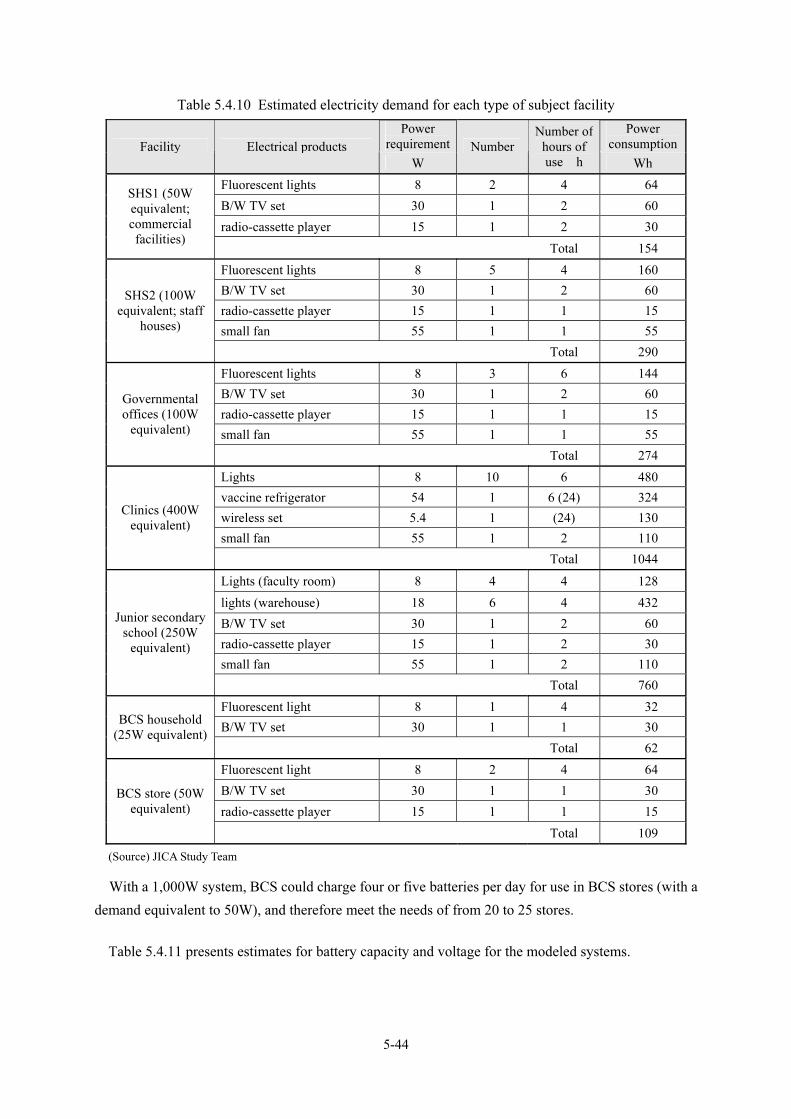
5-44
Table 5.4.10 Estimated electricity demand for each type of subject facility
Power requirement
Power consumptionFacility Electrical products
W
Number Number of
hours of use h Wh
Fluorescent lights 8 2 4 64
B/W TV set 30 1 2 60
radio-cassette player 15 1 2 30
SHS1 (50W equivalent; commercial facilities)
Total 154
Fluorescent lights 8 5 4 160
B/W TV set 30 1 2 60
radio-cassette player 15 1 1 15
small fan 55 1 1 55
SHS2 (100W equivalent; staff
houses)
Total 290
Fluorescent lights 8 3 6 144
B/W TV set 30 1 2 60
radio-cassette player 15 1 1 15
small fan 55 1 1 55
Governmental offices (100W
equivalent)
Total 274
Lights 8 10 6 480
vaccine refrigerator 54 1 6 (24) 324
wireless set 5.4 1 (24) 130
small fan 55 1 2 110
Clinics (400W equivalent)
Total 1044
Lights (faculty room) 8 4 4 128
lights (warehouse) 18 6 4 432
B/W TV set 30 1 2 60
radio-cassette player 15 1 2 30
small fan 55 1 2 110
Junior secondary school (250W
equivalent)
Total 760
Fluorescent light 8 1 4 32
B/W TV set 30 1 1 30 BCS household
(25W equivalent) Total 62
Fluorescent light 8 2 4 64
B/W TV set 30 1 1 30
radio-cassette player 15 1 1 15
BCS store (50W equivalent)
Total 109
(Source) JICA Study Team
With a 1,000W system, BCS could charge four or five batteries per day for use in BCS stores (with a
demand equivalent to 50W), and therefore meet the needs of from 20 to 25 stores.
Table 5.4.11 presents estimates for battery capacity and voltage for the modeled systems.

5-45
Table 5.4.11 Estimates for battery capacity and voltage in the modeled systems
System PV Capacity Battery Capacity Load Voltege
SHS 1 50W 60Ah 12V-DC
SHS 2 100W 170Ah 220V-AC
Office 100W 100Ah 12V-DC
Clinic system 400W 680Ah 220V-AC
School system 250W 340Ah 220V-AC
BCS (1,000W) 1,000W 80~120Ah×4batteries/day 12V-DC
(Source) JICA Study Team
(3) Off-grid PV electrification cost
Table 5.4.12 shows calculation results for the cost of installation of the PV systems modeled in
accordance with the demand forecast, based on the cost of PV system equipment in Ghana. For the
installation cost per W of PV system output, the calculation yielded figures of about 12 dollars for the
SHS1 50W system, 12 dollars for the SHS2 100W system, 20 dollars for the clinic system, 10 dollars for
the school system, and 6 dollars for the BCS system. It is therefore thought that the BCS system would
be the least costly.
Table 5.4.12 Cost of off-grid PV electrification
Item Qty. unit Sub total
PV module 50Wp 1 260.2 260.2
Charge Regulator 20A 1 106.5 106.5
SHS 1 Deep Cycle Battery 60Ah 1 94.0 94.0
(50W) Lamp-Fluorescent or CFL 8W 2 1.7 3.4
installtion, wiring 1 100.0 100.0
Metal Mounting Structure 1 39.9 39.9
TOTAL 604.0
Item Qty. unit Sub total
PV module 100Wp 1 486.4 486.4
Charge Regulator 10A 1 79.9 79.9
SHS 1 Deep Cycle Battery 170Ah 1 254.1 254.1
(100W) Inverter 250W 1 229.9 229.9
Lamp-Fluorescent or CFL 8W 5 1.7 8.5
installtion, wiring 1 100.0 100.0
Metal Mounting Structure 1 39.9 39.9
TOTAL 1198.7
Item Qty. unit Sub total
PV module 100Wp 1 486.4 486.4
Charge Regulator 10A 1 79.9 79.9
Office Deep Cycle Battery 100Ah 2 121.0 242.0
(100W) Lamp-Fluorescent or CFL 8W 3 7.3 21.9
installtion, wiring 1 100.0 100.0
Metal Mounting Structure 1 39.9 39.9
TOTAL 970.1

5-46
Item Qty. unit Sub total
PV module 100Wp 4 486.4 1945.6
Charge Regulator 20A 1 106.5 106.5
Charge Regulator 10A 2 79.9 159.8
Clinic Vaccine Refrigerator WHO standard 1 3932.5 3932.5
(400W) Deep Cycle Industrial battery 170Ah 4 254.1 1016.4
Inverter 250W 2 229.9 459.8
Lamp-Fluorescent or CFL 8W 10 1.7 17.0
installtion, wiring 1 300.0 300.0
Metal Mounting Structure 4 39.9 159.6
TOTAL 8097.2
Item Qty. unit Sub total
PV module 100Wp 2 486.4 972.8
PV module 50Wp 1 260.2 260.2
Charge Regulator 20A 1 106.5 106.5
JSS Deep Cycle Battery 170Ah 2 254.1 508.2
(250W) Inverter 250W 1 229.9 229.9
Lamp-Fluorescent 18W 6 3.3 19.8
Lamp-Fluorescent or CFL 8W 4 1.7 6.8
B/W TV set 1 40 40.0
installtion, wiring 1 200.0 200.0
Metal Mounting Structure 3 39.9 119.7
TOTAL 2463.9
Item Qty. unit Sub total
PV module 50Wp 4 260.2 1040.8
BCS PV module 100Wp 8 486.4 3891.2
(1000W) Charge Regulator 20A 4 106.5 426.0
installtion, wiring 1 400.0 400.0
Metal Mounting Structure 8 39.9 319.2
TOTAL 6077.2
(Source) JICA Study Team
Generally speaking, the service life is about 20 years for PV panels, five years for deep-cycle batteries,
ten years for charge controllers and inverters, and 20 years for cables. On this basis, the Study Team
made a calculation of the annual cost for each type of PV system over its service life, assuming a facility
operating life of 20 years and annual cost factor of 0.102. In addition, the calculation for BCS assumed
an operating personnel cost of 30 dollars per month. The results are shown in Table 5.4.13.

5-47
Table 5.4.13 Annual cost for each type of PV system
System PV Capacity Initial Spare Total Service/year annual cost
SHS 1 50W 604 388 992 0 101
SHS 2 100W 1,199 1,072 2,271 0 232
Office 100W 970 806 1,776 0 181
Clinic 400W 8,097 7,707 15,804 0 1,612
School 250W 2,464 1,860 4,324 0 441
BCS 1 1,000W 6,077 9,600 15,677 360 1,959
BCS 2 2,000W 12,154 19,200 31,354 360 3,558
BCS 3 3,000W 18,231 28,800 47,031 360 5,157
BCS 4 4,000W 24,308 38,400 62,708 360 6,756
BCS 5 5,000W 30,385 48,000 78,385 360 8,355
* Figures for BCS include the cost of 88-ampere-hour batteries owned by residents and business proprietors (58 dollars per household).
(Source) JICA Study Team
The Study Team estimated the yearly generated output of each model system and used the findings to
calculate the cost per kWh for each. The results are shown in Table 5.4.14 and Figure 5.4.7.
While the cost per kWh of output varies with the system, comparison of systems of the same type (e.g.,
the SHS DC system) shows that this cost declines as the capacity rises. The trend for BCS shows that
the cost per kWh of output declines in a hyperbolic curve as capacity increases. This indicates that
efforts to expand system capacity and curtail annual costs would have less effect once a certain level of
capacity is exceeded.
BCS have the lowest cost per kWh in spite of their need for operators. It is thought that a 5-kW BCS
could handle aboout 20 batteries per day, and that the operation of BCS with a larger capacity would
require additional personnel to operate. A 5-kW BCS could accommodate about 100 households with a
demand on the SHS1 level (equivalent to a PV system with a capacity of 50W), and could be termed an
efficient approach to electrification when customers (households) are clumped together.
Table 5.4.14 Power generation
System PV Capacity annual cost annual kWh $/kWh $/Wp
SHS 1 50W 101 56 1.800 2.024
SHS 2 100W 232 106 2.188 2.316
Office 100W 181 100 1.811 1.812
Clinic 400W 1,612 381 4.230 4.030
School 250W 441 277 1.590 1.764
BCS 1 1,000W 1,959 796 2.462 1.959
BCS 2 2,000W 3,558 1,591 2.236 1.779
BCS 3 3,000W 5,157 2,387 2.160 1.719
BCS 4 4,000W 6,756 3,183 2.123 1.689
BCS 5 5,000W 8,355 3,979 2.100 1.671
(Source) JICA Study Team

5-48
0.00
0.50
1.00
1.50
2.00
2.50
3.00
3.50
4.00
4.50
SHS 1 SHS 2 Office Clinic School BCS 1 BCS 2 BCS 3 BCS 4 BCS 5
$/Wp
(Souce) JICA Study Team
Figure 5.4.7 Unit generation cost for each system
(4) PV system electrification cost for the purpose of comparing community electrification costs
The electrification cost calculation in the preceding section envisioned the case of ordinary PV
system projects, i.e., certain electrical products such as lights and refrigerators, and indoor distribution
wiring. Cost comparison with on-grid electrification, however, requires an alignment of bases. The
Study Team therefore considered the situation when the equipment cost is excluded.
A calculation was made of the off-grid (PV) electrification cost in the case of the standard community
(demand) model prepared from the findings of the village study in order to compare the community
electrification costs of on-grid and off-grid systems. Table 5.4.15 presents the makeup of the standard
demand model, and Table 5.4.16, the conditions applied in the cost calculation.

5-49
Table 5.4.15 Standard demand model (the bold enclosure indicates off-grid electrification)
Share of the total
number of communities
Off-grid On-grid
Demand pattern 1 (Population = 500)
91.74% (communities with a population of less
than 1,000)
* Households: 25 W x 10 households (BCS use); 23 kWh/year x 10 households) * Commercial facilities: 50 W x 3 facilities (BCS use); 40 kWh/year x 3 facilities * Grain mills: none * Clinics: none * JSS: none * Offices: none * Staff houses: none
* Households: 107 W x 10 households; 480 kWh/year x 10 households * Commercial facilities: 50 W x 3 facilities (BCS use); 40 kWh/year x 3 facilities * Grain mills: none * Clinics: none * JSS: none * Offices: none * Staff houses: none * 50-kVA transformers: 1
Demand pattern 2 (Population = 2,000)
7.55% (communities with
a population of 1,000 - 4,999)
* Households: 25 W x 40 households (BCS use); 23 kWh/year x 40 households) * Commercial facilities: 50 W x 13 facilities (BCS use); 40 kWh/year x 13 facilities - 50 W x 3 facilities (SHS); 56 kWh/year x 3 facilities * Grain mills: none * Clinics: 400 W x 1 * JSS: 250 W x 1; 277 kWh/year x 1 facility * Offices: 100 W x 1; 100 kWh/year x facility * Staff houses: 100 W x 7; 106 kWh/year x 7 facilities
* Households: 107 W x 60 households; 535.6 kWh/year x 60 households) * Commercial facilities: 195.7 W x 15 facilities; 715.5 kWh/year x 15 facilities * Grain mills: 20,000 W x 1; 58,400 kWh/year x 1 * Clinics: 280 W x 1; 1,272 kWh/year x 1 * JSS: 110.5 W x 1; 321.3 kWh/year x 1 * Offices: 107 W x 1; 535.6 kWh/year x 1 * Staff houses: none * 50-kVA transformers: 1
Demand pattern 3 (Population = 5,000)
0.71% (communities with
a population of 5,000 or more)
* Households: 25 W x 100 households (BCS use); 23 kWh/year x 100 households) * Commercial facilities: 50 W x 31 facilities (BCS use); 40 kWh/year x 31 facilities - 50 W x 6 facilities (SHS); 56 kWh/year x 6 facilities * Grain mills: none * Clinics: 400 W x 1; 381 kWh/year x 1 facility * JSS: 250 W x 2; 277 kWh/year x 2 facilities * Offices: 100 W x 1; 100 kWh/year x 1 facility * Staff houses: 100 W x 10; 106 kWh/year x 10 facilities
* Households: 107 W x 150 households; 535.6 kWh/year x 150 households) * Commercial facilities: 195.7 W x 38 facilities; 715.5 kWh/year x 38 facilities * Grain mills: 20,000 W x 2 facilities; 58,400 kWh/year x 2 * Clinics: 280 W x 1; 1,272.7 kWh/year x 1 * JSS: 110.5 W x 2; 321.3 kWh/year x 2 * Offices: 107 W x 1; 535.6 kWh/year x 1 * Staff houses: none * 50-kVA transformers: 2
(Source) JICA Study Team
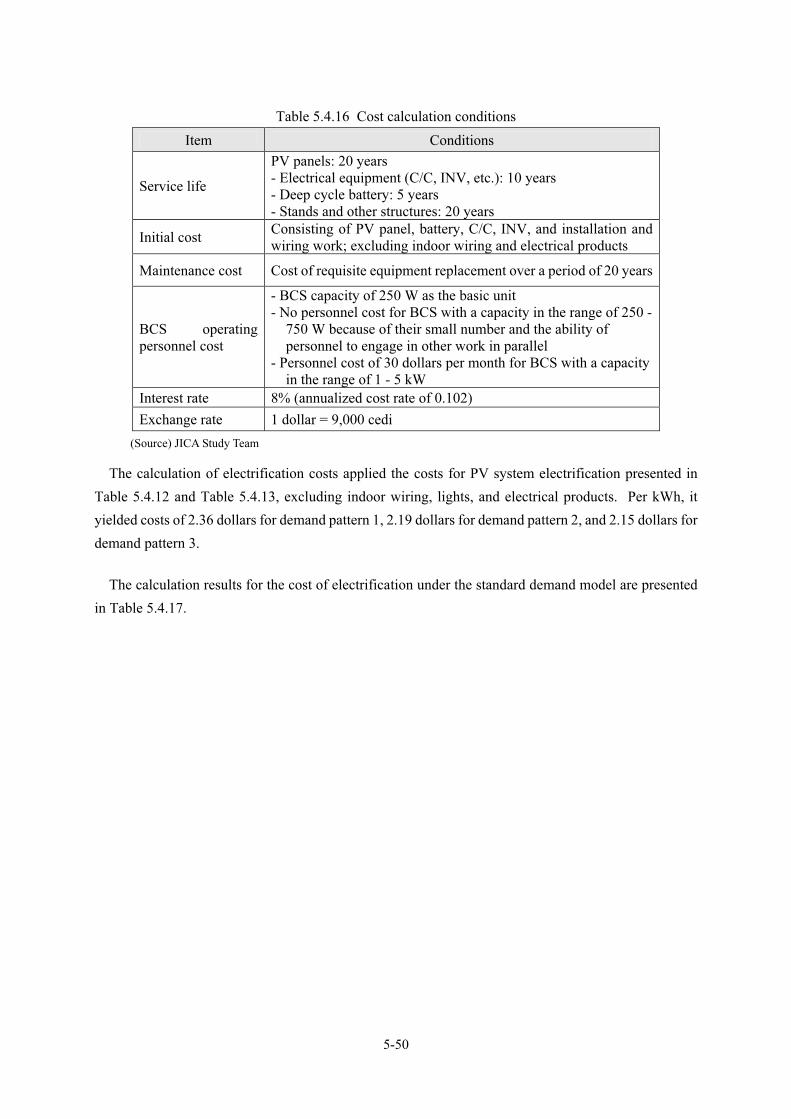
5-50
Table 5.4.16 Cost calculation conditions
Item Conditions
Service life
PV panels: 20 years - Electrical equipment (C/C, INV, etc.): 10 years - Deep cycle battery: 5 years - Stands and other structures: 20 years
Initial cost Consisting of PV panel, battery, C/C, INV, and installation and wiring work; excluding indoor wiring and electrical products
Maintenance cost Cost of requisite equipment replacement over a period of 20 years
BCS operating personnel cost
- BCS capacity of 250 W as the basic unit - No personnel cost for BCS with a capacity in the range of 250 -
750 W because of their small number and the ability of personnel to engage in other work in parallel
- Personnel cost of 30 dollars per month for BCS with a capacity in the range of 1 - 5 kW
Interest rate 8% (annualized cost rate of 0.102)
Exchange rate 1 dollar = 9,000 cedi
(Source) JICA Study Team
The calculation of electrification costs applied the costs for PV system electrification presented in
Table 5.4.12 and Table 5.4.13, excluding indoor wiring, lights, and electrical products. Per kWh, it
yielded costs of 2.36 dollars for demand pattern 1, 2.19 dollars for demand pattern 2, and 2.15 dollars for
demand pattern 3.
The calculation results for the cost of electrification under the standard demand model are presented
in Table 5.4.17.

5-51
Table 5.4.17 Electrification costs under the standard demand model
(Unit: dollars)
Demand model Nu
m.
Power
(kWh) Initial
Maintenanc
e/20 years
Annualized
cost
Operating
cost/year
Yearly
cost
Cost/
kWh
Households(BCS25W)
10 226.3 420 2940 342.7 0 342.7
Commercial facilities(BCS50W)
3 119.4 174 1218 142.0 0 142.0
*BCS 2 - 3038 212 331.5 0 331.5
Demand pattern 1 (population: 500)
Subtotal 345.7 3632 4370 816.2 0 816.2
2.36
Households(BCS25W)
40 905.2 1680 11760 1370.9 0 1370.
9
Commercial facilities(SHS50W)
3 168.6 1653 1164 287.3 0 287.3
Commercial facilities(BCS50W)
13 517.2 754 5278 615.3 0 615.3
Clinics 1 381.1 3998 3774 792.7 0 792.7
JSS 1 277.4 2297 1860 424.0 0 424.0
Offices 1 100.0 898 806 173.8 0 173.8
Staff houses 7 741.0 7980 7504 1579.4 0 1579.
4
*BCS 7 - 10633 742 1160.3 360 1520.
3
Demand pattern 2 (population:
2,000)
Subtotal 3090.5 29893 32888 6403.7 360 6763.
7
2.19
Households(BCS25W)
100 2263.0 4200 29400 3427.2 0 3427.
2
Commercial facilities(SHS50W)
6 337.3 3306 2328 574.7 0 574.7
Commercial facilities(BCS50W)
31 1233.3 1798 12586 1467.2 0 1467.
2
Clinics 1 381.1 3998 3774 792.7 0 792.7
JSS 2 554.8 4594 3720 848.0 0 848.0
Offices 1 100.0 898 806 173.8 0 173.8
Staff houses 10 1058.5 11400 10720 2256.2 0 2256.
2
*BCS 17 - 25823 1802 2817.8 360 3177.
8
Demand pattern 3 (population:
5,000)
Subtotal 5928.0 56017 65136 12357.6 360 12717
.6
2.15
** The assumptions for BCS batteries were as follows. 25-W: 55 Ah (42 dollars) - 50-W: 88 Ah (58 dollars)
(Source) JICA Study Team
5.4.3 Demarcation based on cost analysis
For cost comparison, the Study Team made assessments in terms of kWh taking account of the hours
of electrical product use. Cost comparison between on- and off-grid electirficaiton, however, must be
done on the same basis (e.g., off-grid electirificaion includes inhouse wiring, but on-grid electrificaiotn

5-52
does not). The Study Team therefore considered the situation when the equipment cost is excluded for
PV systems.
In the case that there are no other communities on the route (SHEP)
Figure 5.4.8 shows the point of division between the on- and off-grid systems when there are no other
communities on the route.
Under demand model 1, the most prevalent one in the northern regions, PV power generation would
be more economical than extension of the grid as a means of electrifying communities that are more than
about 14km away from the grid. Even in this case, however, cost exceeds 2 dollars per kWh. On-grid
electrification would be preferable for electrification of communities with demand pattern 2 or 3.
0
0.5
1
1.5
2
2.5
3
0 10 20 30 40 50
Distance from existing grid (km)
Cost($/kWh)
Model 1 grid Model 2 grid Model 3 grid
Model 1 PV Model 2 PV Model 3 PV
(Source) JICA Study Team
Figure 5.4.8 On- and off-grid costs of electrification in the three northern regions
(In the case that there are no other communities on the route)
In the case that all communities on the route are electrified
Figure 5.4.9 shows the calculation results in the event of electrification of all communities. On-grid
electrification is more economical for demand models 2 and 3, and would also be preferable for demand
pattern 1 up to a distance of 36km.
Even for communities with demand model 1 that are about 5km away from the existing grid, however,
on-grid electrification would cost about 1 dollar per kWh. As such, extensive electrification would have
to be preceded by full studies of measures in the institutional aspect, such as the setting of tariffs by the
NED, curtailment of maintenance costs, and instatement of subsidies as necessary.
In the northern regions, the electrification cost per kWh therefore becomes very high due to the small
demand associated with the communities. RE promotion must proceed on the basis of a master plan that
combines on- and off-grid approaches.
14.2km
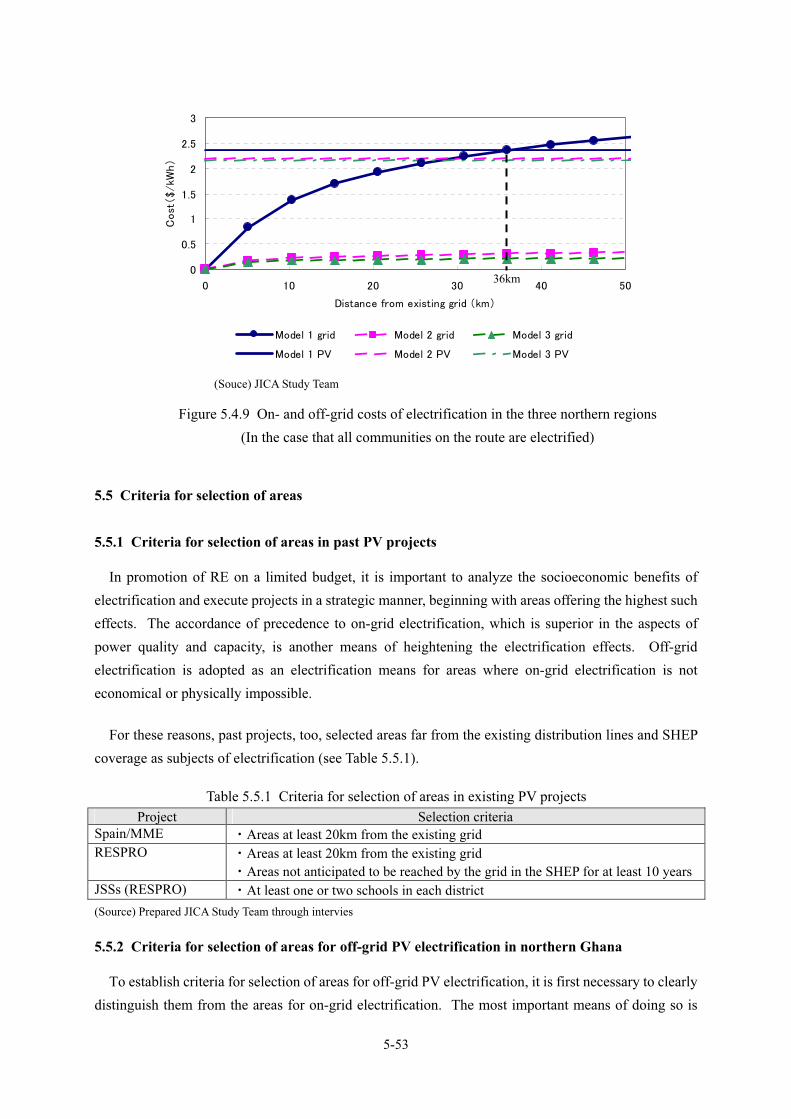
5-53
0
0.5
1
1.5
2
2.5
3
0 10 20 30 40 50
Distance from existing grid (km)
Cost($/kWh)
Model 1 grid Model 2 grid Model 3 grid
Model 1 PV Model 2 PV Model 3 PV
(Souce) JICA Study Team
Figure 5.4.9 On- and off-grid costs of electrification in the three northern regions
(In the case that all communities on the route are electrified)
5.5 Criteria for selection of areas
5.5.1 Criteria for selection of areas in past PV projects
In promotion of RE on a limited budget, it is important to analyze the socioeconomic benefits of
electrification and execute projects in a strategic manner, beginning with areas offering the highest such
effects. The accordance of precedence to on-grid electrification, which is superior in the aspects of
power quality and capacity, is another means of heightening the electrification effects. Off-grid
electrification is adopted as an electrification means for areas where on-grid electrification is not
economical or physically impossible.
For these reasons, past projects, too, selected areas far from the existing distribution lines and SHEP
coverage as subjects of electrification (see Table 5.5.1).
Table 5.5.1 Criteria for selection of areas in existing PV projects
Project Selection criteria
Spain/MME ・Areas at least 20km from the existing grid
RESPRO ・Areas at least 20km from the existing grid
・Areas not anticipated to be reached by the grid in the SHEP for at least 10 years
JSSs (RESPRO) ・At least one or two schools in each district
(Source) Prepared JICA Study Team through intervies
5.5.2 Criteria for selection of areas for off-grid PV electrification in northern Ghana
To establish criteria for selection of areas for off-grid PV electrification, it is first necessary to clearly
distinguish them from the areas for on-grid electrification. The most important means of doing so is
36km

5-54
comparison of the costs of the two. Areas where on-grid electrification is impossible due to cost factors
ought to be designated for off-grid electrification. The continued promotion of on-grid electrification
under the SHEP requires the sharing of information within the MOE and clear definition of the border
between the two.
In ordering the areas to be electrified with PV systems in terms of priority, precedence must be
accorded to the public facilities whose electrification is being pursued by the government (i.e., health
centers, clinics, CHIPS compounds, junior secondary schools, and police stations). The criteria also
must incorporate size of population as an indicator because it is a key determinant of the number of
households, number of commercial facilities, and level of economic activity. Table 5.5.2 shows the
items to be considered in establishing criteria for area selection.
Table 5.5.2 Items to be considered in establishment of standards for area selection
Items Comments
Areas that cannot be electrified by extension of the grid
・Outlying islands, etc.
Policy/technical decisions ・Areas that cannot be reached by SHEP for at
least 10 years
Technical aspect
Cost comparison with on-grid electrification
・Distance from existing distribution line
Number of public facilities
・Medical facilities, educational facilities, etc.
・ Weighting in correspondence with facility
importance Socioeconomic aspect Population (number of
households and commercial facilities)
・Population as an indicator of the level of
economic activity
(Source) JICA Study Team
For quantitative expression of the various items in the socioeconomic aspect, the Study Team
proposes the preparation of a score sheet like that shown in Table 5.5.3. Each item would be weighted
by allotting a certain number of points in correspondence with its importance, and communities would
be scored by adding up the subtotals for the items they contain, with a perfect score being 100. Finally,
communities would be ranked on the basis of their score.
Table 5.5.3 Score sheet for standards for area selection (draft)
* Health ClinicHealth
Centre
Chips
Compound
30 30 30 15
EducationJ.Secondary
School
Primary
School
30 30 -
Police
Border Post
Police
Border Post
10 10
PopulationBeyond
5000
2000~
5000
1000~
2000
~
1000
30 30 20 10 5
Total Score 100
* Maximum 30 Points
Num. of Public
Facilities
(70)
Num. of Population
(Households)
(30)
(Source) JICA Study Team
5-55
5.6 Business model for PV system diffusion
5.6.1 Identification and analysis of issues in past PV projects
Promotion of off-grid PV electrification requires the selection of business models grounded in
schemes (for funding, payment, and O&M) that are adapted to the national and local socioeconomic
situation. Based on the lessons learned through the review of past PV electrification projects and the
field surveys, this section sets forth and analyzes the problems and issues as viewed from the three
aspects of the overall organizational scheme, type of customer, and business model.
(1) Identification of problems and tasks regarding the overall organizational scheme
As was pointed out in the review of past PV electrification projects, various problems can arise in the
organizational aspect. In the planning stage, there are problems that cause difficulties after
implementation due to a mismatch with the on-grid program (SHEP) or lack of basic consensus.
Once projects start, there can surface problems in respect of O&M and charge collection. The surest
way is to have these duties performed by the project principal itself, but this drives up operating costs
and squeezes earnings. When these duties were left to local governments and communities, however,
projects became insolvent because of low levels of skill and ethics among operators.
Yet other problems are associated with factors such as customer ability to pay and inclinations to
perform O&M. Table 5.6.1 summarizes these problems and the tasks to address them.

5-56
Table 5.6.1 Problems and tasks related to the organizational setup
Problems in past projects Issuess identified from the problems
・Due to a mismatch with the SHEP, the grid reached the
community soon after the installation of PV systems, which consequently had to be relocated.
・Conformance with the SHEP
Planning ・Problems occurred in O&M and collection of charges
because the project principal did not fully explain things to the concerned parties in advance.
・Full advance explanation to and building of a
consensus among all concerned parties before the project begins
・Operating costs were driven up by the large service area
and lack of enough O&M support.
・Supporting setup in the vicinity of the electrified
area (e.g., an initial management setup in the community)
・The community resident selected to perform O&M did
not have enough technical skill and was unable to solve problems.
・Technical instruction for community managers
・Management by customers themselves O&M
・In the case of public facility systems, the district and
national governmental outpost offices responsible for O&M did not fully discharge this role.
・Ownership by the party managing the public
facility
・Costs were unable to be retrieved in fee-for-service
schemes because the tariffs were set on low levels, on a par with the lifeline tariffs in grid service.
・Setting of tariffs on levels enabling retrieval of
costs
・Provisions for subsidies
・ Imposition of partial beneficiary (customer)
burden for equipment
Setting of tariffs and
loan repayment ・Loans were made to residents who had low income levels
and could not repay them. The loans were unable to be recovered.
・Resident payment ability
・The surest way is to have the project principal collect the
charges itself, but this drives up operating costs and squeezes earnings.
・Efficient charge collection
・When community residents were assigned to collect
charges, they sometimes were unable to take a tough stance because of ties of blood, or pocketed payments themselves.
・Transparency in charge collection Collection of
charges
・Because many residents are farmers who do not have a
steady income, payments were sometimes made in lump sums at irregular intervals.
・Flexibility in the scheme for collection of charges
・In spite of non-payment, customers refused to allow their
systems to be removed.
・ Making of rules regarding system use and
advance agreement on them
Customers ・In the case of systems in public facilities, breakdowns
were left unrepaired because the users did not have a good understanding of the system ownership and O&M setup.
・System ownership
(Source) prepared by the JICA Study Team
(2) Identification of problems and issues in each customer category
Methods of power use and management, and ability to share the cost burden, vary with the customer
needs and type (e.g., private- versus public-sector use). Each of these matters should be handled
separately.
In the private sector, households in the northern regions tend to be poor. Many cannot afford
payments for systems beyond the level of power for lights. Their O&M capabilities are also generally
low. Commercial facilities, in contrast, have a cash income and the ability to own and maintain systems
to a certain extent.
In the public sector, there are strong needs for electrification of medical and education facilities. The

5-57
MOH is particularly eager to have such facilities electrified and is appropriating budget of its own for
this purpose. In spite of this, in many cases, systems go out of order because proper arrangements have
not been made for O&M by the facility staff. Table 5.6.2 summarizes the electrification needs, problems,
and tasks in each category of demand type and customer.
Table 5.6.2 (1) Problems and issues in each customer category for public sector
Medical facilities Schools Water use Other
Latent needs
・Strong needs for power
for lights, vaccine
refrigerators,
communications, and
other items that can have a
direct bearing on human
life
・Needs for lights for night
classes
・Difference of opinion on
the need for lights to
assure time for study at
night
・Needs for simple water
supply facilities to
provide hygienic drinking
water
・Needs for use of irrigation
pumps to increase
farming productivity
・Strong needs for staff
house electrification to
attract nurses and teachers
・Needs for electrification
of community halls and
other places where people
gather
Probl-ems
・The MOH recognizes the
need for electricity, and
the cost burden would
presumably present little
difficulty.
・However, it is unlikely
that funding could cover
costs down to the smallest
medical facilities.
・There is not a solid
agreement on installation
of PV systems even at
country schools at
national expense.
・In the case of water
supply facilities, it is not
clear whether the cost
burden should be borne by
the user or by the
manager. The cost is not
shared.
・Costs of staff house
electrification could be
paid from wages.
・The cost burden for
community halls would
have to be clearly defined.Ability
to assume a cost burden
Issues
・Appropriation of budget
for electrification and
O&M costs
・Possibility of defrayment
of power charges with
treatment fees and related
subsidies
・Appropriation of budget
for electrification and
O&M costs
・Clear statement of
perspectives on cost and
benefit related to water
use
・Staff houses: heightening
of the customer awareness
of staff
・Community halls: clear
statement of parties who
must shoulder the cost
burden
・Personnel have a higher
level of knowledge than
on the household level,
and there are fewer
difficulties deriving from
a lack of basic knowledge.
They are also capable of
performing simple O&M.
・Personnel have a higher
level of knowledge than
on the household level,
and there are fewer
difficulties deriving from
a lack of basic knowledge.
They are also capable of
performing simple O&M.
・There is a problem with
theft because many panels
are installed in open
space.
・There are needs, but
parties responsible for
O&M must be clearly
defined.
Probl-ems
・In some cases, problems cannot be solved because
managers do not know who to contact.
・The systems are special
and require a high level of
technical skill.
O&M ability
Issues
・Reinforcement of
arrangements for
communication between
the local staff and
managers
・Reinforcement of
arrangements for
communication between
the local staff and
managers
・Need for construction of
an O&M setup for the
community (as the
beneficiary)
・Need for construction of
an O&M setup for the
community (as the
beneficiary)
Probl-ems
・Much depends on the awareness and technical skills of
the managers.
・In the case of water facilities and community halls,
matters depend on the degree of need for systems.
Tasks Aware-ness of owner-
ship
Issues ・Incentives to increase the
level of treatment through
electrification
・Incentives to increase the
level of treatment through
electrification
・Need for management by an O&M committee or other
facility management committee

5-58
Table 5.6.2 (2) Problems and issues in each customer category for private sector
Households Commercial facilities
Latent needs
・ Lights and radios on the average
・Doubtful whether residents of poor unelectrified
communities see electrification as the top priority
・Existence of demand on the order of 100W
systems or installation of several systems (for lights, radios, TV sets)
・Strong needs to heighten added value in business
Probl-ems
・In the northern regions, income levels are
generally low and many residents lack disposable income except at harvest time.
・The lifeline tariff (about 2 dollars per month) may
be regarded as a benchmark.
・In spite of the general povery, stores and bars have
a cash income.
・There are some systems with a capacity above 100
Wp, and there is no need for tariffs to be held to the lifeline level.
Ability to
assume a cost burden
Issues
・Aid for low-income residents through investment
of public funds
・Recovery of funds through the fee-for-service
model applied by the RESPRO
・Possibility of assumption of the cost burDENGiven
the existence of a cash income and recognition of incentives based on electrification
・Households lack basic knowledge, and this causes
many problems in equipment use; they could not be expected to manage systems themselves.
・Commercial facilities also lack the basic
knowledge, but are highly motivated to learn because of the direct connection with income. Probl-
ems ・Even if management is transferred to the community, problems often occur due to the low level of
manager skills.
O&M ability
Issues ・Increase in the O&M awareness and technical
level of users
・Advantage due to existence of a cash income and
incentive for electrification
Probl-ems
・There is little awareness of ownership because
past projects were executed with grant aid.
・Sense of ownership is generally high due to the
direct connection with income. Aware-ness of owner-
ship Issues ・Measures to heighten the ownership awareness
(Source) prepared by the JICA Study Team
(3) Business model problems and issues
In Ghana, past pilot projects applied the fee-for-service model (in which the business principal owns
the system and collects service fees from the customer) and outright sales (based on cash or loans)
model. Each of these models has its own problems.
This section views the problems and issues related to business models. The RESPRO fee-for-service
model is saddled with two major problems of feasibility. One is the tariff, which is on the level of the
lifeline tariff (2 dollars per month) and makes it impossible to recover costs. The other is the problem of
operating costs due to the provision of technical services and scheme for collection of charges by the
enterprise itself.
In outright sales, cash payment is the ideal, but it would not be realistic in the northern regions, where
most households are poor, except in the case of certain wealthy customers and stores. In outright sales
based on loans, there are problems deriving from the need to set up a scheme of financing for lump-sum
reserves by dealers and for loans. In addition, difficulties are likely to be encountered in arrangements
for O&M due to vagueness about the locus of ownership. Table 5.6.3 shows the problems and issues as
viewed from the perspective of business models.

5-59
Table 5.6.3 Business model problems and issues
Fee-for-service (RESPRO) Outright sales (loan) Outright sales (cash)
Overall
・Recovery of cost through a power
tariff scheme patterned after that of utilities
・Provision of loans to customers
unable to purchase systems with cash
・Problem of ownership ascription
until loans are completely repaid
・Direct sale of systems
costing a few hundred dollars; applicable only for affluent customers
O&M
・Establishment of offices in the
northern regions for direct performance of O&M
・Little technical trouble, but high
operating cost
・Occurrence of problems related
to response in the event of breakdown and contract cancellation due to the vagueness about ownership
・Performance of O&M by the
customer or through consignment to the community
・System condition dependent on
the skills of customers and commissioned technicians
・Easy receipt of service
because the customers have cash
Payment of charges
and repayment
of loans
・Inability to retrieve costs because
of the constraints of the lifeline tariff (2 dollars/month)
・High operating cost due to the
direct collection of charges (at the same time as O&M)
・ Lack of establishment of
financing schemes for dealers
・Lack of repayment ability on the
part of most residents
・Susceptibility to the influence of
exchange rates and inflation
・ Difficulty of
expanding the business because of the lack of arrangements for financing for dealers
(Source) prepared by the JICA Study Team
5.6.2 Issues to be considered for improvement
Studies aimed at identifying PV electrification business models applicable in the northern regions
must clarify the principals to engage in the business, the manner of promoting the business, and the
requirements for customers. This section summarizes the items to be considered by the concerned
parties for improvement as regards the issues noted above.
(1) Project principals (who shall undertake projects?)
The principal executing projects differs depending on the socioeconomic purpose of power use and
scale of electrifiction. The national government promotes the electrification of public facilities, but
would find it difficult to operate projects by itself, and should rely on local power and communities for
O&M performance. When power utilities embark on PV business, they must consider the existing tariff
scheme and arrangements for grid customers. ESCOs and dealers must select realistic business models
enabling retrieval of costs. Depending on the payment abilities of the residents, options should not be
confined to SHS but include BCS, which entail less business risk.
Table 5.6.4 presents the prospective PV electrification project principals and their characteristics.

5-60
Table 5.6.4 Prospective PV business principals and their characteristics
Principal Applicable project Characteristics
National government
・ Electrification projects in certain sectors
(education and health)
・Need for involvement by outpost agencies on the
regional and district levels because it would be, in effect, impossible for the competent national authority (ministry) to execute projects directly
・Need to make arrangements for on-site O&M
Local governments
and communities
・The key entities for O&M and collection of
charges, but may possibly be positioned as project principals
・Need for the appropriate technical skills and assurance
of the transparency of charge collection.
Utilities
・Implementation of off-grid PV electrification
as well as on-grid electrification
・ Possibility to implement relatively larger size of
installatins because of sufficient financial and human resources
・Need for conformance with on-grid tariffs
・Need to win customer consent as regards differences
between on- and off-grid power
ESCOs
・Execution of O&M and charge collection
rooted in the community to a certain extent (this approach is also applied by the RESPRO)
・This type also applicable for BCS operation as
well as SHS
・Not commercially viable under the RESPRO model
because of the lifeline tariff constraint
・Need for alleviation of operating risks by having
customers assume the burden for batteries, as in the case of BCS
Dealers
・Sale of equipment directly by dealers, with
contract-based O&M
・BCS operation as another option
・High business risks attached to non-cash sales because
of the lack of a scheme of financing for dealers 11。
・Installation of systems for governmental facilities as the
main market; business not yet on commercial footing
on the private-sector basis。
(Source) prepared by the JICA Study Team
(2) Selection of business models
There are three basic types of model for the operation of off-grid PV systems: fee-for-service, outright
sales (cash), and outright sales (loan). The fee-for-service model is thought to be difficult to apply under
the current status of lifeline tariff application. Outright sale requires the development of customers with
the purchasing potential (although it also depends on arrangements for financing). Table 5.6.5 presents
the characteristics of each business model.
Table 5.6.5 Prospective PV business models and their characteristics
Principal Characteristics and issues Measures
Fee-for-service
・Not viable as a business under the current
lifeline tariff scheme
・Need for study of ways to alleviate operating risks, such
as having customers share the cost burden for the equipment and electrification by BCS
Outright sales (loans)
・Existence of poverty preventing payment
even with loans in the northern regions
・Bank scheme not strong enough to provide
security for loans
・Study of financing for customers with a certain degree of
cash income, such as commercial facilities
Outright sales (cash)
・Applicable for few customers in the civil
sector, considering the poverty in the northern regions
・Possibly applicable for customers in areas
not covered by the SHEP, near cities
・ Development of customers capable of purchasing
equipment on the order of batteries in spite of their poverty
・Coordination with governmental projects
(Source) prepared by the JICA Study Team
(3) Requirements for customers
11 While training local installers, DENG Engineering is attempting to expand the market and lower business risks by having
them sell equipment as well (at first leaving small lots to them).

5-61
Customers utilizing off-grid power naturally have the obligation to pay for the services received, and
also must perform O&M for the systems to a certain extent. The following five items may be cited as the
minimum requisite conditions to be met by customers.
� Possession of a firm grasp of electrification needs (lighting, etc.)
� Existence of a cash income large enough for purchase of equipment on the order of batteries at
the least
� Acquisition of the minimum requisite knowledge regarding battery maintenance and handling
of lights
5.6.3 Proposal of business models for off-grid PV electrification
Table 5.6.6 sets forth the possibilities in respect of the business principals and models in the Northern
Part of Ghana at present, based on the problems identified and analyzed in the preceding sections.
Models thought to be particularly practical are enclosed in bold lines.
Table 5.6.6 Business principals and business model application possibilities
Fee-for-service Outright sales Business model
Principal SHS BCS Loans Cash
Government N/A N/A N/A ◎
For electrification of public facilities
Utilities
○
Need for conformance with the existing tariff scheme
△
Possible commercial feasibility
N/A N/A
ESCOs
△
Need for mitigation of risk through sharing of part of the equipment cost burden by customers
◎
Low tariffs, comparatively easy retrieval of cost
N/A N/A
Local governments
(communities)
△
Some possibility, but problems in the operation aspect
N/A N/A
○
Independent community projects
Dealers
△
Need for financing for equipment purchase
◎
Possible expansion of business through development of chain stores
△
Need to develop customers able to repay loans; high risks for the company side
○
Some potential, mainly among commercial facilities
(Source) prepared by the JICA Study Team
5.6.4 Proposal of electrification model adapted to the socioeconomic status of communities in the
northern regions
As discussed above, examinations of off-grid PV electrification models must draw a clear distinction
between the public and private sectors, which obviously have a different market structure. It would be
advisable to promote electrification in the public sector under government leadership through

5-62
investment of tax revenues, and to stimulate the market and utilize the energies of dealers and other
private enterprises in the private sector.
For the operation of business (projects) in the private sector, there are two basic approaches: system
sales directly by dealers (including provisions for loans) and fee-for-service business operated through
ESCOs. With the current RESPRO model, fee-for-service cannot subsist on commercial footing
because of the low tariffs, and this point to a need for measures such as having the customers shoulder
the cost burden of equipment such as batteries. In light of the level of payment capabilities in the
northern regions, collection of fees by BCS could be the more realistic option for the operation at
present.
While maintaining their own network of sales stores commensurate with the scale of their business,
dealers could deliver systems to government projects and sell directly to the private sector in their
operation. (Dealers could also possibly operate BCS.) Figure 5.6.1 diagrams these configurations.
(Source) JICA Study Team
Figure 5.6.1 Differentiation between civil use and public use
5.7 Roles of the government and the private sector for the spread of off-grid PV electrification
In Ghana, governmental policy on RE has posted the goal of electrification of (i.e., access to a supply
of electricity in) all communities by 2020. In keeping with this goal, the government is promoting
on-grid electrification with subsidies through the SHEP. In the SHEP, the cost of utility poles is to be
borne by the community as a general rule, but funding has been injected in recent years to HIPC funds,
and customers are receiving a substantial benefit from subsidies through the application of lifeline
tariffs.
At the current stage, off-grid PV electrification is on the order of system installation with grant aid in
the context of various pilot projects promoted by donor countries. As evidenced by the case of
Public Facilities Private Facilities
Dealer
ESCOShops
Government Market
(Central Gov.)
MOE
Min. of Health
Min. of Education
Fee for Service (BCS)Outright Sales
Sales
Installation
Installation

5-63
numerous developing countries, the establishment of a supply chain market on the private-sector basis is
important for PV electrification, and the government must make provisions to support it.
5.7.1 Role of government
There are several measures which the national government could conceivably take to stimulate the
spread of off-grid electrification, as follows.
� Formulation of long-term plans based on the Master Plan Study
� Establishment of efficient community electrification plans combining public facilities and
private ones as electrification subjects
� Proposal of O&M methods and business models through the implementation of pilot projects
� Improvement of levels of technology through establishment of technical standards and code of
practice
� Full provisions for technician education through official trainings
� Construction of test facilities to assure observance of PV equipment criteria
� Preparation of schemes of financing for enterprises
� Activities to increase knowledge and awareness of PV power use
5.7.2 Role of the private sector
The spread of off-grid PV electrification demands an expansion of the market led by private
enterprises in coordination with the measures to be taken by the government. For example, in
communities where governments are promoting PV electrification of public facilities, private
enterprises could launch sales campaigns for residential PV systems at the same time.
Through its interviews with PV enterprises and NGOs, the Study Team collected information on
approaches in their projects and views on ways to expand the market. It found that the enterprises faced
problems in the aspects of money, organization, and technology, and were independently searching for
solutions. Table 5.7.1 indicates their approaches to date and their requests for the future.

5-64
Table 5.7.1 Approaches and requests of PV enterprises and NGOs
Contents Approaches and requests
Enterprise organization
• A cooperative organization of PV system enterprises is needed for advancement of the business.
• Enterprises want to form a network with related NGOs.
Collection of charges and O&M
• The cooperation of residents is indispensable for efficient collection of charges.
• Management of customers in the initial phase is a vital factor.
Business models
• Basically, enterprises want to develop the business through outright sales instead of holding assets.
• Arrangements are currently being made for system sales and installation by local installation enterprises.
• Enterprises are studying the prospects for developing chain store operations for PV power supply by BCS.
• Considering the poverty in the northern regions, the fee-for-service model is too risky. Household electrification by BCS is thought by some enterprises to be the more realistic option
12.
• Some enterprises offer both fee-for-service and outright sales options to prevent their business from becoming biased toward one or the other.
Training
• Training courses are being held for PV system enterprises.
• Training is also being offered to students on the site.
• It is necessary to instruct customers in correct use of the systems.
(Source) JICA Study Team through interviews
5.8 Perspectives on off-grid PV electrification programs
Upon the completion of the Master Plan Study, the Ghanaian government is to promote off-grid PV
electrification, in accordance with the criteria for area selection based on cost comparison and other
factors. In the northern regions alone, thousands of communities are still without power, and
electrification of all of them requires efforts to achieve the maximum effect at the minimum cost.
At the stage of execution, the government must clarify the time line for selection of off-grid
electrification areas and implementation of projects. In RE, the general approach lies in extension of the
grid where it is technically and financially possible and PV electrification for areas where grid extension
is not effective. In the case of Ghana, the SHEP is a plan for on-grid electrification premised on
contribution from residents, in that communities must assume the cost burden for low-voltage utility
poles and house lines. As such, it could not be termed a program that is grounded in quantitative cost
analysis.
Under these circumstances, it is difficult to acquire a firm grasp of the future plans for distribution line
(on-grid) electrification. This, in turn, makes it hard to clearly define the scope of off-grid PV
electrification with the exception of areas that are obviously too distant from the existing distribution
12 At the same time, some dealers thought that BCS was not a suitable business model because of the short battery demand
duration of less than two years.
5-65
line network. In reality, even in existing PV projects, areas have been reached by the grid after PV
systems were installed. This compels relocation of the systems and results in inefficiency.
As viewed from the standpoint of power utilities, electrification does not necessarily proceed from
areas where it is most cost-effective, and this has the effect of squeezing business profit.
To promote off-grid PV electrification in a manner that conforms with on-grid electrification, the
Power Unit of the MOE, as the planning party, must supervise the SHEP yearly plan and off-grid PV
electrification plan in an integrated fashion. If priority is placed on the electrification cost and burden
imposed on power utilities, it must consider to reveise the grid extension plan (SHEP) itself.
5.9 Discussion of incentives for PV system diffusion
5.9.1 Conditioning of the market environment in the institutional aspect
To pave the way for the growth of the PV market and spread of PV systems, the government must
make institutional arrangements in various aspects while also formulating off-grid RE plans that are in
conformance with on-grid electrification. These aspects include environmental conditioning to
facilitate participation in the market by private enterprises, provisions for financing, the quality
assurance scheme, the tariff scheme, and training programs.
Some of PV enterprises and NGOs are dissatisfied with the lack of subsidies for off-grid PV
electrification. On-grid electrification is eligible for subsidies for initial investment, and is also a subject
of cross-subsidization because of the low tariffs applied for the poor. In contrast, PV electrification rests
on stand-alone systems and is structurally not conducive to cross-subsidization. It would also be
difficult for the government to provide private facilities (households and stores) with subsidies for the
initial cost. The relative merits of the subsidization scheme must be discussed from these angles.
Even aside from subsidies, enterprises want to see the instatement of various incentives, including
rigorous application of (and simplification of requirements for) tax exemptions linked to lower costs,
establishment of a financing system to improve access to funding, and improvements in the institution of
official certification through items such as technical standards.
Although some of these desires would probably be impossible to fulfill, many deserve consideration.
Table 5.9.1 outlines the incentives desired by enterprises and NGOs and the issues for their instatement.

5-66
Table 5.9.1 Incentives desired by enterprises and issues for their provision
Requests for the government (incentives) Issues for provision
・The installation of PV systems to electrify
households in areas reached by the grid would make it possible to supply more grid power (short supply) to the industrial sector.
・It is the customers who choose between on-
and off-grid electrification; it would be difficult for the government to intervene. PV
electrification policy ・Rural offices should be established to manage
procedures for tax exemptions and the financing system.
・ Provisions for tax exemptions and micro
financing must be made before the offices are established.
・About half of the government's RE Fund
should be directed to funding for the import of equipment by PV enterprises. This would reduce costs at the time of installation.
・There are doubts about its practicality due to
the dearth of government funds.
Subsidization arrangements
・ Subsidies are provided for on-grid
electrification, and ought to be provided for PV electrification as well.
・It would be difficult to furnish subsidies for
initial investment to private facilities.
・Cross-subsidization would probably be out of
the question due to the stand-alone nature of PV systems.
Tax exemptions
・Import of complete PV systems is exempt
from tariffs and value-added tax (VAT), but that of separate pieces of equipment is not.
・ In separate import of batteries and other
components, customs does not assess the purpose of use. This request was made by many enterprises and deserves study.
・The government should construct a micro
financing scheme with its own guarantees.
・Such a system met with failure in the BCS
pilot project executed by DANIDA, but the proposal merits study. Financing
system ・It is hard to keep the business afloat because of
the difficulty of getting loans from banks.
・A financing system must be instated for
enterprises. Government guarantees should be offered, if possible.
Licensing system
・The details of the licensing system are not
clear.13。
・The requirements here are augmentation of the
licensing system for adaption to business models and provision of incentives for licensees.
・Training must be provided to customers so
they can perform system O&M.
・Many enterprises have a keen awareness of the
need for training for their customers. This suggests that project execution should be accompanied by the preparation of manuals and instruction. Training
・ Enterprises would like arrangements for
official qualification (certification) obtained by graduating from training courses held by the government.
・Besides raising the level of technical skill,
official training acts as an incentive for enterprises by offering them official qualifications.
(Source) prepared by the JICA Study Team
5.9.2 Study of economic incentives based on energy prices and tariff settings
The provision of economic incentives for the spread of PV electrification demands, first and foremost,
resolution of the perceived cost disadvantage relative to grid electrification. Desires for a supply of
power are very high in all areas. The fact is, however, that, as compared to grid power, PV power entails
a higher cost both initially and for subsequent O&M, and is also of inferior quality.
Nevertheless, it should also be noted that grid power, particularly in the case of small customers
13 The RESPRO believes that it does not have to obtain a license because it is a governmental agency. On the other hand, EC
believes that RESPRO must obtain a licence.

5-67
targeted by RE, is clearly being subsidized in the aspect of tariffs, which are being artificially held to low
levels (i.e., the lifeline tariff). It would consequently be very difficult for PV electrification to compete
in the same arena. The lifeline tariff is not merely a barrier to the spread of PV electrification; because of
this tariff scheme, the whole power sector is saddled with a backspread structure. This is to say that the
power sector itself, inclusive of the ECG and VRA-NED, is facing financial difficulties.
To rectify this situation, it is vital to hike the lifeline tariff at least to the level of the bulk tariff plus
alpha. This was actually done in 1998. In so doing, it is necessary to win the understanding of
customers for a certain tariff hike by heightening their awareness that the (lifeline) tariff artificially held
down to a low level with subsidization must be paid for with taxes of some other type, and therefore
exerts a heavy burden on them in reality.
The enormous scale of the initial investment is cited as another drawback of PV electrification. In this
connection, it is important to examine various measures that could lower the initial investment,
including micro-credit-type loans.
A reduction in the initial investment could heighten the competitiveness of other energy sources such
as biomass, kerosene, and coal. Nevertheless, off-grid electricity, unlike on-grid electricity, has the
drawback of being harder to use as a power or heat source than these other energy sources. On the other
hand, incentive for installation of PV systems could be increased by priority promotion of social
development with use of the limited supply of electricity (e.g., in tasks such as construction of small
irrigation facilities and provisioning of medical and educational facilities).