Embed Size (px)
Citation preview

EMU study
The location of financialactivity and the euro


The location of financialactivity and the euro
EMU study
This study has been prepared by HM Treasury toinform the assessment of the five economic tests

© Crown copyright 2003
The text in this document (excluding the Royal Coat of Arms and departmental logos)may be reproduced free of charge in any format or medium providing that it isreproduced accurately and not used in a misleading context. The material must beacknowledged as Crown copyright and the title of the document specified.
Any enquiries relating to the copyright in this document should be sent to:
HMSOLicensing DivisionSt Clements House2-16 ColegateNorwichNR3 1BQ
Fax: 01603 723000
E-mail: [email protected]
Printed by the Stationery Office 2003 799414
This study has benefited from review by Professor Philip Davis, working in a personalcapacity as an academic consultant to HM Treasury. It has also benefited fromcomments by Bank of England officials. All content, conclusions, errors and omissionsin this study are, however, the responsibility of HM Treasury alone.
This is one of a set of detailed studies accompanying HM Treasury’s assessment of thefive economic tests. The tests provide the framework for analysing the UKGovernment’s decision on membership of Economic and Monetary Union (EMU).The studies have been undertaken and commissioned by the Treasury.
These studies and the five economic tests assessment are available on the Treasurywebsite at:
www.hm-treasury.gov.uk
For further information on the Treasury and its work, contact:
HM Treasury Public Enquiry Unit1 Horse Guards RoadLondonSW1A 2HQ
E-mail: [email protected]
CO N T E N T S
Page
Executive summary 1
1. Introduction 5
2. London as a financial centre 9
3. Economic geography 21
4. Economic history 27
5. Developments in euro financial markets since 1999 33
6. Factors shaping financial centres’ development 45
7. Conclusions 53
References 55
Annex A: The UK’s position as an international wholesale financial centre 61
Annex B: The location of financial activity in the US 87
Annex C: Theories of location 91


EX E C U T I V E SU M M A RY
1
1 To inform the assessment of the financial services test, the fourth of the Government’s fiveeconomic tests for EMU entry, this study considers the factors that drive the location ofwholesale financial activity, and examines the evidence and emerging trends in the sector. Thestudy’s main focus is on the cluster of wholesale financial services activity in the City1, and therelative impact, if any, of currency as a factor affecting the competitiveness, and the location of,wholesale activity. The study is essentially backward looking and focuses on the performanceof the City to date. The question of the effects that UK membership of the single currency wouldhave on the City is not addressed in the study. This is a matter for the assessment itself.
2 Firms operating in the wholesale financial sector in the UK are internationally mobile.If they consider that the UK is not a competitive location, they can quickly relocate some orall of their activity to more competitive locations. Should they relocate, it could haveimportant implications for the UK economy, where the financial services sector makes asignificant contribution in terms of employment and invisible earnings. An efficient financialservices sector also has a key role in raising the productivity and growth of the UK economy.
3 Key to the study is the evidence that, since the advent of the Euromarkets in the late1950s and early 1960s when large dollar deposits were placed in regulatory jurisdictionsoutside the US (mainly in banks located in Europe), London has reinvented itself from beingan international clearing centre for sterling to making international markets in a variety ofcurrencies and providing international financial services across borders. Its competitivenessin these markets has been largely divorced from both the strength of the underlying economyand sterling. The basis for its competitiveness has instead been grounded in the clusteringforces that attracted a critical mass of international wholesale activity to the City.
4 This study sets out to understand how London arrived at this position of strength.Section 2 begins with an overview of London as a financial centre today. London enjoys astrong presence across a very wide range of markets and in many cases is the dominantinternational financial centre. This dominance stems from a number of factors but, above all,from the critical mass of financial expertise that is present in the City. No other financialcentre in the European time zone currently possesses such a depth of expertise, and probablyonly New York can currently match London on this measure.
5 Sections 3 and 4 offer two contrasting but complementary approaches to explain whythis intensive pattern of financial services activity has developed in London: economicgeography and economic history.
6 Section 3 draws on recent developments in new economic geography. This highlightsthe benefits for wholesale financial market participants of locating in a cluster of activity suchas that in the City. This is because of the strong external economies of scale that individualfirms enjoy as a result of the presence of other firms in the same location.
7 The theory suggests that London has become an international financial centre throughcreating centripetal or agglomeration forces that have made it attractive relative to otherfinancial centres. Current evidence suggests significant centripetal forces would include: acritical mass in financial expertise, offering a wide range of complementary services to theinternational investor; market infrastructure which can support high levels of activity, offeringliquidity to traders; institutional infrastructure, both formal (appropriate regulation) andinformal (market practice); and a large pool of skilled labour and flexible labour markets relativeto other financial centres.
1 ‘The City’ is a descriptive rather than geographical term which includes all financial market activity in Greater Londonand not just that in the City of London or Square Mile. The terms ‘the City’ and ‘London’ are used interchangeablythroughout this study.
Introduction
Why location?
The study’sapproach
Economicgeography

EX E C U T I V E SU M M A RY
8 New economic geography also defines dispersion or centrifugal forces that mayencourage relocation by some businesses to lower cost locations. There are a number of theseforces at work in London: a physical infrastructure under stress (transport and housing);relatively high living costs compared to other financial centres; and, until recent marketdownturns which have affected the growth of both London and overseas financial centres, atight labour market where recruitment problems were experienced. Technology has also beenan important dispersion force, in some cases allowing the relocation of lower value added, bulkprocessing operations to lower cost locations outside clusters. The Prudential’s recent decisionto establish an offshore service centre in Mumbai, India is one example of this trend.
9 If centripetal forces outweigh centrifugal forces and a critical mass of activity is reached,the theory suggests that a financial centre can enter a process of self-sustaining growth. Howfar it develops relative to other financial centres will depend on the relative strengths of thesecentripetal and centrifugal forces in each centre. As this agglomeration process strengthens,so a location’s development can become self reinforcing or path dependent. Such pathdependency implies that the prospects of a rapid decline of a cluster such as London arediminished (though not altogether removed), and that the forces holding the cluster togetherexhibit a degree of robustness against adverse changes in circumstances.
10 Section 4 offers alternative insights into the factors behind London’s development sincethe 18th century from the perspective of economic history. Again, these can be mapped ontothe picture of London as a financial centre today portrayed in Section 2.
11 A number of themes repeat themselves as playing an important role in London’ssuccess, notably the UK’s long history of openness to foreign firms and to immigrants whobrought their financial expertise to the UK. The open-door policy of the authorities allowedLondon to develop at an early stage a critical mass of financial expertise, liquid markets anda range of complementary services to support international wholesale financial activity.
12 This critical mass of expertise enabled London to overcome the gradual decline throughmuch of the 20th century of the relative global importance of the UK economy and sterlingthat together had been its previous sources of strength. Coupled with a favourable regulatoryand legal environment that encouraged financial innovation, they provided the springboardthat allowed London to take full advantage of the development of Euromarkets in the late1950s and early 1960s which was to change profoundly international wholesale markets. Theabolition of exchange controls in 1979 and ‘Big Bang’ in 1986 were other key moments in atrend towards greater international openness which has led to foreign ownership playing asignificant role in today’s City.
13 Section 5 provides a brief review of developments in euro financial markets since 1999.The euro is one of a number of factors affecting the development of financial centres such asLondon. It has in some cases added an additional stimulus to existing trends, and Londonwould have expected to face these challenges either inside or outside the euro area.
14 The evidence shows that London has participated fully in recent developments in eurofinancial markets. London benefits from access to euro financial market infrastructure. TheUK is the second largest user of TARGET2 behind Germany, providing a cheap and effectiveroute for wholesale euro payments across borders. London-based traders have unrestrictedaccess to trading platforms in most other euro area financial centres (e.g. Eurex based inFrankfurt). Where restrictions do remain, for example to cross-border access to settlementsystems, they are the result of national rules and not related to membership or otherwise ofthe single currency.
2
Economic history
Recentdevelopments in
euro financialmarkets
2 Trans-European Automated Real-time Gross settlement Express Transfer system: this links the 15 euro-denominatedReal-Time Gross Settlement (RTGS) systems in the EU and the ECB payment mechanism to provide an EU-wide RTGSsystem.

3
15 Similarly, the boost which the euro gave to the growing euro corporate bond market hasbenefited London. The European Central Bank (2002a, p. 25) notes that the City is “one of themain channels through which non-euro area residents purchase euro-denominated bondsissued inside and outside the euro area”. The Bank of England estimates that London’s marketshare of the issuance of euro-denominated Eurobonds in 2002 was around 60 per cent,compared with 50 per cent in 1999.3
16 Section 6 sets out some of the factors that are shaping the development of financialcentres such as London. Identifying the likely factors behind future structural change iscomplicated by the current strong cycle in global equity markets, and its consequences.Nonetheless, five influences are identified:
• globalisation, as evidenced by increased integration and the establishment oftrends and transmission of shocks across national boundaries;
• supply-side determinants, especially technology;
• a changing business environment, including regulation and tax;
• changing business strategies, in particular further consolidation, for examplein the banking sector; and
• the role of currency – the advent of the euro being the most important in thiscontext.
17 Globalisation will undoubtedly continue be a strong over-arching factor. Policy action –for example in the next trade round, and with the EU – is likely to remove more barriers totrade. Companies are likely to develop global strategies further. In financial markets, there islikely to be a greater take-up of international and global standards and norms.
18 Technology has a complex impact on location and clustering. One the one hand, it hasallowed market firms to concentrate their wholesale operations in one place (in the Europeantime zone, usually London) and offer their services from there. On the other, it creates thepotential for firms to relocate to lower-cost sites, so undermining clustering forces. Thus far,these latter effects have largely been seen on lower value added activities (back-officefunctions for example) and core wholesale operations still see large benefits from locating ina cluster. However, by increasing the mobility of some forms of activity, locations maybecome more ‘contestable’ whereby small changes in the relative attractiveness of locationsmay provoke a quicker response by firms than in the past.
19 Developments in the EU’s regulatory approach contained in the Financial ServicesAction Plan (FSAP) – which applies to all Member States whether inside or outside the euroarea – are an important influence on London as a financial centre. In principle, the removal ofbarriers in the Single Market should deliver significant economic benefits for users of financialservices and opportunities for providers, and the Government strongly supports the aims ofthe FSAP. As well as potential benefits, there are, however, potential risks for London. First,unnecessary harmonisation of standards or procedures might affect competition in the SingleMarket, with potential implications for the location of some activities within the EU. Second,if new EU legislation has costs which are not justified by the benefits, this may force activity outof the EU altogether. Tax, both personal and business, could also be an important factordetermining firms’ location choices – the UK has a competitive personal and corporate taxregime for wholesale financial firms.
EX E C U T I V E SU M M A RY
Factors shapingfinancial centres’
development
Globalisation
Supply-sidedeterminants
Businessenvironment
3 Bank of England (2002).

EX E C U T I V E SU M M A RY
20 Recent equity market downturns have slowed the trend towards greater industryconsolidation, certainly in the short term. Business strategies are, however, likely to evolve inresponse to the growing opportunities and challenges posed by EU market liberalisation,technology and the increasingly global nature of financial services outlined above. Anotherissue is the high level of foreign ownership in London’s wholesale markets. One possibleconsequence of this may be a greater potential risk of relocation away from London ifcircumstances do not remain favourable.
21 The final factor is the single currency. The euro will become a more importantinternational currency, with the eventual likely take-up of the euro by the new EU entrantsadding a further boost to its role as an international currency. In some areas, the euro isalready encouraging deeper and more liquid capital markets in the euro area, and providingan added impetus to existing trends. Increases in demand for euro-denominated assets,whether in equity or bond markets, have not however been to the detriment of London,which has been able to participate fully in euro financial market developments and maintainmarket share.
22 The locational advantages of the UK – the UK business environment, and particularlythe significant clustering benefits offered by London – have provided it with the conditions tobe competitive in international wholesale financial activity. While there are challenges andrisks, as highlighted in the study, to date the euro has not affected London’s ability to competein international wholesale markets. However, the dynamic nature of the sector means thatLondon’s performance in the four years since the start of EMU provides no grounds forcomplacency.
23 This study is essentially backward looking and focuses on the performance of the Cityto date. The question of the effects that UK membership of the single currency would have onthe City is not addressed in this study. This is a matter for the assessment of the financialservices test, the fourth of the Government’s five economic tests for EMU entry. The testassesses the specific question of the potential impact entry to EMU might have on the City’scompetitive position, particularly its wholesale markets and their ability to attract eurobusiness.
4
Currency:the euro
Conclusions
Businessstrategies

1 IN T R O D U C T I O N
5
1.1 The aim of this study is to inform the assessment of the financial services test – thefourth of the Government’s five economic tests for EMU entry. The study focuses on theperformance of the City1 to date. The question of the impact UK entry to the single currencywould have on the City is not addressed in the study. This is a matter for the assessment itself.
1.2 The study sets out to understand what factors influence the location of wholesalefinancial activity and what makes the UK a competitive location for wholesale financialactivity. Pinning down the location of financial activity is not altogether straightforward. TheBank of England (2002) describes the five steps for a foreign exchange transaction: customercontact, trade execution, booking, risk management and settlement. Each step may takeplace in a different location and often through electronic markets which have no physicalpresence.
1.3 Understanding what influences choices of location is important. The financial servicessector makes a significant contribution to the UK economy in terms of employment andinvisible earnings. An efficient financial services sector also has a key role in raising theproductivity and growth of the UK economy.
1.4 Both the potential opportunities and risks to the UK as a location for wholesale activityassociated with the decision not to join EMU in the first wave were highlighted in theconclusions of the Treasury’s 1997 assessment (HM Treasury, 1997). Since that assessment,the euro area has been successfully established. As the euro is likely to have had its mostimmediate structural impact on the financial services sector, some evidence of an impact onthe location trends of wholesale financial services activity since 1999 may have started toemerge. Any change with respect to the UK that might be linked to the euro could besuggestive of its longer-term competitive position as a location for wholesale financialactivity.
1.5 Two particular aspects of the scope of the study should be noted, reflecting theemphasis of the financial services test itself:
• the focus is on wholesale financial activity because this is dominated byinternational firms who can choose from a variety of locations from which toundertake their business. If London and the UK in general are becominguncompetitive, then they might consider relocating; and
• although other UK wholesale financial centres such as Edinburgh arecovered, most of the analysis and accompanying discussion is of the marketsserved by the City because this is by far the dominant financial centre in theUK.
Why location?
The scope of thestudy
1 ‘The City’ is a descriptive rather than geographical term which includes all financial market activity in Greater Londonand not just that in the City of London or Square Mile. The terms ‘the City’ and ‘London’ are used interchangeablythroughout this study.2 The EMU study by HM Treasury EMU and business sectors examines the potential implications of EMU for all businesssectors.

1.6 Section 2 provides a survey of London as a wholesale financial centre today, as shown byits share in international wholesale markets, and the critical mass of financial expertise itholds. Scotland’s importance, especially in institutional asset management, is briefly outlinedtoo.
1.7 Sections 3 and 4 offer two contrasting but complementary approaches to examiningLondon’s current position as a leading international financial centre. Section 3 uses atheoretical approach based on new economic geography to explain spatial concentrations orclusters of financial services activity such as in New York and London. Section 4 then turns toeconomic history to provide a more descriptive overview of London’s development, and thekey forces that have shaped its fortunes.
1.8 Section 5 reviews some of the recent developments in euro financial markets and theimpact of the euro. It looks at evidence to assess whether the euro has transformed eurofinancial markets in a way that has excluded London from participating. The study has beencarried out against a backdrop of a difficult environment for wholesale financial services,following significant falls in global equity markets since 2000. This has affected the lifeinsurance sector, mergers and acquisitions activity, stockbroking and fund managementparticularly seriously with adverse effects for wholesale financial services employment3 bothin London and in financial centres overseas. The effects of this cycle make it all the moredifficult to separate out any structural shifts that may be a result of the introduction of thesingle currency, compounding the problems posed by the short period of time underconsideration.
1.9 Looking beyond such short-term cyclical effects, Section 6 considers a number of morelong-term dynamic forces affecting the structure of the financial services sector. Such driversinclude:
• globalisation, as evidenced by increased integration;
• supply-side determinants, especially technology;
• a changing business environment, including regulation and tax;
• changing business strategies, in particular consolidation; and
• the role of currency, in this context, the advent of the euro as a new currency.
1.10 Chart 1.1 depicts the five drivers at work in financial services, and the ways in whichthey affect a financial centre’s development. Together, they comprise the drivers that areshaping the development of European wholesale financial markets. Section 7 concludesthe study. It does not, however, attempt to evaluate the relative importance of these factors,or what impact UK entry to EMU would have on the City, which is a matter for the assessmentitself.
A dynamicenvironment
Five drivers offinancial centre
development
Economicgeography and
economic history
IN T R O D U C T I O N
6
1
3 The Centre for Economics and Business Research (CEBR) estimates that 10,000 jobs will be lost in the City in 2003, thehighest number since 1992 (CEBR, 2003).

7
IN T R O D U C T I O N1
Chart 1.1: Sectoral drivers and the development of financial centres
Source: Adapted from Begg, 1992.
Businessenvironment
Supply-sideconditions
BusinessstrategyGlobalisation Currency:
the euro
Culture; legaland regulatory
framework;government
policy
Technology;labour supplyand demand;
productinnovation
Consolidation andscale economies;
removal ofcross-border
barriers
Cycle infinancialmarkets;
integration; EUenlargement
Deeper andmore liquid
markets;increased euroarea marketintegration
Development offinancial centres

8

2 LO N D O N A S A F I N A N C I A L CE N T R E
9
2.1 This section describes the current position and characteristics of London as a financialcentre. London is arguably the most international of all financial centres, even more so thanNew York, and is competitive across a wide range of international wholesale markets.
2.2 On the basis of its role as an international financial centre, Clark (2002) views Londonas unique. He argues that its historic roots, coupled with a huge diversity of marketparticipants with a wide range of risk profiles, gives London a major advantage over otherfinancial centres in attracting wholesale financial business:
• through its position in the European time zone, as an interchange betweenEurope, Asia and the US, facilitating and mediating in financial interactionsbetween these regions as well as the rest of the world – its global role;
• as a provider of financial products not found in continental Europe, or ifprovided, not at a suitably competitive price – its regional (i.e. EU) role; and
• as a provider of domestic financial services such as the very significantvolume of institutional and pension assets managed by London – its nationalrole.
2.3 An indication of London’s importance in the world’s financial system is immediatelyapparent in its size or critical mass relative to other financial centres. For example:
• London hosts a greater number of foreign bank branches and subsidiariesthan any other international centre, and its 19 per cent share of global cross-border bank lending is nearly twice as high as the next largest centre;
• London is, by some distance, the world’s dominant foreign exchange dealingcentre, with around a third of the world’s daily turnover of foreign exchangedealing taking place in London;
London has a critical mass of expertise in a wide range of wholesale activities,reflected in its leading share of many international wholesale markets and activities. Thepresence of a large range of wholesale firms, supporting services and financial talent act asstrong attractions for wholesale financial activity to locate in London. Flexible workingpractices, competitive personal and corporate tax rates and an effective regulatoryframework add to its attractions as a place to do business.
London is supported by an efficient market infrastructure. It ensures that the highlevel of liquidity in UK wholesale markets is smoothly and efficiently handled. Equal termsof access for foreign firms are a further important attraction that adds to the clusteringforces at work.
London’s critical mass is translated into a dominant position across a range ofinternational, regional and national wholesale market activities, placing it at thetop of the hierarchy of financial centres alongside New York.
London servingmarkets at every
level
Critical mass

LO N D O N A S A F I N A N C I A L CE N T R E
• London-based bookrunners are estimated to account for around 60 per centof euro-denominated Eurobonds issued, with 70 per cent of secondarytrading taking place in London;
• turnover is higher and there are more companies listed on the London StockExchange than on other leading European exchanges;
• Euronext-LIFFE is the largest derivatives exchange in Europe by the notionalvalue of contracts traded and more trading takes place from London on Eurex,the Swiss-German derivatives exchange, than from anywhere else in Europe;
• London has over a third of the global market for over-the-counter (OTC)derivatives trading;
• London is home to the world’s premier non-ferrous metals market, theLondon Metal Exchange, and to Europe’s leading energy futures and optionsexchange, the International Petroleum Exchange;
• the UK is the third largest home of assets under management internationally,and London is the leading European centre for asset management;
• the UK insurance market is third largest in size internationally, and London ishome to Lloyd’s of London, the world’s leading specialist insurance market;
• London is the leading centre in the provision of insurance services to theinternational maritime community, with owners of about one fifth of theworld fleet tonnage represented in London; and
• London is one of the two leading centres for international legal services, andis also a leading international centre for accountancy and managementconsultancy services.
2.4 Market data show that London has maintained a dominant position across a wide rangeof wholesale markets. Together, the data show that London continues to enjoy a strongpresence across a wide range of markets and in many cases is the dominant internationalfinancial centre. Tables 2.1, 2.2 and 2.3 provide a broad overview of the current position inselected international markets. Annex A contains a more comprehensive set of marketindicators that underlines the picture.
2.5 A particular feature of UK financial markets is the high proportion of activitydenominated in foreign currencies, such as US dollars and euro. As noted above, London isby some distance the leading global foreign exchange centre, with a high and relatively stableshare of non-sterling trading activity (Table 2.1). More foreign exchange trading in euro takesplace in the UK (US$207 billion per day in April 2001) than within the entire euro area. Theinternational nature of London’s market is underlined by the fact that transactions involvingits home currency (sterling) accounted for only 13 per cent of global market turnover in 2001.
10
2
London is aninternational
financial centre

11
Table 2.1: UK share of global foreign exchange trading activityPer cent 1992 1995 1998 2001
UK market total 27 30 33 31
UK share of major currencies:
US dollar 25 29 30 31
Euro currencies 26 26 34 35
Pound sterling 49 55 83 61
Japanese yen 16 24 22 24
Swiss franc 22 26 29 29
Other 14 18 19 20
Pound sterling (global total) 14 9 11 13
Source: Bank of England and Bank for International Settlements (BIS), 2002a.
Table 2.2: Global market share held by major financial centres in keywholesale marketsPer cent – rounded UK US Japan France Germany Others
Cross-border bank lending (Jun 2002) 19 10 9 6 10 46
Foreign equities turnover (Jan – Aug 2002) 56 26 – – 3 15
Foreign exchange dealing (Apr 2001) 31 16 9 3 5 36
OTC derivatives turnover (Apr 2001) 36 18 3 9 13 21
Gross insurance premium income (2000) 10 35 21 5 5 24
Marine insurance net premium income (1999) 19 13 14 5 12 37
Aviation insurance net premium income (1999) 39 23 4 13 3 18
Source: International Financial Services London (IFSL), International Financial Markets in the UK, various editions, and BIS, 2002a,b.
Table 2.3: Leading fund management centres ranked by institutionalequity holdings, 1999 (year-end)
Country US$ billion
1. London UK 2,461
2. Metropolitan New York US 2,363
3. Tokyo Japan 2,058
4. Boston US 1,871
5. San Francisco US 726
6. Los Angeles US 569
7. Paris France 458
8. Philadelphia US 419
9. Zurich/Basel/Winterthur Switzerland 414
10. Denver US 340
11. Amsterdam Netherlands 327
12. Chicago US 316
13. Frankfurt Germany 310
14. Toronto Canada 289
15. Edinburgh/Glasgow UK 253
Source: Thomson Financial Investor Relations, 2000.
2.6 Supporting this high level of international wholesale activity is the critical mass ofexpertise that can be tapped by participants in London’s markets. The main expertise infinancial market research in Europe is based in London, as is expertise in international fundmanagement (though Edinburgh and Glasgow are also important UK centres of expertise).
LO N D O N A S A F I N A N C I A L CE N T R E2

LO N D O N A S A F I N A N C I A L CE N T R E
Together, these factors make it easier to do business, and provide the foundations forLondon’s competitiveness relative to other financial centres. As the Bank of England (2002)argues, because of these conditions, London remains one of the first locations for expandingmarket firms to enter, and one of the last locations for retrenching market firms to leave:
• the range of businesses and financial participants present in London developssynergies for firms. These create economies of scale and scope for firms aswell as increasing competitive pressures in the sector and encouragingfinancial innovation. Contact with a wide variety of competing market firmsalso creates information spillovers, and backed up by a depth and quality ofsupporting services, this helps to increase the value added of key staff;
• the presence in London of supporting services (accountancy, law, IT, media,and marketing) that wholesale market participants use widely in their day-to-day business. The availability, depth and quality of these ancillary servicesacts as a further encouragement for new wholesale financial activity to locatein the City rather than other locations; and
• a large pool of international financial talent familiar with a range ofinternational regulatory environments that wholesale firms undertakingcross-border business can draw upon creates flexibility and encouragesinnovation. The availability of international and homegrown financial talentsourced from world-class universities and business schools based in andaround London repeatedly appears in surveys as one of London’s main assetsin competing in global financial markets (Cushman & Wakefield Healey &Baker, 2002; Chrystal et al., 2002).
2.7 The attractions of London are reflected in the fact that, until the recent equity marketdownturns, the number of people employed by market firms in London had increasedsubstantially, and that market players have often concentrated their European time zonewholesale operations in London and delivered services to European markets from there.Some evidence of the depth of London’s labour markets is provided in Box 2.1.
2.8 The UK’s labour market flexibility and competitive overall rates of personal andcorporate taxation are important reasons behind these moves. Morgan Stanley, for example,transferred its German bond and equity trading desks to London when a decision was madeto organise the firm’s trading along sectoral rather than country/currency lines. Similarly, thefirm’s sectoral research was concentrated in London.
2.9 More generally, London’s ability to attract an international pool of labour lies in factorsthat are less easy to quantify but nonetheless important. London’s cosmopolitan nature andwide variety of cultural amenities – in part the result of a history of openness to foreignimmigration – makes it easier for overseas workers to settle in London compared to otherfinancial centres.
2.10 The use of English as the common language in international finance has been aparticular advantage in attracting English language speakers to London. English law isincreasingly the basis for international wholesale contracts, and is itself a major source oflegal advice business for London.
12
2
Flexible anddeep labour
markets
Cultural factors
13
2.11 London offers sufficient office space of the right type to market firms. Cushman &Wakefield Healey & Baker’s (2002) survey of European cities backs this view, with Londonhousing the greatest availability of office space, with Paris fourth and Frankfurt sixth. Thesame study reveals that London scores less well on office occupation costs, which arerelatively high. Telecommunications links in the City are, however, good with the LondonInternet Exchange (LINX) being the largest such interchange in Europe.
2.12 London does face capacity constraints. While its international transport links are highlyrated, London faces challenges with its public transport system, which is widely viewed aspoor; housing costs are also high compared to other European centres, as is the general costof living. While these costs are likely to be compensated for by higher salaries for workers,such stress factors may at some point encourage relocation of some classes of activity. As IainBegg highlights in his contribution to the EMU study Submissions on EMU from leadingacademics, this has been driven by a combination of cost reduction strategies, competitiveimperatives and labour shortages in financial centres.
LO N D O N A S A F I N A N C I A L CE N T R E2Box 2.1: Indications of the depth of London’s labour markets
The recent Cushman & Wakefield Healey & Baker (2002) survey of major Europeanbusiness cities placed London as the top location both for availability of skilled labour andoverall as a business location. A number of pieces of evidence build up the picture of a deepand skilled labour market in London that lies behind this result.
Attracting international skills: the creation of the EBRD
One piece of anecdotal evidence illustrates the depth of London’s labour markets. Whenthe European Bank for Reconstruction and Development (EBRD) set up in London in 1991,it recruited staff representing 38 different countries and speaking more than 50 languages.This included experts in banking, economics, law and administration. Three quarters ofthose it eventually recruited were already living in London (The Economist, 1995).
Professional skills
The Corporation of London (2002) estimates that in 2000 there were around 300,000individuals engaged in financial services jobs in the City of London, and almost 600,000more engaged in supporting services. Of these, around 60,000 were involved in legalservices, 50,000 in consultancy and 40,000 in accountancy and tax-related activities. Thesefigures do not take account of the effects of the recent equity market downturn, however,and are likely to represent the recent peak of financial services employment in the City.
Graduate supply
London and its surroundings host a large number of world-class universities and highereducation institutions. It not only produces a large number of graduates who potentiallyenter the financial services sector and related activities, but it also attracts graduates fromthe rest of the UK. Almost 50 per cent of graduates studying in universities in the UKoutside London join London’s labour pool.
Physicalinfrastructure

LO N D O N A S A F I N A N C I A L CE N T R E
2.13 A critical attraction for wholesale financial firms is London’s ability to offer access to anefficient financial market infrastructure. An efficient market infrastructure (i.e. trading,payment, settlement and clearing systems) is essential to support liquid markets. Withoutaccess to market infrastructure, dealing costs would rise and the execution of orders wouldbe slowed. Information flows could also be hindered, lowering the efficiency of markets, asprices might not reflect all available information.
2.14 Evidence from both market data and other commentators confirms that London’smarkets enjoy high levels of liquidity providing a key competitive advantage. An importantelement is the UK’s record of being open to foreign participants and offering them the sameterms of access to market infrastructure enjoyed by domestic firms. The Centre for Economicsand Business Research (CEBR, 2000) and Levin (2001) say that the strength and depth ofLondon’s financial markets – the volume of transactions and the diversity of market players –creates the liquidity that enables transactions to take place easily and cheaply, even for non-standard products. These attributes attract firms active in the various markets, and with themthe supporting services required to maintain their business (IT, accountancy services, etc.).
2.15 A range of payment, trading, settlement and clearing systems are available to UK-basedwholesale market participants operating in euro markets (Bank of England, 2002):
• since the launch of the euro, CHAPS Euro has settled same-day high-valueeuro payments in central bank money in real time. The NewCHAPS projectintroduced new technology for sterling payments in August 2001. Thisincreased the efficiency of the sterling system and placed it on the sameplatform as euro payments;
• CLS Bank, which started operations in September 2002, has introducedpayment-versus-payment in real time to address settlement risks arising fromforeign exchange transactions in a number of major currencies;
• the London Stock Exchange has enhanced its trading systems and adapted itsrules to remain attractive to investors. There are also a range of otherexecution venues for equity trades, from the virt-X exchange, throughMultilateral Trading Facilities (of which London has more than any otherfinancial centre in Europe), to internalisation (i.e. the matching of customerorders either against a proprietary trading book or against other customerorders) of trades by investment banks;
• Euronext-LIFFE’s CONNECT platform is one of the world’s leading derivativesplatforms. It is to be used for all the other derivatives exchanges in theEuronext group, and by the Chicago Board of Trade. Trades on the LondonMetal Exchange can be executed electronically as well as on the floor of theexchange, and there is some electronic trading of contracts on theInternational Petroleum Exchange;
• since November 2001, CREST has settled securities against payments ofcentral bank funds, in both sterling and euro, in real time. CREST’s mergerwith Euroclear should further improve functionality and lower the cost ofcross-border settlement for UK-based participants; and
• the London Clearing House (LCH) has assumed a greater role as a centralcounterparty to global OTC market transactions, exchange-tradedgovernment bond derivatives, and equities trading on the London StockExchange’s SETS trading system.
14
2Market
infrastructure

15
2.16 The UK’s regulatory framework for wholesale markets aims to encourage innovation,competition and risk-taking without compromising safeguards for investors or highstandards. This helps London to be at the forefront in responding to new marketdevelopments. The Financial Services and Markets Act 2000, the single statutory frameworkunder which the new unified regulator, the Financial Services Authority (FSA) operates, seeksto embody and promote these key features of the UK’s regulatory environment going forward.Box 2.2 sets out the new framework in more detail.
LO N D O N A S A F I N A N C I A L CE N T R E2Financial
regulation
Box 2.2: Regulation of financial services in the UK
The regulation of financial services in the UK has undergone substantial change in the lastfive years.
Regulation was previously on a sectoral basis: there were nine separate regulators ofbanking, insurance and investment services which led to substantial duplication. It isthought that over 800 financial services firms in the UK were subject to more than oneregulator, and at least another 1,000 belonged to a conglomerate which had more thanone regulator. Consumers too faced a multitude of compensation and dispute resolutionschemes.
New framework for regulation of financial services
Since 1997, a new regulatory framework has been established. Its key features are:
• separation of monetary policy (the responsibility of the Bank of England) fromfinancial regulation (the responsibility of the FSA);
• a single regulator of financial services in the shape of the FSA and, for consumers,a single compensation scheme and ombudsman;
• regulation on a statutory basis under the Financial Services and Markets Act 2000.The FSA acquired its full powers under the Act on 1 December 2001; and
• financial services regulation is at arm’s length from the Government. TreasuryMinisters have no general power to intervene over the FSA’s rules or its decisionsabout individual firms.
Accountability of the regulator
It is important that regulation is strong and effective to ensure that the UK is an honestplace to do business. Nonetheless, these benefits are potentially offset by concerns thatthe FSA is too powerful and insufficiently accountable. There are a number of mechanismsdesigned to ensure that this is not the case, including:
• the FSA’s statutory objectives. These are: market confidence; raising publicawareness; consumer protection; and reducing financial crime. The FSA isrequired to report publicly on the extent to which it has met these objectives; and
• the FSA is required to have regard to a number of principles in its operations,including that the costs of regulation should be proportionate to the benefits, thedesirability of maintaining the competitive position of the UK, and facilitatingcompetition. The FSA has to consult, and provide a cost-benefit analysis, beforemaking new rules.

LO N D O N A S A F I N A N C I A L CE N T R E
2.17 Academic evidence provided by La Porta et al. (1997, 1998) demonstrates theimportance of setting the right regulatory framework. They assess the ability of firmsoperating in different legal environments to raise external finance through either debt orequity. They find that the legal environment (the rules themselves and their enforcement) areimportant determinants of the size and the extent of a country’s capital markets. Thoughthese are early attempts to assess the impact of the legal environment, the overall conclusionssuggest that law has an important bearing on the development of financial markets, and thatcountries operating under English law have more developed financial markets.
2.18 Together, its critical mass and a supporting public policy framework, make Londoncompetitive across a range of wholesale market activity. A practical example of London’scompetitive edge over other European financial centres is provided by Clark (2002). Heillustrates the advantages of London from the point of view of a Swiss investor seeking topurchase investment and management expertise for an emerging-markets equity product:historic expertise, a large range of potential suppliers and auxiliary services (accountancy andlegal services and IT), and a supportive regulatory framework (see Box 2.3).
16
2
The benefits ofcritical mass for
the internationalinvestor
Box 2.3: Why come to London for international financial services – apractical example
Using the example of a Swiss pension fund, Clark (2002) illustrates the advantages ofcoming to London to buy an emerging-market equity product rather than use localsuppliers in Zurich. This provides a practical example of the advantages of critical mass atwork in London, and why it often has a competitive advantage over other financial centres.He cites a number of factors, including:
• London’s historic record in providing these types of products, in part explainedby its connections with a wide range of international markets whose links withLondon have their roots in the British Empire and before. The consequence is thatfirms are attracted to the services it offers on the basis of its reputation andbreadth of experience as well as its competence. The same argument would applyto Edinburgh and its historic expertise in institutional asset management;
• London offers a far greater choice of firms with differing areas of expertise thanthe home market of Zurich, for example extensive research on a variety ofinternational markets. Customers can therefore compare the price and quality ofvarious suppliers and choose the firm with the optimal combination of both;
• London offers a greater range of support services such as legal andaccountancy firms that are called upon in international transactions. Again, beingable to choose from a wide range of competing suppliers is attractive, ensuringthat prices are kept low and service standards maintained; and
• London has a regulatory framework that encourages innovation and theprovision of sophisticated financial products demanded by international investors.Clark makes the general distinction between the UK’s procedural approach toregulation and the Continent’s preference for a rules-based approach. Derivativesare one area where the UK’s regulatory approach has encouraged innovation. Forthe Swiss pension fund, hedging instruments are important tools for managingtheir risk – the UK authorities’ approach is likely to have put London at anadvantage in building the expertise for offering these products.

17
2.19 International market firms operating in the EU appear to have concentrated theirwholesale operations in fewer international centres in recent years. One aim has been toimprove risk control, which can be easier if risk and treasury management functions arelocated in the same place. For the same reasons, the location of euro trading operations hasfollowed that of risk management. Locating wholesale operations in one centre also has thebenefit of reducing regulatory costs associated with dealing with different jurisdictions acrossdifferent legal and tax systems. Indicators of increasing concentration identified by the Bankof England (2002) include:
• the top five investment banks were lead managers for half (by value) ofinternational bond issues by European corporates in 2000;
• the top three investment banks were involved on one side or the other inalmost two thirds of European mergers and acquisitions (M&A) transactionsin 2001 by value; and
• three quarters of foreign exchange transactions in London were carried out by17 market firms in 2001, as opposed to 24 in 1998.
2.20 This trend towards consolidation and exposure to international financial servicesactivity is mirrored in the companies supporting investment banks: for example, Freshfields’merger in 1999 with Bruckhaus Westrick Heller Lober and the consolidation of accountancyservices which are now dominated by the ‘big four’ firms (Ernst and Young,PricewaterhouseCoopers, Deloitte and Touche and KPMG).
2.21 From such evidence and the views of commentators (Beaverstock et al., 2001; Clark,2002; and Sassen, 1991), a hierarchy of financial centres can be identified, based on Begg’s(1992) taxonomy of financial centres (Table 2.4).
2.22 This taxonomy illustrates London’s pivotal role in the global financial system. Londonsits alongside New York at the apex of the hierarchy and, following developments through the1990s, their position as leading financial centres appears more accentuated. They host thevariety of wholesale firms and supporting services required for international wholesaleactivity. Beaverstock and Smith (1996) provide evidence that the presence of these firms inturn attracts international skilled labour, creating a mutually reinforcing relationship that‘locks in’ their position as leading financial centres.
LO N D O N A S A F I N A N C I A L CE N T R E2
A hierarchy offinancial centres

LO N D O N A S A F I N A N C I A L CE N T R E
Table 2.4: Characteristics of financial centres
Characteristics Cities in category
Major nodes of Diversified services; headquarters of major London; New York; Tokyo.global financial financial entities; high volume securities andsystem foreign exchange markets; branches of
foreign banks; ‘switching functions’ for wide geographic spread of business.
Diversified regional Significant cross-border business; headquarters In Europe, London and also centres of major financial and non-financial companies; Paris and Frankfurt. Elsewhere
critical mass in markets; location of regulatory would include Hong Kong bodies; wide range of complementary services. and Singapore.
Specialist centres Niche market expertise. In the UK, Edinburgh. Elsewhere in Europe, Luxembourg, Dublin and Zurich.
National centres Presence of leading financial firms; mix of both In Europe, includes Rome,with limited specialist and general financial services; some Hamburg and Barcelona.international financial markets with mainly domestic clientbusiness base; regulatory functions.
Regional centres Wide range of regional offices; mix of business In UK, includes Leeds and services; some financial headquarters; host Bristol. In Europe, Berlin, to back-office functions. Rotterdam, Turin and Bilbao.
Specialist national Centre for processing activity or presence of In UK, examples would be centres a major financial entity. Norwich and Bournemouth.Source: Adapted from Begg, 1992.
2.23 These characteristics appear to set London apart from the other European financialcentres by making it a ‘global city’ specialised in “control and management of uncertainty andcomplexity” (Sassen, 1991) based on superior information flows. The UK’s trade balance infinancial services and insurance reveals its competitive advantage in these activities, andhelps illustrate the global nature of London’s business. This shows that though growing inimportance, the UK’s most significant source of earnings is not its nearest trading partners inthe EU but the US (Chart 2.1). A sharp fall in the UK’s trade surplus with the US in insuranceand financial services in 2001 reflects sharply deteriorating market conditions, leading to afall in demand as well as a fall in the value of insurance exports, the result of large claims fromUS policy holders. Other European centres’ roles appear more focused on serving theirregional and national markets rather than international markets (Clark, 2002; andBeaverstock et al., 2001) and/or specialising in one area of wholesale activity. The example ofEdinburgh as an important European centre for institutional asset management is a case inpoint (see Box 2.4).
18
2
London: a globalcity

19
2.24 Either Frankfurt or Paris could perform a similar role to London in the European timezone and both have grown. At present, however, they do not offer the liquidity, range ofmarkets or the diverse set of complementary services that mark London out as unique inEurope. The example of the Swiss investor in Box 2.3 demonstrates that any internationalservices these regional centres do not possess can be acquired in London. A representative ofa leading investment bank1 in Frankfurt describes the relationship between Frankfurt andLondon in a recent speech as follows:
“The development of new products takes place in London and it is here thatasset management and trading departments are located. In sum, London isthe global financial centre in Europe. Germany, in contrast, is not a globalfinancial centre. Frankfurt exports very few products (for example,Pfandbriefe) abroad and foreign banks come to Germany to sell the productsand the know-how that they have developed in their own country markets.”
LO N D O N A S A F I N A N C I A L CE N T R E2
Chart 2.1: UK balance of trade in insurance and financial services with leading trading partners
Source: ONS.
0
500
1,000
1,500
2,000
2,500
3,000
3,500
4,000
2001200019991998
JapanUSGermanyFrance
£ million
1 Peter Coym, board member of Lehman Brothers Bankhaus AG, Frankfurt and Chairman of the Association of ForeignBanks in Germany. See Coym (2002).

LO N D O N A S A F I N A N C I A L CE N T R E
20
2Box 2.4: The importance of Scotland as a financial centre
Financial services activities concentrated in Edinburgh and Glasgow represents the secondlargest financial centre in the UK, and the cluster is among the ten largest Europeancentres for banking, life assurance and pension funds and investment management. It ishome to a wide range of support services, including law, accountancy and financialinformation provision. Major overseas financial service players have established a presencein Edinburgh (e.g. State Street Bank and Deutsche Bank), while leading Scottish firmshave remained based in Edinburgh’s financial district (e.g. Scottish Life and ScottishWidows).
Banking
Four banks have their headquarters or major regional offices in Scotland, including TheRoyal Bank of Scotland, the second largest bank in Europe by market capitalisation. HBOSand Lloyds TSB Scotland have headquarters in Edinburgh, and Clydesdale Bank is based inGlasgow, where its parent company, National Australia Group, has its European clearingbank headquarters. Together, Scottish banks have total assets of over £360 billion andhandle about 40 per cent of UK corporate structured finance. While Scotland is known forits retail and corporate banking sector, a number of investment banks have also set upback-office operations in the region.
Asset management
Scotland is one of the world’s major fund management centres, with £294 billion undermanagement in September 2002. Nearly 5 per cent of European pension and long-term lifeassurance funds are managed from Scotland. It is the sixth largest centre in Europe forinstitutional equity management and the fifteenth largest internationally. In the insurancesector, Scottish-based life assurance offices alone currently have over £250 billion of fundsunder management, employing 15,000 people.

1 Clustering is a general idea the appeal of which lies in its applicability to a broad range of scenarios. In essence, it refersto a particular specialised economic activity that is concentrated in one area. Porter (1998, p.197) for example definesclusters as “Geographic concentrations of interconnected companies, specialised suppliers, service providers, firms in relatedindustries, and associated institutions (for example, universities, standards agencies and trade associations) in particular fieldsthat compete but also co-operate.”
3 EC O N O M I C GE O G R A P H Y
21
3.1 One approach to understanding the advantages of a location such as London and itsconcentration of financial services activity is based in economic theory. It comes from thetheoretical insights provided by new economic geography (Krugman, 1991a,b; and Fujita et al.,1999). Other approaches and insights found in economic theory are summarised in Annex C.These models emphasise the importance of external increasing returns to scale in explainingwhy financial services firms might be attracted to individual locations such as London,Frankfurt and Edinburgh and form clusters1 of financial services activity.
New economic geography and c luster ing
3.2 New economic geography suggests that financial firms locate in clusters because theirchoice of location is often dependent on, and in many cases dominated by, the locationdecisions of others. The advantage of locating near to other wholesale firms is that as industryoutput increases, so externalities are produced that lower average costs for the individualfirm. All things being equal, the location becomes more competitive either in terms of lowercosts or higher revenues. As Grilli (1989, p. 391) explains:
“Concentration arises whenever a firm’s productivity directly benefits from theproximity of competitors or firms engaged in related activities.”
This section uses a theoretical approach from new economic geography to helpunderstand why wholesale financial services activity can be so highly concentrated in‘clusters’ such as London.
The theory identifies positive externalities or centripetal forces that attract activityto a cluster. These include greater business opportunities for firms compared to otherlocations, and the availability of skilled labour. Such factors offer competitive advantagesfor firms compared to other locations, and attract them to the cluster. For a cluster togrow, such centripetal forces need to outweigh negative externalities or centrifugal forces,such as the costs of congestion and high commercial rents, that can disperse activity.
The theory shows that once a pattern of growth is established, a cluster’s developmentcan become ‘path dependent’. One lesson drawn is that, in some cases, even smalldifferences between locations at key stages of their development can have significant long-term implications. Path dependency means that clusters can persist for long periods oftime, even when the initial cause for their development is no longer an explanatory factorfor their current position, and it can be hard to change an existing pattern of activity.
In the case of London, the theory suggests that once it established a sufficient mass offinancial expertise, it was able to go on to create a virtuous path of self-sustaininggrowth. On the basis of the evidence presented in Section 2, this critical mass still existstoday.
Path dependency does not, however, remove the risk that clusters can decline. Historicexamples show that factors such as war and political instability can quickly lead to theirdecline. Other more moderate influences can also gradually reduce the relative attractionsof a centre.
Clusters

EC O N O M I C GE O G R A P H Y
3.3 These centripetal forces produced by a concentration of activity in a particular locationare the key to explaining the formation of clusters.
3.4 A good example of how these forces work at the outset of a financial centre’sdevelopment comes from the origin of London’s stock exchange. Investors needed onelocation to buy and sell shares. This demand for liquidity meant shares were initially tradedin coffee houses, where the underwriting of marine risks associated with London’s maritimetrade also took place. As activity increased, so other investors were drawn to London. In turn,this increase in financial activity and its sophistication required an increasingly specialiseddivision of labour to support its activity: jobbers, brokers, banks, accountants and insurancebrokers as well as the institutions to regulate and manage complex financial transactions.
3.5 Hotelling (1929) adds further useful insights into why financial services firms arespatially concentrated rather than seeking locations far away from their competitors. Heobserved that consumers often undertake ‘comparison shopping’. To maximise sales, it paysproducers of financial products to locate close to one another, in recognition that purchasersof financial services will want to compare producers’ prices and the services being offered. Anexample would be the range of insurance brokers and the syndicates that formed Lloyd’s ofLondon, offering to shipping firms a range of marine insurance services covering a variety ofrisks.
3.6 Firms involved in these activities then see locating at a central point – in this case, onefinancial centre or one market – as providing the maximum benefit in terms of being closestto their customers and being able to demonstrate that their products are different from thoseof their competitors.
3.7 Even today, the largest investment banks are rarely able to execute an entire, complexfinancial transaction without using skills sourced from elsewhere. Asset management isanother example of an area of activity that draws upon a range of skills. It requires usinghedging strategies to manage risk as well as core skills required for the management ofinternational equity portfolios. It also draws upon specialist advice from a wide range ofprofessionals such as tax experts adept at understanding international tax and trust law.
3.8 Drawing on Marshall’s (1890) ‘localisation externalities’, examples of centripetal forcesat work in financial centres include:
• as outlined in the example of the London Stock Exchange above, the need tobe physically close to asset markets and tap their liquidity. As discussed inmore detail later in this section, with the advent of new technologies andability to access markets remotely, this is less of an imperative for some classesof activity today;
• access to infrastructure not available elsewhere. Access to an efficientfinancial market infrastructure is key for market participants. Internationaltransport links and high speed telecommunications networks with the abilityto carry high volumes of complex data are also important, as is the availabilityof Grade A office space that can accommodate trading floors;
• the availability of intermediate goods, for example access to a wide variety ofcompeting specialised suppliers that lower the transaction costs of businesscompared to other centres; and
• a pool of labour with a wide range of skills. In a knowledge-intensive industrysuch as financial services, access to a pool of financial talent will be a keyconsideration in the overall location choice.
22
3Centripetal
forces
Comparisonshopping

23
3.9 Locating in the cluster has the added benefit of giving firms and their employees accessto the knowledge network (Lundvall and Borrás, 1997) through which the latest industrythinking is being circulated. Formal routes for such ‘collected learning’ might include industry-organised seminars and briefings where expert views are exchanged. University links such aswith the London Business School and the London School of Economics will also be importantavenues for professionals to learn about new developments. More informal routes would besocial contacts with colleagues in other firms where industry gossip can be shared.
3.10 Even with access to Internet technology and modern telecommunication systems,theory and empirical work shows that such information spillovers matter. By locating in acluster, wholesale market participants can gain timely access to information through theseformal and informal routes and thereby gain a competitive advantage over firms locatedoutside the cluster.
3.11 These forces encourage a concentration of activity. Locating in the cluster thereforeoffers a number of important benefits for wholesale financial firms.
3.12 However, there are also centrifugal forces that offset centripetal forces. These reflect thefact that financial centres are typically based in urban areas. Such agglomerations of activitywill at some stage create ‘stress’ forces as finite resources are stretched to capacity. Thesecentrifugal forces can encourage firms to relocate away from the cluster and discouragefurther entrants. Examples include:
• transport congestion that affects company performance and the generalattractiveness of a location as a place to live and work;
• property costs that rise to uncompetitive levels relative to other locations; and
• ‘tournaments’ for labour as firms bid for limited supplies of skilled labour,forcing up wage bills beyond those justified by productivity improvements.
3.13 Technology also has an influence on location:
• markets can now be accessed ‘remotely’. In theory, trades can take place frommultiple locations, decoupling the location or country of ownership of themarket from the location of the traders using the market;
• information can be accessed and shared more easily through the Internet andwire services; and
• technology can enhance internal scale economies, enabling services to beprovided from one location rather than many.
3.14 A central issue for the location of financial services is the extent to which technology hasled to the so-called ‘death of distance’.2 In some circumstances, technology can permitfinancial services to be provided from any location. Contact with clients can be made bytelephone or Internet. Shares can be traded on-line, and standardised information can besent over long distances without the need for face-to-face contact with customers.
EC O N O M I C GE O G R A P H Y3Sharing
knowledge
Informationspillovers
Centrifugal forces
Technology
The ‘death ofdistance’
2 See for example O’Brien (1992).

EC O N O M I C GE O G R A P H Y
3.15 One example of the ‘death of distance’ is the ability of technology to allow remotemembership of markets. Historically, the existence of an exchange floor has been a feature offinancial centres and was a key clustering force because, without it, there was no way oftransacting business. Remote membership allows direct electronic access to national screen-based trading and settlement systems without establishing a physical presence at themarket’s location (e.g. London-based traders are able to access Euronext based in Paris). Thiseffectively ‘dematerialises’ markets so they do not have a physical presence apart from thehardware and software driving trades, and allows direct electronic access to national screen-based systems without establishing a physical presence at the market’s location (however thatmay be defined). In other words, liquidity is global rather than location specific and thelinkage between financial centres and the location of markets (e.g. the London StockExchange and Euronext) has been largely broken by technology. So while liquidity is beingdriven towards fewer exchanges, technology makes access to these exchanges possiblewithout relocating trading activities to the financial centre hosting the market.
3.16 The impact of technology on location choices depends heavily on which attributes of alocation matter most to a financial sector activity (Nachum and Wymbs, 2002). Wherewholesale activity is heavily reliant on close contacts with clients and needs ready access toskilled labour, then technological development is unlikely to result in relocation outside acluster. This can be expected to apply to most higher valued added wholesale marketactivities such as mergers and acquisition, research, treasury and risk management.
3.17 Technology might, however, have an impact on relocation lower down the value chain.For example, technology might provide strong incentives to relocate bulk-processingoperations to lower-cost locations outside the cluster. One instance is the administration ofmutual funds. Such activities are less dependent on skilled labour and information flows, andinformation can easily be passed back to head offices though telecommunication systems.Another example is Prudential’s recent decision to establish an offshore service centre inMumbai, India.
3.18 Factor immobility may also be a consideration. Once attracted to a particular location,skilled labour may be reluctant to relocate, especially if the existing location such as Londonoffers high levels of cultural amenities compared to lower-cost locations. This makes it harderfor firms to relocate their existing workforce to new locations as well as attracting new, skilledpersonnel.
3.19 Finally, technology means that services can be provided from one location rather thanmany. Where an industry can exploit internal scale economies, lower transport costs (herebeing the introduction of technology) provide the incentive for multinational firms to reducetheir fixed costs and gather operations at one site. Since the costs of providing financialservices across great distances are close to zero, firms can concentrate areas of activity in afewer number of sites to reduce fixed costs and from there offer their services widely.
24
3
25
Table 3.1: Examples of centripetal and centrifugal forces
Centripetal forces Centrifugal forces
• Co-location near to a variety of • Poor public transport
complementary firms and • Congestion
related services • High relative costs – labour, real
• A large pool of skilled labour estate, regulation
• Liquidity and size of markets • Shortages of skilled labour
• Access to financial infrastructure • Immobile factors of production
• Physical infrastructure, especially office space, • Shrinking markets
telecommunications networks and • Technology and the ‘death of distance’
international transport links • Institutional rigidities, including legal systems
• Localised information and and financial regulators
technology spillovers
• ‘Thick’ institutional structures,including regulatory approach
• Initial conditions
3.20 For a financial centre to grow, centripetal forces need to outweigh centrifugal forces.Once a certain critical mass of activity is reached, the centre can then go on to to create aprocess of self-sustaining growth. Here, centripetal factors create a virtuous circle ofagglomeration where other firms and their clients as well as supporting services are attractedby the competitive advantages offered by the cluster.
3.21 As newcomers arrive, so the cluster develops a deep market for skills related to financialactivity (for example, lawyers, accountants and IT specialists) and the cluster is strengthenedand further external economies of scale are created. Studies (Choi et al., 1986; and Jeger et al.,1992) show that the likelihood of attracting a branch of a multinational bank is stronglycorrelated to the number of banks already there – a good example of the basic premise of neweconomic geography, that the choice of location is often dependent on the location decisionof others, and in many cases is dominated by existing patterns of activity.
3.22 As this agglomeration process strengthens, so a location’s development can becomepath dependent: once a pattern of growth is set in train, it can become self reinforcing. Suchpath dependency implies that the prospects of a rapid decline of a cluster are diminished(though not altogether removed), and that the forces holding the cluster together are ‘lockedin’, giving the cluster a degree of robustness against adverse changes in circumstances.
3.23 The idea of path dependency suggests that accidents of history matter, and that smalldifferences at critical stages in a financial centre’s development can have important long-term consequences. Chicago is an example of how an accident of history can matter(Krugman, 1993): it became established as the central city of the mid-West of America withouthaving any particular locational advantages. From that ‘accident of history’, and the fact thatit became the pre-eminent commodities trading city in the US, it went on to develop into theleading global centre for derivatives trading.
3.24 Though clusters appear to persist, they can of course decline. The forward-lookingelement to a firm’s location decision immediately highlights a crucial point in models of neweconomic geography: the locational pattern of financial services activity is dynamic. It can bealtered as profit-maximising firms’ expectations of costs and revenues at different locationschange and they reassess the merits of one location over another. Firms are known to reassessperiodically their requirements, and may decide to leave a location if centrifugal forces arestrong enough to overcome centripetal forces. Relative to their financial resources, any sunk
EC O N O M I C GE O G R A P H Y3
Self-sustaininggrowth
Accidents ofhistory
The decline ofclusters

EC O N O M I C GE O G R A P H Y
costs incurred by leaving a location are unlikely to be a major constraint on large marketplayers’ ability to relocate.
3.25 Predicting exactly when centrifugal forces begin to outweigh centripetal forces isdifficult, partly because the process may be very gradual. Nonetheless, a number of causescan be cited: economic conditions at a location can deteriorate; congestion might becomeunbearable; and other governments might intervene to influence the location choice offinancial services firms, for example through more favourable tax policies.
3.26 Initially, departures may be self stabilising as exits from cluster lower stresses on otherfirms (e.g. less congestion on the roads and lower demand for office space leading to lowerrents). This may even attract firms back into the cluster. At some point, however, the costs ofbeing in a cluster may accelerate and exits become self reinforcing.
3.27 Clear-cut historical examples of financial centres’ decline are provided by Panama andBeirut, where dramatic centrifugal forces forced business away and quickly led to theirdecline as financial centres. More gradual examples are the decline in smaller regional stockmarkets in the EU. In Spain, for example, this has led to an increased concentration ofwholesale financial services activity in Madrid, strengthening its dominance over otherregional markets. Similarly, in France trading has migrated from provincial bourses to Paris.
3.28 Elements from new economic geography theory can be drawn across to the descriptionof London as it is today in Section 2. They suggest that London has the conditions for path-dependent growth. In terms of centripetal forces, its significant strengths include:
• a critical mass in financial expertise, offering a wide range of complementaryservices to the international investor;
• market infrastructure which can support high levels of activity, offeringliquidity to traders which thereby encourages other traders into the market;and
• a pool of skilled labour, and flexible labour markets relative to other financialcentres.
3.29 However, some centrifugal forces are evident that may encourage relocation by somebusinesses to lower-cost locations but are unlikely to lead to the unwinding of London as aleading financial centre. They include:
• a physical infrastructure under stress (in particular, transport and housing);and
• until recent market downturns, which have impacted on both London andoverseas financial centres’ growth, a tight labour market where recruitmentproblems were being experienced.
26
3
Self-stabilisingand self-
reinforcingcauses
Applying theoryto London
4 EC O N O M I C HI S T O RY
27
4.1 This section complements Section 3 by examining the development of London as aninternational financial centre from the perspective of economic history. It does not attempta full analysis of the City’s rich history and the many studies of it. Rather, it draws out someof the salient themes and the key drivers of London’s development as a leading internationalfinancial centre. By doing so, it should help to illustrate the insights of new economicgeography in Section 3 with historical examples. Annex B adds to the analysis by offering asimilar perspective of New York’s development.
4.2 The section begins by outlining the emerging financial infrastructure in London at theturn of the 18th century. It then splits the 130-year period from 1815 to 1945 in line with thetime periods used by Kynaston in his seminal work The City of London.1 Thereafter, this studydeparts from Kynaston in dividing the post-War period into three further sub-periods. This isdone to draw out better some of the key events of the past 50 years or so that have shaped theCity’s development, and to underline the accelerating pace of change in the post-War period.
A br ie f h istory o f the C i ty
4.3 By the end of the 17th century, a thriving financial infrastructure was already in place inLondon. The Bank of England had been established in 1694 to fund the war against France.Though at that time a profit-making bank, it increasingly assumed an important role inmanaging the nation’s finances both in terms of the nation’s debts and, through issuingbanknotes backed by its large bullion reserves, in money markets. Numerous other banksexisted both in London and the rest of the country, facilitating the shift in capital fromregions that were net savers to those in need of capital. This money market function early onin its development as a financial centre gave London a unique character compared toContinental centres, which were more constrained in the activities they could undertake.
This section traces London’s development since the beginning of the 18thcentury to the present day. Its position as supplier of capital and financial clearinghouse to the British Empire and beyond, and a tradition of openness to foreign entry, ledto the establishment of a critical mass of merchant banks and other financial institutionsthat allowed the City to act as the world centre for putting together the financing – andinsuring – of global trade.
This critical mass of financial expertise allowed the City to withstand the subsequentrelative decline of sterling and the UK as an economic power after the First World War,and to make the most of new business opportunities when they came along.
London’s ability to make the most of the opportunities of the new Euromarketsin the late 1950s and early 1960s was perhaps its most important turning point. By doingso, London reinvented itself from acting essentially as an international clearing centre forsterling to the role depicted in Section 2: that of making international markets in a varietyof currencies and providing international financial services across borders.
Since 1979, a deliberate open-door policy to foreign ownership, the ending of foreignexchange controls and a deregulation of some of the City’s markets have added further toits ability to capitalise on the growth in global capital flows which have far outstrippedtrade flows.
1 Kynaston (1994,1995,1999 and 2001).
The 18th century

EC O N O M I C H I S T O RY
4.4 An active, if unsophisticated, stock market had been in operation since the late 17thcentury, used by brokerage firms whose names still remain part of the City’s financialcommunity (immigrant families such as the Cazenoves for example). Immigration had alsoadded to the international character of the merchant banks. A distinguished list of merchantbankers beginning with Barings in 1763 were followed over time by others such asRothschilds, Kleinwort, Lazard and Warburgs, bringing with them expertise in financingforeign trade and handling foreign issues as well as innovations.
4.5 By the end of the Napoleonic Wars, and the starting point of Kynaston’s history, the Cityhad secured its dominant position ahead of Amsterdam as the merchant and trading capitalof Europe and the world. According to Kynaston, this left the City “in a world of its own”. Itplaced London in pole position to act as financial clearing house to the massive increase inworld trade that took place through the 19th century.
4.6 With its large and persistent current account surpluses, Britain acted as a capitalexporter, mainly to the US but also to its colonies. London captured a large slice of the marketto place foreign debt issues – the issuing houses being the international range of merchantbanks already established in the City with contacts across continental Europe and beyond. Itsdominant position in global shipping led naturally to the development of a thrivinginternational marine insurance market, centred around Lloyd’s underwriters. From this base,other insurance markets developed, insuring against natural disasters for instance.
4.7 This was an era when London was moving from performing what was essentially atraditional export function to acting as an entrepôt centre which foreign businesses used notonly to borrow long-term capital but also to place their long-term investment funds. Thisdevelopment was closely related to Britain’s role in the world, particularly the expansion ofthe British Empire abroad and industrial revolution at home. So while the US and Germanysteadily overtook Britain in shares of world trade, through the establishment of aninternational cross-section of merchant banks and other financial institutions, the Citydeveloped the critical mass to act as the world centre for the financing and insuring of thattrade.
4.8 Kynaston has dubbed this era the “golden years”. The majority of industrial trade wasfinanced through sterling-denominated bills drawn on merchant banks based in London.These banks were innovators, and diversified from short-term finance into longer-terminvestment finance and borrowing. Kynaston notes that plentiful back-up services wereavailable in London to support these activities, highlighting three as being especiallyimportant: accountancy, legal and insurance services.
4.9 Some indication of the international flavour of London’s financial community at the endof the 19th century is reflected in the number of foreign banks operating in the City, and thespread of the nationality of ownership. As well as Continental banks, Chinese, Russian andJapanese banks all had a presence. By 1914, the value of deposits of colonial and foreign banksin London was nearly twice that of British banks.
28
4
1815-1890
1890-1914

29
4.10 By 1914 and the advent of the First World War, the City’s fortunes had started to decline.Given sterling’s central role in the previous century, it is not surprising that currency wasperceived as having an equally key role in returning London to its position as the world’sleading financial centre. The belief that a return to the Gold Standard would revive its fortuneshowever proved to be flawed,2 hence Kynaston’s choice of Illusions of Gold as the title for thisvolume of his history of the City.
4.11 The de facto suspension of the pound’s convertibility during the First World War meantin effect that Britain was no longer on the Gold Standard, which in turn weakened sterling asthe currency and the City as the provider of international trade finance. A more dynamic NewYork market was taking an increasing share of business. Its growing importance wasunderpinned by a strengthening dollar, its more widespread use for international trade andthe fact that, like Britain in the previous century, the US was now a capital exporter to acapital-starved Europe in need of reconstruction. In Kynaston’s view “there was no disguisingthe fundamental shift” in the balance between London and New York.
4.12 By this stage, the US was the undisputed world economic power. The financial drain oftwo world wars had left the UK unable to afford exporting its own capital. Strict exchangecontrols aimed to protect scarce reserves. Indeed, tight exchange controls over capital were inplace across Europe and Japan, and the immediate post-War period saw a continuation ofpre-War trends, with sterling’s international role shrinking. Nonetheless, around 40 per centof world trade was still being financed in sterling in the late 1940s, and the UK acted as bankerto the sterling area which remitted the bulk of its dollar receipts to the UK.
4.13 The gradual unwinding of the sterling system in the late 1950s in some ways benefitedLondon, forcing it to look again at its role as a financial centre. Signs of regeneration includeda rekindling of an ‘internationalist’ perspective so important in London’s earlierdevelopment. Pre and post-War immigration brought a new wave of financial talent to theCity, replacing those lost in the war, and with it renewed commercial links to the Continentand beyond. The Bank of England removed a ban on forward dealing in gold, putting Londonon an equal footing with Zurich. Dollar deposits as well as deposits in other currencies grewsteadily, sowing the seeds for the Euromarkets that were to develop in the following years.Other areas, however, remained entrenched in a narrow national view of London’s markets,including the London Stock Exchange, and further reforms were needed to make them fullyopen to international business.
4.14 The catalyst for the upturn in London’s post-War fortunes was clear: the development ofthe Eurobond markets as part of the evolution of the wider Euromarkets (see Box 4.1). At thisstage, what mattered to the City’s well-being was twofold: freedom from unnecessarygovernment interference; and the degree to which it was open to talent from outside its fold.The Euromarkets dynamically combined both and 1963 was the year that the first Eurodollarbond was issued by Warburgs. According to Kynaston (2001, p. 275) “1963 had been the mostimportant year since 1914 in the history of London as an international financial centre”.Podolski (1986, pp. 112–113) echoes Kynaston saying that:
“The development of the Eurocurrency system was perhaps the most importantfinancial innovation of the post war period…comparable to that of coke smelting inthe development of iron and steel, the steam engine in the development ofrailways…”.
EC O N O M I C H I S T O RY41914-1945
1945-1963
1963-1986
2 For further discussion of this issue, see the 2002 Cairncross Lecture given by Ed Balls, Chief Economic Adviser to theTreasury (Balls, 2002).

EC O N O M I C H I S T O RY
4.15 London had a head start in taking advantage of the new opportunities created by theEuromarkets by virtue of the open-door policy practised over a long period. This hadencouraged the development of a critical mass of a diverse set of firms, skills, services andassociated institutions over a sustained period. These were the conditions that provided itwith the competitive edge over other financial centres to take advantage of new opportunitiesafforded by the Euromarkets, and laid the foundations for a new period of rapid growth andprosperity.
30
4
Box 4.1: The early development of Euromarketsa
Drawing on Kynaston (1994, 1995, 1999 and 2001), four stages in the development of theEuromarkets can be identified.
Stage 1: The beginning of the Eurodollar market
From 1945 onwards, a huge pool of Eurodollars developed, so called because they wereheld outside of the jurisdiction of US authorities, the bulk of them in London. The term‘Euromarket’ first applied to the acceptance of offshore deposits, when Moscow NarodnyBank transferred funds out of the US to avoid the possibility that the US authorities wouldconfiscate them. The dollars were transferred to a French bank, and soon all dollarsdeposited in European banks were called Eurodollars.
By making it unattractive to hold short-term deposits in the US, the introduction in theUS of Regulation Q in 1957 artificially capping rates that could be paid on dollar depositsin the US added substantially to the flows of dollar deposits to European banks. The UKauthorities, including the Bank of England, gave tacit backing to the developing market,which was at this stage a simple offshore deposit market. However, the main drivers forthe Euromarkets’ development in London were on the supply side – the infrastructure andskilled labour found in many of the foreign-owned institutions in London.
Stage 2: Taking opportunities in the Eurodollar market
London-based firms saw opportunities in developing the simple Eurodollar deposit marketinto a source of longer-term capital. Warburgs and Samuel Montagu led the way, drawingon the expertise and innovative outlook offered by London’s financial talent. SamuelMontagu placed the first non-sterling foreign loan (to the Belgian Government), withWarburgs creating in 1963 the first Eurobond proper (with a loan for the company whichran Italian motorways).
Stage 3: The catalyst of the Interest Equalisation Tax
In July 1963, the US announced the imposition of a 15 per cent Interest Equalisation Tax(IET) on foreign securities purchased by US citizens from foreigners. A step designed toprotect the US balance of payments had the indirect (and unforeseen) effect of increasingsharply the costs of financial market activity located in the US, with adverse implicationsat the margin for US-based firms in the new and dynamic Euromarkets.
Stage 4: The pace quickens
Although the US (and UK) authorities were slow to catch up with the implication of theIET, firms were not. Several more US banks set up operations in the Eurodollar andEurobond markets in London, joined by a quartet of Tokyo finance houses drawn by theenthusiasm of Japanese concerns to borrow in the new instrument. By the end of 1964,Kynaston’s best estimate is that 44 foreign dollar issues had been made in Europe, raisingthe equivalent of US$681million, with the majority of these issues made in London.
a The prefix ‘euro’ continues to be used and is the legacy of a period when the growth of these markets was inEurope: today, the term Euromarket refer to any offshore market where an instrument, e.g. a Eurobond, is issued ina specific currency outside the currency’s domicile.

31
4.16 US banks aiming to exploit the opportunities offered by the Euromarkets (especially inthe 1970s when the Euromarkets were harnessed by banks to recycle OPEC countries’ hugesurpluses of ‘petrodollars’ and to issue loans) led the transformation of London. They wereattracted by the existing financial infrastructure and the close cultural and trade linksbetween the US and the UK, including that of a common language which gave London anatural advantage over other European centres. However, without a number of key businessenvironment and regulatory changes (some the result of accident rather than design), thesefavourable initial conditions would not have been able to guarantee London’s growth as theleading international financial centre. In Eurobond markets, it was the lack of regulatoryrestrictions compared to other centres that encouraged primary and secondary Eurobondbusiness to take place in London.
4.17 In addition to Euromarkets, the development of investment banking and the increasingrole of investment institutions in the late 1960s and 1970s were additional factors setting theCity on a sharp upward trend. The subsequent abolition of exchange controls in 1979 and theintroduction of full competition to the banking sector by 1980 were crucial foundation stonesfor London’s more recent success, allowing foreign (mainly US) banks to take over Britishconcerns and establish their European time zone wholesale operations in the City. Foreignfirms’ investment came to dominate London’s wholesale markets – ‘the City as FDI’.
4.18 The 1980s were characterised throughout by the modernisation and liberalisation ofLondon’s markets, and the ending of long-established practices. London would trade on areputation of having open and well-run markets with a strengthening of the regulatoryframework that guaranteed equal access for all market participants, e.g. the 1986 FinancialServices Act.
4.19 These revitalised trends towards openness and innovation sustained the growinginternationalisation of the City’s markets, and put them in a strong position to make the mostof the new opportunities available in the EU’s growing capital markets. Old practices wereswept away. ‘Big Bang’ (the term applied to the liberalisation in 1986 of the London StockExchange when trading was automated) was one of the main catalysts for change, makingLondon the first European market to undergo a major deregulation of this type. This providedit with a first-mover advantage over other wholesale financial centres vying for pole positionin the European time zone. This focus on competitiveness meant that foreign investment wasencouraged, resulting in most of the leading wholesale institutions being foreign owned.
4.20 The UK regulatory framework has supported, and continues to support, globalwholesale trading activities. Most recently, a unified financial services regulator, the FinancialServices Authority (FSA) which acquired its full powers on 1 December 2001, was created. TheFSA is required to “bear in mind” when pursuing its statutory objectives “the internationalcharacter of financial services and markets and the desirability of maintaining the competitiveposition of the UK ” (FSA, 2002).
4.21 Applying this narrative to the current position of London set out in Section 2, a numberof themes emerge:
• perhaps most strongly, the importance of the critical mass of financial skills inLondon, often enhanced by waves of immigration (the Warburgs andRothschilds for instance). Being able to draw upon this talent and encouragenew entrants was a critical advantage at key stages of its development, mostimportantly in the advent of the Euromarkets; and
EC O N O M I C H I S T O RY4
1986 to date
Applyingeconomic historyto London today

EC O N O M I C H I S T O RY
• openness to international business and immigration and a proportionate,facilitative regulatory style free from government interference, particularlyover the last 25 years, allowed new practices to spread quickly, encouraginginnovation and growth.
4.22 The success of London, particularly since the 1960s, has depended on the decoupling ofcurrency and location: the City’s strength has largely been independent of the fortunes of theUK economy and currency, sterling or otherwise. By taking full advantage of this decoupling,London has – over a period of more than a century – moved from being a centre grounded inthe UK’s dominant global economic position, and the role of sterling, to the one described inSection 2: that of making international markets in a variety of currencies and providinginternational financial services across borders.
32
4
A key insight

5 DE V E LO P M E N T S I N EU R O F I N A N C I A L
MA R K E T S S I N C E 1999
33
5.1 The study now turns to euro financial market developments since the euro’sintroduction in 1999 to identify trends that might have influenced the development offinancial centres and the location of wholesale activity. Apart from the introduction of theeuro, the European financial services landscape has been most influenced by the recentsharp downturn in equity markets since 2000.
5.2 Falls in equity prices have hit fund managers, stockbrokers and the life insurance sectorparticularly severely, as well as denting merger and acquisition activity. Their effects are nowbeing seen in job losses in the City and overseas financial centres. In the short run, furtherretrenchment by market participants seems probable unless global markets quickly reversetheir recent falls. This background makes it difficult to predict how recent reversals mightimpact on the long-term behaviour of firms and on investors’ strategies. It underlines thefluid and open nature of the wholesale financial services environment, where trends becomeestablished quickly and shocks are transmitted rapidly.
5.3 A key question addressed is whether London has been able to participate fully in theeuro financial markets. Currency has not been the only factor affecting the structure of eurofinancial markets. The discussion therefore considers other developments shaping financialservices in Europe, including regulation in the form of the Financial Services Action Plan(FSAP), industry consolidation and attempts to rationalise European market infrastructurethat remains fragmented along national lines.
Discerning specific factors behind any structural changes in euro financial markets since1999 is made difficult by the recent equity market downturn. This has forced firms tore-evaluate priorities, and uncertainty remains about what the eventual outcomes will bein terms of their location decisions.
Until the sharp downturn in markets since 2000, EU financial centres had beengrowing as a result of market liberalisation and a growing equity culture among euro areainvestors. The introduction of the euro is generally seen to have had a positiveimpact, especially in encouraging the growth of the euro corporate bond market. It hasalso encouraged some further integration in the euro area. One direct consequence of thesingle currency has been the need to build an efficient euro area wholesale paymentssystem infrastructure that ensures a smooth flow of funds across the euro area.
The euro has, however, been only one of a number of factors at work in eurofinancial markets. Other trends include the increased globalisation of the financialservices sector, changing business strategies marked by increased consolidation, achanging business environment especially in the regulatory framework being developedwithin the Financial Services Action Plan (FSAP), and supply-side conditions continuing tobe influenced by the impact of technology.
London has played a full part in these euro financial market developments andhas not been excluded as a result of the UK not being part of the euro area – the evidenceshows that, to date, London has maintained market share and has benefited from accessto euro financial market infrastructure.
Falls in equitymarkets

DE V E LO P M E N T S I N EU R O F I N A N C I A L MA R K E T S S I N C E 1999
Euro f inanc ia l market deve lopments
5.4 The market most directly affected by the introduction of the single currency has been theforeign exchange market. A significant decline in the value of foreign exchange turnover wasseen between 1998 and 2001 in leading financial centres. Much of the fall can be explained bythe replacement of the legacy currencies with the euro on 1 January 1999. Other importantfactors were, however, at work, including consolidation in the banking industry and theincreasing use of more efficient electronic trading systems.
5.5 The fall in trading volumes associated with the euro’s introduction created acorresponding fall in foreign exchange fee revenues for market participants. One estimateputs the loss at around 12 per cent of total foreign exchange revenue, and factoring in thevehicle trades using the dollar, the figure rises to between 13 and 15 per cent of total foreignexchange revenue (Danthine et al., 2000). With increased competition for the remainingforeign exchange business, most pressure has been seen in spot foreign exchange markets,where further consolidation is likely. Though representing a loss to brokers and banks, thisloss of foreign exchange fee income is a transfer to other agents, and creates an overalleconomic gain as markets become more efficient and consumers no longer incur currencytransaction costs.
5.6 Though it has lost foreign exchange fee income, in terms of market share London hasmaintained its dominance over other financial centres. Daily trading volumes were overUS$500 billion in 2001 or around 31 per cent of daily global foreign exchange turnover (seeChart 5.1). In comparison, its nearest rival, New York, transacts around 16 per cent of dailyglobal foreign exchange turnover.
34
5
Currencymarkets
Chart 5.1: Average daily foreign exchange turnover
Source: Bank for International Settlements (BIS), 2002a.
0
100
200
300
400
500
600
700US$ billion
UK US Germany France
1992 1995 1998 2001

35
5.7 A direct consequence of the single currency has been the need to build an efficient europayment system that ensures a smooth flow of funds across the euro markets. The successfulintroduction of TARGET,1 the EU’s real-time gross settlement system, has allowed funds tomove smoothly across the EU. This has helped the integration of euro money markets andlowered liquidity costs. Short-term interest rates have converged and the unsecured euromoney markets are now fully integrated.
5.8 TARGET provides a cheap and effective route for wholesale euro payments acrossborders and is now the dominant euro payment system. While it has had relatively fewtechnical or functional problems, plans are in place to improve it further. The UK is thesecond largest user of TARGET (see Chart 5.2), especially impressive given that UK banks arealso heavy users of other euro payment systems such as the Euro Banking Association’s (EBA)EURO1 system. In 2002, CHAPS Euro accounted for 18 per cent by both volume and value ofall cross-border payments made through TARGET. This has increased from 10 per cent byvolume and 15 per cent by value when the euro was launched in January 1999.
5.9 In terms of market activity, the introduction of the euro has probably had the mostpositive impact on the euro corporate bond market. Jean Dermine in his contribution to theEMU study Submissions on EMU from leading academics provides evidence that the removalof the legacy currencies has taken away a competitive advantage for banks in some MemberStates. He quotes work by Santas and Tsatsaronis (2002) that shows that prior to the euro’sintroduction in 1999, over 80 per cent of bond issues were underwritten by banks from acountry with the same currency denomination. In the post-EMU period (1999-2001), this hadfallen to less than 60 per cent.
DE V E LO P M E N T S I N EU R O F I N A N C I A L MA R K E T S S I N C E 19995TARGET
1 Trans-European Automated Real-time Gross settlement Express Transfer system: this links the 15 euro-denominatedReal-Time Gross Settlement (RTGS) systems in the EU and the ECB payment mechanism to provide an EU-wide RTGSsystem.
Chart 5.2: Share of cross-border euro RTGS1 payments by value
1 Real-Time Gross Settlement. Source: ECB.
0
5
10
15
20
25
30
0
5
10
15
20
25
30
OthersUKNetherlandsItalyFranceGermanyBelgium
Jan-99
Apr-9
9Jul
-99
Oct-99
Jan-00
Apr-0
0Jul
-00
Oct-00
Jan-01
Apr-0
1Jul
-01
Oct-01
Jan-02
Apr-0
2Jul
-02
Oct-02
Dec-02
Per cent
Corporate bonds

DE V E LO P M E N T S I N EU R O F I N A N C I A L MA R K E T S S I N C E 1999
5.10 The market has grown strongly since 1999 (see Chart 5.3), primarily driven by issuancesof commercial bonds mostly by the financial sector. The average size of issues has increased,as has the range of credit ratings offered. Factors other than the introduction of the euro haveplayed a part in these trends – other international markets also witnessed increases inissuance in 1999. One important factor was a market rebound after the Russian debt defaultand the Long Term Capital Management (LTCM) crisis in late 1998. In addition, the sectorreceived a boost from several large issues from the telecommunications sector, used tofinance the purchase of third-generation mobile phone licences. However, the corporatebond market fell back in 2002 due to the deteriorating global economic environment.
5.11 London has participated fully in the growth in the euro-denominated bond market. Asthe ECB (2002a, p. 25) notes, the City is “one of the main channels through which non-euroarea residents purchase euro-denominated bonds issued inside and outside the euro area”. TheBank of England estimates that London’s market share of the issuance of euro-denominatedEurobonds in 2002 was around 60 per cent compared to 50 per cent in 1999 (see Chart 5.4).
36
5
Chart 5.3: Gross issuance of international bonds and notes
Source: BIS, 2002.
SterlingEuro US dollar
US$ billion
0
50
100
150
200
250
300
350
2001 Q42000 Q41999 Q41998 Q41997 Q41996 Q41995 Q41994 Q41993 Q4

37
5.12 Through the removal of currency risk, an increase in price transparency and thelowering of transaction costs, the euro has encouraged some increase in cross-borderfinancial services trade and investment flows, adding further impetus toward greaterintegration in the Single Market. The single currency has also encouraged integration bylowering or removing technical and regulatory barriers in euro area countries (e.g. therequirement in some Member States for pension funds to currency match their assets andliabilities), and led to the reduction in the marked home-market bias that characterises manyinvestors’ portfolios in the EU. Evidence of this latter trend is noted by Jean Dermine in hiscontribution to the EMU study Submissions on EMU from leading academics.
5.13 Equity issuance in the euro area rose sharply in 1999 and 2000 compared to the pre-europeriod. New equity worth US$86 billion was issued in 2000 Q1-Q3, compared with US$108billion in full year 1999 and an annual average of US$56 billion between 1995 and 1998.2 Theeuro, however, does not explain this increase, with the cause lying in a combination of otherfactors.
5.14 Until 2000, a gradual cultural shift by investors in the euro area towards higher-riskequity-based assets had been seen. Similarly, euro area firms had started moving fromtraditional bank-based financing arrangements to greater use of market-based financing.Both led to an increasing demand for funding through capital market instruments and hencefor wholesale market services. The value of European equity markets was rising sharply in the1990s, mirroring those in the US and the UK, and this in turn encouraged equity issuance. Inaddition, a substantial proportion of new issuance was in the telecommunications andtechnology sectors, propelled by rapid worldwide growth in these areas towards the end ofthe 1990s. Increasing merger and acquisition activity in the euro area had also led toincreased equity issuance.
DE V E LO P M E N T S I N EU R O F I N A N C I A L MA R K E T S S I N C E 19995
Chart 5.4: Euro-denominated Eurobond issuance
Source: Dealogic.
0
50
100
150
200
250
2002Q3
2002Q2
2002Q1
2001Q4
2001Q3
2001Q2
2001Q1
2000Q4
2000Q3
2000Q2
2000Q1
1999Q4
1999Q3
1999Q2
1999Q1
2002Q4
UK Others
� billion
2 Bank of England (2000).
Equity markets

5.15 The growth of new equity issuance coincided with the continued expansion of EUmutual funds, signalling the change in EU investors’ attitudes to higher-risk, equity-backedinvestments. In 1992, EU mutual fund assets totalled 8.2 per cent of EU GDP. By 1998 this hadrisen to 31 per cent.3
5.16 Since 2000, equity markets in the euro area, the US and the UK have fallen substantially,especially in the telecommunications and technology sectors. This confirms the importanceof sectoral developments in the market, and makes it all the more difficult to isolate any EMUeffect. On balance, though recent equity market falls have certainly dented confidence, thelonger-term trend appears to point to further shifts towards an equity culture in the euro area.The ageing European population and the increase in demand expected for personal savingsthrough pension funds and mutual funds should continue to provide finance for investmentin the euro area equity market in the future.
5.17 Financial innovation continues apace in European markets, encouraged by theintroduction of new technologies and the ongoing liberalisation and deregulation of MemberStates’ capital markets through initiatives at the national and supra-national levels. The trendis most visible in two areas. First, the increasing use of asset-backed securities (i.e. thesecuritisation of debt), which is still under-developed compared to the US. Second, the rapidgrowth in the use of over-the-counter (OTC) and exchange-traded financial derivatives – forexample, the euro area OTC derivatives market grew by around 35 per cent between April1998 and April 2001.4 The euro is likely to have contributed to this growth by creating a largeand liquid market for euro-denominated interest rate swaps. The euro’s introduction may,however, have been behind the fall in euro area OTC and exchange-traded foreign exchangeinstruments over the same period.
5.18 Running alongside the general process of financial market integration has been arestructuring and rationalisation of the banking and financial services industry, and a trendtowards consolidation. The sustained period of rising asset markets in the 1990s provided theopportunities for firms to take over rivals, encouraged by rapid developments inliberalisation, technology and globalisation in the financial services industry. The relaxationof regulatory constraints, which had for example excluded commercial banks from enteringinvestment banking and asset management, has encouraged tie-ups between financialservices firms. As a result of such developments, there has been a significant number of majorbanking mergers and mergers between banks and other financial companies such asinsurance firms to form ‘bancassurance’ groups. The merger between Allianz and Dresdner isa recent example.
5.19 Most of these mergers have been between companies from the same country. Cross-border mergers, which the euro might have been expected to stimulate, have so far beenlimited. The wholesale banking sector is already very concentrated, limiting the possibilitiesfor cross-border mergers. More scope exists for cross-border mergers between commercialbanks, and a few of these have taken place, but significant barriers remain:
• legal and regulatory rules vary considerably between countries;
• for cultural reasons, customers may prefer local banks;
• savings may not be as great as for domestic mergers where overlappingservices can be reduced; and
• availability of information on credit history and current financialcharacteristics may be limited.
38
3 Bank of England (2000).4 ECB (2002b).
Innovation
Industrystructure
DE V E LO P M E N T S I N EU R O F I N A N C I A L MA R K E T S S I N C E 19995

39
5.20 Underpinning wholesale market activity has been market infrastructure: tradingplatforms, clearing houses and settlement systems. Compared to US markets, Europeanequity markets are more segmented, reflecting previous national arrangements and a splitbetween clearing and settlement systems. EU market infrastructure is now going through aperiod of intense change. As Europe moves towards a Single Market for financial services,providers of market infrastructure have been restructuring themselves and looking to link upwith providers across (although also within) borders. New entrants are also providingcompetition for existing providers.
5.21 The most significant development since the start of EMU has been the establishment ofEuronext, through the merger of the Paris, Brussels and Amsterdam stock exchanges. ThePortuguese exchange has now joined Euronext; and in early 2002, Euronext purchased theLondon derivatives exchange LIFFE.
5.22 In the bond market, Euro-MTS is a common platform that has been created for tradingthe government bonds of Belgium, Finland, Germany, Greece, Spain, France, Italy, Ireland,Portugal, the Netherlands and Austria.
5.23 Before EMU, European settlement systems were based on a framework of nationalcentral security depositories (CSDs) in each Member State, plus two internationaldepositories (ICSDs). Two separate mergers so far have taken place: Cedelbank, an ICSDbased in Luxembourg, merged with Deutsche Börse Clearing, the German CSD, to formClearstream (which has recently been taken over by Deutsche Börse); while Euroclear, whichsettles trades for Euronext’s exchanges in Europe, acquired the national CSDs of France,Belgium and the Netherlands and more recently London’s CREST. The new Euroclear groupwill handle about 60 per cent of trades in leading European equities and more than 50 percent of fixed income trades.5
5.24 In addition to these three main infrastructure elements for securities, there are also twopan-European payment systems mentioned earlier: TARGET, the ECB’s cross border paymentsystem, and the EBA’s EURO1, which, by allowing commercial banks to manage euro liquidityin a virtual single pool, are contributing to the integration of euro trading and settlement.
5.25 Most of these market infrastructure developments have been driven by a strong case torationalise European market infrastructure – access to their services has not been driven byconsideration of membership of the single currency. Remote access to trading platforms inLondon (e.g. the London Stock Exchange and Euronext-LIFFE) is unrestricted; similarly,London-based traders have unrestricted access to trading platforms in most other euro areafinancial centres (e.g. Eurex based in Frankfurt). Where restrictions do remain, for example tocross-border access to settlement systems, they are the result of national rules and not relatedto membership or otherwise of the single currency.
5.26 Regulation of financial services has continued to evolve and is set to influence furtherthe shape of the sector and where activity takes place. International agreements have playedtheir part, increasing competition and market opportunities through encouraging theopening of national markets, but it is at the European level that the greatest impact on theUK-based sector has been seen.
DE V E LO P M E N T S I N EU R O F I N A N C I A L MA R K E T S S I N C E 19995Developments in
euro financialmarket
infrastructure
Regulation
5 Based on pre-merger volumes.

DE V E LO P M E N T S I N EU R O F I N A N C I A L MA R K E T S S I N C E 1999
5.27 Steps to create a Single European Market in financial services have gradually removedMember States’ barriers to trade in financial services. More progress has been made inwholesale financial services, which are generally viewed as more integrated in the EUcompared with retail financial services. In recognition that there is more to do, however, theEU has set in train a series of initiatives contained in the FSAP adopted in 1999. This aims toaddress the remaining barriers in the Single Market and progress in a number of areas hasalready been made (see Box 5.1).
Developments in Par is and Frankfurt
5.28 Paris and Frankfurt – the other leading European financial centres alongside London –have seen growth over the past decade and established healthy market shares in a number ofactivities. Growth has come through a number of routes. Member States’ markets have beenderegulated, stimulating demand for wholesale services helped by a cultural shift in attitudesby firms and consumers in the euro area towards capital markets.
40
5
Box 5.1: The Financial Services Action Plan
Integration of financial services across the EU has the potential to be an important factorin boosting productive investment. A report published by the European Commission in late2002 suggested that full integration of EU financial markets would result in: a 0.5percentage point reduction in the cost of equity capital for EU business; a 0.4 percentagepoint reduction in the cost of corporate debt financing; and a one-off increase in EU15 GDPover 10 years of about 1.1 per cent (equivalent to €130 billion in 2002 prices) and anincrease in EU15 employment of 0.5 per cent over the same period.
Adopted in 1999, the FSAP aims to:
• create a single wholesale financial market to allow companies to raise capital on anEU-wide basis;
• complete a single EU retail market, ensuring consumer choice while maintainingconsumer confidence and protection; and
• underpin all of this through state of the art prudential rules and supervision.
Over 30 of the FSAP’s 42 measures have been adopted at the EU level, with progressunder way on many others. Key recent developments have included:
• adoption of a new Collateral Directive, which will provide increased legal certaintyas to the validity and enforceability of collateral in cross-border securities markets;
• agreement on a single set of accounting standards, allowing financial reports to beproduced on a consistent and comparable basis across the EU; and
• progress on the Prospectus Directive, intended to facilitate companies wanting toraise capital across the EU on the basis of a single prospectus. A revision of theInvestment Services Directive is an important element of the FSAP currentlyunder negotiation.
However, adoption of FSAP measures at the EU level is only part of the process. Effectiveimplementation by Member States is essential, as is enforcement.
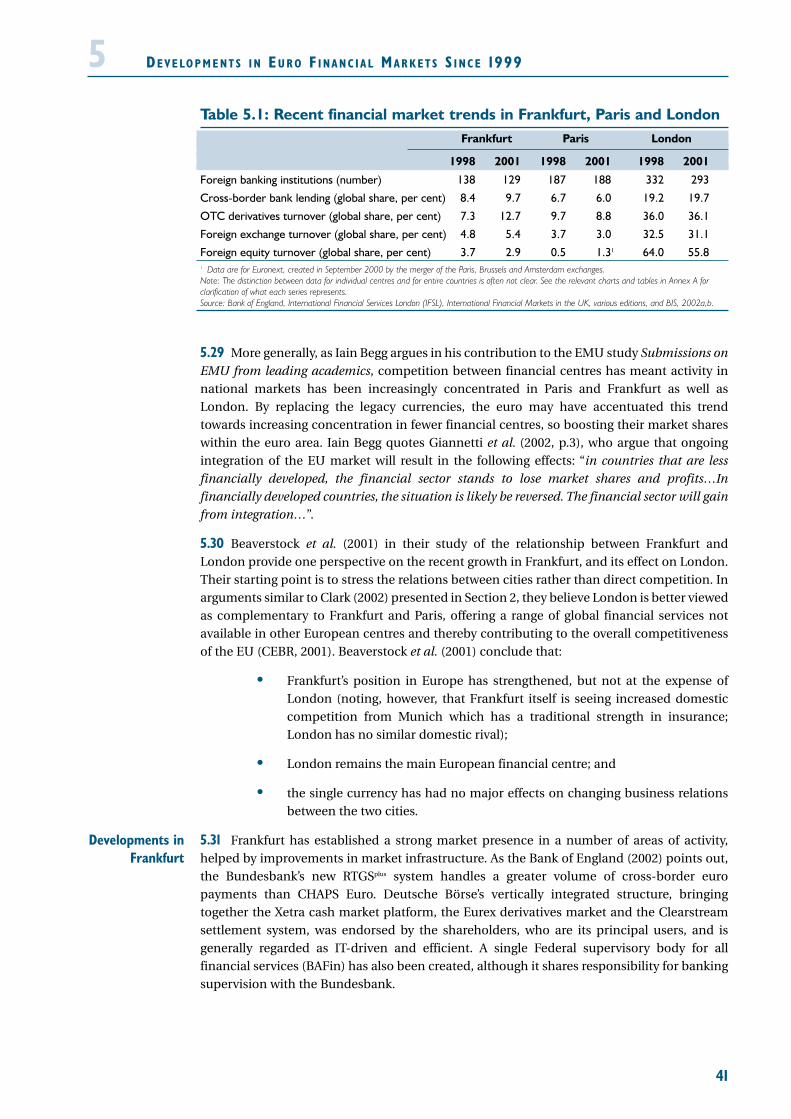
41
Table 5.1: Recent financial market trends in Frankfurt, Paris and LondonFrankfurt Paris London
1998 2001 1998 2001 1998 2001
Foreign banking institutions (number) 138 129 187 188 332 293
Cross-border bank lending (global share, per cent) 8.4 9.7 6.7 6.0 19.2 19.7
OTC derivatives turnover (global share, per cent) 7.3 12.7 9.7 8.8 36.0 36.1
Foreign exchange turnover (global share, per cent) 4.8 5.4 3.7 3.0 32.5 31.1
Foreign equity turnover (global share, per cent) 3.7 2.9 0.5 1.31 64.0 55.81 Data are for Euronext, created in September 2000 by the merger of the Paris, Brussels and Amsterdam exchanges.Note: The distinction between data for individual centres and for entire countries is often not clear. See the relevant charts and tables in Annex A forclarification of what each series represents.Source: Bank of England, International Financial Services London (IFSL), International Financial Markets in the UK, various editions, and BIS, 2002a,b.
5.29 More generally, as Iain Begg argues in his contribution to the EMU study Submissions onEMU from leading academics, competition between financial centres has meant activity innational markets has been increasingly concentrated in Paris and Frankfurt as well asLondon. By replacing the legacy currencies, the euro may have accentuated this trendtowards increasing concentration in fewer financial centres, so boosting their market shareswithin the euro area. Iain Begg quotes Giannetti et al. (2002, p.3), who argue that ongoingintegration of the EU market will result in the following effects: “in countries that are lessfinancially developed, the financial sector stands to lose market shares and profits…Infinancially developed countries, the situation is likely be reversed. The financial sector will gainfrom integration…”.
5.30 Beaverstock et al. (2001) in their study of the relationship between Frankfurt andLondon provide one perspective on the recent growth in Frankfurt, and its effect on London.Their starting point is to stress the relations between cities rather than direct competition. Inarguments similar to Clark (2002) presented in Section 2, they believe London is better viewedas complementary to Frankfurt and Paris, offering a range of global financial services notavailable in other European centres and thereby contributing to the overall competitivenessof the EU (CEBR, 2001). Beaverstock et al. (2001) conclude that:
• Frankfurt’s position in Europe has strengthened, but not at the expense ofLondon (noting, however, that Frankfurt itself is seeing increased domesticcompetition from Munich which has a traditional strength in insurance;London has no similar domestic rival);
• London remains the main European financial centre; and
• the single currency has had no major effects on changing business relationsbetween the two cities.
5.31 Frankfurt has established a strong market presence in a number of areas of activity,helped by improvements in market infrastructure. As the Bank of England (2002) points out,the Bundesbank’s new RTGSplus system handles a greater volume of cross-border europayments than CHAPS Euro. Deutsche Börse’s vertically integrated structure, bringingtogether the Xetra cash market platform, the Eurex derivatives market and the Clearstreamsettlement system, was endorsed by the shareholders, who are its principal users, and isgenerally regarded as IT-driven and efficient. A single Federal supervisory body for allfinancial services (BAFin) has also been created, although it shares responsibility for bankingsupervision with the Bundesbank.
DE V E LO P M E N T S I N EU R O F I N A N C I A L MA R K E T S S I N C E 19995
Developments inFrankfurt

5.32 The status of Frankfurt as a trading centre for euro-denominated Eurobonds mightpotentially have been enhanced by the use of the long Bund as a benchmark. Trading volumeshave, however, fallen off sharply since 1998 and Frankfurt has lost ground to London inbookrunning for new euro-denominated Eurobond issues (as noted in Section 2, London-based bookrunners took around a 60 per cent share of the market in 2002).
5.33 However, to the extent that the arrival of the euro has stimulated euro-denominatedEurobond issuance, it may also have contributed to the very substantial increase in euro-denominated derivatives business on Eurex, the German-Swiss derivatives market based inFrankfurt. The total number of contracts traded on Eurex in 2001 was over two and a halftimes greater than in 1998 and, although over 40 per cent of all contracts traded on Eurex in2002 involved UK-based traders, the majority of the exchange revenues from this activityaccrue to Deutsche Börse AG in Frankfurt. The market in short-term euro derivatives remainsfirmly rooted in London, as does the foreign exchange market where Frankfurt’s market sharehas changed little in recent years.
5.34 In contrast, OTC derivatives trading has grown faster in Germany than in any othermajor financial centre, almost trebling in volume between April 1998 and April 2001, leadingto Germany’s global share of this market rising from 7.3 per cent to 12.7 per cent over thesame period.
5.35 In the late 1990s, large American investment banks built up sales and marketing teamsin Frankfurt to maintain client relationships with a view to future merger and acquisition andnew issues business. Thus far, they are maintaining a presence during the present lean periodin the expectation of business when the equity market recovers and re-structuring resumes,driven by globalisation and by the growing impact of the Single Market (to which the euro islikely to contribute).
5.36 The number of authorised foreign banks in Frankfurt has, however, fallen from a peak of138 in 1998 to 126 in 2002. The Association of Foreign Banks in Germany says this is due tothe withdrawal of several Japanese Banks and to banking mergers. The total business volumeof foreign banks was only 1.5 per cent greater in 2001 than at the end of 1998, and theircollective share of the total volume of business of all banks in Frankfurt fell over the sameperiod from 11.5 per cent to under 9 per cent, primarily reflecting the foreign banks’ relativedependence on investment banking opportunities that have been limited by market falls.
5.37 Paris is a leading European and international financial centre, with a particular strengthin the fund management business, where it can draw on a large pool of local savings. It hasnearly 200 foreign bank branches and subsidiaries, and ongoing consolidation within thedomestic banking sector may eventually enhance French banks’ presence in the euro area.Historically, however, Paris has not been a leading centre for foreign exchange trading and thelevel of foreign exchange dealing in Paris has continued to decline. The latest BIS survey inApril 2001 showed daily turnover in Paris averaged US$48 billion, less than half of Frankfurtand one tenth of London.
5.38 France has been working towards reform and rationalisation of the financial marketregulators, with a view to enhancing their effectiveness. On 5 February 2003, the FrenchGovernment approved and sent Parliament the Loi de Securité Financière. This will create a‘twin peaks’ system of regulation through the creation of a new markets regulator, theAuthorité des Marchés Financiers, formed through the merger of three existing bodies (theCommission des Opérations de Bourse, the Conseil des Marchés Financiers and the Conseilde la Discipline de la Gestion Financière) sitting alongside the Commission Bancaire and aunified insurance regulator.
42
Developmentsin Paris
DE V E LO P M E N T S I N EU R O F I N A N C I A L MA R K E T S S I N C E 19995

43
5.39 Paris has suffered with other European wholesale financial centres from the unwindingof the 1990s equity bull market. The CAC 40 recorded its largest ever fall last year, down byaround 34 per cent. The bond market has, however, fared better, especially governmentbonds, thanks to the efforts of the Trésor’s Debt Management Agency, Agence France Trésor(AFT). Investors have seen the bond market as a relative safe-haven and French governmentbonds have done especially well. AFT have worked closely with the markets to develop anattentive debt management style, which to date has worked very smoothly. The introductionof both domestic inflation-linked and euro area inflation-linked securities (OATi and OATei)has been a success, attracting both national and international investors ranging from pensionfunds to hedge funds. Good back-office systems have helped trading, although thefutures/options market is less well developed.
5.40 In terms of exchanges, Paris’ cash and derivative markets are part of the recently formedEuronext group of exchanges. Euronext is one of the three largest equity exchanges in Europeand the largest derivatives exchange, Matif, has been fully integrated into Euronext-Liffe andis now focusing on equity and commodity instruments (in 2002 equity contract volumes roseby 15 per cent and commodities by 50 per cent) with the bulk of its business in CAC 40futures/options. NextWarrants was launched in May 2002, and groups 20 issuers acrossEuronext’s four markets (10 are Paris-based, dominated by Credit Agricole, SocGen and BNP-Paribas). The warrants business is looking to attract Paris-based US investment banks to helpoffset the decline in activity (the volume of transactions fell from 2.8 million to 2.7 millionbetween 2001 and 2002).
DE V E LO P M E N T S I N EU R O F I N A N C I A L MA R K E T S S I N C E 19995

44

6 FAC T O R S SH A P I N G F I N A N C I A L
CE N T R E S ’ DE V E LO P M E N T
45
6.1 The previous sections have set out how and why London has established itself as amajor international wholesale financial market centre. To help inform the assessment of thefive economic tests for EMU entry, this section looks at the factors shaping London’s andother financial centres’ development. It does not attempt to evaluate the relative impact ofthese factors or what impact UK entry would have on the City. This is a matter for theassessment itself.
6.2 Five drivers of financial centres’ development were identified at the outset of the study.These are:
• globalisation, as evidenced by increased integration and greater global reachof both suppliers of, and customers for, finance. Trends are becomingestablished more quickly and shocks can be transmitted more rapidly acrossnational boundaries;
• a changing business environment, particularly in relation to the ongoingdevelopment of regulation and other aspects of public policy towards labour,products, tax and profits;
• supply-side determinants, including the continuing impact of technology onbusinesses and their location choices;
This section looks at the potential factors that affect the location decisions of wholesalefinancial services firms and shape financial centres such as London. It does not attempt toevaluate the relative importance of these factors, or what impact UK entry to EMU wouldhave on the City. This is a matter for the assessment of the financial services test itself.
Globalisation is likely to lead to greater integration of markets and greater global reachof both suppliers of, and customers for, finance. The way these trends play out may havewider implications for financial centres in terms of businesses’ strategies and policymakers’responses to the implications of greater integration.
The business environment is likely to be affected by public policy, both domestic andEuropean. The development of EU financial services policy through the FSAP will be a keydriver for change. As well as potential benefits, there are also potential risks in the waythat new EU legislation may affect location decisions.
On the supply side, technology is likely to continue to have an influence. It has alreadymeant that markets can potentially be accessed from any location. It has increased thelocational mobility of firms and certain types of activity. Lower value added bulk processingfunctions, for example, can now be relocated to lower cost locations. Technology can alsomean that wholesale services can be provided from one location rather than many,providing a countervailing force to the dispersion effects that technology can have.
Business strategies are likely to evolve in response to the growing opportunities andchallenges posed by EU market deregulation, technology and the increasing global natureof financial services. Recent equity market downturns have, however, slowed the previoustrend towards consolidation.
In terms of the euro, the evidence available thus far suggests that London has been ableto participate fully in euro financial markets. To date, the competitiveness of the City (andother UK financial centres) as a location for wholesale activity remains in place, and lies inthe forces that create and sustain clusters.
Five drivers

FAC T O R S SH A P I N G F I N A N C I A L CE N T R E S ’ DE V E LO P M E N T
• changing business strategies, in particular consolidation in the EU bankingsector; and
• the role of currency, here being the advent of the euro.
What economic geography and economic h istory suggest
6.3 Both economic geography and economic history suggest a number of common themesthat explain the development of London as a major international financial centre. Initialconditions were obviously important, especially openness to foreign entry and relativelylightly regulated markets, which gave London a ‘first-mover advantage’ among Europeanfinancial centres. Further policy action to encourage cross-border activity also helped it tobecome a leading international financial centre.
6.4 The effects were to attract quickly a critical mass of expertise into the City. This path-dependent growth allowed the City to withstand periods of relative decline in the UKeconomy. Key characteristics such as openness and an appropriate regulatory culture alsogave London an ability to respond quickly to new developments and events and to make themost of the accidents of history that crossed the City’s path, the most important probablybeing the advent of the Euromarkets in the late 1950s and early 1960s.
6.5 By taking full advantage of these opportunities over the course of time, London hasreinvented itself from acting essentially as an international clearing centre for sterling,building on the UK’s role in the world economy and trade, to making international markets ina variety of currencies and providing international financial services across borders.
6.6 The evidence suggests that London’s competitiveness is largely decoupled from thestrength of the underlying economy and the domestic currency regime. From both aneconomic history and economic geography perspective, the basis for its competitiveness isinstead to be found in the clustering forces that attracted a critical mass of internationalwholesale activity to the City and a supportive public policy framework at key junctures in itsdevelopment. They explain why the City can currently compete successfully in all the marketsidentified by Clark (2002) in Section 2:
• its global role facilitating and mediating in financial interactions between theEuropean time zone, the US, Asia and the rest of the world;
• its regional (i.e. EU) role providing financial products not found in other euroarea centres such as Paris or Frankfurt. If other centres do provide theseservices, London’s critical mass means that they often cannot compete on costor quality grounds; and
• the national role, for example as a provider of domestic financial services suchas the very significant volume of institutional and pension assets managed byLondon.
6.7 The remainder of this section examines the five drivers identified in Section 1 shapingLondon’s and other financial centres’ development.
46
6

47
Global isat ion
6.8 Globalisation represents the increasing integration of national product, capital and, tosome extent, labour markets. Key elements adding to this trend include:
• further reduction in trade barriers, through policy initiatives such as the DohaWTO round and, in Europe, from EU enlargement and further structuralreform within the EU;
• an increasing weight of companies with a global reach and strategy, whichmight be looking to raise finance on a global rather than national or regional(i.e. EU) basis;
• greater locational mobility of firms and the further use of out-sourcing ofelements of the production chain across national boundaries to lower-costcentres; and
• a further tendency towards the development of international or globalstandards and their more widespread use. Examples might range frominternational accounting standards, off-the-shelf financial contracts andstandards for the prudential supervision of financial institutions.
6.9 Globalisation has already been associated with a massive increase in global capital flowsin the last 20 years that have far outstripped trade flows and the increased integration ofnational capital markets. In this more fluid and open environment, trends becomeestablished more quickly and shocks can be more rapidly transmitted across nationalboundaries.
6.10 This is evident in the current world trade cycle, and even more obvious in the longer-term cycle in financial markets, best seen in the increasing correlation of developed markets’equity prices in the long bull market through the 1990s and their subsequent fall. Thesecyclical and secular trends have been matched by the development of concerns at a globallevel, for example in relation to corporate governance. The way these trends play out mayhave wider implications for business strategy and environment in the different levels of themarket, particularly at the EU level.
Business env ironment
6.11 Business environment is a generic term to describe the collection of factors thattogether define a country’s style or approach to business. The focus here is on UKGovernment policy, which plays a key role in setting the business environment. Othergovernments are also pursuing policies that have an impact on the relative attractiveness oftheir financial centres. The growth in the financial sectors of Dublin and Luxembourg througha combination of low taxes and business-friendly policies are notable examples of thesepolicies bringing success.
6.12 Particularly relevant to the development of financial centres and the location choice ofmarket firms is regulation. Financial services regulation, and above all its style, is animportant driver for change and innovation, particularly so in the wholesale financialservices sector where firms are mobile and relatively free to choose the most appropriateregulatory regime. Tax, both personal and business, could be a further important influence onfirms’ location choices.
FAC T O R S SH A P I N G F I N A N C I A L CE N T R E S ’ DE V E LO P M E N T6

FAC T O R S SH A P I N G F I N A N C I A L CE N T R E S ’ DE V E LO P M E N T
6.13 Markets thrive best on the basis of confidence and trust. Good regulation will underpinthat, but without stifling competition, risk taking and innovation. Less effective regulationcan hamper the dynamic development of financial centres and drive business away.
6.14 The UK has recently modernised its regulatory regime, reflecting the growingintegration of financial services activity, particularly across sectors. It established a newunified regulator, the FSA, responsible for the banking, insurance and securities industries.The framework under which the FSA operates (see Section 2) seeks to embody theproportionate, risk-based approach to regulation that has served London well in the past.
6.15 The regulatory environment is also being influenced at EU level through measures todevelop the FSAP. The objective of the FSAP is to address the remaining barriers in the SingleMarket in financial services. In principle, the removal of barriers will deliver significanteconomic benefits for the users of financial services, although the studies so far suggest that,at the wholesale level, customers in the UK benefit relatively less because its wholesalemarkets are already relatively efficient. The removal of barriers should also potentially offerbenefits to providers of financial services.
6.16 Over 30 of the FSAP’s 42 measures have been adopted at the EU level, with progressunder way on many others. However, effective implementation by Member States is essential.The development of the FSAP is separate from the issue of membership of the singlecurrency: the FSAP applies to all EU Member States, irrespective of whether or not theybelong to the single currency. The challenge will be to ensure that the final legislation deliversthe maximum possible benefit. Enforcement and the appropriate use of other instruments,such as competition policy, will also be important if the maximum benefits are to becaptured. The UK has strongly supported the FSAP’s objectives and is seeking to secureoutcomes that are compatible both with the strengths of London’s way of doing business andthe achievement of economic reform in Europe. In 2002, the UK and Germany successfullyled an initiative to improve the EU’s decision-making processes for developing financialservices legislation and enhancing cooperation among supervisors. These processes, whenfully implemented, are intended to facilitate progress to a more dynamic and efficient EUSingle Market.
6.17 However, in terms of locational decisions by firms, EU regulatory developments havetwo potential risks for London:
• to the extent that London is preferred over other EU financial centres onaccount of its distinctive regulatory style (which can take various forms),unnecessary harmonisation of standards or procedures might affectcompetition in the Single Market, with potential implications for the locationof some activities within the EU; and
• if new EU legislation has costs which are not justified by the benefits, this mayforce activity out of the EU altogether.
6.18 A specific regulatory issue is the regulation of market infrastructure. As discussed inSection 5, Europe’s market infrastructure is currently going through a period of intensechange. Many exchanges have demutualised and become for-profit companies keen to dodeals to strengthen their position in the marketplace. There is a move away from providinginfrastructure services on a purely national basis to cross-border provision of such services.This process of change should help to support the development of a single Europeansecurities market by breaking down barriers to cross-border trades and thereby reducing thecosts of such activity.
48
6Regulation
Marketinfrastructure

49
6.19 There are potentially difficult regulatory issues arising out of consolidation of marketinfrastructure in Europe. Many countries may find that as a result of consolidation, themarket infrastructure providers used in their country are regulated from elsewhere in Europe.Regulators will need to cooperate and share information. It is also vital from a competitionpoint of view that whatever regulatory structures are put in place ensure open and equalaccess for users across Europe, and from a financial stability point of view that they ensurerisks are effectively mitigated.
6.20 The burden of the UK tax regime compares favourably with that of other EU MemberStates, with the headline rate of corporation tax having been recently reduced to make it oneof the lowest in Europe. Coupled with labour market flexibility, this makes the UK anattractive location for wholesale activity.
6.21 Some concerns have been raised by industry representatives about the proposal toallocate capital to foreign bank branches for tax purposes, which places the UK tax regime ona similar basis as other financial centres.
6.22 Another concern raised by industry representatives relates to the issue of stamp dutyand stamp duty reserve tax (SDRT). Stamp duty is payable each time shares in UK-incorporated companies change hands irrespective of where the shares are traded – to avoidstamp duty, a UK business would have to incorporate abroad. While in some circumstances,particularly in relation to some collective investment vehicles, this may affect corporatedecisions on where to incorporate, stamp duty needs to be seen in the context of the overalltax burden on UK-incorporated companies which, as noted, is favourable compared to otherEuropean countries. In terms of the location of financial services activity, otherconsiderations are more relevant for firms when deciding where to locate their wholesaleactivity, in particular the significant advantages offered by London’s critical mass of wholesalefinancial activity and the UK’s overall business environment. For example, even thoseExchange Traded Funds that have incorporated in Ireland are locating their managementactivity and the vast majority of their employment in London.
Supply-s ide determinants
6.23 Further technological developments are likely to be a major influence on thedevelopment of financial centres and the delivery of financial services. Technology hasalready had a profound effect on the financial services sector over the past 20 years andpromises to continue to shape the sector. Newer, more complex financial products (mostnotably derivatives) would not have developed without the potential created by tradingprograms and powerful hardware to drive trading platforms and carry and store hugeamounts of information. Technology has increased the spread of firms’ client bases and firmshave reacted by adjusting management structures to reflect the global spread of business –their products too reflect this globalisation and are increasingly managed along global lines.
6.24 One of technology’s effects identified in Section 3 has been to increase the locationalmobility of firms and certain types of activity. Lower value added, bulk processing functionsfor example can now be relocated to lower-cost locations – asset management back-officefunctions for example. The Prudential’s recent decision to establish an offshore service centrein Mumbai, India is one example of this trend. Such attempts to reduce costs and circumventlabour shortages in London may provoke relocation to lower-cost sites and hence weakenclustering forces.
FAC T O R S SH A P I N G F I N A N C I A L CE N T R E S ’ DE V E LO P M E N T6
Technology
Tax

FAC T O R S SH A P I N G F I N A N C I A L CE N T R E S ’ DE V E LO P M E N T
6.25 For many forms of wholesale activity, however, clusters continue to offer benefits.Wholesale firms are still heavily dependent on skilled labour, and this is most easily recruitedby locating in a financial centre such as London, which attracts significant numbers ofinternational workers highly skilled in financial services activity.
6.26 Perhaps more important for London is an issue raised in Section 3 relating to the impactof technology on trading. Historically, the existence of an exchange floor has been a feature offinancial centres and was a key clustering force. Technology has changed this by creating thepossibility for remote membership of exchanges, effectively ‘dematerialising’ markets. Thishas allowed direct electronic access to national screen-based systems without establishing aphysical presence at the market’s location (however that may be defined). In other words, theliquidity in some markets has become global rather than location specific. For example, theEurex market is located in Frankfurt, but 75 per cent of its turnover comes from traderslocated outside Germany (see Table 6.1).
Table 6.1: Eurex market turnover by country of origin
Per cent 1997 1999 2001 2002
UK 7 25 33 41
Germany 81 41 31 25
US 1 7 10 11
France 3 8 9 10
Others 8 19 17 13
Source: Eurex.
6.27 At another level, technology also means that wholesale services can be provided fromone location rather than many, reducing the need for a presence in every national market.The choice of location is again determined by the attributes of clusters such as skilled labourand physical and market infrastructure.
Changing bus iness strateg ies
6.28 As outlined in Section 5, the past decade or so has been marked by increasingconsolidation in the financial services sector. EU mergers and acquisitions activity increasedin the 1990s, but this was mainly among smaller domestic banks seeking scale economies andsufficient critical mass to compete in increasingly deregulated EU and global markets: asignificant rise in cross-border activity in the euro area has yet to be seen.
6.29 Recent equity market downturns have slowed this process, certainly in the short term,and in some markets (including the UK) opportunities for further consolidation in thebanking sector are now limited. In the longer term, however, business strategies are likely toevolve in response to the growing opportunities and challenges posed by EU marketderegulation, technology and the increasingly global nature of financial services.
6.30 The City has long been open to foreign companies buying wholesale marketparticipants. Most investment banks in London are now foreign owned. This foreign directinvestment brings important benefits. It has led to investment on a scale that was probablybeyond British-owned institutions, helped the transmission of new ideas from overseas andled to an influx of talented individuals enriching the available pool of labour in London.
50
6
Consolidation
Ownership

51
6.31 Greater foreign ownership may have made location decisions in relation to Londonmore sensitive to changes in the driving factors than they might have been in the past. As onemanifestation of this, it has been argued that in difficult market conditions, such as thosecurrently prevailing, cuts in jobs and investment may fall more heavily on overseas branchesin London than on domestically-located offices. It is not clear whether this would imply astructural change in London’s relative importance or simply an amplification of cyclicalmovements in City-related employment.
Currency systems: the euro
6.32 The locational advantages of the UK – the UK business environment and particularly thesignificant clustering benefits offered by London – have provided it with the conditions to becompetitive in international wholesale financial activity. While there are challenges and risks,as highlighted in the study, to date the euro has not affected London’s ability to compete ininternational wholesale markets.
6.33 However, the dynamic nature of the sector means that London’s performance in the fouryears since the start of EMU provides no grounds for complacency. This study is essentiallybackward looking and focuses on the performance of the City to date. The question of theeffects that UK membership of the single currency would have on the City is not addressed inthis study. This is a matter for the assessment of the financial services test, the fourth of theGovernment’s five economic tests for EMU entry. The test assesses the specific question of thepotential impact that entry to EMU might have on the City’s competitive position,particularly on its wholesale markets and their ability to attract euro business.
FAC T O R S SH A P I N G F I N A N C I A L CE N T R E S ’ DE V E LO P M E N T6

52
7 CO N C LU S I O N S
53
7.1 The study has set out to inform the assessment of the financial services test andconsider the factors that drive the location of wholesale financial activity. This includes therole of currency, in this case the euro, and whether the fact that London is outside the euroarea is excluding it from developments in euro financial markets.
7.2 A key basis of the study is that since the advent of the Euromarkets in the late 1950s andearly 1960s, London has reinvented itself from being an international clearing centre forsterling to making international markets in a variety of currencies and providing internationalfinancial services across borders.
7.3 Through the twin approaches of economic geography and economic history, the studyhas shown that the City’s competitiveness in these markets has been largely divorced from thestrength of the underlying economy and sterling. The basis for its competitiveness hasinstead been grounded in the clustering forces that attracted a critical mass of internationalwholesale activity to the City. These forces are still very much in evidence today, bestillustrated by the range of wholesale market firms present in the City, their internationaldiversity and the depth of the labour market for financial skills in London.
7.4 Public policy supports this high level of activity. Through the FSA, the UK’s regulatoryframework aims to be fair, risk based and quick to adapt to market innovation in order toencourage competition and risk taking without compromising safeguards for investors orhigh standards. Labour market policy is important too, creating flexibility for market firmsfaced with a fast moving environment.
7.5 An important question the study asks is whether London has been excluded from eurofinancial markets through not being part of the single currency. The evidence to date showsthat since the introduction of the single currency, London has participated fully in eurofinancial markets. For example, market firms based in London have cheap and effectiveaccess to TARGET for wholesale euro payments across borders and unrestricted access toother market infrastructure. London also has a majority share in the growing euro-denominated Eurobond market.
7.6 It is clear that London and other overseas financial centres face challenges. A centraltheme of this study is the dynamic nature of the financial services sector. Sharp equity marketdeclines have forced wholesale firms to retrench and rethink business strategies. This hasresulted in job losses in London and other financial centres and reflects the dynamic globaland integrated nature of capital markets, where shocks are quickly transmitted. Howwholesale institutions will regroup once markets recover remains to be seen.
7.7 On the supply side, technology has increased firms’ mobility and potentially makeslocations more ‘contestable’, especially for back-office functions. Greater foreign ownershipmay increase London’s vulnerability to changes in firms’ location choices in response to smallchanges in relative conditions. Finally, the business environment in the EU is changing, notleast in the way that the regulatory environment for financial services is evolving as a result ofthe Financial Services Action Plan.
CO N C LU S I O N S
7.8 The locational advantages of the UK – the UK business environment and particularly thesignificant clustering benefits offered by London – have provided the City with the conditionsto be competitive in international wholesale financial activity. While there are challenges andrisks, as highlighted in the study, to date the euro has not affected London’s ability to competein international wholesale markets.
7.9 However, the dynamic nature of the sector means that London’s performance in the fouryears since the start of EMU provides no grounds for complacency. This study is essentiallybackward looking and focuses on the performance of the City to date. The question of theeffects that UK membership of the single currency would have on the City is not addressed inthis study. This is a matter for the assessment of the financial services test, the fourth of theGovernment’s five economic tests for EMU entry. The test assesses the specific question of thepotential impact that entry to EMU might have on the City’s competitive position,particularly on its wholesale markets and their ability to attract euro business.
54
7

RE F E R E N C E S
55
Association of British Insurers (2002) ‘UK Insurance 2002/3 Key Facts’,<http://www.abi.org.uk/Display/File/44/key_facts.pdf>.
Balls, E. (2002) ‘Why the Five Economic Tests?’, speech by the Chief Economic Adviser to theTreasury at the 2002 Cairncross Lecture, 4 December 2002. <http://www.hm-treasury.gov.uk/newsroom_and_speeches/speeches/chief_economic_advisor_to_the_treasury_speeches/cea_speech_041202.cfm>
Bank for International Settlements (2002a) Triennial Central Bank Survey of ForeignExchange and Derivatives Market Activity, 2001. <http://www.bis.org/publ/rpfx02.htm>
Bank for International Settlements (2002b) Quarterly Review: International Banking andFinancial Market Developments, December 2002. <http://www.bis.org/publ/r_qt0212.htm>
Bank of England (1999) Practical Issues Arising from the Euro, December 1999.
Bank of England (2000) Practical Issues Arising from the Euro, November 2000.
Bank of England (2001) Practical Issues Arising from the Euro, June 2001.
Bank of England (2002) Practical Issues Arising from the Euro, November 2002.
Beaverstock, J.V., Hoyler, M., Pain, K. and Taylor, P.J. (2001) Comparing London andFrankfurt as World Cities: A Relational Study of Contemporary Urban Change, London:Anglo-German Foundation.
Beaverstock, J.V. and Smith, J. (1996) ‘Lending Jobs to Global Cities: Skilled InternationalLabour Migration, Investment Banking and the City of London’, Urban Studies 33(8),pp. 1377-1394.
Begg, I. (1992) ‘The Spatial Impact of Completion of the EC Internal Market for FinancialServices’, Journal of Regional Studies 26(4), pp. 333-347.
Brülhart, M. (1998) ‘Economic Geography, Industry Location and Trade: The Evidence’, TheWorld Economy 21(6), pp. 775-801.
Centre for Economics and Business Research (2000) The City’s Importance to the EuropeanUnion’s Economy, November 2000, report for the Corporation of London.
Centre for Economics and Business Research (2001) The City’s Importance to the EuropeanUnion’s Economy, December 2001, report for the Corporation of London.<http://www.cityoflondon.gov.uk/business_city/research_statistics/pdf/city2eu.pdf>
Centre for Economics and Business Research (2003) The City’s Importance to the EuropeanUnion’s Economy, January 2003, report for the Corporation of London.<http://www.cityoflondon.gov.uk/business_city/research_statistics/pdf/city2eu03.pdf>
Choi, S-R., Tschoegl, A.E. and Yu, C-M. (1986) ‘Banks and the World's Major FinancialCenters, 1970-1980’, Weltwirtschaftliches Archiv 122(1), pp. 48-64.
Clark, G.L. (2002) ‘London in the European Financial Services Industry: LocationalAdvantage and Product Complementarities’, Journal of Economic Geography 2(4), pp. 433-453.

RE F E R E N C E S
Chrystal, K.A., Hojanovic, A. and Crossan, P. (2002) ‘The Impact on the City of UK EurozoneMembership: The Banking Industry’, report for the Corporation of London.<http://www.cityoflondon.gov.uk/business_city/research_statistics/pdf/eurozone_membership.pdf>
Corporation of London (2002) ‘The Global Powerhouse: The City of London’.<http://www.cityoflondon.gov.uk/business_city/global_powerhouse.htm>
Coym, P. (2002) Speech to the Annual Press Conference of the Association of Foreign Banksin Germany, 7 March 2002 (in German).
Cushman & Wakefield Healey & Baker (2002) European Cities Monitor, 2002.<http://www.cushmanwakefieldeurope.com/global/en/ECM2002forweb.pdf>
Danthine, J-P., Giavazzi, F. and von Thadden, E-L., (2000) ‘European Financial Markets afterEMU: A First Assessment’, CEPR Discussion Paper No. 2413.
Dixit, A. and Norman, V. (1980) Theory of International Trade, Cambridge: CambridgeUniversity Press.
The Economist (1995) Turn up the Lights: A Survey of Cities.
European Central Bank (2002a) Review of the International Role of the Euro, December 2002.<http://www.ecb.int/pub/pdf/euro-international-role2002.pdf>
European Central Bank (2002b) Report on Financial Structures, October 2002.<http://www.ecb.int/pub/pdf/reportfinancialstructures2002en.pdf>
Financial Services Authority (2002) Annual Report, 2001/2002.
Fujita, M., Krugman, P. and Venables, A.J. (1999) The Spatial Economy: Cities, Regions, andInternational Trade, Cambridge, MA: MIT Press.
Giannetti, M., Guiso, L., Jappelli, T., Padula, M., and Pagano, M. (2002) ‘Financial MarketIntegration, Corporate Financing and Economic Growth, Final Report’, EuropeanCommission, DG Economic and Financial Affairs, European Economy Economic Paper No. 179.
Grilli, V. (1989) ‘Europe 1992: Issues and Prospects for the Financial Markets’, EconomicPolicy 9, pp. 388-421.
Heckscher, E.F. (1919) ‘The Effect of Foreign Trade on the Distribution of Income’,Ekonomisk Tidskrift 21, pp. 1-32 (in Swedish).
Helpman, E. and Krugman, P. (1985) Market Structure and Foreign Trade, Cambridge, MA:MIT Press.
HM Treasury (1997) UK Membership of the Single Currency: An Assessment of the FiveEconomic Tests, October.
Hotelling, H. (1929) ‘Stability in Competition’, Economic Journal 39, pp. 41-57.
International Financial Services London (1999) ‘Derivatives’, City Business Series, 1999.<http://www.ifsl.org.uk/uploads/CBS_Derivatives_1999.pdf>
International Financial Services London (2001a) International Financial Markets in the UK,November 2001. <http://www.ifsl.org.uk/uploads/IFM_11_2001.pdf>
56

57
International Financial Services London (2001b) ‘Insurance’, City Business Series, 2001.<http://www.ifsl.org.uk/uploads/CBS_Insurance_2001.pdf>
International Financial Services London (2002a) International Financial Markets in the UK,May 2002. <http://www.ifsl.org.uk/uploads/RP_IFM_2002_05.pdf>
International Financial Services London (2002b) International Financial Markets in the UK,November 2002. <http://www.ifsl.org.uk/uploads/RP_IFM_2002_11.pdf>
International Financial Services London (2002c) ‘Derivatives’, City Business Series, 2002.<http://www.ifsl.org.uk/uploads/CBS_Derivatives_2002.pdf>
Jeger, M., Haegler, U. and Theiss, R. (1992) ‘On the Attractiveness of Financial Centers’, inBlattner, N., Genberg, H. and Swoboda, A. (eds.) Competitiveness in Banking, Heidelberg:Physica-Verlag.
Kindleberger, C.P. (1974) ‘The Formation of Financial Centres: A Comparative Study inEconomic History’, Princeton Studies in International Finance 36, Princeton: PrincetonUniversity Press.
Kynaston, D. (1994) The City of London: Volume I: A World of Its Own 1815-1890, London:Pimlico.
Kynaston, D. (1995) The City of London: Volume II: The Golden Years 1890-1914, London:Pimlico.
Kynaston, D. (1999) The City of London: Volume III: Illusions of Gold 1914-1945, London:Pimlico.
Kynaston, D. (2001) The City of London: Volume IV: A Club No More 1945-2000, London:Pimlico.
Krugman, P. (1979) ‘Increasing Returns, Monopolistic Competition, and International Trade’,Journal of International Economics 9(4), pp. 469-479.
Krugman, P. (1980) ‘Scale Economies, Product Differentiation, and the Pattern of Trade’,American Economic Review 70(5), pp. 950-959.
Krugman, P. (1981) ‘Intraindustry Specialization and the Gains from Trade’, Journal ofPolitical Economy 89(5), pp. 959-973.
Krugman, P. (1991a) Geography and Trade, Cambridge MA: MIT Press.
Krugman, P. (1991b) ‘Increasing Returns and Economic Geography’, Journal of PoliticalEconomy 99(3), pp. 483-499.
Krugman, P. (1993) ‘First Nature, Second Nature, and Metropolitan Location’, Journal ofRegional Science 33(2), pp. 129-144.
Krugman, P. and Venables, A.J. (1995a) ‘The Seamless World: A Spatial Model of InternationalSpecialization’, CEPR Discussion Paper No. 1230.
Krugman, P. and Venables, A.J. (1995b) ‘Globalisation and the Inequality of Nations’,Quarterly Journal of Economics 110, pp. 857-880.
Krugman, P. and Venables, A.J. (1996) ‘Integration, Specialization, and Adjustment’,European Economic Review 40(3-5), pp. 959-967.
RE F E R E N C E S

RE F E R E N C E S
La Porta, R., Lopez-de-Silanes, F., Schleifer, A. and Vishny, R. (1997) ‘Legal Determinants ofExternal Finance’, Journal of Finance 52(3), pp. 1131-1150.
La Porta, R., Lopez-de-Silanes, F., Schleifer, A. and Vishny, R. (1998) ‘Law and Finance’,Journal of Political Economy 106(6), pp. 1113-1155.
Levin, M. (2001) ‘No Overtaking: To Stay in the Lead, the City needs the Euro’, The City inEurope, London: Britain in Europe.
Lundvall, B-A. and Borrás, S. (1997) ‘The Globalising Learning Economy: Implications forInnovation Policy’. <ftp://ftp.cordis.lu/pub/tser/docs/globeco.doc>
Markusen, J. and Venables, A.J. (1996) ‘The Theory of Endowment, Intra-Industry andMultinational Trade’, CEPR Discussion Paper No. 1341.
Marshall, A. (1890) Principles of Economics, London: Macmillan.
Martin, R. (1999) ‘The New 'Geographical Turn' in Economics: Some Critical Reflections’,Cambridge Journal of Economics 23(1), pp. 65-91.
Nachum, L. and Wymbs, C. (2002) ‘Firm Specific Attributes and MNE Location Choices:Financial and Professional Service FDI to New York and London’, ESRC Centre for BusinessResearch, University of Cambridge, Working Paper No. 223.
O’Brien, R. (1992) Global Financial Integration: The End of Geography, London: Pinter.
Odell, K.A. and Weiman, D.F. (1998) ‘Metropolitan Development, Regional Financial Centers,and the Founding of the Fed in the Lower South’, Journal of Economic History 58(1), pp. 103-125.
Ohlin, B. (1933) Inter-regional and Inter-national Trade, Cambridge, MA: Harvard UniversityPress.
OXERA Consulting (2002) ‘The Impact of UK Stamp Duty on the Development of a MoreIntegrated European Capital Market: Asymmetric Capital Flows’, report for the LondonStock Exchange. <http://www.londonstockexchange.com/cmsattach/991.doc>
Podolski, J. (1986) Financial Innovation and the Money Supply, Oxford: Blackwell.
Porter, M.E. (1998) Competitive Strategy: Techniques for Analyzing Industries andCompetitors, New York: Free Press.
Puga, D. and Venables, A.J. (1997) ‘Preferential Trading Agreements and Industrial Location’,Journal of International Economics 43(3-4), pp. 347-368.
Ricardo, D. (1817) The Principles of Political Economy and Taxation, London: John Murray.
Sassen, S. (1991) The Global City: New York, London, Tokyo, Princeton: Princeton UniversityPress.
Scottish Financial Enterprise (2002), Funds Under Management, various editions.<http://www.financescotland.com/index.taf?_P=PUB10802&_year=2002>
Sylla, R. (1995) ‘The Rise of Securities Markets – What can Government Do?’, World BankPolicy Research Working Paper No. 1539.
Thomson Financial Investor Relations (2000) International Target Cities Report, 2000.
58

59
Vanek, J. (1968) ‘The Factor Proportions Theory: The N-Factor Case’, Kyklos 21, pp. 749-756.
Venables, A.J. (1996) ‘Equilibrium Locations of Vertically Linked Industries’, InternationalEconomic Review 37(2), pp. 341-359.
Weber, A. (1909) Theory of the Location of Industries, Tübingen: J.C.B. Mohr (in German).
Weder, R. (1995) ‘Linking Absolute and Comparative Advantage to Intra-Industry TradeTheory’, Review of International Economics 3(3), pp. 342-354.
RE F E R E N C E S

60

A1 This annex, containing a comprehensive survey of wholesale activity in the UK, forms acentral part of the evidence base for the financial services test. It complements the analysiscontained in the EMU study by HM Treasury EMU and the cost of capital which considersdevelopments in euro area capital markets since the start of EMU.
1 ) Over v iew
A2 Table A1 provides an overall picture of the UK’s importance as an internationalwholesale financial centre. The UK holds a commanding position in a wide variety ofwholesale markets even compared to larger economies such as the US and Japan. Somerecent growth has, however, been seen in other European centres. For example, Frankfurt hasestablished a presence in the over-the-counter (OTC) derivatives sector (Table A2). Paris isanother leading European centre and continues to hold a significant share of some keywholesale markets.
Table A1: Global market share held by major financial centres in keywholesale marketsPer cent – rounded UK US Japan France Germany Others
Cross-border bank lending (Jun 2002) 19 10 9 6 10 46
Foreign equities turnover (Jan – Aug 2002) 56 26 – – 3 15
Foreign exchange dealing (Apr 2001) 31 16 9 3 5 36
OTC derivatives turnover (Apr 2001) 36 18 3 9 13 21
Gross insurance premium income (2000) 10 35 21 5 5 24
Marine insurance net premium income (1999) 19 13 14 5 12 37
Aviation insurance net premium income (1999) 39 23 4 13 3 18
Source: International Financial Services London (IFSL), International Financial Markets in the UK, various editions, and Bank for International Settlements(BIS), 2002a,b.
Table A2: Recent financial market trends in Frankfurt, Paris and LondonFrankfurt Paris London
1998 2001 1998 2001 1998 2001
Foreign banking institutions (number) 138 129 187 188 332 293
Cross-border bank lending (global share, per cent) 8.4 9.7 6.7 6.0 19.2 19.7
OTC derivatives turnover (global share, per cent) 7.3 12.7 9.7 8.8 36.0 36.1
Foreign exchange turnover (global share, per cent) 4.8 5.4 3.7 3.0 32.5 31.1
Foreign equity turnover (global share, per cent) 3.7 2.9 0.5 1.31 64.0 55.81 Data are for Euronext, created in September 2000 by the merger of the Paris, Brussels and Amsterdam exchanges.Note: The distinction between data for individual centres and for entire countries is often not clear. See the relevant charts and tables in Annex A forclarification of what each series represents.Source: Bank of England, IFSL, International Financial Markets in the UK, various editions, and BIS, 2002a,b.
2) UK f inanc ia l ser v ices sector employment
A3 Financial services are an important source of employment for the UK economy. Highdegrees of concentration are seen in London and the South East of the country, with Scotlandalso seeing significant and rising levels of employment in the sector (Table A3 and Charts A1and A2).
AAN N E X A : TH E UK’S PO S I T I O N A S A NIN T E R N AT I O N A L WH O L E S A L EF I N A N C I A L CE N T R E
61
Marked regionalconcentrations

AN N E X A : TH E UK’S PO S I T I O N A S A N IN T E R N AT I O N A L WH O L E S A L E F I N A N C I A L CE N T R E
A4 Employment levels especially in wholesale activities, are marked by quick adjustmentsaccording to underlying market conditions. This is also a reflection of the flexible nature ofthe UK’s jobs market and is most clearly seen in London, the major UK wholesale financialcentre. The Centre for Economics and Business Research (CEBR, 2003) estimates that, due tothe impact of equity market falls, 10,000 jobs will be lost in the City in 2003, the highestnumber since 1992.
A5 Another feature of financial services employment is the high presence of supportingactivity (for example, management consultants and legal and accountancy services) within theoverall total (Chart A3). These are important to support and serve international wholesalefinancial activity.
Table A3: Location quotients for financial services employment1
UK = 1.00 1996 1997 1998 1999 2000 2001 2002
London 2.23 2.19 2.07 2.01 2.03 2.01 1.96
Scotland 0.84 0.88 0.90 0.93 1.01 1.07 1.09
UK 1.00 1.00 1.00 1.00 1.00 1.00 1.00
South West 1.05 0.96 0.98 0.98 0.97 0.96 0.94
South East 0.99 0.99 1.01 0.97 0.95 0.92 0.91
East 0.84 0.91 0.91 0.93 0.88 0.84 0.83
Yorkshire & Humberside 0.78 0.85 0.89 0.85 0.79 0.78 0.79
North West 0.78 0.75 0.78 0.81 0.80 0.80 0.78
West Midlands 0.72 0.71 0.72 0.75 0.73 0.74 0.75
Wales 0.60 0.59 0.59 0.60 0.65 0.73 0.74
Northern Ireland 0.49 0.47 0.48 0.49 0.52 0.54 0.56
North East 0.52 0.49 0.48 0.52 0.50 0.54 0.54
East Midlands 0.55 0.54 0.56 0.53 0.50 0.49 0.461 Quotients calculated as the ratio of the share of financial service employment in total employment for the region to the share of financial serviceemployment in total employment nationally. Financial services defined as item J in the Labour Force Survey, ‘financial intermediation’.Note: 2002 data are for January–June only.Source: ONS and HM Treasury calculations.
62
AEmployment
levels linked tomarket
performance
High levels ofsupporting
services
Chart A1: UK and London financial service sector employment
UK (LHS) London (LHS) London as a percentage of UK (RHS)
0
200
400
600
800
1,000
1,200
20022001200019991998199719961995
Fina
ncia
l ser
vice
s em
ploy
men
t (th
ousa
nds)
Note: 2002 data are for January-June only.
Source: ONS.Lo
ndon
fina
ncia
l ser
vice
s em
ploy
men
t (pe
r ce
nt o
f UK
finan
cial
ser
vice
s em
ploy
men
t)
25
26
27
28
29
30
31
32
33
34
35

63
AN N E X A : TH E UK’S PO S I T I O N A S A N IN T E R N AT I O N A L WH O L E S A L E F I N A N C I A L CE N T R EA
Chart A2: UK regional financial service sector employment
0
50
100
150
200
250
300
350
South
East
East
Lond
on
South
West
West M
idlan
ds
East
Midlan
ds
Yorks
hire &
Humbe
rside
North
West
North
East
Wales
Scotla
nd
Northe
rn Ir
eland
1996 1998 2000 2001 2002
Thousands
Note: 2002 data are for January-June only.Source: ONS.
Chart A3: Breakdown of UK financial services employment, 2000
Fund management3%
Securities dealing3%
Banking28%
Insurance21%Legal services
14%
Accounting13%
Managementconsultancy
11%
Other7%
Source: ONS and IFSL, 2002a.

AN N E X A : TH E UK’S PO S I T I O N A S A N IN T E R N AT I O N A L WH O L E S A L E F I N A N C I A L CE N T R E
3) Overseas earnings
A6 The balance of invisible trade provides a good indication of the UK’s competitiveposition in wholesale activity. Surpluses would suggest relative strength in that area ofactivity, deficits a relative weakness.
A7 Chart A4 shows that, on this basis, the UK enjoys a significant competitive advantageover the range of wholesale markets. Moreover, Charts A5 and A6 show that this has beenincreasing in recent years, though gains have been trimmed by recent market reversals asinvestors shy away from capital markets.
A8 Chart A7 completes the picture. This shows that the UK has significant trade surpluseswith its major trading partners, with surpluses with France and Germany growing over theperiod 1998-2001, during which time the euro was introduced. The surplus with the US fellsubstantially in 2001, driven mainly by deteriorating market conditions, as well as a fall in thevalue of insurance exports, the result of large claims from US policy holders.
64
A
Significantsurpluses with
main tradingpartners
Trade balancesan indicator of
competitiveness
Chart A4: UK net financial service exports by activity, 2001
0
500
1,000
1,500
2,000
2,500
3,000
3,500
4,000
4,500
Insur
ance
Secu
rities
deale
rs Bank
sFu
nd
manag
ers Baltic
Exch
ange
Money
mark
et
brok
ers
Futur
es an
d
optio
ns de
alers
Lloyd
’s
Shipp
ing Re
gister
Other f
inanc
ial
servic
es
£ million
Source: ONS and Bank of England.

65
AN N E X A : TH E UK’S PO S I T I O N A S A N IN T E R N AT I O N A L WH O L E S A L E F I N A N C I A L CE N T R EA
Chart A5: UK net financial service exports by activity
Source: ONS and Bank of England.
0
500
1,000
1,500
2,000
2,500
3,000
3,500
4,000
4,500£ million
1991 1992 1993 1994 1995 1996 1997 1998 1999 2000 2001
Insurance Securities dealers Banks
Chart A6: UK net financial service exports by activity
Source: ONS and Bank of England.
0
100
200
300
400
500
600
700£ million
1991 1992 1993 1994 1995 1996 1997 1998 1999 2000 2001
Fund managers Baltic ExchangeFuture and options dealers
Money market brokersLloyd’s Shipping Register

AN N E X A : TH E UK’S PO S I T I O N A S A N IN T E R N AT I O N A L WH O L E S A L E F I N A N C I A L CE N T R E
4) Fore ign d irect investment
A9 As well as illustrating the cyclical nature of FDI flows, Chart A8 shows that the UK is a majorbeneficiary of FDI flows into financial services. The result of these inflows is that the stock of FDIin the UK financial services sector is over £70 billion, with the stocks originating in the EUincreasing from around 19 per cent of the total in 1997 to 25 per cent in 2001 (Chart A9).
66
A
UK the recipientof large FDI
flows intofinancial services
Chart A8: Inflows of foreign direct investment to UK financial services by source
Source: ONS.
0
2,000
4,000
6,000
8,000
10,000
12,000
14,000
16,000£ million
1997
71%
29%
1998
92%
8%
1999
48%
52%
2000 2001
59%
41%
68%
32%
Non-EU EU
Chart A7: UK balance of trade in insurance and financial services with leading trading partners
Source: ONS.
0
500
1,000
1,500
2,000
2,500
3,000
3,500
4,000
2001200019991998
JapanUSGermanyFrance
£ million

67
5) Banking
A10 London hosts a greater number of foreign bank branches and subsidiaries than anyother international centre (Chart A10). Some decline in numbers has, however, been seen inrecent years, the result of industry consolidation and the concentration of market activity ina smaller number of large market firms, and the withdrawal of some Japanese banks due totheir domestic difficulties. Against this background, the number of foreign banks in Frankfurtand Paris has remained broadly unchanged, in part a reflection of their growth as financialcentres. The number of foreign representative offices (not included in Chart A10) in Londonhas fallen from 209 in 1997 to 167 in 2001. Rough estimates indicate that the number offoreign representative offices in Paris has remained at around 80, while the figure forFrankfurt fell slightly from 75 to 70 over the same period.
A11 UK shares in cross-border banking lending remain stable at around 19 per cent of the global total, and nearly twice as high as the two following countries, the US and Germany(Chart A11).
AN N E X A : TH E UK’S PO S I T I O N A S A N IN T E R N AT I O N A L WH O L E S A L E F I N A N C I A L CE N T R EA
Chart A9: Stock of foreign direct investment in UK financial services by source
Source: ONS.
0
10,000
20,000
30,000
40,000
50,000
60,000
70,000
80,000
20012000199919981997
Non-EU EU
81%
19%
81%
19%
73%
27%
77%
23%
75%
25%
£ million
London as aninternational
banking centre

AN N E X A : TH E UK’S PO S I T I O N A S A N IN T E R N AT I O N A L WH O L E S A L E F I N A N C I A L CE N T R E
6) Payments
A12 Despite the fact that UK banks are heavy users of other payment systems, the UKwholesale payments system accounted for around 18 per cent by value of cross-borderpayment flows in TARGET in the fourth quarter of 2002, up from 15 per cent when the eurowas launched in January 1999. Only Germany exceeds the UK in cross-border payments(Chart A12).
68
A
TARGET
Chart A10: Number of foreign banking institutions located in London, Frankfurt and Paris
Note: 2002 data are for September.Source: Bank of England, Hessische Landeszenralbank, French Banking Federation and Banque de France.
0
50
100
150
200
250
300
350
400
200220012000199919981997
ParisFrankfurtLondon
Chart A11: Share of cross-border bank lending, June 2002
Source: BIS, 2002b.
Others24%
UK19%
US10%
Germany10%
Japan9%Cayman Islands
8%
Switzerland 6%
France 6%
Luxembourg 5%
Singapore 3%

69
A13 The Bank of England (2002) reports that the value of payments through CHAPS Euro hasincreased significantly in the period since 1999. ECB data show that average daily turnover forcross-border euro payments handled by CHAPS Euro during 2002 was A85 billion, anddomestic euro payments A26 billion. This compares with respective daily turnovers of A59billion and A18 billion in 1999.
7) Fore ign exchange deal ing
A14 The UK remains by some distance the world’s dominant foreign exchange dealing centre(Chart A13) and its position relative to other countries has strengthened over the past decade(Chart A14). Daily trading volumes were over US$500 billion in 2001 or around 31 per cent ofdaily global foreign exchange turnover. In all the main centres, a significant decline was seenbetween 1998 and 2001 in the value of turnover. This can be explained by:
• the substitution of legacy currencies by the euro;
• consolidation in the banking industry; and
• the increasing use of efficient electronic trading systems.
A15 The international nature of London’s markets is underlined by the fact that transactionsinvolving its home currency (sterling) accounted for only 13 per cent of global marketturnover (Table A4). London is usually the most active trading centre for currencies outsidetheir home market.
AN N E X A : TH E UK’S PO S I T I O N A S A N IN T E R N AT I O N A L WH O L E S A L E F I N A N C I A L CE N T R EA
Chart A12: Share of cross-border euro RTGS1 payments by value
1 Real-Time Gross Settlement. Source: ECB.
0
5
10
15
20
25
30
0
5
10
15
20
25
30
OthersUKNetherlandsItalyFranceGermanyBelgium
Jan-99
Apr-9
9
Jul-99
Oct-99
Jan-00
Apr-0
0
Jul-00
Oct-00
Jan-01
Apr-0
1
Jul-01
Oct-01
Jan-02
Apr-0
2
Jul-02
Oct-02
Dec-02
Per cent
UK the largestforeign exchange
dealing centre
The internationalnature ofLondon’smarkets

AN N E X A : TH E UK’S PO S I T I O N A S A N IN T E R N AT I O N A L WH O L E S A L E F I N A N C I A L CE N T R E
70
A
Chart A13: Average daily foreign exchange turnover
Source: BIS, 2002a.
0
100
200
300
400
500
600
700US$ billion
UK US Germany France
1992 1995 1998 2001
Chart A14: Share of world daily foreign exchange turnover
Source: BIS, 2002a.
0
200
400
600
800
1,000
1,200
1,400
1,600
1,800
2,000
OthersSingaporeJapanUS
SwitzerlandFranceGermanyUK
20011998199519921992
US$ billion
27%30%
33%31%
5%
16%
6%
25%
9%
4%5%4%4%4%
8%
18%
7%
23%
5%
16%
7%
24%
5%
10%
4% 4%
5%6%16%
11%7%
25%
3%

71
Table A4: UK share of global foreign exchange trading activityPer cent 1992 1995 1998 2001
UK market total 27 30 33 31
UK share of major currencies:
US dollar 25 29 30 31
Euro currencies 26 26 34 35
Pound sterling 49 55 83 61
Japanese yen 16 24 22 24
Swiss franc 22 26 29 29
Other 14 18 19 20
Pound sterling (global total) 14 9 11 13
Source: Bank of England and BIS, 2002a.
8) Bonds
A16 The Bank of England estimates that London’s market share of the issuance of euro-denominated Eurobonds in 2002 was around 60 per cent, compared with 50 per cent in 1999(Chart A16). These figures exclude domestic issuance and use the location of the bookrunnersas a proxy for the centre from which bonds are issued.
AN N E X A : TH E UK’S PO S I T I O N A S A N IN T E R N AT I O N A L WH O L E S A L E F I N A N C I A L CE N T R EA
Chart A15: Currency share of average daily turnover of foreign exchange involving sterlingPer cent
US$ billions
Source: BIS, 2002a.
1992 1995 1998 2001
Other £ transactions
DM/£ (1992–1998) and �/£ (2001) transactionsUS$/£ transactions
0
10
20
30
40
50
60
70
80
90
100 3.75
15.50
80.75
5.28
19.71
75.02
7.39
19.64
72.97
5.21
21.80
72.99
Eurobonds
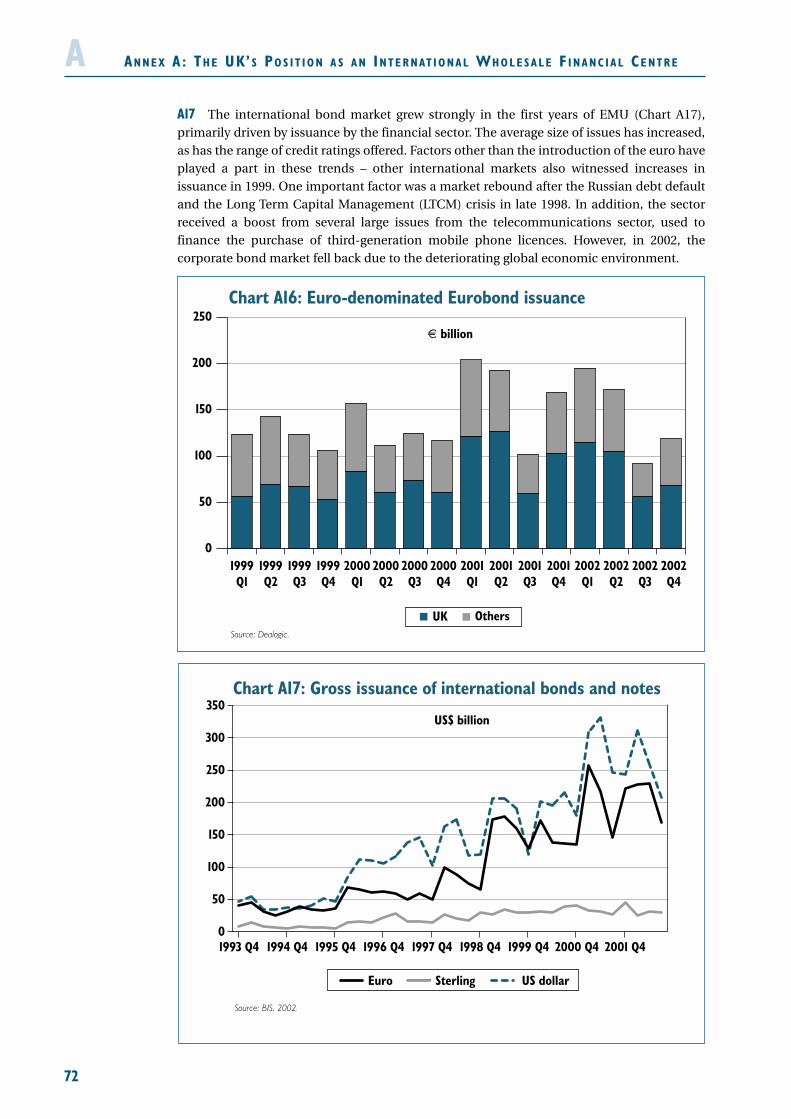
AN N E X A : TH E UK’S PO S I T I O N A S A N IN T E R N AT I O N A L WH O L E S A L E F I N A N C I A L CE N T R E
A17 The international bond market grew strongly in the first years of EMU (Chart A17),primarily driven by issuance by the financial sector. The average size of issues has increased,as has the range of credit ratings offered. Factors other than the introduction of the euro haveplayed a part in these trends – other international markets also witnessed increases inissuance in 1999. One important factor was a market rebound after the Russian debt defaultand the Long Term Capital Management (LTCM) crisis in late 1998. In addition, the sectorreceived a boost from several large issues from the telecommunications sector, used tofinance the purchase of third-generation mobile phone licences. However, in 2002, thecorporate bond market fell back due to the deteriorating global economic environment.
72
A
Chart A17: Gross issuance of international bonds and notes
Source: BIS, 2002.
SterlingEuro US dollar
US$ billion
0
50
100
150
200
250
300
350
2001 Q42000 Q41999 Q41998 Q41997 Q41996 Q41995 Q41994 Q41993 Q4
Chart A16: Euro-denominated Eurobond issuance
Source: Dealogic.
0
50
100
150
200
250
2002Q3
2002Q2
2002Q1
2001Q4
2001Q3
2001Q2
2001Q1
2000Q4
2000Q3
2000Q2
2000Q1
1999Q4
1999Q3
1999Q2
1999Q1
2002Q4
UK Others
€ billion

73
9) Equit ies
A18 Euro area equity markets grew rapidly in 1999 and 2000, reflecting technology andtelecommunications firms tapping capital markets through share issuance. Since 2000, thesemarkets have fallen back as the 1990s bull run came abruptly to an end.
A19 The market capitalisation of companies traded on the London Stock Exchange remainsa far larger proportion of GDP than any other of the European exchanges (Chart A18),although in part this simply reflects the greater reliance on stock markets as a means ofraising finance by British and American firms compared to their continental Europeancounterparts. While the capitalisation of the London Stock Exchange relative to otherEuropean bourses has diminished, turnover remains far higher in London (Chart A19). Thenumbers of companies listed on the London Stock Exchange exceeds by a large margin thatof other exchanges within Europe (Chart A20), reflecting the international and open nature ofthe UK’s markets.
A20 The level of foreign equity turnover further illustrates the international flavour of theLondon Stock Exchange. Foreign equity turnover was 55.8 per cent of total equity turnover inLondon in 2001, compared to 16.6 per cent on the New York Stock Exchange and less than 3per cent on German exchanges (Chart A21).
AN N E X A : TH E UK’S PO S I T I O N A S A N IN T E R N AT I O N A L WH O L E S A L E F I N A N C I A L CE N T R EA
London StockExchange high
internationalexposure
London StockExchange’s
capitalisationhigh compared
to UK GDP
Chart A18: Stock market capitalisation (year-end)
1Euronext was created in September 2000 by the merger of the Paris, Brussels and Amsterdam exchanges. 1992-2000 datarepresent the combined capitalisation of the separate exchanges. 2001 and 2002 data are for the new merged exchange.Euronext capitalisation is measured as a percentage of the combined GDP of France, Belgium and the Netherlands. Lisbon, nowalso part of Euronext, is not included.
Source: OECD, World Federation of Exchanges and HM Treasury calculations.
0
20
40
60
80
100
120
140
160
180
200
TokyoNasdaqNYSEEuronext1LondonDeutsche Börse
2001200019991998199719961995199419931992 2002
Per cent of GDP
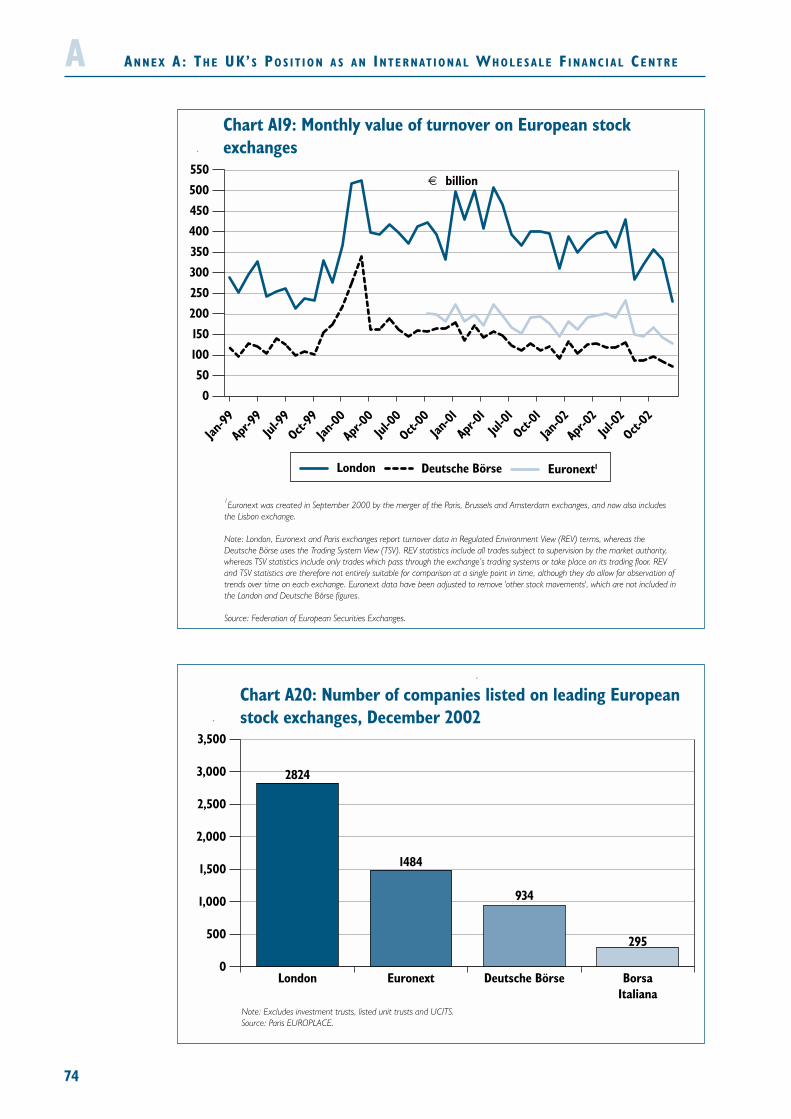
AN N E X A : TH E UK’S PO S I T I O N A S A N IN T E R N AT I O N A L WH O L E S A L E F I N A N C I A L CE N T R E
74
A
Jan-99
Apr-9
9Jul
-99
Oct-99
Jan-00
Apr-0
0Jul
-00
Oct-00
Jan-01
Apr-0
1Jul
-01
Oct-01
Jan-02
Apr-0
2Jul
-02
Oct-02
Chart A19: Monthly value of turnover on European stock exchanges
Euronext1Deutsche BörseLondon
0
50
100
150
200
250
300
350
400
450
500
550
1Euronext was created in September 2000 by the merger of the Paris, Brussels and Amsterdam exchanges, and now also includes the Lisbon exchange.
Note: London, Euronext and Paris exchanges report turnover data in Regulated Environment View (REV) terms, whereas the Deutsche Börse uses the Trading System View (TSV). REV statistics include all trades subject to supervision by the market authority, whereas TSV statistics include only trades which pass through the exchange’s trading systems or take place on its trading floor. REV and TSV statistics are therefore not entirely suitable for comparison at a single point in time, although they do allow for observation of trends over time on each exchange. Euronext data have been adjusted to remove 'other stock movements', which are not included inthe London and Deutsche Börse figures.
Source: Federation of European Securities Exchanges.
� billion
Chart A20: Number of companies listed on leading European stock exchanges, December 2002
Note: Excludes investment trusts, listed unit trusts and UCITS. Source: Paris EUROPLACE.
0
500
1,000
1,500
2,000
2,500
3,000
3,500
BorsaItaliana
Deutsche BörseEuronextLondon
295
934
1484
2824

75
10) Der ivat ives
A21 Through remote traders, the UK accounts for the largest source of turnover on Eurex, theSwiss-German exchange through which the majority of Bund future contracts are traded. Thisquickly reversed the initial dominance of traders based in Germany in these markets(Table A5).
Table A5: Eurex market turnover by country of originPer cent 1997 1999 2001 2002
UK 7 25 33 41
Germany 81 41 31 25
US 1 7 10 11
France 3 8 9 10
Others 8 19 17 13
Source: Eurex.
A22 Taking euro STIR, bond and other contracts together, Euronext-LIFFE is also the largestderivatives exchange in Europe by notional value of contracts traded, though Eurex has beenthe largest derivatives exchange in Europe by volume of contracts traded since 1998 (Tables A6 and A7). Since March 2001, over 99.5 per cent of euro STIR contracts have beentraded on LIFFE.
AN N E X A : TH E UK’S PO S I T I O N A S A N IN T E R N AT I O N A L WH O L E S A L E F I N A N C I A L CE N T R EA
Chart A21: Share of foreign equity turnover on leading stock exchanges by value
Source: IFSL, 2002b.
0
20
40
60
80
100
OthersGermanyNasdaqNYSELondon
1996 1999 2001
61.9 58.5 55.8
23.520.5
16.6
9.311.4
9.9
Per cent
1.73.6
5.04.6
2.9
14.8
Exchange-tradedderivatives

AN N E X A : TH E UK’S PO S I T I O N A S A N IN T E R N AT I O N A L WH O L E S A L E F I N A N C I A L CE N T R E
Table A6: Share of exchange-traded derivatives turnover by valuePer cent LIFFE Eurex Other Euronext Other Europe US Asia
1999 22.6 10.6 1.1 0.9 49.8 15.0
2000 22.3 8.8 1.1 1.4 50.7 15.7
2001 23.4 7.7 0.3 0.3 59.1 9.3
2002 21.8 7.0 0.2 0.3 62.0 8.7Note: 2002 data are for the first two quarters only.Source: BIS and individual exchanges.
Table A7: Eurex and LIFFE interest rate product turnover, December2002
Interest rate options Interest rate futures
Derivative Country Contracts Notional Contracts Notional
exchange traded turnover traded turnover
(€ million) (€ million)
LIFFE UK 3,893,725 3,752,847 9,979,510 8,671,713
Eurex Germany/Switzerland 2,082,758 227,046 23,834,618 2,612,017
Source: Federation of European Securities Exchanges.
A23 The UK has the largest market share in OTC derivatives (Chart A22). It takes 36 per centof the market, a share unchanged since 1998. Germany, however, has increased market sharefrom around 5 per cent of global turnover in 1995 to just below 13 per cent today. Paris hasseen market share increase only marginally over the same period.
76
A
Chart A22: Share of OTC derivatives turnover by value
Source: IFSL, 2002b.
0
10
20
30
40
50
60
70
80
90
100
OthersSingaporeSwitzerlandJapanFranceGermanyUSUK
April 2001April 1998April 1995
19.2
7.3
9.7
8.93.32.413.2
19.1
2.92.0 0.8
8.8
12.7
17.7
36.0
5.18.3
19.7
27.4
12.21.66.7
19.0
36.0
Per cent
OTC derivatives

77
1 1 ) Asset management
A24 The UK is the third largest home of assets under management internationally and theleading European centre for asset management. In terms of assets managed as a percentageof GDP, London is the largest of the major asset management centres (Chart A23). A particularfeature of the UK asset management sector is its management of funds on behalf of overseasclients, reflecting the UK’s expertise in international asset management.
A25 London is the world’s largest centre for institutional equity management (Table A8). In1999, it managed over US$2.4 billion worth of institutional equities, nearly three times the1990 total, and around five times the amount managed by the second largest Europeancentre, Paris. Since 1999, however, there has been a substantial fall in equity markets, whichhas negatively affected the value of assets managed by London and other major financialcentres.
A26 Scotland is also one of Europe’s major fund management centres with around£294 billion under management in September 2002, down from a 2000/2001 high followingstock market falls (Table A9). Assets under management in Scotland grew particularlystrongly between 1998 and 2000. While this can partly be explained by rises in equity prices,the increase in assets under management in Scotland is mostly attributable to the merger ofScottish Widows Investment Managers and Hill Samuel Investment Management. Thisfollowed the acquisition of Scottish Widows by Lloyds TSB and the decision to base assetmanagement operations in Edinburgh.
A27 Nearly 5 per cent of European pension and long-term life assurance funds are managedfrom Scotland. In 1999, it was the sixth largest centre in Europe for institutional equities, andthe fifteenth largest internationally.
AN N E X A : TH E UK’S PO S I T I O N A S A N IN T E R N AT I O N A L WH O L E S A L E F I N A N C I A L CE N T R EA
UK a leadinginternational
assetmanagement
centre
Scotland as afinancial centre
Chart A23: Total assets under management
Source: OECD, IFSL, 2002 a,b, and HM Treasury calcuations.
0
50
100
150
200
250
20011999
Per cent of GDP
UK Netherlands US France Japan Italy Germany

AN N E X A : TH E UK’S PO S I T I O N A S A N IN T E R N AT I O N A L WH O L E S A L E F I N A N C I A L CE N T R E
Table A8: Leading fund management centres ranked by institutionalequity holdings, 1999 (year-end)
Country US$ billion
1. London UK 2,461
2. Metropolitan New York US 2,363
3. Tokyo Japan 2,058
4. Boston US 1,871
5. San Francisco US 726
6. Los Angeles US 569
7. Paris France 458
8. Philadelphia US 419
9. Zurich/Basel/Winterthur Switzerland 414
10. Denver US 340
11. Amsterdam Netherlands 327
12. Chicago US 316
13. Frankfurt Germany 310
14. Toronto Canada 289
15. Edinburgh/Glasgow UK 253
Source: Thomson Financial Investor Relations, 2000.
78
A
Chart A24: Breakdown of assets under management, 2001
Source: IFSL, 2002b.
0
2,000
4,000
6,000
8,000
10,000
12,000
14,000
16,000
18,000
Mutual Funds Insurance Pensions
OthersItalyNetherlandsGermanyFranceUKJapanUS
US$ billion

79
Table A9: Total assets under management in ScotlandSep-98 Sep-99 Sep-00 Sep-01 Sep-02
Total assets under management (£ billion) 197.1 233.9 350.7 309.8 294.0
Annual growth rate (per cent) - 18.7 49.9 -11.7 -5.1
Financial Times World Index Series (month-end) 254.06 329.0 356.48 252.89 203.85
Annual growth rate (per cent) – 29.5 8.4 -29.1 -19.4
Source: Scottish Financial Enterprise, 2002 and Financial Times.
12 ) Insurance
A28 The UK insurance market is third in size internationally behind the US and Japan, but isthe largest of the major international markets as a percentage of GDP (Chart A25). It leadsother European insurance markets, with a 10 per cent share of total world premium income,compared to 5 per cent for both Germany and France.
A29 Lloyd’s of London is the world’s leading specialist insurance market, providing specialistinsurance services to businesses in over 120 countries. Approximately 5 per cent of worldreinsurance is placed at Lloyd’s, which also accounts for half of the London market’sinternational insurance premiums, with most trades carried out in US dollars. It is the world’ssecond largest commercial insurer and sixth largest reinsurer. In 2002, 88 syndicatesunderwrote insurance at Lloyd’s. The world’s 20 largest insurance and reinsurance companiesare actively located in the market.
A30 The UK had a 10 per cent share of total world treaty reinsurance in 2000, i.e. reinsurancearranged under a contract applying to a specified portfolio of business. It also has the largestshare of net premiums in the world for marine and aviation insurance (19 per cent and 39 percent respectively in 1999).
A31 General and long-term insurance are significant in terms of their weight in assetmarkets. The UK sector’s total investments amounted to £1,060 billion in 2001, with thegreatest proportion of assets held in stocks and shares. Insurers hold around one fifth of UKcompany equity. The Association of British Insurers (2002) reports that £974 billion is investedin long-term insurance products, or around 30 per cent of UK personal sector wealth. £210billion is invested in insurance-administered occupational pensions, £350 billion ininsurance administered personal pensions and £250 billion in life assurance.
A32 As noted earlier, expertise in managing these funds lies both in London and in Scotland.In the insurance sector, Scottish-based life assurance offices alone have over £250 billion offunds under management, employing 15,000 people.
AN N E X A : TH E UK’S PO S I T I O N A S A N IN T E R N AT I O N A L WH O L E S A L E F I N A N C I A L CE N T R EA
UK is thirdlargest insurance
market
Reinsurance
General andlong-terminsurance
Scotland aleading centre

AN N E X A : TH E UK’S PO S I T I O N A S A N IN T E R N AT I O N A L WH O L E S A L E F I N A N C I A L CE N T R E
Table A10: Long-term and general insurance portfolio holdings of UKinsurersTotal long-term and general insurance investment holdings £1,060 billion
Of which:
UK public sector securities (including gilts) £140 billion
Overseas public sector securities £47 billion
UK ordinary stocks and shares £307 billion
Other UK company securities £113 billion
Overseas ordinary stocks and shares £130 billion
Other overseas company securities £62 billion
Unit trusts £69 billion
Property £76 billion
Other investments £116 billon
Source: ABI, 2002.
80
A
Chart A25: Premium income of major world insurance markets
Source: OECD, IFSL, 2001b and 2002b and HM Treasury calculations.
0
2
4
6
8
10
12
14
16
18
200019991990
GermanyUSFranceJapanUK
Per cent of GDP

81
13 ) Commodity exchanges
A33 London hosts highly liquid commodity markets in the London Metal Exchange (LME)and the International Petroleum Exchange (IPE). Turnover on both remains healthy, with theturnover of trades on the IPE increasing rapidly through the past decade (Charts A27, A28 andA29).
A34 Trades on the IPE are denominated in US dollars, so little effect would be expected fromthe introduction of the euro. Similarly, all LME contracts are traded and quoted in US dollars.However, LME contracts can be cleared in currencies other than US dollars – the euro,Japanese yen, and sterling – though the tonnages cleared in currencies other than US dollarsare relatively small.
AN N E X A : TH E UK’S PO S I T I O N A S A N IN T E R N AT I O N A L WH O L E S A L E F I N A N C I A L CE N T R EA
Chart A26: Average daily turnover on the London Metal Exchange (all contracts)
Source: London Metal Exchange.
0
20,000
40,000
60,000
80,000
100,000
120,000
140,000
Alloy Zinc Tin
LeadNickelCopperAluminiumMar-
98
Sep-9
8
Mar-99
Sep-9
9
Mar-00
Sep-0
0
Mar-01
Sep-0
1
Mar-02
Sep-0
2
Dec-02
Lots

AN N E X A : TH E UK’S PO S I T I O N A S A N IN T E R N AT I O N A L WH O L E S A L E F I N A N C I A L CE N T R E
82
A
Chart A27: Turnover of Brent crude oil futures on the International Petroleum Exchange, London
Source: International Petroleum Exchange.
0
20,000
40,000
60,000
80,000
100,000
120,000
Aug-0
2
Dec-02
Aug-0
1
Aug-0
0
Aug-9
9
Aug-9
7
Aug-9
8Au
g-96
Aug-9
5
Aug-9
4
Aug-9
3
Aug-9
2Au
g-91
Aug-9
0
Aug-8
9
Aug-8
8
Lots
Chart A28: Turnover of gas oil futures on the International Petroleum Exchange, London
Source: International Petroleum Exchange.
0
5,000
10,000
15,000
20,000
25,000
30,000
35,000
40,000
May-81
May-83
May-85
May-87
May-89
May-91
May-93
May-95
May-97
May-99
May-01
Lots

83
14) Profess ional and support ser v ices
A35 UK financial services activity benefits from a very wide range of supporting services.
A36 Along with New York, London is one of the two leading centres for international legalservices. There are an increasing number of foreign law firms with offices in London,including more than 60 from the US. Five of the ten largest international law firms are basedin London. Legal services accounted for around 1.3 per cent of UK GDP in 2000 and employed246,000 people in 2001.
A37 London is a leading international centre for the provision of accounting and relatedservices. All the largest accountancy firms have headquarters in London and branchesthroughout the UK. In 1998, accounting had a UK GDP share of 1.0 per cent, and in 2000employed 180,000 people. Net overseas earnings of accountancy grew rapidly in the late1990s to around £500 million (Chart A30), underlining strong growth in the UK sector.
A38 The UK is the second largest centre for management consultancy in Europe measuredby turnover (Chart A31), with healthy growth in overseas earnings seen through the 1990s(Chart A32). The total revenue of UK management consultancies was estimated by theManagement Consultancies Association (MCA) to be £8 billion in 2001. The revenue of MCAmembers increased from £1.5 billion in 1995 to £3.7 billion in 2000, and then to £4.4 billion in2001. Over half of revenue in 2001 was generated by outsourcing and information technologyservices.
AN N E X A : TH E UK’S PO S I T I O N A S A N IN T E R N AT I O N A L WH O L E S A L E F I N A N C I A L CE N T R EA
Chart A29: Turnover of natural gas futures on the International Petroleum Exchange, London
Source: International Petroleum Exchange.
0
500
1,000
1,500
2,000
2,500
3,000
3,500
Mar-97
Sep-9
7
Mar-98
Sep-9
8
Mar-99
Sep-9
9
Mar-00
Sep-0
0
Mar-01
Sep-0
1
Mar-02
Sep-0
2
Lots
Legal services
Accounting andrelated services
Managementconsultancy

AN N E X A : TH E UK’S PO S I T I O N A S A N IN T E R N AT I O N A L WH O L E S A L E F I N A N C I A L CE N T R E
84
A
Chart A30: Net overseas earnings of UK accountancy sector
Source: ONS.
0
100
1992 1993 1994 1995 1996 1997 1998 1999 2000 2001
200
300
400
500
600
700
800£ million
Exports Imports Net
Chart A31: Share of world management consultancy turnover, 2001
Source: IFSL, 2002b.
Other7%
Other Europe7%
Spain2%
Italy2%
France6%
UK9%
Germany10%
US 57%
85
AN N E X A : TH E UK’S PO S I T I O N A S A N IN T E R N AT I O N A L WH O L E S A L E F I N A N C I A L CE N T R EA
Chart A32: Net overseas earnings of UK management consultancy
Source: ONS.
0
200
400
600
800
1,000
1,200
2001200019991998199719961995199419931992
Exports Imports Net
£ million

86

B AN N E X B: TH E LO C AT I O N O F
F I N A N C I A L AC T I V I T Y I N T H E US
87
B1 The US provides a useful example of financial location because the existence offinancial markets pre-dates both the creation of the political centre of gravity in the USaround Washington, DC, and also the territorial expansion of the 19th century whichintegrated vast new areas into the economy. Examining this evolution, and how the patternof business is distributed today, should provide some further insights into how economicintegration such as that of EMU can influence the location of markets. A summary of someof the main historical influences is contained in Box B1. Further details are included in theEMU study by HM Treasury The United States as a monetary union.
Box B1: US financial services location: a historical background
The first three banks in the US were founded in three cities – New York, Boston andPhiladelphia – in the 1780s. They served local markets, isolated from each other in the absenceof any banking system. It was in these three cities that the first securities markets developed,soon to be followed by Baltimore. Significantly, the establishment of US securities marketsprecedes the establishment of the nation’s permanent capital in the District of Columbia(Washington, DC) – a fact that may go some way to explaining the dispersal of US securitiesmarkets away from the political centre of gravity.
Although in today’s terms the three markets appear relatively close geographically (New Yorkand Boston are around 200 miles apart, while only 100 miles separates New York fromPhiladelphia), communication delays existed between the cities in the early days that helpedeach to establish themselves and grow independently, catering for regional markets. Thesecommunication delays amounted to between one and two days between Philadelphia and NewYork, and a further week to Boston.
Despite these distance barriers, Sylla (1995) finds evidence of integration between these threemajor markets from the beginning, and that pricing was efficient even despite delays incommunication between the cities. Sylla also notes that New York appears to have been themost active of the markets, even though Philadelphia was widely regarded as the leadingfinancial centre, and was at that time the largest city in the US.
Even as the country expanded with the acquisition of new territory, it was the North East USthat witnessed the most rapid development of financial markets and banking. By 1830, Syllarecords that the New England and mid Atlantic regions of the US were home to roughly 86 percent of US banks, and 72 per cent of banking capital.
In some respects, this early strength in the North Eastern stock markets probably also helpedto stymie the development of some financial markets in the South and West (though theurbanisation of the South was arguably some 40 years behind the rest of the US). Atlanta andDallas however emerged as regional banking centres in the South, yet many banks in these citieschose to insure themselves against large credit demands by linking with banks elsewhere in thecountry. Odell and Weiman (1998) report that in 1880, 90 per cent of Georgia banks had turnedto banks in New York for their primary correspondent, while the equivalent figure for Texas was97 per cent.
In this way, New York’s early-mover advantage was reinforced, though as regional financialcentres such as Kansas City and St Louis grew, they were able to draw some business away fromNew York. The rapid spread of banking post-1880 stimulated demand for regional banks, whichtended to concentrate around the railroad hubs – Atlanta and the twin cities of Dallas-ForthWorth in particular.
By the time the Federal Reserve was founded, Atlanta and Dallas were the dominant regionalfinancial centres in the Southern US. Both were chosen as home for regional Federal Reservebanks, which arguably helped cement their positions. Odell and Weiman (1998, p. 123) believethat “the Fed… acted as a powerful lever reinforcing economic development within the LowerSouth”.

AN N E X B: TH E LO C AT I O N O F F I N A N C I A L AC T I V I T Y I N T H E US
B2 Kindleberger (1974) shows that the rise of New York as the financial centre of the UScame despite repeated attempts to break its power by rival cities and through variouslegislative routes. It is an example where economies of scale in the provision of financialservices overcame adverse institutional enactments aimed at trimming New York’s hegemonyover the US financial system.
B3 Prior to the Napoleonic wars, no North American Atlantic seaport dominated trade andfinance. In 1815, New York made its move to become the major trading centre, enacting anauction law that offered favourable conditions to wholesale merchants. These merchantsfocused their trade on the port, and thus stimulated the demand for sterling to finance theirtrading activities (mainly cotton and grain) between New York and Liverpool.
B4 This provided the catalyst that gave New York the advantage over other centres, and setin train a process of agglomeration and self-sustaining growth. It attracted financial talentand capital, as a practice developed of maintaining bankers’ balances in the city to handle theseasonal movement of agricultural goods passing through the port. New York funds started tocommand a premium over other centres, provoking other states to enact measures to preventa drain of funds. None proved effective in undermining investors’ preferences for New Yorkpaper and deposits.
B5 The National Banking Act of 1863 (amended in 1864) formalised the role of New York’sbanks as the country’s banking reserve. Repeated attempts to wrest this dominance awayfrom it were made, the first being in 1887 when the National Banking Act was amended againto allow any city with over 200,000 inhabitants to become a reserve city; and then in 1913,when the Federal Reserve Act envisaged separate regional money and capital markets centredon the 12 district banks.
B6 There was, however, to be only one US money market and one US monetary policy, andboth were centred on New York. Here, discount and open-market policies were unified. Thefacilities New York offered were more specialised and competitive: other regions thereforeused these existing facilities, reinforcing New York’s pre-eminence. Half the loans made byNew York’s banks were for customers outside the city, compared to 8.2 per cent for Chicago,7.8 per cent for Dallas and 6.3 per cent for San Francisco, its nearest competitors.
B7 Though New York demonstrates all the hallmarks of self-sustaining growth, it has notdominated entirely the financial landscape of the US. Table B1 illustrates the relativeimportance of major US cities in terms of institutional equity holdings. The data show thatthe US fund management industry is dispersed over several different centres, and unlike theEU where London is by some margin the pre-eminent management centre of institutionalfunds, no city is as strongly dominant. As two of the first three cities to develop securitiesmarkets in the late 18th century, New York and Boston are still the two largest centres. NewYork holds 33 per cent of the holdings of the ten largest US fund management centres, Boston26 per cent.
88
B
The rise of New York

89
Table B1: Leading US fund management centres ranked by institutionalequity holdings, 1999 (year-end)
US$ billion
1. New York 2,363
2. Boston 1,871
3. San Francisco 726
4. Los Angeles 569
5. Philadelphia 419
6. Denver 340
7. Chicago 316
8. Houston 242
9. Hartford 19910. Minneapolis 186
Source: Thomson Financial Investor Relations, 2000.
B8 This co-existence of two large fund management centres is despite 200 years ofintegration, and the two cities being, by US standards, a relatively short distance apart (thecities are significantly closer together than London and Frankfurt, two of the dominantfinancial centres within the EU). The third of the initial three markets, Philadelphia, alsoremains host to a significant level of trade. Baltimore is the only obvious exception – one ofthe first cities to begin securities trading around the turn of the 19th century, Baltimore isconspicuous by its absence from the top ten fund management cities.
B9 A similar observation is apparent in derivatives trading. Chicago, where derivatives werefirst developed, maintains its advantage in this form of trading, even though New York isgenerally thought of as being the more important financial centre (Table B2). Overall, Chicagomaintains a greater degree of dominance in this market than is apparent by any city in thefund management industry.
Table B2: Annual contract volumes on US derivatives exchangesMillions of contracts 1998 2001
Chicago (CBOT, CME and CBOE) 715 979
New York (NYMEX and AMEX) 174 293
Philadelphia (PHLX) 39 103San Francisco (PE) 59 101
Source: IFSL, 1999 and 2002c.
B10 There are several stylised facts that can be drawn from these data. Casual observationseems to suggest that there is a first-mover advantage in financial market business, andcertainly in the case of New York – those cities where markets develop first (whether byhistorical accident or technical expertise) and establish expertise have retained their leadeven in the face of competition from other cities. This suggests that once started,agglomeration effects can be long standing, as financial networks and expertise develop inparticular areas.
B11 This also appears to sustain itself in the face of at least some innovation in the industry.Chicago developed as a derivatives market because it was the pre-eminent commoditiestrading city in the US, and had a competitive advantage in commodities derivatives. Morerecently, it has used this baseline expertise to exploit new markets in exchange and interestrate derivatives, both of which have seen rapid growth.
AN N E X B: TH E LO C AT I O N O F F I N A N C I A L AC T I V I T Y I N T H E USB
Stylised factsfrom the US

AN N E X B: TH E LO C AT I O N O F F I N A N C I A L AC T I V I T Y I N T H E US
90
B
B12 Observation of the geographic pattern of activity in the US shows that it is possible fordifferent financial centres to co-exist in even a relatively small geographical area. The data onequity markets shown above illustrate this point – four of the top ten US cities in thesemarkets are located in the North East US (New York, Boston, Philadelphia, and Hartford),while a further two are located in California (Los Angeles and San Francisco). In addition, thedata show that it is possible for cities to specialise in different markets within a singlecurrency zone, and for a city to be a leader in one market but a minor player in others.

C AN N E X C: TH E O R I E S O F LO C AT I O N
91
C1 This annex outlines neoclassical theory, and the implications of trade costs and theassumption of increasing returns used in new trade and new economic geography models onthe location of activity (Krugman and Venables, 1995a, 1996).
C2 Neoclassical trade theory1 assumes constant returns to scale, homogenous goods andperfect competition. The comparative advantage of a location is determined exogenously, forexample by the distribution of factor endowments. If firms produce in a location where otherfirms are located, the theory argues that they risk increasing competition both in factormarkets (i.e. competition for scarce land, labour and capital) and in their product marketswhen they try to sell their outputs. Under these conditions, and assuming trade costs arehigh, neoclassical theory suggests that firms will tend to disperse according to thedistribution of factor endowments. This will minimise competition from other producers forscarce resources and, as a result, means that markets become segmented.
C3 A dispersed distribution of activity is rarely observed in wholesale financial services. Byintroducing increasing returns to scale and trade costs, new trade and new economicgeography models provide one means for understanding why some locations becomespecialised in certain types of activity.
C4 Krugman and Venables (1995a, 1996) show that firms may tend to locate (or agglomerate)in larger markets when trade costs such as transport costs2 are neither too high nor too low. Byagglomerating in one place, firms are able to take advantage of the various cost and demandlinkages between their activities. Because of the beneficial synergies between their activities,other related firms are attracted to the location and regions gradually specialise in one form ofproduction, e.g. Detroit in car production, northern Italy in textiles.
C5 Krugman and Venables’ work suggests the location of production can be stable over arange of transport costs. If trade costs gradually increase, then there may become a pointwhere firms disperse to avoid product market competition and markets will becomesegmented - a similar scenario to that described by the neoclassical model.
C6 In contrast, if trade costs become sufficiently low, markets can be served easily from anylocation, and proximity to markets might be a less important criterion in the locationdecision than the cost of production and the availability of factors of production.
C7 An example of lower transport costs in the financial services sector is the widespreadintroduction of technology that has resulted in the reduction of internationaltelecommunications costs for international market firms, and increased their ability to sendinformation quickly over large distances. Because technology allows financial services firmsto deliver a variety of services through telecommunication systems over large distances, a fallin transport costs has two contrasting implications for location.
C8 First, it can create the potential for some forms of financial service activity to relocateto lower-cost locations and serve their clients from there, thereby acting as a dispersion force.This is relevant especially to those financial services firms and activities involved in routineback-office processing of information where, because margins are low, cost imperativesmight be greatest.
1 As set out in the seminal works of Heckscher (1919) and Ohlin (1933) and subsequent contributions.2 New trade models capture this effect through the conceptual tool of ‘iceberg costs’ – a fraction of a good melts away asit is transported over a distance, usually assumed to be at a constant rate per kilometre travelled. The greater thedistance, the greater the transport costs for the producer.

AN N E X C: TH E O R I E S O F LO C AT I O N
C9 Second, by allowing some financial services firms to concentrate activity in one locationand serve their markets from a central point, it acts as a force increasing concentration. Thismay apply most to core wholesale operations – treasury and risk management, research andmergers and acquisition – where market firms can centralise their activities in one financialcentre and, from there, offer services to a range of national markets. By concentratingoperations on one site, firms can reduce the fixed costs associated with multiple sites andcapture internal scale economies. If constant returns to scale are assumed, a firm’s activitycould be simply divided into any number of separate operations (so-called ‘backyardcapitalism’). In contrast, the exploitation of internal scale economies implies activity takesplace in a small number of operations and therefore at fewer locations.
Table C1: Location theories
Neoclassical New trade New economictheory theory geography
Seminal papers Ricardo (1817); Krugman Marshall (1890);Heckscher (1919); Ohlin (1979, 1980, 1981); Krugman (1991 a,b)(1933); Weber (1909); Dixit and Norman (1993); Krugman andVanek (1968) (1980); Helpman Venables (1995a,b);
and Krugman Venables (1996);(1985); Weder Markusen and Venables(1995) (1996); Puga and
Venables (1997); Fujita,et al. (1999)
Market structure Perfect competition Monopolistic Monopolisticcompetition competition
Determinants of location • Technological • Degree of • Pecuniarydifferences plant-level externalities (labour
• Natural resource increasing market pooling,endowments returns input-output
• Factor endowments • Substitutability linkages, migration-and intensities of differentiated induced demand)
• Size of home linkages • Technologicalmarket externalities
Distribution of economic • Determined by • Exogenously • Endogenousactivity given endowments given • Centripetal
• Inter-industry • Intra- and agglomeration forcesspecialisation inter-industry • Intra- and inter-
• Unique equilibria specialisation industry specialisation• Unique • Multiple equilibria
equilibria • ‘U curve’Source: Adapted from Brülhart, 1998.
92
C