Embed Size (px)
DESCRIPTION
The Lifetime Impacts of a Kindergarten Classroom. Diane Whitmore Schanzenbach Northwestern University and National Bureau of Economic Research. Introduction. What are the long-term impacts of high quality early childhood education ? - PowerPoint PPT Presentation
Citation preview

The Lifetime Impacts of a Kindergarten Classroom
Diane Whitmore SchanzenbachNorthwestern University
and National Bureau of Economic Research

Introduction
• What are the long-term impacts of high quality early childhood education?
– We link data from a widely studied education experiment to administrative records on earnings for the first time
How does kindergarten classroom assignment affect you 25 years later?

Research Context
• Important policy question but very limited evidence to date
– Why? Few datasets link information on early childhood test scores with data on adult outcomes
• Perry Preschool– High quality preschool intervention in 1962– Long term positive impacts across a wide range of
outcomes– 123 participants, all low income

Design of STAR Experiment• 11,571 Children• 79 Schools • 1 Cohort, Started School in 1985-86• Random Assignment Small (13-17 Students) Regular, Aide (22-25 Students)• Teachers Randomly Assigned• KG-3rd Grade
• 45% of cohort entered after KG• ~25% of cohort in STAR all 4 years
• 4th grade all returned to regular classes• Most children born in 1980 -> 30 years old today

Students in small classes scored higher on standardized tests, K-8
0123456789
K 1 2 3 4 5 6 7 8
Grade level
Per
cen
tile
po
int
dif
fere
nce
Note: Effect of class size after controlling for student’s race, gender, free-lunch status and initial school-by-entry-wave fixed effects.
Switch from SAT to CTBS and return to regular-size classes
Black students
Free-lunch students
Full sample

Students randomly assigned to small classes more likely to take a college entrance exam
10
15
20
25
30
35
40
45
50
Whites Blacks Free Lunch
SmallRegular
Perc
ent T
akin
g SA
T or
ACT
Notes: Figure shows percent of students who took the ACT or the SAT exam, by their initial class-type assignment. Students initially assigned to regular classes with and without a teacher aide are combined in the figure. Sample consists of 9,397 STAR students who were H.S. seniors in 1998. Source: Krueger and Whitmore (1999).

Other benefits of small classes
• African American boys less likely to have juvenile criminal record
• Girls less likely to give birth as teens• More likely to graduate from high school
• Students today are ~30 years old– Opportunity to investigate a wider range of adult
outcomes

United States Tax Data• Access to selected variables in anonymous U.S. tax records
to conduct research on behavioral responses to economic policies
• Dataset covers full U.S. population from 1996-2008• Approximately 90% of working age adults file tax returns• Third-party reports yield data on many outcomes even for
non-filers– Employer and wage earnings from W-2 forms– College attendance from 1098-T forms
• 95% of STAR records were linked to tax data– Match rate unrelated to treatment

STAR SampleMean
U.S. 1979-80 cohortMean
(1) (2)
Average Wage Earnings (2005-07) $15,910 $20,500
Fraction With Zero Earnings (’05-’07) 13.9% 15.6%
Attended College in 2000 (age 20) 26.4% 34.7%
Ever Attended College by age 27 45.5% 57.1%
Average Parental Income (’96-’98) $48,010 $65,660
Table 1: Summary Statistics

Outline1. Test scores and adult outcomes in the cross-
section2. Re-evaluate validity of STAR experimental design3. Impacts of observable classroom characteristics4. Impacts of unobservable classroom
characteristics5. Fade-out, re-emergence, and non-cognitive
skills6. Cost-benefit analysis

1. Cross-sectional correlations
• Begin by correlating KG test scores with adult outcomes– Useful to benchmark estimates from randomized interventions
• Show both raw correlations and OLS regressions with controls– Quartic in parental household income interacted with marital status– Mother’s age at child’s birth– Parent 401K contributions, home ownership– Child gender, free-lunch status, race and age
• Test score: percentile score on the KG Stanford Achievement Test (average of math & reading)

What is a kindergarten test?• Instructions:
• You should be on the part of the page with the keys across the top. Look at the cups in the first row. How many cups are there? Fill in the circle under the number that tells how many cups there are.
5 64
Mathematics

What is a kindergarten test?• Instructions:
• You should be on the part of the page with the strawberries across the top. Put your marker under the first row. In this box there are a sentence and three words. Read the sentence and then read the three words under the sentence. Decide which word makes the most sense in the sentence. Fill in the circle under the word that goes best in the sentence.
jump bigcan
Reading
The dog likes to _________.

Figure 1a: Wage Earnings in 2007 vs. KG Test Score
KG Test Score Percentile
Mea
n W
age
Earn
ings
from
Age
25-
27
$10K
0 20 40 60 80 100
$15K
$20K
$25K

Test scores and Earnings in the Cross-SectionDependent Var.: Wage Earnings
(1) (2) (3) (4)KG Test Percentile $132 $93.8 $90.0 $97.7
($12.2) ($11.6) ($8.65) ($8.47)
Parental Income Percentile $146($8.15)
Entry Grade KG KG All AllClass Fixed Effects x x xStudent Controls x x xParent Controls x x
Adjusted R2 0.05 0.17 0.17 0.16Observations 5,621 5,621 9,939 9,939
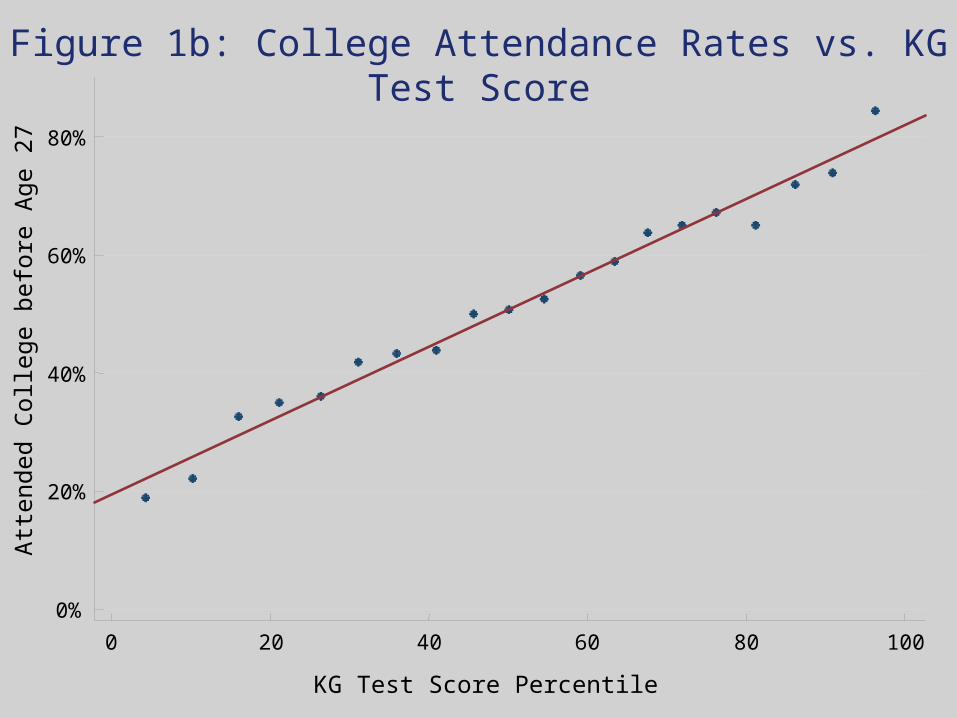
Figure 1b: College Attendance Rates vs. KG Test Score
KG Test Score Percentile
0%
20%
40%
60%
80%
0 20 40 60 80 100
Att
ende
d C
olle
ge b
efor
e A
ge 2
7

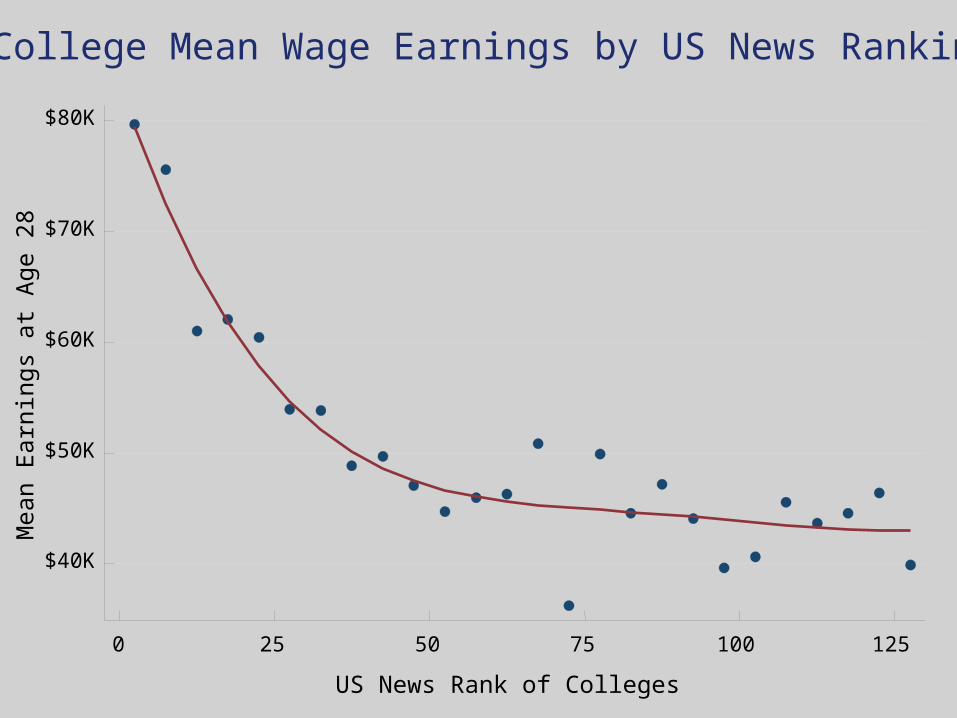
An Earnings-Based Index of College Quality
• We construct an index of college quality using tax data
• Tuition paid to any higher ed. institution automatically generates a 1098-T form linking student and institution
• Find everyone age 20 enrolled in college in 1999
• Calculate average wage earnings in 2007 (from W-2s) by college
• For those who do not attend college, define college quality index as mean earnings for those not in college in 1999

US News College Mean EarningsRanking at age 28
1 Harvard
$79,6432 Princeton3 Yale4 Cal Tech5 MIT
6 Stanford
$75,5707 U Penn8 Columbia9 U Chicago
10 Duke ….
121 Arizona St.
$46,390122 Catholic U123 MI Tech124 U Buffalo125 U San Fran
An Earnings-Based Index of College Quality
Mea
n Ea
rnin
gs a
t Age
28
$40K
$50K
$60K
$70K
$80K
0 25 50 75 100 125
College Mean Wage Earnings by US News Ranking
US News Rank of Colleges
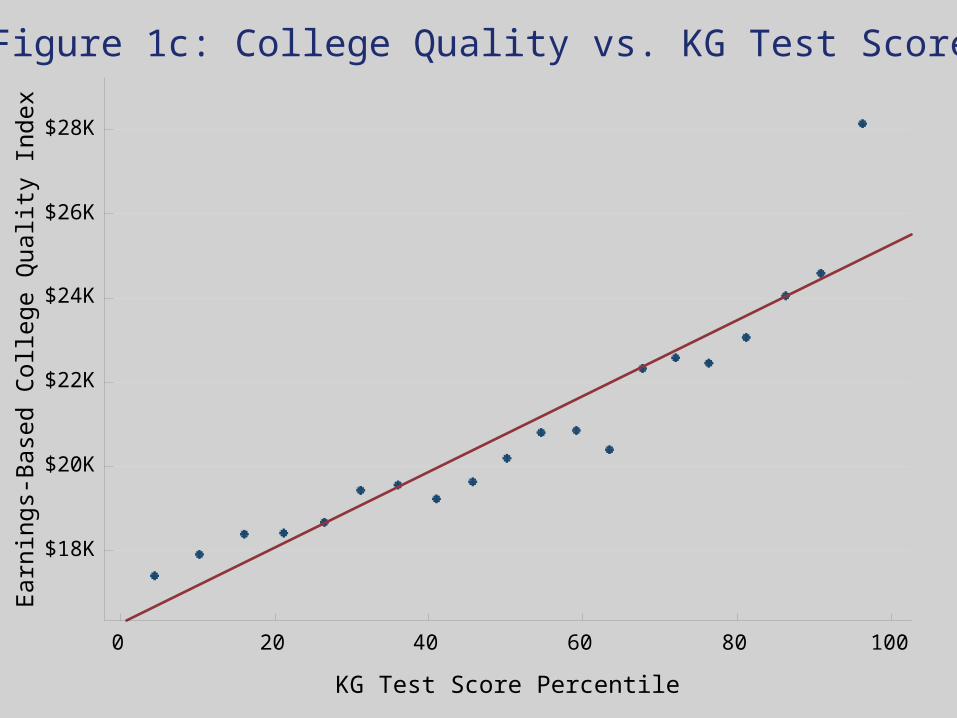
Figure 1c: College Quality vs. KG Test Score
$18K
$20K
$22K
$24K
$26K
$28K
Earn
ings
-Bas
ed C
olle
ge Q
ualit
y In
dex
0 20 40 60 80 100
KG Test Score Percentile

Figure 2a: Home Ownership vs. KG Test ScoreO
wne
d a
Hom
e by
Age
27
20%
30%
40%
0 20 40 60 80 100
KG Test Score Percentile
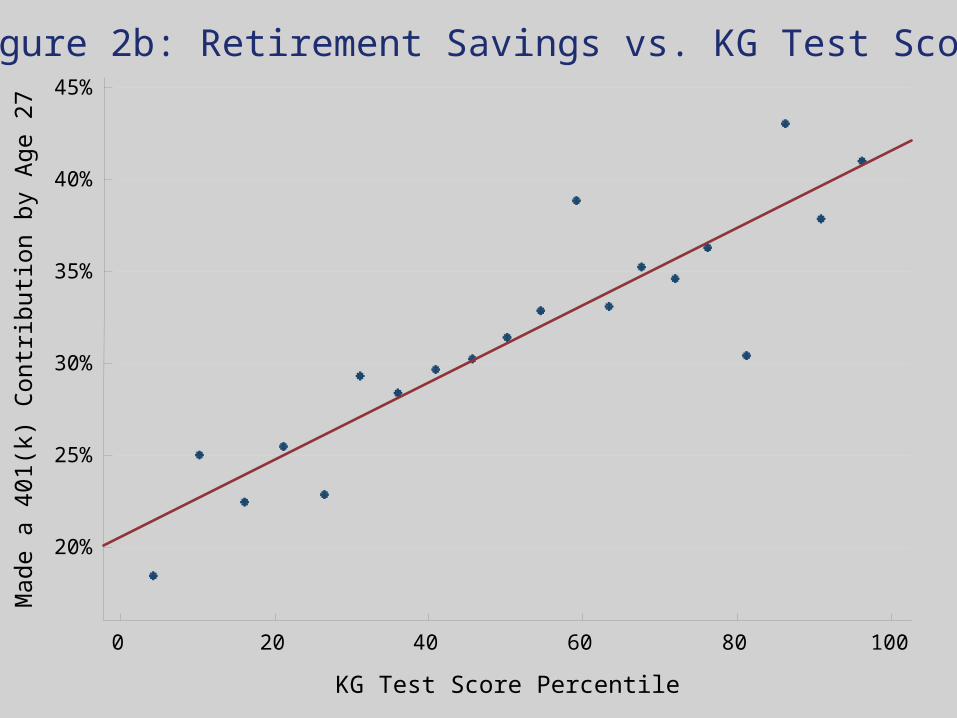
Figure 2b: Retirement Savings vs. KG Test Score
KG Test Score Percentile
20%
25%
30%
35%
40%
45%
0 20 40 60 80 100
Mad
e a
401(
k) C
ontr
ibuti
on b
y Ag
e 27
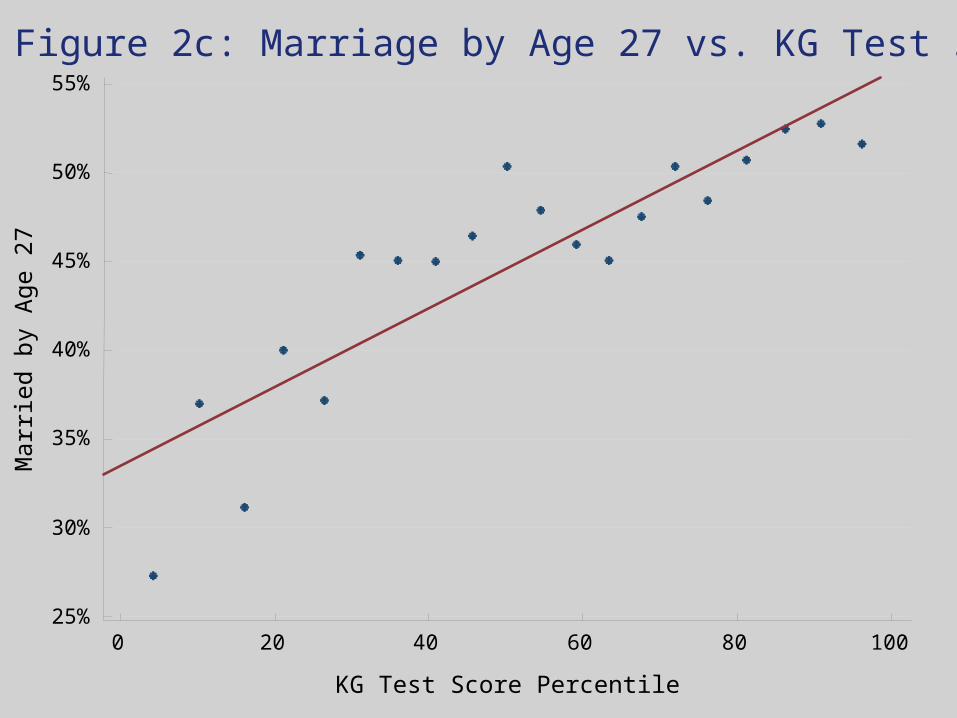
Figure 2c: Marriage by Age 27 vs. KG Test Score
KG Test Score Percentile
Mar
ried
by A
ge 2
7
25%
30%
35%
40%
45%
50%
55%
0 20 40 60 80 100
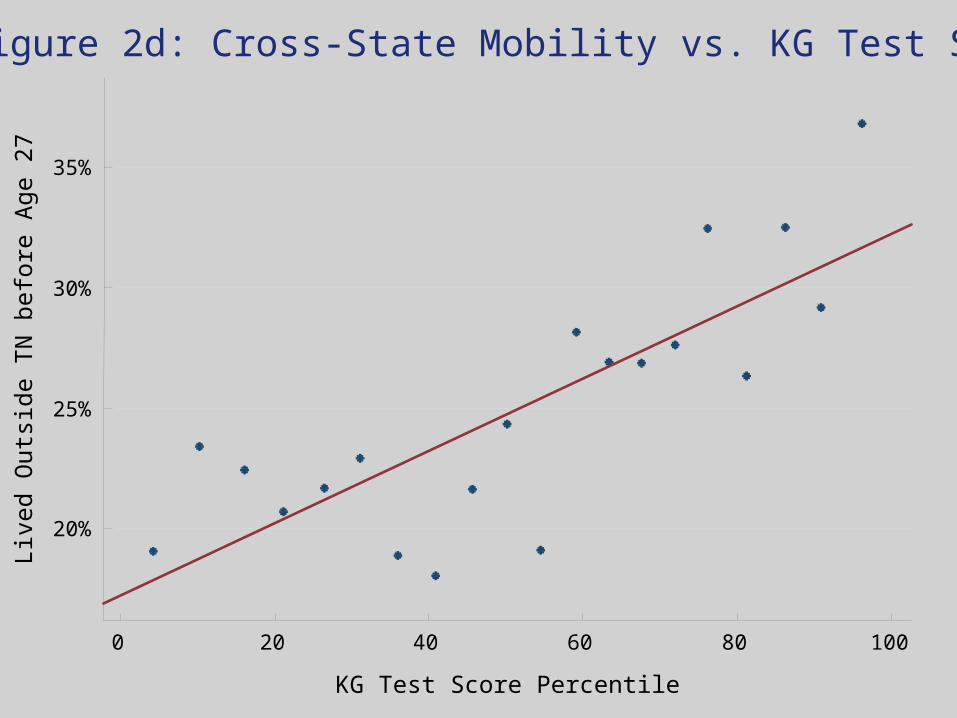
Figure 2d: Cross-State Mobility vs. KG Test Score
KG Test Score Percentile
20%
25%
30%
35%
0 20 40 60 80 100
Live
d O
utsi
de T
N b
efor
e Ag
e 27

Figure 2e: Percent College Grads in ZIP code vs. KG Test Score
KG Test Score Percentile
Perc
ent C
olle
ge G
radu
ates
in 2
008
ZIP
14%
16%
18%
20%
22%
0 20 40 60 80 100

• From now on, concentrate on 4 outcomes:
1. College attendance
2. College quality
3. Mean earnings (ages 25-27)
4. Summary index of other outcomes: Index = 401K + Home Owner + Married + Moved (Leave TN) + Pct. College
Grads. in Zip

Figure 2f: Summary Outcome Index vs. KG Test ScoreO
utco
me
Sum
mar
y In
dex
-.4
-.2
0
.2
.4
0 20 40 60 80 100
KG Test Score Percentile
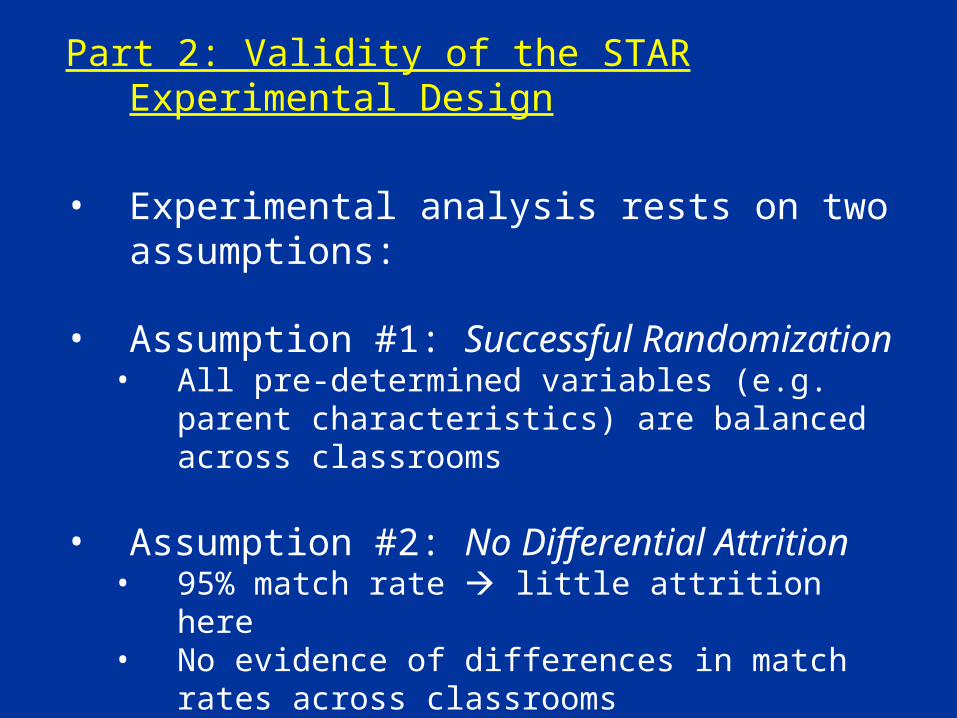
Part 2: Validity of the STAR Experimental Design
• Experimental analysis rests on two assumptions:
• Assumption #1: Successful Randomization• All pre-determined variables (e.g. parent characteristics)
are balanced across classrooms
• Assumption #2: No Differential Attrition• 95% match rate little attrition here• No evidence of differences in match rates across
classrooms• No evidence of differences in death rates across
classrooms

Part 2: Validity of the STAR Experimental Design
Threat #1: Failure of Randomization• We test for balance across class types with an expanded
set of parent/sibling characteristics in two ways:
1. Class size (type) intervention• Students were assigned to small vs. large class sizes• Do characteristics vary across small vs. large class
types?
2. Class room intervention• Students were assigned to specific classroom within
class size• Do characteristics vary across classrooms within
schools?

Table 2: Randomization TestsDependent Variable: Wage Earnings Small Class Teacher Exp. Class Effects
(%) (%) (%) p-value (1) (2) (3) (4)Parent’s Income 65.47 -0.003 -0.001 0.848 ($1,000s) (6.634) (0.015) (0.002)
[9.87] [-0.231] [-0.509]
Mother’s Age at STAR Birth 53.96 0.029 0.022 0.654(24.95) (0.076) (0.012)[2.162] [0.384] [1.863]
Parents Have 401(k) 2273 1.455 0.111 0.501(348.3) (1.063) (0.146)[6.526] [1.368] [0.761]
Student Female -2317 -0.226 0.236 0.502(425.0) (0.864) (0.111)[-5.451] [-0.261] [2.129]
Student Black -620.8 0.204 0.432 0.995(492.0) (1.449) (0.207)[-1.262] [0.141] [2.089]
p-Value of F Test 0.000 0.261 0.190
Observations 10,992 10,992 10,914Note: Regressions include school-by-entry-grade fixed effects.
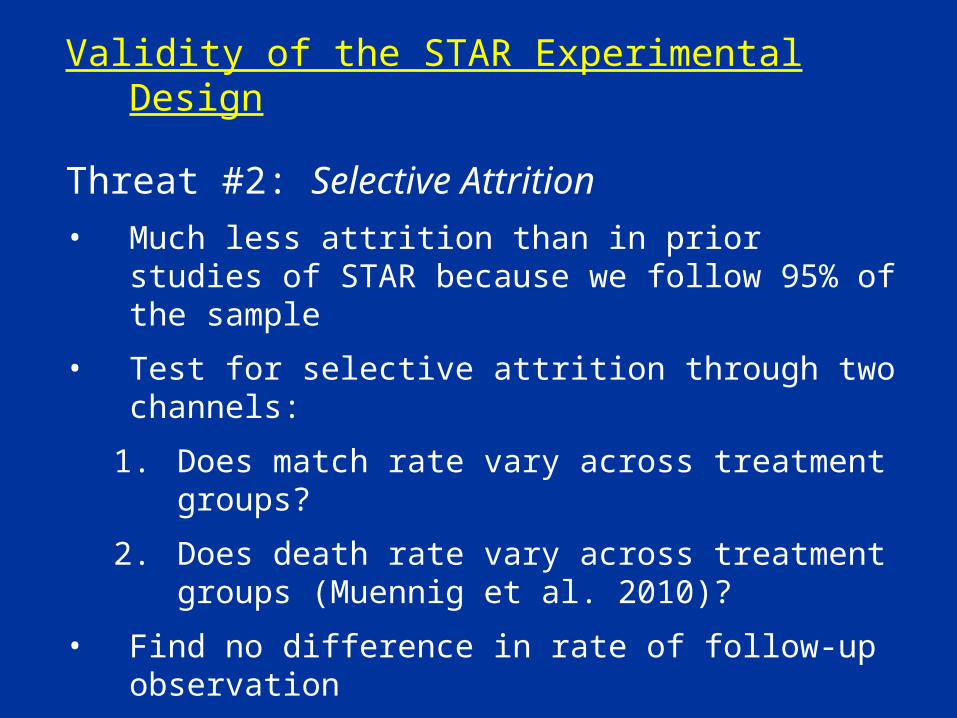
Validity of the STAR Experimental Design
Threat #2: Selective Attrition• Much less attrition than in prior studies of STAR because
we follow 95% of the sample
• Test for selective attrition through two channels:
1. Does match rate vary across treatment groups?
2. Does death rate vary across treatment groups (Muennig et al. 2010)?
• Find no difference in rate of follow-up observation

Table 3: Tests for Selective Attrition
Specification: Match Rates Death Rates
(%) (%) (%) (%)
(1) (2) (3) (4)
Difference -0.019 0.079 -0.010 -0.006(0.476) (0.418) (0.293) (0.293)
F-Test P-Value on Class F.E.'s 0.951 0.888 0.388 0.382
Controls x x
Mean of dep. Var. 95.0 95.0 1.70 1.70
Observations 11,571 11,571 10,992 10,992

Part 3: Class Size Impacts
• Replicate specifications in previous studies
• Independent variable: dummy for small class assignment (ITT)
• Focus on four outcomes:
1. College attendance in 2000
2. College quality index
3. Mean earnings (ages 25-27)
4. Standardized (SD = 1) summary index of other outcomes:
Index = 401K + Home Owner + Married + Moved (Leave TN) + Pct. College
Grads. in Zip

Figure 2a: Effect of Class Size on College Attendance by YearPe
rcen
t Att
endi
ng C
olle
ge
Year
10%
15%
20%
25%
30%
2000 2002 2004 2006
Large Class Small Class

Freq
uenc
yFigure 2b: College Earnings Quality by Class Size
Earnings-Based Index of College Quality$20K $30K $40K $50K $60K
Large Class Small Class
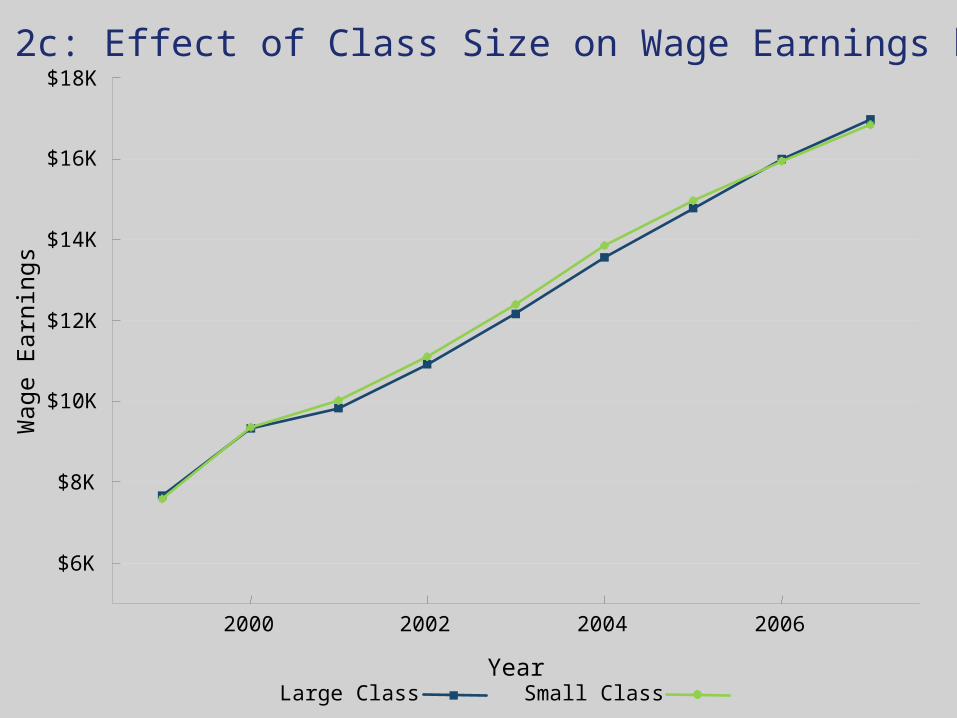
Figure 2c: Effect of Class Size on Wage Earnings by YearW
age
Earn
ings
$6K
$8K
$10K
$12K
$14K
$16K
$18K
2000 2002 2004 2006
YearLarge Class Small Class

Table 5: Impacts of Class Size on Adult Outcomes
Note: All specifications control for school-by-entry-wave effects, class size, and student and parent demographics, and standard errors are clustered on initial school.
Dependent College In 2000 College Quality Wage Earnings SummaryVariable: Index (1) (2) (3) (4)
Small Class 1.78% $109 -$124 4.61%(0.95%) ($92.6) ($336) (2.09%)
Observations 10,992 10,992 10,992 10,992
Mean of Dep. Var. 26.4% $27,115 $15,912 0.00

Part 3: Teacher/Peer EffectsStudents randomly assigned to classrooms that differ in teacher
and peer quality
For example, a school has two small classes• One small class taught by experienced teacher, one by
inexperienced teacher• By luck of draw, students assigned to one or other teacher• Can tease out impact of being assigned to more
experienced teacher• After accounting for class size
• Similarly, by luck of draw some classes have more/fewer• Girls• African American students• Students on free lunch

Do Teachers & Peers Affect Adult Outcomes?
First test: does random assignment to a more experienced KG teacher improve adult outcomes?
• Not necessarily causal effect of teacher experience per se
• Experienced teachers not only have more experience but may also be different along other dimensions like dedication to teaching

48
50
52
54
56
Kindergarten Teacher Experience (Years)
KG T
est S
core
Per
centi
leFigure 3a: Causal Effect of Teacher Experience on Test Scores
0 5 10 15 20

$16K
$17K
$18K
$19K
0 5 10 15 20
Mea
n W
age
Earn
ings
, 200
5-20
07Figure 3b: Causal Effect of Teacher Experience on Earnings
Kindergarten Teacher Experience (Years)

Teacher Experience <=10 Years Teacher Experience > 10 YearsYear
Wag
e Ea
rnin
gsFigure 3c: Effect of Teacher Experience on Earnings by Year
$8K
$10K
$12K
$14K
$16K
$18K
$20K
2000 2002 2004 2006
$1104

Table 6: Observable Teacher vs. Peer EffectsDependent Var.: Test Score Wage Earnings (1) (2) (3) (4)
Teacher with >10 Years 3.18% $1093Experience (1.26%) ($546)
Teacher has post-BA deg. -0.85% -$261(1.15%) ($449)
% Black Classmates -$1,757($2,692)
% Female Classmates -$67.5($1,539)
% Free-Lunch Classmates -$285($1,731)
Classmates’ Mean Age -$25.8($1,359)
Classmates’ Mean Pred. Score -$23.3($93.7)
Entry Grade KG KG All All
Observations 5,601 6,005 10,992 10,992
Note: All specifications control for school fixed effects and class size, as well as student and parent demographics.

Part 4: Unobserved Class Effects• Many elements of teacher and peer quality (e.g. clarity of
instruction, enthusiasm) not captured by observable measures
• Well known problem in literature on teacher effects
• Modern literature captures unobserved teacher characteristics using analysis of variance
• In other words, does across-class difference in outcomes vary by more than normal statistical variation?
• Other studies have estimated whether certain teachers usually have classes that show larger-than-average achievement gains
• Large differences across individual teachers

Part 4: Unobserved Class Effects• We do not observe the same teacher multiple times
• Only one cohort of students
• Cannot isolate “teacher effects”
• We can test for “classroom effects” on adult outcomes
• Is there significant intra-class correlation in student’s outcomes?
• Note that this “class effect” includes effect of teachers, peers, and any class-level shocks such as noise outside classroom (barking dog on test day)

A Statistical Model of Class Effects
• Test scores and earnings for individual i in class c in school n:
• zcn = class-level intervention (e.g. better teaching) that affects scores and earnings
• zYcn = intervention that affects earnings but not scores
• aicn = academic ability• nicn = earnings ability orthogonal to academic ability• = impacts of interventions on earnings• = covariance of class effects on scores and earnings
sicn dn zcn a icny icn n zcn zcnY a icn icn
#
#

A Statistical Model of Class Effects
• Test scores and earnings for individual i in class c in school n:
• Thus far, we have estimated directly by using observable z’s that affect test scores (e.g. teacher experience)
• How can we estimate when z is unobserved?
sicn dn zcn a icny icn n zcn zcnY a icn icn
#
#

Strategy 1: Analysis of Variance
• Test for class effects on earnings (β + γ > 0) using ANOVA
• Do earnings vary across classes by more than what would be predicted by random variation in student abilities?
• F-test for significance of class fixed effects
• Random effects estimate of class-level SD for outcomes

Note: All specifications control for school fixed effects and class size as well as student and parent demographics.
Table 7: F-Tests for Kindergarten Class EffectsDependent Var.: Grade
K ScoresGrade
8 ScoresWage Earnings
(1) (2) (3) (4) (5) (6)
P-value of F-Test on KG 0.000 0.419 0.047 0.026 0.020 0.042 Class Fixed Effects
SD of Class Effects 8.77% 0.000% $1,497 $1,520 $1,703 $1,454 (RE estimate)
Demographic Controls x x x x x
Large Classes Only x
Observable Class Chars. x
Observations 5,621 4,448 6,025 6,025 4,208 5,983

Measuring class quality: the intuition• We see that there is variation across classrooms from the same
schools in adult outcomes– Want to know: is it same classrooms that have higher test score gains that
produce higher earnings?
• Because of random assignment, class “pre-test” scores should on average be the same
• Difference in end of year scores across classrooms is measure of “class quality”– Includes teacher effects, peer effects, common shocks
• Each student’s class quality is the difference between classmates’ scores and schoolmates’ scores– How did classmates score, relative to the classmates you could have had?– Higher scores -> better class quality

Strategy 2: Covariance of Class Effects on Scores and Earnings
Two limitations of ANOVA:1. Does not tell us whether class effects on scores are
correlated with class effects on earnings (β > 0)• Do (unobserved) interventions that raise test scores
also improve adult outcomes?2. Inadequate power to implement ANOVA for grade 1-3
entrants (50% of sample)
Turn to a second strategy to measure covariance between class effects on scores and earnings (β)
• Class effect on scores zcn is unobserved proxy for it using peer test scores

Peer-Score Measure of Class Quality
• Average end-of-year test scores in class relative to school is a (noisy) measure of class effect on scores:
• Motivates regression of the form:
• “Own-observation” bias: in finite sample, bM > 0 even if bM• Smart kid raises average class score and has high earnings
Measure class quality using jackknife (leave-out mean) score:
• How good are your classmates’ scores, compared with the classmates you could have had?
scn scn sn zcn 1I j1
I ajcn 1IC
c1C
j1I ajcn
yicn n bM scn icn
scni scni sni

Peer-Score Measure of Class Quality
• Regression specification:
1. Class quality Δs-icn captures teacher quality + class-level shocks
• Good teachers raise peers’ end of year scores
2. Class quality Δs-icn varies randomly within schools
3. Two sources of bias in bLM:
a. Attenuation: Δs-icn is a noisy measure of class quality
b. Reflection: with peer effects, smart kid raises peers’ scores and earns a lot, driving up bLM
• After presenting results, we bound size of reflection bias and show it is smaller than attenuation bias

Figure 4a: Causal Effect of Early Childhood Class Quality on Own ScoreFi
rst O
bser
ved
Test
Sco
re P
erce
ntile
40
45
50
55
60
65
70
-20 -10 0 10 20
Class Quality (End-of-Year Peer Scores)

Figure 4c: Causal Effect of Early Childhood Class Quality on EarningsM
ean
Wag
e Ea
rnin
gs, 2
005-
2007
Class Quality (End-of-Year Peer Scores)
$14.5K
$15.0K
$15.5K
$16.0K
$16.5K
$17.0K
-20 -10 0 10 20

Figure 5a: Effect of Class Quality on Earnings by YearW
age
Earn
ings
$875
$8K
$10K
$12K
$14K
$16K
$18K
2000 2002 2004 2006Year
Below-Average Class Quality Above-Average Class Quality
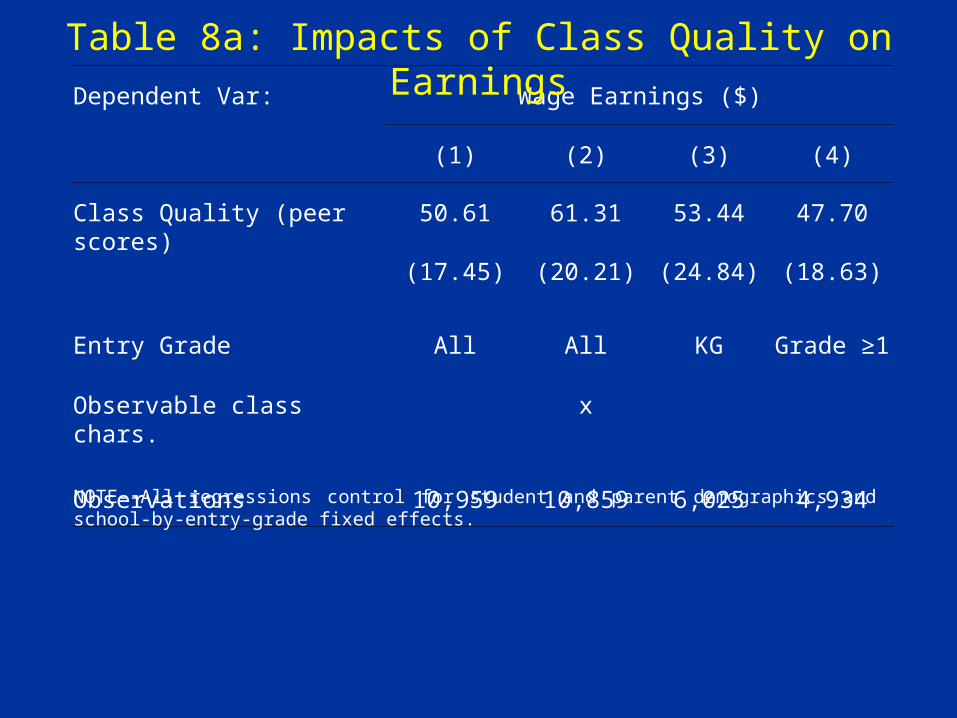
Dependent Var: Wage Earnings ($)
(1) (2) (3) (4)
Class Quality (peer scores) 50.61 61.31 53.44 47.70(17.45) (20.21) (24.84) (18.63)
Entry Grade All All KG Grade ≥1
Observable class chars. x
Observations 10,959 10,859 6,025 4,934
Table 8a: Impacts of Class Quality on Earnings
NOTE--All regressions control for student and parent demographics and school-by-entry-grade fixed effects.

Dependent Variable: College in 2000 College by Age 27
College Quality
Summary Index
(%) (%) ($) (%)
(1) (2) (3) (4)
Class Quality 0.096 0.108 9.328 0.250 (peer scores) (0.046) (0.053) (4.573) (0.098)
Observations 10,959 10,959 10,959 10,959
NOTE--All regressions control for student and parent demographics and school-by-entry-grade fixed effects.
Table 8b: Impacts of Class Quality on Other Adult Outcomes
Grade
Test
Sco
re P
erce
ntile
95% CI 1 SD Class Quality Effect on Test Scores
0
2
4
6
8
10
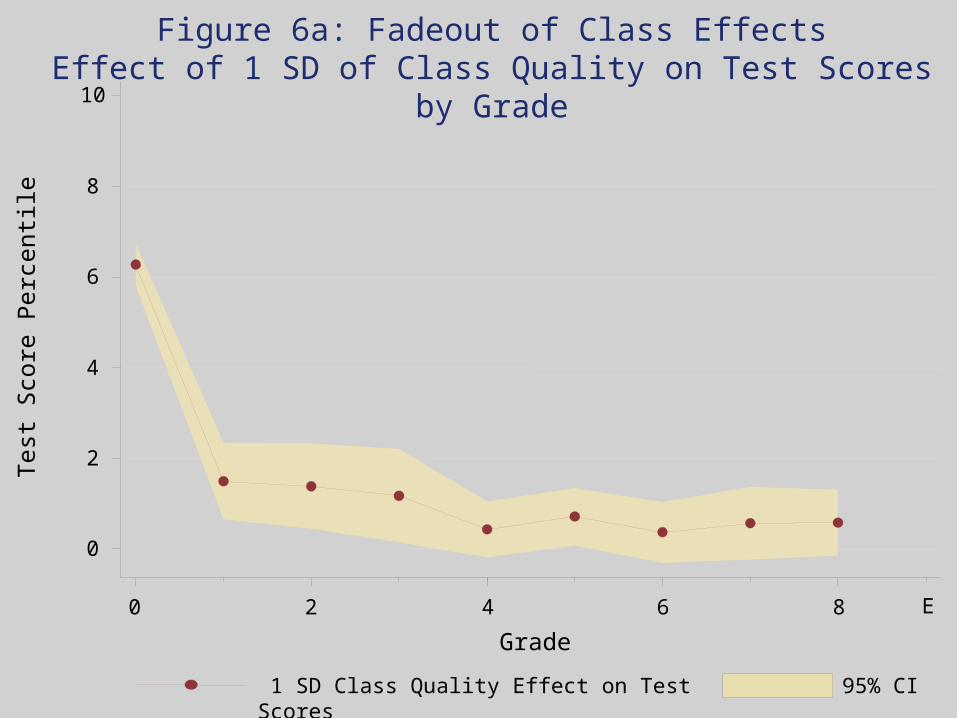
Figure 6a: Fadeout of Class EffectsEffect of 1 SD of Class Quality on Test Scores by Grade
0 2 4 6 8 E

Grade0 2 4 6 8
$0
$200
$400
$600
$800
$1000
95% CI 1 SD Class Quality Effect on Wage Earnings
E
Figure 6b: Fadeout of Class EffectsEffect of 1 SD of Class Quality on Earnings
Wag
e Ea
rnin
gs

Bounding Reflection Bias
• Small impact of KG class quality on subsequent test scores places a tight upper bound on reflection bias
• Smart kids score high on all tests (test scores highly autocorrelated)
• To have large reflection bias, smart kid must raise peer scores a lot
Large correlation between peer scores and own score in later grades
• We formalize this intuition in a linear-in-means model and derive a bound on the degree of reflection bias
• Observed correlation between KG peer scores and 8th grade score places an upper bound on reflection bias of 20%
• Variance in scores implies attenuation bias of 20% as well, implying preceding estimates are downward biased on net

Fade-out and Re-emergence: The Role of Non-Cognitive Skills
• Why do effects of kindergarten class fade out and re-emerge?
• One explanation: non-cognitive skills (Heckman 2000)• Really “social, behavioral & emotional skills”
• Data on non-cognitive measures (effort, initiative, disruption) collected for random subset of STAR students in 4th and 8th grade
• Convert mean non-cognitive score to percentile scale as above
Please consider the behavior of Jim Smith over the last 2-3 months. Circle the number that indicates how often the child exhibits the behavior.
#1. Acts restless, is often unable to sit still
#2. Annoys or interferes with peers’ work
Some-Never times Always 1 2 3 4 5 1 2 3 4 5

Mean Wage Earnings vs. Grade 4 Non-Cognitive Percentile
Grade 4 Non-Cognitive Percentile
Mea
n W
ages
Ear
ning
s, 2
005-
2007
$10K
$15K
$20K
$25K
0 20 40 60 80 100

Table 9: Wages Earnings, Class Quality and Non-Cognitive Skills
Grade 8 Grade 4 Scores Grade 8 Scores
Dependent Variable: Wage Earnings
Math+ Read
Math+ Read
Non-Cognitive
Math+ Read
Non-Cognitive
(1) (2) (3) (4) (5) (6)
Grade 4 Non-Cog. Score $87.7 0.059($20.4) (0.017)
Grade 4 Math + Reading $36.4 0.671 Score ($24.7) (0.023)
Class Quality (peer 0.047 0.153 0.064 0.128 scores) (0.035) (0.065) (0.041) (0.054)
Observations 1,360 1,254 4,023 1,671 4,448 1,780
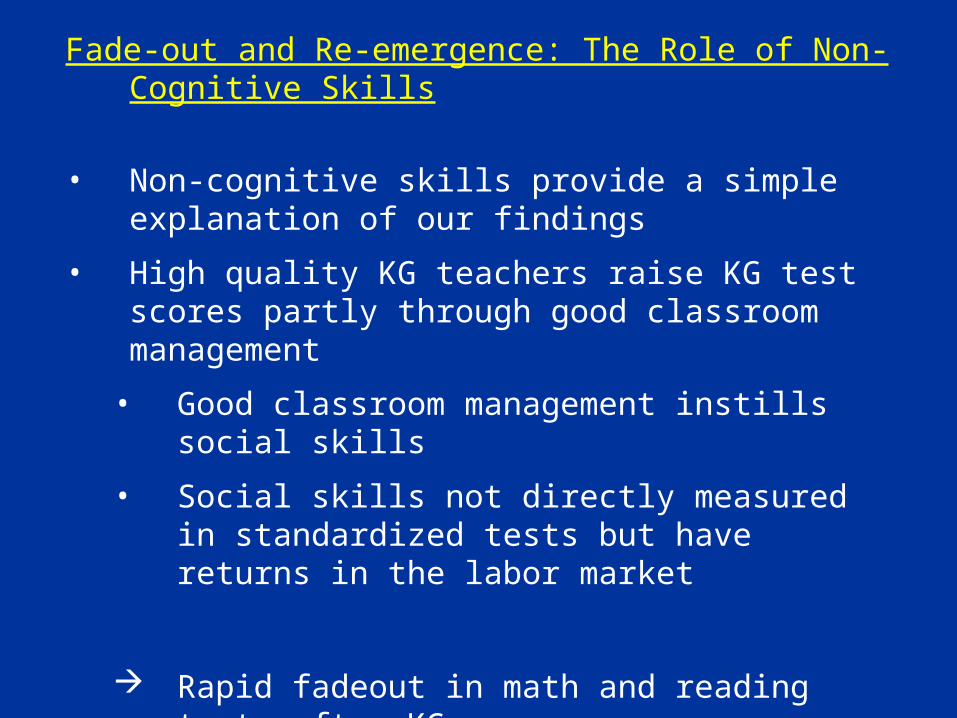
Fade-out and Re-emergence: The Role of Non-Cognitive Skills
• Non-cognitive skills provide a simple explanation of our findings
• High quality KG teachers raise KG test scores partly through good classroom management
• Good classroom management instills social skills
• Social skills not directly measured in standardized tests but have returns in the labor market
Rapid fadeout in math and reading tests after KG
But significant earnings gains from better KG class
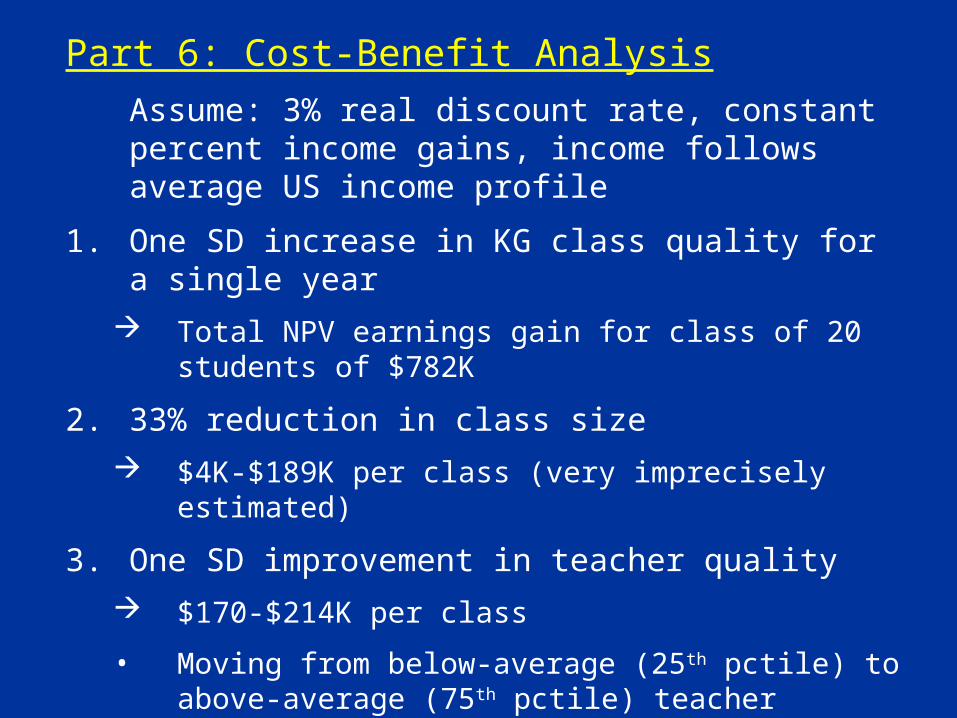
Part 6: Cost-Benefit AnalysisAssume: 3% real discount rate, constant percent income gains, income follows average US income profile
1. One SD increase in KG class quality for a single year Total NPV earnings gain for class of 20 students of $782K
2. 33% reduction in class size $4K-$189K per class (very imprecisely estimated)
3. One SD improvement in teacher quality $170-$214K per class
• Moving from below-average (25th pctile) to above-average (75th pctile) teacher generates NPV of $320K for a class of 20 students

Take Away Points• KG scores are highly correlated with adult outcomes (earnings,
homeownership, college attendance, retirement savings)
• Small classes improve a variety of adult outcomes– Outcomes of blacks, low-income generally improved more
• Students assigned to a more experienced teacher have higher adult earnings
• Higher kindergarten class quality improves a variety of adult outcomes– Even a single year of a high-quality class has long-term impact
• Class quality effects fade out on test scores, but persist on non-cognitive measures

More information on STAR
• http://www.heros-inc.org Bibliography public-use dataset
“How Does Your Kindergarten Class Affect Your Earnings? Evidence from Project STAR” by Raj Chetty, John Friedman, Nathaniel Hilger, Emmanuel Saez, Diane Schanzenbach, and Danny Yagan. NBER Working Paper #16381. Available at http://www.nber.org