Embed Size (px)
Citation preview
Page 1 of 20
The Letter Position Test
When readers see words, they need to identify the letters. They also need to know the positions of the letters in a word. For example, in the word ‘who’, ‘w’ is first, ‘h’ is in the middle, and ‘o’ is at the end. This contrasts with ‘how’, where ‘h’ is first, ‘o’ is in the middle, and ‘w’ comes last. The Letter Position Test assesses children’s ability to assign positions to letters. While this test can be used with all children, it is a particularly useful for screening children for ‘letter position dyslexia’ (LPD). Children with LPD have a specific problem assigning positions to letters. This problem causes ‘migration’ or ‘anagram’ errors in (1) reading aloud (e.g., reading slime as “smile”); (2) in same-different decisions (e.g., judging slime and smile to be the same); (3) deciding if a string of letters is a word or not (e.g., deciding that brid is a word); and (4) defining a written word (e.g., slime: “that’s like giggling without the sound”). This problem is said to be ‘specific’ because children with LPD often have normal reading for nonwords, regular and irregular words (please see page 4 for further readings on LPD). However, children who have poor word and/or nonword reading can also have difficulties with letter position coding, but we currently don’t know how poor letter position coding impacts on children’s literacy skills. The Letter Position Test consists of 60 migratable words, in which the letters can be rearranged to create a new word (e.g., ‘pirates’ can be read as ‘parties’). According to the Children’s Printed Word Database, 56 of these words should be known 5-9 year olds (Masterson, Stuart, Dixon & Lovejoy, 2010). The remaining four words are not in this database but are likely to be familiar to most children from Year 3/4 onwards. If you want to cite this test, please do as follows: Kohnen, S., Marinus, E., Friedmann, N., Anandakumar, T., Nickels, L., McArthur, G., & Castles, A. (2012). Letter Position Test. Available from www.motif.org.au.
Preparation
1. Print this pdf file. It is recommended that you use double-sided printing, especially for pages 5 – 6, which is the test items (Appendix 1). We recommend laminating the test items.
2. The LetPos Record Sheet (Appendix 2, pages 7 – 8 of this pdf) should look like this:
Front view: Back view:
3. Ensure you have the following materials: Testing Instructions Scoring Instructions Comparison Data Record Sheet Test Items Clipboard and Pencil Error Classification Table Audio recorder (to record child’s responses)

Page 2 of 20 The Letter Position Test: Kohnen, Marinus, Friedmann, Anandakumar, Nickels, McArthur, & Castels (2012) The Letter Position Test: Kohnen, Marinus, Friedmann, Anandakumar, Nickels, McArthur, & Castels (2012)
Testing Instructions
Attach the Record Sheet to a clipboard and seat yourself in a position where the child cannot see the Record Sheet (e.g., opposite the child). Then place the audio recorder on the desk in front of the child and start recording. Finally place the test item pages on the desk in front of the child. Say the following:
“I will show you some words. I would like you to try and read each word. There are two pages (show the two pages) with two rows of words on each. I want you to read this row (point to left column) first and then the other row (point to right column).”
“If you are ready you can start.”
Rather than recording and scoring each response online, put a mark near items that may be an error. This will allow you to check their response to these items closely during the post-test scoring. Important: If a child does not respond to an item within 5 seconds, prompt them to make a response. If they still do not respond then move on to next word.
Scoring Instructions
Replay the audiorecording of the test session and fill in the Record Sheet to reflect the child’s answers.
1. For each item, use the Error Classification Table (Appendix 3) below to score a child’s response as:
i. correct ii. migration error (M): e.g., reading diary as “dairy”; being as “begin”. iii. other word error (W): e.g., reading diary as “dear”; being as “beginning” iv. other error (O): e.g., nonword responses (reading diary as “dar”; being as “beng”), refusals.
2. Sum the total number of items for i, ii, iii, and iv and calculate the total sum of errors (ii + iii + iv).
3. Select the correct norms table for the child:
i. if the child has not been tested for their nonword or word reading test recently, or the child is known to have poor nonword or word reading, then use “all students norm data” (see Appendix 4).
ii. if the child has been tested for their nonword or word reading recently and is known to have reading in the average range then use “average readers norm data” (see Appendix 5).
iii. if the child has not progressed through a “typical” Australian school system (e.g., has moved from another country; has repeated a year at school; did not attend pre-school or kindergarten) then see Appendix 6.
4. In the norms table you will find the percentile scores and z scores.
i. Percentile scores tell you the percentage of children, who are in the same Grade (Year) as your child, who score below your child. For example, a percentile of 34 means that 34% of children in the same Grade score lower than your child. Percentiles between 16 and 84 are in the average range. Percentiles above 84 are in the above average range. Percentiles below 16 are in the below average range.
Page 3 of 20
ii. Z scores are standard scores that tell you how far the child scores away from the average score for children in the same Grade (Year). The average z score is 0. The further a score is above 0, the better that score is relative to the average level. The further a score is below 0, the poorer it is relative to average level. Z scores between -1.0 and 1.0 are in the average range. Z scores above 1.0 are in the above-average range. Z scores above 1.64 are in the well-above-average range. Z scores below -1.0 are in the below-average range. Z scores below -1.64 are in the well-below-average range.
5. Determining a child’s performance in terms of percentiles and z scores
i. Suppose a Year 3 student from NSW was tested. This student has completed Kindy, Year 1, Year 2 and is now in their 4th year at school. The child’s reading hasn’t been tested recently. So, the appropriate norms table would be in Appendix 4 (“all students norm data” Grade 3). The clinician wishes to look up percentiles for this child in order to find out if this child makes more errors on the Letter Position Test than his/her peers.
ii. The child made a total of 19 errors: 8 migration (M) errors, 8 word (W) errors and 3 other (O) errors, which were nonword responses.
iii. According to the norms, making 19 errors corresponds to a percentile rank of 32, that is, a performance within the average range (see section 5 above for a note on what is the normal range). 8 migration errors correspond to the 37th percentile, which is average for this age group. 8 word errors correspond to the 18th percentile, which is average for this age group. Three nonword errors correspond to the 26th percentile, which is within the average average for this age group. This child does not show poor letter position coding abilities.
6. Using sub-category scores to understand poor total scores:
i. A child’s ‘total error’ z score or percentile can be low for a number of different reasons. It is important to consider scores for the three sub-categories as well as the total score to determine why a child has a low total score. For example, the z score for ‘total errors’ may be low because the child made many errors of all kinds. Alternatively, the z score for ‘total errors’ may be low because the child made many errors of one particular type. ii. If a child has a specific difficulty with the ordering of letters, they will only have a low z score or percentile for migration errors; z scores and percentiles for ‘word errors’ and ‘other errors’ will be in the average range. ii. if your child has poor reading in general (i.e., not just for letter position coding) then they are very likely to have low z scores and percentiles in two or more error categories.
Comparison Data
In Terms 3 and 4 of 2010 this test was administered to children from two NSW schools in Years 3 – 6. The schools were chosen because their NAPLAN results indicated average performance of students on literacy measures. The data collected from these children were used to create two sets of norms for each year group. One set included all students in the year. This is called “all students norm data”. The other set included students whose reading of nonwords and words was in the average range on the Test of Word Reading Efficiency (TOWRE; Torgesen, Wagner, & Rashotte, 1999) using Australian normative data (Marinus et al., in prep). This is called the “average readers norm data”.

Page 4 of 20 The Letter Position Test: Kohnen, Marinus, Friedmann, Anandakumar, Nickels, McArthur, & Castels (2012) The Letter Position Test: Kohnen, Marinus, Friedmann, Anandakumar, Nickels, McArthur, & Castels (2012)
Further Readings
Case descriptions of children with a selective impairment in letter-position coding Friedmann & Rahamim (2007). Developmental letter position dyslexia. Journal of Neuropsychology, 1,
201–236. Friedmann & Haddad-Hanna (2012). Letter position dyslexia in Arabic: From form to position.
Behavioural Neurology, 25(3), 193-203. Kohnen, Nickels, Castles, Friedmann & McArthur (2013). When ‘slime’ becomes ‘smile’: Developmental
Letter Position Dyslexia in English. Neuropsychologia, 50(14), 3681-3692. Treatment directions for children with Letter Position Dyslexia Friedmann & Rahamim (2012). What can reduce letter migrations in letter position dyslexia? Journal of
Research in Reading. More on different subtypes of reading difficulties Jones, Castles & Kohnen (2011). Subtypes of developmental dyslexia: Recent developments and
directions for treatment. Acquiring Knowledge in Speech, Language and Hearing, 13(2), 79-83. TOWRE norms for Australian Children Marinus et al. (in preparation). Australian Norms for the TOWRE – Test of Word Reading Efficiency. The TOWRE reading test Torgesen, Wagner & Rashotte (1999). Test of Word Reading Efficiency. Austin, TX: ProEd.

Page 5 of 20
Appendix 1 Test Items
lost coats
bolt sneaks
there fits
filed wrap
beings braked
expect never
bread spared
bowls cutlery
tired flies
could tarp
barn signs
trial form
smile slate
fires quiet
parties diary

Page 6 of 20 The Letter Position Test: Kohnen, Marinus, Friedmann, Anandakumar, Nickels, McArthur, & Castels (2012) The Letter Position Test: Kohnen, Marinus, Friedmann, Anandakumar, Nickels, McArthur, & Castels (2012)
lots coast
blot snakes
three fist
field warp
begins barked
except nerve
beard spread
blows cruelty
tried files
cloud trap
bran sings
trail from
slime stale
fries quite
pirates dairy

Page 7 of 20
Appendix 2 Record Sheet
Letter Position Test
Materials Discontinuation Self-corrections Feedback Scoring Pencil, eraser, word list, audio recorder
No discontinuation rule. If no response, prompt after 5 seconds, if still no response move onto next word.
Score the last response a child makes. Once the child has moved to the next word, do not consider a response to a previous word.
No feedback, praise for following rules and good behaviour.
Audio record child’s responses. Do not score during test session. Just mark items with possible errors for post-test scoring.
Instructions: I will show you some words. I would like you to try and read each word. There are two pages (show the two pages) with two rows of words on each. I want you to read this row (point to left column) first and then the other row (point to right column).
Word Accuracy Response Error type 1. lost 2. bolt 3. there 4. filed 5. beings 6. expect 7. bread 8. bowls 9. tired 10. could 11. barn 12. trial 13. smile 14. fires 15. parties 16. coats 17. sneaks 18. fits 19. wrap 20. braked 21. never 22. spared 23. cutlery 24. flies 25. tarp 26. signs 27. form 28. slate 29. quiet 30. diary

Page 8 of 20 The Letter Position Test: Kohnen, Marinus, Friedmann, Anandakumar, Nickels, McArthur, & Castels (2012) The Letter Position Test: Kohnen, Marinus, Friedmann, Anandakumar, Nickels, McArthur, & Castels (2012)
Word Accuracy Response Error type 31. lots 32. blot 33. three 34. field 35. begins 36. except 37. beard 38. blows 39. tried 40. cloud 41. bran 42. trail 43. slime 44. fries 45. pirates 46. coast 47. snakes 48. fist 49. warp 50. barked 51. nerve 52. spread 53. cruelty 54. files 55. trap 56. sings 57. from 58. stale 59. quite 60. dairy %ile Z score
Sum correct: Sum errors Sum M Sum W Sum O
Comments: __________________________________________________________________________________________________________________________________________________________________________ _____________________________________________________________________________________

Page 9 of 20
Appendix 3 Error Classification Table
Item no
Target Item
Migration error
examples word errors
examples other errors
1 lost lots last, lot losts 2 bolt blot bolted, blots blost, bot 3 there three there’s, this, free, then thir 4 filed field filled, fred fie, feld, frand 5 beings begins beginnings bengs 6 expect except expecting, expert ext 7 bread beard breads, breed, brat drad 8 bowls blows bowl, blowing pells 9 tired tried tied, tyre, train ter
10 could cloud cold, cod coll 11 barn bran brain, bane bram 12 trial trail trill tring, drin 13 smile slime smiling, slim smy 14 fires fries freeze, fire, fry, fares fres 15 parties pirates parts bants, prattied 16 coats coast cots coll 17 sneaks snakes speaker, snake sneck 18 fits fist fit, feet filts 19 wrap warp wrapped, warps wap, wormp 20 braked barked bunk, brake bracked, bax 21 never nerve nerves, nevy 22 spared spread spy, spare spreep 23 cutlery cruelty cut, kylie, close, cutely cuttelee 24 flies files flees frigs 25 tarp trap tap, tram tarmp 26 signs sings sign, singing senga 27 form from for, fork froam 28 slate stale salt, slat, stall, still slape 29 quiet quite quietly, cubed, cue, quick, quit queet 30 diary dairy daily, drive, dry dray 31 lots lost let’s liss 32 blot bolt bit, blow boyst 33 three there where, threed 34 field filed fred, fled, file feeb 35 begins beings begs bings, 36 except expect exit exkep 37 beard bread buried, beer, breed beev 38 blows bowls blow, blowing, bow, bowl, blouse blewd 39 tried tired telling, tray tid 40 cloud could colder lud 41 bran barn brain, broom, ban, bar broo 42 trail trial try, trailer, till traif 43 slime smile smelling, seal, slim, smiling slimp 44 fries fires freeze, fry, friends frers 45 pirates parties pants, pie, pleased pirantes

Page 10 of 20 The Letter Position Test: Kohnen, Marinus, Friedmann, Anandakumar, Nickels, McArthur, & Castels (2012)
Item no
Target Item
Migration error
examples word errors
examples other errors
46 coast coats cold, coat coas 47 snakes sneaks snack, sneak sneegs 48 fist fits fest, fit, first, fists fint 49 warp wrap warm wharp, warmp, wirp, wap 50 barked braked bark, brake barky, barkit 51 nerve never nerves, nevers, neving, neev 52 spread spared speak, sped sprad 53 cruelty cutlery careful, cruel, cut crund, crepar 54 files flies fillers, felix, fills flim 55 trap tarp tip, tapping traip 56 sings signs sing, singings, swims sig 57 from form forms froam 58 stale slate stay, stall stell 59 quite quiet quick pretting 60 dairy diary day, dead, dear dirwee, dray
Page 11 of 20
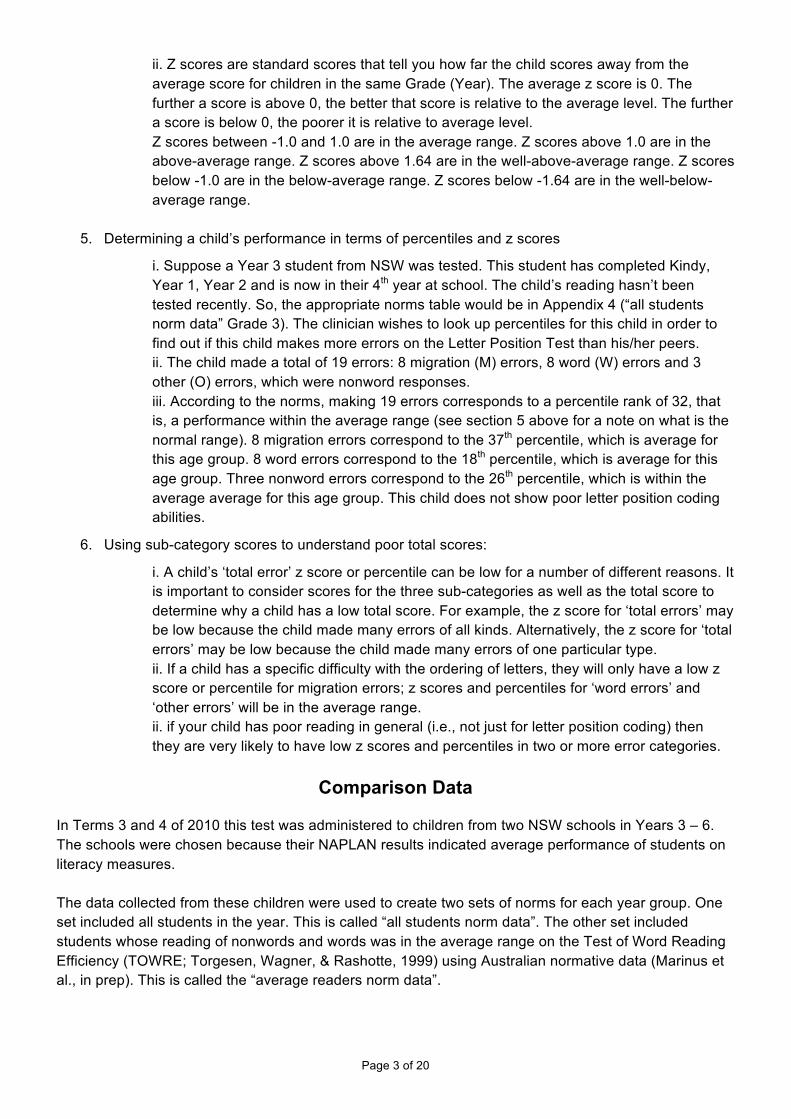
Appendix 4 Table 4a. Grade(Year)-‐based percentile ranks and normalised z-‐scores for Year 2 (all students)
Error$score Percentile z*score Percentile z*score Percentile z*score Percentile z*score0 100 >2.48 98 1.96 96 1.77 92 1.431 99 2.48 95 1.64 86 1.08 84 0.972 99 2.23 92 1.43 76 0.70 66 0.413 98 1.96 85 1.03 66 0.41 53 0.084 96 1.77 81 0.88 65 0.37 34 -0.415 95 1.64 72 0.59 60 0.24 28 -0.596 92 1.43 65 0.37 52 0.05 24 -0.707 89 1.21 61 0.27 44 -0.14 23 -0.758 87 1.14 51 0.02 39 -0.27 19 -0.889 84 0.97 43 -0.18 34 -0.41 18 -0.9310 77 0.75 38 -0.31 32 -0.48 15 -1.0311 76 0.70 30 -0.51 24 -0.70 11 -1.2112 75 0.67 28 -0.59 20 -0.83 9 -1.3513 71 0.55 20 -0.83 17 -0.97 6 -1.5314 70 0.54 9 -1.35 14 -1.08 6 -1.5815 70 0.53 8 -1.43 13 -1.14 5 -1.6416 70 0.51 6 -1.53 10 -1.28 5 -1.6817 63 0.34 5 -1.64 10 -1.31 4 -1.7218 61 0.27 3 -1.96 9 -1.35 4 -1.7719 58 0.21 1 -2.23 8 -1.43 3 -1.8320 54 0.11 1 -2.33 5 -1.64 3 -1.8921 47 -0.08 1 -2.46 4 -1.77 3 -1.9622 46 -0.11 <1 -2.65 3 -1.96 2 -2.0723 43 -0.18 <1 -3.09 2 -2.00 1 -2.2324 41 -0.24 <1 <-3.09 2 -2.03 1 -2.2825 39 -0.27 <1 <-3.09 2 -2.07 1 -2.3426 37 -0.34 <1 <-3.09 2 -2.12 1 -2.4227 34 -0.41 <1 <-3.09 2 -2.17 1 -2.5028 32 -0.48 <1 <-3.09 1 -2.23 <1 -2.6229 28 -0.59 <1 <-3.09 1 -2.27 <1 -2.7830 24 -0.70 <1 <-3.09 1 -2.33 <1 -3.0931 23 -0.75 <1 <-3.09 1 -2.39 <1 <-3.0932 20 -0.83 <1 <-3.09 1 -2.46 <1 <-3.0933 18 -0.93 <1 <-3.09 1 -2.54 <1 <-3.0934 14 -1.08 <1 <-3.09 <1 -2.65 <1 <-3.0935 13 -1.14 <1 <-3.09 <1 -2.81 <1 <-3.0936 11 -1.21 <1 <-3.09 <1 -3.09 <1 <-3.0937 10 -1.27 <1 <-3.09 <1 <-3.09 <1 <-3.0938 9 -1.35 <1 <-3.09 <1 <-3.09 <1 <-3.0939 8 -1.43 <1 <-3.09 <1 <-3.09 <1 <-3.0940 7 -1.46 <1 <-3.09 <1 <-3.09 <1 <-3.0941 7 -1.50 <1 <-3.09 <1 <-3.09 <1 <-3.0942 6 -1.53 <1 <-3.09 <1 <-3.09 <1 <-3.0943 6 -1.58 <1 <-3.09 <1 <-3.09 <1 <-3.0944 5 -1.64 <1 <-3.09 <1 <-3.09 <1 <-3.0945 4 -1.72 <1 <-3.09 <1 <-3.09 <1 <-3.0946 3 -1.83 <1 <-3.09 <1 <-3.09 <1 <-3.0947 3 -1.96 <1 <-3.09 <1 <-3.09 <1 <-3.0948 1 -2.23 <1 <-3.09 <1 <-3.09 <1 <-3.0949 1 -2.46 <1 <-3.09 <1 <-3.09 <1 <-3.0950 <1 -3.09 <1 <-3.09 <1 <-3.09 <1 <-3.0951 <1 <-3.09 <1 <-3.09 <1 <-3.09 <1 <-3.0952 <1 <-3.09 <1 <-3.09 <1 <-3.09 <1 <-3.0953 <1 <-3.09 <1 <-3.09 <1 <-3.09 <1 <-3.0954 <1 <-3.09 <1 <-3.09 <1 <-3.09 <1 <-3.0955 <1 <-3.09 <1 <-3.09 <1 <-3.09 <1 <-3.0956 <1 <-3.09 <1 <-3.09 <1 <-3.09 <1 <-3.0957 <1 <-3.09 <1 <-3.09 <1 <-3.09 <1 <-3.0958 <1 <-3.09 <1 <-3.09 <1 <-3.09 <1 <-3.0959 <1 <-3.09 <1 <-3.09 <1 <-3.09 <1 <-3.0960 <1 <-3.09 <1 <-3.09 <1 <-3.09 <1 <-3.09
NO1subjects 79 79 79 79Mean 22.34 8.94 8.08 5.33SD 11.8 4.86 6.84 5.58
Total Migration Word Other

Page 12 of 20 The Letter Position Test: Kohnen, Marinus, Friedmann, Anandakumar, Nickels, McArthur, & Castels (2012)
Table 4b. Grade(Year)-‐based percentile ranks and normalised z-‐scores for Year 3 (all students)
Error$score Percentile z*score Percentile z*score Percentile z*score Percentile z*score0 100 >1.59 94 1.59 89 1.22 86 1.061 94 1.59 91 1.35 72 0.59 54 0.112 94 1.54 82 0.92 57 0.17 39 -0.283 93 1.50 72 0.59 50 0.00 26 -0.664 86 1.06 67 0.43 39 -0.28 19 -0.885 80 0.84 54 0.11 34 -0.40 14 -1.066 76 0.69 47 -0.08 32 -0.46 12 -1.177 69 0.49 44 -0.14 27 -0.62 9 -1.358 64 0.37 37 -0.34 18 -0.92 6 -1.599 58 0.20 31 -0.49 16 -1.01 4 -1.7110 54 0.11 23 -0.73 14 -1.06 3 -1.8411 52 0.06 13 -1.11 12 -1.17 3 -1.9212 48 -0.06 9 -1.35 11 -1.22 2 -2.0113 44 -0.14 4 -1.71 10 -1.28 <1 -3.0914 41 -0.22 2 -2.01 9 -1.31 <1 <-3.0915 38 -0.31 1 -2.29 9 -1.35 <1 <-3.0916 37 -0.34 1 -2.42 8 -1.38 <1 <-3.0917 36 -0.37 <1 -2.62 8 -1.42 <1 <-3.0918 34 -0.40 <1 -3.09 7 -1.46 <1 <-3.0919 32 -0.46 <1 <-3.09 7 -1.50 <1 <-3.0920 29 -0.56 <1 <-3.09 6 -1.54 <1 <-3.0921 23 -0.73 <1 <-3.09 6 -1.59 <1 <-3.0922 21 -0.80 <1 <-3.09 3 -1.84 <1 <-3.0923 20 -0.84 <1 <-3.09 3 -1.92 <1 <-3.0924 18 -0.92 <1 <-3.09 2 -2.01 <1 <-3.0925 16 -1.01 <1 <-3.09 2 -2.13 <1 <-3.0926 13 -1.11 <1 <-3.09 1 -2.29 <1 <-3.0927 13 -1.14 <1 <-3.09 1 -2.35 <1 <-3.0928 12 -1.17 <1 <-3.09 1 -2.42 <1 <-3.0929 12 -1.19 <1 <-3.09 1 -2.51 <1 <-3.0930 11 -1.22 <1 <-3.09 <1 -2.62 <1 <-3.0931 11 -1.25 <1 <-3.09 <1 -2.79 <1 <-3.0932 10 -1.28 <1 <-3.09 <1 -3.09 <1 <-3.0933 9 -1.31 <1 <-3.09 <1 <-3.09 <1 <-3.0934 9 -1.35 <1 <-3.09 <1 <-3.09 <1 <-3.0935 8 -1.38 <1 <-3.09 <1 <-3.09 <1 <-3.0936 8 -1.42 <1 <-3.09 <1 <-3.09 <1 <-3.0937 7 -1.46 <1 <-3.09 <1 <-3.09 <1 <-3.0938 7 -1.50 <1 <-3.09 <1 <-3.09 <1 <-3.0939 6 -1.59 <1 <-3.09 <1 <-3.09 <1 <-3.0940 3 -1.84 <1 <-3.09 <1 <-3.09 <1 <-3.0941 3 -1.88 <1 <-3.09 <1 <-3.09 <1 <-3.0942 3 -1.92 <1 <-3.09 <1 <-3.09 <1 <-3.0943 2 -1.96 <1 <-3.09 <1 <-3.09 <1 <-3.0944 2 -2.01 <1 <-3.09 <1 <-3.09 <1 <-3.0945 1 -2.29 <1 <-3.09 <1 <-3.09 <1 <-3.0946 1 -2.35 <1 <-3.09 <1 <-3.09 <1 <-3.0947 1 -2.42 <1 <-3.09 <1 <-3.09 <1 <-3.0948 1 -2.51 <1 <-3.09 <1 <-3.09 <1 <-3.0949 <1 -2.62 <1 <-3.09 <1 <-3.09 <1 <-3.0950 <1 -2.79 <1 <-3.09 <1 <-3.09 <1 <-3.0951 <1 -3.09 <1 <-3.09 <1 <-3.09 <1 <-3.0952 <1 <-3.09 <1 <-3.09 <1 <-3.09 <1 <-3.0953 <1 <-3.09 <1 <-3.09 <1 <-3.09 <1 <-3.0954 <1 <-3.09 <1 <-3.09 <1 <-3.09 <1 <-3.0955 <1 <-3.09 <1 <-3.09 <1 <-3.09 <1 <-3.0956 <1 <-3.09 <1 <-3.09 <1 <-3.09 <1 <-3.0957 <1 <-3.09 <1 <-3.09 <1 <-3.09 <1 <-3.0958 <1 <-3.09 <1 <-3.09 <1 <-3.09 <1 <-3.0959 <1 <-3.09 <1 <-3.09 <1 <-3.09 <1 <-3.0960 <1 <-3.09 <1 <-3.09 <1 <-3.09 <1 <-3.09
NO1subjects 90 90 90 90Mean 15.23 6.76 5.7 2.78SD 11.54 4.17 6.68 2.94
Total Migration Word Other

Page 13 of 20
Table 4c. Grade(Year)-‐based percentile ranks and normalised z-‐scores for Year 4 (all students)
Error$score Percentile z*score Percentile z*score Percentile z*score Percentile z*score0 94 1.53 90 1.26 78 0.78 60 0.261 89 1.20 78 0.78 57 0.18 40 ,0.262 81 0.89 69 0.49 42 ,0.21 25 ,0.673 76 0.71 60 0.26 30 ,0.52 14 ,1.104 72 0.58 51 0.03 22 ,0.78 9 ,1.325 66 0.40 42 ,0.21 17 ,0.97 5 ,1.636 59 0.24 33 ,0.43 10 ,1.26 3 ,1.877 51 0.03 28 ,0.58 8 ,1.39 3 ,1.948 45 ,0.13 25 ,0.67 7 ,1.45 2 ,2.039 38 ,0.32 22 ,0.78 6 ,1.54 1 ,2.3310 36 ,0.35 15 ,1.05 5 ,1.63 1 ,2.4011 35 ,0.37 13 ,1.15 3 ,1.87 1 ,2.4912 31 ,0.49 9 ,1.32 3 ,1.89 <1 ,2.6013 30 ,0.52 6 ,1.54 3 ,1.91 <1 ,2.7714 29 ,0.55 4 ,1.73 3 ,1.93 <1 ,3.0915 25 ,0.67 3 ,1.87 3 ,1.96 <1 <,3.0916 23 ,0.74 1 ,2.33 2 ,1.98 <1 <,3.0917 21 ,0.81 <1 ,3.09 2 ,2.01 <1 <,3.0918 19 ,0.89 <1 <,3.09 2 ,2.03 <1 <,3.0919 17 ,0.97 <1 <,3.09 1 ,2.33 <1 <,3.0920 15 ,1.03 <1 <,3.09 1 ,2.39 <1 <,3.0921 14 ,1.10 <1 <,3.09 1 ,2.46 <1 <,3.0922 12 ,1.20 <1 <,3.09 1 ,2.54 <1 <,3.0923 8 ,1.39 <1 <,3.09 <1 ,2.65 <1 <,3.0924 7 ,1.45 <1 <,3.09 <1 ,2.81 <1 <,3.0925 6 ,1.54 <1 <,3.09 <1 ,3.09 <1 <,3.0926 5 ,1.63 <1 <,3.09 <1 <,3.09 <1 <,3.0927 3 ,1.87 <1 <,3.09 <1 <,3.09 <1 <,3.0928 3 ,1.94 <1 <,3.09 <1 <,3.09 <1 <,3.0929 2 ,2.03 <1 <,3.09 <1 <,3.09 <1 <,3.0930 2 ,2.08 <1 <,3.09 <1 <,3.09 <1 <,3.0931 2 ,2.13 <1 <,3.09 <1 <,3.09 <1 <,3.0932 1 ,2.19 <1 <,3.09 <1 <,3.09 <1 <,3.0933 1 ,2.25 <1 <,3.09 <1 <,3.09 <1 <,3.0934 1 ,2.33 <1 <,3.09 <1 <,3.09 <1 <,3.0935 1 ,2.39 <1 <,3.09 <1 <,3.09 <1 <,3.0936 1 ,2.46 <1 <,3.09 <1 <,3.09 <1 <,3.0937 1 ,2.54 <1 <,3.09 <1 <,3.09 <1 <,3.0938 <1 ,2.65 <1 <,3.09 <1 <,3.09 <1 <,3.0939 <1 ,2.81 <1 <,3.09 <1 <,3.09 <1 <,3.0940 <1 ,3.09 <1 <,3.09 <1 <,3.09 <1 <,3.0941 <1 <,3.09 <1 <,3.09 <1 <,3.09 <1 <,3.0942 <1 <,3.09 <1 <,3.09 <1 <,3.09 <1 <,3.0943 <1 <,3.09 <1 <,3.09 <1 <,3.09 <1 <,3.0944 <1 <,3.09 <1 <,3.09 <1 <,3.09 <1 <,3.0945 <1 <,3.09 <1 <,3.09 <1 <,3.09 <1 <,3.0946 <1 <,3.09 <1 <,3.09 <1 <,3.09 <1 <,3.0947 <1 <,3.09 <1 <,3.09 <1 <,3.09 <1 <,3.0948 <1 <,3.09 <1 <,3.09 <1 <,3.09 <1 <,3.0949 <1 <,3.09 <1 <,3.09 <1 <,3.09 <1 <,3.0950 <1 <,3.09 <1 <,3.09 <1 <,3.09 <1 <,3.0951 <1 <,3.09 <1 <,3.09 <1 <,3.09 <1 <,3.0952 <1 <,3.09 <1 <,3.09 <1 <,3.09 <1 <,3.0953 <1 <,3.09 <1 <,3.09 <1 <,3.09 <1 <,3.0954 <1 <,3.09 <1 <,3.09 <1 <,3.09 <1 <,3.0955 <1 <,3.09 <1 <,3.09 <1 <,3.09 <1 <,3.0956 <1 <,3.09 <1 <,3.09 <1 <,3.09 <1 <,3.0957 <1 <,3.09 <1 <,3.09 <1 <,3.09 <1 <,3.0958 <1 <,3.09 <1 <,3.09 <1 <,3.09 <1 <,3.0959 <1 <,3.09 <1 <,3.09 <1 <,3.09 <1 <,3.0960 <1 <,3.09 <1 <,3.09 <1 <,3.09 <1 <,3.09
NO0subjects 96 96 96 96Mean 10.29 5.49 3.14 1.67SD 8.61 4.43 4.1 2.26
Total Migration Word Other

Page 14 of 20 The Letter Position Test: Kohnen, Marinus, Friedmann, Anandakumar, Nickels, McArthur, & Castels (2012)
Table 4d. Grade(Year)-‐based percentile ranks and normalised z-‐scores for Year 5 (all students)
Error$score Percentile z*score Percentile z*score Percentile z*score Percentile z*score0 96 1.70 87 1.13 78 0.77 52 0.061 85 1.03 71 0.54 53 0.08 27 ,0.602 76 0.70 59 0.23 36 ,0.37 17 ,0.973 69 0.49 49 ,0.02 27 ,0.60 9 ,1.334 61 0.27 39 ,0.27 23 ,0.75 7 ,1.495 54 0.10 36 ,0.37 17 ,0.94 5 ,1.626 46 ,0.11 27 ,0.63 16 ,1.00 3 ,1.887 40 ,0.25 21 ,0.80 14 ,1.06 2 ,2.008 34 ,0.41 18 ,0.91 10 ,1.29 2 ,2.179 31 ,0.49 14 ,1.06 8 ,1.39 1 ,2.4110 28 ,0.58 11 ,1.21 6 ,1.55 1 ,2.4811 27 ,0.60 9 ,1.33 5 ,1.70 1 ,2.5612 26 ,0.65 4 ,1.77 4 ,1.77 <1 ,2.6713 24 ,0.72 3 ,1.87 3 ,1.83 <1 ,2.8214 22 ,0.77 2 ,2.00 3 ,1.88 <1 ,3.0915 20 ,0.85 2 ,2.17 3 ,1.91 <1 <,3.0916 17 ,0.94 1 ,2.27 3 ,1.93 <1 <,3.0917 16 ,1.00 1 ,2.41 2 ,1.96 <1 <,3.0918 15 ,1.03 <1 ,2.61 2 ,2.00 <1 <,3.0919 14 ,1.06 <1 ,3.09 2 ,2.03 <1 <,3.0920 11 ,1.21 <1 <,3.09 2 ,2.07 <1 <,3.0921 11 ,1.25 <1 <,3.09 2 ,2.12 <1 <,3.0922 10 ,1.26 <1 <,3.09 2 ,2.17 <1 <,3.0923 10 ,1.28 <1 <,3.09 1 ,2.21 <1 <,3.0924 10 ,1.29 <1 <,3.09 1 ,2.25 <1 <,3.0925 8 ,1.43 <1 <,3.09 1 ,2.30 <1 <,3.0926 7 ,1.49 <1 <,3.09 1 ,2.35 <1 <,3.0927 5 ,1.62 <1 <,3.09 1 ,2.41 <1 <,3.0928 5 ,1.70 <1 <,3.09 1 ,2.48 <1 <,3.0929 4 ,1.73 <1 <,3.09 1 ,2.56 <1 <,3.0930 4 ,1.77 <1 <,3.09 <1 ,2.67 <1 <,3.0931 3 ,1.88 <1 <,3.09 <1 ,2.82 <1 <,3.0932 3 ,1.89 <1 <,3.09 <1 ,3.09 <1 <,3.0933 3 ,1.91 <1 <,3.09 <1 <,3.09 <1 <,3.0934 3 ,1.92 <1 <,3.09 <1 <,3.09 <1 <,3.0935 3 ,1.93 <1 <,3.09 <1 <,3.09 <1 <,3.0936 3 ,1.95 <1 <,3.09 <1 <,3.09 <1 <,3.0937 2 ,1.96 <1 <,3.09 <1 <,3.09 <1 <,3.0938 2 ,1.98 <1 <,3.09 <1 <,3.09 <1 <,3.0939 2 ,2.00 <1 <,3.09 <1 <,3.09 <1 <,3.0940 2 ,2.17 <1 <,3.09 <1 <,3.09 <1 <,3.0941 1 ,2.27 <1 <,3.09 <1 <,3.09 <1 <,3.0942 1 ,2.41 <1 <,3.09 <1 <,3.09 <1 <,3.0943 <1 ,2.61 <1 <,3.09 <1 <,3.09 <1 <,3.0944 <1 ,3.09 <1 <,3.09 <1 <,3.09 <1 <,3.0945 <1 <,3.09 <1 <,3.09 <1 <,3.09 <1 <,3.0946 <1 <,3.09 <1 <,3.09 <1 <,3.09 <1 <,3.0947 <1 <,3.09 <1 <,3.09 <1 <,3.09 <1 <,3.0948 <1 <,3.09 <1 <,3.09 <1 <,3.09 <1 <,3.0949 <1 <,3.09 <1 <,3.09 <1 <,3.09 <1 <,3.0950 <1 <,3.09 <1 <,3.09 <1 <,3.09 <1 <,3.0951 <1 <,3.09 <1 <,3.09 <1 <,3.09 <1 <,3.0952 <1 <,3.09 <1 <,3.09 <1 <,3.09 <1 <,3.0953 <1 <,3.09 <1 <,3.09 <1 <,3.09 <1 <,3.0954 <1 <,3.09 <1 <,3.09 <1 <,3.09 <1 <,3.0955 <1 <,3.09 <1 <,3.09 <1 <,3.09 <1 <,3.0956 <1 <,3.09 <1 <,3.09 <1 <,3.09 <1 <,3.0957 <1 <,3.09 <1 <,3.09 <1 <,3.09 <1 <,3.0958 <1 <,3.09 <1 <,3.09 <1 <,3.09 <1 <,3.0959 <1 <,3.09 <1 <,3.09 <1 <,3.09 <1 <,3.0960 <1 <,3.09 <1 <,3.09 <1 <,3.09 <1 <,3.09
NO0subjects 132 132 132 132Mean 9.18 4.56 3.33 1.29SD 9.41 4.15 4.93 2.09
Total Migration Word Other

Page 15 of 20
Table 4e. Grade(Year)-‐based percentile ranks and normalised z-‐scores for Year 6 (all students)
Error$score Percentile z*score Percentile z*score Percentile z*score Percentile z*score0 93 1.45 85 1.05 80 0.82 43 *0.171 83 0.95 72 0.59 43 *0.17 23 *0.742 72 0.59 52 0.04 30 *0.52 10 *1.293 64 0.36 40 *0.25 19 *0.88 5 *1.654 57 0.17 30 *0.54 13 *1.12 3 *1.965 45 *0.12 25 *0.66 7 *1.45 2 *2.016 39 *0.27 22 *0.77 7 *1.51 2 *2.077 34 *0.42 16 *1.01 6 *1.58 2 *2.138 28 *0.59 13 *1.12 5 *1.65 1 *2.219 25 *0.69 12 *1.16 3 *1.84 1 *2.3010 24 *0.71 9 *1.34 3 *1.88 1 *2.4111 21 *0.80 7 *1.48 3 *1.92 1 *2.4512 17 *0.95 5 *1.65 3 *1.96 1 *2.5013 15 *1.05 4 *1.71 2 *1.98 1 *2.5514 13 *1.12 4 *1.77 2 *2.01 <1 *2.6115 12 *1.20 3 *1.84 2 *2.03 <1 *2.6916 11 *1.24 3 *1.90 2 *2.06 <1 *2.7817 10 *1.27 3 *1.96 2 *2.08 <1 *2.9018 10 *1.31 2 *2.13 2 *2.11 <1 *3.0919 9 *1.34 1 *2.41 2 *2.14 <1 <*3.0920 7 *1.45 <1 *2.61 1 *2.19 <1 <*3.0921 7 *1.48 <1 *3.09 1 *2.23 <1 <*3.0922 7 *1.51 <1 <*3.09 1 *2.28 <1 <*3.0923 5 *1.65 <1 <*3.09 1 *2.34 <1 <*3.0924 4 *1.79 <1 <*3.09 1 *2.41 <1 <*3.0925 4 *1.74 <1 <*3.09 <1 *2.61 <1 <*3.0926 4 *1.77 <1 <*3.09 <1 *3.09 <1 <*3.0927 4 *1.80 <1 <*3.09 <1 <*3.09 <1 <*3.0928 3 *1.84 <1 <*3.09 <1 <*3.09 <1 <*3.0929 3 *1.86 <1 <*3.09 <1 <*3.09 <1 <*3.0930 3 *1.88 <1 <*3.09 <1 <*3.09 <1 <*3.0931 3 *1.91 <1 <*3.09 <1 <*3.09 <1 <*3.0932 3 *1.93 <1 <*3.09 <1 <*3.09 <1 <*3.0933 3 *1.96 <1 <*3.09 <1 <*3.09 <1 <*3.0934 2 *2.01 <1 <*3.09 <1 <*3.09 <1 <*3.0935 2 *2.07 <1 <*3.09 <1 <*3.09 <1 <*3.0936 2 *2.14 <1 <*3.09 <1 <*3.09 <1 <*3.0937 1 *2.26 <1 <*3.09 <1 <*3.09 <1 <*3.0938 1 *2.41 <1 <*3.09 <1 <*3.09 <1 <*3.0939 1 *2.43 <1 <*3.09 <1 <*3.09 <1 <*3.0940 1 *2.46 <1 <*3.09 <1 <*3.09 <1 <*3.0941 1 *2.49 <1 <*3.09 <1 <*3.09 <1 <*3.0942 1 *2.52 <1 <*3.09 <1 <*3.09 <1 <*3.0943 1 *2.56 <1 <*3.09 <1 <*3.09 <1 <*3.0944 <1 *2.59 <1 <*3.09 <1 <*3.09 <1 <*3.0945 <1 *2.63 <1 <*3.09 <1 <*3.09 <1 <*3.0946 <1 *2.68 <1 <*3.09 <1 <*3.09 <1 <*3.0947 <1 *2.73 <1 <*3.09 <1 <*3.09 <1 <*3.0948 <1 *2.79 <1 <*3.09 <1 <*3.09 <1 <*3.0949 <1 *2.87 <1 <*3.09 <1 <*3.09 <1 <*3.0950 <1 *2.96 <1 <*3.09 <1 <*3.09 <1 <*3.0951 <1 *3.09 <1 <*3.09 <1 <*3.09 <1 <*3.0952 <1 <*3.09 <1 <*3.09 <1 <*3.09 <1 <*3.0953 <1 <*3.09 <1 <*3.09 <1 <*3.09 <1 <*3.0954 <1 <*3.09 <1 <*3.09 <1 <*3.09 <1 <*3.0955 <1 <*3.09 <1 <*3.09 <1 <*3.09 <1 <*3.0956 <1 <*3.09 <1 <*3.09 <1 <*3.09 <1 <*3.0957 <1 <*3.09 <1 <*3.09 <1 <*3.09 <1 <*3.0958 <1 <*3.09 <1 <*3.09 <1 <*3.09 <1 <*3.0959 <1 <*3.09 <1 <*3.09 <1 <*3.09 <1 <*3.0960 <1 <*3.09 <1 <*3.09 <1 <*3.09 <1 <*3.09
NO0subjects 122 122 122 122Mean 7.62 4.13 2.47 1.02SD 8.44 4.38 3.91 2.2
Total Migration Word Other

Page 16 of 20 The Letter Position Test: Kohnen, Marinus, Friedmann, Anandakumar, Nickels, McArthur, & Castels (2012)
Appendix 5 Table 5a. Grade(Year)-‐based percentile ranks and normalised z-‐scores for Year 3 (average students) Error$score Percentile z*score Percentile z*score Percentile z*score Percentile z*score
0 100 >1.87 95 1.67 91 1.32 88 1.151 97 1.87 94 1.53 72 0.58 48 -0.042 95 1.67 88 1.15 55 0.12 31 -0.493 95 1.67 75 0.67 45 -0.12 17 -0.954 88 1.15 67 0.45 34 -0.40 9 -1.325 81 0.89 53 0.08 30 -0.53 5 -1.676 78 0.78 47 -0.08 27 -0.62 3 -1.877 72 0.58 45 -0.12 19 -0.89 <1 -3.098 66 0.40 34 -0.40 9 -1.32 <1 <-3.099 58 0.20 31 -0.49 6 -1.54 <1 <-3.0910 53 0.08 23 -0.73 5 -1.67 <1 <-3.0911 50 0.00 14 -1.08 3 -1.87 <1 <-3.0912 45 -0.12 9 -1.32 2 -2.14 <1 <-3.0913 41 -0.24 5 -1.67 1 -2.20 <1 <-3.0914 36 -0.36 3 -1.87 1 -2.27 <1 <-3.0915 31 -0.49 2 -2.14 1 -2.34 <1 <-3.0916 30 -0.51 1 -2.29 1 -2.44 <1 <-3.0917 30 -0.53 1 -2.51 1 -2.56 <1 <-3.0918 28 -0.58 <1 -3.09 <1 -2.73 <1 <-3.0919 25 -0.67 <1 <-3.09 <1 -3.09 <1 <-3.0920 22 -0.78 <1 <-3.09 <1 <-3.09 <1 <-3.0921 16 -1.01 <1 <-3.09 <1 <-3.09 <1 <-3.0922 14 -1.08 <1 <-3.09 <1 <-3.09 <1 <-3.0923 13 -1.15 <1 <-3.09 <1 <-3.09 <1 <-3.0924 9 -1.32 <1 <-3.09 <1 <-3.09 <1 <-3.0925 6 -1.54 <1 <-3.09 <1 <-3.09 <1 <-3.0926 3 -1.87 <1 <-3.09 <1 <-3.09 <1 <-3.0927 2 -1.99 <1 <-3.09 <1 <-3.09 <1 <-3.0928 2 -2.14 <1 <-3.09 <1 <-3.09 <1 <-3.0929 1 -2.21 <1 <-3.09 <1 <-3.09 <1 <-3.0930 1 -2.29 <1 <-3.09 <1 <-3.09 <1 <-3.0931 1 -2.39 <1 <-3.09 <1 <-3.09 <1 <-3.0932 1 -2.51 <1 <-3.09 <1 <-3.09 <1 <-3.0933 <1 -2.70 <1 <-3.09 <1 <-3.09 <1 <-3.0934 <1 -3.09 <1 <-3.09 <1 <-3.09 <1 <-3.0935 <1 <-3.09 <1 <-3.09 <1 <-3.09 <1 <-3.0936 <1 <-3.09 <1 <-3.09 <1 <-3.09 <1 <-3.0937 <1 <-3.09 <1 <-3.09 <1 <-3.09 <1 <-3.0938 <1 <-3.09 <1 <-3.09 <1 <-3.09 <1 <-3.0939 <1 <-3.09 <1 <-3.09 <1 <-3.09 <1 <-3.0940 <1 <-3.09 <1 <-3.09 <1 <-3.09 <1 <-3.0941 <1 <-3.09 <1 <-3.09 <1 <-3.09 <1 <-3.0942 <1 <-3.09 <1 <-3.09 <1 <-3.09 <1 <-3.0943 <1 <-3.09 <1 <-3.09 <1 <-3.09 <1 <-3.0944 <1 <-3.09 <1 <-3.09 <1 <-3.09 <1 <-3.0945 <1 <-3.09 <1 <-3.09 <1 <-3.09 <1 <-3.0946 <1 <-3.09 <1 <-3.09 <1 <-3.09 <1 <-3.0947 <1 <-3.09 <1 <-3.09 <1 <-3.09 <1 <-3.0948 <1 <-3.09 <1 <-3.09 <1 <-3.09 <1 <-3.0949 <1 <-3.09 <1 <-3.09 <1 <-3.09 <1 <-3.0950 <1 <-3.09 <1 <-3.09 <1 <-3.09 <1 <-3.0951 <1 <-3.09 <1 <-3.09 <1 <-3.09 <1 <-3.0952 <1 <-3.09 <1 <-3.09 <1 <-3.09 <1 <-3.0953 <1 <-3.09 <1 <-3.09 <1 <-3.09 <1 <-3.0954 <1 <-3.09 <1 <-3.09 <1 <-3.09 <1 <-3.0955 <1 <-3.09 <1 <-3.09 <1 <-3.09 <1 <-3.0956 <1 <-3.09 <1 <-3.09 <1 <-3.09 <1 <-3.0957 <1 <-3.09 <1 <-3.09 <1 <-3.09 <1 <-3.0958 <1 <-3.09 <1 <-3.09 <1 <-3.09 <1 <-3.0959 <1 <-3.09 <1 <-3.09 <1 <-3.09 <1 <-3.0960 <1 <-3.09 <1 <-3.09 <1 <-3.09 <1 <-3.09
NO1subjects 64 64 64 64Mean 12.97 6.89 4.06 2.02SD 7.67 4.12 3.63 1.69
Total Migration Word Other

Page 17 of 20
Table 5b. Grade(Year)-‐based percentile ranks and normalised z-‐scores for Year 4 (average students)
Error$score Percentile z*score Percentile z*score Percentile z*score Percentile z*score0 96 1.70 93 1.44 78 0.76 58 0.211 90 1.26 82 0.92 57 0.17 34 ,0.402 84 0.98 70 0.53 40 ,0.25 16 ,0.983 79 0.81 60 0.25 27 ,0.62 9 ,1.344 75 0.66 52 0.06 15 ,1.04 5 ,1.705 66 0.40 40 ,0.25 9 ,1.34 2 ,2.176 60 0.25 31 ,0.49 5 ,1.70 1 ,2.277 51 0.02 25 ,0.66 4 ,1.75 1 ,2.418 43 ,0.17 24 ,0.71 4 ,1.81 <1 ,2.619 34 ,0.40 21 ,0.81 3 ,1.88 <1 ,3.0910 33 ,0.45 15 ,1.04 2 ,2.00 <1 <,3.0911 31 ,0.49 13 ,1.11 2 ,2.17 <1 <,3.0912 27 ,0.62 9 ,1.34 1 ,2.22 <1 <,3.0913 25 ,0.66 8 ,1.44 1 ,2.27 <1 <,3.0914 24 ,0.71 6 ,1.55 1 ,2.34 <1 <,3.0915 19 ,0.86 5 ,1.70 1 ,2.41 <1 <,3.0916 16 ,0.98 2 ,2.17 1 ,2.50 <1 <,3.0917 13 ,1.11 <1 ,3.09 <1 ,2.61 <1 <,3.0918 12 ,1.18 <1 <,3.09 <1 ,2.78 <1 <,3.0919 11 ,1.23 <1 <,3.09 <1 ,3.09 <1 <,3.0920 10 ,1.28 <1 <,3.09 <1 <,3.09 <1 <,3.0921 9 ,1.34 <1 <,3.09 <1 <,3.09 <1 <,3.0922 8 ,1.44 <1 <,3.09 <1 <,3.09 <1 <,3.0923 6 ,1.55 <1 <,3.09 <1 <,3.09 <1 <,3.0924 5 ,1.70 <1 <,3.09 <1 <,3.09 <1 <,3.0925 4 ,1.78 <1 <,3.09 <1 <,3.09 <1 <,3.0926 3 ,1.88 <1 <,3.09 <1 <,3.09 <1 <,3.0927 2 ,2.17 <1 <,3.09 <1 <,3.09 <1 <,3.0928 1 ,2.41 <1 <,3.09 <1 <,3.09 <1 <,3.0929 <1 ,3.09 <1 <,3.09 <1 <,3.09 <1 <,3.0930 <1 <,3.09 <1 <,3.09 <1 <,3.09 <1 <,3.0931 <1 <,3.09 <1 <,3.09 <1 <,3.09 <1 <,3.0932 <1 <,3.09 <1 <,3.09 <1 <,3.09 <1 <,3.0933 <1 <,3.09 <1 <,3.09 <1 <,3.09 <1 <,3.0934 <1 <,3.09 <1 <,3.09 <1 <,3.09 <1 <,3.0935 <1 <,3.09 <1 <,3.09 <1 <,3.09 <1 <,3.0936 <1 <,3.09 <1 <,3.09 <1 <,3.09 <1 <,3.0937 <1 <,3.09 <1 <,3.09 <1 <,3.09 <1 <,3.0938 <1 <,3.09 <1 <,3.09 <1 <,3.09 <1 <,3.0939 <1 <,3.09 <1 <,3.09 <1 <,3.09 <1 <,3.0940 <1 <,3.09 <1 <,3.09 <1 <,3.09 <1 <,3.0941 <1 <,3.09 <1 <,3.09 <1 <,3.09 <1 <,3.0942 <1 <,3.09 <1 <,3.09 <1 <,3.09 <1 <,3.0943 <1 <,3.09 <1 <,3.09 <1 <,3.09 <1 <,3.0944 <1 <,3.09 <1 <,3.09 <1 <,3.09 <1 <,3.0945 <1 <,3.09 <1 <,3.09 <1 <,3.09 <1 <,3.0946 <1 <,3.09 <1 <,3.09 <1 <,3.09 <1 <,3.0947 <1 <,3.09 <1 <,3.09 <1 <,3.09 <1 <,3.0948 <1 <,3.09 <1 <,3.09 <1 <,3.09 <1 <,3.0949 <1 <,3.09 <1 <,3.09 <1 <,3.09 <1 <,3.0950 <1 <,3.09 <1 <,3.09 <1 <,3.09 <1 <,3.0951 <1 <,3.09 <1 <,3.09 <1 <,3.09 <1 <,3.0952 <1 <,3.09 <1 <,3.09 <1 <,3.09 <1 <,3.0953 <1 <,3.09 <1 <,3.09 <1 <,3.09 <1 <,3.0954 <1 <,3.09 <1 <,3.09 <1 <,3.09 <1 <,3.0955 <1 <,3.09 <1 <,3.09 <1 <,3.09 <1 <,3.0956 <1 <,3.09 <1 <,3.09 <1 <,3.09 <1 <,3.0957 <1 <,3.09 <1 <,3.09 <1 <,3.09 <1 <,3.0958 <1 <,3.09 <1 <,3.09 <1 <,3.09 <1 <,3.0959 <1 <,3.09 <1 <,3.09 <1 <,3.09 <1 <,3.0960 <1 <,3.09 <1 <,3.09 <1 <,3.09 <1 <,3.09
NO0subjects 67 67 67 67Mean 9.4 5.55 2.57 1.28SD 7.19 4.44 3.01 1.64
Total Migration Word Other

Page 18 of 20 The Letter Position Test: Kohnen, Marinus, Friedmann, Anandakumar, Nickels, McArthur, & Castels (2012)
Table 5c. Grade(Year)-‐based percentile ranks and normalised z-‐scores for Year 5 (average students)
Error$score Percentile z*score Percentile z*score Percentile z*score Percentile z*score0 98 2.01 88 1.19 82 0.90 52 0.041 88 1.19 71 0.55 51 0.01 23 +0.752 79 0.79 58 0.20 30 +0.52 11 +1.243 69 0.49 47 +0.07 22 +0.79 4 +1.724 61 0.29 37 +0.34 16 +0.99 3 +1.855 52 0.04 31 +0.49 12 +1.19 2 +2.016 42 +0.20 22 +0.79 10 +1.30 <1 +3.097 36 +0.37 16 +0.99 9 +1.37 <1 <+3.098 28 +0.58 13 +1.13 4 +1.72 <1 <+3.099 25 +0.68 10 +1.30 3 +1.85 <1 <+3.0910 22 +0.79 9 +1.37 <1 +3.09 <1 <+3.0911 20 +0.83 7 +1.51 <1 <+3.09 <1 <+3.0912 19 +0.86 1 +2.29 <1 <+3.09 <1 <+3.0913 18 +0.90 1 +2.51 <1 <+3.09 <1 <+3.0914 16 +0.99 <1 +3.09 <1 <+3.09 <1 <+3.0915 13 +1.11 <1 <+3.09 <1 <+3.09 <1 <+3.0916 11 +1.24 <1 <+3.09 <1 <+3.09 <1 <+3.0917 9 +1.37 <1 <+3.09 <1 <+3.09 <1 <+3.0918 8 +1.44 <1 <+3.09 <1 <+3.09 <1 <+3.0919 7 +1.51 <1 <+3.09 <1 <+3.09 <1 <+3.0920 4 +1.72 <1 <+3.09 <1 <+3.09 <1 <+3.0921 4 +1.75 <1 <+3.09 <1 <+3.09 <1 <+3.0922 4 +1.78 <1 <+3.09 <1 <+3.09 <1 <+3.0923 3 +1.82 <1 <+3.09 <1 <+3.09 <1 <+3.0924 3 +1.85 <1 <+3.09 <1 <+3.09 <1 <+3.0925 <1 +3.09 <1 <+3.09 <1 <+3.09 <1 <+3.0926 <1 <+3.09 <1 <+3.09 <1 <+3.09 <1 <+3.0927 <1 <+3.09 <1 <+3.09 <1 <+3.09 <1 <+3.0928 <1 <+3.09 <1 <+3.09 <1 <+3.09 <1 <+3.0929 <1 <+3.09 <1 <+3.09 <1 <+3.09 <1 <+3.0930 <1 <+3.09 <1 <+3.09 <1 <+3.09 <1 <+3.0931 <1 <+3.09 <1 <+3.09 <1 <+3.09 <1 <+3.0932 <1 <+3.09 <1 <+3.09 <1 <+3.09 <1 <+3.0933 <1 <+3.09 <1 <+3.09 <1 <+3.09 <1 <+3.0934 <1 <+3.09 <1 <+3.09 <1 <+3.09 <1 <+3.0935 <1 <+3.09 <1 <+3.09 <1 <+3.09 <1 <+3.0936 <1 <+3.09 <1 <+3.09 <1 <+3.09 <1 <+3.0937 <1 <+3.09 <1 <+3.09 <1 <+3.09 <1 <+3.0938 <1 <+3.09 <1 <+3.09 <1 <+3.09 <1 <+3.0939 <1 <+3.09 <1 <+3.09 <1 <+3.09 <1 <+3.0940 <1 <+3.09 <1 <+3.09 <1 <+3.09 <1 <+3.0941 <1 <+3.09 <1 <+3.09 <1 <+3.09 <1 <+3.0942 <1 <+3.09 <1 <+3.09 <1 <+3.09 <1 <+3.0943 <1 <+3.09 <1 <+3.09 <1 <+3.09 <1 <+3.0944 <1 <+3.09 <1 <+3.09 <1 <+3.09 <1 <+3.0945 <1 <+3.09 <1 <+3.09 <1 <+3.09 <1 <+3.0946 <1 <+3.09 <1 <+3.09 <1 <+3.09 <1 <+3.0947 <1 <+3.09 <1 <+3.09 <1 <+3.09 <1 <+3.0948 <1 <+3.09 <1 <+3.09 <1 <+3.09 <1 <+3.0949 <1 <+3.09 <1 <+3.09 <1 <+3.09 <1 <+3.0950 <1 <+3.09 <1 <+3.09 <1 <+3.09 <1 <+3.0951 <1 <+3.09 <1 <+3.09 <1 <+3.09 <1 <+3.0952 <1 <+3.09 <1 <+3.09 <1 <+3.09 <1 <+3.0953 <1 <+3.09 <1 <+3.09 <1 <+3.09 <1 <+3.0954 <1 <+3.09 <1 <+3.09 <1 <+3.09 <1 <+3.0955 <1 <+3.09 <1 <+3.09 <1 <+3.09 <1 <+3.0956 <1 <+3.09 <1 <+3.09 <1 <+3.09 <1 <+3.0957 <1 <+3.09 <1 <+3.09 <1 <+3.09 <1 <+3.0958 <1 <+3.09 <1 <+3.09 <1 <+3.09 <1 <+3.0959 <1 <+3.09 <1 <+3.09 <1 <+3.09 <1 <+3.0960 <1 <+3.09 <1 <+3.09 <1 <+3.09 <1 <+3.09
NO0subjects 93 93 93 93Mean 7.42 4.1 2.38 0.95SD 6.23 3.52 2.53 1.3
Total Migration Word Other

Page 19 of 20
Table 5d. Grade(Year)-‐based percentile ranks and normalised z-‐scores for Year 6 (average students)
Error$score Percentile z*score Percentile z*score Percentile z*score Percentile z*score0 95 1.64 89 1.20 83 0.97 44 ,0.161 90 1.26 77 0.74 41 ,0.23 22 ,0.782 78 0.78 54 0.10 24 ,0.69 8 ,1.433 68 0.46 41 ,0.23 14 ,1.08 3 ,1.944 59 0.23 28 ,0.58 9 ,1.34 <1 ,3.095 45 ,0.13 23 ,0.74 4 ,1.77 <1 <,3.096 37 ,0.33 21 ,0.82 3 ,1.94 <1 <,3.097 30 ,0.54 13 ,1.14 1 ,2.23 <1 <,3.098 23 ,0.74 10 ,1.26 1 ,2.46 <1 <,3.099 19 ,0.87 9 ,1.34 <1 ,3.09 <1 <,3.0910 18 ,0.92 6 ,1.52 <1 <,3.09 <1 <,3.0911 16 ,0.99 5 ,1.70 <1 <,3.09 <1 <,3.0912 14 ,1.08 3 ,1.94 <1 <,3.09 <1 <,3.0913 10 ,1.26 2 ,2.02 <1 <,3.09 <1 <,3.0914 8 ,1.43 2 ,2.11 <1 <,3.09 <1 <,3.0915 6 ,1.52 1 ,2.23 <1 <,3.09 <1 <,3.0916 5 ,1.64 1 ,2.33 <1 <,3.09 <1 <,3.0917 5 ,1.68 1 ,2.46 <1 <,3.09 <1 <,3.0918 4 ,1.72 <1 ,2.65 <1 <,3.09 <1 <,3.0919 4 ,1.77 <1 ,3.09 <1 <,3.09 <1 <,3.0920 3 ,1.94 <1 <,3.09 <1 <,3.09 <1 <,3.0921 2 ,2.06 <1 <,3.09 <1 <,3.09 <1 <,3.0922 1 ,2.23 <1 <,3.09 <1 <,3.09 <1 <,3.0923 1 ,2.37 <1 <,3.09 <1 <,3.09 <1 <,3.0924 <1 ,2.58 <1 <,3.09 <1 <,3.09 <1 <,3.0925 <1 ,3.09 <1 <,3.09 <1 <,3.09 <1 <,3.0926 <1 <,3.09 <1 <,3.09 <1 <,3.09 <1 <,3.0927 <1 <,3.09 <1 <,3.09 <1 <,3.09 <1 <,3.0928 <1 <,3.09 <1 <,3.09 <1 <,3.09 <1 <,3.0929 <1 <,3.09 <1 <,3.09 <1 <,3.09 <1 <,3.0930 <1 <,3.09 <1 <,3.09 <1 <,3.09 <1 <,3.0931 <1 <,3.09 <1 <,3.09 <1 <,3.09 <1 <,3.0932 <1 <,3.09 <1 <,3.09 <1 <,3.09 <1 <,3.0933 <1 <,3.09 <1 <,3.09 <1 <,3.09 <1 <,3.0934 <1 <,3.09 <1 <,3.09 <1 <,3.09 <1 <,3.0935 <1 <,3.09 <1 <,3.09 <1 <,3.09 <1 <,3.0936 <1 <,3.09 <1 <,3.09 <1 <,3.09 <1 <,3.0937 <1 <,3.09 <1 <,3.09 <1 <,3.09 <1 <,3.0938 <1 <,3.09 <1 <,3.09 <1 <,3.09 <1 <,3.0939 <1 <,3.09 <1 <,3.09 <1 <,3.09 <1 <,3.0940 <1 <,3.09 <1 <,3.09 <1 <,3.09 <1 <,3.0941 <1 <,3.09 <1 <,3.09 <1 <,3.09 <1 <,3.0942 <1 <,3.09 <1 <,3.09 <1 <,3.09 <1 <,3.0943 <1 <,3.09 <1 <,3.09 <1 <,3.09 <1 <,3.0944 <1 <,3.09 <1 <,3.09 <1 <,3.09 <1 <,3.0945 <1 <,3.09 <1 <,3.09 <1 <,3.09 <1 <,3.0946 <1 <,3.09 <1 <,3.09 <1 <,3.09 <1 <,3.0947 <1 <,3.09 <1 <,3.09 <1 <,3.09 <1 <,3.0948 <1 <,3.09 <1 <,3.09 <1 <,3.09 <1 <,3.0949 <1 <,3.09 <1 <,3.09 <1 <,3.09 <1 <,3.0950 <1 <,3.09 <1 <,3.09 <1 <,3.09 <1 <,3.0951 <1 <,3.09 <1 <,3.09 <1 <,3.09 <1 <,3.0952 <1 <,3.09 <1 <,3.09 <1 <,3.09 <1 <,3.0953 <1 <,3.09 <1 <,3.09 <1 <,3.09 <1 <,3.0954 <1 <,3.09 <1 <,3.09 <1 <,3.09 <1 <,3.0955 <1 <,3.09 <1 <,3.09 <1 <,3.09 <1 <,3.0956 <1 <,3.09 <1 <,3.09 <1 <,3.09 <1 <,3.0957 <1 <,3.09 <1 <,3.09 <1 <,3.09 <1 <,3.0958 <1 <,3.09 <1 <,3.09 <1 <,3.09 <1 <,3.0959 <1 <,3.09 <1 <,3.09 <1 <,3.09 <1 <,3.0960 <1 <,3.09 <1 <,3.09 <1 <,3.09 <1 <,3.09
NO0subjects 78 78 78 78Mean 6.46 3.9 1.81 0.76SD 5.22 3.67 1.74 1.05
Total Migration Word Other

Page 20 of 20 The Letter Position Test: Kohnen, Marinus, Friedmann, Anandakumar, Nickels, McArthur, & Castels (2012)
Appendix 6 Selecting appropriate norms for children who have not progressed through a typical Australian
school system We suggest that, as a first step, you calculate the number of terms the child you have tested has been at school for. Include the term they are currently in. If a child has repeated a year, you may want to decide to calculate the number of terms a child that hasn’t repeated a year has been at school for. Then look up in the table below to see what is the best comparison group.
No of terms the tested has been at school for
NSW/QLD Terminology We suggest to use the following norms
10 – 13 Year 2, Term 2 – Year 3, Term 1 Year 2 14 – 17 Year 3, Term 2 – Year 4, Term 1 Year 3 18 – 21 Year 4, Term 2 – Year 5, Term 1 Year 4 22 – 25 Year 5, Term 2 – Year 6, Term 1 Year 5 26 - 29 Year 6, Term 2 – Year 7, Term 1 Year 6


![Star Trek Pc Manual 021213[1]](https://img.dokumen.tips/doc/110x75/577cddcc1a28ab9e78adc384/star-trek-pc-manual-0212131.jpg)

