Embed Size (px)
Citation preview

Full Terms & Conditions of access and use can be found athttps://www.tandfonline.com/action/journalInformation?journalCode=ctqm20
Total Quality Management & Business Excellence
ISSN: 1478-3363 (Print) 1478-3371 (Online) Journal homepage: https://www.tandfonline.com/loi/ctqm20
The Lean journey: have we got it wrong?
Peter Hines, Darrin Taylor & Aidan Walsh
To cite this article: Peter Hines, Darrin Taylor & Aidan Walsh (2020) The Lean journey: havewe got it wrong?, Total Quality Management & Business Excellence, 31:3-4, 389-406, DOI:10.1080/14783363.2018.1429258
To link to this article: https://doi.org/10.1080/14783363.2018.1429258
Published online: 28 Feb 2018.
Submit your article to this journal
Article views: 413
View related articles
View Crossmark data
Citing articles: 2 View citing articles

The Lean journey: have we got it wrong?
Peter Hines*, Darrin Taylor and Aidan Walsh
Academy of Lean Enterprise Excellence, RIKON, School of Business, Waterford Institute ofTechnology, Waterford, Ireland
Over the last three decades, there has been a vogue in manufacturing, and increasingly inservices organisations to implement Lean. However, in many cases these journeys havenot been as successful or sustainable as their architects had planned. The question is whyhave the results been worse than planned and have organisations got theirimplementation approach wrong? This paper considers this question and finds that thereason is largely due to the ‘easy’ results-oriented and tools-only approach of theorganisations involved. It explores why this approach does not work using a critical-realist method in a longitudinal case organisation, based in Wales that has taken adifferent evolutionary approach and ultimately received Shingo Prize recognition. Itsapproach is based on principles-led behaviours, systems, and cultural change. Thisapproach appears to be more successful and early indications are that it is moresustainable. The paper contributes to both the academic and practitioner communitiesby presenting a theoretical stage model and evolutionary framework of thedevelopment that the case company undertook as well as a discussion of how toovercome two barriers to successful Lean implementation. We therefore demonstratehow one can move beyond the common tool-based approach which has attracted themajority of criticism in the academic literature.
Keywords: Lean; principles; employees; behaviour; tools; systems; culture;sustainability
Introduction
The origins of Lean lie in the shop floors of Japanese manufacturers, in particular at ToyotaMotor Corporation (Monden, 1983; Ohno, 1988; Shingo, 1989). Early emulation in theWest in the 1980s largely consisted of the piecemeal copying of particular tools such as5S and Kanban within what was at the time called ‘Just-In-Time (JIT)’. Other influencesfrom improvement methodologies such as Total Quality Management and Six Sigmaalso contributed tools, understanding, and discipline. It was not until the publication in1990 of the breakthrough book The Machine That Changed The World by Womack,Jones, and Roos (1990) that the term ‘Lean Production’ was popularised. This bookshowed evidence of a significant gap in performance between Toyota and other globalcar manufacturing companies. The effectiveness of the book, and Lean itself, lay in thesimple but powerful message that success could be achieved through the removal ofwaste (‘Muda’ in Japanese). Womack et al. (1990, p. 15) indeed start the book with‘Muda. It’s the one word in Japanese you really must know’.
There is an extensive literature on Lean and its evolution, with several excellent sum-maries provided by: Bhamu and Sangwan (2014); Bhasin and Burcher (2006); Holweg(2007); Samuel, Found, and Williams (2015). Since 1990, there have been a number ofwider developments in Lean such as Lean and Green (Zokaei, Lovins, Wood, & Hines,
© 2018 Informa UK Limited, trading as Taylor & Francis Group
*Corresponding author. Email: [email protected]
Total Quality Management, 2020Vol. 31, No. 4, 389–406, https://doi.org/10.1080/14783363.2018.1429258

2013), Six Sigma (Schonberger, 2008) and Leagile (Christopher & Towill, 2000).However, these lie beyond the scope of this paper.
Suffice it to say the major theme within Lean was, particularly in its early days, a focuson waste reduction, as illustrated by Jeffrey K. Liker’s early definition of Lean: ‘a philos-ophy that when implemented reduces the time from customer order to delivery by eliminat-ing sources of waste in the flow of production’ (Liker, 1996, p. 481).
There was a rapid take up of Lean after the publication of ‘The Machine… ’ book. Inmany cases organisations received huge benefits (Sheridan, 2004; Sohal & Eggleston,1994; Taylor & Brunt, 2001). Within companies the topic was dominated by the operationsmanagement, engineering, and supply chain practitioners. This was mirrored by interestfrom academics within these subject areas, resident both in Business Schools and in Engin-eering Schools, with a steadily increasing number of publications over time (Bhamu &Sangwan, 2014; Jasti & Kodali, 2015; Samuel et al., 2015). An exception to this was abody of literature from researchers (see below) who were in many cases much less positiveabout Lean.
Criticisms and gaps within Lean
Much of the literature on Lean is positive in terms of the results that can be achieved.However, there have been a number of areas where criticism has been levelled and gapsidentified, notably:
. Confusion about what the term Lean actually means (Hallam, 2003; Stone, 2012).
. A lack of a standard implementation process (Anand & Kodali, 2010; Bhamu &Sangwan, 2014).
. Whether Lean can be applied in low-volume high-variety environments (Christopher& Towill, 2000; van Hoek, Harrison, & Christopher, 2001).
. An over focus on the operational versus the strategic level (Hines, Holweg, & Rich,2004; Tennant & Roberts, 2001).
. Companies that use a piecemeal tools approach (Hines, Found, Griffiths, & Harrison,2011; Seddon & Caulkin, 2007).
. Lack of, or inadequacy of, a coherent theory (Flynn, Sakkakibara, Schroeder, Bates,& Flynn, 1990; Schmenner & Swink, 1998).
. The transferability of Lean (Cooney, 2002; James-Moore & Gibbons, 1997).
. The negative effects on the workforce (Benders & Morita, 2004; Coffey & Thornley,2006; Delbridge, Turnbull, & Wilkinson, 1992; Garrahan & Stewart, 1992; Williamset al., 1992).
. The missing role of people in the Lean approach (Bidanda, Ariyawongrat, Needy, &Norman, 2005; Kippenberger, 1998; Stone, 2012).
. The sustainability of Lean (Repenning & Sterman, 2001; Motley, 2004).
These criticisms and gaps are summarised in Figure 1. This figure describes these gapsin terms of inputs (what the starting point for Lean is; and what Lean itself is), process (howto employ Lean) and outputs (the results of Lean application). However, ‘the most apparentvoid within the body of knowledge eschewing from the Lean literature was the lack oftheoretical connections often associated with planned organisational change and HRDinterventions’ (Stone, 2012, p. 121).
In the research undertaken for this paper, we have sought to be cognisant of thesevarious criticisms and gaps, and to ask ourselves this simple question about Lean: Have
390 P. Hines et al.

we got it wrong?What we mean by this is have we got the application of Lean wrong. If we,namely the academic community and the majority of practitioners, have got it wrong thenwe would expect to see poor sustainability and low levels of engagement in Lean activity.
The sustainability of Lean
As we noted above, much of the literature is positive about Lean – perhaps even a little toopositive as it is more rewarding (and perhaps more publishable) to write a really goodsuccess story. Also many of the cases involve action research carried out by the researcherthemselves. In this respect the work of Bateman (2001) is of interest in her independentstudy of a large multi-company Lean programme in the UK. She concludes that consultantsdwell on the positives of Lean whilst being somewhat sketchy on their respectiveimplementation records.
Sohal and Eggleston (1994) have suggested that only 10% of firms have an effectiveLean philosophy implemented. In addition, Repenning and Sterman (2001), as cited inBhasin and Burcher (2006, p. 56):
advocate that companies use initiatives almost as a fad and submit that whilst the: ‘number oftools, techniques and technologies available to improve operational performance is growingrapidly, on the other hand, despite dramatic successes in a few companies most efforts touse them fail to produce significant results’.
So, have we got it wrong in terms of our thinking and application of Lean?
Research methodology
The research methodology in this study is qualitative, and conducted over a longitudi-nal period using case study design (Yin, 2009) at a single organisation in a singlelocation (Stake, 1998). The case study is a very popular and widely used researchdesign in business research (Bryman & Bell, 2015), and it is useful for theory building
Figure 1. Lean literature gaps.
Total Quality Management 391
(Eisenhardt & Graebner, 2007). In this study it was required because of the need for aflexible and holistic research design (Hakim, 2000) that involves a combination ofdifferent methods in order to deal with the complexity and variety of data (Hartley,1994; Yin, 2009).
A critical-realist approach was adopted. Additionally, principles of action research andlearning were applied (Eden & Huxham, 1996) and this enabled one of the researchers (asan embedded consultant) and the case organisation (their client) to ‘collaborate in the diag-nosis of a problem and in the development of a solution based on the diagnosis’ (Bryman &Bell, 2015, pp. 418–419). This also allowed the other two researchers to take a moredetached and independent view of the case and mitigate the temptation to exaggerate thesuccess of the work.
The case organisation
The case organisation is Vale, a nickel refinery located in Wales, UK. Access to the caselocation was provided over a seven-year longitudinal period from 2009 to 2016. Thecase company exhibited characteristics of an advanced Lean approach towards the endof this period as evidenced in achieving recognition against the Shingo Prize standard in2014 (Shingo Institute, 2016a). The Shingo Prize is now developing as the de factohighest level achievement for companies in the Lean world (Business Week, 2000; Liker,2004; Shingo Institute, 2016b). It is housed at The Shingo Institute in the Jon M. HuntsmanSchool of Business, Utah State University, USA and is named after Shigeo Shingo who co-developed the Toyota Production System when working as a consultant for Toyota (Hogan,2009). Dr Shingo received an honorary doctorate from Utah State University in 1988.
Limitations of the research
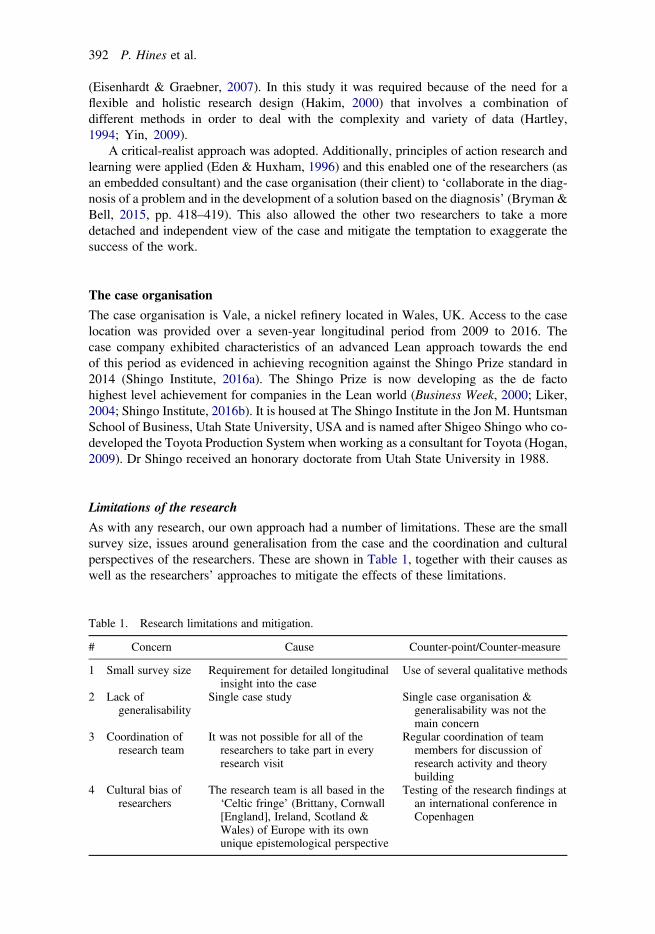
As with any research, our own approach had a number of limitations. These are the smallsurvey size, issues around generalisation from the case and the coordination and culturalperspectives of the researchers. These are shown in Table 1, together with their causes aswell as the researchers’ approaches to mitigate the effects of these limitations.
Table 1. Research limitations and mitigation.
# Concern Cause Counter-point/Counter-measure
1 Small survey size Requirement for detailed longitudinalinsight into the case
Use of several qualitative methods
2 Lack ofgeneralisability
Single case study Single case organisation &generalisability was not themain concern
3 Coordination ofresearch team
It was not possible for all of theresearchers to take part in everyresearch visit
Regular coordination of teammembers for discussion ofresearch activity and theorybuilding
4 Cultural bias ofresearchers
The research team is all based in the‘Celtic fringe’ (Brittany, Cornwall[England], Ireland, Scotland &Wales) of Europe with its ownunique epistemological perspective
Testing of the research findings atan international conference inCopenhagen
392 P. Hines et al.

Research findings
Vale is one of the world’s largest mining companies, and is headquartered in Brazil. It is theworld’s largest producer of iron ore and nickel. Its nickel refinery operation in Clydach,Wales, UK has 200 employees and an annual production of 40,000 tonnes of nickelpellets and powder. It is a continuous process plant operating 24 hours a day, 365 days ayear. The site is over 100 years old, a classic brownfield site and has employees with typi-cally very long staff service. The final product is of a very high level of purity and is sold to280 customers in 30 countries including many Japanese electronics firms.
Like most manufacturing companies, Vale has undertaken continuous improvementactivity for many years. From the mid-1990s to 2008 it had undertaken a series of tool-based initiatives including: Theory of Constraints, Strategic Supply Chain Management,and Six Sigma. All of these proved useful to the site, but none formed the basis of sustain-able embedded change. We can characterise Vale’s post 2008 continuous improvement inthree phases:
1. Stabilising Production Processes 2008–20092. Developing Strategy Deployment and Continuous Improvement Systems 2010–
20123. Embedding Sustainability 2013–2016.
Phase I. Stabilising production processes 2008–2009
This first phase could be regarded as the first major step towards sustainable excellence inthe business and involved the use of a number of Lean and Six Sigma tools. Principalamong these was the roll out of Standard Work for over 200 critical tasks, as well as theimplementation of 5S widely across the site. A useful addition to this was the ProblemFollow Up (PFU) approach whereby any employee could raise a concern about a StandardWork sheet, and their proposal would be discussed and in many cases, result in an improve-ment of the Standard Work.
In addition, the company had developed some expertise in structured problem solvingfor complex problems using a simplified version of Six Sigma it termed ‘Analyse &Improve’. This was applied to larger improvement projects by Lean engineering experts.An example of this was the de-bottlenecking of the kiln involving the use of Overall Equip-ment Effectiveness and Failure Mode and Effect Analysis (FMEA).
We can, therefore, characterise this first stabilisation phase as a tool-based approachlargely led by internal, and in some cases external, experts.
Phase II. Developing strategy deployment and continuous improvement systems2010–2012
The second phase started with a systematic review of the site and its Lean maturity. Themanagement reviewed Lean maturity with outside support against a five-point Lean matur-ity model ranging from ‘Reactive’, where there is no Lean activity to ‘Way of Life’ whereLean was the norm (Figure 2). There were five factors taken into account in this maturityassessment: Strategy Deployment, Value Stream Management, People, Tools & Tech-niques and Extended Enterprise. They judged themselves to be in the second ‘formal’stage – a reflection of the fact that they had established a controlled, stable manufacturingenvironment by the end of 2009. They also identified where they wanted to reach three
Total Quality Management 393

years later, as well as an intermediary point at the end of the first roadmap in 2011 (Figures2 & 3).
The second phase involved a plan against all of these five elements; although in thesummary document (Figure 3) the Tools and People elements are combined. This involveda series of improvement projects organised and sponsored by the management team. Thecore element of this activity was the central line involving the development of what man-agement termed ‘Yellow Boards’ (Figure 4). These Yellow Boards were the visual mani-festation of a Strategy Deployment system and Continuous Improvement system. Theycaptured the purpose of the team, the process or activity the team undertook including
Figure 2. Lean maturity at Vale, January, 2010.
Figure 3. Continuous improvement roadmap.
394 P. Hines et al.

KPIs, improvement activity and people engagement. In total 15 Yellow Boards were intro-duced in this period: one at the business level, and a further 14 at the local team level inevery area of the company, manufacturing, warehouse, and office. The initial trial was inthe kiln area and laboratory testing area. These areas being chosen to show that whatwas now termed ‘Continuous Improvement’ rather than Lean could be applied anywherein the business.
The Yellow Boards were made up of four parts and the general structure was standar-dised across the business (Figure 4). The main elements of the Strategy Deployment systemwere:
A. At the Business Level:i. A simple one page codification of the strategy for the site in terms of what the
mission for the site was (‘We will… .’), what the key mechanisms or activitieswere (‘By… .’), and what would be the result (‘In order to… ’).
ii. A set of statements by the senior management team about why they were doingthis activity.
iii. A summary of Critical Success Factors (CSFs) at their level again developed bythe senior team.
iv. A set of Key Performance Indicators (KPIs) with targets and trends that weredeveloped around measures that would gauge how well they were doing withthe CSFs and encourage a behaviour around working on the right improvementactivities to achieve the stated strategy. These measures were a balance of leadmeasures (such as Employee Engagement & Wellness Index), process measures(such as the Percentage of People taking part in Yellow Board meetings &Adherence to the Continuous Improvement Roadmap) and more traditional lagmeasures (such as Conversion Cost and Yield Rate).
B. At the Local Team Level, an identical approach except:
Figure 4. Yellow board (local version).
Total Quality Management 395

i. An additional page to the site level strategy codifying what a local team’s contri-bution to the site strategy was, importantly developed by the team itself andchecked by the senior team.
ii. The ‘Why Are We Doing Continuous Improvement’, CSFs and KPIs were alldeveloped by the teams themselves, not assigned by the senior team. Targetsfor these were then agreed between the local team and the senior team.
The Yellow Boards were not static ‘Visual Displays’, however, but were used to definestrategy at each level and for the ongoing management of the local area and the ContinuousImprovement system. This was achieved through:
A. At the Business Level:i. The development of a planned series of Discontinuous Improvement projects
which were managed through an A3 process with progress checked weekly atthe senior management team meeting. The projects were developed at thestart of 2010 and were limited to six at any one time, with new projectsadded as existing projects were completed. These new projects could bedeveloped as a response to the changing environment (for example, theprice of nickel), new ideas from the team themselves, or through ideas esca-lated from local boards.
B. At the Local Team Level, an identical approach except:
i. The addition of a bottom up Continuous Improvement process using a simplerA5 sized form (in essence a quarter of the size of the bigger A3 project sheetsdesigned for smaller projects). The approach taken was termed PFU as it wasan extension of the existing popular approach for improving Standard Work.The extension meant that any team member could raise suggestions whichwould be reviewed at the next local Yellow Board meeting. These meetingswere held on a shift basis (where there was shift work); or on a dailybasis; or, in the office environment, on a weekly basis. Hence ideas in mostlocal teams were reviewed within 24 hours of being raised, and in officesat least weekly. The review would consist of the idea originator sharingtheir idea with the team and the team deciding whether it was worthy ofimplementation. If it was agreed that the idea should be implemented, itwas either:
a. Assigned (in its A5 format) to one or more team members by the teamleader; or
b. Upgraded to an A3 format if it was a major Discontinuous Improvementand added to the Discontinuous Improvement Gantt chart with a plannedimplementation time (in the manufacturing area this was often during aproduction planned downtime); or
c. Escalated to the senior team or transferred to another local team where thesource of the problem might be.
In this second phase, there was an early light touch approach to the cultural aspects ofchange. This was captured in the People part of the Yellow Board, with a similar approachat both business and local levels, and included:
. A picture of each team member.
. A skills matrix for each team member which was updated as skills changed.
. A set of 11 behaviours that had been defined by the senior team (Table 2).
396 P. Hines et al.

Phase III. Embedding sustainability 2013–2016
In the third phase, there was a greater focus on the sustainability of change. This included awide range of actions, many of which were led by the senior management team. There wasalso a seamless integration of technical and people aspects of change. This is illustrated byway of four of the more noteworthy examples:
A. Training and development of the leaders was undertaken within the businessaround gemba walks and coaching activity. This meant the site director andother key staff undertook regular walks around the local Yellow Boards toreview the achievement of KPIs, improvement activity, and the culture embeddedwithin the local teams. Depending on what was found, the team leaders and teamswere recognised for their performance and/or coaching conversations were under-taken with a view to improving local skills and behaviour.
B. Structured weekly conversations were undertaken by each team around the ‘be-haviour of the week’ within the ‘Our Behaviour’ visual list (Table 2). Thisinvolved a standard work procedure for the Yellow Board meeting where individ-uals recognised another person in the business for their behaviour. If these wereoutside of the team the team leader took an action to pass on the public recognitionto the person outside of the team. As this was considered so important, a record ofthe behaviour was kept. The behaviour that was recorded was that of recognisingsomebody else. A tally was kept of how many times an individual had recognisedsomeone else and this was recorded on a table on the Yellow Board.
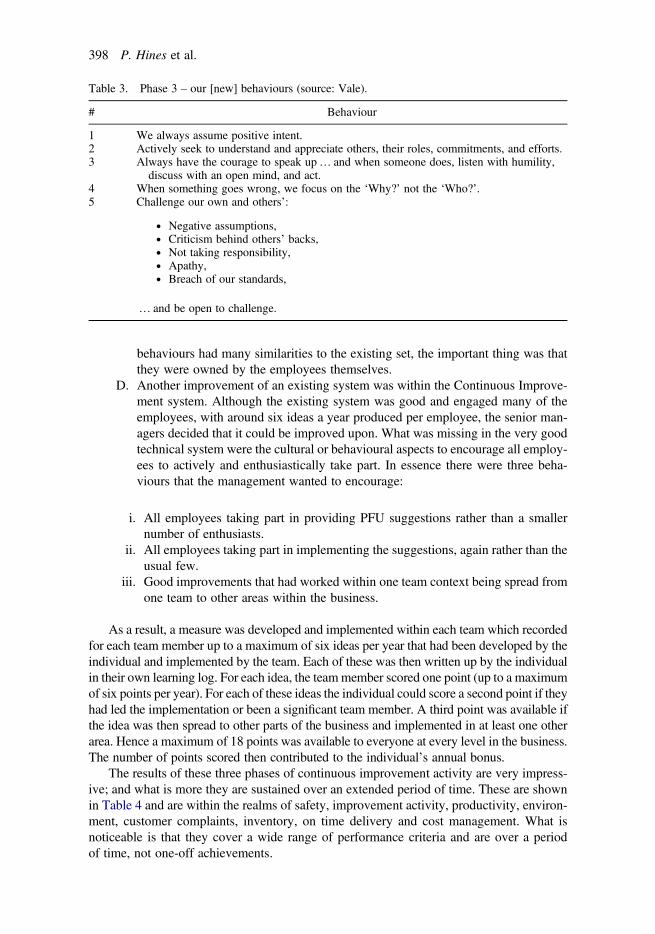
C. The business was developing a learning and continuous improvement mentalitywhereby they were starting actively to challenge the systems that they hadimplemented to make them better. Although this last activity was helping tocreate a culture of continuous improvement, the business felt that it was still notengaging enough and that some people were perhaps not taking it as seriouslyas they might. The root cause was that the local teams had these behavioursimposed on them and in some cases did not understand why these behaviourswere relevant. As a result, the management decided to undertake an extensivebottom up exercise of understanding from all employees what was good aboutthe site and what could be improved. This also included the bottom up develop-ment of a set of behaviours that stemmed from consensus meetings of the employ-ees rather than top down from the managers (Table 3). Although the resulting
Table 2. Phase 2 – our behaviours (source: Vale).
# Behaviour
1 We will actively demonstrate commitment to SHE.2 We will not ‘walk past’.3 We will listen actively to other’s opinions.4 We will ‘Go Look See’.5 We will respect our colleagues’ time.6 We will do what we say.7 We will challenge each other and the status quo.8 We will recognize others and say thank you.9 We will ask for and give positive and constructive feedback.10 We will accept and learn from mistakes – no blame.11 We will take responsibility for our own actions.
Total Quality Management 397
behaviours had many similarities to the existing set, the important thing was thatthey were owned by the employees themselves.
D. Another improvement of an existing system was within the Continuous Improve-ment system. Although the existing system was good and engaged many of theemployees, with around six ideas a year produced per employee, the senior man-agers decided that it could be improved upon. What was missing in the very goodtechnical system were the cultural or behavioural aspects to encourage all employ-ees to actively and enthusiastically take part. In essence there were three beha-viours that the management wanted to encourage:
i. All employees taking part in providing PFU suggestions rather than a smallernumber of enthusiasts.
ii. All employees taking part in implementing the suggestions, again rather than theusual few.
iii. Good improvements that had worked within one team context being spread fromone team to other areas within the business.
As a result, a measure was developed and implemented within each team which recordedfor each team member up to a maximum of six ideas per year that had been developed by theindividual and implemented by the team. Each of these was then written up by the individualin their own learning log. For each idea, the teammember scored one point (up to a maximumof six points per year). For each of these ideas the individual could score a second point if theyhad led the implementation or been a significant team member. A third point was available ifthe idea was then spread to other parts of the business and implemented in at least one otherarea. Hence a maximum of 18 points was available to everyone at every level in the business.The number of points scored then contributed to the individual’s annual bonus.
The results of these three phases of continuous improvement activity are very impress-ive; and what is more they are sustained over an extended period of time. These are shownin Table 4 and are within the realms of safety, improvement activity, productivity, environ-ment, customer complaints, inventory, on time delivery and cost management. What isnoticeable is that they cover a wide range of performance criteria and are over a periodof time, not one-off achievements.
Table 3. Phase 3 – our [new] behaviours (source: Vale).
# Behaviour
1 We always assume positive intent.2 Actively seek to understand and appreciate others, their roles, commitments, and efforts.3 Always have the courage to speak up… and when someone does, listen with humility,
discuss with an open mind, and act.4 When something goes wrong, we focus on the ‘Why?’ not the ‘Who?’.5 Challenge our own and others’:
. Negative assumptions,
. Criticism behind others’ backs,
. Not taking responsibility,
. Apathy,
. Breach of our standards,
… and be open to challenge.
398 P. Hines et al.

Discussion
In this paper, we have shown that Lean change can be successful and can be sustained(Table 4) in at least the case organisation. We can see a clear evolution through a seriesof stages, characterised as follows:
1. Tool-Based Change.2. Systems-Based Change.3. Cultural-Based Change.
This evolutionary journey is depicted in Figures 5 and 6. In Figure 5 we depict threestages with performance moving from highly variable (Tool-Based Change) to stable andslowly improving (Systems-Based Change) to consistent faster improvement (Cultural-
Table 4. Results of continuous improvement activity at Vale.
# Result
1 Over 90% reduction in lost time injuries between 1999 and 2014.2 Employees implemented over 1620 improvement suggestions between 2009 and 2014.3 Average monthly production increased from 2770t/month in 2007 to 3532t/month in 2013 – an
annual increase of over 9000t.4 Energy efficiency improvement of 16% between 2008 and 2013 – a reduction of c.7200t of CO2.5 100% of waste from the Refinery was re-used or recycled in 2014, avoiding landfill, up from 51%
in 2008.6 55% reduction in Refinery attributable customer complaints between 2008 and 2014 through CI
work.7 56% reduction in finished product inventory between 2008 and 2013 – a reduction of nearly 2000
tonnes of finished nickel.8 Reduction in late shipments from more than 120 in 2008 to zero in 2013.9 Maintained control of Refinery costs despite escalating input costs.
Figure 5. Lean maturity stages.
Total Quality Management 399
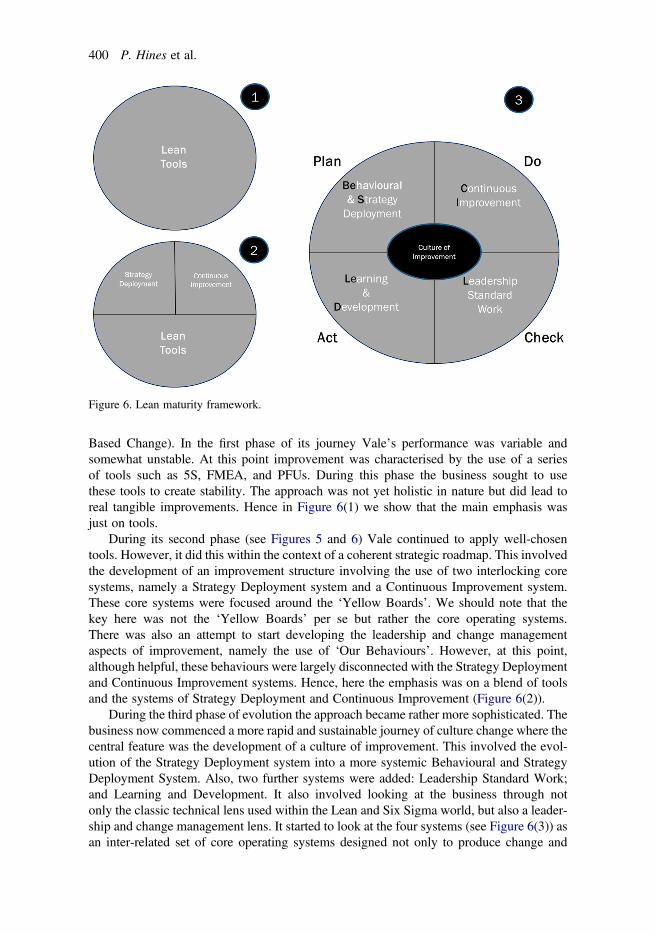
Based Change). In the first phase of its journey Vale’s performance was variable andsomewhat unstable. At this point improvement was characterised by the use of a seriesof tools such as 5S, FMEA, and PFUs. During this phase the business sought to usethese tools to create stability. The approach was not yet holistic in nature but did lead toreal tangible improvements. Hence in Figure 6(1) we show that the main emphasis wasjust on tools.
During its second phase (see Figures 5 and 6) Vale continued to apply well-chosentools. However, it did this within the context of a coherent strategic roadmap. This involvedthe development of an improvement structure involving the use of two interlocking coresystems, namely a Strategy Deployment system and a Continuous Improvement system.These core systems were focused around the ‘Yellow Boards’. We should note that thekey here was not the ‘Yellow Boards’ per se but rather the core operating systems.There was also an attempt to start developing the leadership and change managementaspects of improvement, namely the use of ‘Our Behaviours’. However, at this point,although helpful, these behaviours were largely disconnected with the Strategy Deploymentand Continuous Improvement systems. Hence, here the emphasis was on a blend of toolsand the systems of Strategy Deployment and Continuous Improvement (Figure 6(2)).
During the third phase of evolution the approach became rather more sophisticated. Thebusiness now commenced a more rapid and sustainable journey of culture change where thecentral feature was the development of a culture of improvement. This involved the evol-ution of the Strategy Deployment system into a more systemic Behavioural and StrategyDeployment System. Also, two further systems were added: Leadership Standard Work;and Learning and Development. It also involved looking at the business through notonly the classic technical lens used within the Lean and Six Sigma world, but also a leader-ship and change management lens. It started to look at the four systems (see Figure 6(3)) asan inter-related set of core operating systems designed not only to produce change and
Figure 6. Lean maturity framework.
400 P. Hines et al.

deliver business results, but also to allow the business continuously to improve the way thatit operated by learning, adapting, and changing.
Hence in this third stage, we could envisage an organisation (in this case Vale) using anannual learning cycle where it planned what it was trying to achieve, why it was trying toachieve this, and deploying this information to all teams across the business with an appro-priate set of behaviours (Behavioural and Strategy Deployment system). It then identifiedand undertook a series of planned and emergent improvement activities (ContinuousImprovement system). Managers in the business checked whether this improvement wasaligned to the business and local goals, and whether it was effective. If it was effectivethey gave appropriate reward and recognition. If it was less effective they gave supportto local team leaders and managers (Leadership Standard Work). Finally, time was spenthelping individuals and teams to learn, develop, and spread improvement activity. Thisinvolved the use of personal learning logs for all employees, coaching of individuals,and other mechanisms such as the spread of specific successful improvements from onearea to other areas where these were relevant (Learning & Development system).
We believe this systematic Plan Do Check Act cycle, that we call here ‘BE SCILLED(pronounced “Be Skilled”)’, is at the heart of Vale’s sustained success (Figures 6).
However, we should be aware that such cases, in common with most other case studiesof Lean, are the exception rather than the rule (Bateman, 2001). It would appear that mostorganisations are nowhere near as successful (Repenning & Sterman, 2001). So, what didVale do that others failed to do?
Reviewing the evidence and connecting this with our Lean Maturity Stage model(Figure 5), it would appear that the key thing was that Vale found a way of rapidly andreasonably seamlessly moving from Stage 1 to Stage 2, and then later to Stage 3. Wecould regard this as overcoming two significant hurdles (A and B in Figure 5). Most organ-isations find this hurdling hard or impossible to do.
Hurdle A involved a move from the simple tool-based approach where a series of toolsare used often in isolation. By adopting the ‘Yellow Boards’ and focusing on the StrategyDeployment and Continuous Improvement systems, Vale was able to align its approach andhence create a more systematic and aligned improvement journey. We suggest that mostorganisations adopting Lean fail to overcome this hurdle and hence they use a set oftools that are often in the wrong order or conflict with each other rather than a morealigned approach.
Hurdle B involved both the evolution of these systems as well as the use of two moresystems allowing for a systematic BE SCILLED approach. This involves a considerableamount of leadership. In addition, it also involves the bringing together of often competingmindsets and functional skillsets. Lean people often see the world through a technical andprocess lens, whereas the more people-focused approach seen within the Human Resourcescommunity requires greater levels of emotional intelligence, empathy, and behaviouralawareness. Bringing these together is akin to trying to cross a bridge wherein each ofthese communities starts from either side of the bridge but the bridge lacks a centralpiece, meaning that change is not sustainable. Hurdle B is about linking the bridge togetherand filling the usual gap between the two sides, as shown in Figure 7. This is almost cer-tainly a bigger hurdle than the first one, and one very few organisations overcome.
Academic and management contribution and further research
In this paper, we have explored the Vale case and developed a framework to explain its suc-cessful journey and the hurdles it has sought to overcome. We believe the Lean Maturity
Total Quality Management 401

Stage model and BE SCILLED model have made a small step to help in the development ofa coherent academic Lean theory framework and implementation route map as called for byauthors such as Flynn et al. (1990) and Schmenner and Swink (1998). The approachdemonstrated here helps to move our thinking of Lean as just an operational and tool-based approach forward by giving greater focus to the role of systems, people, andculture, an area of concern for authors such as Seddon and Caulkin (2007). In addition,we believe we have contributed to the debate about how such change can be made moresustainable as called for by authors such as Repenning and Sterman (2001) and Motley(2004). A summary of our contributions is provided in Table 5.
Specifically, these contributions also include a redefinition of Lean away from theapplication of a set of tools to reduce waste to a lifelong journey to create a cultureof improvement based on a rigorous use of four core systems that ensures improvementsare aligned, behaviours are exemplified, improvement is both planned and organic,systems are checked, and people are continually coached and developed. Both thecase study presented here and the discussion around overcoming the two practicalhurdles will also prove useful for practitioners wishing to take their own Lean journeysfurther and make them more sustainable. Indeed, this will help practitioners in theirchoice of implementation approaches (Anand & Kodali, 2010; Bhamu & Sangwan,2014). Within this environment, those following the approach outlined here are alsolikely to increase their levels of staff engagement and show what Lean can achieve ifapplied appropriately as we have seen at Vale.
However, this paper is only a small step and further work is required. In particular, wehave identified the following areas requiring future research:
. Whether the models we have described here are adequate to describe the journey thatother organisations have taken to achieve sustainable enterprise excellence. Wesuggest that this requires both further case studies and wider multi-site quantitativestudy. This will allow for the further refinement and development of the modelswe describe here.
Figure 7. Moving from stage 2 to 3 – hurdle B (Adapted from Shingo Institute).
402 P. Hines et al.

. Whether it is possible to achieve a high level of performance with Lean (for instancetool based) without employing an approach similar to the one identified here at Valeand in the BE SCILLED model.
. Whether it is possible to skip a step and have a revolution rather than an evolution. Itwill be useful to test whether a principles-based approach and behaviour-basedapproach, coupled with tools and systems, can be applied successfully from thestart of a Lean transformation. Will this be quicker? Will this be more effective?Will this be more sustainable? Such research questions are likely to require longitudi-nal case studies.
Conclusion
The early writers on Lean placed a heavy focus on Lean being about the removal of wasteand the application of tools. As we quote above: ‘Muda. It’s the one word in Japanese youreally must know’ (Womack et al., 1990, p. 15). We have shown that this approach,although perhaps helpful in the early stages of a Lean transformation, is unlikely toenable a mature or sustainable Lean journey. Indeed, such a mindset is likely to becomean obstacle in its own right.
Table 5. Contribution of the paper.
Lean Criticism/Gap Contribution Level of contribution
Definition of Lean A definition is provided in theconclusion that is applicable to thetype of sustainable approachdescribed in this paper.
Meaningful.
Coherent LeanTheory
A small step has been made inattempting to describe a frameworkfor Lean enterprise excellence thatcan be implemented in a sustainableway.
Tentative step.
Implementationapproach
A suggested three-step implementationapproach is proposed that has provedsuccessful in the case company.
Good for this single case.Requires further testing andvalidation.
Focus on operationallevel
Stages 2 and 3 of the approach show amove away from the operationallevel to a more strategic perspective.
Demonstration of need forstrategic perspective to reachhigher levels of Lean maturity.
Tools approach Stages 2 and 3 of the approach show amove away from a tools-basedapproach.
Suggests that tools alone are notenough.
Lack of focus onpeople
The case and resulting model show thatpeople are at the heart of successful,mature Lean implementation.
Positions people at the heart ofLean change.
Low-volumeenvironment
Not addressed. None.
Sustainability of Leanimplementation
A case and framework are provided toshow how a mature Leanorganisation can create sustainablesuccess.
Good, but limited to single caseand requires further testing.
Negative peopleaspects
Not directly addressed, but the case anddiscussion reinforce the need toengage people and create a positiveworking environment where peopleare unlikely to feel alienated.
Limited.
Total Quality Management 403

So: Have we got it wrong? Is the traditional waste reduction tool-based Lean approachwrong? The simple answer is yes. As we described above, we see Lean as a lifelong journeyto create a culture of improvement based on a rigorous use of four core systems that ensuresimprovements are aligned, behaviours are exemplified, improvement is both planned andorganic, systems are checked, and people are continually coached and developed.
In this paper, we have contributed to academia and practitioners by presenting a singlecase study. We have also developed a series of models, frameworks and hurdles (specifi-cally Figure 5: Lean Maturity Stages; Figure 6: Lean Maturity Framework and Figure 7:Hurdle B) which make a modest contribution to our understanding of the application ofLean, how to overcome some of the current gaps in the literature, and a true theory forLean. In order to validate this approach, we believe that significant further testing isrequired in a range of industries, and in different cultural settings, through further casestudies and quantitative studies.
AcknowledgementsThe authors would like to express their thanks to Vale, Clydach, Wales; and in particular to Mike Coxand Fiona Buttrey. The authors would also like to thank Simon Grogan of S A Partners.
Disclosure statementNo potential conflict of interest was reported by the authors.
References
Anand, G., & Kodali, R. (2010). Development of a framework for implementation of Lean manufac-turing systems. International Journal of Management Practice, 4(1), 95–116. doi:10.1504/IJMP.2010.029705
And the Shingo goes to. (2000). Business Week, 15 May 2000.Bateman, N. (2001). Sustainability… a guide to… process improvement. Cardiff: Lean Enterprise
Research Centre. Retrieved from https://dspace.lboro.ac.uk/2134/3232Benders, J., & Morita, M. (2004). Changes in Toyota Motors’ operations management. International
Journal of Production Research, 42(3), 433–444. doi:10.1080/00207540310001602883Bhamu, J., & Sangwan, K. S. (2014). Lean manufacturing: Literature review and research issues.
International Journal of Operations & Production Management, 34(7), 876–940. doi:10.1108/IJPOM-08-2012-0315
Bhasin, S., & Burcher, P. (2006). Lean viewed as a philosophy. Journal of Manufacturing TechnologyManagement, 17(1), 56–72. doi:10.1108/17410380610639506
Bidanda, B., Ariyawongrat, P., Needy, K., & Norman, B. (2005). Human related issues in manufac-turing cell design, implementation, and operation: A review and survey. Computers &Industrial Engineering, 48(3), 507–523. doi:10.1016/j.cie.2003.03.002
Bryman, A., & Bell, E. (2015). Business research methods (4th ed). Oxford: Oxford University Press.Christopher, M., & Towill, D. R. (2000). Supply chain migration from Lean and functional to agile
and customisation. Supply Chain Management: An International Journal, 5(4), 206–213.doi:10.1108/13598540010347334
Coffey, D., & Thornley, C. (2006). Automation, motivation and Lean production reconsidered.Assembly Automation, 26(2), 98–103. doi:10.1108/01445150610658068
Cooney, R. (2002). Is ‘Lean’ a universal production system?: Batch production in the automobileindustry. International Journal of Operations and Production Management, 22(10), 1130–1147. doi:10.1108/01443570210446342
Delbridge, R., Turnbull, P., & Wilkinson, B. (1992). Pushing back the frontiers: Management controland work intensification under JIT/TQM factory regimes. New Technology, Work andEmployment, 7(2), 97–106. doi:10.1111/j.1468-005X.1992.tb00024.x
Eden, C., & Huxham, C. (1996). Action research for management research. British Journal ofManagement, 7(1), 75–86. doi:10.1111/j.1467-8551.1996.tb00107.x
404 P. Hines et al.

Eisenhardt, K. M., & Graebner, M. E. (2007). Theory building from cases: Opportunities and chal-lenges. Academy of Management Journal, 50(1), 25–32. doi:10.5465/AMJ.2007.24160888
Flynn, B., Sakkakibara, S., Schroeder, R., Bates, K., & Flynn, J. (1990). Empirical research methodsin operations management. Journal of Operations Management, 9(2), 250–284. doi:10.1016/0272-6963(90)90098-X
Garrahan, P., & Stewart, P. (1992). The Nissan Enigma: Flexibility at work in a local economy.London: Mansell.
Hakim, C. (2000). Research design: Successful designs for social and economic research (2nd ed.).London: Routledge.
Hallam, C. R. A. (2003). Lean enterprise self-assessment as a leading indicator for acceleratingtransformation in the aerospace industry (Doctoral thesis). Massachusetts Institute ofTechnology. Retrieved from https://dspace.mit.edu/handle/1721.1/29216
Hartley, J. (1994). Case studies in organizational research. In C. Cassell, & G. Symon (Eds.),Qualitative methods in organizational research: A practical guide (pp. 208–229). London:Sage.
Hines, P., Found, P., Griffiths, G., & Harrison, R. (2011). Staying Lean – thriving not just surviving(2nd ed.). New York, NY: Productivity Press.
Hines, P., Holweg, M., & Rich, N. (2004). Learning to evolve: A review of contemporary Lean think-ing. International Journal of Operations & Production Management, 24(10), 994–1011.doi:10.1108/01443570410558049
Hogan, B. J. (2009). Sustaining a Lean culture. Manufacturing engineering, November 2009.Retrieved from http://advancedmanufacturing.org/sustaining-Lean-culture/
Holweg, M. (2007). The genealogy of Lean production. Journal of Operations Management, 25(2),420–437. doi:10.1016/j.jom.2006.04.001
James-Moore, S. M., & Gibbons, A. (1997). Is Lean manufacture universally relevant? An investiga-tive methodology. International Journal of Operations and Production Management, 17(9),899–911. doi:10.1108/01443579710171244
Jasti, N. V. K., & Kodali, R. (2015). Lean production: Literature review and trends. InternationalJournal of Production Research, 53(3), 867–885. doi:10.1080/00207543.2014.937508
Kippenberger, T. (1998). Planned change: Kurt Lewin’s legacy. The Antidote, 3(4), 10–12. doi:10.1108/EUM0000000006617
Liker, J. (1996). Becoming Lean. New York, NY: Free Press.Liker, J. (2004). The Toyota Way. New York, NY: McGraw-Hill.Monden, Y. (1983). The Toyota Production System. Portland, OR: Productivity Press.Motley, W. T. (2004). Lean thinking redefines O&M practices. Power, 148(2), 72–75. Retrieved from
https://online.platts.com/PPS/P=m&s=1029337384756.1478827&e=1107551779446.-6756071925796850631/?artnum=20T050s2K011mc34F4ty24_1
Ohno, T. (1988). The Toyota production system: Beyond large scale production. Portland, OR:Productivity Press.
Repenning, N. P., & Sterman, J. D. (2001). Nobody ever gets credit for fixing problems that neverhappened: Creating and sustaining process improvement. California Management Review,43(4), 64–88. doi:10.2307/41166101
Samuel, D., Found, P., & Williams, S. (2015). How did the publication of the book the machine thatchanged the world change management thinking? Exploring 25 years of Lean literature.International Journal of Operations & Production Management, 35(10), 1386–1407.doi:10.1108/IJOPM-12-2013-0555
Schmenner, R., & Swink, M. (1998). On theory in operations management. Journal of OperationsManagement, 17(1), 97–113. doi:10.1016/S0272-6963(98)00028-X
Schonberger, R. J. (2008). Best practices in Lean six sigma process improvement: A deeper look.Hoboken: John Wiley.
Seddon, J., & Caulkin, S. (2007). Systems thinking: Lean production and action learning. ActionLearning: Research and Practice, 4(1), 9–24. doi:10.1080/14767330701231438
Sheridan, J. H. (2004). Growing with Lean. Industry Week, December 21, 2004. Retrieved from http://www.industryweek.com/Lean-six-sigma/growing-Lean
Shingo, S. (1989). A study of the Toyota production system from an industrial viewpoint.(A. P. Dillon, Trans.). Portland, OR: Productivity Press.
Shingo Institute. (2016a). Shingo prize recipients. Retrieved from http://www.shingo.org/awardsShingo Institute. (2016b). The Shingo Model™. Retrieved from http://shingoprize.org/model
Total Quality Management 405

Sohal, A., & Eggleston, A. (1994). Lean production: Experience among Australian organizations.International Journal of Operations & Production Management, 14(11), 35–51. doi:10.1108/01443579410068639
Stake, R. E. (1998). Case studies. In N. K. Denzin, & Y. S. Lincoln (Eds.), Strategies of qualitativeinquiry. 2, (pp. 86–109). Thousand Oaks, CA: Sage.
Stone, K. (2012). Four decades of Lean: A systematic literature review. International Journal of LeanSix Sigma, 3(2), 112–132. doi:10.1108/20401461211243702
Taylor, D., & Brunt, D. (Eds.) (2001). Manufacturing operations. London: Thompson.Tennant, C., & Roberts, P. (2001). Hoshin Kanri: Implementing the catchball process. Long Range
Planning, 34(3), 287–308. doi:10.1016/S0024-6301(01)00039-5van Hoek, R. I., Harrison, A., & Christopher, M. (2001). Measuring agile capabilities in the supply
chain. International Journal of Operations & Production Management, 21(1/2), 126–148.doi:10.1108/01443570110358495
Williams, K., Harlam, C., Williams, J., Cutler, T., Adcroft, A., & Johal, S. (1992). Against Lean pro-duction. Economy and Society, 21(3), 321–354. doi:10.1080/03085149200000016
Womack, J. P., Jones, D. T., & Roos, D. (1990). The machine that changed the world: How Leanproduction revolutionized the global car wars. New York: Rawson Associates.
Yin, R. K. (2009). Case study research: Design and methods (4th ed.). Thousand Oaks, CA: Sage.Zokaei, K., Lovins, H., Wood, A., & Hines, P. (2013). Creating a Lean and green business system.
Boca Raton: CRC Press.
406 P. Hines et al.