Embed Size (px)
Citation preview

Annales Geophysicae (2002) 20: 835–846c© European Geophysical Society 2002Annales
Geophysicae
The Lagrangian structure of ozone mini-holes and potentialvorticity anomalies in the Northern Hemisphere
P. M. James1,2 and D. Peters1
1Leibniz-Institut fur Atmospharenphysik, Kuhlungsborn, Germany2Lehrstuhl fur Bioklimatologie und Immissionsforschung, Technische Universitat Munchen, Am Hochanger 13, D-85354Freising-Weihenstephan, Germany
Received: 12 March 2001 – Revised: 21 November 2001 – Accepted: 18 December 2001
Abstract. An ozone mini-hole is a synoptic-scale area ofstrongly reduced column total ozone, which undergoes agrowth-decay cycle in association with baroclinic weathersystems. The tracks of mini-hole events recorded duringthe TOMS observation period over the Northern Hemisphereprovide a database for building anomaly fields of variousmeteorological parameters, following each mini-hole cen-ter in a Lagrangian sense. The resulting fields provide, forthe first time, a complete mean Lagrangian picture of thethree-dimensional structure of typical ozone mini-holes inthe Northern Hemisphere. Mini-holes are shown to be as-sociated with anomalous warm anticyclonic flow in the up-per troposphere and cold cyclonic anomalies in the middlestratosphere. Ascending air columns occur upstream and de-scent downstream of the mini-hole centers. Band-pass filter-ing is used to reveal the transient synoptic nature of mini-holes embedded within larger scale circulation anomalies.Significant correlations between ozone and Ertel’s potentialvorticity on isentropes (IPV) both near the tropopause andin the middle stratosphere are shown and then utilized byreconstructing the Lagrangian analysis to follow local IPVanomalies instead of ozone minima. By using IPV as a proxyfor ozone, the geopotential anomaly dipolar structure in thevertical characteristic of mini-holes is shown to result froma superposition of two largely independent dynamical com-ponents, stratospheric and tropospheric, typically operatingon different time scales. Hence, ozone mini-holes may beviewed primarily as phenomena of coincidence.
Key words. Meteorology and atmospheric dynamics (mid-dle atmosphere dynamics; synoptic-scale meteorology)
1 Introduction
Ever since the pioneering work of Dobson et al. (1929), thevariability of column total ozone levels and its association
Correspondence to:P. M. James([email protected])
with the passage of weather systems has been a subject offascinating study. Reed (1950) investigated cases where lo-cally strong ozone decrease occurred, and showed that thesesynoptic-scale regions lasted typically only a few days. Suchevents were christened “ozone mini-holes” by Newman etal. (1988). Mini-holes forming on the edge of the Antarc-tic region were investigated by McKenna et al. (1989), whileOrsolini et al. (1998) studied the signature of the NorthernHemispheric storm tracks on the ozone field. Indeed, theyoccur frequently over mid- and high-latitudes of both hemi-spheres during the winter half-year (James 1998a, McCor-mack and Hood, 1997).
The basic dynamics behind mini-hole development havebeen discussed, for example, by James et al. (1997), whoshowed the crucial role played by the vertical motion and di-vergence fields. That mini-holes typically form as transientfeatures over warm air masses in regions of anticyclonic ridg-ing in the troposphere was already known by Reed (1950).As a result, local relative vorticity anomalies show strongpositive correlations with total ozone (Vaughan and Price,1991). This was utilized by Peters et al. (1995), who showedthat the dynamics of vorticity and indeed isentropic poten-tial vorticity (IPV) development could be used as a proxy forozone mini-holes. On the other hand, Petzoldt et al. (1994)have shown that anomalously cold air in the stratosphere isa further prerequisite for the formation of strong mini-holes,as confirmed in the modelling study of James et al. (2000).An extreme example of such a case, recorded over Europeat the end of November 1999, was examined by Allaart etal. (2000). Thus, in the middle atmosphere, in contrast tothe troposphere, IPV exhibits negative correlations with to-tal ozone. Aspects of the vertical structure of ozone min-ima have also recently been studied by Reid et al. (2000),who showed, for example, that backward trajectories endingat ozone minima over Europe typically have very differentsource latitudes depending on the isentropic level at the end:minima near the tropopause height typically have trajectoriesout of the sub-tropics, whereas lower stratospheric minimahave trajectories coming from further polewards.

836 P. M. James and D. Peters: The Lagrangian structure of ozone mini-holes and potential vorticity anomalies
Hence, mini-holes are phenomena which involve the in-terplay between various dynamical factors at different alti-tudes, encompassing a range of spatial and temporal scales.However, except in a limited sense, in some single case stud-ies, a summary description of the general dynamical structureof mini-holes has never been provided observationally untilnow.
In this paper, the mean three-dimensional structure of var-ious meteorological parameters close to ozone mini-holes ispresented in a Lagrangian sense, following the centers of allwintertime mini-holes tracked in a recently produced clima-tology for the Northern Hemisphere (James, 1998b), basedon TOMS satellite observations. The data and the analysismethod used are described in Sect. 2, and the primary resultsfollow in Sect. 3. In Sect. 4, the correlation between ozoneand IPV on different isentropes is investigated in depth forthe special case of mini-holes, and the implications are dis-cussed. A summary is given in Sect. 5.
2 Data and methodology
ECMWF reanalysis data for ten winters (DJF), 1982–83 to1991–92 inclusive, is employed to provide the daily mete-orological fields for this study. The quantities used are thegeopotential, temperature and the full wind field in three-dimensions (zonal, meridional and vertical), each interpo-lated to a reduced resolution grid of 6◦ latitude × 5◦ lon-gitude, adequate for the study of mean synoptic-scale at-mospheric structures. In the vertical, the data are availablefor 17 pressure levels: approximately 11 in the troposphereand 6 in the stratosphere, the highest being at 10 hPa. TheErtel’s IPV data used in the study was calculated at LIAP-Kuhlungsborn from the ECMWF data using a methodologydescribed by Bartels et al. (1998).
The Northern Hemisphere mini-hole climatology of James(1998b) is based on detrended daily total column ozone ob-servations from the Nimbus-7 TOMS instrument, version 7.Over 500 mini-hole events, defined as synoptic-scale ozoneminima at least 70 DU below climate mean levels for therespective location and season, were recorded over the mid-latitudes during the 10 winters. Since many are trackable fora number of days, the above mini-holes contribute a total ofsome 1400 mini-hole days. The daily locations and mini-mum ozone values of their centers were logged and, for thisstudy, interpolated onto the same grid as above.
To build up a set of Lagrangian anomaly fields describ-ing the mean structure of ozone mini-holes, the exact loca-tion of the center of each mini-hole on each day is noted.A large grid array, of hemispheric-spanning dimensions inthe horizontal that uses all 17 vertical levels, upon which theLagrangian fields were accumulated, is centered over this lo-cation. Spherical geometry is taken into account by expand-ing or contracting the zonal direction as a function of thecosine of latitude, since grid-lines of longitude converge to-wards the pole in the original data. Hence, a geometricaladjustment is required to ensure that the longitudinal scale
of the Lagrangian grid is constant and not a function of lat-itude, which is different for each mini-hole. The referencelatitude for this adjustment was chosen to be 52.5◦ N, sincethe majority of mini-holes occur between 45◦ N and 60◦ N.The choice of a reference latitude is somewhat arbitrary andhas no qualitative effect on the results. Its purpose is simplyto provide a reference spatial scale in the zonal direction forall figures that follow in this paper.
The original data is thus interpolated onto the geometri-cally adjusted Lagrangian grid. Respective climatologicalmean fields, relative to geographical location, are subtractedin each case so that anomaly fields can be consistently ac-cumulated. A simple linear weighting scheme, with weightsproportional to “mini-hole intensity in DU minus 70 DU”,is also applied to give more weight to strong mini-holes andless to weaker events, the latter being inevitably more fre-quent. A set of three-dimensional Lagrangian anomaly fieldsare thus built up utilizing all of the available daily mini-holeevents.
To separate the superimposed effects of large-scale wavesand baroclinic transients associated with mini-holes, the re-analysis fields are also subjected to a 2.5 to 6 day band-pass filter, allowing only typical synoptic-scale disturbancesthrough. This band-pass filter has also been applied to theTOMS ozone data to build up a second climatology dataset of mini-holes, based in this case on band-pass filteredozone. This new mini-hole data set is employed in parallelwith the filtered reanalysis data, forming a consistent pairingto compliment the primary analysis pair: non-filtered reanal-ysis data with non-filtered ozone mini-holes. Hence, addi-tional Lagrangian anomaly fields are built up for the synop-tic band-pass filtered data and compared with the full fieldcases.
It is also necessary to synchronize the ozone data sets tothe reanalysis data, since the latter is available to us daily at00:00 UTC, whereas the TOMS instrument logs ozone val-ues close to local noon. Since mini-holes move at a simi-lar speed to baroclinic waves, there could be discrepanciesbetween a mini-hole’s apparent location and its associatedanomaly fields, as seen in the reanalysis data. To solve thisproblem, the tracking information available in the mini-holeclimatology is employed to estimate the positions of eachmini-hole at 00:00 UTC, both before (backwards synchro-nization) and after (forwards synchronization) the local noon.Both estimates are used in the analysis, weighted accordingto which 00:00 UTC reanalysis field is closest in time to thelocal noon in each case. Tests have shown that synchroniza-tion increases the amplitudes of the resulting anomaly pat-terns by some 20% to 30% and produces a more consistentdynamical picture compared with non-synchronized results.
3 The Lagrangian structure of ozone mini-holes
The anomalous Lagrangian distribution of ozone itselfaround ozone mini-holes is illustrated in Fig. 1. The meantotal column ozone anomaly (Fig. 1a) exceeds 100 DU in the

P. M. James and D. Peters: The Lagrangian structure of ozone mini-holes and potential vorticity anomalies 837
Fig. 1. Horizontal cross sections of the Lagrangian mean total column ozone anomaly patterns associated with ozone mini-holes, using(a)non-filtered ozone, contour interval 10 DU, and(b) 2.5 to 6 day band-pass filtered ozone, contour interval 5 DU. Negative contours dashed.The panels span some 60◦ west and east, 25◦ south and north, respectively, of the mini-hole centers (‘C’). The east-west scale is based on areference latitude of 52.5◦ N.
centers of the mini-holes logged in the James’ climatology.The pattern is broadly circular, with the region of negativeozone anomalies encompassing roughly 3000 km, althoughthe line of maximum negative anomaly exhibits a definitiveeastward tilt from south to north. When the band-pass filter-ing is applied (Fig. 1b), a classic synoptic-scale wave trainis revealed. The negative anomaly of around−45 DU asso-ciated with the mini-hole itself is flanked by weak positiveanomalies roughly 30◦ to the west and east, thus building apattern of approximate scale wave number 6. Again, a slighteastward tilt from south to north of the whole pattern is sug-gested.
The anticyclonicity in the troposphere associated withmini-holes is clearly seen in the Lagrangian unfiltered windflow anomaly fields of Fig. 2. In the upper troposphere, aquasi-circular anticyclonic anomaly exists around the mini-hole, with mean horizontal wind anomalies of up to 15 m/s.These anomalies result in a strong ridge in the mean west-erly flow around mini-holes (not shown), while a closed an-ticyclonic cell exists in the lower troposphere. The anticy-clonic anomaly is a deep feature and exists well into thelower stratosphere. A remnant can be seen even at 70 hPa. Atthis level, a cyclonic anomaly is seen northeast of the mini-hole. Higher still, this becomes strongly dominant, with itsamplitude exceeding that in the upper troposphere. Its centertilts westwards with height, eventually sitting over the mini-hole center above 10 hPa.
We note that the statistical significance of these anomalypatterns, and also of most of those that follow in which arecognizable pattern is discussed, is exceptionally high. Re-gions of the patterns that exceed the 99% confidence level,
for example, are not shaded here since if they were, shadingwould cover most of the areas involved, except the near zerolines, of course, thereby detracting from the visual impact ofthe diagrams by becoming monotonous in the literal sense ofthe word.
A set of height-longitude Lagrangian sections of meananomaly fields are shown pairwise in Fig. 3, using full non-filtered data and the synoptic band-pass filtered data.
The full geopotential field anomalies, Fig. 3a, compli-ment the wind flow results above. A positive troposphericgeopotential anomaly, indicating anticyclonicity, coincideswith the mini-hole center. It extends well into the lowerstratosphere, with maximum amplitudes of about+25 damaround 300 hPa, typically just below the local tropopause(note that the Lagrangian averaging procedure yields a meantropopause of all events; typically around 200 hPa in mini-holes, higher than otherwise usual in mid-latitudes). A west-ward tilt with height, a characteristic signature of baroclinicwaves, is evidenced. The equivalent cross section for thenorth-south direction (not shown) also shows a northwardtilt with height, such that the surface anticyclone is typicallysome 10◦ east and 6◦ south of the mini-hole. This correlateswell with the common observation that mini-holes tend toform in the warm sectors of surface cyclones in air massesstreaming northeastwards around a high pressure ridge.
In the middle stratosphere, a strong negative anomaly isseen, approaching−60 dam around 10 hPa (30–35 km alti-tude). This is centered some 5◦ to 10◦ east and 3◦ north ofthe mini-hole center and has a far larger zonal scale, betweenwave numbers 1 and 2, than do the anomalies lower down.This dominant planetary-scale cyclonic flow in the middle

838 P. M. James and D. Peters: The Lagrangian structure of ozone mini-holes and potential vorticity anomalies
Fig. 2. Horizontal cross sections of the Lagrangian mean horizontal wind vector anomaly patterns associated with ozone mini-holes onpressure surfaces at(a) 10 hPa,(b) 30 hPa,(c) 70 hPa and(d) 300 hPa. The length of an equivalent 10 m/s vector is indicated. The panels arescaled as in Fig. 1.
stratosphere is probably an indication that many strong mini-holes reach peak intensity under the edge of the stratosphericpolar vortex, especially at times when the latter is displacedfrom the pole (James et al., 2000).
This is confirmed by comparison with the patterns associ-ated with band-pass filtered geopotential data, Fig. 3b. Syn-optic mid-stratospheric anomalies are almost nonexistent,showing that the cyclonic flow indicated in Fig. 3a must be ofa relatively long time scale. In the troposphere, the synopticanomalies have tightened to a wave number 6 pattern, typi-cal for baroclinic systems. This is in good agreement withthe findings of Mote et al. (1991), who computed point cor-relation maps of ozone with baroclinic disturbances, albeitessentially an Eulerian approach.
The temperature anomaly field shown in Fig. 3c is con-sistent with the geopotential field. A warm anomaly of upto +7 K fills the mid- to lower troposphere, centered some5◦ west of the mini-hole at the surface, again adding weight
to the warm sector observation earlier. The anticyclonic-ity typically leads to a locally high tropopause such that asharp reversal in temperature anomalies is seen. At the meantropopause, a local cold anomaly of about−7 K is formed,but centered somewhat east of the mini-hole. Cold anoma-lies then dominate the stratosphere, exceeding−12 K at near25 hPa. In contrast to geopotential, the temperature anoma-lies show little meridional displacement away from the mini-hole center. However, as with geopotential, the band-passfiltered temperature data yields a similar tightening of zonal-scales in the Lagrangian anomaly pattern, Fig. 3d, and a vir-tual absence of anomalies in the middle stratosphere.
The vertical wind anomaly field, shown in Fig. 3e, revealsa dipole pattern in the east-west direction. On the westernflank of the mini-hole, an anomalous air mass ascent extendsthroughout all regions of the atmosphere visible in this study.Local maxima are seen in the upper troposphere and themiddle stratosphere, where speeds approach+1 cm/s. The

P. M. James and D. Peters: The Lagrangian structure of ozone mini-holes and potential vorticity anomalies 839
Fig. 3. Longitude-height sections of the Lagrangian mean anomaly patterns associated with ozone mini-holes of(a) geopotential,φ, contourinterval 4 dam, and(b) 2.5 to 6 day band-pass filtered geopotential, contour interval 2 dam,(c) temperature,T , contour interval 1 K, and(d)2.5 to 6 day band-pass filtered temperature, contour interval 0.5 K,(e) vertical wind,w, contour interval 0.2 cm/s, and(f) 2.5 to 6 day band-pass filtered vertical wind, contour interval 0.2 cm/s, negative contours dashed. The panels span some 60◦ west and east of the respectivemini-hole centers (‘C’); the horizontal scale based on a reference latitude of 52.5◦ N. SFC refers to the 1000 hPa surface.

840 P. M. James and D. Peters: The Lagrangian structure of ozone mini-holes and potential vorticity anomalies
ascending columns are mirrored downstream of the mini-hole, where an extensive column of air mass descent isseen. In the north-south direction (not shown), the region ofanomalous ascent west of the mini-hole is displaced slightlypolewards of the central latitude, by about 3◦, and exhibits apolewards tilt with height such that maximum stratosphericascent is typically about 6◦ polewards of the maximum tro-pospheric ascent. In contrast, east of the mini-hole, regionsof descent are centered typically around 6◦ equatorwards ofthe central latitude, while the patterns only show a minimaltilt with height.
In the case of band-pass filtered vertical motion, the La-grangian pattern is concentrated in the troposphere. How-ever, qualitative differences here are minimal, since verticalmotion energy is particularly concentrated around synoptictime scales anyway. Quantitatively, the band-pass filteredvertical wind amplitudes are actually greater, by 2 to 3 times,than those of the non-filtered data. This implies that theslowly changing components of the vertical wind fields as-sociated with mini-holes must act contrary to those on shorttime scales, thus tending to dissipate the total column ozoneanomalies generated by synoptic disturbances. In the mid-dle stratosphere, above the ozone maximum layer, descentoccurs on synoptic time scales directly above the mini-holecenters, encouraging a divergent flow in the lower strato-sphere. This leads to a net ozone loss out of the column,since ozone mixing ratios in the divergence layer are muchhigher than lower down, supporting the supposition of James(1997) that such a divergence field must play a significantrole in the generation of mini-holes. However, since mix-ing ratios typically continue to increase slightly immediatelyabove the divergence layer, the role of the stratospheric com-ponent in generating mini-holes is not directly due to the de-scending air masses, but rather due to equatorward advectionin the stratosphere above the mini-hole, as seen in Fig. 2, es-pecially around the 30 hPa level. Since the ozone mixing ra-tio decreases towards the pole at this level, this northwesterlycomponent of the wind advects ozone-poor polar air massesinto the stratospheric region above the ozone mini-hole.
In all cases, the vertical wind anomalies are rather weakclose to the 100 hPa level, indicating that the stratosphericand tropospheric dynamical components relevant for mini-holes are somewhat detached from each other. Note also thatthe columns of ascent are typically centered to the west butnot at the mini-hole center, where they might be expected.This indicates that the eddies on both synoptic and longertime scales must be adding a significant horizontal advectioncomponent to the total advective changes to the ozone col-umn, presumably via the mean southwesterly flow into themini-hole center.
4 Ertel’s isentropic potential vorticity anomalies andozone mini-holes
The Lagrangian structure of Ertel’s IPV anomalies associ-ated with ozone mini-holes is presented on three isentropic
surfaces in Fig. 4. Again, non-filtered results are paired withsynoptic band-pass filtered results. At 330 K (Fig. 4e), repre-senting the uppermost troposphere and near the tropopause,IPV shows a strong positive pattern correlation with total col-umn ozone. The negative IPV anomaly center coincides withthe mini-hole centers, the former being just fractionally fur-ther south, by about 3◦. The IPV anomaly also has a slightlyshorter zonal scale, but this may simply reflect that the ozonepattern is derived from an integration over the total column,inevitably producing a scale-smoothing effect relative to anysingle level. The band-pass filtered IPV anomalies at 330 K(Fig. 4f) also correlate very well with the equivalent ozoneanomalies. The IPV pattern is slightly displaced to the eastand south of the ozone pattern, but exhibits a very similartilting, with the wave train centered further south to the east.
At 400 K, now in the lower stratosphere, the band-pass fil-tered IPV anomalies (Fig. 4d) correlate even more accuratelywith the ozone anomalies. This is perhaps to be expected,since the greatest ozone changes on synoptic time scales oc-cur at around this altitude, where vertical ozone gradientsare largest (James et al., 2000). The non-filtered full IPVanomalies at this altitude (Fig. 4c) show an increased posi-tive IPV region to the northeast of the mini-holes. At 500 K(Fig. 4a), in the middle stratosphere, this region becomesstrongly dominant and expands over the mini-hole, althoughit remains centered some 25◦ east and up to 6◦ north of themini-hole centers. As with geopotential, this is probably asignature of the stratospheric polar vortex. Band-pass filter-ing reveals that the synoptic wave train signal is still presentand in-phase at 500 K (Fig. 4b), although it has become dis-placed northwards by 5◦ to 10◦.
One of the summarizing features of the non-filtered IPVstructures is the reversal of the sign of the IPV-ozone cor-relation between 330 K and 500 K. At 330 K, negative IPVanomalies would be expected to coincide well spatially withtotal ozone minima. At 500 K, positive IPV anomaliesshould coincide with ozone minima, albeit with a possiblespatial phase-shift, as suggested from Fig. 4a. Hence, it isfeasible to replace the tracking data of ozone mini-holes withsimilar data for local IPV minima at 330 K or local IPV max-ima at 500 K, and construct new Lagrangian anomaly fields,now centered on respective IPV anomalies, referred to hereas IPV-blobs. The IPV-blob tracking is based closely on thealgorithms used for mini-hole tracking. An arbitrary IPVthreshold is also set to determine which blobs have sufficientamplitude worth tracking, but optimized to yield roughly thesame total number of trackable events as the mini-holes hadyielded previously. In constructing Lagrangian fields basedon these IPV-blobs, we note that the synchronization modulemust either be switched off (for IPV is naturally already syn-chronized to the reanalysis data) or even inverted, in a sense,when Lagrangian ozone fields are constructed.
To secure the scientific quality of the conclusions that fol-low in this section, only non-filtered IPV-blob analyzes willbe discussed here. This limitation is necessary, since the vari-ability of IPV at 330 K has a different typical time scale tothat at 500 K. As illustrated in Fig. 5, the 330 K IPV spec-

P. M. James and D. Peters: The Lagrangian structure of ozone mini-holes and potential vorticity anomalies 841
Fig. 4. Horizontal cross sections of the Lagrangian mean potential vorticity (IPV) anomaly patterns associated with ozone mini-holes onisentropic surfaces at(a, d) 500 K, (b, e)400 K and(c, f) 330 K. The left-hand panels (a, c, e) use non-filtered data, the right-hand panels (b,d, f) use 2.5 to 6 day band-pass filtered data. Contour interval is 1 IPV unit (1 IPVU= 10−6 Km2/kg s) in panel (a) and 0.2 IPV units in allremaining panels. The panels are scaled as in Fig. 1.
842 P. M. James and D. Peters: The Lagrangian structure of ozone mini-holes and potential vorticity anomalies
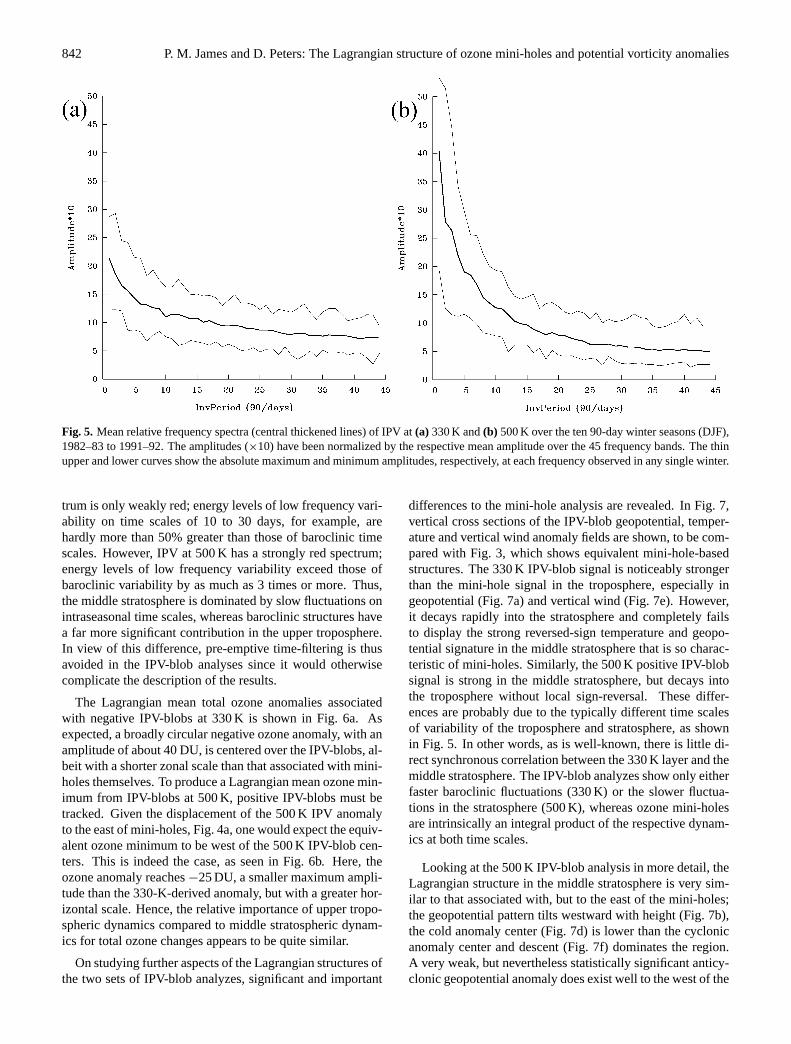
Fig. 5. Mean relative frequency spectra (central thickened lines) of IPV at(a) 330 K and(b) 500 K over the ten 90-day winter seasons (DJF),1982–83 to 1991–92. The amplitudes (×10) have been normalized by the respective mean amplitude over the 45 frequency bands. The thinupper and lower curves show the absolute maximum and minimum amplitudes, respectively, at each frequency observed in any single winter.
trum is only weakly red; energy levels of low frequency vari-ability on time scales of 10 to 30 days, for example, arehardly more than 50% greater than those of baroclinic timescales. However, IPV at 500 K has a strongly red spectrum;energy levels of low frequency variability exceed those ofbaroclinic variability by as much as 3 times or more. Thus,the middle stratosphere is dominated by slow fluctuations onintraseasonal time scales, whereas baroclinic structures havea far more significant contribution in the upper troposphere.In view of this difference, pre-emptive time-filtering is thusavoided in the IPV-blob analyses since it would otherwisecomplicate the description of the results.
The Lagrangian mean total ozone anomalies associatedwith negative IPV-blobs at 330 K is shown in Fig. 6a. Asexpected, a broadly circular negative ozone anomaly, with anamplitude of about 40 DU, is centered over the IPV-blobs, al-beit with a shorter zonal scale than that associated with mini-holes themselves. To produce a Lagrangian mean ozone min-imum from IPV-blobs at 500 K, positive IPV-blobs must betracked. Given the displacement of the 500 K IPV anomalyto the east of mini-holes, Fig. 4a, one would expect the equiv-alent ozone minimum to be west of the 500 K IPV-blob cen-ters. This is indeed the case, as seen in Fig. 6b. Here, theozone anomaly reaches−25 DU, a smaller maximum ampli-tude than the 330-K-derived anomaly, but with a greater hor-izontal scale. Hence, the relative importance of upper tropo-spheric dynamics compared to middle stratospheric dynam-ics for total ozone changes appears to be quite similar.
On studying further aspects of the Lagrangian structures ofthe two sets of IPV-blob analyzes, significant and important
differences to the mini-hole analysis are revealed. In Fig. 7,vertical cross sections of the IPV-blob geopotential, temper-ature and vertical wind anomaly fields are shown, to be com-pared with Fig. 3, which shows equivalent mini-hole-basedstructures. The 330 K IPV-blob signal is noticeably strongerthan the mini-hole signal in the troposphere, especially ingeopotential (Fig. 7a) and vertical wind (Fig. 7e). However,it decays rapidly into the stratosphere and completely failsto display the strong reversed-sign temperature and geopo-tential signature in the middle stratosphere that is so charac-teristic of mini-holes. Similarly, the 500 K positive IPV-blobsignal is strong in the middle stratosphere, but decays intothe troposphere without local sign-reversal. These differ-ences are probably due to the typically different time scalesof variability of the troposphere and stratosphere, as shownin Fig. 5. In other words, as is well-known, there is little di-rect synchronous correlation between the 330 K layer and themiddle stratosphere. The IPV-blob analyzes show only eitherfaster baroclinic fluctuations (330 K) or the slower fluctua-tions in the stratosphere (500 K), whereas ozone mini-holesare intrinsically an integral product of the respective dynam-ics at both time scales.
Looking at the 500 K IPV-blob analysis in more detail, theLagrangian structure in the middle stratosphere is very sim-ilar to that associated with, but to the east of the mini-holes;the geopotential pattern tilts westward with height (Fig. 7b),the cold anomaly center (Fig. 7d) is lower than the cyclonicanomaly center and descent (Fig. 7f) dominates the region.A very weak, but nevertheless statistically significant anticy-clonic geopotential anomaly does exist well to the west of the

P. M. James and D. Peters: The Lagrangian structure of ozone mini-holes and potential vorticity anomalies 843
Fig. 6. Horizontal cross sections of the Lagrangian mean total column ozone anomaly patterns associated with(a) negative IPV-blobs on the330 K isentrope, contour interval 5 DU, and(b) positive IPV blobs on the 500 K isentrope, contour interval 2 DU. Negative contours dashed.The panels are scaled as in Fig. 1.
IPV-blob centers. This suggests that some reversed couplingof the stratosphere onto the troposphere exists, probably onlonger time scales. The nature and horizontal scale of thisgeopotential mode (Fig. 7b) is in close agreement with thecoupled mode found over the European region in an Euleriananalysis by James et al. (2000). In their analysis, the tro-pospheric anticyclone was relatively a stronger feature, sug-gesting that the general Lagrangian mode may be enhancedwhen mapped onto certain geographical regions, especiallyover Europe, or attenuated in certain other regions.
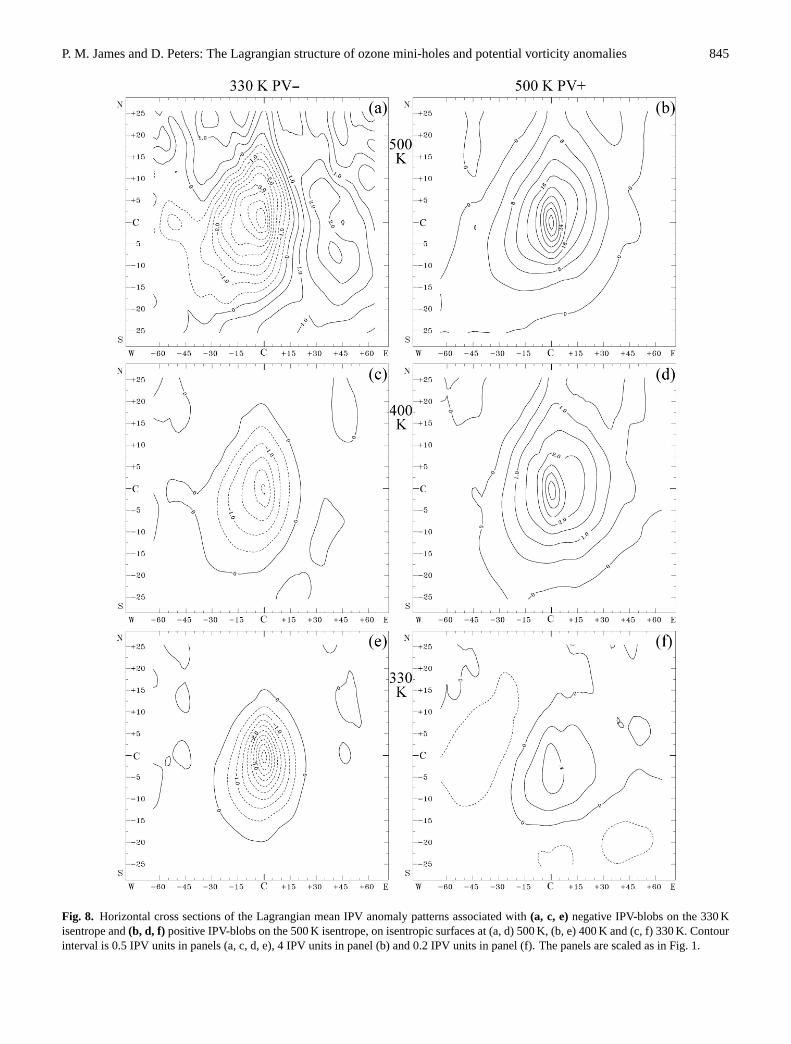
The synchronous detachment of the stratosphere from thetroposphere, as viewed from IPV-blobs, is emphasized inFig. 8, which shows the associated Lagrangian IPV struc-tures themselves at 330 K, 400 K and 500 K, to be comparedwith the mini-hole IPV structures on the left-hand side ofFig. 4. For 330 K IPV-blobs, the negative anomaly center at330 K itself (Fig. 8e) is strong and more compact than thatassociated with vertically integrated total ozone. But the pat-tern remains phase-locked and sign-invariant with height, be-coming embedded in positive IPV anomaly surroundings at500 K (Fig. 8a). Indeed, relative to mean IPV amplitudes oneach respective isentrope, the signal in fact decays rapidlywith height. At 330 K, the peak signal is about 82% of thelocal climatological mean IPV, thus reducing absolute IPVvalues from about 6 PVU to just 1 PVU at the anomaly cen-ter. At 500 K, the peak signal, also around−5 PVU, is hereonly about 12% of the local climatological mean IPV, whichis thus reduced from about 38 PVU to 33 PVU.
For 500 K IPV-blobs, the signal decay on descent towardsthe troposphere (Figs. 8b, d, and f) is especially obvious. At500 K, the peak positive IPV anomaly increases local meanIPV values by some 85%, from 45 PVU to 82 PVU, while
at 330 K the peak positive IPV anomaly is just 0.5 PVU, theaddition of just 8% to local mean IPV values. Thus, the resultis qualitatively the same as above: IPV-blobs have structuresthat simply decay with vertical distance from their centers.
5 Summary
A first statistically significant picture of the mean three-dimensional Lagrangian structure of typical mid-latitudewintertime ozone mini-holes has been presented in this pa-per. Band-pass filtering reveals the transient nature of mini-holes, whose synoptic-scale Lagrangian structures are seento be embedded within significant larger scale anomaly fea-tures. Mini-holes are shown to form in transient waves run-ning over tropospheric anticyclonic ridges, with rising warmair masses on their western flanks and descent to the east,underneath a quasi-stationary region of anomalously coldstratosphere on the cyclonic flanks of the polar vortex. Asa result, mini-holes correlate with negative IPV anomaliesclose to the height of the tropopause and to positive IPVanomalies in the middle stratosphere.
The comparative Lagrangian structures of blobs of nega-tive IPV at 330 K and positive IPV at 500 K show that dy-namical features in the troposphere have little mean syn-chronous correlation with those in the stratosphere. Anoma-lous blobs of IPV are primarily associated with structuresthat decay with distance in the vertical and whose charac-teristic time scales are typically greater in the middle strato-sphere than at lower levels. In contrast, ozone mini-holeshave geopotential structures with strongly characteristic sign

844 P. M. James and D. Peters: The Lagrangian structure of ozone mini-holes and potential vorticity anomalies
Fig. 7. Longitude-height sections of Lagrangian mean anomaly patterns associated with(a, c, e)negative IPV-blobs on the 330 K isentropeand(b, d, f) positive IPV-blobs on the 500 K isentrope. Shown are (a, b) geopotential, contour interval 4 dam, (c, d) temperature, contourintervals 2 K and 1 K, respectively, and (e, f) vertical wind, contour intervals 0.2 cm/s and 0.1 cm/s, respectively, negative contours dashed.The panels are scaled as in Fig. 3.
P. M. James and D. Peters: The Lagrangian structure of ozone mini-holes and potential vorticity anomalies 845
Fig. 8. Horizontal cross sections of the Lagrangian mean IPV anomaly patterns associated with(a, c, e)negative IPV-blobs on the 330 Kisentrope and(b, d, f) positive IPV-blobs on the 500 K isentrope, on isentropic surfaces at (a, d) 500 K, (b, e) 400 K and (c, f) 330 K. Contourinterval is 0.5 IPV units in panels (a, c, d, e), 4 IPV units in panel (b) and 0.2 IPV units in panel (f). The panels are scaled as in Fig. 1.
846 P. M. James and D. Peters: The Lagrangian structure of ozone mini-holes and potential vorticity anomalies
reversals between the troposphere and stratosphere, with as-sociated dynamics that span the above time scale range.
Hence, we conclude that ozone mini-holes are predomi-nantly phenomena of coincidence, requiring the simultane-ous action of two factors on largely different time scales toattain a significant amplitude: tropospheric transient synop-tic activity (warm, anticyclonicity) and appropriate middlestratospheric circulation conditions (cold, polar vortex in-fringement). However, while transient waves in the tropo-sphere do not have any strong simultaneous effect on the po-lar vortex, displacements of the latter appear to enhance an-ticyclonicity slightly under its western flanks on longer timescales, somewhat increasing the potential for mini-hole de-velopment. Thus, our findings are, in good agreement withJames et al. (2000), who showed that the primary coupledmode of atmospheric variability between the middle strato-sphere and upper troposphere, using total column ozone asa further weighting factor, produces anticyclonic ridging onthe western flank of the polar vortex when the latter is shiftedtowards northern Europe. This mode is thereby associatedwith a strong ozone decrease over Europe, directly betweenthe two anomaly centers in the troposphere and stratosphere.While such a mode appears geographically enhanced overthe European region, the associated Lagrangian structuresdiscussed in this paper can be applied generally across themid-latitudes of the Northern Hemisphere. Whether system-atic regional differences in the structures exist remains to betested and should be the subject of a future paper.
Acknowledgement.We wish to thank the German Weather Service(DWD) and German Climate Computing Centre (DKRZ) for pro-viding us with the ECMWF-Reanalysis data and thank our col-leagues, J. Schacht, B. Wecke and J. Bartels for their work in com-puting Ertel’s IPV values from that data. The invaluable workperformed by the Ozone Processing Team at the NASA/GoddardSpace Flight Center, Greenbelt, USA in making the TOMS grid-ded ozone data available to us is greatly appreciated. P. Jameswould like to thank the German Federal Ministry for Education andResearch (BMBF), within the context of its Ozone Research Pro-gramme (OFP), for their financial support of project number 01 LO9510/5.
Topical Editor J.-P. Duvel thanks B. Legras and I. Stachelin fortheir help in evaluating this paper.
References
Allaart, M., Valks, P., van der A, R., Piters, A., Kelder, H., and vanVelthoven, P.: Ozone mini-hole observed over Europe, influence
of low stratospheric temperature on observations, Geophys. Res.Lett., 27, 4089–4093, 2000.
Bartels, J., Peters, D., and Schmitz, G.: Climatological Ertel’s po-tential vorticity flux and mean meridional circulation in the ex-tratropical troposphere – lower stratosphere, Ann. Geophysicae,16, 250–265, 1998.
Dobson, G. M. B., Harrison, D. N., and Lawrence, J.: Measure-ments of the amount of ozone in the Earth’s atmosphere and it’srelation to other geophysical conditions: Part III, Proc. R. Soc.London, A122, 456–486, 1929.
James, P. M.: An interhemispheric comparison of ozone mini-holeclimatologies, Geophys. Res. Lett., 25, 301–304, 1998a.
James, P. M.: A climatology of ozone mini-holes over the northernhemisphere, Int. J. Climatol., 18, 1287–1303, 1998b.
James, P. M., Peters, D., and Greisiger, K. M.: A study of ozonemini-hole formation using a tracer advection model driven bybarotropic dynamics, Meteorol. Atmos. Phys., 64, 107–121,1997.
James, P. M., Peters, D., and Waugh, D. W.: Very low ozoneepisodes due to polar vortex displacement, Tellus, 52B, 1123–1137, 2000.
McCormack, J. P. and Hood, L. L.: The frequency and size ofozone “mini-hole” events at northern midlatitudes in February,Geophys. Res. Lett., 24, 2647–2650, 1997.
McKenna, D., Jones, R. L., Austin, J., Browell, E. V., McCormick,M. P., Krueger, A. J., and Tuck, A. F.: Diagnostic studies ofthe Antarctic vortex during the 1987 Airbourne Antarctic OzoneExperiment: Ozone mini-holes, J. Geophys. Res., 94, 11 641–11 668, 1989.
Mote, P. W., Holton, J. R., Wallace J. M.: Variability in total ozoneassociated with baroclinic waves, J. Atmos. Sci., 48, 1900–1903,1991.
Newman, P. A., Lait, L. R., and Schoeberl, M. R.: The morphol-ogy and meteorology of southern hemisphere Spring total ozonemini-holes, Geophys. Res. Lett., 15, 923–926, 1988.
Orsolini, Y. J., Stephenson, D. B., and Doblas-Reyes, F. J.: Stormtrack signature in total ozone during Northern Hemisphere win-ter, Geophys. Res. Lett., 25, 2413–2416, 1998.
Peters, D., Egger, J., and Entzian, G.: Dynamical aspects ofozone mini-hole formation, Meteorol. Atmos. Phys., 55, 205–214, 1995.
Petzoldt, K., Naujokat, B., and Neugebohren, K.: Correlation be-tween stratospheric temperature, total ozone and troposphericweather systems, Geophys. Res. Lett., 21, 1203–1206, 1994.
Reed, R. J.: The role of vertical motions in ozone – weather rela-tionships, J. Met., 7, 263–267, 1950.
Reid, S. J., Tuck, A. F., and Kiladis, G.: On the changing abundanceof ozone minima at northern midlatitudes, J. Geophys. Res., 105,D10, 12 169–12 180, 2000.
Vaughan, G., and Price, J.: On the relation between total ozone andmeteorology, Q. J. Roy. Met. Soc., 117, 1281–1298, 1991.