Embed Size (px)
Citation preview

The Key Determinantsof Ireland's Economic Success
Turning Transitions Into Prosperity


The Key Determinantsof Ireland's Economic Success
Iryna Piontkivska, Edilberto L. Segura
Chief Economist Edilberto L. SeguraEditor Rina Bleyzer Rudkin
June 2004
In 1999, SigmaBleyzer initiated the International Private Capital Task Force (IPCTF) in Ukraine. Its objective was tobenchmark transition economies to identify best practices in government policies that improve the investment climateand attract private capital. An Action Plan was developed and presented to the Ukrainian government which identifiedthe economic policy actions necessary to improve the investment and business climate in Ukraine, attract additionalflows of private capital to the country; support economic growth, and improve the quality of life for their citizens. In2001, this effort was expanded to all countries of the FSU, and IPCTF ratings for all 15 countries of the FSU were devel�oped. They are available from SigmaBleyzer and The Bleyzer Foundation.
The Bleyzer Foundation was established in 2001 in order to promote the IPCTF framework and help countries implementthe policies necessary to successfully complete transitions to market economy.
The Foundation's Managing Director is Mr. Victor Gekker, who is supported by a team of economists and business ana�lysts. The Advisory Board of The Bleyzer Foundation is chaired by Dr. Edilberto Segura and provides advice and guidanceto the activities of the Foundation.
Table of Contents
Abstract . . . . . . . . . . . . . . . . . . . . . . . . . . . . . . . . . . . . . . . . . . . . . . . . . 2
Short Country Overview . . . . . . . . . . . . . . . . . . . . . . . . . . . . . . . . . . . . . . . . . 2
Introduction . . . . . . . . . . . . . . . . . . . . . . . . . . . . . . . . . . . . . . . . . . . . . . . 3
Macroeconomic Performance . . . . . . . . . . . . . . . . . . . . . . . . . . . . . . . . . . . . . . 5
Real Sector Development . . . . . . . . . . . . . . . . . . . . . . . . . . . . . . . . . . . 5
Ireland's Investment Climate Organized According to the Nine Drivers Framework. . . . . . . . . . . 7
1. Macroeconomic stabilization . . . . . . . . . . . . . . . . . . . . . . . . . . . . . . . 7
Fiscal Policies . . . . . . . . . . . . . . . . . . . . . . . . . . . . . . . . . . . . . . . 7
Monetary Policies . . . . . . . . . . . . . . . . . . . . . . . . . . . . . . . . . . . . . 8
2. Business Liberalization and Deregulation Policies. . . . . . . . . . . . . . . . . . . . . 9
3. Stable and Predictable Legal Environment . . . . . . . . . . . . . . . . . . . . . . . . 13
4. Effective Corporate and Public Governance . . . . . . . . . . . . . . . . . . . . . . . 14
5. Liberalization in Foreign Trade and International Capital Movements . . . . . . . . . . 15
6. Healthy Financial Sector . . . . . . . . . . . . . . . . . . . . . . . . . . . . . . . . . 17
7. Corruption Minimization . . . . . . . . . . . . . . . . . . . . . . . . . . . . . . . . . 17
8. Political Uncertainty Minimization . . . . . . . . . . . . . . . . . . . . . . . . . . . 18
9. Country Promotion . . . . . . . . . . . . . . . . . . . . . . . . . . . . . . . . . . . . 18
Concluding Remarks . . . . . . . . . . . . . . . . . . . . . . . . . . . . . . . . . . . . . . . . . . 18
References . . . . . . . . . . . . . . . . . . . . . . . . . . . . . . . . . . . . . . . . . . . . . . . 20
Appendix 1. Chronological Order of Economic and Institutional Reforms in Ireland . . . . . . . . . . 22
Appendix 2. The Nine Drivers Framework. . . . . . . . . . . . . . . . . . . . . . . . . . . . . . . . 24

Abstract
In late 1980s–early 1990s, Ireland experienced exceptionally high rates of economic growth, greatly surpassing those
in other European countries. Starting in 1990, the Irish economy grew by an average of 6% annually for ten years.
Over the last few years, Ireland has become one of the most attractive countries for foreign investment. Ireland's eco�
nomic success was determined by a number of factors, from sound government policies to independent favorable pre�
conditions for growth. The present Briefing Note purports to determine the key factors of the Irish "economic mira�
cle". The first section of the Note presents an analysis of macroeconomic and structural transformations in Ireland
prior to and after 1987, which is considered a turning point in the country's economic history. The sections that follow
cover government policies in various sectors of economic activity aimed at creating favorable conditions for Ireland's
economic development. The final section presents conclusions and lessons to be learnt from the Irish experience of
economic development.
Short Country Overview
Ireland (Ir.: Eire), or the Republic of Ireland (Ir.: Saorstat Eireann) is a coun�try occupying approximately 83% of the island of Ireland. The island is sepa�rated from Great Britain by St. George's Channel, the Irish Sea, and the NorthChannel. Ireland is longest from north�east to south�west (486 km). The to�tal area is 84,423 sq. km; the independent Republic of Ireland is 70,285 sq.km, while Northern Ireland (part of the United Kingdom of Great Britain andNorthern Ireland) is 14,138 sq. km. The Republic of Ireland is comprised of 26counties in the three historical provinces of Ireland: Leinster, Munster, andConnaught, and three counties of Ulster (Cavan, Donegal, and Monaghan).
In 2003, the population of Ireland was 3,920,000. The population density is52 people per 1 sq. km. An all�time population low was reached in 1961, whenthe country's population amounted to 2.82 million. The capital of Ireland isDublin, with almost a quarter of the country's population residing there. Dub�lin is the trade, political, and social center of the country. Cork, the secondlargest city, has 179,954 inhabitants. Other cities are smaller still: Limerick(79,137), Waterford (44,155), and Dundalk (30,195). The highest populationdensity is in Dublin: 4,098 people per sq. km. From 1926 to 1991, life expec�tancy increased from 57.4 years to 72.3 years for men and from 57.9 years to77.9 for women. The most substantial increases in population took place in1971–1979 and then again in 1991–1996, with a lot of emigrants returningto their homeland.
Ireland gained independence from Great Britain in 1922. Prior to 1949, Irelandwas part of the British Commonwealth of Nations; after that, the independentRepublic of Ireland was proclaimed, and connections with the British Common�wealth ceased. Ireland is a unitary state with a parliamentary form of govern�ment. The head of state is the President, elected by direct vote for seven years,with a limit of two terms. The President has exclusive authority in two impor�tant issues: first, he/she can submit a bill to the Supreme Court to verify its con�stitutionality; second, he/she can refuse dissolution of Parliament to the PrimeMinister if the latter has lost the majority in the lower chamber. Of eight Irishpresidents, six were members of Fianna Fail, the largest party in the country.
2 Copyright © The Bleyzer Foundation, 2004
The Key Determinants of Ireland's Economic Success

The Prime Minister is head of the Government. He/she is proposed by the ma�jority of the Irish House of Representatives and appointed by the President.Having lost support of the said majority, the Prime Minister must resign. TheParliament is two�chamber. The lower chamber, the House of Representatives,consists of 166 members elected by a general vote by all people aged 18 andolder. Elections are based on a system of proportional representation. Parlia�ment is elected for five years; however, it can be dissolved by order of thePrime Minister. The upper chamber, the Senate, consists of 60 members whoare to be elected within 90 days after elections to the lower chamber. 43 areelected by the lower chamber and members of local councils; 6 are elected bythe Trinity College of the Dublin University and the National University of Ire�land; 11 are appointed by the Prime Minister. The House of Representativeshas priority in legislation. All local councils are elected bodies.
The major ports in the country are Dublin and Cork. A well�developed airlinenetwork connects Ireland to Great Britain, Europe, and North America. TheDublin airport is a large international terminal. Transportation to Great Britainand France is ensured by ferries. Ireland possesses a modern digital telecommu�nication network, connecting it directly to 160 countries in the world, includ�ing all of the most important financial centers. Regular messenger services areprovided by the National Postal Service and a number of other companies. Un�til 2002, the national currency was the punt, which was part of the Europeanmonetary system later transformed into the euro zone. On January 1, 2002, Ire�land introduced Euro notes and coins into circulation. The official and busi�ness language is English, although Irish is also a state language.
Introduction
Since independence until the mid�1950s, Ireland's economic developmentwas weak compared to other countries of Western Europe. The government'sattempts to form a viable industry under strict trade restrictions failed andled to general economic stagnation in the country. By the mid�1950s, whenunemployment and emigration from the country reached unprecedented lev�els, the government resorted to radical changes in international trade andcapital movement policies. Ireland started gradually removing trade barriersand actively attracting international capital, aiming to revive economic activ�ity in the country. Over the 1960s and early 1970s, economic growth sped up,though not enough to close the gap in living standards with continental Eu�rope. In 1973, when Ireland joined the European Union, it was still one of thepoorer countries in Western Europe. Gradual economic integration of Euro�pean countries and simultaneous introduction of unified standards of gover�nance and legislation created positive preconditions for economic growth inIreland. However, the government's errors in fiscal policies seriously hinderedeconomic growth in the country.
Ireland achieved truly revolutionary economic success in 1990s, when itseconomy was growing at an average of 6% per year for the whole decade.Western experts referred to this upsurge in economic activity as the Celtic
Copyright © The Bleyzer Foundation, 2004 3
The Key Determinants of Ireland's Economic Success

Tiger phenomenon. Traditionally, the turning point in Ireland's economic his�tory is considered to be 1987, when the government ventured to implement aset of fundamental reforms aimed at stabilizing the economy. First, it imple�mented fiscal reform to cut budget spending and reduce the burden of publicdebt. Tax amnesty greatly expanded the fiscal revenue base; within a year, ithad already brought the first visible results, stabilizing the country's balanceof payments. At the same time, public investments in all social services anddevelopment of human assets, the key national resource, remained substan�tial. Throughout the whole "revolutionary" period (1987–1999) Irelandmaintained strict fiscal discipline. Fiscal revenues were growing faster thanexpenditures, so gradually the fiscal deficit was reduced, and later a surpluswas achieved. Certainly, with fiscal stabilization inflation gradually sloweddown to a level was less than the average for other EU countries. Ireland alsomanaged to obtain significant financial resources from the European struc�tural programs, which were invested in creating a modern infrastructure, sup�porting the country's businesses, and increasing the efficiency of produc�tion. Thus, creating a steady macroeconomic environment with a favorableinvestment climate helped achieve overall conditions for rapid social and in�dustrial progress in the country.
Trade and investment liberalization in the country and within the EuropeanUnion led to unprecedented growth in Irish foreign trade and massive in�flows of foreign direct investments. A surge in exports, with imports re�strained by a low punt rate, resulted in a classic pattern of economic develop�ment under favorable exchange rate conditions. A small island state with noconsiderable natural resources managed to increase its export volumes eighttimes in just over twenty years. In the early 1980s, Ireland's exports were$8.4 billion; in 2000, its merchandise exports reached $77 billion. Tax incen�tives helped create a favorable environment for foreign capital. Substantialinflows of foreign direct investments from a great number of multinational(mostly US) companies to the country contributed to the expansion of indus�trial capacity. In 1997, 1,100 foreign companies operated in Ireland, everytenth of them in the IT sector. The largest world software producers have af�filiate companies and branches in Ireland (Microsoft, Compaq, Intel, Novell,Oracle, Informix, Symantec, Corel, Ericsson, Netscape, etc.).
As a result, according to the Organization for Economic Cooperation and De�velopment (OECD), Ireland's GDP amounted to $122 billion in 2002, or morethan $30,000 per capita, surpassing the United Kingdom, Canada, Germany,France, and many other industrially developed countries. Fifteen years ago,per capita income in the country was less than two thirds of the average in�come in the EU. In late 2002, based on complex empirical calculations, theHeritage Foundation and the Wall Street Journal calculated and publishedthe 2003 Index of Economic Freedom, evaluating social and economic condi�tions in 156 countries. Ireland was ranked fourth on the list.
4 Copyright © The Bleyzer Foundation, 2004
The Key Determinants of Ireland's Economic Success

Macroeconomic Performance
Real Sector Development
From independence to the mid�1980s, Ireland tried without success to findways of speeding up its economic development. During the 1970s and up tomid�1980s, GDP growth in the country was unstable, and its general trend waseven negative. Such dynamics were caused by a large fiscal deficit, rapid con�sumer price growth, and high unemployment rates. Starting in 1987, when thegovernment decided to implement a set of reforms designed to stabilize theeconomy, the trend of economic growth changed dramatically. From 1987 to1994, the Irish economy was growing an average of 5.5% every year; since 1995,GDP growth has accelerated to 9% annually. Besides macroeconomic stabiliza�tion, the key growth factors for the Irish economy were: increased human re�sources, availability of a qualified and relatively cheap labor force, mass inflowsof foreign capital, and the consequent rapid development of hi�tech industriesand the financial sector. A rather fast increase in the number of employed dueto higher employment of women, a rise in net migration, and birth rate growth,together with controlled wage increases and consistent business liberalizationresulted in higher economic potential, lower internal costs, and increased com�petitive strength of the Irish economy.
Figure 1. Economic Growth in Ireland, 1970–2002
Ireland's economic development was accompanied by significant changes inthe structure of the economy. The closeness of economy until the 1960s greatlyinfluenced its production structure. The fact that agriculture remained an im�portant sector, while the industry and services developed relatively slowly, wasthe reason Ireland lagging behind other countries in Western Europe. After join�ing the EU in 19731, the country long remained one of the weakest. By economystructure, Ireland still differs from other EU members. Up until the late 1980s, in�dustrial growth (which later became the key driver for economic growth) was
Copyright © The Bleyzer Foundation, 2004 5
The Key Determinants of Ireland's Economic Success
�2
0
2
4
6
8
10
12
14
1970 1973 1976 1979 1982 1985 1988 1991 1994 1997 2000
GDP Growth (annual %)3 per. Mov. Avg. (GDP Growth (annual %))
1 In 1973, integration of the EU members was at the stage of customs union. Activeimplementation of the program to create a single European market, envisaging adeeper economic integration of the countries, did not start until 1986.

relatively small, and the share of this sector remained virtually unchanged (seeTable 1).
Table 1. Ireland's Economic Structure, 1970–2000
Source: World Development Indicators, 2003
At the same time, the services sector was developing rapidly, which was a di�rect positive result of European integration. The economic boom of the 1990swas accompanied by intensive industrialization. Presently, industry (particu�larly manufacturing) is relatively more important to the Irish economy, com�pared to other developed countries. In 2000, industry accounted for 42% ofIreland's GDP, which is approximately 1.5 times more than in the United King�dom, the USA, France, Belgium, and the Netherlands. The share of services intotal production (55% of GDP) remains slightly lower than in other countrieswith a similar level of development (an average of 70% of GDP).
Table 2. Ireland: Key Macroeconomic Indicators, 1973–2001
The income policy resulted in reduction of ultimate consumption levels inIreland with high rates of economic growth. For comparison, domestic con�sumption decreased from 87% of GDP in 1980 to 62% of GDP in 2000, which ismuch lower than in other developed countries (on average above 80% of
6 Copyright © The Bleyzer Foundation, 2004
The Key Determinants of Ireland's Economic Success
% GDP 1970 1980 1990 2000
By Income
Agriculture 16 12 9 4
Industry 35 36 35 42
Services 49 52 56 55
By Expenditure
Ultimate Consumption 85 87 74 62
Gross Capital Investments 23 27 21 24
Gross Internal Savings 15 13 26 38
Net Exports –8 –14 5 14
aop1973–1980
1981–1986
1987–1990
1991–1994
1995–1998
1999–2001
GDP ($ bn) 13.63 23.37 42.23 56.30 83.65 99.30
GDP Growth, % 4.54 2.32 5.35 5.45 9.50 8.65
Consumer Price Index (CPI), % 16.10 8.08 3.20 2.35 1.78 5.25
Fiscal Revenues, % of GDP 28.05 37.42 37.13 36.43 30.98 27.55
Fiscal Expenditures, % of GDP 38.99 48.28 39.30 38.80 29.70 22.00
Fiscal Balance, % of GDP –10.94 –10.87 –2.18 –2.38 1.28 5.55
Current Account Balance, % of GDP –7.65 –4.63 –0.45 2.53 1.68 –0.80
Net FDI, % of GPD 1.58 0.62 1.15 2.15 9.85 16.75
Net FDI, $ mln 215.02 124.26 540.21 1,211.93 8,752.65 16,321.61
Exports of Goods and Services, $ bn 6.07 12.06 24.45 38.01 73.94 94.39
Imports of Goods and Services, $ bn 7.51 11.93 22.18 32.59 63.11 79.99
Trade Balance, $ bn –1.74 –0.16 2.24 5.61 10.41 14.46
Trade Balance, % of GDP 100.35 105.07 111.68 127.08 153.95 175.72
Official Exchange Rate (IRP/USD) 0.66 1.01 0.82 0.81 0.87 1.10
Unemployment Rate, % 10.50 15.42 14.83 14.50 8.98 4.70

GDP). Such a low level of ultimate consumption given high GDP growth dem�onstrates that external demand is extremely important for the growth of theIrish economy. Net exports reached 14% of GDP in 2000, while 20 years ago ithad a negative input to the national income (–14% of GDP). Savings in Ire�land increased from around 15% of GDP in the early 1970s to a record high38% in 2000. Capital investment dynamics generally reflected those of GDPgrowth: an increase in capital investments in the 1970s changed to a sharpdecline in the 1980s. Over a short period from 1980 to 1986, the share of capi�tal investments dropped from 28% to 16% of GDP; then, capital investmentbegan to gradually increase. The combination of foreign capital inflows andgrowth in domestic savings 7–10 years after the beginning of stabilizationemphasize the complexity and length of the process of investment climateformation and the necessity for consistent, sustainable economic policies.
Ireland's Investment ClimateOrganized According to the Nine Drivers Framework2
Macroeconomic stability and the quality of the institutional environment aremajor determinants of a successful economic development. Government poli�cies and actions that ensure sound macroeconomic stability, defined as long�term stability in prices (domestic stability) and foreign exchange rates (exter�nal stability) are important elements of the investment climate of the country.Efficient business regulation and institutions that enforce it provide for firmsmaking investments, creating jobs, and improving productivity, and thus spureconomic growth and improve standards of living. Presently, Ireland is an exam�ple of the best practices in business regulation and investment climate.
1. Macroeconomic stabilization
Fiscal Policies
In the 1970s and the first half of the 1980s, the Irish government's fiscal policieswere excessively expansionary, leading to a serious fiscal crisis and a slowdownof economic development. At that time, the fiscal deficit amounted to an aver�age of 11% of GDP, which greatly exceeded the sustainability limit. Public debtwas growing rapidly and reached more than 110% of GDP by 1986.
In the early 1980s, the Irish government attempted to balance the fiscal bud�get by raising tax rates; however, these measures were ineffective. A turningpoint was the reforms of 1987, when the government decided to cut fiscal ex�penditures by reducing the number of government officials and improvingthe social insurance system. Simultaneously, a tax amnesty was introduced,which greatly expanded the tax base and tax collections as early as 1988.Thus, the government of Ireland managed to find ways of macroeconomic sta�bilization and public debt reduction. Throughout the whole period since1987, Ireland has maintained fiscal discipline. Fiscal revenues grew fasterthan expenditures, and the fiscal deficit gradually declined from 11% of GDP
Copyright © The Bleyzer Foundation, 2004 7
The Key Determinants of Ireland's Economic Success
2 See Appendix 2 for explanation of the nine investment drivers.

in the first half of the 1980s to 2.2% in 1987–1990. Later, the country man�aged to balance the budget, with the surplus reaching almost 5.6% of GDP in1999–2001. By 2002, public debt decreased to 34% of GDP. Fiscal stabilizationwas undoubtedly the key for the gradual deceleration of inflation, which wasalso one of the factors for stability and growth.
Figure 2. Fiscal Deficit and GDP, 1970–2000
Between 1987 and 2000, Ireland pursued a tight fiscal policy but main�tained a significant level of government investments. The latter was madepossible with support from the EU within the framework of various finan�cial aid programs for less developed EU countries (in particular, the DelorsPackages). From 1989 to 1999, Ireland received more than $50 billion fromthe EU as development aid (2–3% of GDP annually). The country used thesefunds to create a modern infrastructure (building motorways3, hotels, andairports), teach and train government officials, and develop modern indus�tries. These additional funds are believed to have played an important rolein increasing Ireland's attractiveness for foreign investors. The share of cap�ital investment in the government budget in 1995–1996 was 2.3% of GDP,increasing later to 3.3% of GDP in 2000. An urgent need in creating condi�tions for further growth requires large investments in the next years. TheNational Development Plan for 2000–2006 envisages investing more than$24 billion from the budget in developing social and economic infrastruc�ture (43% of total investments), employment and human resources (23%),industry (11%), and regional development programs (12.5%).
Monetary Policies
Unbalanced fiscal policies and an oil crisis in the 1970s provoked sustainablehigh inflation in Ireland that lasted for more than a decade. During this time,consumer prices in Ireland grew at an average rate of 16% annually. Fiscalconsolidation in the second half of the 1980s helped substantially reduce in�flation. From 1987 to 1999, consumer prices were growing by only 2–3% peryear, which is quite low given the high rates of economic growth at that time.
8 Copyright © The Bleyzer Foundation, 2004
The Key Determinants of Ireland's Economic Success
�15
�10
�5
0
5
10
15
1970 1973 1976 1979 1982 1985 1988 1991 1994 1997 2000
Overall Budget Balance Including Grants (% of GDP)
GDP Growth (annual %)
3 Note: In 1986, there were no motorways in Ireland.

In a small and open economy, exchange rate fluctuations greatly affect con�sumer prices dynamics. Until 1986, depreciation of punt to dollar also con�tributed to inflation pressures. At the same time, punt depreciation becameone of the key drivers increasing the competitive strength of the Irish econ�omy and induced a rise in economic activity. In particular, a 12% deprecia�tion of the Irish punt in 1993 led to a rapid increase in GDP growth the follow�ing year. While GDP grew by 2.7% in 1993, the GDP growth rate reachedalmost 6% in 1994.
In 1999, Ireland introduced the common European currency at par with theECU currency basket. Since then, monetary policies have been formulated bythe Central European Bank in Frankfurt. Another additional stimulus for theincreased competitive strength of Ireland's exports was the significant depre�ciation of the Euro to the Dollar in 1999–2000. Euro notes and coins replacedthe Irish punt in January 2002.
Figure 3. Consumer Prices and Exchange Rate, 1970–2001
2. Business Liberalization and Deregulation Policies
One of the most important steps towards a liberal business environment iseasy entry and exit procedures. In 1995, the Task Force on Small Businessand Services produced recommendations that were put in place and resultedin the reduction of business licenses and permits, simplification of informa�tion requirements provided by firms, and streamlining the process of com�pany registration. In particular, the current registration procedure in Irelandis quite simple, permitting registration of a company in less than two weeks.To help foreign investors, the Industrial Development Agency (IDA Ireland)set up "one�stop�shops" that significantly simplified market entry proce�dures. For instance, the number of procedures that are officially required foran entrepreneur to start a business amounts to 3 in Ireland, which comparesvery favorably with the United States (5) and the UK (6). The charts belowshow that Ireland is now one of the best performing countries in the world interms of liberalization of market entry and exit.
Copyright © The Bleyzer Foundation, 2004 9
The Key Determinants of Ireland's Economic Success
0
5
10
15
20
25
1970 1973 1976 1979 1982 1985 1988 1991 1994 1997 20000
0.2
0.4
0.6
0.8
1
1.2
1.4Inflation, Consumer Prices (annual %), left scaleOfficial Exchange Rate (IRP per US$, aop), right scale

Figure 4. Starting Business Indicators (time in days)
Source: Doing business in 2004: Understanding Regulation
Figure 5. Closing a Business Indicators (time in years)
Source: Doing business in 2004: Understanding Regulation
Since the course of protectionist policy was abolished, Irish government has de�veloped a comprehensive FDI promotion strategy that had notable effect on thetax system in the country. The Irish tax system has long been dualistic with lowrates applicable to export sales or manufacturing and internationally�tradedservices, on the one hand, and a high standard rate applicable to the rest of theprivate sector on the other. In the early 1980s, the standard corporate profit taxwas 50%, while a zero (up to 1981) or 10% (after 1981and through the 1990s)tax rate was applied to the export oriented activities mentioned above. Overthe last decade, the government of Ireland has been pursuing a busi�ness�friendly tax policy through the gradual reduction of the tax burden. Ini�tially in the mid�1950s, the main element of Ireland's policy towards FDIpromotion was an automatic tax holiday for foreign manufacturing companieson the profits from all new export sales. The peculiar feature of this fiscal incen�tive was its continuity and certainty — in the late 50s, the tax holiday wasgiven for ten years, but then it was subsequently extended to fifteen years.When introduced in the mid�50s, the tax holiday was set to terminate in 1990.Prior to 1990, however, Ireland was forced by the European Commission to alterthe policy for new firms, as the tax holiday distorted market development.
10 Copyright © The Bleyzer Foundation, 2004
The Key Determinants of Ireland's Economic Success
0
0.5
1.0
1.5
2.0
2.5
3.0
3.5
Belg
ium
Fran
ce
Germ
any
Irel
and
Net
herl
ands
Spai
n
Uni
ted
King
dom
Uni
ted
Stat
es
New
Zeal
and
Ukr
aine
Rom
ania
0
20
40
60
80
100
120Be
lgiu
m
Fran
ce
Germ
any
Irel
and
Net
herl
ands
Spai
n
Uni
ted
King
dom
Uni
ted
Stat
es
New
Zeal
and
Ukr
aine
Rom
ania

Therefore, since 1982, all new firms have been entitled to an automatic preferen�tial corporate tax rate of 10 %, which was applied to all profits and not merely tothose arising from export sales. It is worth mentioning, however, that the termi�nation of the tax holiday was not applied to individual investing firms who hadalready been given tax�holiday status before 1982, and thus were able to hold itafterwards. At that time, the government also committed to keeping the prefer�ential tax regime until 2000, and ten years later this period was extended to2010. In such a way, the government of Ireland kept as much certainty as possi�ble with regards to its fiscal incentives, and this was a great benefit to the invest�ment climate in the country. Still, goods exports are fully exempt of VAT, exceptfor non�EU resident companies. Companies that export 75% or more of their out�put can apply to the Revenue Commissioners for authorization to receive al�most all of their goods and services from Irish and foreign suppliers free of anyVAT. This reduces administration and the need to get a refund of VAT.
Since 1990, the Irish government has been transforming its tax system in order togradually eliminate distortionary targeting of specific sectors. Thus, consistent re�duction of income taxes has been taking place (see Appendix 1 on chronology ofIrish reforms). Starting in 1995, the government has also reduced the corporateprofit tax for small businesses from 40% to 30%. Eventually, corporate profit taxwas cut to 12.5% in 2003, one of the lowest rates in the world (see chart below)4.Taxation of personal income remained considerably higher, though it has been re�duced several times over 1990–2003. Currently, personal income in Ireland istaxed on a progressive scale ranging from 22% to 44%. Back in 1990, personal in�come tax rates ranged from 32% to 56%. Thus, there exists a large gap betweenthe tax rates applied to corporate and personal income, which is deemed to be animportant component of Ireland's economic success.
Figure 6. Corporate Tax Rates (as of Jan, 2003)
Source: Deloitte&Touche
In addition to the preferential tax regime, there are many other incentivesthe Irish government provides in order to reduce the cost of doing businessin the country for foreign companies. Financial support for foreign firms
Copyright © The Bleyzer Foundation, 2004 11
The Key Determinants of Ireland's Economic Success
0
10
20
30
40
50
Irel
and
Uni
ted
King
dom
Belg
ium
Fran
ce
Net
herl
ands
Spai
n
Uni
ted
Stat
es
Ukr
aine
Germ
any
4 Except for qualifying foreign companies, which will enjoy preferential tax rates until2010.

locating in Ireland in the 1950s was primarily in the form of cash grants to�wards the cost of the plant and machinery that would be used to producegoods for export markets. As with the tax holiday, the basis for grant eligibil�ity had to be changed in 1982, so that the grants now apply to all manufactur�ing firms and not merely exporters. Currently, there are four categories ofgrants: capital grants, employment grants, training grants, and R&D grants.While investors are free to choose the location of their investment (subjectto planning considerations), grant aid has become increasingly dependenton investors' willingness to establish operations in the more remote westernand border regions of Ireland, where unemployment is higher and infrastruc�ture is less developed. Screening mechanisms for grant aid purposes aretransparent and do not impede investment, limit competition or protect do�mestic interests. Potential investors are also required to examine the envi�ronmental impact of the proposed project and to meet with Irish Environmen�tal Protection Agency (EPA) officials. The core state body that providesincentives for investors is IDA Ireland. IDA Ireland assesses potential invest�ment projects for eligibility for grant aid; the amount of subsidy or grant aidis determined by negotiation. Grant aid is largely tied to job creation andlinkages with the local economy.
The remarkable economic performance of Ireland was also achieved thanksto fairly liberal Irish labor regulations as compared with most continental EUcountries. The Irish labor force is characterized by a high degree of flexibilityand mobility. It has also remained highly competitive throughout the last de�cade. Much credit should be given to the Irish system of centralized wage de�termination that maintained the supply price of labor at competitive levels.In 1987, the government of Ireland managed to bargain the first "social part�nership" agreement with employers and trade unions envisaging wagegrowth moderation for three years. The government's promise of steady re�ductions in income taxation levels helped to ensure moderate rates of wageincreases. Overall, the government managed to negotiate six "social partner�ship" agreements since 1987, which ensured low wage growth relative to theoverall economic expansion (see chart below).
Figure 7. Real GDP and Average Wage Growth Dynamics in 1990s
Source: World Development Indicators, 2003
12 Copyright © The Bleyzer Foundation, 2004
The Key Determinants of Ireland's Economic Success
0
2
4
6
8
10
12
1993 1994 1995 1996 1997 1998
Wage Growth, %
GDP Growth (annual %)
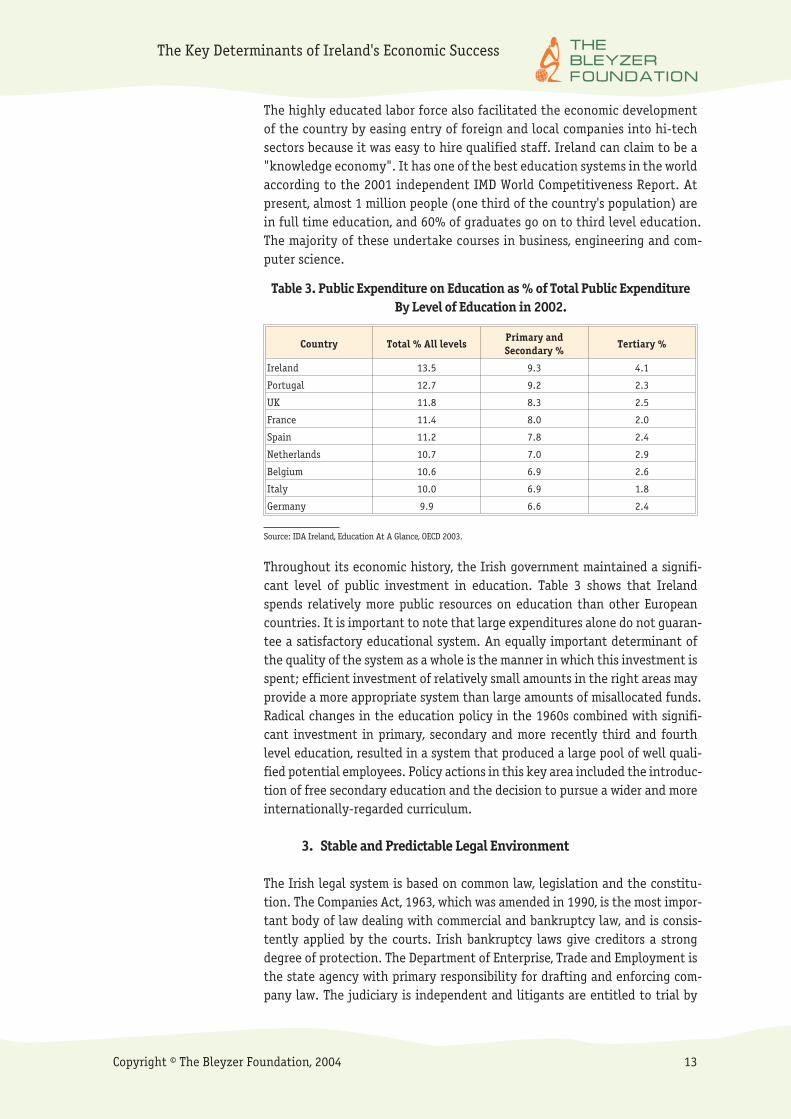
The highly educated labor force also facilitated the economic developmentof the country by easing entry of foreign and local companies into hi�techsectors because it was easy to hire qualified staff. Ireland can claim to be a"knowledge economy". It has one of the best education systems in the worldaccording to the 2001 independent IMD World Competitiveness Report. Atpresent, almost 1 million people (one third of the country's population) arein full time education, and 60% of graduates go on to third level education.The majority of these undertake courses in business, engineering and com�puter science.
Table 3. Public Expenditure on Education as % of Total Public ExpenditureBy Level of Education in 2002.
Source: IDA Ireland, Education At A Glance, OECD 2003.
Throughout its economic history, the Irish government maintained a signifi�cant level of public investment in education. Table 3 shows that Irelandspends relatively more public resources on education than other Europeancountries. It is important to note that large expenditures alone do not guaran�tee a satisfactory educational system. An equally important determinant ofthe quality of the system as a whole is the manner in which this investment isspent; efficient investment of relatively small amounts in the right areas mayprovide a more appropriate system than large amounts of misallocated funds.Radical changes in the education policy in the 1960s combined with signifi�cant investment in primary, secondary and more recently third and fourthlevel education, resulted in a system that produced a large pool of well quali�fied potential employees. Policy actions in this key area included the introduc�tion of free secondary education and the decision to pursue a wider and moreinternationally�regarded curriculum.
3. Stable and Predictable Legal Environment
The Irish legal system is based on common law, legislation and the constitu�tion. The Companies Act, 1963, which was amended in 1990, is the most impor�tant body of law dealing with commercial and bankruptcy law, and is consis�tently applied by the courts. Irish bankruptcy laws give creditors a strongdegree of protection. The Department of Enterprise, Trade and Employment isthe state agency with primary responsibility for drafting and enforcing com�pany law. The judiciary is independent and litigants are entitled to trial by
Copyright © The Bleyzer Foundation, 2004 13
The Key Determinants of Ireland's Economic Success
Country Total % All levelsPrimary andSecondary %
Tertiary %
Ireland 13.5 9.3 4.1
Portugal 12.7 9.2 2.3
UK 11.8 8.3 2.5
France 11.4 8.0 2.0
Spain 11.2 7.8 2.4
Netherlands 10.7 7.0 2.9
Belgium 10.6 6.9 2.6
Italy 10.0 6.9 1.8
Germany 9.9 6.6 2.4

jury in commercial disputes. Ireland is a member of the International Centerfor the Settlement of Investment Disputes, and the Irish Government has beenwilling to agree to binding international arbitration of investment disputes be�tween foreign investors and the state.
4. Effective Corporate and Public Governance
Ireland's corporate governance system fully conforms to internationally rec�ognized standards. According to Irish legislation, company ownership infor�mation is publicly available. Auditing practices are fully compatible with in�ternational standards. Also, there is a fairly restrictive law on shareholderprotection, similar to the one adopted in the UK, which completely excludesoppression of minority shareholder rights.
Public governance in Ireland has been constantly improving in order to meetthe challenges in adapting to a high�growth and pro�market environment inwhich consumer interests are dominant. The public sector and its institu�tions have changed in the past decade and half. The Irish approach to mod�ernization of the public sector during the past decade was based on pru�dence, pragmatism, and an incremental approach to change rather than theadoption of 'big projects'. A recently approved regulatory reform program"Reducing Red Tape" is an important addition to an array of initiatives andpolicies stretching back more than a decade that are intended to increase ef�ficiency, transparency and accountability of the Irish public administration.The main vehicle for these improvements was the launching in 1994 of the"Strategic Management Initiative" (SMI). SMI was the third attempt to re�form the Irish administration. Earlier attempts to reform the public servicewere of value in diagnosing the problems of the public service and raisingawareness about new management approaches and tools. The SMI is re�garded as the first successful reform of the Irish Public Service since the foun�dation of the independent state. One of the reasons for the success of theSMI is that it has had strong support, not only from senior civil servants, butalso from three successive governments. Another reason is that many of itscentral policies were underpinned by legislation adopted in 1997 (the PublicService Management Act, the Freedom of Information Act, and the Commit�tee of the Houses of the Parliament Act). In many ways, the laws provided for�mal structure and content to informal and heterogeneous procedures andpractices. As a result of the implemented reforms, public administration hasbecome much more efficient. The fact that total employment in the publicsector grew by only 5.1% in 1989–99 when the level of economic activity in�creased enormously provides indirect evidence of the increased efficiency ofpublic administration in Ireland. An important step towards efficiency ofpublic administration was implementation of the e�government initiative.Ireland has invested in new information and communication technologies toimprove transparency and delivery of government services. Earlier existingstate agencies' office infrastructure was replaced with a countrywide virtualprivate network, which covers the entire government sector.
14 Copyright © The Bleyzer Foundation, 2004
The Key Determinants of Ireland's Economic Success

5. Liberalization in Foreign Trade and International CapitalMovements
In the late 1950s, Ireland abandoned its protectionist policy and began inte�grating into the global economy. Until the mid�1960s, Ireland had a highlyprotected economy with some of the highest rates of effective protection ofany economy in the world. Reductions in tariffs began in 1966 as a conse�quence of the Anglo�Irish Free Trade Area Agreement. In 1973, Ireland joinedthe European Union (or European Economic Community), which at that timewas effectively a customs union. Following a five�year adjustment after Ire�land joined the EEC, the process of tariff reduction was eventually completedin 1978. Starting in 1986, the process of deepening the level of economic inte�gration by means of the Single Market Initiative began. Creation of the Sin�gle Market within the borders of the EU assumed removal of all non�tariff bar�riers to trade such as border controls, national�specific product standards,etc. In 1993, foreign exchange control regulations were completely abol�ished, and Ireland became a member of the WTO in 1995.
Today Ireland is one of the most open economies (trade turnover was 175%of GDP in 2000). Currently, there are no restrictions on inward investment,foreign trading, or the repatriation of capital and profits of foreign compa�nies based in Ireland. The Central Bank of Ireland controls and approves allforeign investment flows, repatriation of profits and dividends, althoughthis regulation is just a formality for monitoring purposes rather than a capi�tal control instrument.
Trade and investment liberalization in the country resulted in great increasein Ireland's foreign trade and large foreign capital inflows. From the early1980s to 2000, rapid growth of exports, with imports moderated by the lowpunt exchange rate, created a classic pattern of economic development underfavorable exchange rate conditions. During the 20�year period, this small is�land state with no considerable natural resources managed to increase its ex�ports by eight times. In the early 1980s, Ireland exported goods for $8.4 bil�lion; in 2000, its exports of goods reached $77 billion. Today, most exportproducts are in several hi�tech sectors (namely, IT and the pharmaceutical in�dustry), while twenty years ago textiles and apparel was the major industrialproduct in the country's export structure. For historical and geographical rea�sons, Great Britain remains Ireland's major trade partner, despite the fact thatexports have diversified considerably over the last twenty years. In 1983,Great Britain's share in the country's foreign trade turnover was 38% of ex�ports and 45% of imports; in 2000 these figures were 24% and 36%. At thesame time, the US' share of Irish exports almost doubled (from 10% in the early1990s to 18% in 2002), which can be attributed to the presence of numerousAmerican companies in Ireland.
Depreciation of the Irish currency led to leveling off and then quite stronggrowth of the current account balance, which remained at 2–3% of GDP in the1990s. In Ireland, the dynamics of the key components of the current account issomewhat unusual, because foreign multinational companies dominate the
Copyright © The Bleyzer Foundation, 2004 15
The Key Determinants of Ireland's Economic Success
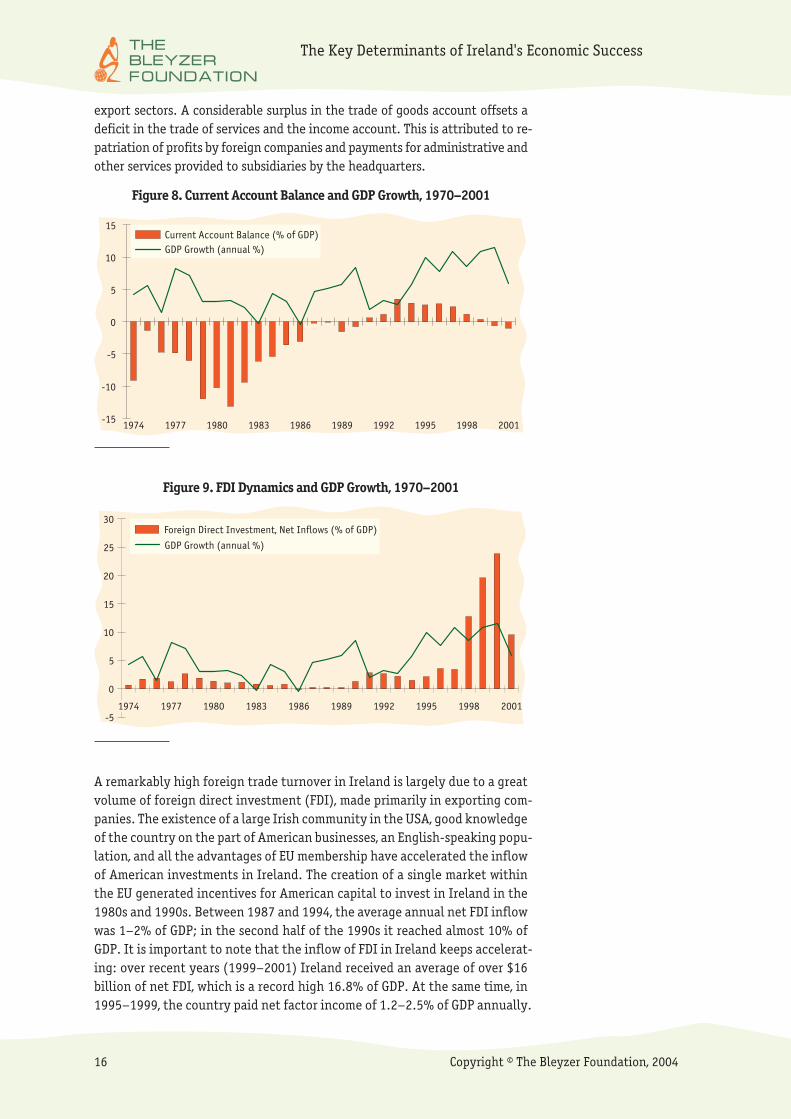
export sectors. A considerable surplus in the trade of goods account offsets adeficit in the trade of services and the income account. This is attributed to re�patriation of profits by foreign companies and payments for administrative andother services provided to subsidiaries by the headquarters.
Figure 8. Current Account Balance and GDP Growth, 1970–2001
Figure 9. FDI Dynamics and GDP Growth, 1970–2001
A remarkably high foreign trade turnover in Ireland is largely due to a greatvolume of foreign direct investment (FDI), made primarily in exporting com�panies. The existence of a large Irish community in the USA, good knowledgeof the country on the part of American businesses, an English�speaking popu�lation, and all the advantages of EU membership have accelerated the inflowof American investments in Ireland. The creation of a single market withinthe EU generated incentives for American capital to invest in Ireland in the1980s and 1990s. Between 1987 and 1994, the average annual net FDI inflowwas 1–2% of GDP; in the second half of the 1990s it reached almost 10% ofGDP. It is important to note that the inflow of FDI in Ireland keeps accelerat�ing: over recent years (1999–2001) Ireland received an average of over $16billion of net FDI, which is a record high 16.8% of GDP. At the same time, in1995–1999, the country paid net factor income of 1.2–2.5% of GDP annually.
16 Copyright © The Bleyzer Foundation, 2004
The Key Determinants of Ireland's Economic Success
�15
�10
�5
0
5
10
15
1974 1977 1980 1983 1986 1989 1992 1995 1998 2001
Current Account Balance (% of GDP)GDP Growth (annual %)
�5
0
5
10
15
20
25
30
1974 1977 1980 1983 1986 1989 1992 1995 1998 2001
Foreign Direct Investment, Net Inflows (% of GDP)
GDP Growth (annual %)

The adequacy of direct investments and payments of factor income empha�sizes the importance of the development factor in attracting foreign directinvestments.
Large volumes of FDI inflow into the Irish economy were the result of the gov�ernment's consistent policies concerning foreign investments, especially inthe sector of information technologies. In addition, the volume of FDI ingreenfield projects is much higher in Ireland than in other countries. Thiscan also be explained by the fact that the actions of the Irish governmentproved that it can fulfill its commitments and implement coordinated andconsistent foreign investments policies, thus winning investors' trust.
6. Healthy Financial Sector
Ireland's banking and financial sector is both advanced and generally com�petitive. The Irish financial system has experienced a series of changes overthe past decade. New legislation has been introduced to allow more competi�tion between different types of financial services organizations. Conse�quently, there exists a very sophisticated banking environment, which offersmany sources of financing to organizations doing business in Ireland.
Ireland has attracted a number of foreign banks through its InternationalFinancial Services Center (IFSC) located in Dublin. In 1987, the Irish govern�ment established the IFSC in an attempt to broaden the financial services in�dustry in Ireland. Institutions qualifying for IFSC status (a key criterionwas that activities be carried out with non�residents and in non�Irish cur�rencies) were offered a preferential 10% corporate tax rate. In 1998 the gov�ernment, under pressure from the European Commission, agreed to phaseout IFSC corporate tax incentives. The main activities of IFSC institutionsinclude international banking, corporate treasury, insurance and reinsur�ance, fund management, asset financing, custody and administration ser�vices, and back�office operations. The Irish Stock Exchange (ISE), whichhas operated independently of the International Stock Exchange of the UKsince 1995, provides a market for the purchase and sale of negotiable securi�ties, mostly Irish equities and government bonds.
Since May 2003, the Single Regulatory Authority (SRA) has been responsiblefor both prudential supervision and consumer protection across the entire fi�nancial services industry. Establishment of the SRA improved the efficiencyof the sector because the regulation of financial services was earlier done bymany different bodies.
7. Corruption Minimization
Corruption is not a serious problem for foreign investors in Ireland. The princi�pal Irish legislation relating to anti�bribery and corruption includes the PublicBodies Corrupt Practices Act, 1889, the Prevention of Corruption Act, 1906 thePrevention of Corruption Act, 1916 and the Prevention of Corruption (Amend�ment) Act, 2001, which make it illegal for Irish public servants to accept bribes.
Copyright © The Bleyzer Foundation, 2004 17
The Key Determinants of Ireland's Economic Success

The "Ethics in Public Office Act, 1995" provides for the written annual disclo�sure of interests of people holding public office or employment.
8. Political Uncertainty Minimization
Since 1987, Ireland has shown unique consistency in pursuing market reforms,regardless of the political forces who won the elections. The government de�clares the course for reform as its long term strategy — the National Develop�ment Plan — usually developed for a six�year time span.
9. Country Promotion
In 1988, the Industrial Development Authority (IDA) was re�established. Itwas first established in 1949 to promote industrial development and develop�ment of the export capacity of the country. The Agency was given increasingpowers to provide grant aid to the manufacturing industry. Currently, IDAIreland is the primary government agency with responsibility for the promo�tion of foreign direct investment into Ireland and the development of the ex�isting base of overseas companies. Government promotional agencies haveselectively targeted certain areas of industry, in particular those that pro�duce sophisticated and high value�added products and services. IDA Irelandalso has responsibility for attracting foreign companies to Dublin's Interna�tional Financial Services Center (IFSC). IDA Ireland maintains offices in NewYork, Boston, Chicago, Los Angeles, San Jose, and Atlanta, as well as at loca�tions in Europe and Asia.
Concluding Remarks
Ireland's economic success in recent decades was determined by favorable pre�conditions on the one hand and efficient government policies on the other. Amost important external element of the Irish success was EU membership,which sharply increased competition, expanded markets, and spurred productiv�ity growth. Many countries had favorable conditions in these decades, thoughnot all of them managed to take advantage of it. A decisive impulse took placein 1987, when the government managed to significantly improve public fi�nances, though the rates of economic growth leapt forward seven years later.For more than thirty years, the Irish government worked on improving the in�vestment climate, implementing a number of institutional reforms. In the longterm, these reforms became an impetus to form a favorable business environ�ment and stable macroeconomic situation, which created good overall condi�tions for economic growth.
The Irish economic growth in the 1990s was propelled by two groups offactors:
18 Copyright © The Bleyzer Foundation, 2004
The Key Determinants of Ireland's Economic Success

Internal Factors:
1. Fiscal stabilization and consistent fiscal policies aimed at reducing thetax burden;
2. Consistent policies in controlling wage growth, based on mutual under�standing between the government, trade unions, and employers (theprinciple of Social Partnership);
3. Trade and investment liberalization;
4. Creating a favorable business environment in the country and simplify�ing business entry and exit requirements;
5. Creating an efficient public governance system through regulatoryreform;
6. Sound policies aimed at attracting foreign direct investments. Most im�portantly, the policies for attracting direct investments remained unin�terrupted for fifteen years;
7. Substantial long�term investment in education, resulting in a relativelyyoung, inexpensive, and well�educated labor force.
External Factors:
1. EU accession and economic assistance from the EU to developinfrastructure;
2. Rapid development of information technologies all over the world;
3. A large Irish diaspora in the USA.
Copyright © The Bleyzer Foundation, 2004 19
The Key Determinants of Ireland's Economic Success

References
CIA World Factbook. Ireland's Profile.http://www.cia.gov/cia/publications/factbook/index.html
European Institute. 1999. Reflections on the Irish Experience of EUStructural Fun Development Aid.
IMF. 2000. Ireland: Selected Issues and Statistical Appendix.IMF Staff Country Report No. 00/99
Industrial Development Agency (IDA) Ireland website materials.
OECD (Organization for Economic Co�Operation and Development).Regulatory Reform in Ireland: Enhancing Market Opennes ThroughRegulatory Reform. OECD Reviews of Regulatory Reform, April 2001.
McMahon, F. 2000. The Celtic Tiger. The National Post, January 19, 2000.
Morisset, J. 2003. Tax Incentives. Viewpoint Note # 25, January 2003.The World Bank.
National Competitiveness Council. 2003. Annual Competitiveness Report2003, Dublin.
O'Neill, H. 2000. Ireland's Economic Transition: The Role of EU RegionalFunds� and the Other Factors. Occasional Paper No. 1, Institute of EconomicResearch, Ljubjana.
SigmaBleyzer. 2002. The Bleyzer Initiative: Completing the EconomicTransition in FSU Countries, SigmaBleyzer
SigmaBleyzer, 2001. Accelerating the Flow of International Private Capitalto Ukraine, Houston, April 2001.
Walsh, B. 2000. The Role of Tax Policy in Ireland's Economic Renaissance.Department of Economics, National University of Ireland.
Walsh, B. 1999. The Irish Economic 'Miracle', New Economy, vol.6, no. 4.
Wetzel, H. 2003. Ireland Country Commercial Guide FY 2004, U.S.Commercial Service.
World Bank. 2004. Doing Business in 2004: Understanding Regulation.World Bank, Washington, DC.
20 Copyright © The Bleyzer Foundation, 2004
The Key Determinants of Ireland's Economic Success

"Ирландия: Успех стабилизации и промышленной политики.Аналитическая записка". 2000 (октябрь), Фонд "Бюро экономическогоанализа", Москва
Ушаков, Константин. "А трилистник растет круглый год", Журнал "CIO"http://www.cio�world.ru/analytics/review/31707/
Copyright © The Bleyzer Foundation, 2004 21
The Key Determinants of Ireland's Economic Success

Appendix 1. Chronological Order of Economic andInstitutional Reforms in Ireland
Year Action
1947 A customs free zone was created at Shannon Airport
1949Industrial Development Authority (IDA) of Ireland was established given increasing pow�ers to provide aid to the manufacturing industry.
1956Export profit tax relief (EPRT) was introduced to promote development of export�ori�ented manufacturing. Foreign manufacturing companies were provided an automatic taxholiday on the profits from all export sales.
1958Restrictions on inward investment were removed by the repeal of the Control Manufac�tures Act (enacted in the mid 30s)
1963Adoption of the Company Act (amended 1990), the most important body of law dealingwith commercial and bankruptcy law
1966 The Anglo�Irish Free Trade Agreement was passed.
1969
Publication of Report of Public Services Organization Review Group (Devlin). It presenteda series of recommendations to permit the administration to cope with new demandsgenerated by the creation of a European welfare state providing more services to a widerarray of citizens. It concentrated on key functional elements, the most important ofwhich was a separation of policy making from implementation and service delivery func�tions. However, the reform initiative failed achieving only piecemeal results.
1973 Ireland joined the European Economic Community (the first enlargement)
1978 The process of tariff reduction was completed
1982All new firms were entitled to an automatic preferential corporate tax rate of 10 %,which has applied to all profits and not merely those arising from export sales.
1984
Government White Paper, Serving the Country Better. It advocated greater decentraliza�tion, improved budgetary management and greater mobility across departments of toplevel administrators. However, the basic structural changes envisaged by the programwere not implemented.
1986 New Judicial Review Procedures introduced.
1987
Fiscal consolidation (public expenditures were cut significantly: public sector wage billwas put down through reduction of the number of public employees)
Establishment of International Financial Services Centre (IFSC) in an attempt to broadenthe financial sector industry. Institutions qualifying for IFSC status (a key criterion wasthat activities be carried out with non�residents and in non�Irish currencies) were of�fered a preferential 10% corporate tax rate.
The 1st social partnership agreement was stricken which in essence, entailed an ex�change of wage moderation in return for tax�cuts. The government, trade union andbusiness agreed to limit wage increases to preserve international competitiveness of Irishexports.
1990
Tax rates were reduced (corporate profit tax (CPT) for residents from 43% to 40%; per�sonal income tax (PIT) from 32% to 30% (standard) and from 56% to 53% (top).
The 2nd social partnership agreement
1991Competition Act. The Act establishes a competition authority. The Act was later amendedand strengthened in 1996 by the introduction of criminal offences and penalties.
1992Personal income tax (PIT) further reduced from 30% to 27% (standard) and from 53% to48% (top).
1993Foreign exchange control regulations were completely abolished.
The 3rd social partnership agreement.
1994
Strategic Management Initiative (SMI) launched. Regarded as the first successful reformof the Irish Public Service since the foundation of the independent state. Eight initia�tives formed the core of SMI. Four were aimed at improving customer service and deliveryof policies (in particular, Quality services for customers; Simplification of administrativeprocedures and regulatory reform; Open and transparent service delivery; Effective man�agement of cross�cutting issues.) Another four initiatives were aimed at internal im�provements of the administration (in particular, Devolving authority and accountability;New approaches to human resource management; More effective financial management,and Improved use of information technology to meet business and organizational needs.)The program was based mainly on a 'bottom�up' approach to reform.
22 Copyright © The Bleyzer Foundation, 2004
The Key Determinants of Ireland's Economic Success
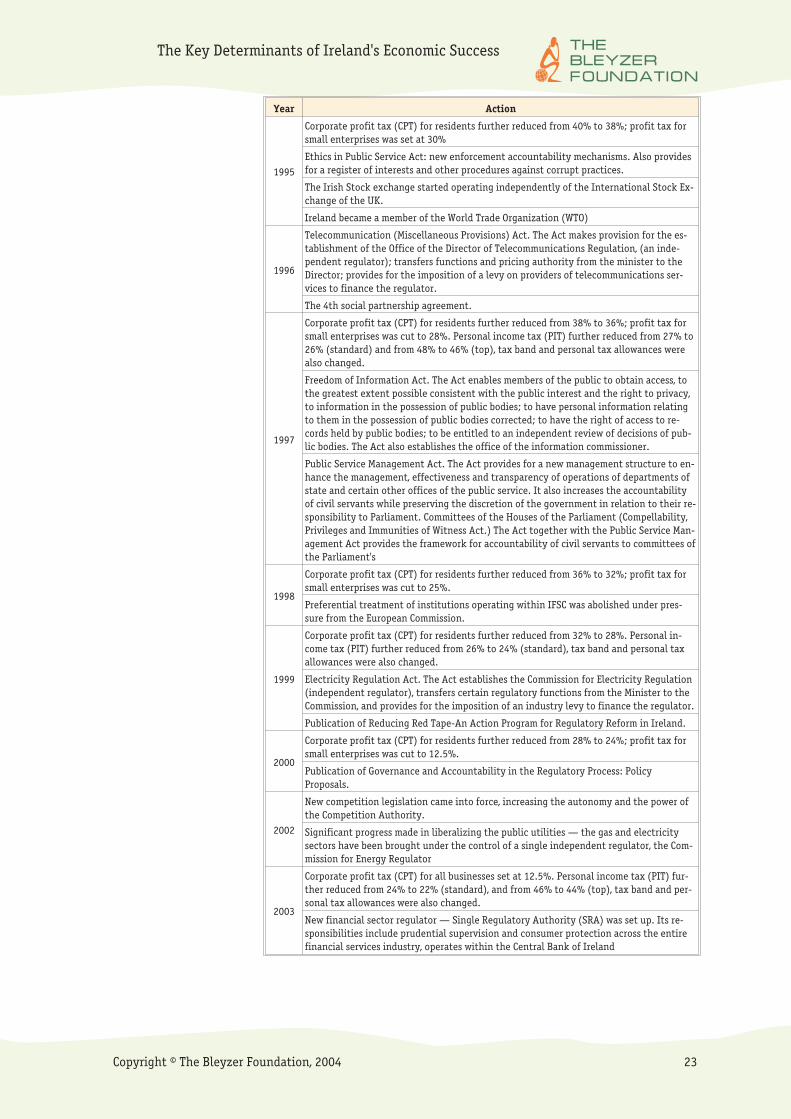
Year Action
1995
Corporate profit tax (CPT) for residents further reduced from 40% to 38%; profit tax forsmall enterprises was set at 30%
Ethics in Public Service Act: new enforcement accountability mechanisms. Also providesfor a register of interests and other procedures against corrupt practices.
The Irish Stock exchange started operating independently of the International Stock Ex�change of the UK.
Ireland became a member of the World Trade Organization (WTO)
1996
Telecommunication (Miscellaneous Provisions) Act. The Act makes provision for the es�tablishment of the Office of the Director of Telecommunications Regulation, (an inde�pendent regulator); transfers functions and pricing authority from the minister to theDirector; provides for the imposition of a levy on providers of telecommunications ser�vices to finance the regulator.
The 4th social partnership agreement.
1997
Corporate profit tax (CPT) for residents further reduced from 38% to 36%; profit tax forsmall enterprises was cut to 28%. Personal income tax (PIT) further reduced from 27% to26% (standard) and from 48% to 46% (top), tax band and personal tax allowances werealso changed.
Freedom of Information Act. The Act enables members of the public to obtain access, tothe greatest extent possible consistent with the public interest and the right to privacy,to information in the possession of public bodies; to have personal information relatingto them in the possession of public bodies corrected; to have the right of access to re�cords held by public bodies; to be entitled to an independent review of decisions of pub�lic bodies. The Act also establishes the office of the information commissioner.
Public Service Management Act. The Act provides for a new management structure to en�hance the management, effectiveness and transparency of operations of departments ofstate and certain other offices of the public service. It also increases the accountabilityof civil servants while preserving the discretion of the government in relation to their re�sponsibility to Parliament. Committees of the Houses of the Parliament (Compellability,Privileges and Immunities of Witness Act.) The Act together with the Public Service Man�agement Act provides the framework for accountability of civil servants to committees ofthe Parliament's
1998
Corporate profit tax (CPT) for residents further reduced from 36% to 32%; profit tax forsmall enterprises was cut to 25%.
Preferential treatment of institutions operating within IFSC was abolished under pres�sure from the European Commission.
1999
Corporate profit tax (CPT) for residents further reduced from 32% to 28%. Personal in�come tax (PIT) further reduced from 26% to 24% (standard), tax band and personal taxallowances were also changed.
Electricity Regulation Act. The Act establishes the Commission for Electricity Regulation(independent regulator), transfers certain regulatory functions from the Minister to theCommission, and provides for the imposition of an industry levy to finance the regulator.
Publication of Reducing Red Tape�An Action Program for Regulatory Reform in Ireland.
2000
Corporate profit tax (CPT) for residents further reduced from 28% to 24%; profit tax forsmall enterprises was cut to 12.5%.
Publication of Governance and Accountability in the Regulatory Process: PolicyProposals.
2002
New competition legislation came into force, increasing the autonomy and the power ofthe Competition Authority.
Significant progress made in liberalizing the public utilities — the gas and electricitysectors have been brought under the control of a single independent regulator, the Com�mission for Energy Regulator
2003
Corporate profit tax (CPT) for all businesses set at 12.5%. Personal income tax (PIT) fur�ther reduced from 24% to 22% (standard), and from 46% to 44% (top), tax band and per�sonal tax allowances were also changed.
New financial sector regulator — Single Regulatory Authority (SRA) was set up. Its re�sponsibilities include prudential supervision and consumer protection across the entirefinancial services industry, operates within the Central Bank of Ireland
Copyright © The Bleyzer Foundation, 2004 23
The Key Determinants of Ireland's Economic Success

Appendix 2. The Nine Drivers Framework
A study by SigmaBleyzer5 identified the most important measures that a Gov�ernment can take up to improve the business environment and attract for�eign direct investments. The study reviewed 50 countries around the worldand carried out statistical analyses to identify the policy that could have thegreatest impact on the flows of FDI. Through benchmarking, it also identifiedbest practices in economic reforms in a number of successful developingcountries. Also, a model was built to predict the flows of foreign direct invest�ments that a country could receive based on the implementation of thesekey "policy" investment drivers. The study concluded that "first generationreforms" — macroeconomic stabilization, achieved by sound fiscal and mone�tary policies — are essential pre�conditions to achieving a favorable busi�ness climate and attracting foreign direct investments. But they alone arenot sufficient to improve the business environment and achieve increases ininternational capital inflows. Within this macroeconomic framework, a num�ber of "second�generation" reforms are needed. Our benchmarking statisti�cal analyses and business surveys indicated that a significant portion of thevariations in foreign direct investments group of 50 developing countriescould be explained by nine economic policy drivers. Furthermore, studiesshowed that whereas there was a high correlation between the nine policydrivers and the flows of FDI, there was also a low correlation between FDIflows and the "natural characteristics" of a country (e.g. geographical loca�tion, country size, population, etc.). These key investment drivers were thefollowing, in order of priority:
(1) Macroeconomic stabilization
(2) Business liberalization and de�regulation policies
(3) Stable and Predictable Legal Environment
(4) Effective Corporate and Public Governance
(5) Liberalization in Foreign Trade and International Capital Movements
(6) Healthy Financial Sector
(7) Corruption Minimization
(8) Political Uncertainty Minimization
(9) Country Promotion
24 Copyright © The Bleyzer Foundation, 2004
The Key Determinants of Ireland's Economic Success
5 The Bleyzer Initiative: Completing the Economic Transition in FSU Countries, SigmaBleyzer 2002.See also “Accelerating the Flow of International Private Capital to Ukraine”, Houston,April 2001.


Headquarters123 North Post Oak Lane, Suite 410Houston, Texas 77024, USATel: +1 (713) 621�3111Fax: +1 (713) 621�4666E�mail: [email protected]
Kyiv Office, Ukraine21, Pushkinskaya Street, Suite 40
Kyiv 01004, UkraineTel: +380 (44) 244�94�87Fax: +380 (44) 244�94�88
E�mail: [email protected]
www.bleyzerfoundation.com