Embed Size (px)
Citation preview

ARTICLE IN PRESS
Journal ofVisual Languages & ComputingJournal of Visual Languages and Computing
16 (2005) 119–152
1045-926X/$
doi:10.1016/j
$Part of th
Swiss Federa�CorrespoE-mail ad
www.elsevier.com/locate/jvlc
The JOpera visual composition language$
Cesare Pautasso�, Gustavo Alonso
Department of Computer Science, Swiss Federal Institute of Technology (ETHZ),
ETH Zentrum (HRS G7), 8092 Zurich, Switzerland
Received 1 January 2004; received in revised form 1 August 2004; accepted 1 August 2004
Abstract
Composing Web services into a coherent application can be a tedious and error-prone task
when using traditional textual scripting languages or emerging XML-based approaches. As an
alternative, complex interactions patterns and data exchanges between different Web services
can be effectively modeled using a visual language. In this paper, we discuss the requirements
of such an application scenario and we fully describe the JOpera Visual Composition
Language. An extensive set of visual editing tools, a compiler and a debugger for the language
have been implemented as part of the JOpera system with the goal of providing a true visual
environment for Web service composition with usability features emphasizing rapid
development and visual scalability.
r 2004 Elsevier Ltd. All rights reserved.
Keywords: Visual composition languages; Web services; JOpera; Data flow
1. Introduction
Service composition is a form of software composition that is starting to becomewidespread with the establishment of Web services technologies [1–3] and service-oriented architectures [4–7]. Although the concept and the potential advantages of
- see front matter r 2004 Elsevier Ltd. All rights reserved.
.jvlc.2004.08.004
is work is supported by grants from the Hasler Foundation (DISC Project No. 1820) and the
l Office for Education and Science (ADAPT, BBW Project No. 02.0254/EU IST-2001-37126).
nding author. Tel.: +411 632 0879; fax: +41 1 632 1425.
dresses: [email protected] (C. Pautasso), [email protected] (G. Alonso).

ARTICLE IN PRESS
C. Pautasso, G. Alonso / Journal of Visual Languages and Computing 16 (2005) 119–152120
software composition have been widely known for a long time [8–10], until recentlythere were still many factors limiting the adoption of composition in the softwaredevelopment process: an underdeveloped market for reusable components, difficultinteroperability between different component frameworks, and a lack of viablecomposition languages.
With the introduction of Web service technologies, many of the interoperabilityproblems have been addressed through standardization. Furthermore, the switchfrom components to services can potentially help to establish a larger market as thesoftware components to be integrated are now maintained by service providersdealing with all of the dependencies and deployment issues and guaranteeing acertain quality of service [11].
In this paper, we present our contribution to the development of a viablecomposition language. In this area, many approaches to service composition haverecently been proposed, spanning from the extension of traditional programming orscripting languages [12] to new, ad hoc languages [13], including XML-based processmodeling languages [14,15] as well as visual programming languages [16].
Concerning the limitations of traditional programming languages when applied tocoarse-grained composition, already in [17] the case for a separate ‘‘glue’’ languageto coordinate the individual components was presented. Furthermore, referring tothe old impedance mismatch problem between programming languages anddatabases [18], it has been argued that a similar problem exists with Webservices [13]. Although more and more tools are being developed to address someof these issues, interacting with such coarse-grained units of compositions byexchanging complex XML documents is still cumbersome with ordinary program-ming languages.
Our alternative approach towards a language for composition at a higherlevel of abstraction originates from the workflow area [19], where processmodeling languages and related tools have been evolving to support thecomposition of Web services [20]. Given the abstract nature of processes,which, as opposed to other modeling techniques, still retain clear and well-definedexecution semantics, they would seem to be an appropriate model for composingcoarse-grained services in the time dimension [21]. Both the emerging BusinessProcess Execution Language for Web Services (BPEL4WS [14]) and the competingBusiness Process Modeling Language (BPML [15]) specifications use an XML-basedsyntax to represent the processes, which define how the Web services are composed.It should be noted that some efforts are currently concentrated on automatingsome of the tasks involved in composing services residing at different location andplatforms by leveraging semantic annotations in their interface descriptions [22].Hence, an XML syntax appears to be well suited for supporting automaticservice composition. Nevertheless, we would like to emphasize that no matterwhether a Web service composition has been manually constructed by a humanprogrammer, or matching services have been connected automatically usingadditional semantics, a visual surface language, which can be used to give acomplementary, visual representation of the result, is of fundamental importance toenable its understanding.

ARTICLE IN PRESS
C. Pautasso, G. Alonso / Journal of Visual Languages and Computing 16 (2005) 119–152 121
Thus, one such aspect that can play a big role in facilitating the development ofcomplex processes over Web services is visual composition. To explore this aspect indetail, in this paper we discuss in depth the visual language used in JOpera, ourresearch platform for visual (Web) service composition [23]. As first presented in [24],the JOpera Visual Composition Language (JVCL) is based on the notion of process,defined by data flow and control flow graphs. With a simple syntax, the languageoffers the following features: conditional execution, failure handling, optional-typesafety, implicit (list based) and explicit iteration, nesting and recursion, as well as thevisual specification of basic XML data manipulations and of late binding throughreflection. The JOpera visual development environment supports the user in rapidlybuilding processes from a library of existing component services and in monitoringand debugging their execution. We have not only developed an integrated set of toolsfor component library management, automatic layout of graphs, static and dynamic-type checking, process compilation, execution profiling, analysis and optimization,but have also successfully tried the system in a number of small enterpriseapplication integration projects.
The paper is structured as follows. In Section 2, we give some background on Webservices and their composition based on processes. The full syntax and semantics ofthe JVCL are presented with examples in Section 3 (basic data and control flowfeatures) and Section 4 (advanced iteration, reflection and XML constructs), which isfollowed by the description of the JOpera visual development environment(Section 5) emphasizing its visual scalability features. In Section 6 we presentrelated work and in Section 7 we conclude the paper.
2. Web services composition
The JVCL can work with many different types of software components. Webservices are, however, the most relevant one at this stage. Hence, in this section webriefly discuss the most important aspects of Web services that facilitate compositionthrough a visual language.
2.1. A brief overview of Web services
Web services are being standardized around a number of specifications that covera wide variety of issues, from the most basic ones, like interface description orcommunication, to rather specialized aspects like virtual interfaces or securitycertificates. For the purposes of this paper, we are interested only in the most basicaspects: how to contact a Web service, how to define the interface of a Web service,and where to find the definitions of available Web services. These three aspects—transport, interface description, and directory services—constitute the key elementsof the architecture of Web services [25]. The architecture follows a client/servermodel and includes a service requester (the client, or entity that invokes a Webservice), a service provider (the server, or the entity that implements the Web service),and a service registry (that acts as a name and directory service). This architecture is

ARTICLE IN PRESS
C. Pautasso, G. Alonso / Journal of Visual Languages and Computing 16 (2005) 119–152122
supported by three specifications: simple object access protocol (SOAP) [1] fortransport, web services description language (WSDL) [2] for service description, anduniversal description, discovery and integration (UDDI) [3] for service location anddiscovery.
2.1.1. Service location and discovery
An important element of a visual composition tool is an extensive library ofcomponents that the designer can use to drag and drop into the composed system. Inthe past, this has been difficult to provide given the wide variety of interfaces andproperties of the components involved. With Web services this becomes much easiersince all of them follow a similar pattern. Hence, the problem is no longer how torepresent many different interfaces but where to find and how to store a collection ofinterfaces for Web services to be used as components. In here, we benefit from thefact that a similar problem appears with Web service interfaces and a solution hasbeen provided. Thus, in JOpera we will assume that Web services are described in aregistry of the form defined by the UDDI specification.
UDDI defines (1) how to describe a service including information about the entityproviding the service, the nature of the service, and technical data on the service, and(2) how to interact with a repository (a registry) that contains such information. Theregistry entries contain three types of information: white, yellow and green pages.The white pages contain generic information about the service provider (address,contact person, etc.). The yellow pages include categorization information thatallows the registry to classify the service. The green pages contain information aboutthe services interface and pointers to the service provider (where the actual WSDLinterface definition can be found). Interaction with the registry typically involvesregistration and lookup of services. Registration is the procedure whereby new servicedescriptions are added to the registry. Lookup corresponds to queries sent by servicerequesters in search for the right services. Other forms of interaction aresubscriptions, notifications, validation, etc. Finally, it should be noted that UDDIregistries are Web services themselves and all of the above interactions are definedwith WSDL interfaces and occur through the exchange of messages encoded usingthe SOAP protocol.
2.1.2. Service interface description
As with UDDI, Web services offer the advantage that they use a common syntaxfor describing interfaces of components. JOpera takes advantage of this fact toautomatically process this interface information obtained through an UDDI registrywhile importing it into its library of available components. Furthermore, as theinternal JOpera processes can themselves be published as Web services, theircorresponding interface description is automatically generated by JOpera. For thesepurposes, JOpera supports and can process service descriptions in WSDL.
A WSDL service description is an XML document that contains both an abstractdescription of a service and a concrete description of how to contact it, includingwhat protocols are needed to interact with that service. The abstract descriptionincludes types (commonly XML types [26]), messages, operations that combine

ARTICLE IN PRESS
C. Pautasso, G. Alonso / Journal of Visual Languages and Computing 16 (2005) 119–152 123
messages into simple interactions, and interfaces grouping operations into a singlecoherent description of an abstract service. The concrete description includesbindings that specify what transport protocol is to be used for each interface and theformat of each message, endpoints that specify the network address for the binding,and services grouping together all the endpoints and bindings. JOpera uses thisinformation in two ways. With the abstract description, JOpera can create visualrepresentations of the operations of a Web service and make them available forcomposition. It also uses the type information for static-type checking and automaticparameter matching, to facilitate composition. The concrete description is used bythe run-time engine of JOpera to actually invoke a Web service.
2.1.3. Service interaction protocol
JOpera interacts with Web services using SOAP. SOAP specifies messages asdocuments encoded in XML divided into two parts: header and body. Both theheader and the body can be subdivided into blocks. Header blocks carry informationpertaining to the interaction: e.g., security, authentication, and transactional context.Body blocks store the data used in the interaction, e.g. which procedure is beingcalled, the values for each individual parameter. SOAP also defines bindings toactual transport protocols, which specify how a SOAP message is transmitted.
2.2. Process-based composition
Our approach to modeling the composition of independent but relatedservices is based on the notion of process. A process defines the structure of anapplication built by linking a set of tasks with control and data flow dependencies.The component tasks can represent either service invocations (activities) or calls toother processes (sub-processes). All the information necessary to execute a task isderived at runtime to support a form of late binding, where the actualimplementation of a service is located at the latest possible moment based onconstraints imposed on the task.
With the JVCL and thanks to JOpera’s flexible runtime execution kernel, it ispossible to model and execute processes built with software components and servicesaccessible through a wide variety of invocation mechanisms. In addition toinvocations of standards-compliant Web services, a JOpera component can, forexample, represent: the execution of a UNIX or Windows command line in theoperating system shell; a remote procedure call or method invocation; a jobsubmitted to a batch scheduling system of a cluster of computers; an SQL query tobe sent to a database; and an XSL style sheet transformation [27] to be applied tosome XML data packet. Furthermore, to model fine-grained operations, smallscripts written in Java can be efficiently embedded directly in the process.
In general, a component task models the execution of an operation which mayrequire some input data and may produce a set of output results. In the case ofactivities representing the invocation of a Web service, each input parametercorresponds to a part of the SOAP request message, while each output parameter isextracted from the SOAP response. For activities modeling UNIX or Windows

ARTICLE IN PRESS
C. Pautasso, G. Alonso / Journal of Visual Languages and Computing 16 (2005) 119–152124
applications, the input parameters are used to build the command line used to startthem and the values of the output parameters are extracted from the dataprinted by the application to standard output. Also a process has input and outputparameters, in order to exchange data with the user starting it or with otherprocesses.
In JOpera, data parameters may contain values of any data type encoded asstring. Optionally, the user may associate a type identifier to a parameter andturn on the static-type checking facilities of the development environment.This way, connections between parameters of mis-matching data types will berejected.
The connections between the input and output parameters are described in thedata flow graph of the process. From the data flow graph, it is possible to derive theprocess’ control flow graph, which defines the partial order of execution of thecomponent tasks. Similar to data-driven data flow languages, tasks cannot be starteduntil all of their data dependencies are satisfied [28]. Unlike in traditional data flowmodels, we include an explicit description of the control flow of a process for thefollowing reasons. First of all, the control flow graph is useful to give the user anoverview about the content of a process also including the order of execution of itstasks. Additionally, it allows users to specify control flow dependencies that cannotbe automatically derived from the data flow. Finally, also by editing the control flowgraph, users can add exception handling tasks and annotate some tasks withconditions to model alternative execution paths. The development environmentenforces the appropriate editing constraints to keep the control and data flow graphsconsistent.
JOpera stores the various services and existing processes to be composed in alibrary of reusable components. JOpera provides a set of tools to manage thiscomponent library. For example, the user can look up external services by browsingthrough an UDDI registry and import their interfaces in the library. This is done bytransforming the WSDL interface descriptions into the JVCL visual notation: eachservice’s operation is imported as a separate activity whose input and outputparameters match the corresponding parts of the request and response messages. Ifnecessary, additional activities are created for XML data manipulation to encodeand decode the content of such messages.
3. Basic Features of the JVCL
This section introduces the syntax and semantics of the basic features of the JVCL,describing the visual representation of processes and their data flow and control flowstructure. This graphical notation is used both during the design phase to developthe processes and at runtime, augmented with color coded information, to monitorthe state of the execution of the processes.
This basic notation is extended with more advanced features in the followingsection, covering iteration constructs, XML data types, visual comments andreflection.

ARTICLE IN PRESS
ActivitySubProcess
Process
Activity
Service
SubProcess
Process
Process
Fig. 1. Syntax definition for the activity and the sub-process.
C. Pautasso, G. Alonso / Journal of Visual Languages and Computing 16 (2005) 119–152 125
3.1. Processes and tasks
A process is composed of tasks. As shown in Fig. 1, a task is drawn as a box withits name inside. An activity box has a single border; boxes for sub-processes have adouble border to indicate nesting. Furthermore, the name of the service to beinvoked or the process to be called can also be displayed in the task box. If necessary,e.g., to reduce clutter, the user can decide to hide this additional information. Giventhe abstract nature of most services and to keep the notation as simple as possible,we have chosen not to use icons in addition to names to illustrate the tasks’operations.
The tasks of a process are linked by data flow and control flow dependencies,therefore the structure of a process can be programmed by drawing two directedgraphs. The nodes of these graphs represent the tasks and their data parameters. Theedges represent control flow or data flow dependencies.
3.2. Data flow syntax definition
The data flow graph defines how the data is exchanged between theparameters of the various tasks of the process. The nodes of the graph representthe process, its tasks and their parameters. The solid edges represent data flowtransfers.
As previously described, tasks are associated with a set of input andoutput data parameters. Input parameters are used to pass data to a task about tobe started. Output parameters contain the results returned from the task once itsexecution has finished. This property is visually represented in the data flow graphsyntax, as the tasks are connected with incoming edges to their input parameters.Conversely, outgoing edges connect tasks to their output parameters. It should benoted that these edges are not removable, since there cannot exist a parameter boxdisconnected from its task. To complement the parameter’s name, it is possible toshow also its type inside the same box. The user may choose to display thisadditional information, e.g., to resolve type mismatches. Similar to tasks, alsoprocesses have input and output parameters. However, to improve readability bygiving a higher degree of freedom for the graph layout, the parameters of a processare linked to two separate shapes representing the input and output interface of theprocess.
Data flow connections between parameters define how the data is transferredbetween them: a data flow binding is represented as an edge going from an output

ARTICLE IN PRESS
Process Input Parameter
Process Input
Process Output Parameter
Process Output
Activity Input Parameter
Activity Output Parameter
Activity Input Parameter (2)
Activity
SubProcess Input Parameter
SubProcess Output Parameter
SubProcess
Constant Value
Process - DataFlow
Fig. 2. Data flow graph syntax example.
C. Pautasso, G. Alonso / Journal of Visual Languages and Computing 16 (2005) 119–152126
parameter box of a task to an input parameter box of another task. Furthermore,as shown in Fig. 2, also constant values can be connected to input parameters oftasks.
The same parameter can be connected by multiple data bindings. For example,to copy data produced by one task to multiple ones, one output parameterbox can be linked to multiple input boxes. Multiple incoming bindingsare also allowed by using a last writer wins semantic: the value of the inputparameter will be overwritten each time a task finishes and, at the end of the process,its value will be a copy of the output parameter attached to the task finishing last.This rule has been chosen considering that multiple incoming bindings are mostlyused in loops or when the control flow merges from two or more alternativeexecution paths. The same rule is also applied to the output parameters of processes.More specifically, if such a parameter is bound to a constant value or directly to aprocess input parameter, this binding is evaluated first, as the process is started. Theadditional bindings are evaluated after their corresponding tasks have finished.Thus, the value of the process output parameter will be overwritten only if thesetasks will have finished their execution, as specified by the conditions in the controlflow graph.
ARTICLE IN PRESS
Activity1
Program1
Activity2
Program2
Activity3
Program3SubProcess1
Process2
SubProcess2
Process1
Activity4
Program2
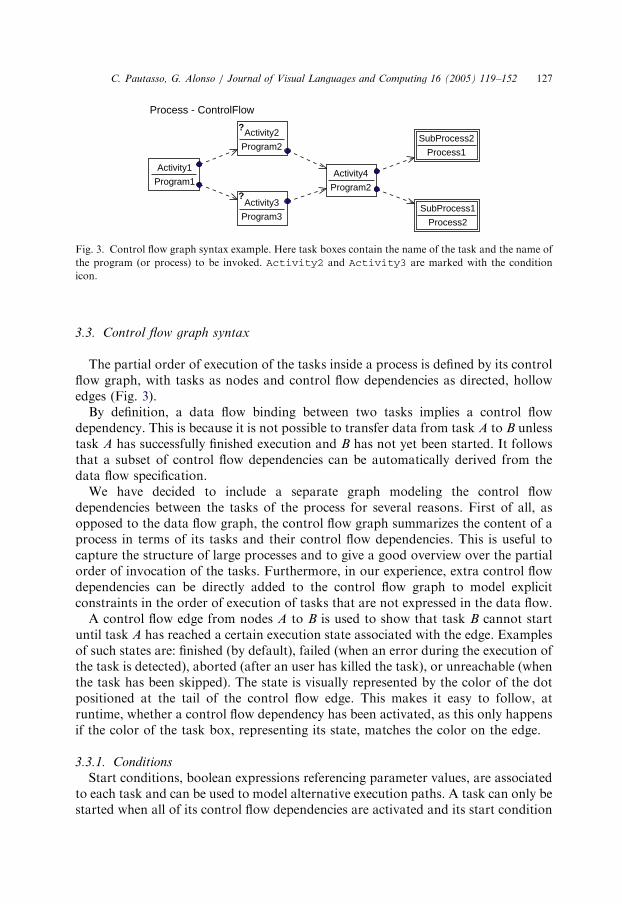
Process - ControlFlow
?
?
Fig. 3. Control flow graph syntax example. Here task boxes contain the name of the task and the name of
the program (or process) to be invoked. Activity2 and Activity3 are marked with the condition
icon.
C. Pautasso, G. Alonso / Journal of Visual Languages and Computing 16 (2005) 119–152 127
3.3. Control flow graph syntax
The partial order of execution of the tasks inside a process is defined by its controlflow graph, with tasks as nodes and control flow dependencies as directed, hollowedges (Fig. 3).
By definition, a data flow binding between two tasks implies a control flowdependency. This is because it is not possible to transfer data from task A to B unlesstask A has successfully finished execution and B has not yet been started. It followsthat a subset of control flow dependencies can be automatically derived from thedata flow specification.
We have decided to include a separate graph modeling the control flowdependencies between the tasks of the process for several reasons. First of all, asopposed to the data flow graph, the control flow graph summarizes the content of aprocess in terms of its tasks and their control flow dependencies. This is useful tocapture the structure of large processes and to give a good overview over the partialorder of invocation of the tasks. Furthermore, in our experience, extra control flowdependencies can be directly added to the control flow graph to model explicitconstraints in the order of execution of tasks that are not expressed in the data flow.
A control flow edge from nodes A to B is used to show that task B cannot startuntil task A has reached a certain execution state associated with the edge. Examplesof such states are: finished (by default), failed (when an error during the execution ofthe task is detected), aborted (after an user has killed the task), or unreachable (whenthe task has been skipped). The state is visually represented by the color of the dotpositioned at the tail of the control flow edge. This makes it easy to follow, atruntime, whether a control flow dependency has been activated, as this only happensif the color of the task box, representing its state, matches the color on the edge.
3.3.1. Conditions
Start conditions, boolean expressions referencing parameter values, are associatedto each task and can be used to model alternative execution paths. A task can only bestarted when all of its control flow dependencies are activated and its start condition

ARTICLE IN PRESS
Activity1
Activity2
Activity3 ExceptionHandler
ProcessException - ControlFlow
finished
finished
finished failed
Fig. 4. Control flow with exception handler.
C. Pautasso, G. Alonso / Journal of Visual Languages and Computing 16 (2005) 119–152128
is satisfied. Otherwise, if the condition evaluates to false, the task is skipped and itsstate is set to unreachable. Currently, start conditions are specified only in textualform as one of the task properties. However, boxes of tasks with non-trivialconditions are marked with a small question-mark icon.
As shown in Fig. 4, failure handling behavior is specified in the control flow graphby using connectors which fire on failure of a task. An exception handling task maybe added to a process by drawing such connections from one or more tasks to it.With start conditions applied to the output parameters of the failed task, it ispossible to discriminate between different types of failures and activate theappropriate exception handler. By drawing an edge from the exception handlerback to the failed task it is possible to retry its execution after the exception handlerhas finished. As an alternative, it is possible to resume the execution of the processalong an alternative execution path, triggered by the failure.
3.3.2. Synchronization
If there is more than one incoming control flow edge to a node C; it must bedefined how the various dependencies are merged. By default, the semantic is to and
all dependencies. For example, if there is a dependency coming from service A andanother from B; task C cannot be started until both tasks A and B have finished. Oneexception to this rule is when there is a merge of alternative execution paths, in thatcase the semantic is to xor the connections. Similarly, for incoming connectors partof a loop in the graph, the semantic is to or the loop dependency with the others.Similar to conditions, the boolean expression defining how to synchronize multipleincoming control flow edges can be edited in textual form. JOpera ensures that itremains consistent with the graph topology.

ARTICLE IN PRESS
C. Pautasso, G. Alonso / Journal of Visual Languages and Computing 16 (2005) 119–152 129
3.4. Data flow and control flow
Although the data flow bindings between parameters already constrain the orderof the invocation of the services, a pure data-flow approach is not enough tocompletely model the interactions between different service invocations.
Clearly, if two services do not need to exchange data, there is no data flowconnection between them. Thus, according to the data flow graph there is noconstraint in the order in which they should be invoked. Depending on the overallstructure of the data flow graph, they could therefore be invoked in parallel. In somescenarios, this is the intended behavior and—incidentally—this is one of theadvantages of using a graph-based visual notation, where parallelism can beexpressed for free.
However, it is not always possible to invoke multiple services at the same time,even if there is no explicit data flow dependency between them. For example, a dataflow dependency may be implicit (e.g., a task writes some data into a file which isread by the following task) or a dependency may not be data flow related (e.g., acompensation handler is only invoked when canceling the execution of certain set oftasks).
Likewise, as we will show with an example (Section 4.5), the conversation rulesassociated with a certain service provider may require the operations of a service tobe invoked following a given interaction protocol (e.g., the payment informationmust be sent after the items have been chosen and the purchase order has beenentered). These constraints can be orthogonal with respect to the data exchangedwith the service provider.
Thus, it becomes useful to model additional constraints in the order of invocationof the services that cannot be derived from the data flow. This is the first reason toadd an explicit model of the control flow to the JVCL. Although, this issue can alsobe addressed by adding ‘‘dummy’’ data flow connections between the services, this isnot an elegant solution [29].
Furthermore, an explicit model of the control flow provides constructs such asconditional branching, synchronization, loops and exception handling. As pre-viously discussed, the nodes and the edges of the control flow graph are labeled withdifferent information modeling the dependencies between service invocations. Thisway, as shown in the example of Fig. 4, exception handlers are included in a processby labeling their incoming edges with a failed dependency type. Since thisinformation does not represent a data exchange between service parameters it doesnot belong in the finer-grained model of the data flow. Instead, we use a differentgraph, whose edges model control flow dependencies between the nodes representingthe service invocations.
From this discussion it should be clear why both control flow and data flowaspects are necessary to model the composition of different services. It remains to bedetermined what is the best approach to render this information in the visualnotation. More precisely, the choice is whether the visual notation should allow tooverlay the two different but related aspects in the same or in separate diagrams. Inthe first case, the data flow and control flow graphs are displayed and edited in the

ARTICLE IN PRESS
C. Pautasso, G. Alonso / Journal of Visual Languages and Computing 16 (2005) 119–152130
same diagram, containing both kind of edges (i.e., data flow bindings betweenparameters and control flow dependencies between tasks). In the second case, thegraphs are shown separately and the editing environment provides the necessarytools to keep them consistent.
Although both cases are equivalent, as far as the information content of thevisualization is concerned, we favor separate representations due to usability andvisual scalability reasons. A separate representation of control flow and data flowaspects helps to simplify the visual representation of a process, where data flow-related details (i.e., parameters and bindings) can be abstracted into a simplerrepresentation (i.e., the control flow graph). For small processes, the developer maychoose to ignore the control flow graph, as it is generated automatically from thedata flow, the main working representation. However, especially when working withlarge processes, the data flow graph may become quite complicated. Thus, thecontrol flow graph provides a visual overview about the content of the process interms of its tasks. Furthermore, this overview is augmented with the edges,representing control flow dependencies between tasks and giving a readablesummary about their order of execution.
By separating the two aspects the developer may explicitly focus on each one atdifferent times. Thus, the problem of connecting service interfaces in a data flowdiagram can be approached separately from the problem of defining sequencingconstraints and exception handling behavior. For each of these aspects, the JVCLprovides the appropriate modeling constructs, while the corresponding developmenttools ensure the consistency of the result.
3.5. Example
As a first example, we present a process used to retrieve quotes in the desiredcurrency for a user-provided stock symbol. This process combines two Web services,one quoting stock prices [30] and the other one performing currency conversions [31].Although it is a simple example, it allows us to show an application of the basicfeatures of the language without too many unnecessary, application-related details.Furthermore, in this example we compare two different versions of the process, oneemphasizing reusability, the other performance achieved through parallelism.
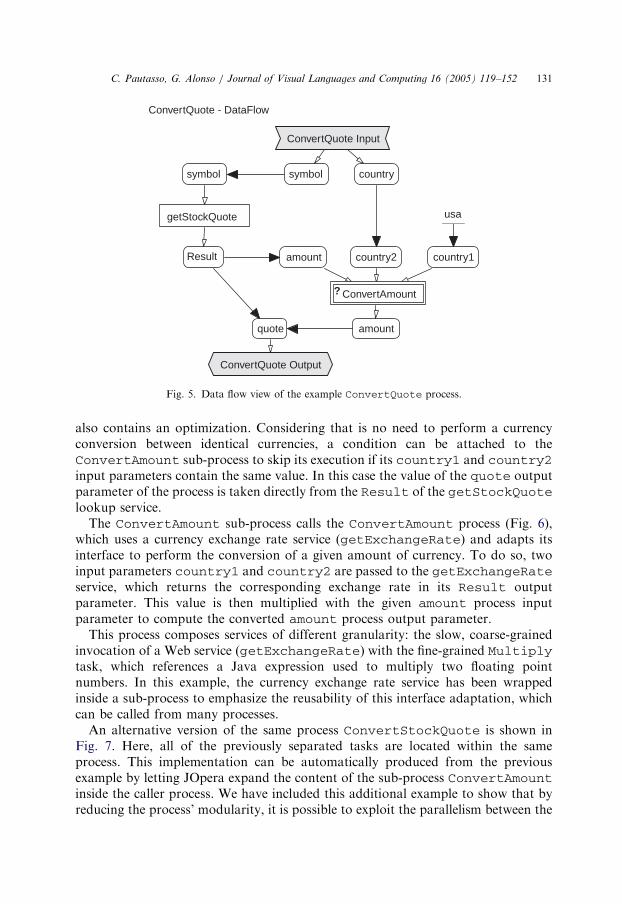
The first version is the ConvertQuote process shown in Fig. 5. This processtakes a stock symbol and a country as input parameters and returns a quote forthe given stock market symbol converted to the currency of the given country.The symbol parameter is passed to the getStockQuote lookup service whichreturns the current price in its Result output parameter. This value is then passedto the amount input parameter of the ConvertAmount sub-process together withthe two countries between which the value should be converted. The country1parameter is set to the "usa" constant value, as the price returned by thegetStockQuote service is in US dollars. The country2 parameter is bound tothe country process input parameter, and can be chosen by the user when startingthe process. The amount output parameter, result of the ConvertAmount sub-process, is copied to the quote output parameter of the main process. The example
ARTICLE IN PRESS
symbol country
ConvertQuote Input
quote
ConvertQuote Output
country1country2amount
amount
ConvertAmount?
symbol
Result
getStockQuote usa
ConvertQuote - DataFlow
Fig. 5. Data flow view of the example ConvertQuote process.
C. Pautasso, G. Alonso / Journal of Visual Languages and Computing 16 (2005) 119–152 131
also contains an optimization. Considering that is no need to perform a currencyconversion between identical currencies, a condition can be attached to theConvertAmount sub-process to skip its execution if its country1 and country2input parameters contain the same value. In this case the value of the quote outputparameter of the process is taken directly from the Result of the getStockQuotelookup service.
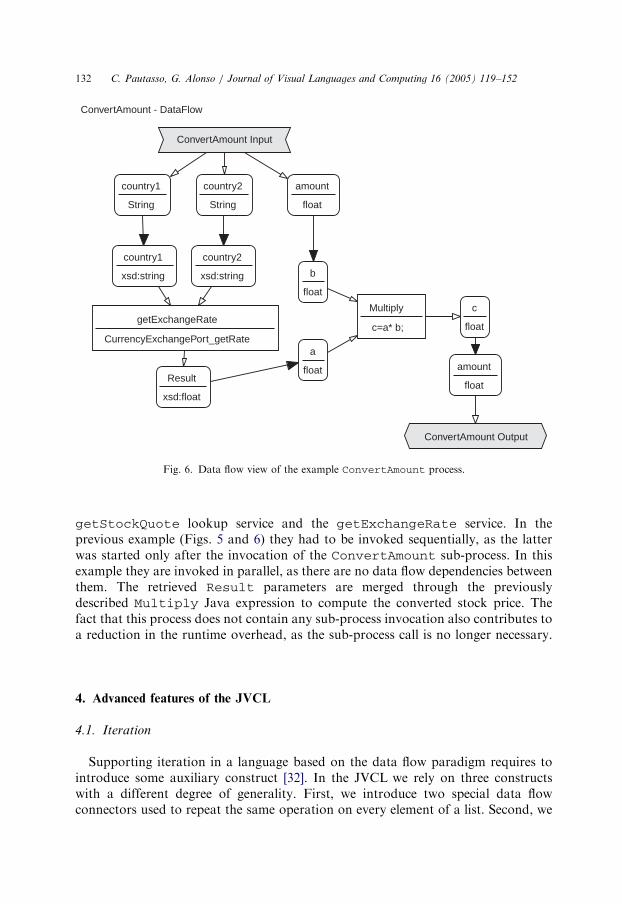
The ConvertAmount sub-process calls the ConvertAmount process (Fig. 6),which uses a currency exchange rate service (getExchangeRate) and adapts itsinterface to perform the conversion of a given amount of currency. To do so, twoinput parameters country1 and country2 are passed to the getExchangeRateservice, which returns the corresponding exchange rate in its Result outputparameter. This value is then multiplied with the given amount process inputparameter to compute the converted amount process output parameter.
This process composes services of different granularity: the slow, coarse-grainedinvocation of a Web service (getExchangeRate) with the fine-grained Multiplytask, which references a Java expression used to multiply two floating pointnumbers. In this example, the currency exchange rate service has been wrappedinside a sub-process to emphasize the reusability of this interface adaptation, whichcan be called from many processes.
An alternative version of the same process ConvertStockQuote is shown inFig. 7. Here, all of the previously separated tasks are located within the sameprocess. This implementation can be automatically produced from the previousexample by letting JOpera expand the content of the sub-process ConvertAmountinside the caller process. We have included this additional example to show that byreducing the process’ modularity, it is possible to exploit the parallelism between the
ARTICLE IN PRESS
country1
String
country2
String
amount
float
ConvertAmount Input
amount
float
ConvertAmount Output
country1
xsd:string
country2
xsd:string
Result
xsd:float
getExchangeRate
CurrencyExchangePort_getRatea
float
b
float
c
float
Multiply
c=a* b;
ConvertAmount - DataFlow
Fig. 6. Data flow view of the example ConvertAmount process.
C. Pautasso, G. Alonso / Journal of Visual Languages and Computing 16 (2005) 119–152132
getStockQuote lookup service and the getExchangeRate service. In theprevious example (Figs. 5 and 6) they had to be invoked sequentially, as the latterwas started only after the invocation of the ConvertAmount sub-process. In thisexample they are invoked in parallel, as there are no data flow dependencies betweenthem. The retrieved Result parameters are merged through the previouslydescribed Multiply Java expression to compute the converted stock price. Thefact that this process does not contain any sub-process invocation also contributes toa reduction in the runtime overhead, as the sub-process call is no longer necessary.
4. Advanced features of the JVCL
4.1. Iteration
Supporting iteration in a language based on the data flow paradigm requires tointroduce some auxiliary construct [32]. In the JVCL we rely on three constructswith a different degree of generality. First, we introduce two special data flowconnectors used to repeat the same operation on every element of a list. Second, we

ARTICLE IN PRESS
symbol
String
country
String
StockQuoteConvert Input
quote
float
StockQuoteConvert Output
country1
xsd:string
country2
xsd:string
Result
xsd:float
getExchangeRate?
symbol
xsd:string
Result
xsd:float
getStockQuotea
float
b
float
c
float
Multiply
usa
StockQuoteConvert - DataFlow
Fig. 7. Data flow view of the example StockQuoteConvert process.
C. Pautasso, G. Alonso / Journal of Visual Languages and Computing 16 (2005) 119–152 133
have been experimenting with arbitrary loops in the control flow graph. Third,recursive sub-process calls are also supported.
4.1.1. List-based Loops
List-based loops can be used to repeat the same operation on a given set of values.When no data dependencies hold, the operation can be performed in parallel.Otherwise, the task must be applied sequentially on each value. To achieve this, weintroduce a pair of special data flow connectors, called split and merge. As in othergraph rewriting schemes [33], the overall effect at runtime is to replicate a task nodefor each value of the input parameter list.
Fig. 8 shows how these operators are visually represented. In it, a Task isinvoked for each element of a list producing the corresponding result.Such split operation is represented by the gray triangle on the data flowbinding linking the list to the element parameter. Although each taskreceives a different element of the list, all tasks are invoked with the samevalue, as this parameter is connected with a basic data flow binding. Uponcompletion of all invocations, the merge connector is used to concatenate all resultsinto the result list parameter.

ARTICLE IN PRESS
list
value
Process Input result list
Process Output
element
result
value
Task
Process - DataFlow
Fig. 8. Data flow syntax of the list-based loops.
C. Pautasso, G. Alonso / Journal of Visual Languages and Computing 16 (2005) 119–152134
By setting properties associated with the operators, the user can control whetherthe invocation of the tasks happens sequentially or in parallel and how the elementsare extracted from the list. For example, JOpera can interpret a string with multiplewords separated by blanks as a list of words. Similarly, JOpera can also split andmerge arrays encoded in the SOAP protocol using XML tags as element separators.In the case of a sequential split connector, the appropriate control flow dependenciesbetween each task of the sequence are automatically inserted when the loop isunrolled.
4.1.2. Control flow loops
Arbitrary cycles in the control flow graph are used to describe the repeatedexecution of parts of a process. Each individual task found within the loop isautomatically restarted when its direct predecessors have finished, even if the taskhas already completed its execution more than once. To avoid endless repetition, theuser should attach the appropriate conditions to enter and exit the loop. In order tobegin executing a loop, the appropriate control flow synchronization must beselected, i.e., the dependencies leading into it should be or’ed with the loopdependencies. In case of loops spanning through all tasks of a process, there must bea way to indicate which of the tasks in the loop is started first. If only one of the tasksreceives data directly from the process input parameter, this task is chosen as the firsttask of the loop. However, in the general case, the user may have to include anadditional task, external to the loop, with no incoming control flow dependencies.This task is executed once at the beginning of the process and it is linked to the firsttask in the loop with a control flow dependency.
4.1.3. Recursion
Another possible way of modeling repeated behavior is through recursion. In thesimplest case, this can be achieved with a sub-process referring to itself. This way, thetasks composing the process will be repeated as long as the condition associated tothe sub-process making the recursive call holds true. As an example, Fig. 9 shows thedata flow graph of a recursive process, which computes the factorial of a number. Inthe example, two tasks computing Java expressions to decrement one number andmultiply two numbers are linked with a sub-process which recursively calls itself. The

ARTICLE IN PRESS
num
int
ProcessFactorial Input
factorial
int
ProcessFactorial Output
a
int
b
int
Decrement
b = a - 1;
b
int
a
int
c
int
Multiply
c = a * b;
num
int
factorial
int
RecursiveCall
ProcessFactorial
?
1
ProcessFactorial - DataFlow
Fig. 9. Data flow graph of a process to compute the factorial of an integer value.
C. Pautasso, G. Alonso / Journal of Visual Languages and Computing 16 (2005) 119–152 135
condition associated with the sub-process stops the recursion and forces the processto return the constant value of one.
4.2. Reflection
In this section we present the reflection features of the JVCL. Reflection is theability of a computational system to represent and modify information aboutitself [34]. In the JVCL, reflection is used to access metadata both about the staticstructure of the process and about its state of execution, as well as about its runtimeenvironment. These features are available through so-called system parameters andsystem services.
4.2.1. System parameters
In addition to the data flow parameters defined by the user, each task is associatedwith a set of system parameters and properties which can be used for a variety ofpurposes. In general, they contain metadata about the execution of the process andare updated automatically by the runtime environment. System input parameters canbe used to control the behavior of a task, e.g., setting its scheduling priority, and canbe connected with incoming data flow bindings like any other user input parameter.

ARTICLE IN PRESS
C. Pautasso, G. Alonso / Journal of Visual Languages and Computing 16 (2005) 119–152136
System output parameters are used to read metadata about tasks, e.g., their runningtime, and are connected with outgoing data flow bindings to other system or userparameters. Similarly to user output parameters their value is—by definition—available only after a task has completed its execution. One exception to this rule aresystem properties which are also used to read metadata, but their value can be read atany time. Therefore, a data flow binding involving a system property does not implya control flow dependency.
The same visual syntax applies to both system and user data flow parameters, withthe only difference that the former are colored in gray and their name always beginswith the SYS prefix. System properties are linked to their task with an undirectededge, symbolizing that their value can be read also before the corresponding task hasbeen executed.
The set of available system parameters depends on the type of componentassociated with the task, and changes for processes, sub-processes or activities.Fig. 10 shows some examples of system parameters and properties. In the case ofactivities representing Web service calls, the two system parameters called soapinand soapout give direct access to the XML content of the SOAP request andresponse messages (Fig. 10a). Similarly, for activities executing UNIX programs, thestdin, stdout and stderr standard data streams are provided together with theretval parameter, which contains the exit code of the program as it is returned bythe operating system (Fig. 10b).
Each task is associated with a system property called ID, which can be used touniquely identify the task among all other tasks of the process and among allinstances of the task that have been executed by JOpera (Fig. 10c). This property istypically used to generate unique filenames for storing the results of the task, as itguarantees that they will not be overwritten by other concurrently running taskinstances.
In order to identify multiple executions of the same task instance, JOpera alsoprovides the restart system property. The value of this restart counter isautomatically incremented every time the task is started, e.g., if the task is part of aloop this may happen multiple times (Fig. 4). This property can also be used to limitthe number of times a loop is executed. To do so, it is enough to set the start
SYS.soapin
SYS.soapout
SOAPActivity
SYS.stdin
SYS.stdout SYS.stderrSYS.retval
UNIXActivity
SYS.ID
SYS.realtime
Task
(a) (b) (c)
Fig. 10. Example of system parameters and properties.

ARTICLE IN PRESS
C. Pautasso, G. Alonso / Journal of Visual Languages and Computing 16 (2005) 119–152 137
condition of a task in the loop to SYS.restart o N, where N is the maximumnumber of times that the loop should be executed.
For execution profiling purposes, JOpera measures the execution time of each taskof a process. This information is displayed to the user in JOpera’s processmonitoring environment. In addition, the same information can be accessed fromwithin a process, in the form of system parameters (cputime, realtime,walltime) associated with each task (Fig. 10c).
4.2.2. System services
System services expose information about JOpera’s runtime environment and let aprocess interact with it. They currently include: the program library API, the processcontrol API and the resource management API. As opposed to the systemparameters, tasks invoking system services are not represented differently from taskscalling other types of components.
The system services of the process control API are mainly used for controlling theexecution of a process from within the process itself. This enables, for example, tocancel the execution of a process upon detection of a certain condition. Similarly, itis possible to automatically suspend a running process upon reaching a certain stageof the execution and have a user manually resume it when appropriate.
Examples on using the program library system services for dynamic late bindingand using the resource reservation service are briefly presented in the rest of thesection.
4.2.3. Late binding example
Reflection can also be applied to a Web service composition scenario, wheretypically the services published on the Web have a variable degree of availability andtend to evolve quickly, especially after the processes composing them have beendefined. Through late binding and the ability to gather information about theavailable services, a process can be made more resilient to these changes as it isdynamically adapted to the environment where it is running.
The example of Fig. 11 illustrates how to use system parameters to support late
binding of tasks to services. The choice of which service (or process) to invoke whenexecuting a certain activity (or sub-process) is done dynamically based on the valueof the prog (or proc) system parameter. This value is normally set at compile-time,but can also be changed at run-time, both by the user and from within a process.
More in detail, the example data flow graph shows how to use the prog systemparameter to set the service that will be invoked by the CallService activity. Thename of the actual service is retrieved using the LookupService system service,which attempts to locate a fitting service implementation given the interface ofthe activity (identified by its ID) and the additional constraint on the service’s nameprovided by the service process input parameter.
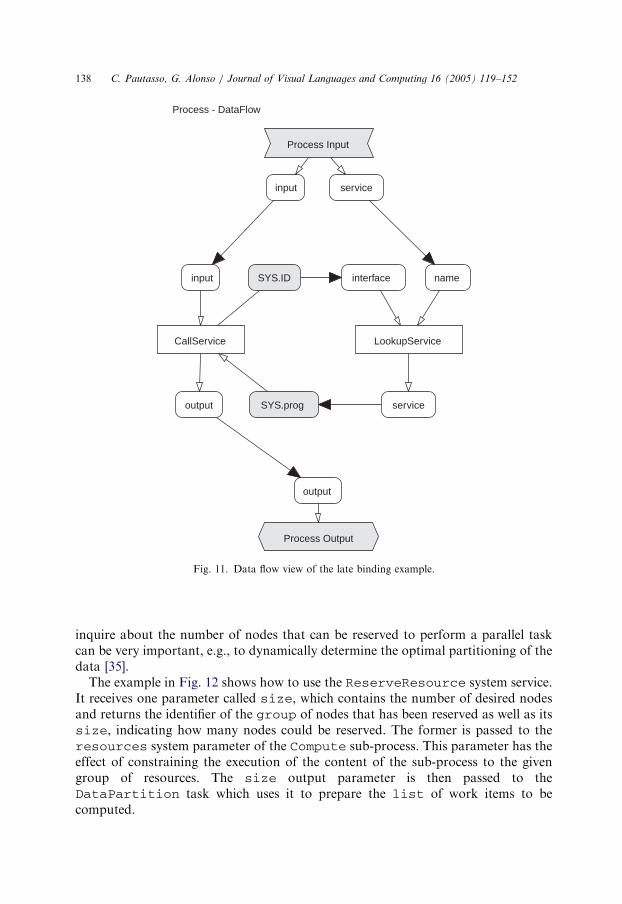
4.2.4. Cluster resource reservation example
In a cluster computing environment, it is useful to program computations in aparametric way with respect to the available computing resources. The ability to
ARTICLE IN PRESS
input service
Process Input
output
Process Output
input
output SYS.prog
SYS.ID
CallService
interface
service
name
LookupService
Process - DataFlow
Fig. 11. Data flow view of the late binding example.
C. Pautasso, G. Alonso / Journal of Visual Languages and Computing 16 (2005) 119–152138
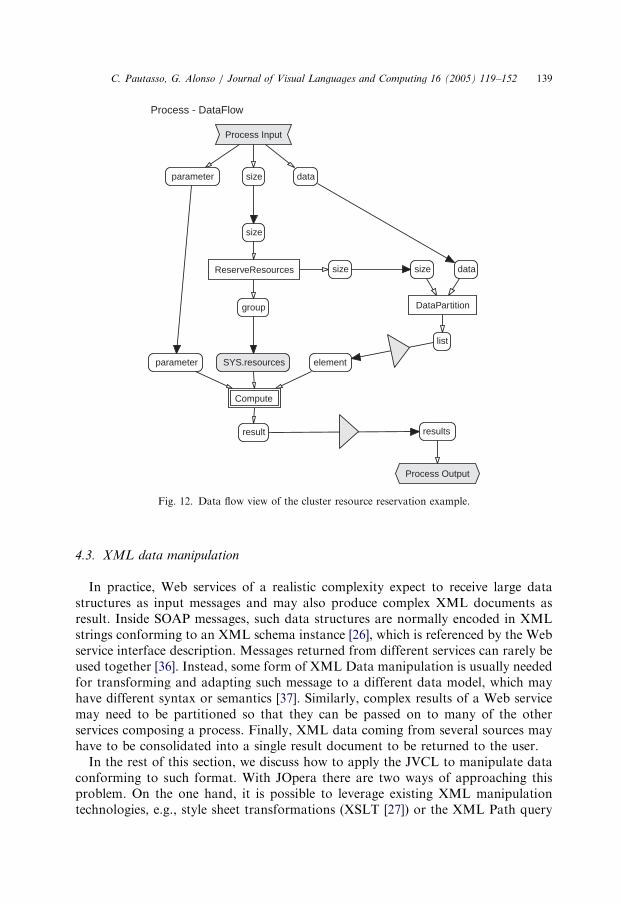
inquire about the number of nodes that can be reserved to perform a parallel taskcan be very important, e.g., to dynamically determine the optimal partitioning of thedata [35].
The example in Fig. 12 shows how to use the ReserveResource system service.It receives one parameter called size, which contains the number of desired nodesand returns the identifier of the group of nodes that has been reserved as well as itssize, indicating how many nodes could be reserved. The former is passed to theresources system parameter of the Compute sub-process. This parameter has theeffect of constraining the execution of the content of the sub-process to the givengroup of resources. The size output parameter is then passed to theDataPartition task which uses it to prepare the list of work items to becomputed.
ARTICLE IN PRESS
datasizeparameter
Process Input
results
Process Output
list
datasize
DataPartition
size
group
sizeReserveResources
SYS.resources
result
elementparameter
Compute
Process - DataFlow
Fig. 12. Data flow view of the cluster resource reservation example.
C. Pautasso, G. Alonso / Journal of Visual Languages and Computing 16 (2005) 119–152 139
4.3. XML data manipulation
In practice, Web services of a realistic complexity expect to receive large datastructures as input messages and may also produce complex XML documents asresult. Inside SOAP messages, such data structures are normally encoded in XMLstrings conforming to an XML schema instance [26], which is referenced by the Webservice interface description. Messages returned from different services can rarely beused together [36]. Instead, some form of XML Data manipulation is usually neededfor transforming and adapting such message to a different data model, which mayhave different syntax or semantics [37]. Similarly, complex results of a Web servicemay need to be partitioned so that they can be passed on to many of the otherservices composing a process. Finally, XML data coming from several sources mayhave to be consolidated into a single result document to be returned to the user.
In the rest of this section, we discuss how to apply the JVCL to manipulate dataconforming to such format. With JOpera there are two ways of approaching thisproblem. On the one hand, it is possible to leverage existing XML manipulationtechnologies, e.g., style sheet transformations (XSLT [27]) or the XML Path query

ARTICLE IN PRESS
C. Pautasso, G. Alonso / Journal of Visual Languages and Computing 16 (2005) 119–152140
language (X-Path [38]). This way, users familiar with these languages can embedXSLT transformation or X-Path expressions directly into a process by creating datafiltering tasks which can be applied to the XML data in transit.
On the other hand, for a certain class of operations, the JVCL can be used directlyto model XML transformations in a visual way. These operations concern theencoding and decoding of so-called XML complex types. Furthermore, the split andmerge operators for list-based iteration have been extended to support lists encodedin XML.
4.3.1. Complex types
A complex type is a record-like data structure which is composed out of elementsof a certain data type, which can be simple (e.g., integer, boolean or string) or, again,complex. For each complex type defined in the data model of a certain service’sinterface, we define two symmetric operations: pack and unpack. These operationsare used to encode the XML representation of a data packet of a certain complextype (pack) and, conversely, to extract from its XML serialization each individualelements (unpack).
These pack and unpack operations are automatically created by JOpera whenimporting the XML schema referenced by the Web service interface definition. Apack operation, for a certain complex type, has multiple input parameters,representing the elements of the complex type and one output parameter, whichcontains the encoded complex type. An unpack operation receives one inputparameter, with the serialized complex type, and returns the values of its element inseparate output parameters. The parameter types of the operations are copied fromthe original schema, allowing to statically check whether the pack and unpackoperations are connected correctly. Furthermore, JOpera uses this type informationto suggest the appropriate operation when the user selects a parameter of a Webservice having a complex data type. In case of data structures with nested complextypes, we propose a modular, composable construction, where each complex type isencoded individually. The various packing operations can then be plugged togetherto form the final XML serialization.
4.3.2. XML processing example: Google
As an example of XML Processing with the JVCL, we present how to retrieve alist of URLs from the results of a Google search. Since this WWW search engine’sAPI has been published as a Web service [39], it is possible to import its interfacedefinition, including its data model, into JOpera. In order to extract the required listof URLs, in the first example (Fig. 13) we use the JVCL’s XML data manipulationfeatures. In the second example (Fig. 14), we present an alternative solution using X-Path queries.
First of all, Google’s search results are returned as a single data structure into thereturn output parameter. Through the Unpack_return operation, it is possibleto extract the component elements of this complex type. These are, among others,the searchTime (indicating how long the query took), the estimatedTotal-ResultCount (indicating the estimated number of page hits) which is copied to the
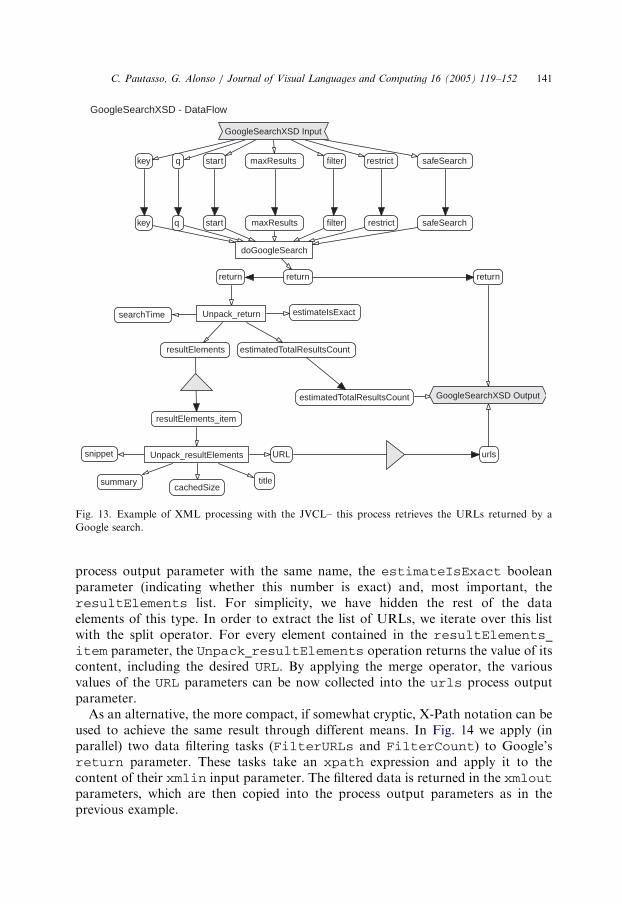
ARTICLE IN PRESS
key q start maxResults filter restrict safeSearch
GoogleSearchXSD Input
return
urls
estimatedTotalResultsCount GoogleSearchXSD Output
key q start maxResults filter restrict safeSearch
return
doGoogleSearch
return
estimatedTotalResultsCountresultElements
searchTime estimateIsExactUnpack_return
resultElements_item
URL
titlecachedSize
summary
snippet Unpack_resultElements
GoogleSearchXSD - DataFlow
Fig. 13. Example of XML processing with the JVCL– this process retrieves the URLs returned by a
Google search.
C. Pautasso, G. Alonso / Journal of Visual Languages and Computing 16 (2005) 119–152 141
process output parameter with the same name, the estimateIsExact booleanparameter (indicating whether this number is exact) and, most important, theresultElements list. For simplicity, we have hidden the rest of the dataelements of this type. In order to extract the list of URLs, we iterate over this listwith the split operator. For every element contained in the resultElements_item parameter, the Unpack_resultElements operation returns the value of itscontent, including the desired URL. By applying the merge operator, the variousvalues of the URL parameters can be now collected into the urls process outputparameter.
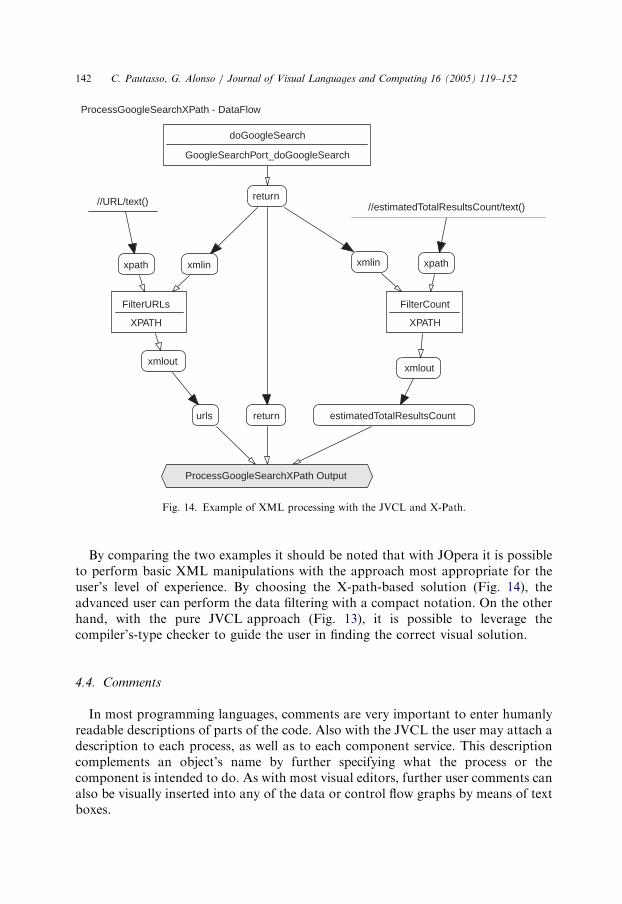
As an alternative, the more compact, if somewhat cryptic, X-Path notation can beused to achieve the same result through different means. In Fig. 14 we apply (inparallel) two data filtering tasks (FilterURLs and FilterCount) to Google’sreturn parameter. These tasks take an xpath expression and apply it to thecontent of their xmlin input parameter. The filtered data is returned in the xmloutparameters, which are then copied into the process output parameters as in theprevious example.
ARTICLE IN PRESS
returnurls estimatedTotalResultsCount
ProcessGoogleSearchXPath Output
return
doGoogleSearch
GoogleSearchPort_doGoogleSearch
xmlinxpath
xmlout
FilterURLs
XPATH
xmlin xpath
xmlout
FilterCount
XPATH
//URL/text() //estimatedTotalResultsCount/text()
ProcessGoogleSearchXPath - DataFlow
Fig. 14. Example of XML processing with the JVCL and X-Path.
C. Pautasso, G. Alonso / Journal of Visual Languages and Computing 16 (2005) 119–152142
By comparing the two examples it should be noted that with JOpera it is possibleto perform basic XML manipulations with the approach most appropriate for theuser’s level of experience. By choosing the X-path-based solution (Fig. 14), theadvanced user can perform the data filtering with a compact notation. On the otherhand, with the pure JVCL approach (Fig. 13), it is possible to leverage thecompiler’s-type checker to guide the user in finding the correct visual solution.
4.4. Comments
In most programming languages, comments are very important to enter humanlyreadable descriptions of parts of the code. Also with the JVCL the user may attach adescription to each process, as well as to each component service. This descriptioncomplements an object’s name by further specifying what the process or thecomponent is intended to do. As with most visual editors, further user comments canalso be visually inserted into any of the data or control flow graphs by means of textboxes.

ARTICLE IN PRESS
C. Pautasso, G. Alonso / Journal of Visual Languages and Computing 16 (2005) 119–152 143
Another typical usage of comments in ordinary programming languages, is thetemporary removal of program code, which is ‘‘commented out’’ so that it will beignored by the compiler, while it still remains visible to the user. Given the practicalimportance of such way of using comments, also in the JVCL we support thisapproach. By visually stretching a comment box so that it overlaps with existingparts of a diagram, the user may temporarily disable the compilation of suchdiagram elements so that they will be ignored by the compiler and will not be part ofthe execution.
4.5. Example of a conversation
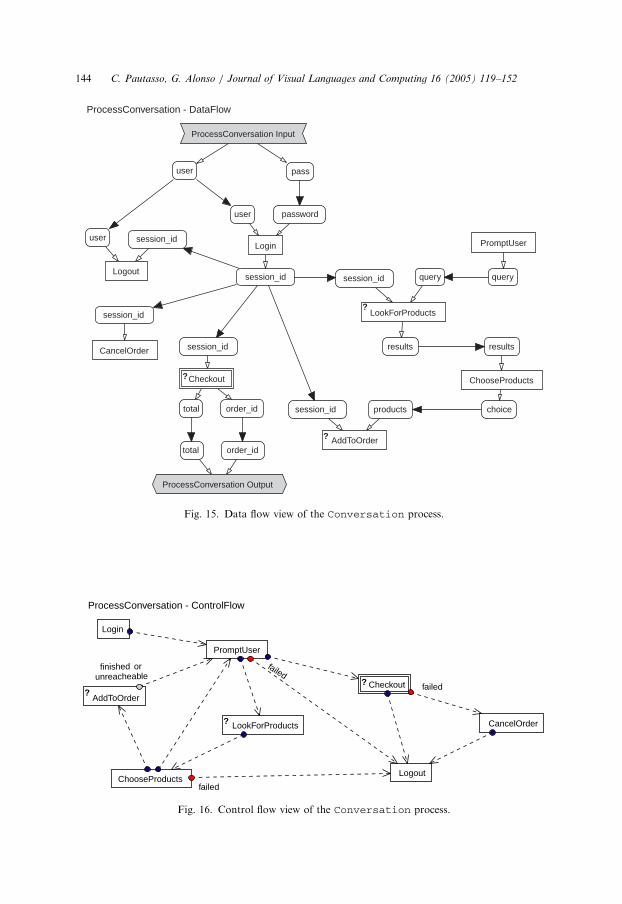
As a final example, we include a process modeling a conversation with an e-commerce service provider. This example shows how to use the control flow graph tospecify sequencing constraints that are not part of the data flow, including loops andexception handlers.
The service provider offers several operations: Login, LookForProducts,AddToOrder, CancelOrder, Logout. The PromptUser and ChoosePro-ducts activities represent the interaction with the user during the execution of theprocess and the Checkout sub-process encapsulates the submission of paymentinformation after the order has been entered.
In Fig. 15 the data flow graph models several aspects of the conversation. Oneconcerns how to maintain the state of the interaction across multiple serviceinvocations. This is modeled by the session_id parameter, whose value isinitialized upon Login and must be passed on with every subsequent interactionwith the service provider. The other represents the conversation between the user andthe service provider: the PromptUser activity returns the query entered by theuser which is forwarded to the LookForProducts service. This returns a list ofresults which are shown to the user during the ChooseProducts activity. Theuser choice is then added to the current order, identified by the currentsession_id.
Although the information of the data flow graph is sufficient to describe the dataexchanged between the various invocations, it does neither model the correct orderof such invocations, nor specify that parts of the process can be repeated more thanonce. More precisely, from the data flow graph it is clear that the Logout operationis invoked after the Login as it uses the session_id parameter. However, as thereis no data flow dependency between the CancelOrder or Checkout tasks, it mayseem that the purchase order is canceled or checked out at the same time, even beforesome products have been added to it.
All of these additional constraints are specified in the control flow graph ofFig. 16. Following the control flow dependencies of the graph, the structure of theprocess becomes visible as it is possible to recognize the beginning of theconversation (Login), the main loop (PromptUser, LookForProducts,ChooseProducts, AddToOrder) followed by the Checkout sub-process. TheLogout activity concludes the conversation. More specifically, Logout also fulfillsan exception handling role, as it is called in case the PromptUser and
ARTICLE IN PRESS
Login
Logout
PromptUser
ChooseProducts
LookForProducts
AddToOrder?
?
Checkout?
CancelOrder
ProcessConversation - ControlFlow
failed
failed
failedfinished
unreacheableor
Fig. 16. Control flow view of the Conversation process.
user pass
ProcessConversation Input
total order_id
ProcessConversation Output
session_id
user password
Loginsession_iduser
Logoutquery
PromptUser
results
querysession_id
LookForProducts
choice
results
ChooseProducts
productssession_id
AddToOrder?
session_id
total order_id
Checkout?
session_id
CancelOrder
ProcessConversation - DataFlow
?
Fig. 15. Data flow view of the Conversation process.
C. Pautasso, G. Alonso / Journal of Visual Languages and Computing 16 (2005) 119–152144

ARTICLE IN PRESS
C. Pautasso, G. Alonso / Journal of Visual Languages and Computing 16 (2005) 119–152 145
ChooseProduct activities fail (e.g., the user has not responded after a certain time-out). Also, if the Checkout sub-process fails, it is not possible to Logout of theconversation immediately, as the CancelOrder compensation handler must beinvoked beforehand. The conditions associated with the LookForProducts andCheckout tasks model the branch in the execution which depends on the choice ofthe user. Furthermore, the AddToOrder activity is skipped if the choice of theuser is empty.
5. Visual development environment
In this section, we briefly present JOpera’s visual development environment(Fig. 17), an integrated set of tools we have built to support the JVCL. First, we givean overview about the development cycle. Then we concentrate on the visualscalability features. A binary distribution of the latest JOpera version can bedownloaded from [23].
5.1. Development cycle
The whole lifecycle of a process can be managed with the JOpera visual processdevelopment environment. First of all, Web services and other component types canbe imported into the service library as reusable components. The user can browsethrough it, select a set of services and drag and drop them into the data flow graph ofa process. At this point, the development environment can automatically suggestdata flow connections between parameters of matching names and data types, or, forexample, assist the user in building the appropriate data conversion filters betweenmismatching parameters. The control flow graph of the process is also automaticallykept consistent with the data flow graph.
When deleting a control flow dependency all of the corresponding data flowbindings are removed. Conversely, whenever a new data flow binding is established,the corresponding control flow dependency is added. The user is notified withoptional warning messages of the consequences of these actions, which otherwise arecarried out in a transparent manner.
Once all services have been connected the process is compiled to Java executablecode and uploaded to a JOpera runtime environment for execution. Duringcompilation various consistency checks of the process are carried out and the user isnotified with a list of errors (e.g., parameters of incompatible types are connected)and warnings about potential problems (e.g, an input parameter has been leftdisconnected).
After a successful compilation, the user may start multiple concurrent instances ofa process, which are managed by the same runtime environment. The progress of arunning process can also be visually monitored by watching the color of task boxes,indicating their execution state, and by clicking on data parameters to inspect (andmodify) their content. The user may interact with a process and its tasks to abort,pause, continue and restart their execution at will. Once a process terminates its

ARTICLE IN PRESS
Fig. 17. Screenshots of JOpera’s visual environments.
C. Pautasso, G. Alonso / Journal of Visual Languages and Computing 16 (2005) 119–152146

ARTICLE IN PRESS
C. Pautasso, G. Alonso / Journal of Visual Languages and Computing 16 (2005) 119–152 147
execution, the system keeps its state in a history data base, which includes both thecontent of all parameters as well as profiling information with measurements aboutthe execution time of each task. This information can later be analyzed, e.g., forperformance optimization. Finally, once its development and testing has beencompleted, a process can be published as a Web service.
5.2. Visual scalability
One of the advantages of using a visual programming language is thatthe data and control flow of a process can be specified directly by drawinggraphs. In practice, however, some manual effort is required in order toobtain a readable diagram, even for small sized graphs. Thanks to theautomatic layout facilities built into the development environment, the amount ofwork necessary to re-arrange the graph layout is significantly reduced. We haveadapted several hierarchical layout algorithms to take into account the syntacticalrelationships between the graph elements. Furthermore, these algorithms areintended to be used incrementally in order to preserve the user’s mental map ofthe process [40].
Although the automatic layout features already improve the user’s productivity,better support is required to visualize realistic graphs having a large number ofelements. Therefore, our development environment provides the user with otherfeatures that increase the scalability of the visual language [41].
First of all, thanks to the sub-process construct, parts of the graphmay be collapsed into single nodes and the user may easily navigate back andforth between the various levels of nesting. This allows the user to design processesfollowing both a top-down progressive refinement and a bottom-up aggregationapproach.
Second, the environment provides the ability to create and work withmultiple views over the same data flow graph. In this case, the user may easilyextract a subset of the data flow graph, for example, to analyze the data flowingthrough a particular task, or to focus on the tasks receiving data from a certainparameter. This way, the user may interactively navigate through a complex dataflow graph and is always presented with an uncluttered view over the relevantinformation. The development environment also allows the user to edit the data flowgraph from any of the views by enforcing the required consistency constraints. Forexample, when deleting a redundant data flow connection which is present in morethan one view, the user will be warned about it and may decide to remove theconnection from all views.
6. Related work
Why a new visual language? In the past, there have been already manycontributions, both in the areas of visual programming languages (e.g., [42]) andvisual process modeling.
ARTICLE IN PRESS
C. Pautasso, G. Alonso / Journal of Visual Languages and Computing 16 (2005) 119–152148
Visual programming languages, however, have been mostly oriented towardsprogramming in the small, positioning themselves on a level of abstractioncomparable with traditional programming languages, such as C or Java [43]. Inthis domain, it has become clear that two (or three)-dimensional approaches sufferfrom visual scalability problems [41], where the usability of such tools and languagesdecreases as the size of the diagrams increases [44].
Only recently there have been some attempts to shift the focus to programming inthe large, where the composition of coarse-grained software components (orservices) plays a more important role [16]. In this paper, we have described a visualcomposition language, whose main application domain lies in describing of howservices are composed together [24]. Although not specifically related to visuallanguages, the idea of separating composition (or coordination) languages fromprogramming languages was presented in [17].
We believe service composition can be a more viable application area for a visuallanguage, where a non-linear, two-dimensional syntax can be most appropriate todescribe the interactions between coarse-grained services. In this context, the idea ofdeveloping large-scale applications by composing reusable component modules hasbeen pioneered by Wiederhold et al. [9] and McIlroy [10]. A more recent perspectiveon the relationship between component-based software engineering and servicecomposition can be found in [8].
Visual process modeling languages have been mostly based on adaptations andvariations of existing graphical notations and formalisms (e.g., Petri-Nets [45] orState Charts [46,47]). Also within the UML community, business processes havebeen usually modeled using Activity diagrams [48], for which the underlyingsemantics has been upgraded to Petri Nets in the current UML 2.0 proposals [49].The strong point of all of these approaches lies in the accurate descriptionof the control flow of a process, where a large number of constructs is devoted todescribing the partial order of invocation of the services composing the process, inorder to support various branching and synchronization patterns [50]. However, asthese notations are applied to service composition, some limitations becomeapparent:
�
In order to provide an executable description of a process built out ofinterconnected components, it is not enough to model its control flow, as thecomponents typically exchange some kind of information between theirinvocations.�
Most existing visual process modeling languages do not use a visual syntax toprogram the data flow, which describes how data is transferred across componentboundaries. As an example, in the syntax of the UML 2.0 activity diagrams profilefor Web service composition, the data flow transfers between the activitiesrepresenting service invocations are programmed with a textual syntax insidecomments associated to control flow edges [49].�
Very little can be done with a pure control flow approach, as far as the visualmodeling of the necessary adapters between mismatching service interfaces isconcerned.
ARTICLE IN PRESS
C. Pautasso, G. Alonso / Journal of Visual Languages and Computing 16 (2005) 119–152 149
�
The control flow and, when supported, data flow aspects of a process model areusually overlaid in a single diagram [51]. This approach leads to unnecessaryclutter and, given the complexity of real business processes [52], may hinder theusability and the success of such visual languages and tools.In the JVCL, we attempt to address such limitations by modeling processesprimarily by their data flow structure. For it provides a simple and intuitivenotation, the data flow paradigm has been used by many existing visuallanguages [28]. However, this simple, side effects-free representation requiresto be extended with additional constructs to be applied in practical settings.In the past, there have been many contributions concerning the problem ofextending data flow languages with iteration constructs. A survey can be foundin [32], while an example of iteration through vector operators and conditionalswitches is [53].
Similarly, reflection [34] is an important feature of a composition language. Withit, the visual syntax is extended to model the interaction between a program and itsenvironment. By using terms such as ‘‘higher-order functions’’, similar ideas havebeen applied to data flow-based visual languages in the past [54].
7. Conclusion
In this paper, we have presented the JVCL. This language is used to describe howto compose services into processes. It is based on a simple graph-based notation,used to visually specify the order of invocation of each service (control flow) and tomodel the patterns of data exchange between the services (data flow). Thecomponents of a process can be of many different types, including, but not limitedto, Web services, UNIX and Windows applications, SQL data base queries, jobsubmissions to a cluster of computers, or Java Remote method invocations.Furthermore, with the JVCL it is possible to combine such coarse-grained types ofservices with smaller, fine-grained scripts written in Java, which are efficientlyembedded within a process by the compiler.
In addition to basic modeling features, such as defining nested control and dataflow graphs, the language supports conditional branches in the execution, list-basediteration through split and merge operators, arbitrary control flow loops andrecursion. Furthermore, without significantly increasing the language syntax, wehave shown examples on how to apply its reflection capabilities to model the latebinding of service implementations to their interfaces, as well as about how toperform basic XML data manipulations.
For execution, the language is compiled to Java code, which is then dynamicallyloaded into JOpera’s runtime environment. This environment provides support forthe whole lifecycle of a process, it features a visual monitoring and debuggingenvironment that lets the user interact with a running process using the same visualsyntax used to define it. If necessary, the history of the execution of the processes isstored persistently, so that it can be analyzed for performance optimization and

ARTICLE IN PRESS
C. Pautasso, G. Alonso / Journal of Visual Languages and Computing 16 (2005) 119–152150
troubleshooting purposes. Finally, production quality processes can be published asWeb services.
References
[1] W3C, Simple Object Access Protocol (SOAP) 1.1, 2000, http://www.w3.org/TR/SOAP.
[2] W3C, Web services Definition Language (WSDL) 1.1, 2001, http://www.w3.org/TR/wsdl.
[3] Oasis, Universal Description, Discovery and Integration of Web services (UDDI) Version 3.0, 2002,
http://uddi.org/pubs/uddi-v3.htm.
[4] J.-Y. Chung, K.-J. Lin, R.G. Mathieu, Web services computing—advancing software interoper-
ability, Computer 36 (10) (2003) 35–37.
[5] F. Leymann, Web services: distributed applications without limits, in: Proceedings of the
International Conference on Business Process Management (BPM 2003), Eindhoven, The Nether-
lands, 2003, pp. 123–145.
[6] C. Mohan, Dynamic E-business: trends in Web services, in: Proceedings of the Third International
Workshop on Technologies for E-Services (TES 2002), Hong Kong, China, 2002, pp. 1–5.
[7] M.P. Papazoglou, D. Georgakopoulos, Service-oriented computing, Communications of the
Association for Computing Machinery 46 (10) (2003) 25–28.
[8] C. Szyperski, Component technology—what, where, and how?, in: Proceedings of the 25th
International Conference on Software Engineering, Portland, OR, USA, 2003, pp. 684–693.
[9] G. Wiederhold, P. Wegner, S. Ceri, Towards megaprogramming: a paradigm for component-based
programming, Communications of the Association for Computing Machinery 35 (11) (1992) 89–99.
[10] M.D. McIlroy, Mass-produced software components, in: Proceedings of the Working Conference on
Software Engineering, Garmisch-Partenkirchen, Germany, 1968, pp. 138–150.
[11] G. Alonso, F. Casati, H. Kuno, V. Machiraju, Web Services: Concepts Architectures and
Applications, Springer, Berlin, 2003.
[12] J. Aldrich, C. Chambers, D. Notkin, ArchJava: connecting software architecture to implementation,
in: Proceedings of the International Conference on Software Engineering (ICSE 2002), Orlando, FL,
USA, 2002.
[13] D. Florescu, A. Gruenhagen, D. Kossmann, XL: an XML programming language for Web service
specification and composition, in: Proceedings of the 11th International Conference on World Wide
Web (WWW’02), Honolulu, HI, USA, 2002, pp. 65–76.
[14] IBM, Microsoft, and BEA Systems, Business Process Execution Language for Web services
(BPEL4WS) 1.0, August 2002, http://www.ibm.com/developerworks/library/ws-bpel.
[15] BPMI, BPML: Business Process Modeling Language 1.0, Business Process Management Initiative,
March 2001, http://www.bpmi.org.
[16] M. Muench, A. Schuerr, Leaving the visual language ghetto, in: Proceedings of the IEEE Symposium
on Visual Languages, 1999, pp. 148–155.
[17] D. Gelernter, N. Carriero, Coordination languages and their significance, Communications of the
Association for the Computing Machinery 35 (2) (1992) 97–107.
[18] G. Copeland, D. Maier, Making smalltalk a database system, in: Proceedings of the 1984 Association
for the Computing Machinery SIGMOD International Conference on Management of Data, Boston,
MA, 1984, pp. 316–325.
[19] D. Georgakopoulos, M.F. Hornick, A.P. Sheth, An overview of workflow management: from process
modelling to workflow automation infrastructure, Distributed and Parallel Databases 3 (2) (1995)
119–153.
[20] L.-J. Zhang, M. Jeckle, The Next Big Thing: Web services Collaboration, in: Proceedings of the
International Conference on Web services (ICWS-Europe 2003), Erfurt, Germany, 2003, pp. 1–10.
[21] M. Govindaraju, S. Krishnan, K. Chiu, A. Slominski, D. Gannon, R. Bramley, Merging the CCA
component model with the OGSI framework, in: Proceedings of the Third IEEE/ACM International
Symposium on Cluster Computing and the Grid (CCGrid03), Tokyo, Japan, 2003, pp. 182–189.

ARTICLE IN PRESS
C. Pautasso, G. Alonso / Journal of Visual Languages and Computing 16 (2005) 119–152 151
[22] B. Medjahed, A. Bouguettaya, A.K. Elmagarmid, Composing Web services on the semantic Web,
The VLDB Journal 12 (4) (2003) 333–351.
[23] C. Pautasso, JOpera: process support for Web services, http://www.iks.ethz.ch/jopera/
download.
[24] C. Pautasso, G. Alonso, Visual composition of Web services, in: Proceedings of the 2003 IEEE
International Symposium on Human-Centric Computing Languages and Environments (HCC 2003),
Auckland, New Zealand, Avon Books, New York, 2003, pp. 92–99.
[25] K. Gottschalk, S. Graham, H. Kreger, J. Snell, Introduction to Web services architecture, IBM
Systems Journal 41 (2) (2002) 170–177.
[26] W3C, XML Schema, 2001, http://www.w3.org/TR/xmlschema-0/.
[27] W3C, Extensible Stylesheet Language Transformations (XSLT) 1.0, 1999, http://www.w3.org/
TR/xslt.
[28] D.D. Hils, Visual languages and computing survey: data flow visual programming languages, Journal
of Visual Languages and Computing 3 (1) (1992) 69–101.
[29] D. Fensel, C. Bussler, The Web service modeling framework WSMF, Electronic Commerce Research
and Applications 1 (2) (2002) 113–137.
[30] XMethods, Delayed stock quote service, http://services.xmethods.net/soap/urn:x-
methods-delayed-quotes.wsdl.
[31] XMethods, Currency exchange rate service, http://www.xmethods.net/sd/2001/Curren-
cyExchangeService.wsdl.
[32] M. Mosconi, M. Porta, Iteration constructs in data-flow visual programming languages, Computer
Languages 26 (2–4) (2000) 67–104.
[33] A. Beguelin, J.J. Dongarra, A. Geist, R. Manchek, K. Moore, R. Wade, V.S. Sunderam, HeNCE:
graphical development tools for network-based concurrent computing, in: Proceedings of the 1992
Scalable High Performance Computing Conference (SHPCC-92), Williamsburg, VA, 1992, pp.
129–136.
[34] P. Maes, Concepts and experiments in computational reflection, in: Proceedings of the Second
Annual Conference on Object-Oriented Programming Systems, Languages and Applications
(OOPSLA’87), Orlando, FL, 1987, pp. 147–155.
[35] G. Alonso, W. Bausch, C. Pautasso, M. Hallett, A. Kahn, Dependable computing in virtual
laboratories, in: Proceedings of the 17th International Conference on Data Engineering (ICDE2001),
Heidelberg, Germany, 2001, pp. 235–242.
[36] V.R. Aragao, A.A. Fernandes, Conflict resolution in Web service federations, in: Proceedings of the
International Conference on Web services (ICWS-Europe 2003), Erfurt, Germany, 2003, pp. 109–122.
[37] A.P. Sheth, Changing focus on interoperability in information systems: from system, in: M.F.
Goodchild, M.J. Egenhofer, R. Fegeas, C.A. Kottman (Eds.), Interoperating Geographic
Information Systems, Kluwer Academic Publishers, Dordrecht, 1998, pp. 5–30.
[38] W3C, XML path language (XPath) 1.0; 1999, http://www.w3.org/TR/xpath.
[39] Google, Google Web APIs, http://api.google.com/GoogleSearch.wsdl.
[40] K. Misue, P. Eades, W. Lai, K. Sugiyama, Layout adjustment and the mental map, Journal of Visual
Languages and Computing 6 (2) (1995) 183–210.
[41] M.M. Burnett, M.J. Baker, C. Bohus, P. Carlson, S. Yang, P. van Zee, Scaling up visual
programming languages, Computer 28 (3) (1995) 45–54.
[42] J.D. Kiper, E. Howard, C. Ames, Criteria for Evaluation of Visual Programming Languages, Journal
of Visual Languages and Computing 8 (2) (1997) 175–192.
[43] P.T. Cox, F.R. Giles, T. Pietrzykowski, Prograph, in: Visual Object-oriented Programming: Concepts
and Environments, Manning Publications Co., 1995, pp. 45–66.
[44] M. Petre, Why looking isn’t always seeing: readership skills and graphical programming,
Communications of the Association for the Computing Machinery 38 (6) (1995) 33–44.
[45] W.M.P. van der Aalst, The application of petri nets to workflow management, Journal of Circuits,
Systems and Computers 8 (1) (1998) 21–66.
[46] D. Harel, Statecharts: a visual formalism for complex system, Science of Computer Programming 8
(3) (1987) 231–274.

ARTICLE IN PRESS
C. Pautasso, G. Alonso / Journal of Visual Languages and Computing 16 (2005) 119–152152
[47] D. Wodtke, J. Weissenfels, G. Weikum, A. Kotz-Dittrich, The mentor project: steps toward
enterprise-wide workflow management, in: Proceedings of the 12th International Conference on Data
Engineering (ICDE 1996), New Orleans, LA, 1996, pp. 556–565.
[48] G. Wirtz, M. Weske, H. Giese, Extending UML with workflow modeling capabilities, in: O. Etzion,
P. Scheuermann (Eds.), Seventh International Conference on Cooperative Information Systems
(CoopIS-2000), Eilat, Israel, 2000, pp. 30–41.
[49] S. Iyengar, Business process integration using UML and BPEL4WS, in: M. Glinz, H.-P. Hoidn
(Eds.), Components: The Future of Software Engineering? (SI-SE 2004), Zurich, Switzerland, 2004.
[50] W. van der Aalst, A.H.M. ter Hofstede, B. Kiepuszewski, A. Barros, Workflow patterns, Distributed
and Parallel Databases 14 (3) (2003) 5–51.
[51] E. di Nitto, L. Lavazza, M. Schiavoni, E. Tracanella, M. Trombetta, Deriving executable process
descriptions from UML, in: Proceedings of the International Conference on Software Engineering
(ICSE 2002), Orlando, FL, USA, 2002, pp. 155–165.
[52] C. Bussler, B2B Integration, Concepts and Architecture, Springer, Berlin, 2002.
[53] M. Auguston, A. Delgado, Iterative constructs in the visual data flow language, in: Proceedings of the
1997 IEEE Symposium on Visual Languages, Capri, Italy, 1997, pp. 152–159.
[54] A. Fukunaga, W. Pree, T.D. Kimura, Functions as objects in a data flow based visual language, in:
Proceedings of the 1993 ACM Conference on Computer Science, Indianapolis, IN, 1993, pp. 215–220.