Embed Size (px)
Citation preview

The Italian NPL market | 01 The Italian macroeconomic scenario and real estate market overview p4 | 02 Overview of the Italian banking system p8 | 03 Banks’ asset quality deterioration issue p10 | 04 Size and features of the Italian NPL market p14 | 05 The NPL servicing market p18 | 06 Market recent activity and outlook p20 | Appendix p22
January 2015
www.pwc.com/it
The Italian NPL market
Time for deleveraging

The Italian macroeconomic scenario and real estate market overview 1
Overview of the Italian banking system 2
Banks’ asset quality deterioration issue 3
Size and features of the Italian NPL market 4
The NPL servicing market 5
Market recent activity and outlook 6
Appendix
In 2014 the Italian market catalysed the attention of an increasing number of investors and several originators put on the market non core and non performing assets. However the big wave of NPL transactions has not materialised yet and banks focus was mainly on ECB Asset Quality Review and stress test exercise.
The ECB Comprehensive Assessment exercise performed on 2013 balance sheets brought to an immediate increase in the provisioning (especially for some banks) and provided the guidelines for applying the new policies to the entire banks portfolio. This is expected to drive a further improvement in coverage ratio in 2014 which will contribute to bridging the bid and ask gap.
With some transactions already in process expected to complete by year end or Q1-2015 (including the UCCMB platform and portfolio deal which is in the final phases) and a significant pipeline of deals which are planned to land on the market in the first moths of next year we foresee a vibrant 2015.
We expect more deals in the consumer loan segment, which has been very lively over the last years, and in SMEs and mortgage loans area, not particularly active so far.
We also expect a dynamic situation in the loan servicing market, where investors with a long term development strategy are willing to invest to consolidate their position. We expect that this will involve both the independent servicers segment and the servicing platform of the banks, where deals that combine portfolios and platform might be a winning strategy for some financial institutions in the deleveraging and value creation process that the Italian banks have to implement.
Kind Regards,
Fedele [email protected]
Antonella [email protected]
Laura [email protected]
Foreword Content
4 | The Italian NLP market | Time for deleveraging
01
Table 2: European Countries’ peers analysis
Table 1: GDP growth (% change)
Source: PwC analysis on European Economic Forecast, Spring 2014
1 EU Commission Opinion on the Draft Budgetary Plan of Italy released on 28th November 2014
The Italian macroeconomic scenario and the real estate market overview
Source: PwC analysis on IMF data as of October 2014
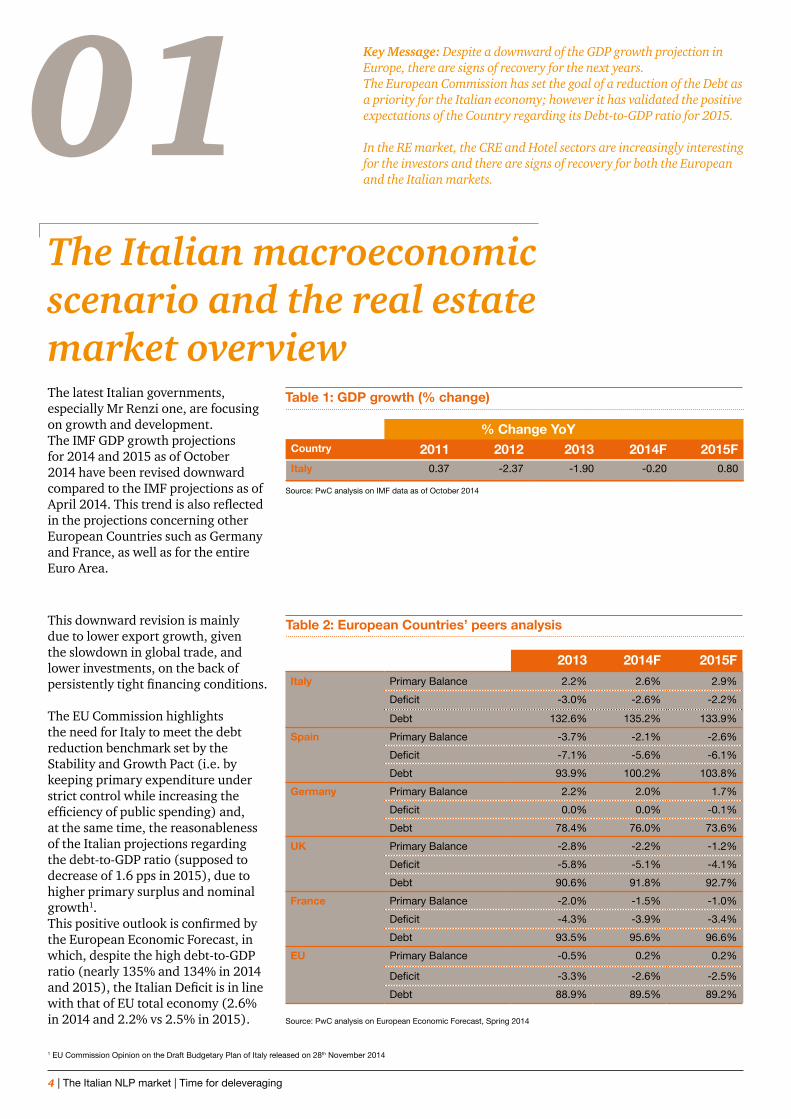
The latest Italian governments, especially Mr Renzi one, are focusing on growth and development. The IMF GDP growth projections for 2014 and 2015 as of October 2014 have been revised downward compared to the IMF projections as of April 2014. This trend is also reflected in the projections concerning other European Countries such as Germany and France, as well as for the entire Euro Area.
This downward revision is mainly due to lower export growth, given the slowdown in global trade, and lower investments, on the back of persistently tight financing conditions.
The EU Commission highlights the need for Italy to meet the debt reduction benchmark set by the Stability and Growth Pact (i.e. by keeping primary expenditure under strict control while increasing the efficiency of public spending) and, at the same time, the reasonableness of the Italian projections regarding the debt-to-GDP ratio (supposed to decrease of 1.6 pps in 2015), due to higher primary surplus and nominal growth1.This positive outlook is confirmed by the European Economic Forecast, in which, despite the high debt-to-GDP ratio (nearly 135% and 134% in 2014 and 2015), the Italian Deficit is in line with that of EU total economy (2.6% in 2014 and 2.2% vs 2.5% in 2015).
Key Message: Despite a downward of the GDP growth projection in Europe, there are signs of recovery for the next years.The European Commission has set the goal of a reduction of the Debt as a priority for the Italian economy; however it has validated the positive expectations of the Country regarding its Debt-to-GDP ratio for 2015.
In the RE market, the CRE and Hotel sectors are increasingly interesting for the investors and there are signs of recovery for both the European and the Italian markets.
% Change YoYCountry 2011 2012 2013 2014F 2015FItaly 0.37 -2.37 -1.90 -0.20 0.80
2013 2014F 2015F
Italy Primary Balance 2.2% 2.6% 2.9%
Deficit -3.0% -2.6% -2.2%
Debt 132.6% 135.2% 133.9%
Spain Primary Balance -3.7% -2.1% -2.6%
Deficit -7.1% -5.6% -6.1%
Debt 93.9% 100.2% 103.8%
Germany Primary Balance 2.2% 2.0% 1.7%
Deficit 0.0% 0.0% -0.1%
Debt 78.4% 76.0% 73.6%
UK Primary Balance -2.8% -2.2% -1.2%
Deficit -5.8% -5.1% -4.1%
Debt 90.6% 91.8% 92.7%
France Primary Balance -2.0% -1.5% -1.0%
Deficit -4.3% -3.9% -3.4%
Debt 93.5% 95.6% 96.6%
EU Primary Balance -0.5% 0.2% 0.2%
Deficit -3.3% -2.6% -2.5%
Debt 88.9% 89.5% 89.2%

PwC | 5
Table 2: European Countries’ peers analysis
Chart 1: Debt of total economy per Country (% GDP)
Source: PwC analysis on European Economic Forecast, Spring 2014
However, the level of financial wealth of Italian families has been increasing: their financial activities as of March 2014 amount to €3,858bn (€3,465 bn as of 2011 end), thus going back to pre-crisis level, with an average per capita financial wealth of €65k (against €63k in Germany and €40k in Spain).
This is also connected to the switch in investment strategies from real estate investments to financial ones. Therefore, despite the persisting crisis, the amount of private wealth is still high.We also expect that a positive effect will come form the announced ECB measures aimed at fighting deflation trends (Mario Draghi, Frankfurt am Main, 4th December 2014 “Early next year the Governing Council will reassess the monetary stimulus achieved, the expansion of the balance sheet and the outlook for price developments… Should it become necessary to further address risks of too prolonged a period of low inflation, the Governing Council remains unanimous in its commitment to using additional unconventional instruments within its mandate”).
Chart 2: Trend in Italian families financial wealth (€ bn)
Source: Servizio Studi BNL, Focus N.32, 9 October 2014
With regards to the Real Estate , the market is still struggling, however the interest of the institutional investors is increasing, with particular focus on CRE (malls, shopping centres, office buildings, etc.) and hotels. In particular, focusing on the sector allocation, Chart 3 shows the breakdown of the CRE investment volume in Italy (nearly €1.6 bn as of H1-2014), with the retail sector accounting for almost 60%, followed by the office sector (23%).Chart 4 highlights the different weights by which investments in CRE are allocated in Italy among the geographical areas. Throughout the period 2009-2014, the majority of the investments have been allocated to the North-Western area of Italy, with an increasing gap between the mentioned area and the rest of the Country.
Chart 3: CRE investment volume in Italy by sector
Source: Italy investment - Market view, Q2-2014, CBRE Global Research and Consulting

6 | The Italian NLP market | Time for deleveraging
% Change YoY
Country 2014F Volumes
(€ ml)
2010 2011 2012 2013 2014F 2015F Trend 2016
Italy 105,900 3.3 -0.4 -2.0 0.6 -0.2 0.5
France 134,500 0.9 3.0 -4.9 -0.4 -0.4 2.5
Germany 200,000 2.7 2.9 4.4 3.0 1.5 2.7
UK 122,700 1.4 2.9 -2.0 1.1 2.4 3.1
Spain 74,300 -5.9 1.1 -4.0 -0.5 0.1 1.3
Avg EU 5 637,400 1.0 2.1 -1.3 1.0 0.8 2.2
Table 3: Real Estate turnover and % change
% Change YoY
Country 2010 2011 2012 2013 2014F 2015F Trend 2016
Italy Residential -5.9 -3.2 -1.1 -1.8 -1.4 0.2
Offices -2.9 -1.0 -1.0 -2.0 -1.7 -0.8
Industrial -7.0 3.2 -2.2 2.5 -2.2 -1.3
Commercial 1.0 1.0 1.0 0.2 0 1.2
Table 4: Real Estate price % change
Source: European Outlook 2015 - Scenari Immobiliari
Despite some elements of uncertainty, recovery signals have been observed in the EU area market in terms of turnover, starting from 2013 and are projected to be higher in 2014 and 2015 (+0.8% and +2.2% YoY respectively).The Italian market is undergoing a more complex scenario, due to the decrease in both volumes and prices expected in 2014.
Still, timid signs of improvement are foreseen starting from 2015, especially for Residential and Commercial assets in Italy where prices are expected to increase by o.2% and 1.2% respectively.Several Italian banks have launched aggressive lending campaigns for residential mortgage: this is expected to generate a positive effect on the real estate residential market.
From the investors point of view, the risk that speculative funds (opportunistic investors) are willing to bear is increasing: their focus is shifting towards opportunistic investments, leveraging on reversal tendencies expected in the Real Estate market in the short term.This is also connected to the descending trend in yields started in Q2-2014, which in turns is a reflection of a mix of factors such as:
i. the lowest 10 year Government Bond yield - which stood at 2.8% in July;
ii. greater competition among investors boosted by the increasing overheating of other European markets such as Spain; iii. the ongoing excess of liquidity available in the markets.
However this trend did not impact the yields of investors focused on core assets (including trophy assets).
Source: European Outlook 2015 - Scenari Immobiliari
Chart 4: CRE investment volume in Italy by geographical area
Source: BPN Paribas Real Estate, At a glace - Investimenti in Italia, H1-2014

PwC | 7
8 | The Italian NLP market | Time for deleveraging
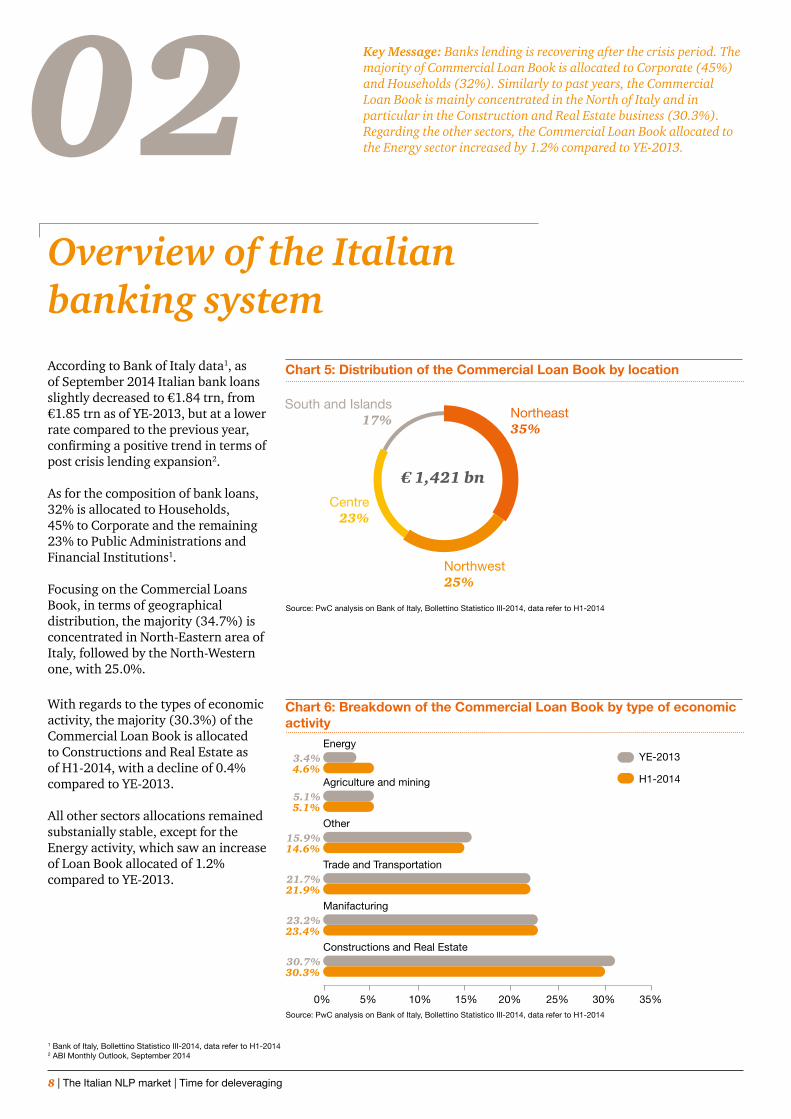
02Overview of the Italian banking systemAccording to Bank of Italy data1, as of September 2014 Italian bank loans slightly decreased to €1.84 trn, from €1.85 trn as of YE-2013, but at a lower rate compared to the previous year, confirming a positive trend in terms of post crisis lending expansion2.
As for the composition of bank loans, 32% is allocated to Households, 45% to Corporate and the remaining 23% to Public Administrations and Financial Institutions1.
Focusing on the Commercial Loans Book, in terms of geographical distribution, the majority (34.7%) is concentrated in North-Eastern area of Italy, followed by the North-Western one, with 25.0%.
Key Message: Banks lending is recovering after the crisis period. The majority of Commercial Loan Book is allocated to Corporate (45%) and Households (32%). Similarly to past years, the Commercial Loan Book is mainly concentrated in the North of Italy and in particular in the Construction and Real Estate business (30.3%). Regarding the other sectors, the Commercial Loan Book allocated to the Energy sector increased by 1.2% compared to YE-2013.
Chart 5: Distribution of the Commercial Loan Book by location
Chart 6: Breakdown of the Commercial Loan Book by type of economicactivity
Source: PwC analysis on Bank of Italy, Bollettino Statistico III-2014, data refer to H1-2014
Source: PwC analysis on Bank of Italy, Bollettino Statistico III-2014, data refer to H1-2014
1 Bank of Italy, Bollettino Statistico III-2014, data refer to H1-20142 ABI Monthly Outlook, September 2014
With regards to the types of economic activity, the majority (30.3%) of the Commercial Loan Book is allocated to Constructions and Real Estate as of H1-2014, with a decline of 0.4% compared to YE-2013.
All other sectors allocations remained substanially stable, except for the Energy activity, which saw an increase of Loan Book allocated of 1.2% compared to YE-2013.

PwC | 9
10 | The Italian NLP market | Time for deleveraging
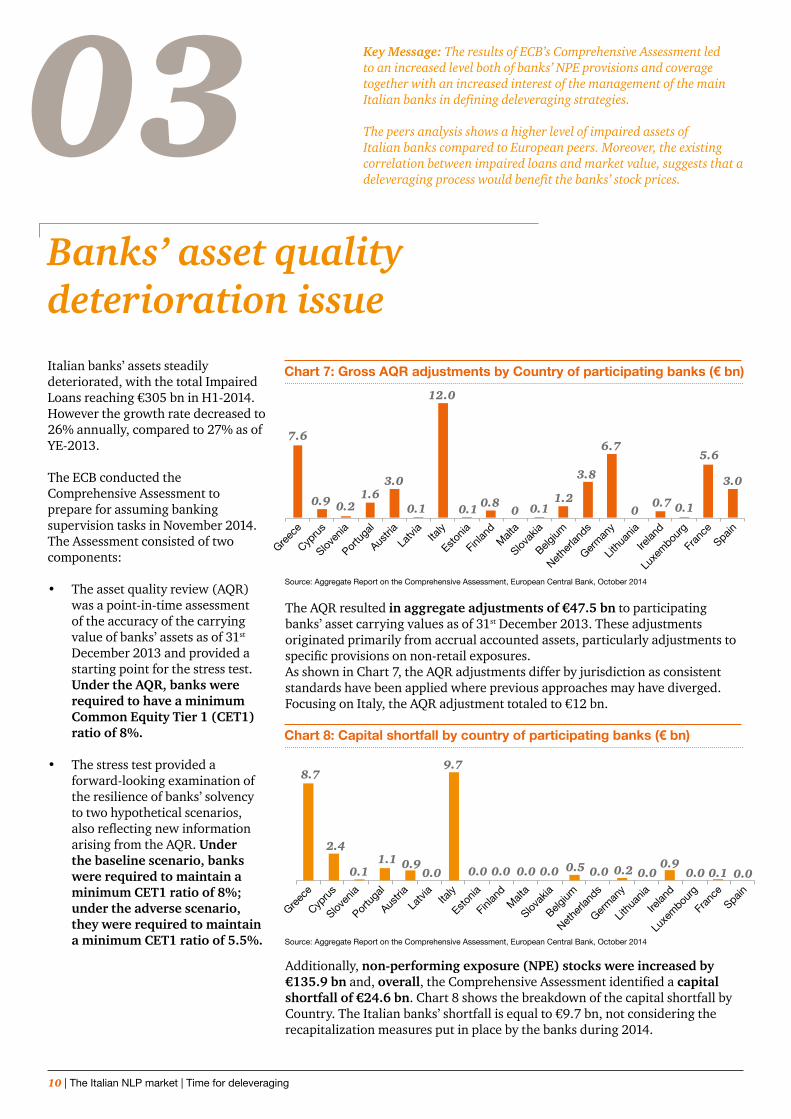
03Banks’ asset quality deterioration issueItalian banks’ assets steadily deteriorated, with the total Impaired Loans reaching €305 bn in H1-2014. However the growth rate decreased to 26% annually, compared to 27% as of YE-2013.
The ECB conducted the Comprehensive Assessment to prepare for assuming banking supervision tasks in November 2014. The Assessment consisted of two components:
• The asset quality review (AQR) was a point-in-time assessment of the accuracy of the carrying value of banks’ assets as of 31st December 2013 and provided a starting point for the stress test. Under the AQR, banks were required to have a minimum Common Equity Tier 1 (CET1) ratio of 8%.
• The stress test provided a forward-looking examination of the resilience of banks’ solvency to two hypothetical scenarios, also reflecting new information arising from the AQR. Under the baseline scenario, banks were required to maintain a minimum CET1 ratio of 8%; under the adverse scenario, they were required to maintain a minimum CET1 ratio of 5.5%.
Key Message: The results of ECB’s Comprehensive Assessment led to an increased level both of banks’ NPE provisions and coverage together with an increased interest of the management of the main Italian banks in defining deleveraging strategies.
The peers analysis shows a higher level of impaired assets of Italian banks compared to European peers. Moreover, the existing correlation between impaired loans and market value, suggests that a deleveraging process would benefit the banks’ stock prices.
The AQR resulted in aggregate adjustments of €47.5 bn to participating banks’ asset carrying values as of 31st December 2013. These adjustments originated primarily from accrual accounted assets, particularly adjustments to specific provisions on non-retail exposures. As shown in Chart 7, the AQR adjustments differ by jurisdiction as consistent standards have been applied where previous approaches may have diverged. Focusing on Italy, the AQR adjustment totaled to €12 bn.
Additionally, non-performing exposure (NPE) stocks were increased by €135.9 bn and, overall, the Comprehensive Assessment identified a capital shortfall of €24.6 bn. Chart 8 shows the breakdown of the capital shortfall by Country. The Italian banks’ shortfall is equal to €9.7 bn, not considering the recapitalization measures put in place by the banks during 2014.
Chart 7: Gross AQR adjustments by Country of participating banks (€ bn)
Source: Aggregate Report on the Comprehensive Assessment, European Central Bank, October 2014
Chart 8: Capital shortfall by country of participating banks (€ bn)
Source: Aggregate Report on the Comprehensive Assessment, European Central Bank, October 2014
PwC | 11
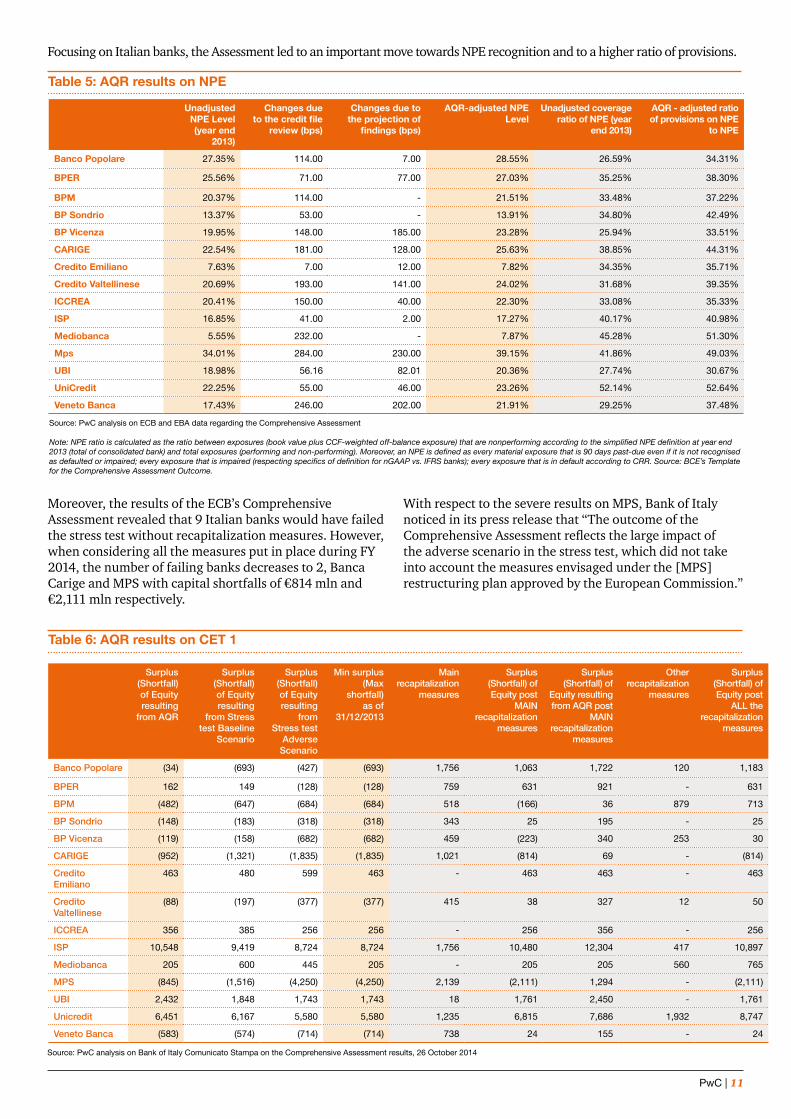
Focusing on Italian banks, the Assessment led to an important move towards NPE recognition and to a higher ratio of provisions.
Table 5: AQR results on NPE
Source: PwC analysis on ECB and EBA data regarding the Comprehensive Assessment
Note: NPE ratio is calculated as the ratio between exposures (book value plus CCF-weighted off-balance exposure) that are nonperforming according to the simplified NPE definition at year end 2013 (total of consolidated bank) and total exposures (performing and non-performing). Moreover, an NPE is defined as every material exposure that is 90 days past-due even if it is not recognised as defaulted or impaired; every exposure that is impaired (respecting specifics of definition for nGAAP vs. IFRS banks); every exposure that is in default according to CRR. Source: BCE’s Template for the Comprehensive Assessment Outcome.
Unadjusted NPE Level (year end
2013)
Changes due to the credit file
review (bps)
Changes due to the projection of
findings (bps)
AQR-adjusted NPE Level
Unadjusted coverage ratio of NPE (year
end 2013)
AQR - adjusted ratio of provisions on NPE
to NPE
Banco Popolare 27.35% 114.00 7.00 28.55% 26.59% 34.31%
BPER 25.56% 71.00 77.00 27.03% 35.25% 38.30%
BPM 20.37% 114.00 - 21.51% 33.48% 37.22%
BP Sondrio 13.37% 53.00 - 13.91% 34.80% 42.49%
BP Vicenza 19.95% 148.00 185.00 23.28% 25.94% 33.51%
CARIGE 22.54% 181.00 128.00 25.63% 38.85% 44.31%
Credito Emiliano 7.63% 7.00 12.00 7.82% 34.35% 35.71%
Credito Valtellinese 20.69% 193.00 141.00 24.02% 31.68% 39.35%
ICCREA 20.41% 150.00 40.00 22.30% 33.08% 35.33%
ISP 16.85% 41.00 2.00 17.27% 40.17% 40.98%
Mediobanca 5.55% 232.00 - 7.87% 45.28% 51.30%
Mps 34.01% 284.00 230.00 39.15% 41.86% 49.03%
UBI 18.98% 56.16 82.01 20.36% 27.74% 30.67%
UniCredit 22.25% 55.00 46.00 23.26% 52.14% 52.64%
Veneto Banca 17.43% 246.00 202.00 21.91% 29.25% 37.48%
Moreover, the results of the ECB’s Comprehensive Assessment revealed that 9 Italian banks would have failed the stress test without recapitalization measures. However, when considering all the measures put in place during FY 2014, the number of failing banks decreases to 2, Banca Carige and MPS with capital shortfalls of €814 mln and €2,111 mln respectively.
With respect to the severe results on MPS, Bank of Italy noticed in its press release that “The outcome of the Comprehensive Assessment reflects the large impact of the adverse scenario in the stress test, which did not take into account the measures envisaged under the [MPS] restructuring plan approved by the European Commission.”
Table 6: AQR results on CET 1
Surplus (Shortfall) of Equity resulting
from AQR
Surplus (Shortfall) of Equity resulting
from Stress test Baseline
Scenario
Surplus (Shortfall) of Equity resulting
from Stress test
Adverse Scenario
Min surplus (Max
shortfall) as of
31/12/2013
Main recapitalization
measures
Surplus (Shortfall) of Equity post
MAIN recapitalization
measures
Surplus (Shortfall) of
Equity resulting from AQR post
MAIN recapitalization
measures
Other recapitalization
measures
Surplus (Shortfall) of Equity post
ALL the recapitalization
measures
Banco Popolare (34) (693) (427) (693) 1,756 1,063 1,722 120 1,183
BPER 162 149 (128) (128) 759 631 921 - 631
BPM (482) (647) (684) (684) 518 (166) 36 879 713
BP Sondrio (148) (183) (318) (318) 343 25 195 - 25
BP Vicenza (119) (158) (682) (682) 459 (223) 340 253 30
CARIGE (952) (1,321) (1,835) (1,835) 1,021 (814) 69 - (814)
Credito Emiliano
463 480 599 463 - 463 463 - 463
Credito Valtellinese
(88) (197) (377) (377) 415 38 327 12 50
ICCREA 356 385 256 256 - 256 356 - 256
ISP 10,548 9,419 8,724 8,724 1,756 10,480 12,304 417 10,897
Mediobanca 205 600 445 205 - 205 205 560 765
MPS (845) (1,516) (4,250) (4,250) 2,139 (2,111) 1,294 - (2,111)
UBI 2,432 1,848 1,743 1,743 18 1,761 2,450 - 1,761
Unicredit 6,451 6,167 5,580 5,580 1,235 6,815 7,686 1,932 8,747
Veneto Banca (583) (574) (714) (714) 738 24 155 - 24
Source: PwC analysis on Bank of Italy Comunicato Stampa on the Comprehensive Assessment results, 26 October 2014
12 | The Italian NLP market | Time for deleveraging
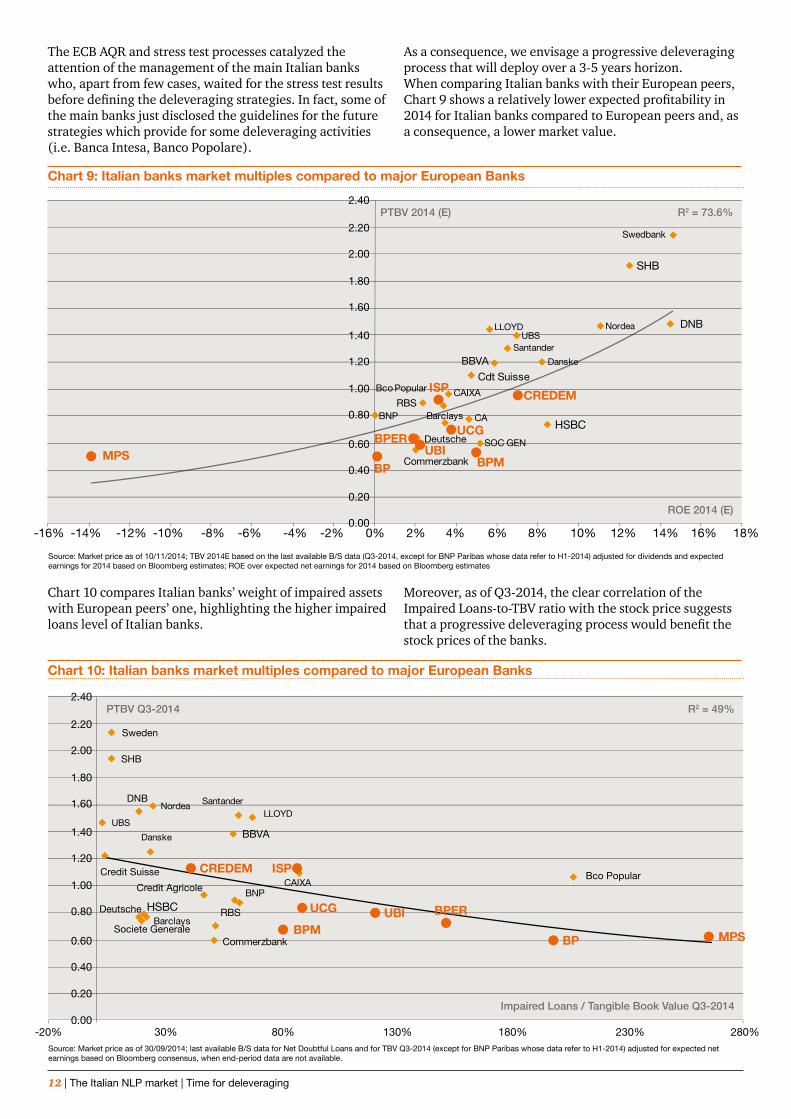
Chart 9: Italian banks market multiples compared to major European Banks
Chart 10: Italian banks market multiples compared to major European Banks
Source: Market price as of 10/11/2014; TBV 2014E based on the last available B/S data (Q3-2014, except for BNP Paribas whose data refer to H1-2014) adjusted for dividends and expected earnings for 2014 based on Bloomberg estimates; ROE over expected net earnings for 2014 based on Bloomberg estimates
Source: Market price as of 30/09/2014; last available B/S data for Net Doubtful Loans and for TBV Q3-2014 (except for BNP Paribas whose data refer to H1-2014) adjusted for expected net earnings based on Bloomberg consensus, when end-period data are not available.
The ECB AQR and stress test processes catalyzed the attention of the management of the main Italian banks who, apart from few cases, waited for the stress test results before defining the deleveraging strategies. In fact, some of the main banks just disclosed the guidelines for the future strategies which provide for some deleveraging activities (i.e. Banca Intesa, Banco Popolare).
As a consequence, we envisage a progressive deleveraging process that will deploy over a 3-5 years horizon.When comparing Italian banks with their European peers, Chart 9 shows a relatively lower expected profitability in 2014 for Italian banks compared to European peers and, as a consequence, a lower market value.
Chart 10 compares Italian banks’ weight of impaired assets with European peers’ one, highlighting the higher impaired loans level of Italian banks.
Moreover, as of Q3-2014, the clear correlation of the Impaired Loans-to-TBV ratio with the stock price suggests that a progressive deleveraging process would benefit the stock prices of the banks.

PwC | 13
14 | The Italian NLP market | Time for deleveraging
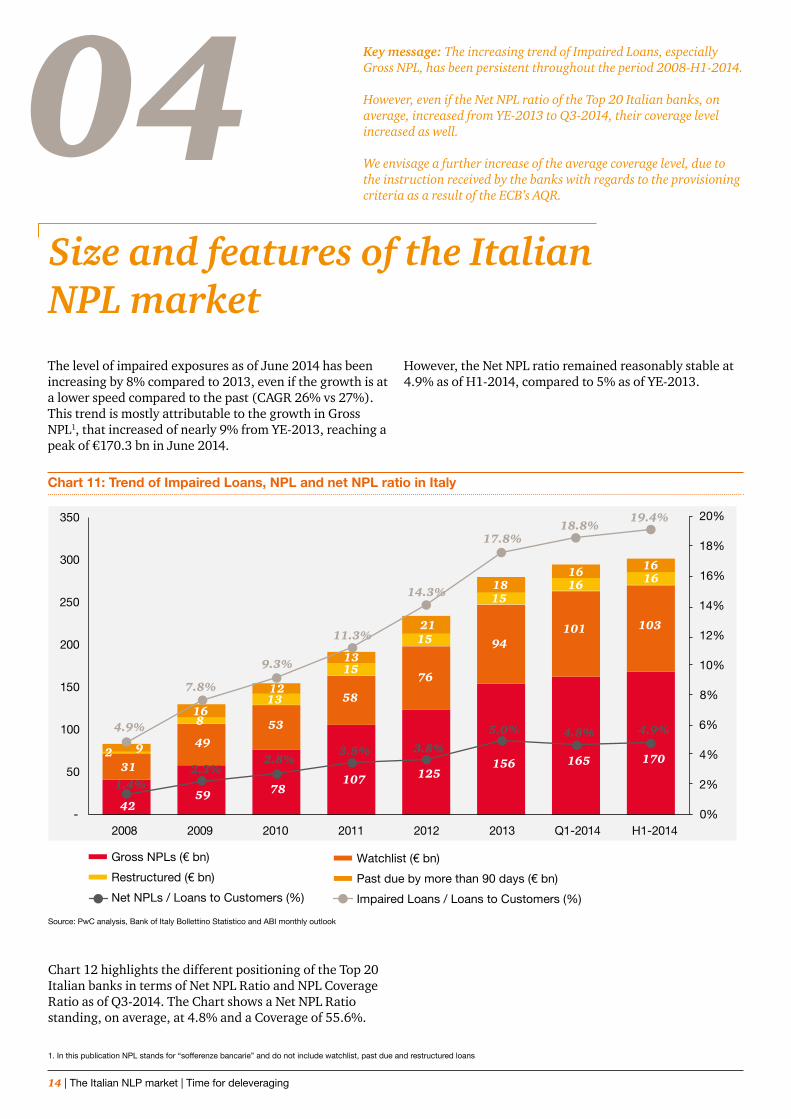
04Size and features of the Italian NPL marketThe level of impaired exposures as of June 2014 has been increasing by 8% compared to 2013, even if the growth is at a lower speed compared to the past (CAGR 26% vs 27%).This trend is mostly attributable to the growth in Gross NPL1, that increased of nearly 9% from YE-2013, reaching a peak of €170.3 bn in June 2014.
However, the Net NPL ratio remained reasonably stable at 4.9% as of H1-2014, compared to 5% as of YE-2013.
Key message: The increasing trend of Impaired Loans, especially Gross NPL, has been persistent throughout the period 2008-H1-2014.
However, even if the Net NPL ratio of the Top 20 Italian banks, on average, increased from YE-2013 to Q3-2014, their coverage level increased as well.
We envisage a further increase of the average coverage level, due to the instruction received by the banks with regards to the provisioning criteria as a result of the ECB’s AQR.
Chart 11: Trend of Impaired Loans, NPL and net NPL ratio in Italy
Source: PwC analysis, Bank of Italy Bollettino Statistico and ABI monthly outlook
1. In this publication NPL stands for “sofferenze bancarie” and do not include watchlist, past due and restructured loans
Chart 12 highlights the different positioning of the Top 20 Italian banks in terms of Net NPL Ratio and NPL Coverage Ratio as of Q3-2014. The Chart shows a Net NPL Ratio standing, on average, at 4.8% and a Coverage of 55.6%.

PwC | 15
Chart 12: Top 20 Italian Banks - NPL peer Analysis Q3-2014
Source: Financial statements data as of Q3-2014, except for Cariparma, BNL, BP Vicenza, Veneto Banca and Banca Sella whose data refer to H1-2014, and DB whose data refer to YE-2013
The average level of coverage in the Italian banking system has been improving compared to 2013 end, with some banks having increased significantly the level of provisioning also in connection to the results of the AQR which was carried out on a sample of the banks portfolio.
As a result of the AQR, the banks received instructions about the provisioning criteria to apply to the rest of the portfolio before year end: this will turn into a further increase of the average provisioning level.
Focusing on Top 10 banks, Chart 13 shows an increase, on average, in the Net NPL Ratio (from 3.9% as of YE-2013 to 4.6% as of Q3-2014). However, the coverage level increased as well, in Q3-2014 compared to YE-2013, with a peers average of 55.2% and 54.7% respectively.
Chart 13: Bubble chart NPL and Coverage level - Top 10 banks movements (Q3-2014 vs YE-2013)
Source: Financial statements as of YE-2013 vs Q3-2014, except for BNL and Cariparma whose data refer to YE-2013 vs H1-2014

16 | The Italian NLP market | Time for deleveraging
Overall, all remaining Top 20 banks show an increase in the average Net NPL Ratio (4.1% as of YE-2013 compared to 5.4% in Q3-2014). At the same time, the average coverage level increased from 53.7% to 54.8%, with a significant move of Banco Desio.
Chart 14: Bubble chart NPL and Coverage level - Other Top 20 banks movements (Q3-2014 vs YE-2013)
Source: Financial statements as of YE-2013 vs Q3-2014, except for BP Vicenza, Veneto Banca and Banca Sella whose data refer to YE-2013 vs H1-2014. For DB no data available to be compared to YE-2013

PwC | 17
18 | The Italian NLP market | Time for deleveraging
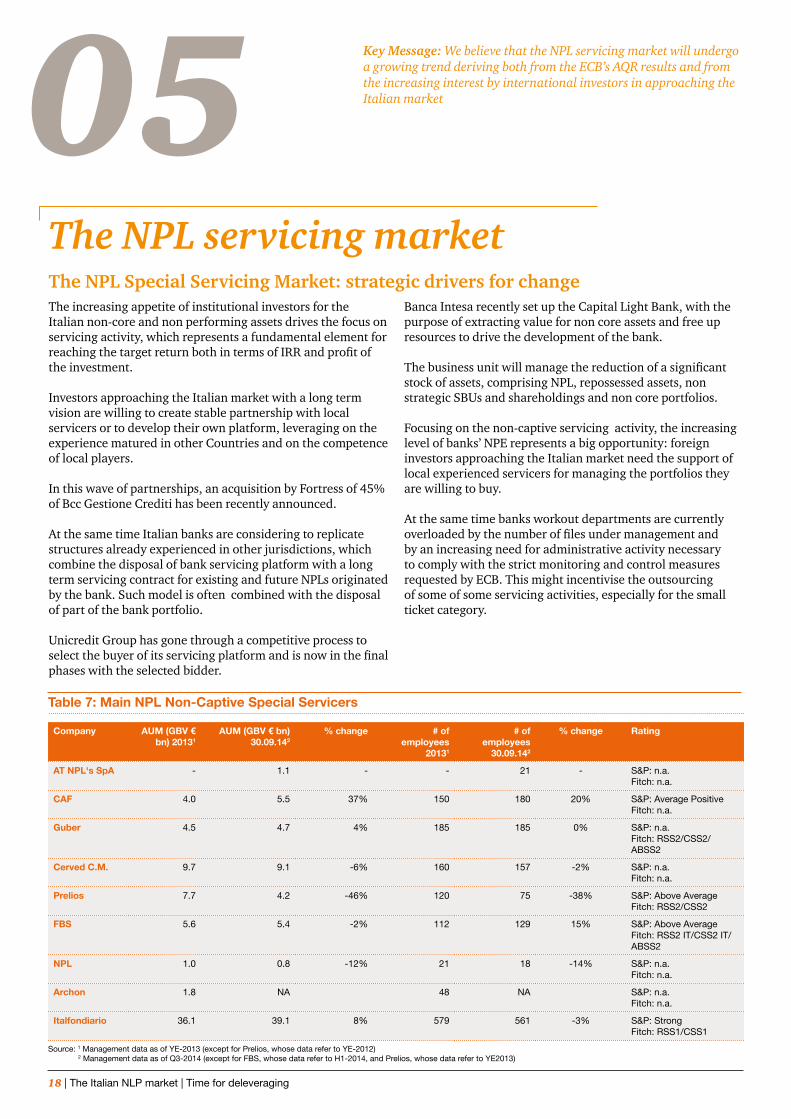
05The NPL servicing marketThe NPL Special Servicing Market: strategic drivers for changeThe increasing appetite of institutional investors for the Italian non-core and non performing assets drives the focus on servicing activity, which represents a fundamental element for reaching the target return both in terms of IRR and profit of the investment.
Investors approaching the Italian market with a long term vision are willing to create stable partnership with local servicers or to develop their own platform, leveraging on the experience matured in other Countries and on the competence of local players.
In this wave of partnerships, an acquisition by Fortress of 45% of Bcc Gestione Crediti has been recently announced.
At the same time Italian banks are considering to replicate structures already experienced in other jurisdictions, which combine the disposal of bank servicing platform with a long term servicing contract for existing and future NPLs originated by the bank. Such model is often combined with the disposal of part of the bank portfolio.
Unicredit Group has gone through a competitive process to select the buyer of its servicing platform and is now in the final phases with the selected bidder.
Banca Intesa recently set up the Capital Light Bank, with the purpose of extracting value for non core assets and free up resources to drive the development of the bank.
The business unit will manage the reduction of a significant stock of assets, comprising NPL, repossessed assets, non strategic SBUs and shareholdings and non core portfolios.
Focusing on the non-captive servicing activity, the increasing level of banks’ NPE represents a big opportunity: foreign investors approaching the Italian market need the support of local experienced servicers for managing the portfolios they are willing to buy.
At the same time banks workout departments are currently overloaded by the number of files under management and by an increasing need for administrative activity necessary to comply with the strict monitoring and control measures requested by ECB. This might incentivise the outsourcing of some of some servicing activities, especially for the small ticket category.
Key Message: We believe that the NPL servicing market will undergo a growing trend deriving both from the ECB’s AQR results and from the increasing interest by international investors in approaching the Italian market
Company AUM (GBV € bn) 20131
AUM (GBV € bn) 30.09.142
% change # of employees
20131
# of employees
30.09.142
% change Rating
AT NPL's SpA - 1.1 - - 21 - S&P: n.a.Fitch: n.a.
CAF 4.0 5.5 37% 150 180 20% S&P: Average Positive Fitch: n.a.
Guber 4.5 4.7 4% 185 185 0% S&P: n.a.Fitch: RSS2/CSS2/ABSS2
Cerved C.M. 9.7 9.1 -6% 160 157 -2% S&P: n.a. Fitch: n.a.
Prelios 7.7 4.2 -46% 120 75 -38% S&P: Above Average Fitch: RSS2/CSS2
FBS 5.6 5.4 -2% 112 129 15% S&P: Above Average Fitch: RSS2 IT/CSS2 IT/ABSS2
NPL 1.0 0.8 -12% 21 18 -14% S&P: n.a. Fitch: n.a.
Archon 1.8 NA 48 NA S&P: n.a. Fitch: n.a.
Italfondiario 36.1 39.1 8% 579 561 -3% S&P: Strong Fitch: RSS1/CSS1
Source: 1 Management data as of YE-2013 (except for Prelios, whose data refer to YE-2012) 2 Management data as of Q3-2014 (except for FBS, whose data refer to H1-2014, and Prelios, whose data refer to YE2013)
Table 7: Main NPL Non-Captive Special Servicers

PwC | 19
Focus on Non-Captive Special Servicers
According to company management data provided to PwC, non-captive players service the entire Italian territory and all of them, with different weight, manage a mix of secured and unsecured exposures.
Each servicer have peculiarities in terms of loans managed by Asset Manager (on average, 190 secured positions and 1800 unsecured ones), number of external lawyer used and business model (e.g. ticket size, generalist vs specialized,…)
Source: PwC analysis on companies’ management data as of 30.09.2014 (except for FBS, whose data refer to H1-2014, Prelios and Archon, whose data refer to YE-2013)
Chart 15 - Borrowers Geographical breakdown (Mix in %)
Chart 16 - Type of loans managed by GBV (Mix in %)
Chart 17 - Type of Loan Resolution - Secured (Mix in %)
Chart 18 - Type of Loan Resolution - Unsecured (Mix in %)

20 | The Italian NLP market | Time for deleveraging
06Market recent activity and outlookRecent activity and trends Market outlookAccording to our observatory, 5 portfolio transactions closed from the beginning of 2014 to H1-2014, for an aggregate GBV of €2.5 bn. There are also 5 ongoing transactions, totaling nearly €6 bn of GBV.
Investors are mainly still focused on unsecured loans: the slow recovery trend for the real estate market and the connected persisting issue of the length of the foreclosure procedure represent one of the main reasons for the differences in pricing of the mortgage loans positions.The liquidity in the system is pushing some financial institutions to make available on the market financing at relatively low rates for the senior part of NPL portfolio investment: this turns into the possibility for some of the institutional investors to leverage, thus reducing the discount rate applicable in the valuation of the NPL portfolios.
The combined effect of increasing provisions, due to AQR results, and decreasing discount rates, due to financing at relatively low rates, is progressively bridging the bid and ask gap between the value of the assets in the banks book and the price offered by the investors.
We perceive an increasing interest by the international investors interested in approaching Italy with a long term investment strategy (more than a spot and opportunistic one) in asset classes that range from consumer loans to SMEs, mortgage and leasing. In such a framework investors are looking also at possible acquisitions/partnerships with local servicers. This will lead to a further consolidation in the independent servicing market and could create possible opportunities for small but efficient local operators to team up with strong investors, thus having access to a much larger market.
On the other hand, banks that have been focused on AQR and Stress Test exercise by ECB for months are now switching their focus on developing strategies aimed at combining deleveraging with value creation. In such a framework we see also an increasing interest by some banks in exploring partnership like solutions involving the servicing platform that could combine the need of deleveraging NPL exposure and enhancing the performances on the portfolio of the bank.
The combination of the above factors is expected to drive an increasing level of transactions starting from H1-2015.
Date Closed / Ongoing Seller Volume (€mln) Type of portfolio BuyerOngoing Ongoing Confidential 700 Mixed Secured/Unsecured Not assigned
Ongoing Ongoing Confidential 600 Mixed Secured/Unsecured Not assigned
Ongoing Ongoing Confidential 60 Utility Not assigned
Ongoing Ongoing Confidential 900 Consumer Not assigned
Ongoing Ongoing UCCMB 4.400 Platform & NPL Mixed Sec/Unsec
Not assigned
2014 Q4 Closed Cassa Centrale Banca
250 Mixed Secured/Unsecured CRC
2014 Q2 Closed MPS 500 Mixed Secured/Unsecured Fortress
2014 Q2 Closed CR Ravenna 43 Unsecured HIG Capital
2014 Q2 Closed Confidential 1.263 Consumer Banca IFIS
2014 Q1 Closed CreVal 36 Mixed Secured/Unsecured Ares Management
2014 Q1 Closed Unicredit 700 Mixed Secured/Unsecured Anacap
Main public portfolio transactions in 2014
Source: PwC analysis on public available information

PwC | 21
Market outlook
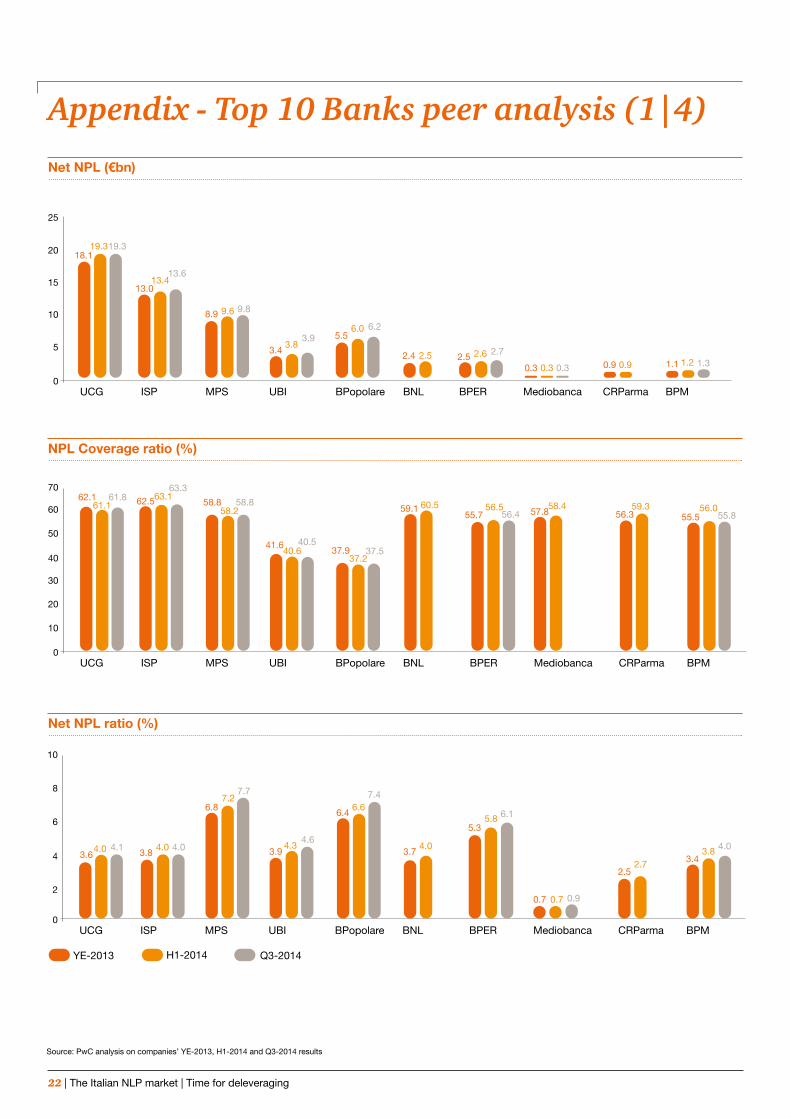
22 | The Italian NLP market | Time for deleveraging
Net NPL (€bn)
NPL Coverage ratio (%)
Net NPL ratio (%)
Source: PwC analysis on companies’ YE-2013, H1-2014 and Q3-2014 results
Appendix - Top 10 Banks peer analysis (1|4)
PwC | 23
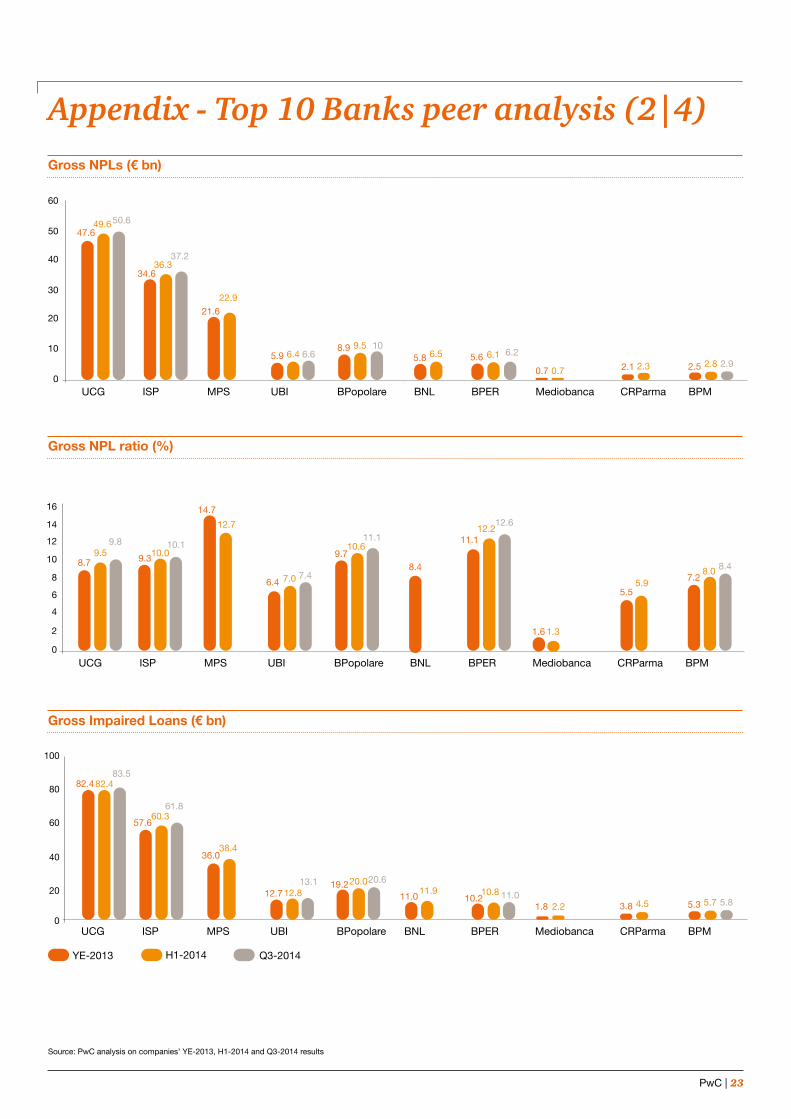
Gross NPLs (€ bn)
Gross NPL ratio (%)
Gross Impaired Loans (€ bn)
Appendix - Top 10 Banks peer analysis (2|4)
Source: PwC analysis on companies’ YE-2013, H1-2014 and Q3-2014 results

24 | The Italian NLP market | Time for deleveraging
Net Impaired Loans (€ bn)
Impaired Loans Coverage ratio (%)
Yearly loan loss provision / Net interest margin (%)
Appendix - Top 10 Banks peer analysis (3|4)
Source: PwC analysis on companies’ YE-2013, H1-2014 and Q3-2014 results

PwC | 25
Net NPL / Equity (%)
Appendix - Top 10 Banks peer analysis (4|4)
Source: PwC analysis on companies’ YE-2013, H1-2014 and Q3-2014 results
Writedowns/ Loans to consumers (%)

26 | The Italian NLP market | Time for deleveraging
PwC | 27
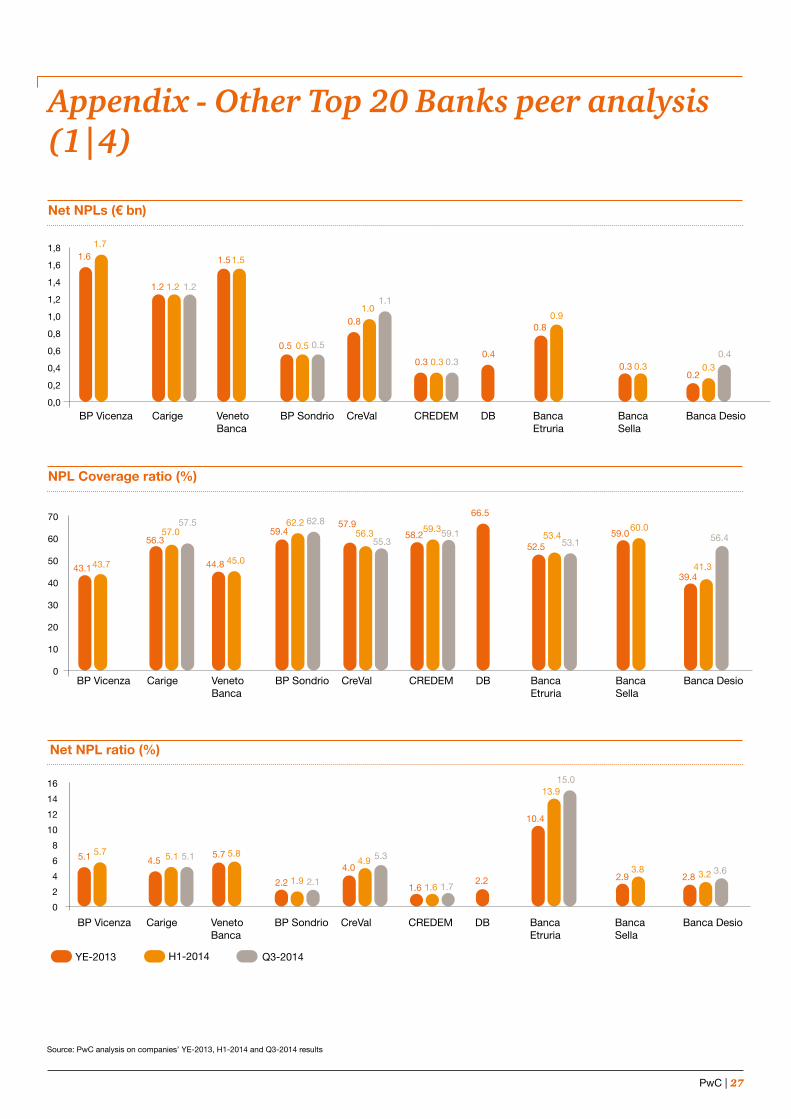
Net NPLs (€ bn)
NPL Coverage ratio (%)
Appendix - Other Top 20 Banks peer analysis (1|4)
Source: PwC analysis on companies’ YE-2013, H1-2014 and Q3-2014 results
Net NPL ratio (%)
28 | The Italian NLP market | Time for deleveraging
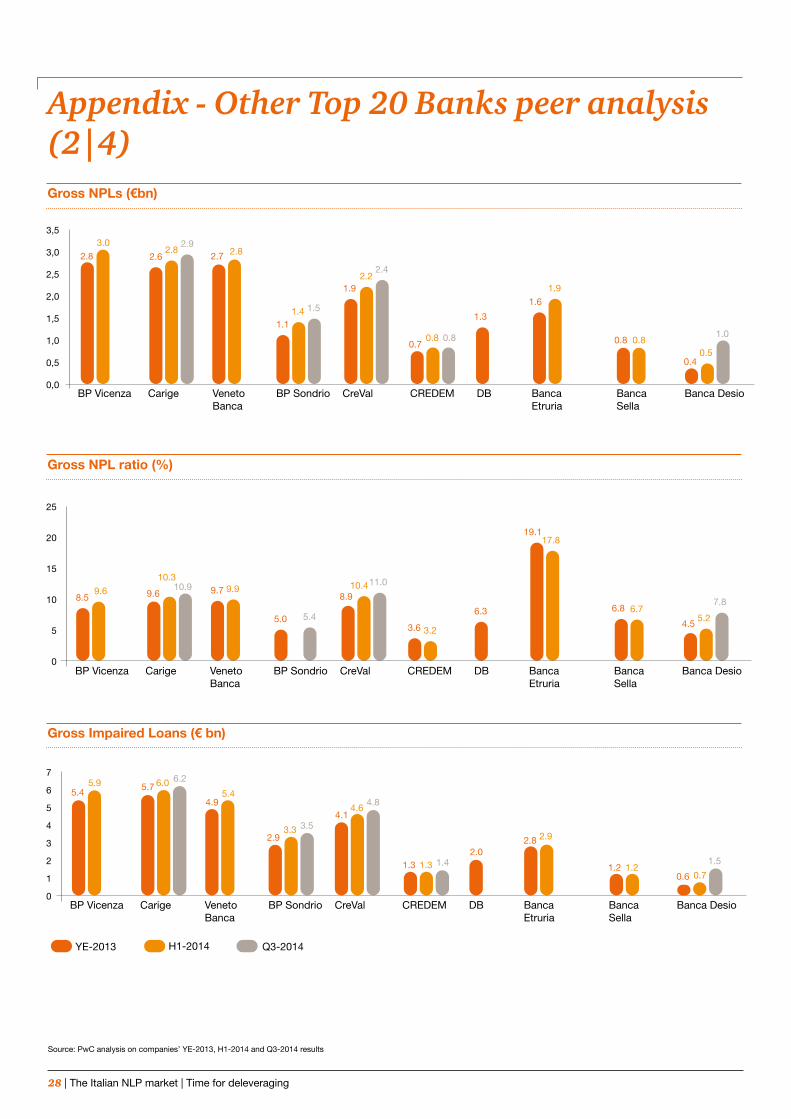
Appendix - Other Top 20 Banks peer analysis (2|4)Gross NPLs (€bn)
Gross NPL ratio (%)
Gross Impaired Loans (€ bn)
Source: PwC analysis on companies’ YE-2013, H1-2014 and Q3-2014 results
PwC | 29
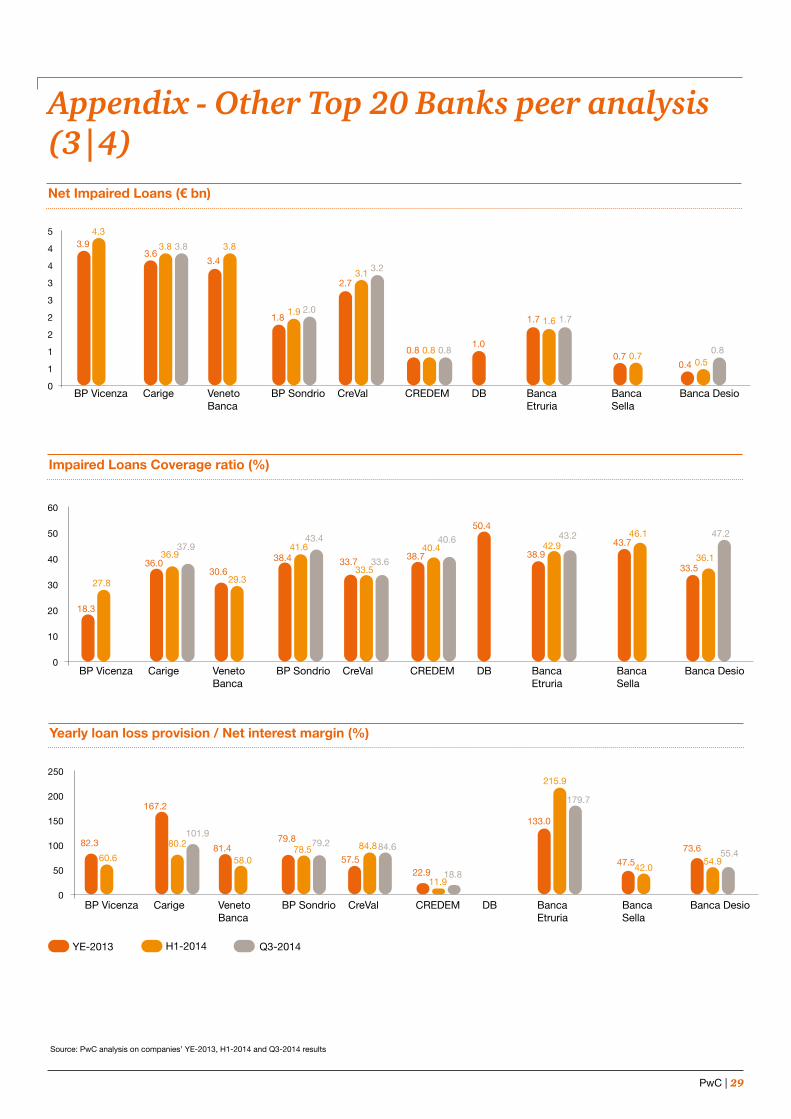
Appendix - Other Top 20 Banks peer analysis (3|4)Net Impaired Loans (€ bn)
Impaired Loans Coverage ratio (%)
Yearly loan loss provision / Net interest margin (%)
Source: PwC analysis on companies’ YE-2013, H1-2014 and Q3-2014 results
30 | The Italian NLP market | Time for deleveraging
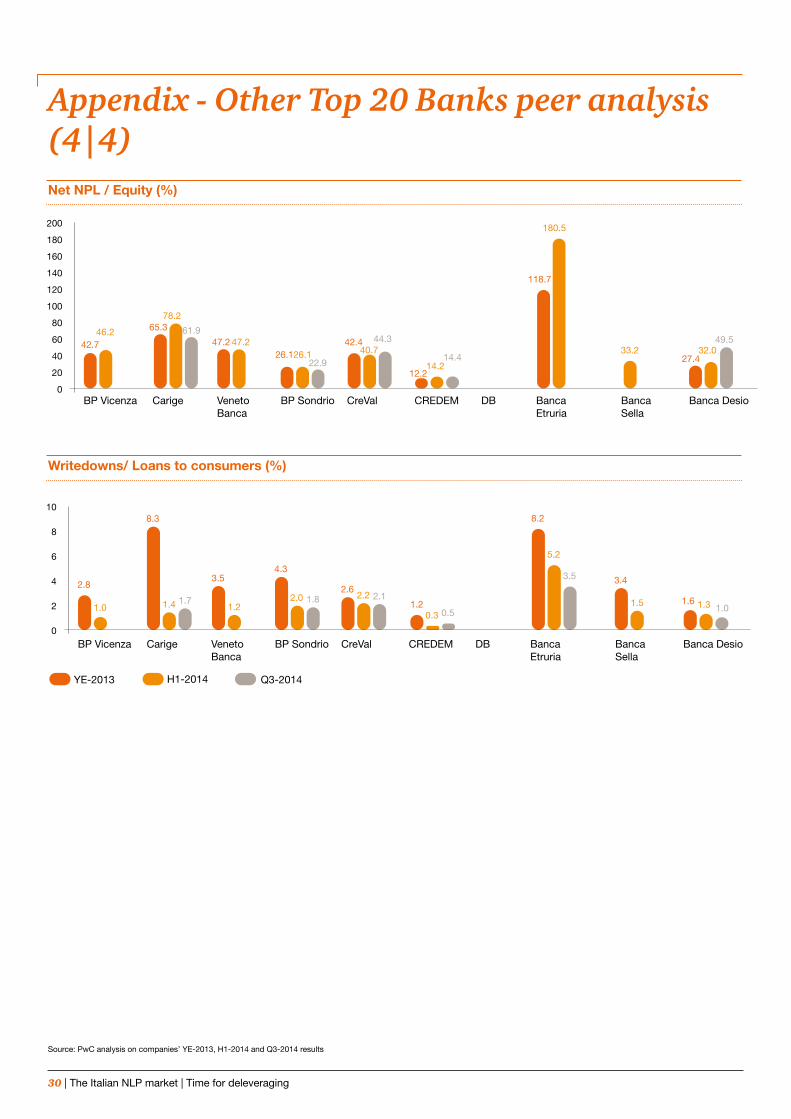
Appendix - Other Top 20 Banks peer analysis (4|4)Net NPL / Equity (%)
Writedowns/ Loans to consumers (%)
Source: PwC analysis on companies’ YE-2013, H1-2014 and Q3-2014 results


32 | The Italian NLP market | Time for deleveraging
Portfolio Advisory Group
PricewaterhouseCoopers Advisory SpAVia Monte Rosa, 9120149 MilanoTel. 02 80646.1
This publication has been prepared for general guidance on matters of interest only, and does not constitute professional advice. You should not act upon the infor-mation contained in this publication without obtaining specific professional advice. No representation or warranty (express or implied) is given as to the accuracy or completeness of the information contained in this publication, and, to the extent permitted by law, PricewaterhouseCoopers Advisory SpA, its members, employees and agents do not accept or assume any liability, responsibility or duty of care for any consequences of you or anyone else acting, or refraining to act, in reliance on the information contained in this publication or for any decision based on it.© 2015 PricewaterhouseCoopers Advisory SpA. All rights reserved. In this document, “PwC” refers to PricewaterhouseCoopers Advisory SpA which is a member firm of PricewaterhouseCoopers International Limited, each member firm of which is a separate legal entity.