Embed Size (px)
Citation preview

1
January 2020
NPL TRANSACTION MARKET AND SERVICING INDUSTRY2019 AND FORECAST 2020

2
NPL Industry
6. Enormous amount of NPEs to manage: in Italy there are ~325 Bn€ of NPLs and UtPs yet to be recovered
7. Servicers financial data confirms the need to invest to run the industry: from 2014 to 2018 strong annual average increase for both human resources +4% and
for investments +21% per year
8. Very dynamic M&A in the servicer sector: we can see both interest of foreign investors as well as a strong JV trend
NPL transactions and pipeline
4. NPL Transaction market continues to function actively: 2019 NPL transactions reached 32 Bn€ + 6 Bn€ of UtP, with an increasing share of secondary market (17%
out of total)
5. In 2020 portfolio disposals will go on to support the achievement of the NPL ratio European target (5% NPE ratio): expected at 37 Bn€ with a growing
incidence of secondary market + 7 Bn€ of UtP
MARKET WATCH NPL
Italian Banks NPE’s scenario
1. Improving situation in the Italy bank NPE stock: gross NPE stocks have halved since 2015 peak and we expect they will close 2019 at 145 Bn€ with an NPE ratio
forecasted at 7,7%
2. There is still a long way to go: Italy has one of the strongest reductions in NPE ratio amongst other European countries, but it still has one of the biggest NPE ratio
(in Q2 2019: 8% vs 3% EU average vs 5% which constitutes the target required by the ECB)
3. The state of new non-performing flows remains dynamic: the pace of deterioration of performing loan is back to the pre-crisis levels but the switch from UtPs to
NPLs remains higher than pre-crisis level because of Construction Industry

3
GACS role in NPL market
1. GACS supports market volumes: from 2016 transazctions subject to securitization with GACS have involved 24 deals for an amount of 70 Bn€: in 2020 an additional
6 billion euros of transactions assisted by GACS are estimated
2. Average prices show an upward trend: the average market prices move according to secured share of GBV in the different years
3. GACS deals show a good recovery performance vs original business plan: the cumulative Gross and Net Collection average ratios of GACS portfolios included in
the analysis (historical data available) are performing slightly ahead the original business plan thanks to 5 portfolios above the target for both net and gross
collection indicators
4. Recovery performance is averaging 3% on yearly basis: so far it doesn’t depend on secured incidence and debtor type (Corporate or Individual) of GACS
portfolios
MARKET WATCH NPL

4MARKET WATCH NPL

5MARKET WATCH NPL Sources: Banca d’Italia, based on Statistical Database; NPE ratio revised on EBA guidelines; Q4 2019, 2020, Forecast: Banca IFIS internal estimate
Bank NPE - Bn€ and Percentages
-25%
-53%
12 13 21 18 12 14 7 5 5 5 5 4 4 4 4 4 4
127117
94 91 86 83 79 76 74 69 64 6253 5876 94 11313
15
1515
1778
107
125
156
184 201201
167 164
132123
100 92 90 8677
55
157
194
237
283
327341
325
266 260
223211
182172 168
159145
1218,9%
10,8%
13,3%
16,7% 17,1% 17,0%16,3%
13,6% 13,3%
11,5%11,0%
9,5%9,0% 9,0%
8,3%7,7%
6,5%
-1%
4%
9%
14%
19%
24%
0,0
50,0
100,0
150,0
200,0
250,0
300,0
350,0
400,0
FY 2010 FY 2011 FY 2012 FY 2013 FY 2014 FY 2015 FY 2016 FY 2017 Q1 2018 Q2 2018 Q3 2018 Q4 2018 Q1 2019 Q2 2019 Q3 2019 Q4 2019
Est
2020 Est
Past Due Unlikely to Pay Watchlist Restructured Bad Loans NPE Ratio
Classification of impaired Loans updated in 2015

6MARKET WATCH NPL Sources: EBA “Risk Dashboard” report, NPL ratio based on weighted average
Q4 2015
Q2 2019
1,1
1,0 1,0 0,9
0,9 0,8 0,8
0,7 0,7 0,7 0,7 0,6
Q4
2015
Q4
2016
Q1
2017
Q2
2017
Q3
2017
Q4
2017
Q1
2018
Q2
2018
Q3
2018
Q4
2018
Q1
2019
Q2
2019
47% 4% 6% 19% 17% 3% 19% 6%
GR FR ES PT IT DE IE EU
39% 3% 4% 9% 8% 1% 5% 3%
NPL Ratio recalculated bases on the solution implemented by the EBA to disseminate information on EU’s largest banks, as established by Decision EBA/DC/130
*Note that the terms “non-performing exposure (NPE) and “non-performing loan” (NPL) are used unterchangeably in the EBA “Risk Dashboard”
European Landscape - Bank NPE Ratio* - PercentagesEuropean Non Performing Loans – Tn€
34% 33% 34% 34% 33% 33% 33% 30% 30% 28% 26%
12% 19% 13% 3% 22% 5% 1%-50% EU NPE %
-16%
-35%-45%
-53% -53% -58%
-75%
-48%

7MARKET WATCH NPL Sources: Banca d’Italia, based on Statistical Database; Forecast: Banca IFIS internal estimate
Bank Gross Bad Loans/Total Asset by debtor type - Percentages
Bank Bad Loans - Bn€ and Percentages
4,1%
8,1%9,9%
13,4%
16,2%18,0% 18,4%
16,1% 15,6%
12,9% 12,1%
9,9% 9,3% 9,2% 8,8% 8,7% 8,1%
3,8%5,1% 5,9%
6,8% 7,5% 7,9% 7,8%6,7% 6,7%
5,6% 5,2% 4,4% 4,2% 4,0% 4,0% 3,2% 3,0%
FY 2010 FY 2011 FY 2012 FY 2013 FY 2014 FY 2015 FY 2016 FY 2017 Q1 2018 Q2 2018 Q3 2018 Q4 2018 Q1 2019 Q2 2019 Q3 2019 Nov'19 Est 2019
NPL Ratio Corporate NPL Ratio Individual
53% 52% 48% 49% 54% 56% 57% 62% 68% 68% 67% 68% 66% 65% 64% 63% 63%Coverage
rate %
-60%
-66%
78
107125
156
184201 201
167 164
132123
100 92 90 86 80 77
3752
6580 85 89 87
6453
43 40 32 32 32 31 30 28
FY 2010 FY 2011 FY 2012 FY 2013 FY 2014 FY 2015 FY 2016 FY 2017 Q1 2018 Q2 2018 Q3 2018 Q4 2018 Q1 2019 Q2 2019 Q3 2019 NOV'19 EST 2019
Gross Bad Loans Net Bad Loans

8MARKET WATCH NPL Sources: Banca d’Italia, based on Statistical Database; Forecast: Banca IFIS internal estimate
4,5%4,8%
6,3%
7,5% 7,5%
6,3%5,9%
4,8% 4,6% 4,4% 4,3%4,1% 4,0% 3,8%
3,6%3,3%
FY 2010 FY 2011 FY 2012 FY 2013 FY 2014 FY 2015 FY 2016 FY 2017 Q1 2018 Q2 2018 Q3 2018 Q4 2018 Q1 2019 Q2 2019 Q3 2019 Q4 2019 Est
UtP Ratio
19% 18% 21% 23% 27% 27% 33% 34% 38% 38% 38% 39% 39% 39% 39% 39%
Bank UtP - Bn€ and Percentages
Bank Gross UtP/Total Asset - Percentages
-47%
Coverage
rate %
6674
91
109
131 127117
94 91 86 83 79 76 73 69 6454
6071
8396 92
79
6257 54 52 48 47 45 42 39
FY 2010 FY 2011 FY 2012 FY 2013 FY 2014 FY 2015 FY 2016 FY 2017 Q1 2018 Q2 2018 Q3 2018 Q4 2018 Q1 2019 Q2 2019 Q3 2019 Q4 2019
EST
Gross UtP
Net UtP

9
1,9% 1,9%
3,2%
5,8%
4,3% 4,6%
6,5%7,4%
6,6%
4,7%
3,5%2,7%
2,1% 1,8%
1,4% 1,6%2,2% 2,5% 2,1% 1,8% 2,2% 2,0% 1,8% 1,8% 1,4% 1,1% 0,9%
0,8%
2006 2007 2008 2009 2010 2011 2012 2013 2014 2015 2016 2017 2018 2019
Corporate
Individual
MARKET WATCH NPL Sources: Banca IFIS internal analysis based on Banca d’Italia statistical Database
Banks’ NPE Inflows from Performing and Deterioration rate by debtor type - Bn€ and Percentages
Deterioration rate - Percentages
Deterioration rate: Annual flow of adjusted non-performing loans/Stock of performing loans at the previous year (2019 annualized estimate data)
3 4 7 8 12 9 12 13 10 10 6 5 4 413 15
29
56 40 4056 59
4932
23 18 13 12
16 19
35
64
53 49
68 7159
42
2923
18 16
1,5% 1,5%
2,5%
4,3%
3,4%3,1%
4,2%4,5%
4,0%
3,1%
2,2%1,8%
1,3% 1,2%
0,00
0,01
0,02
0,03
0,04
0
20
40
60
80
100
2006 2007 2008 2009 2010 2011 2012 2013 2014 2015 2016 2017 2018 2019 Est
Corporate
Individual
Deterioration rate

10
2 2 3 5 6 6 5 6 5 6 6 5 4 49 10
15
26 26 2633
4235 33 28
2118 13
11 1218
31 33 32
39
49
42 4035
2721
180,9% 0,9%
1,2%
1,9% 2,0%1,8%
2,3%
3,0%2,7% 2,7%
2,4%
1,9%
1,5%
1,2%
-0,4%
0,1%
0,6%
1,1%
1,6%
2,1%
2,6%
3,1%
-5
5
15
25
35
45
55
65
2006 2007 2008 2009 2010 2011 2012 2013 2014 2015 2016 2017 2018 2019 Est
Corporate
Individual
Danger rate
MARKET WATCH NPL Sources: Banca IFIS internal analysis based on Banca d’Italia statistical Database
Migration from UTP/Past Due to NPL and Danger rate by debtor type - Bn€ and Percentages
Danger rate - Percentages
Danger rate: Annualized flow of new adjusted bad loans/Stock of performing loans at the previous year (2019 annualized estimate data)
1,2% 1,1%1,5%
2,6% 2,6% 2,5%
3,4%
4,8%4,4% 4,2%
3,7%2,9%
2,4%1,9%
0,8% 0,8% 0,9% 1,3% 1,4% 1,4% 1,3% 1,4% 1,3% 1,5% 1,5% 1,2%1,3%
0,8%
2006 2007 2008 2009 2010 2011 2012 2013 2014 2015 2016 2017 2018 2019 Est
Corporate
Individual

11
1,86% 1,80% 1,28%2,11% 2,22% 2,07%
2,95%
4,68%
2,67%3,35%
11,08%
6,44%
3,70% 4,23%
1,80%1,18% 1,61%
5,00%
1,76% 1,82% 1,87%
Deterioration rate
Corporate
Industrial Services Construction Real Estate Trade Agriculture
2006 2015 2019 Est
MARKET WATCH NPL Sources: Banca IFIS internal analysis based on Banca d’Italia statistical Database
1,17% 1,28% 0,89% 1,24% 1,16% 1,31% 1,58%
4,20%
2,40%3,01%
8,79%
6,36%
3,69% 3,51%
1,85%1,23% 1,14%
5,14%
2,57%1,62% 1,92%
Danger rate Corporate Industrial Services Construction Real Estate Trade Agriculture
Deterioration rate corporate - %
Danger rate corporate - %
Deterioration rate: Annual flow of adjusted non-performing loans/Stock of performing loans at the previous year (2019 annualized estimate data) Danger rate: Annualized flow of new adjusted bad loans/Stock of performing loans at the previous year (2019 annualized estimate data)

12MARKET WATCH NPL

13
19 17
71 66
32 31
6
2015 2016 2017 2018 2019 2020 Est
Estimation
Pipeline
Actual
43 50 64 83 88 33
2015 2016 2017 2018 2019 2020
# Deals
MARKET WATCH NPL Sources: Banca IFIS NPL Market Database – Press releases and news – Banca IFIS internal estimate
% Secondary
% GACS
NPL Transactions - Bn€ and Percentages
15%0% 3% 45% 43% 27%
27%31% 51% 4% 2% 17%
Bn€ 37
33
6

14MARKET WATCH NPL Sources: Banca IFIS NPL Market Database – Press releases and news - Banca IFIS internal estimate
7%19%
11% 8%15%
55%
49%
14%12%
29%
36%13%
4% 16%
28%
0%
5%
42%
45%
23%
2%
14%
30%19%
5%
2015 2016 2017 2018 2019
Mixed mostly Unsecured
Mixed mostly Secured
Mixed
Unsecured
Secured
NPL Transactions by portfolio type - Bn€ and Percentages
19 17 71 67 32Bn€

15MARKET WATCH NPL Sources: Banca IFIS NPL Market Database – Press releases and news – Banca IFIS interna estimate
NPL Transactions: Estimated avg prices - Percentages
19%
32%
5%
28%
33%
6%
21%
34%
8%
Mixed Secured Unsecured
2017 2018 2019

16MARKET WATCH NPL
41,5
32,8
16,3 13,8
9,0 4,2 4,2 4,2 4,1 3,8
Unicredit MPS Banco BPM Intesa Sanpaolo Veneto Banks Gruppo Carige BPER Creval Cassa Centrale Banca UBI
Mainly Unsecured Mailnly Secured Mixed Unsecured Secured
29,2
18,6
12,3 10,8 9,8 9,0
5,4 5,0 4,5 4,4
Quaestio Capital
Management Sgr
Banca IFIS Fortress; PIMCO Lindorf-Intrum -
CarVal Investors
Credito Fondiario SGA Christofferson Robb Illimity Anacap MBCredit Solution
2015- 2019 NPL Transactions Top Originator Sellers - Bn€
2015- 2019 NPL Transactions Top Buyers - Bn€
Sources: Banca IFIS NPL Market Database – Press releases and news - Banca IFIS internal estimate

17MARKET WATCH NPL Sources: Banca IFIS NPL Market Database – Press releases and news
Buyer Bn€ GBV Servicer Seller
Amco (ex SGA) 1,1 Amco (ex SGA) Gruppo Carige
Amco (ex SGA) 0,2 Amco (ex SGA) Banca del Fucino
Bain Capital Credit 0,6 Aquileia Capital Services Monte dei Paschi di Siena
Banca IFIS 2,4 Banca IFIS All confidential deals
Banca IFIS 0,3 Banca IFIS Findomestic Banca
Banca IFIS 0,2 Banca IFIS Gruppo ICCREA
Barclays Bank, Guber Banca 0,2 Guber Banca Unicredit
Barclays Bank, Guber Banca 0,9 Guber Banca Confidential
Gruppo Arrow Global 0,3 WhiteStar Asset Solutions Cassa Centrale Banca
Guber Banca 0,4 Guber Banca Confidential
Guber Banca 0,3 Guber Banca Monte dei Paschi di Siena
Illimity 0,7 Illimity Banco BPM
Illimity 0,3 Illimity Confidential
Illimity 1,8 Illimity Monte dei Paschi di Siena
Illimity 1,1 Illimity Unicredit
SPF Investment Management LP 1,1 n.a. Unicredit
Unipol Rec 1,3 Unipol Rec BPER
Varde, Barclays, Guber Banca 0,7 Guber Banca Cassa Centrale Banca
Confidential and other minus 17,8 n.a. n.a.
Total 31,8
18MARKET WATCH NPL Sources: Banca IFIS NPL Market Database – Press releases and news
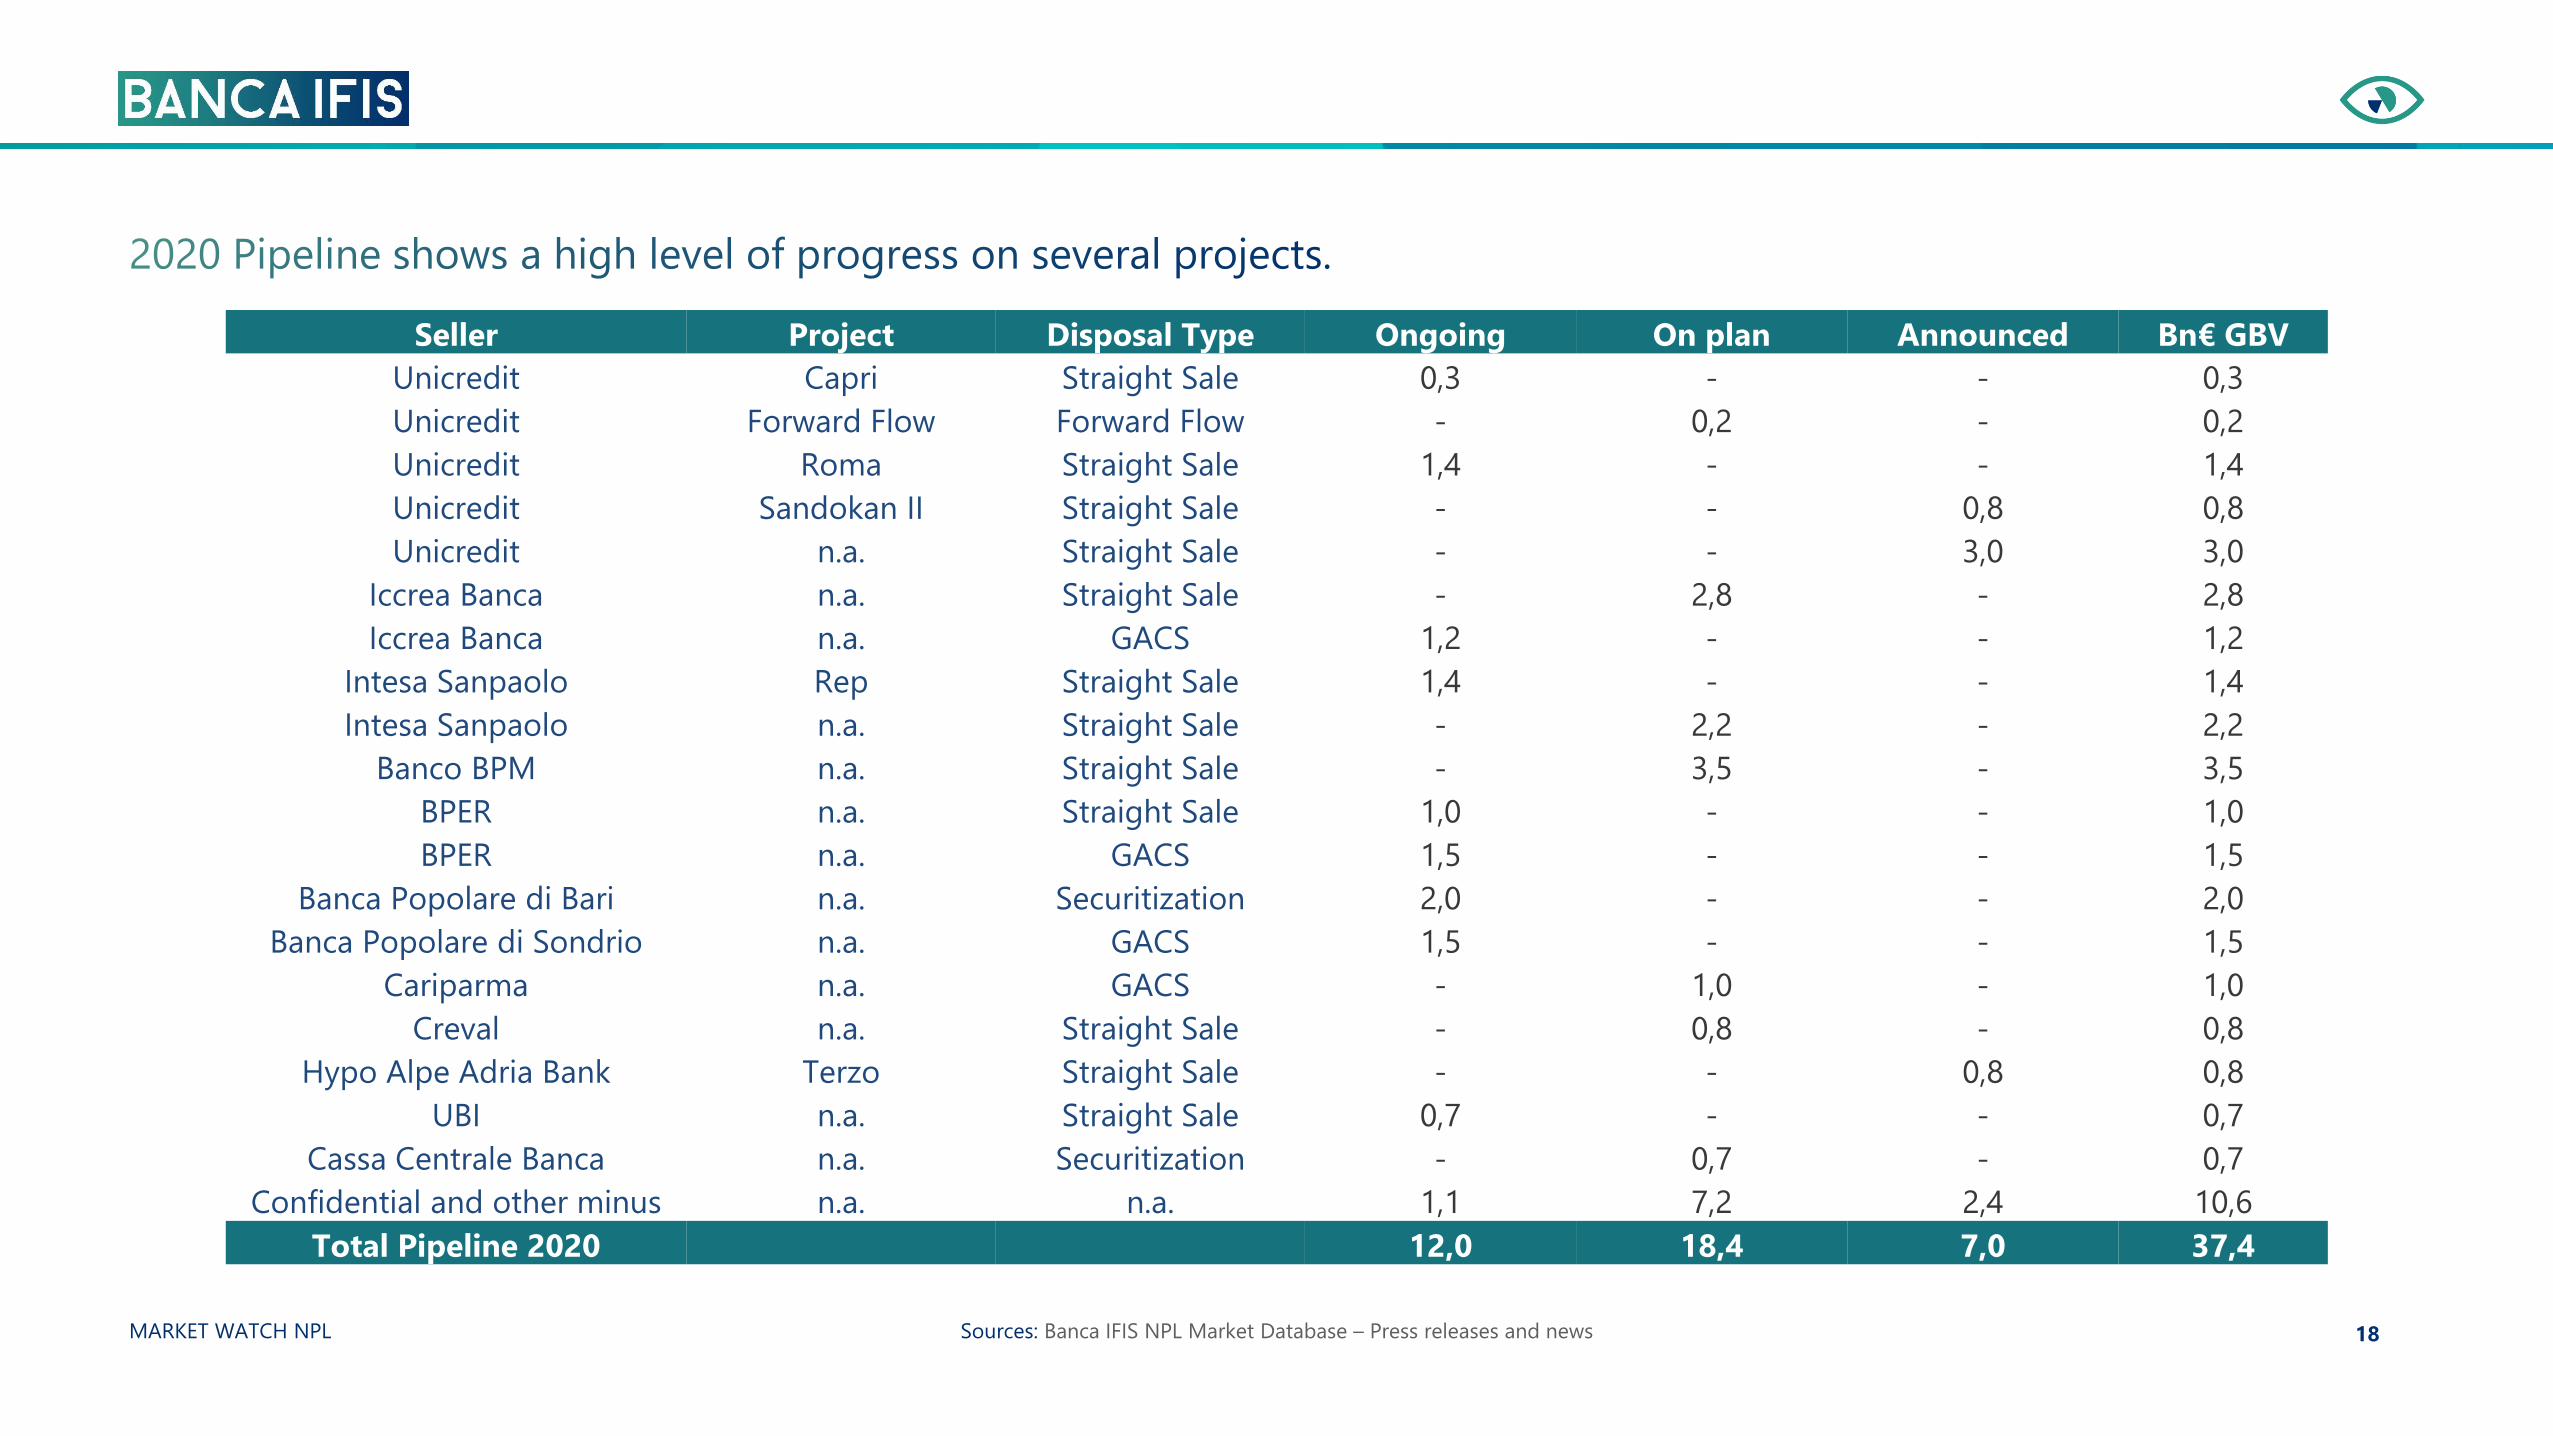
Seller Project Disposal Type Ongoing On plan Announced Bn€ GBV
Unicredit Capri Straight Sale 0,3 - - 0,3
Unicredit Forward Flow Forward Flow - 0,2 - 0,2
Unicredit Roma Straight Sale 1,4 - - 1,4
Unicredit Sandokan II Straight Sale - - 0,8 0,8
Unicredit n.a. Straight Sale - - 3,0 3,0
Iccrea Banca n.a. Straight Sale - 2,8 - 2,8
Iccrea Banca n.a. GACS 1,2 - - 1,2
Intesa Sanpaolo Rep Straight Sale 1,4 - - 1,4
Intesa Sanpaolo n.a. Straight Sale - 2,2 - 2,2
Banco BPM n.a. Straight Sale - 3,5 - 3,5
BPER n.a. Straight Sale 1,0 - - 1,0
BPER n.a. GACS 1,5 - - 1,5
Banca Popolare di Bari n.a. Securitization 2,0 - - 2,0
Banca Popolare di Sondrio n.a. GACS 1,5 - - 1,5
Cariparma n.a. GACS - 1,0 - 1,0
Creval n.a. Straight Sale - 0,8 - 0,8
Hypo Alpe Adria Bank Terzo Straight Sale - - 0,8 0,8
UBI n.a. Straight Sale 0,7 - - 0,7
Cassa Centrale Banca n.a. Securitization - 0,7 - 0,7
Confidential and other minus n.a. n.a. 1,1 7,2 2,4 10,6
Total Pipeline 2020 12,0 18,4 7,0 37,4

19MARKET WATCH NPL Sources: Banca IFIS NPL Market Database – Press releases and news
UtP Transactions - Bn€
10
6 7
2018 2019 2020
Actual Pipeline ongoing
5 10# Deals 7
Bn€
Year Seller Project Buyer Bn€ GBV
2018
Veneto banks n.a. SGA 9,0
Credit Agricole - Cariparma Valery Bain Capital Credit 0,5
Monte dei Paschi di Siena Alfa 2 Algebris 0,3
Monte dei Paschi di Siena Alfa 2 GWM and Farallon 0,1
Gruppo Carige n.a. Bain Capital Credit 0,4
10,2
2019
Monte dei Paschi di Siena Papa2 Cerberus 0,5
Monte dei Paschi di Siena Quebec Illimity 0,5
Monte dei Paschi di Siena n.a. Confidential 0,2
Intesa Sanpaolo e Unicredit n.a. Pillarstone (KKR) 0,3
Intesa Sanpaolo n.a. Prelios 3,0
Gruppo Carige Hydra Amco (ex SGA) 1,7
Banca del Fucino n.a. Amco (ex SGA) 0,1
6,2
Total Actual 16,4
Year Seller Project Potential Buyer Bn€ GBV
2020 Pipeline Ongoing
Gruppo Carige Messina CDP 0,5
Intesa Sanpaolo Levante n.a. 0,3
Monte dei Paschi di Siena Lima Bofa Merrill Lynch 0,1
Unicredit Dawn n.a. 1,0
MultiSeller Cuvèe Amco (ex SGA) 2,0
MultiSeller n.a. n.a. 2,0
Confidential and other minus n.a. n.a. 0,8
6,7
2020 Other assumed
projects
Seller Project Potential Buyer Bn€ GBV
Monte dei Paschi di Siena n.a. Amco (ex SGA) - Partnership 7,0
Monte dei Paschi di Siena n.a. n.a. 0,2
Unicredit n.a. Dea Capital e Clessidra 6,0
13,2

20MARKET WATCH NPL

21MARKET WATCH NPL Sources: Banca IFIS NPL Market Database – Press releases and news – Banca IFIS internal estimate
77 Bn€ bad Loan*
UtP*64 Bn€
182 Bn€
Volume
transactions
from 2015 to
2019
16 Bn€
13 Bn€
Recovery and
final write-off on
recovery
UtP Recovery
return to preform**1 Bn€
246 Bn€ Italy Gross Bad Loan*
Italy Gross UtP*
325
79 Bn€
NPL Recovery NPL Volume
UtP Volume
Banks Gross
NPE
**UtP recovery/return to perform based on Bank of Italy transition matrix *Bad Loan at Q4’19, UtP at Q4’19 Banca IFIS estimate
141 198 14

22
Top ten servicersBank of Italy
SurveillanceRating Bn€ AuM % AuM
DoValue 106/115 S&P, Fitch 82 20%
Credito Fondiario Bank Fitch 52 13%
Cerved Credit Management 106/115 Fitch 46 11%
Intrum Italia 115 Fitch 41 10%
IFIS NPL, FBS 106 Fitch 24 6%
Prelios 106 S&P, Fitch 24 6%
AMCO 106 S&P, Fitch 20 5%
Phoenix Asset Management 115 n.a. 10 2%
Guber Bank Fitch 9 2%
Sistemia 115 Fitch 9 2%
Total 317 78%
MARKET WATCH NPL Sources: Banca IFIS NPL Market Database – Press releases and news – Banca IFIS internal estimate
~

23MARKET WATCH NPL Sources: internal estimate based on servicers’ financial reports. The analysis includes 9 out of ten main servicers in the NPL market
Uman intensive
business+4% (headcount)
Technology
Innovation+21%(asset increase)

24MARKET WATCH NPL
Sources: Banca IFIS NPL Market Database – Press releases and news
2018 2019
Lindorff / Intrum
Acquisition of
100% of PwC Mass
Credit Collection
Arrow
Acquisition of 100%
of Parr Credit and
Europa Investimenti
Anacap + Pimco
Acquisition of a majority
stake in PAM
Kruk
Acquisition of
51% of Agecredit
Banca IFIS
Acquisition of 90% of
FBS
Cerberus
Acquisition of 57%
of Offi cine CST
Hoist Finance
Acquisition of 100%
of Maran
Financial Group
Acquisition
of Generale Gestione
Crediti Se.Tel. Servizi
Illimity
Acquisition of 70%
of IT Auction
IBL Banca
Acquisition of 9.9%
of Frontis NPL
MCS - DSO
(a BC Partners company)
Acquisition of 80%
of Serfin
Acquisitions
IBL Banca +
Europa Factor
Joint venture for the
creation of the new
Servicer Credit Factor
Joint Venture
Intesa + Lindorff /
Intrum
Joint venture for
the NPL platform of
Intesa Sanpaolo
Cerved + Studio
legale La Scala
Joint venture for the
creation of a specialized
NPL law firm
Credito Fondiario
+ Banco BPM
Creation of a Joint
venture for the
management and
disposals of Banco
BPM NPLs
Npl Re Solutions +
Axactor
Joint venture to
manage NPL and
UTP
Opportunity
assessment
Cerved
Evaluation phase:
Intrum and Credito
Fondiario are
negotiating the
acquisition of NPL
company division
MCS - DSO
(a BC Partners company)
Acquisition of Sistemia
subject to approval
DoValue
+ Aurora RE (Mosaico)
Creation of a
multioriginator platform
to manage UTP portfolio
secured by real estate
DeA Capital
Acquisition of 38,82%
Quaestio Holding and NPL
company branch of Quaestio
SGR
Amco
+ Prelios (Cuvée)
Creation of a
multioriginator
platform to manage
UTP portfolio secured
by real estate
2020

25
In-depth analysis
GACS role in NPL market

26
85%
MARKET WATCH NPL Sources: Banca IFIS NPL Market Database – Press releases and news – Banca IFIS internal estimate
NPL GACS Transactions - Bn€ and # Deals
24# Deals
Senior
note %65% 86% 89% 78%
5 29
Bn€ amount
54
2951 14
2016 2017 2018 2019 2019
Cumulated 2019
Cumulated
2020
Cumulated
estimated
GBV = 69,8
Bn€
GBV = 69,8
Bn€
24
NPL GACS Transactions - Bn€ and # Deals
2020
pipeline
61%
39% Secured
Unsecured
72%
28%
Corporate
Individual
# Deals
Bn€ amount

27MARKET WATCH NPL Sources: Banca IFIS NPL Market Database – Press releases and news – Banca IFIS internal estimate
NPL GACS Transactions - Bn€ and Percentages
0,5 32,0 28,6 8,7
2016 2017 2018 2019
GBV – Bn€
21,1%
28,7%
24,7%
14,3%
17,1%
21,8%
31,4%
37,0% 36,4%
43,6%
Avg Price
Min Price
Max Price
63% 58% 73% 68%Secured %

28BANCA IFIS Sources: Banca IFIS internal estimation based on Moody’s SECTOR PROFILE 26 September 2019
127%
98%
73%
94%
124%139%
105%
124%
90%93%
99%
137%
86%
96%
131%
145%
113%
140%
95%
99%
115%
30%
50%
70%
90%
110%
130%
150%
Red Sea SPV FINO 1
Securitization
Elrond NPL
2017 S.r.l.
Bcc Npls 2018 Aqui SPV POP NPLs 2018 RIVIERA NPL Brisca
Securitisation
Srl
Popolare Bari
NPLs 2017
Popolare Bari
NPLs 2016
Maggese
Cumulative Gross Collection Ratio Cumulative Net Collection Ratio
Cumulative Gross and Net Collection Ratio: Actual on Business Plan. T2=H1 2019 - Percentage
103% 105%
1 2Cumulative Gross Collection
Average Ratio
Cumulative Net Collection
Average Ratio
Note: Cumulative Gross/Net Collection average calculated as a weighted average of 11 GACS transactions observed
Cumulative Gross/Net Collection Ratio: Actual on Business Plan* - Percentage
* Cumulated ratio based on weighted average of 11 GACS portfolios with sufficient
performance historical data
weighted averageweighted averageweighted averageweighted average

29
2,0%
2,5%
3,0%
3,5%
4,0%
4,5%
5,0%
50% 55% 60% 65% 70% 75% 80%
BANCA IFIS Sources: Banca IFIS internal estimate based on Moody’s SECTOR PROFILE 26 September 2019; Debtwire report “performance of GACS deals”
% Secured
Correlation Index=0,4
Reco
very
Rate
GACS performance
GACS shows no correlation between recovery
rate and % of guaranteed credits
0,0%
1,0%
2,0%
3,0%
4,0%
5,0%
6,0%
9% 14% 19% 24% 29% 34% 39% 44%
Correlation Index=-0,6
GACS performance
% Individual
Reco
very
Rate
GACS shows no correlations between recovery
rate and % of individual on portfolio
GACS portfolio
Correlation line
GACS portfolio
Correlation line

30
This publication is edited by Banca IFIS. The information contained herein, obtained
from sources believed to be reliable by Banca IFIS, are not necessarily complete, and their accuracy
cannot be guaranteed. This publication is provided merely for purposes of illustration and information
and does not in any way represent financial and investment advice.
MARKET WATCH NPL

31