Embed Size (px)
Citation preview

Journal of Accounting and Economics 16 (1993) 407-445. North-Holland
The investment opportunity set and accounting procedure choice
Preliminary evidence*
Received November 1990. final version received July 1992
This paper provides evidence on the cross-sectional relation between firms’ investment opportuni- ties, their debt and compensation contracts. their size and financial leverage. and their accounting procedure choices. This evidence is important. because previous studies hypcthesize !!?ut the link between firms’ investment oppor!-unities and their accounting choices helps explain extant results on the size. debt/equity. and bonus plan hypotheses. However. while 1 find that firms’ rnvestment opportunities do affect the nature of their coIltracts, I also find that the ‘traditional’explanations for accounting choice are important after controlling for the effects of the investment opportunity set.
1. Introduction
This paper provides evidence on the cross-sectional relation between firms’ investment opportunities (hereafter, the investment opportunity set or just the ‘ios’), the nature of their debt and compensation contracts,’ their size and financial leverage, and their accounting procedure choices. The principal
Cnt~~spc~r&~~ to: Douglas J. Skinner. School of Business Administration. University of Michigan, Ann Arbor, MI 48109-1234, USA.
*I thank Jeff Abarbanell. Don Anderson, Joy Begley, Vie Bernard, Harry DeAngelo. Linda DeAngelo. Tony Greig. Pat O’Brien. and Jerry Zimmerman for helpful comments on earlier versions, and Li Li Eng, James Myers, and Karren Skinner for help with data collection. Special thanks are due to Tom Lys (the referee) and Ross Watts (the editor) for comments and suggestions that helped me to improve the paper substantially. Financial support from the KPMG Peat Marwick Foundation and the University of Michigan Business School is also gratefully acknow- ledged. All errors and omissions are my responsibility.
‘The term ‘nature of contracts’ refers to the extent to which contracts(i) restrict the actions of the contracting parties and (ii) use accounting numbers to measure performance and/or specify actions and,‘or prescribe restrictions, Y elaborate further on this in section 2.
01654101/93~$06.00 (‘ 1993 Elscvier Science Publishers B.V. All rights reserved
408 D.J. Skinner, Investment opportunities and accounting choice
empirical conclusions are as follows:
(1) Consistent with extant research, I find that larger firms are more likely to select income-decreasing accounting procedures, that more highly-levered firms are more likely to select income-increasing accounting procedures, and that firms with accounting-based bonus plans are more likely to select income- increasing accounting procedures, than are other firms. Importantly, I also find that these relations remain largely unaffected when I include measures of the ios in the regressions - the ‘traditional’ explanations are robust to controlling for the effect of the ios.
(2) I document that the ios affects the nature of firms’ debt and compensation contracts. Specifically, firms with relatively more assets-in-place are more likely to employ (i) accounting-based debt covenants in their public debt contracts and (ii) bonus plans that tie the bonus directly to accounting earnings. Thus man- agers of firms with more assets-in-place have larger incentives, given the nature of the contracts in place in these firms, to select income-increasing accounting procedures. This is evidence of an indirect relation between the ios, through its effect on contracting, and accounting choice.
(3) There is limited evidence of a direct association between the ios and accounting choice. Specifically, in some accounting choice regressions the ios proxy variables have explanatory power with respect to accounting choice over and above the traditional variables that proxy for managerial opportunism. Although this evidence suggests that the ios affects the ‘accepted set’ of account- ing procedures, it should be interpreted cautiously given the correlation that exists between the ios and the nature of firm contracts.
This evidence contributes to the literature on positive accounting theory in several ways. First, although there has been speculation in the literature that the ios affects accounting procedure choice [Watts and Zimmerman (1986, 199Q)], there is little evidence on the relation between the ios and accounting choice. The only direct evidence of a relation between the ios and accounting choice (of which I am aware) is in Zimmer (1986), who examines whether Australian real estate developers capitalize interest costs. The present study is therefore the first to provide evidence about the ios/accounting choice relation for a large, ran- domly-chosen cross-section of firms.
Second, most previous studies view accounting choice as a function of managers* incentives to behave opportunistically, given contracts in place. [See Holthausen and Leftwich (1983) or Watts and Zimmerman (1986, ch. 11) for reviews.] These studies typically regress measures of accounting choice on firms’ debt-to-equity ratios (to proxy for the incentives that debt contracts provide to managers) or on the existence of a bonus plan (to proxy for managers’ incentives under those agreements), and interpret the relations they observe as providing evidence on the extent to which managerial opportunism drives accounting choice. For example, a positive relation between debt-to-equity ratios and

D. J. Skinner, Invesrmenr opportuniries and accounting choice 409
the use of income-increasing accounting procedures is usually interpreted as evidence in favor of the hypothesis that managers choose income-increasing accounting procedures to loosen debt-cr-*nvenant constraints.
If firms’ investment opportunities systematically affect the types of contracts that are written, the inferences that these studies draw cocbld be confounded by an omitted variables problem [Watts and Zimmerman (1990)].* To address this, I include measures of the ios in accounting choice regressions along with the ‘traditional’ measures such as firm size, financial leverage, and a bonus plan indicator variable. In addition, I collect data on the nature of sample firms’ debt and compensation contracts, and report on how the ios affects the nature of these contracts across firms. Thus, this paper examines whether the relation between the ios, firm contracts, and accounting choice helps explain results already in the literature. Alternative explanations are important, for as Leftwich (1990, p. 41) emphasizes, ‘even if the existing tests provide unambiguous evi- dence of associations in the data, there is little agreement on interpretations of those correlations’.
Finally, this evidence increases our understanding of observed accounting practice. For example, firms in the same industry tend to adopt similar account- ing practices. Because it is likely to be the case that the nature of investment opportunities vary across industries more than they do within industries, the ios-accounting choice linkage provides a simple and direct explanation for this phenomenon. More generally, the ios-accounting choice linkage helps explain why firms’ accounting procedure choices appear to depend on factors such as their production and investment, financing, and operating decisions [see, e.g., Foster (1986, ch. 5)].
To analyze cross-sectional accounting choice data for a large number of firms, I have to make simplifying assumptions. For example, I characterize alternative accounting procedure choices at a given point in time as either ‘income- increasing’ or ‘income-decreasing’ - in practice the earnings effects of particular accounting choices tend to reverse over time. (Although with inflation this type of reversal will only occur for firms that are shrinking, and so should not systematically characterize the firms in my sample.) In addition, managers are likely to consider the effect of alternative accounting methods on more than just the level of earnings (e.g., under income ‘smoothing’ hypotheses, managers attempt to reduce the variability of earnings). While more specific research settings avoid such ambiguities [e.g., see Zimmer (1986) J, the results from these studies are more difficult to generalize to a broad cross-section of firms. Thus, while there are limitations of the evidence that I provide, this evidence
2Along similar lines, Ball and Foster (1982) and Holthausen and Leftwich (1983) had originally criticized these types of accounting choice studies because of the likelihc: ,d that the size, debt/equity, and bonus plan proxy variables that they employed are likely to be correlated with many other things, including industry membership.

410 D.J. Skinner, Investment opportunities and accounting choice
nonetheless increases our understanding of extant accounting practice, par- ticularly when combined with the evidence from studies that examine smaller samples of firms in particular economic circumstances (such as Zimmer’s).
The next section of the paper summarizes existing theory on the relation between the ios and accounting choice, and emphasizes that it is not obvious a priori how the ios affects the accepted set of accounting procedures. In addition, I provide a rationale for why we expect a relation between the ios and the nature of firm contracts, and so why there is also likely to be an indirect link between the ios and accounting choice. Section 3 provides details of the sample. Section 4 discusses the proxy variables that I use to measure the ios, and documents how the ios covaries with firm size, financial leverage, and long-term financial performance. Section 5 provides evidence of how the ios affects the nature of firms’ bonus plans and debt contracts. Section 6 then provides evidence of variation in firms’ accounting choices, and documents how this variation is related to variation in these firms’ size, financial leverage, debt and compensation contracts, and investment opportunities. Section 7 provides a dis- cussion and summary.
2. The ios-accounting choice linkage
This section describes two links between the ios and accounting choice. In section 2.1 I discuss why we expect to observe a direct relation between the ios and the accepted set of accounting procedures. Section 2.2 discusses how the ios is likely to affect the nature of firm contracts and thus managers’ incentives to select particular accounting procedures after contracts are in place, and so provides an indirect link between the ios and observed accounting choice.
2.1. The ios and the accepied set qf accourzting procedures
Watts and Zimmerman (1986, 1990j isolate two principal forces that deter- mine firms’ accounting procedure choices. First, certain accounting procedures (the ‘accepted set’) evolve through time and emerge as best practice - these are the accounting procedures that cost-effectively resolve the firms’ agency prob- lems ex ante. This perspective on accounting choice is also known as the ‘efficient contracting’ perspective [e.g., Holthausen ( 1990)].3 Second, because it
3An early example of this argument is Watts (1977, p. 61) who draws a linkage between the agency costs of debt, the nature of firms’ assets, and the requirement that managers set aside profits for ‘renewal, repairs, maintenance or depreciation of existing assets’. Leftwich (1983) argues that the accounting choices that have evolved as best practice in private lending agreements (as exemplified by their existence as ‘boiler-plate’ type provisions) are those procedures that minimize the costs of the agency relationship between the firm and its private lenders. Zimmer (1986) provides an example in the context of Australian real estate developers of how accounting procedure choices can result from contracting solutions that are rx ~tte efficient.

D.J. Skinner, Inwstment opportunities and accounring choice 411
is costly to restrict managerial choice entirely, managers choose particular accounting procedures from among the accepted set ex post, i.e., after the contracts are in place. Managers who do this to make themselves better off at the expense of other stakeholders are said to act ‘opportunistically’. The extant literature focuses primarily on managers’ incentives to make opportunistic choices.4
In delineating an accepted set of accounting procedures, those appointed to monitor the firm’s managers face a tradeoff. On one hand, managers’ accounting choices must be restricted to some extent - otherwise contracts denominated in accounting nuqsbers are ineffective in restricting manager behavior. For example, compensation contracts would do little to motivate managerial per- formance if earnings-based management compensation agreements did not specify the accounting choices on which the earnings calculation was based.
On the other hand, however, if there are efficiency-based costs and benefits to particular accounting choices, managers are likely to best know which account- ing procedure choices maximize the value of the firm. In other words, managers are likely to have speci’c knowledge about which accounting choices are optimal from the point of view of all claimants. For example, managers are likely to have the best information about which accounting procedures minimize the firm’s potential costs in the political/regulatory process, or about which accounting methods provide the best way of motivating employees (thus ex post choices are often efficient as well). Therefore, it is not efficient to contractually restrict managerial choice entirely, given this as well as the costs of monitoring and enforcing restrictions on accounting choice.5
The relative costs and benefits of restricting managerial choice are likely to be different for different firms. In particular, these costs and benefits - and so the eficient ser of accounting procedures - are likely to vary across firms as a func- tion of their investment opportunities. For example, Watts and Zimmerman (1986, pp. 360-361) argue that the assets of growth firms are more difficult to observe because they are primarily represented by future investments. As a re- sult, contracts based on these less readily observed values provide managers
with greater flexibility to behave opportunistically ex post, SO that growth firms’ accepted sets of accounting procedures would likely restrict managers’ ability to choose income-increasing accounting procedures ex ante. (On the other hand,
4Choices that are made after contracts are in place are not always the result of managerial opportunism - managers also make choices that are KY post efficient from the point of view of the firm’s claimants.
‘In addition to Watts and Zimmerman this general point has previously been made by Demski, Patell, and Wolfson (1984) who argue that ‘the delegation to managers of the choice from among the set of acceptable (accounting) alternatives can best be understood as efficient, equilibrium behavior’ (p. 17) and that ‘by both allowing mangers ‘freedom of choice’ with respect to accounting methods and compensating t/tern according/y, owners can capitalize upon managers’ ‘local expertise” (p. 31. emphasis in original).

412 D.J. Skinner, Investment opportunities and accounting choice
the accounting choices that are optimal for growth firms probably depend on as-yet unobservable outcomes, so it may be more costly to restrict accounting choices in the current period for these firms.)
While it is clear that the ios will affect both the costs and benefits of writing, monitoring, and enforcing contracts, it is difficult to arrive at more specific predictions about how exactly the ios will affect the accepted set of accounting procedures. As Watts and Zimmerman (1986, p. 359) note: ‘Development of a complex model of the accepted procedure set is difficult since it would involve modeling the demand for contracting as a monitoring device and the cost of alternative methods of monitoring.’ As a result, I adopt the more modest objective of providing descriptive evidence on the relation between the ios and observed accounting choicle.
2.2. The indirect relation between the ios and accounting choice
In addition to its direct eXects on the accepted set, the ios is likely to affect the types of contracts that the firm writes with various claimants. To illustrate this in a concrete way, I next analyze how the ios affects the nature of management compensation hnd debt contracts, respectively.
2.2. I. Management compensation agreements
Management compensation agreements help reduce the conflict of interest between corporate managers and stockholders; these plans are designed to motivate managers to maximize firm value [Smith and Watts (1982)]. Because the costs and benefits of monitoring and motivating managers depend on the nature of the firm’s investment opportunities, the structure of management compensation agreements will vary across firms as a function of the ios. Smith and Watts (1991) argue that the actions of managers of firms with relatively more assets-in-place are less costly to monitor than the actions of managers of firms whose value is comprised largely of growth opportunities. In addition, managers of firms with relatively more growth opportunities are likely to be allowed more decision-making discretion because these managers have better information about the firm’s investment opportunities than the firm’s stock- holders; i.e., managers of growth firms ari: likely to have relatively more specific knowledge than managers of firms with relatively more assets-in-place. Conse- quently, Smith and Watts predict that growth firms are more likely to use incentive compensation schemes that tie management compensation to measures of firm performance (such as accounting earnings or stock price).
In addition, Smith and Watts (1991) argue that accounting numbers are poorer performance measures for firms with relatively more growth opportuni- ties because of conservatism in accounting: the need for objective and verifiable numbers limits the extent to which accountants are willing to recognize income that depends on uncertain future events. [Consistent with this, Collins et al.

6). J. Skinner. Investment oppomnities and accounting choice 413
(1992) provide evidence that stock prices lead accounting earnings to a greater extent for firms with relatively large amounts of new and intangible assets.] This countervailing measurement effect implies that incentive compensation schemes that rely on accounting performance measures are less likely to be used in firms with growth opportunities, offsetting the arguments above. Stock-based incen- tive plans are likely to be more prevalent in growth firms, since these plans achieve the incentive-alignment benefits without incurring the accounting measurement costs.6
This discussion is summarized in fig. 1. The figure illustrates the two counter- vailing effects of the ios on the nature of managerial compensation - firms with more assets-in-place are: (1) less likely to use incentive compensation (because their managers optimally have less decision-making discretion) and (2) more likely to use accounting earnings numbers in compensation contracts (because these numbers are relatively better performance measures in these firms).
Smith and Watts (1991) and Gaver and Gaver (1993) provide evidenc+c that is consistent with this. Smith and Watts present industry-level evidence that firms with growth opportunities are (i) less likely to use accounting-based bonus plans than other firms and (ii) more likely to use stock-option plans. Gaver and Gaver (1993) replicate the Smith and Watts analysis for 237 growth firms and 237 nongrowth firms, and find that their growth firms are more likely to use stock-option plans, but no more likely to use earnings-based bonus plans, than their nongrowth firms. The fact that the evidence indicates that growth firm: are more likely to use stock-option plans, but is inconclusive with respect to which firms are more likely to use bonus plans, is consistent with the existence of these two opposing effects.’
Overall, it is difficult to make a clear a priori prediction about the relation between the ios and the use of accounting-based bonus plans because of the two countervailing effects, However, the evidence in Smith and Watts (1991) and the evidence below (table 3) suggests that, at least as an empirical matter, firms with relatively more assets-in-place are more likely to use bonus plans that rely on accounting numbers. Consequently, in fig. 1 I indicate that firms with more assets-in-place are more likely to employ earnings-based bonus plans. If this is in
‘Sibson (1990, pp. 342-343) prescribes for ‘fast-growing enterprises’: ‘There is continuous change in these firms. Therefore, compensation systems must be simple and highly adaptable to change . . . In fast-growing companies, you don’t have annual bonus plans. Performance standards would be changing frequently. Also, some plans, like management bonus plans, can be divisive in a fast-growth environment.’
7See also Clinch (1991) who finds that high-R&D firms are more likely to use stock-option plans than low-R&D firms, but that there is no apparent difference in these firms’ propensity to use earnings-based bonus plans, and Lambert and Larcker (1987). who find that firms with relatively high rates of sales and asset growth place more weight on market returns and less weight on accounting numbers in determining managerial compensation than do other firms.

414 D.J. Skinner, Investment opportunities and accounting choice
Less likely to use incentive compensation
Firm with more assets-in-place
More hkely to use More likely to use
earnings-based income-increasing
bonus plans* __t accounting
Accounting numbers are relatively good measures of performance I
procedures
L
“Opportunism” Linkage
Fig. 1. The link between the investment opportunity set, incentive compensation, accounting earnings-based bonus plans, and accounting procedure choices. (*The fact that firms with more assets-in-place are more likely to use earnings-based bonus plans is an empirical statement based on
the evidence in this and o:her studies.)
fact the case in general, and if the contractual terms of bonus plans provide managers with incentives to make income-increasing accounting procedure choices, then I expect that firms with more assets-in-place are more likely to use accounting-based bonus plans, so that their managers are more likely to select income-increasing accounting procedures ex post.’ This is shown as the last linkage in fig. 1.
Debt convers-ts are written to reduce the conflict of interest between the firm’s stockholders and bondholders [Smith and Warner (1979)]. Smith and Warner describe four principal sources of conflict between bondholders and stockholders, two of which have implications for the ios-accounting choice linkage.’
*Unlike the accruals choices that Healy (1985) documents, managers’ accounting procedure choices cannot be altered every period depending on where the firm’s accounting income falls relative to the upper and lower bounds in bonus plan contracts; it is relatively costly to change accounting procedures [see e.g., Sweeney (199l)J Therefore, the relation between the existence of bonus plans and managers* accounting procedure choices is likely to depend on whether income- increasing procedure choices will, on average over a period of years, increase the managers’ bonus. Based on the relatively strong evidence in favor of the “bonus plan’ hypothesis, this is probably the case. However, this is ultimately an empirical question and in the tests that follow I provide evidence about the relation between the ios and the terms of bonus plans for a subsample of firms with available data.
‘The other two sources of stockholder-bondholder conflict are ‘dividend payment’ (under which the stockholders opportunistically reduce the value of the bondholders’ claims by reducing the firm’s level of investment to increase the dividend) and ‘claim dilution’ (under which stockholders opportunistically dilute the value ofexisting bondholders’claims by issuing more debt of the same or higher priority). Neither of these conflicts relates directly to the nature of the firm’s assets, and so neither of these conflicts is linked to the firm’s ios.

D. J. Skinner, hwesrment opportmifies and accounting choice 415
1. The Underinuestment Problem. As discussed above, while firm managers
have little discretion with respect to the value of assets-in-place, they can readily
affect the value of growth opportunities. With risky debt outstanding, Myers (1977) shows that situations can arise where managers (acting on shareholders’ behalf) decide not to undertake these positive net present value investments because most of the payoffs go to bondholders. To mitigate this underinvest- ment problem, firms generally only issue risky debt that can be supported by assets-in-place. The analysis thus predicts that, other things equal, the larger the fraction of firm value represented by assets-in-place, the higher the firm’s financial leverage.
2. The Asset-Substitution Problem. Asset substitution occurs when stockhol- ders opportunistically substitute higher variance assets for lower variance assets, once the debt has been issued. Asset substitution will transfer wealth to the stockholders if the debt has been issued and priced on the assumption of low-variance assets. The extent to which asset substitution creates agency costs will vary across firms as a function of their ios. If a firm’s ios is comprised largely of assets-in-place, it is relatively easy to prevent asset substitution - the assets are ‘fixed’ assets which are relatively easy for outsiders to monitor (external auditors, for example, can easily verify the continued existence and upkeep of fixed assets such as land, buildings, plant, and equipment). On the other hand, if firm value is largely comprised of intangible growth opportunities, asset substi- tution is likely to be more difficult to prevent. Therefore, as with underinvest- ment, firms with relatively more growth opportunities are less likely to issue risky debt (other things held constant).
D-+1, I,” Aerinvestment and asset substitution suggest that firms with relatively U”Lll U‘IUI& ___ A
more assets-in-place will be more highly levered than firms whose va!ue is comprised principally of growth opportunities. Gaver and Gaver (1993), Long and Malitz (1985), and Smith and Watts (1991) all provide evidence that is consistent with this prediction. This relation is shown as the upper part of the first linkage in fig. 2.
If firms whose value is made up principally of growth opportunities are less likely to issue debt, these firms are also less likely to have accounting-based debt covenants. This follows because: (i) these firms have less debt so that bondhol- ders do not require the same degree of protection, (ii) the cost of these restric- tions, in terms of inhibiting these firms’ future investment decisions, is likely to be larger for these firms, and (iii) as argued above, accounting numbers are likely to provide relatively poor information for monitoring stockholders of these firms. These relations are shown in fig. 2.”
“Press and Weintrop (1990) provide evidence that firms that use accounting-based debt cove- nants are more highly levered than firms that do not have these constraints. If firms with more assets-in-place are also more highly levered, this evidence supports the view that the ios affects the likelihood that firms will have accounting-based debt covenants.

416 D.J. Skinner, Investment opportunities and accounting choice
Higher financial leverage
Firm with more assets-in-place
More likely to use More likely IO use
accoumic, ja.xd - income-increasing
debt covenanls
*I ’
accounting procedures
Accounting numbers are relatively good measures of performance
“Opportunism” Linkage
Fig. 2. The link between the investment opportunity set, financial leverage, accounting-based debt covenants, and accounting procedure choices.
Extant evidence on the debt/equity hypothesis indicates that larger debt/equity ratios are associated with the use of income-increasing accounting procedures, and suggests that managers choose income-increasing accounting procedures to loosen debt-covenants constraints. However, if the ios affects both financial leverage and the extent to which firms utilize accounting-based debt covenants, these studies potentially suffer from a correlated omitted variables problem.
It is difficult to discriminate between these explanations empirically: is it opportunism that explains the observed relation between accounting choice and leverage, or is it that the ios determines both leverage and the firm’s accounting choices?’ ’ Press and Weintrop (1990) provide evidence that, even after control- ling for managers’ incentives under accounting-based debt covenants, leverage is still significant in explaining cross-sectional variation in accounting choice. As they note, one expianation for this result is that leverage is proxying for the ios in these regressions. By including ios measures directly in these regressions, the tests in this paper provide evidence on whether or not this is true, and, more generally, on the extent to which the ios determines accounting choice condi- tional on the incentives that managers have under contracts in place.
2.2.3. Summary
I have argued that the ios affects the accounting procedures used by firms indirectly. This occurs because the ios affects the nature of the contracts written
“In section 2.2.1, the opportunism to which I was referring involved wealth transfers from the firm to its managers under managerial compensation contracts. In this section, I am referring to opportunism under debt agreements that involves wealth transfers from bondholders to stockhol- ders that are implemented by managers (who are, following Smith and Warner, assumed to act in the best ir,:eres& of the stockholders). In both cases managers choose income-increasing accounting procedures .I effect the wealth trpn$ers.

D. J. Skinner, hcestnzennr opporruniries und accounting choice 417
between the firm and its stakeholders, and because - other things equal - the nature of these contracts, in turn, affects the accounting procedures that man- agers select ex post. The ceteris paribus assumption here is important, because the effects of the ios on the accepted set of accounting procedures may offset managers’ opportunistic incentives (this is an empirical question). For example, if firms with relatively more assets-in-place are more likely to use earnings-based bonus plans, so that managers of these firms have larger incentives to make income-increasing accounting choices cx post, it may also be that these firms’ accepted sets of accounting procedures are more likely to restrict managers’ ability to make these choices ex ante.
3. Sample selection
To obtain a broad cross-section of firms I select all firms on the 1989 Compustat II PST jik (Compustat) that have the requisite data available. To focus primarily on unregulated industrial firms, I exclude firms in the following four-digit SIC categories: (i) 100-1400 (mining firms), (ii) 2911 (petroleum firms), (iii) 4011 (railroads), (iv) 4911-4991 (utilities), (v) 6021-8744 (financial, medical, and service firms). Many of these firms do not report depreciation or inventory accounting choices (because they do not have material depreciable assets and/or inventories), which are my primary interest here.12
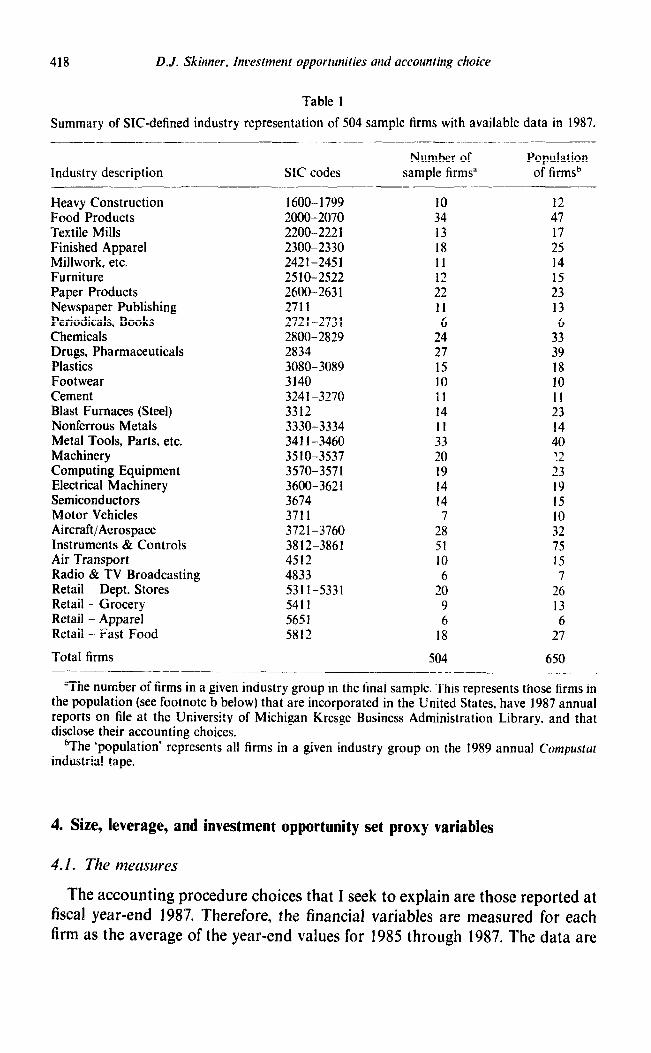
Table 1 lists the number of firms selected in each two-digit SIC code industry, along with the number of firms available for selection in each industry. The data-collection constraint is the availability of these firms’ accounting procedure choices (financial and stock market data being relatively cheaply available on Compustut and CRSP). I obtain these data from firms’ annual reports, primarily from the first footnote where firms generally disclose their ‘summary of signifi- cant accounting policies’. The firms in the sample are those that are incorpor- ated in the United States, have 1987 annual reports available in the University of Michigan Kresge Duallavuu _ D**-;-cc 4dministration Library, and disclose their accounting procedure choices. l3 The sample comprises 78% of the relevant population of Compustut firms (504 of the 650 available firms). The coverage varies by industry from a minimum of 60.8% (steel firms) to a maximum of 100% (several industries).
“Although mining and petroleum firms have both fixed asset: and inventories, they tend to account for these assets in unique ways. and so are excluded from !he sa:nple. For example. because mining firms often recognize revenue at the point of production, their inventories die usually recorded at amounts that exceed cost, i.e., at market value. And both mining and petroleum firms typically use some type of depletion base to allocate the cost of their fixed assets to expense, making it difficult to compare their depreciation methods directly to those of other industrial firms (moreover, for many of these firms the important choice is between full cost and successful efforts accounting, not between straight-line and accelerated depreciation).
“Consistent with Can~pustat, I define a 1987 annual report as one for the year ended over the 6/30/87 to 5131188 period.
418 D.J. Skinner, Inoestmenr opportunities and accounting choice
Table 1
Summary of SIC-defined industry representation of 504 sample firms with available data in 1987.
Industry description SIC codes Number of
sample firmsa Population
of firmsb
Heavy Construction 1600- 1799 10 12 Food Products 2000-2070 34 47 Textile Mills 2200-222 1 13 17 Finished Apparel 2300-2330 18 25 Millwork, etc. 2421-2451 11 14 Furniture 2510-2522 12 15 Paper Products 2600-263 1 22 23 Newspaper Publishing 2711 11 13 Periodicals, Books 2721-2731 6 6 Chemicals 2800-2829 24 33 Drugs, Pharmaceuticals 2834 27 39 Plastics 3080- 3089 15 18 Footwear 3140 10 10 Cement 3241-3270 11 II Blast Furnaces (Steel) 3312 14 23 Nonferrous Metals 3330-3334 11 14 Metal Tools, Parts, etc. 341 f-3460 33 40 Machinery 3510-3537 20 ?2 Computing Equipment 3570-3571 19 23 Electrical Machinery 3600-362 I 14 19 Semiconductors 3674 14 15 Motor Vehicles 3711 7 10 Aircraft/Aerospace 3721-3760 28 32 Instruments & Controls 3812-3861 51 75 Air Transport 4512 10 15 Radio & TV Broadcasting 4833 6 7 Retail - Dept. Stores 531 l-5331 20 26 Retail - Grocery 5411 9 13 Retail - Apparel 5651 6 6 Retail - Fast Food 5812 18 27
Total firms 504 650
“The number of firms in a given industry group in the final sample. This represents those firms in the population (see footnote b below) that are incorporated in the United States, have 1987 annual reports on tile at the Universi!y of Michigan Kresge Business Administration Library, and that disclose their accounting choices.
bThe ‘populatio n‘ industria! tape.
represents all firms in a given industry group on the 1989 annual C’ompustot
4. Size, leverage, and investment opportunity set proxy variables
4.1. The meusures
The accounting procedure choices that I seek to explain are those reported at fiscal year-end 1987. Therefore, the financial variables are measured for each firm as the average of the year-end values for 1985 through 1987. The data are

D. J. Skinner, Incesmtent opporruniries and accounting choice 419
taken from annual Compustat. 1 discuss measures of each of the constructs separately.
4.1. i. investment opportunity* set measures
The construct that I seek to measure here is Myers’ (1977) notion of assets- in-place vs. growth opportunities. I use three variables to capture this construct. In addition to these three variables, I include a measure of the riskiness of these firms’ assets.
First, to measure assets-in-place (i.e., those assets whose ultimate value does not principally depend on future discretionary investment by managers), I calcu- late the ratio of the book value of gross property, plant, and equipment (PP&E) to the value of the firm. The intuition behind this measure is that past invest- ments in property, plant, and equipment can be characterized as assets-in-place. This measure is increasing in the proportion of assets-in-place to value.
Second, as an additional proxy for growth opportunities vs. assets-in-place, I use the firm’s research and development (R&D) expense deflated by net sales. The rationale here is that investments in R&D yield expected payoffs that form part of managers’ private information and that the value of these investments is difficult for outsiders to measure reliably. Moreover, R&D expenditures com- prise, at least to some extent, discretionary expenditures and so are like the growth options that Myers describes [Dechow and Sloan (1991)]. Long and Malitz (1985) and Smith and Watts (1991) also use R&D expenditures to measure Myers’ notion of growth opportunities.
Finally, I also include Tobin’s 4 ratio, which is defined as the market value of the firm divided by the replacement cost of its assets. This variable increases with the proportion of firm value represented by intangible assets. Both Lindenberg and Ross (1981) and Merck, Shleifer, and Vishny (1988) provide arguments and/or evidence that Tobin’s 4 increases with the proportion of value repre- sented by intangibles [in fact Merck, Shleifer, and Vishny (1988, p. 299) use R&D and advertising variables to control for ‘observable measures of intangible assets that affect $1.
Following Lindenberg and Ross (1981), I estimate the replacement cost of these firms’ assets as the sum of the replacement cost of property, plant, and equipment (PP&E), the replacement cost of inventories (measured as the book value of inventories plus the LIFO reserve), and the book value of other assets. I estimate the replacement cost of PP&E using the procedure outlined by Hall et al. (1988) for the NBER R&D master file data:
1. Estimate the average age of the PP&E by dividing 1987 year-end accumu- lated depreciation by the 1987 depreciation expense (this assumes straight-line
depreciation). 2. Multiply the 1987 net book value of PP&E by ihc ratio of the GNP
deflator for fixed nonresidential investment in 1987 to this same deflator AA

420 D.J. Skinner, Inaesrtnent opportunities and accounting choice
years before 1987, where AA is the average age of the assets from 1. [This assumes that the replacement cost of PP&E grows, on average, at the same rate as the GNP deflator for fixed nonresidential investment. Hall et al. (1988) and Lindenberg and Ross (1981) use the GNP deflator for fixed nonresidential investment in similar calculations.]
I then divide the market value of the firm (i.e., the size measure described below) by this estimate of the replacement cost of the assets to yield an estimate of q.
To proxy for the risk of these firms’ investment opportunities, I estimate their asset betas. To calculate an asset beta, I first estimate the beta of each firm’s stock, and then ‘unlever’ this number by multiplying by the equity-to-value ratio discussed below [see Hamada (1972)]. This estimation procedure assumes that the firm’s debt is approximately risk-free.14
To summarize, I use four variables to characterize the ios for these firms: one measure that is positively related to assets-in-place/firm value (gross PP&E- to-value), two measures that are positively related to growth opportunities/firm value (R&D-to-sales and q), and a measure of risk (asset beta).
4.1.2. Firm size and financial leverage
I measure the size of the firm as the sum of the market value of equity and the book value of debt (current liabilities plus long-term debt). Two measures of financial leverage are employed, one based on book values and the other on market values. The book value measure is the ratio of the book value of long-term debt to the book value of total assets (debt-to-assets), while the market value measure is the ratio of the market value of equity to firm size, calculated as described above (equity-to-value). The debt-to-assets measure is increasing and the equity-to-value measure is decreasing in financial leverage.
4.1.3. Accounting ROA
Firms’ past accounting performance is used since there is reason to believe that accounting procedure choice is related to how well or badly firms are performing: firms that are poor performers are more likely to select income- increasing accounting procedures [see, for example, Lilien, Mellman, and Pas- tena (1988) and Sweeney (1991)]. It is important to control for accounting
14The betas are estimated for most (305) firms using five years of monthly CRSP data through December 1987. Some firms are not available on the CRSP monthly returns files, however, and so for these firms (134) I use 500 days of daily return data from the CRSP daily returns file. I thus have beta estimates for a total of 439 sample firms. I use montly beta estimates where available because these are less susceptible to the measurement error that arises because of nonsynchronous trading than are daily beta estimates.

D.J. Skinner, Inresmenl opportunities and amounting choice 421
performance because, for example, firms’ recent accounting performance may be correlated with their ios: firms for which assets-in-place comprise a large fraction of value may have performed systematically better (or worse) than other firms. The particular measure that I use here is an average (over the last ten years) annual accounting return on assets (ROA), calculated in each year as operating income (before amortization and depreciation and adjusted for changes in the LIFO reserve) divided by the market value of the firm in that year. l5 I measure performance over a ten-year period because the evidence in Sweeney (1991) indicates that managers’ accounting procedure choices are a function of firms’ long-term but not short-term earnings perform- ance, which is consistent with there being relatively large costs of changing accounting procedures. I subtract the change in the LIFO reserve to remove the effect of inventory method choice from the accounting rate of return variable.
A limitation of ROA is that because I measure performance over such a long window, it may proxy for expected accounting returns as much as for poor earnings realizations. Moreover, the ten-year average may not be a good proxy for the relatively short periods of poor performance within this window that could cause managers to switch to income-increasing accounting procedures. As a result, I treat this variable as an (albeit noisy) control for both poor perform- ance and expected returns, an approach that is justifiable on the grounds that it is the other variables (the ios, size, and leverage) that are of primary economic interest.
4.2. Descriptive statistics
Table 2 provides cross-sectional rank correlations for the independent vari- ables described above. I report rank correlations because the distributions of several variables are skewed.
The two financial leverage variables are inversely related (correlation - 0.63), which is expected if both variables measure financial leverage. The ios variables are also correlated, providing assurance that they are capturing the same underlying construct. Asset beta is negatively related to the assets-in-place measure ( - 0.24 with gross PP&E-to-value) and positively related to the R&D variable (0.29) and q (0.40). Thus, firms with relatively more growth opportuni- ties (and so relatively few assets-in-place) tend to have more systematic asset risk. Gross PP&E-to-value is negatively related to the R&D measure ( - 0.10) and to q ( - 0.61). These correlations are all statistically significant and in the ‘correct’ direction for these variables to be measuring assets-in-place vs. growth
I51 have also calculated ROA by adding back interest expense in addition to these other a.djustments, with similar results to those that I report below.

422 D.J. Skinner, Incestment opportunities und uccounting choice
Table 2
Sp;arman rank correlations for fiscal 1987 between the size, profitability, financial leverage, and investment opportunity set measures of 504 sample firms.“. b
_~~~_~~ _~~~ - ~~~~~~ -~ .-~ ~- --- Financial leverage Investment opportunity set variables _..._~~_~_ _~ .-- ~~ ~~ ~~~~ _~ ~_~ ~~~
Accg Debt/ MVE,’ Asset PPE/ R&D/ Tobin’s
ROA assets value beta value sales 4
Size: Value 0.25’ - 0.02 0.17’ 0.41’ 0.01
Projitahiliry Accg ROA - 0.02 0.21’ 0.14’ 0.25’
Financial lererage: Debt/assets - 0.63’ - 0.32’ 0.21’
MVE,‘value 0.62’ - 0.38’
lnresrment opportunit_v cariohles: Asset beta - 0.24’
PPE/value R&D/sales
0.19’ 0.18’
- 0.1 Id - 0.04
- 0.24’ - 0.19’ 0.22’ 0.56’
0.29’ 0.40’ - O.lOd - 0.61’
0.22’
“The numbers in the table are Spearman rank correlation coefficients, calculated using firm level data. There are 504 firms, although the correlations are typically calculated with fewer observations since most firms have missing data for at least one variable.
bThe variables are defined as follows. All variables (except asset beta, accounting ROA. and Tobin’s q) are calculated for each firm as the average over year-end 1985 through year-end 1987, and so are based on three observations for each firm. Firm value =
Accg ROA :
Debt/assets = MVE/value = Asset beta = PPE/value =
market value of the firm (in millions of dollars) market value of equity plus book value of debt; ten-year average of the yearly ratio of operating income (before depreciation expense and after adjusting for the change in the LIFO reserve) to firm value, expressed as a percentage: book-value of long-term debt divided by the book value of total assets; market value of equity divided by the market value of the firm; beta of the firm’s stock multiplied by the MVE!value ratio; gross property, plant, and equipment (at historic cost) divided by the market value of the firm:
R&D/sales = research and development expense divided by net sales, expressed as a percentage; Tobin’s q = estimate of Tobin’s q ratio (see text for details of calculations).
‘Significantly different from zero at the 0.01 level, two-tailed test. dSiunificantly different from zero at the 0.05 level, two-tailed test. P
opportunities. Finally, y is positively related to the R&D (0.22) measure, consis- tent with q measuring firms’ intangible investment opportunities.16
There is also evidence of an association between these firms’ investment opportunities and their financial leverage. In particular, financial leverage is
“1 also performed a factor analysis to try and gauge how many underlying or ‘latent’ variables the four ios variables were capturing. The factor analysis reveals that a single factor explains 49% of the cross-sectional variation in these four variables, and that two factors together explain 73% of the variation. Moreover, when 1 cxcludc the risk measure, a single factor explains 55% of the variation in the remaining three variables. This evidence is consistent with these variables capturing two underlying investmcnl opportunity constructs: the assets-in-place vs. growth options dimension, as well as the fact that asset risk varies as a function of the ios.

positively related to the proportion of assets that comprise assets-in-place: the equity-to-value measure, for example, is negatively related to gross PPE-to- value ( - 0.38) and positively related to R&D/sales (0.22) and 4 (0.56). These correlations are consistent with Myers’ prediction: firms with more assets- in-place are, on average, more highly levered than other firms. In addition, the correlation between asset beta and equity-to-value is 0.62; so there is a negative relation between leverage and systematic asset risk. This is to be expected if firms with more growth opportunities are also more risky (i.e., because growth opportunities represent more risky investment opportunities than assets-in- place, they also support less debt). Overall, the evidence confirms that financial leverage is related to the nature of firms’ investment opportunities, which supports the view that some of the extant evidence on the debt/equity hypothesis could be confounded by an omitted variables problem.17
Firm size is related to three of the four ios measures. Size is positively related to systematic asset risk (0.41), R&D/sales (0.19), and 4 (0.18). The accounting ROA variable is positively related to asset beta (0.14) and negatively related to market-valued leverage (0.2 1 with equity-to-value).
5. The relation between the investment opportunity set and firm contracts
This section provides evidence on the relation between the ios and nature of sample fi*?ms management compensation plans and debt contracts. This linkage is important because the arguments in section 2 suggest that the ios affects accounting choice indirectly through its effects on the nature of firms’ contracts.
I collect information on these firms’ bonus plans on two levels of detail.‘* First, to investigate whether there is a relation between the parameters of these plans [such as the lower and upper bounds that Healy (1985) describes] and the ios, I collect all available plan details for a subsample of 100 sample firms. Second, consistent with previous studies, I also collect information on whether or not firms in the full sample had a bonus plan under which the bonus award explicitly dep=- ~$5 Oii accounting earnings.
Larger firms are more likely to disclose bonus plan details in their proxy statements than are smaller firms [see Healy (1985), Kim and Schroeder (199O)J. To maximize the chances of obtaining bonus plan details, I collect all available bonus plan information for the 100 !argest sample firms from the proxy
“See Bradley, Jarrell. and Kim (1984). Gaver and Caver (1993). Long and Mak f 1985). and Smith and Watts (1991) for similar evidence.
“Following Heidy (1085) and other subsequent slttdics I restrict attetiiion to firms’ annual bonus PliltIS.
424 D.J. Skinner, Inaestment opportunities and accounting choice
statements that these firms filed over the 1981 through 1990 period. (By selecting only the largest firms I weaken the power of these tests if, as the correlations in table 2 suggest, size is correlated with the ios: by choosing large firms I tend to select firms with relatively more assets-in-place than characterizes the sample as a whole.) I chose the ten-year sampling interval because previous studies report that bonus plans are subject to shareholder approval every three, five, or ten years, at which time details of the plans are usually available in the proxy statement [e.g., see Healy (1985)].
Of these 100 firms, 9 appear not to have a bonus plan, 6 disclose the existence of a plan but provide no information about how awards are determined under the plan, 44 have a ‘discretionary’ bonus plan (under which the bonus award is made at the discretion of the compensation committee of the board of directors), and 41 have ‘incentive’ bonus plans that explicitly tie the bonus to an accounting earnings measure (return on equity, operating earnings, net income before taxes, extraordinary items, etc.). l9 These proportions are comparable to those in Healy (1985). Healy starts with the Fortune 250, and finds that around half of these firms (123) have bonus plans but do not publicly disclose bonus plan details, and ultimately arrives at a sample of 94 firms with bonus plans that tie the bonus to accounting earnings. These proportions are similar to mine because a large number of firms in the former group probably have ‘discretionary’ bonus plans that Healy excludes.
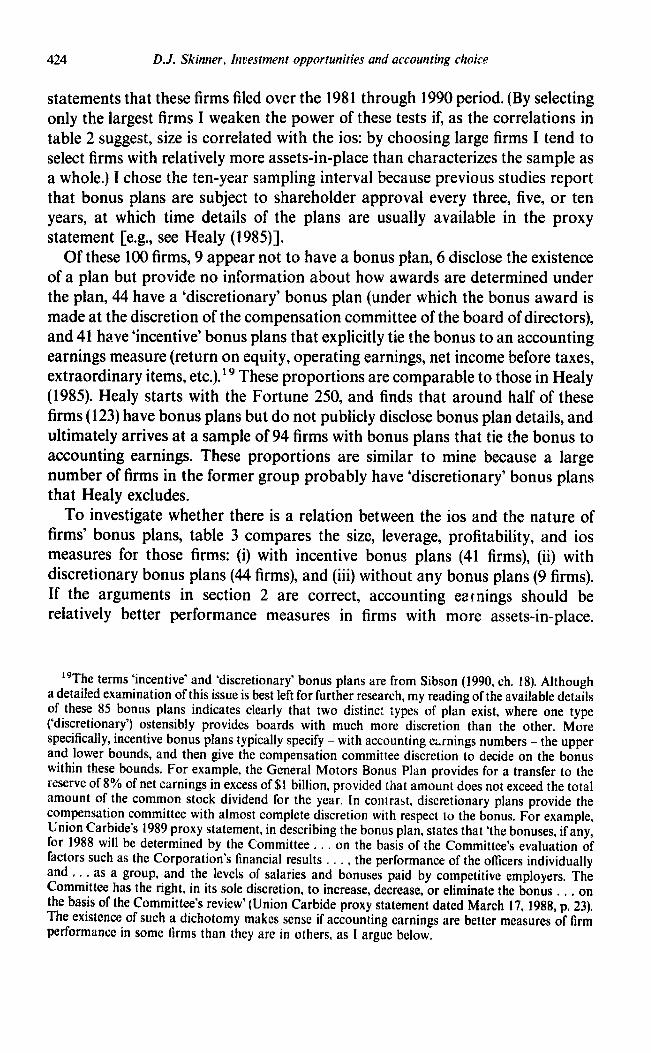
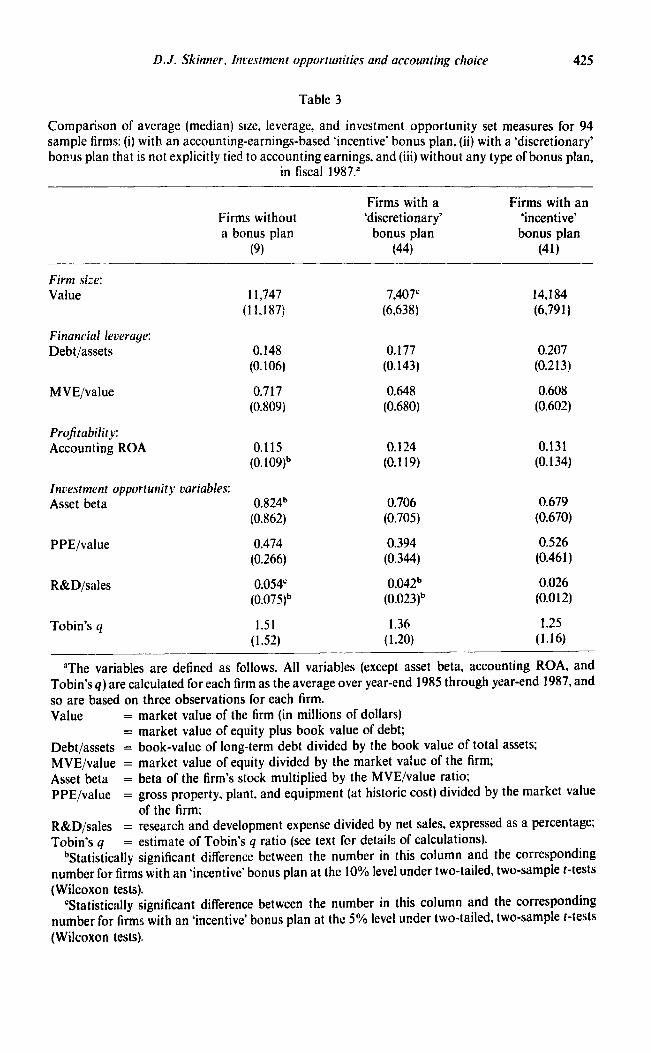
To investigate whether there is a relation between the ios and the nature of firms’ bonus plans, table 3 compares the size, leverage, profitability, and ios measures for those firms: (i) with incentive bonus plans (41 firms), (ii) with discretionary bonus plans (44 firms), and (iii) without any bonus plans (9 firms). If the arguments in section 2 are correct, accounting earnings should be relatively better performance measures in firms with more assets-in-place.
“The terms ‘incentive’ and ‘discretionary’ bonus plans are from Sibson (1990, ch. 18). Although a detailed examination of this issue is best left for further research, my reading of the available details of these 85 bonus plans indicates clearly that two distinct types of plan exist, where one type (‘discretionary’) ostensibly provides boards with much more discretion than the other. More specifically, incentive bonus plans typically specify - with accounting e;mings numbers - the upper and lower bounds, and then give the compensation committee discretion to decide on the bonus within these bounds. For example, the General Motors Bonus Plan provides for a transfer to the reserve of 8% of net earnings in excess of $I billion, provided that amount does not exceed the total amount of the common stock dividend for the year. In contrast, discretionary plans provide the compensation committee with almost complete discretion with respect to the bonus. For example, Union Carbide’s 1989 proxy statement, in describing the bonus plan, states that ‘the bonuses, if any, for 1988 will be determined by the Committee. . . on the basis of the Committee’s evaluation of factors such as the Corporation’s financial results . . . , and . . .
the performance of the officers individually as a group, and the levels of salaries and bonuses paid by competitive employers. The
Committee has the right, in its sole discretion, to increase, decrease, or eliminate the bonus the basis of the Committee’s review’ (Union Carbide proxy statement dated March 17. 1988,‘~.‘2~ The existence of such a dichotomy makes sense if accounting earnings are better measures of firm performance in some firms than they are in others, as 1 argue below.
D. J. Skinner, Investment opportunities and accounting choice 425
Table 3
Comparison of average (median) size, leverage, and investment opportunity set measures for 94 sample firms: (i) with an accouniing-earnings-based ‘incentive’ bonus plan. (ii) with a ‘discretionary’ bonus plan that is not explicitly tied to accounting earnings, and (iii) without any type of bonus plan,
in fiscal 1987.”
Firms without a bonus plan
(9)
Firms with a ‘discretionary’
bonus plan (44)
Firms with an ‘incentive’ bonus plan
(41)
Firm size: Value 11,747
(11,187) 7,407
(6,638)
Financial leverage: Debt/assets 0.148
(0.106) 0.177
(0.143)
MVE/value 0.717 0.648 (0.809) (0.680)
Projtability: Accounting ROA 0.115
(0.109)b 0.124
(0.119)
Investment opportunity variables: Asset beta 0.824b
(0.862) 0.706 (0.705)
PPE/value 0.474 (0.266)
R&D/sales 0.054’ (0.075)b
0.394 (0.344)
0.042b (0.023)b
Tobin’s q 1.51 (1.52)
1.36 (1.20)
14,184 (6,791)
0.207 (0.213)
0.608 (0.602)
0.131 (0.134)
0.679 (0.670)
0.526 (0.461)
0.026 (0.012)
1.25 (1.16)
“The variables are defined as follows. All variables (except asset beta, accounting ROA, and Tobin’s q) are calculated for each firm as the average over year-end 1985 through year-end 1987, and so are based on three observations for each firm. Value =
= Debt/assets = MVE/value = Asset beta = PPE/value =
market value of the firm (in millions of dollars) market value of equity plus book value of debt; book-value of long-term debt divided by the book value of total assets; market value of equity divided by the market value of the firm; beta of the firm’s stock multiplied by the MVE/value ratio; gross property, plant, and equipment (at historic cost) divided by the market value of the firm;
R&D/sales = research and development expense divided by net sales, expressed as a percentage; Tobin’s q = estimate of Tobin’s q ratio (see text for details of calculations).
bStatistically significant difference between the number in this column and the corresponding number for firms with an ‘incentive’ bonus plan at the 10% level under two-tailed, two-sample f-tests (Wilcoxon tests).
‘Statistically significant difference between the number in this column and the corresponding number for firms with an ‘incentive’ bonus plan at the 5% level under two-tailed, two-sample r-tests (Wilcoxon tests).

426 D.J. Skinner, Investment opportunities and accounting choice
Consequently, these firms are likely to use incentive bonus plans that tie the bonus directly to accounting earnings while firms with more growth opportuni- ties are likely to use discretionary bonus plans that do not.
The evidence in table 3 is consistent with this. Firms that use incentive bonus plans have higher mean and median gross PP&E to value ratios (more assets-in-place) but smaller q and R&D ratios (fewer growth opportu- nities) than firms that use discretionary bonus plans, although only the differ- ence in mean and median R&D ratios is statistically significant. Moreover, firms without any bonus plans appear to be those with the largest proportion of growth opportunities of all of the three groups, which is also consistent with accounting numbers being poorer performance measures in growth firms.
The evidence in table 3 provides some support for the idea that the ios affects the firm’s choice of bonus plan (i.e., incentive vs. discretionary) such that firms with relatively more assets-in-place are more likely to use incentive bonus plans. If this is the case in general and other things are held the same, managers of these firms are likely to have larger incentives to choose income-increasing accounting procedures, implying an indirect link between the ios and accounting choice. This is examined further in section 6.
For those firms with an incentive bonus plan that ties the bonus to an accounting earnings measure (41 firms), I also examine whether there is a rela- tion between how the parameters in these firms’ plans are set and their leverage and ios measures. Of these 41 firms, 26 disclosed details of a lower bound and 16 disclosed details of an upper bound. The tests (not reported in tables) indicate that there is no apparent relation between these bounds and the ios or leverage of these firms. However, this is not too surprising since: (i) the results in table 3 indicate that firms with incentive bonus plans tend to be those with relatively large amounts of assets-in-place, so there is not much variation in the ios of the firms that disclose details of the upper and lower bounds, and (ii) the sample sizes are small.
5.2. The ios and accounting-based debt conuenunts
I collect data on sample firms’ accounting-based debt convenants from Moody’s Industrial Marum (1987). Begley (1990b) indicates that Moody’s pro- vides reasonably complete data on accounting-based debt covenants in firms’ public but not private debt issues. As a result of this, I can only make inferences about the relation between the ios and accounting-based debt covenants in public debt issues. This limitation will be important if there is any systematic relation between the ios and firms’ relative utilization of public vs. private debt,
D. J. Skinner, Incesrnzenr opporrunities und accounting choice 427
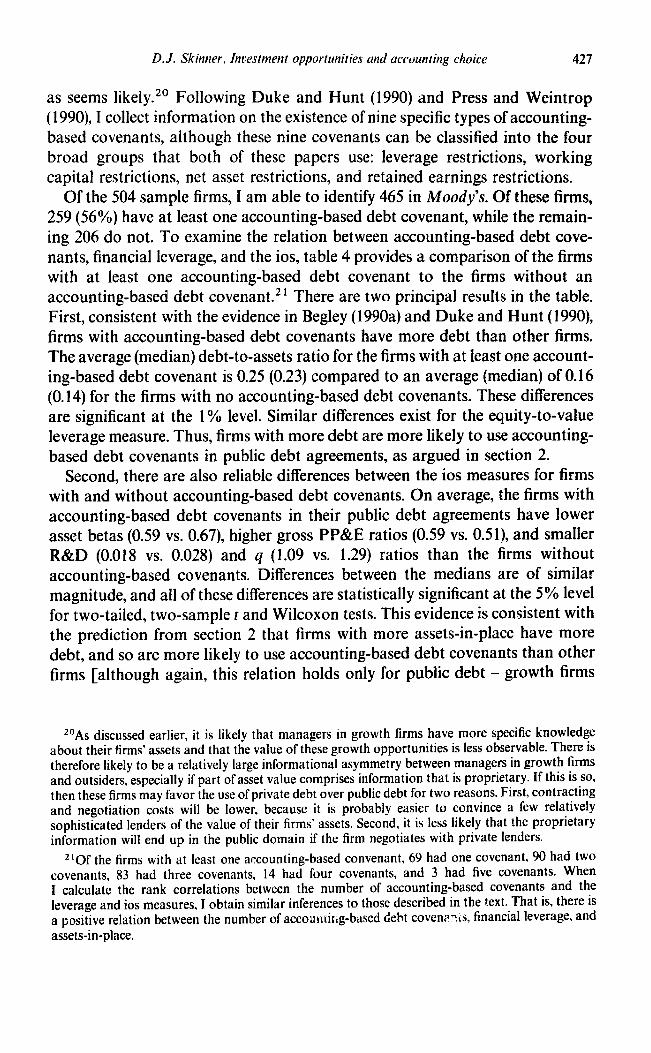
as seems likely. 2o Following Duke and Hunt (1990) and Press and Weintrop (1990), I collect information on the existence of nine specific types of accounting-
based covenants, although these nine covenants can be classified into the four broad groups that both of these papers use: leverage restrictions, working capital restrictions, net asset restrictions, and retained earnings restrictions.
Of the 504 sample firms, I am able to identify 465 in Moody’s. Of these firms, 259 (56%) have at least one accounting-based debt covenant, while the remain- ing 206 do not. To examine the relation between accounting-based debt cove- nants, financial leverage, and the ios, table 4 provides a comparison of the firms with at least one accounting-based debt covenant to the firms without an accounting-based debt covenant. 21 There are two principal results in the table. First, consistent with the evidence in Begley (1990a) and Duke and Hunt (1990), firms with accounting-based debt covenants have more debt than other firms. The average (median) debt-to-assets ratio for the firms with at least one account- ing-based debt covenant is 0.25 (0.23) compared to an average (median) of 0.16 (0.14) for the firms with no accounting-based debt covenants. These differences are significant at the 1% level. Similar differences exist for the equity-to-value leverage measure. Thus, firms with more debt are more likely to use accounting- based debt covenants in public debt agreements, as argued in section 2.
Second, there are also reliable differences between the ios measures for firms with and without accounting-based debt covenants. On average, the firms with accounting-based debt covenants in their public debt agreements have lower asset betas (0.59 vs. 0.67), higher gross PP&E ratios (0.59 vs. 0.51), and smaller R&D (0.018 vs. 0.028) and q (1.09 vs. 1.29) ratios than the firms without accounting-based covenants. Differences between the medians are of similar magnitude, and all of these differences are statistically significant at the 5% level for two-tailed, two-sample t and Wilcoxon tests. This evidence is consistent with the prediction from section 2 that firms with more assets-in-place have more debt, and so are more likely to use accounting-based debt covenants than other firms [although again, this relation holds only for public debt - growth firms
2DAs discussed earlier, it is likely that managers in growth firms have more specific knowledge about their firms’ assets and that the value of these growth opportunities is less observable. There is therefore likely to be a relatively large informational asymmetry between managers in growth firms and outsiders, especially if part of asset value comprises information that is proprietary. If this is so, then these firms may favor the use of private debt over public debt for two reasons. First, contracting and negotiation costs will be lower, because it is probably easier to convince a few relatively sophisticated lenders of the value of their firms’ assets. Second, it is less likely that the proprietary information will end up in the public domain if the firm negotiates with private lenders.
210f the firms with at least one accounting-based convenant, 69 had one covenant, 90 had two covenants, 83 had three covenants, 14 had four covenants, and 3 had five covenants. When I calculate the rank correlations between the number of accounting-based covenants and the leverage and ios measures, I obtain similar inferences to those described in the text. That is, there is a positive relation between the number of accounting-based debt covena?& financial leverage. and assets-in-place.

428 D.J. Skinner, Inoestment opportunities and accounting choice
Table 4
Comparison of average (median) size, leverage, and investment opportunity set measures for 465 firms with and without at least one accounting-based debt covenant in their public debt agreements
in fiscal 1987.“eb
Firms with accounting-based
debt covenants (259)
Firm size: Value 1,902
(656)
Finanrial leverage: Debt/assets 0.251
(0.227)
MVE/value 0.521 (0.532)
Profitability: Accounting ROA 0.119
(0.123)
Investment opportunity variables: Asset beta 0.587
(0.597)
PPE/value 0.588 (0.507)
R&D/sales 0.018 (0.002)
Tobin’s q 1.09 (0.97)
Firms without accounting-based
debt covenants (206)
4,134 (616)
0.164 (0.138)
0.654 (0.671)
0.120 (0.126)
0.674 (0.663)
0.508 (0.407)
0.028 (0.007)
1.29 (1.11)
Test statistic for
difference
t = 2.84* z = 0.21
t = - 6.22* Z = - 6.71*
t = 7.51* Z = 6.99d
t = 0.22 z = 0.43
t = 2.71* Z = 2.47*
t = - 1.95’ Z = - 3.46*
t = 2.95d Z = 2.37d
t = 3.29d z = 3.43*
“The numbers in the difference column are test statistics from two-sample t-tests (Wilcoxon tests) of the null hypothesis that the average (median) difference between the two groups of firms is zero.
bThe variables are defined as follows. All variables (except asset beta, accounting ROA, and Tobin’s q) are calculated for each firm as the average over year-end 1985 through year-end 1987, and so are based on three observations for each firm. Value = market value of the firm (in millions of dollars)
Debt/assets 1 market value of equity plus book value of debt; book value of long-term debt divided by the book value of total assets;
MVE/value = market value of equity divided by the market value of the firm; Asset beta = beta of the firm’s stock multiplied by the MVE/value ratio; PPE/value = gross property, plant, and equipment (at historic cost) divided by the market value
of the firm; R&D/sales = research and development expense divided by net sales, expressed as a percentage; Tobin’s q = estimate of Tobin’s q ratio (see text for details of calculations).
‘Statistical significance at the 5% level (two-tailed test). *Statistical significance at the I % level (two-tailed test).

D. J. Skinner, Incestntent opportunities and accounting choice 429
may use more private debt which also uses accounting-based debt covenants - see Leftwich (1983) 3. Thus, the evidence suggests that the ios drives both financiai leverage and the nature of debt coniracts, which implies that there is likely to be an indirect link between the ios and accounting choice, as outlined in section 2. I address this directly next.
6. The relation between accounting procedure choices and size, leverage, and the investment opportunity set
6.1. The accounting procedure choices
This section provides evidence on the determinants of three accounting procedure choices: inventory cost flow assumption, depreciation method, and goodwill amortization period. To aggregate these choices across firms, I develop a scale (from 0 to 2) to measure the extent to which a given accounting choice can be characterized as income-increasing. Specifically, I characterize the choice of first-in-first-out (FIFO) inventory cost flow assumption, of straight-line depreciation, and of a 40-year goodwill amortization period (the maximum) as income-increasing; these choices are assigned a score of 2. Conversely, the use of a last-in-first-out (LIFO) cost flow assumption, acceler- ated depreciation, and a goodwill amortization period of less than 30 years are characterized as income-decreasing and assigned a score of 0. Finally, the average cost method for inventory (or an approximately equal-weighted combination of FIFO and LIFO), units-of-production depreciation (or a combination of straight-line and accelerated methods), and a goodwill amorti- zation period of between 30 and 39 years (or a statement that goodwill is amortized over periods ‘not to exceed 40 years’) are characterized as neither income-increasing nor income-decreasing, and so receive a score of 1. Therefore, for each of the three procedure choices, the score increases from 0 for the most ‘income-decreasing’ technique through to 2 for the most ‘income-increasing’ technique.22
The characterization of accounting techniques as ‘income-increasing’ or ‘in- come-decreasing’ is a simplification. The choice of particular accounting tech- niques is a choice that determines how revenues and expenses are allocated to different accounting periods rather than a choice that affects the total amount of income that is recognized. However, without access to additional information it is difficult to improve on the above categorization. Moreover, since previous studies also adopt this categorization scheme [e.g., Hagerman and Zmijewski (1979), Zmijewski and Hagerman (198 I), Dhaliwal, Salamon, and Smith (1983,
221 alsa use finer partition where suffkient detail is provided in the annual report. For example, if a firm states that it uses a combination oT the FIFO and AC’ methods, I code this choice as 1.5.

430 D.J. Skinner, ~~l~.~t~lle~ll oppomrrilies urtd uCCouFltiFlg CilOiCe
Sweeney (1991)], my results will be directly comparable to those already in the literature.
Another difficulty with the way that I characterize these firms’ accounting choices is that it ignores the higher moments of the earnings effects of different accounting methods. For example, LIFO will often increase the variability of firm earnings vis-a-vis FIFO. This may be at least as important to risk-averse managers as the effect of inventory method on the level of earnings, especially since the levels effects tend to be offsetting over time. Once again, however, it is difficult to do a great deal about this without performing a much more detailed time series analysis that considers more precisely the effects of alternative accounting methods on the variance of individual firm earnings.
Table 5 provides a summary of these firms’ accounting choices. With respect to inventory accounting, the majority (38%) of firms choose LIFO, while 32.5% choose FIFO, and 20.7% make an intermediate choice. The proportion of firms using LIFO is comparable to that in Accounting Trends and Techniques 1988 (ATT) of 40%. The depreciation method choice shows less variation, with 74. I % of the sample choosing straight-line depreciation, 14.9% choosing either units-of-production or an intermediate combination, and only 9.6% choosing accelerated depreciation. 23 The fact that 74% of firms make the income- increasing depreciation choice, while only 32% of firms’ choose the income- increasing inventory method suggests that different forces drive these two accounting choices; in particular, the inventory choice likely reflects tax-mini- mization as well as financial reporting incentives. Nevertheless, the depreciation and inventory choices exhibit a small positive correlation of 0.10 (significant at the 5% level). Finally, of the 231 firms that report a goodwill accounting method, around half (48%) make the income-increasing choice, 40.7% make an intermediate choice, leaving 11.3% that choose a relatively small amortization period. The goodwill choice exhibits a small positive correlation with the depreciation choice (correlation of 0.10) but is uncorrelated with the inventory choice (correlation of 0.02).
The next subsection provides evidence on the determinants of these firms’ inventory, depreciation, and goodwill choices. I analyze these choices separately because the relatively small correlations among them indicates that: (i) different forces drive the different accounting choices (e.g., tax considerations affect firms’ inventory accounting choices but not their depreciation or goodwill choices), and/or (ii) the noise added by categorizing particular choices as income-increas- ing or income-decreasing (see above) limits my ability to aggregate these scores across the three different accounting choices.
230f the 600 firms in the ATT sample, 559 use straight-line depreciation, 132 use accelerated methods, and 51 use units of production (clearly, a number of firms use more than one mclhod). Similarly, of the 213 firms that report a goodwill amortization period, 173 (HI%) choose 40 years (and another 77 disclose that they use ;I period ‘not exceeding 40 years’).

D. J. Skitmer, hw~rtmw opporrutriries unci accomtit~g choice 431
Summa
Table 5
ry of the inventory, depreciation. and goodwill accounting choices of 504 sample firms in fiscal 1987.
_____ Choice” Code Number Percent of totaf
(A) Itmwtory cost jlow assutnptiot~
FIFO 2 152 32.5 AC,‘FIFO 1.5 26 5.4 AC or Mix 1 97 20.7 AC,‘LIFO 0.5 15 3.2 LIFO 0 178 38.0
Total 468 _______
(B) Depreciation method
SL 2 369 74.1 UPiSL 1.5 7 1.4 UP or Mix U P/‘Acc.
A.5 74 14.9 0 0.0
Act. 0 48 9.6
Total 498 __.__~~__ ~~ _~~ ~~~ _~ ______~_._
(C) Goodwill attlortizatiot~ period
40 years 2 111 48.0 30-39 years 94 40.7 < 30 years
:, 26 11.3
Total 231
“D~fitzition of acron~ws: FIFO = first-in-first-out inventory cost flow assumption; LIFO = last-in-first-out inventory cost flow assumption; AC = average cost method; Mix = approximately equal-weighted combination of FIFO and LIFO; SL = straight-line depreciation; Act. = accelerated depreciation method; UP = units-of-production depreciation method; Mix = combination of SL and Act. methods.
6.2. Multivariate tests
Tables 6 and 7 provide maximum likelihood estimates of ordinal-level logit models of the inventory, depreciation, goodwill, and combined deprecia- tion-goodwill accounting choices. 24 In each case the dependent variable is coded as described above (table 5) so that a positive coefficient indicates an
24Maddala (1983, pp. 46-49) discusses multinomial models with ordered responses and Cox and Snell(1989, ch. 5) describe the ordinal-level logit model that I use here. This type of procedure is also used by Zmijewski and Hagerman (19Pl) and is appropriate given the ordinal nature of the accounting choice data. I have estimated a number of the equations reported in tables 6 and 7 using the ordinal-level probit (or n-probit) model, with very similar results. The ordinal-level logit model is implemented using the MIDAS statistical package developed by the Center for Statistical Consult- ing and Research at the University of Michigan. This package uses the Newton-Raphson numerical procedure to iteratively obtain estimates of the parameters that maximize the likelihood function. The. pseudo R-square that I report is from Aldrich and Nelson (1984, p. 57).

432 D.J. Skinner, Incesstntenr opporlunities and accounting choice
increase in the probability of choosing a more income-increasing accounting alternative. To investigate whether the ios variables help explain accounting choice, I report p-values from chi-square tests of the joint null hypothesis that all of the coefficients on the ios variables are equal to zero. This test examines whether or not the ios variables, as a group, add statistically significant explana- tory power to the regression. I also report (in parentheses beneath each esti- mated coefficient) the coefficient divided by its asymptotic standard error and refer to this ratio as a t-statistic, as well as an overall regression p-value and pseudo R-square.
Because of the large number of independent variables in these regressions (I include the traditional size, financial leverage, and compensation variables, along with ROA and the four ios proxy variables), there are many possible regression specifications. To economize on space, I report on only a few of these regressions in tables. However, because the results (i.e., which variables are significant and which are not) do not vary greatly between different specifica- tions, I am able to do this without distorting the impressions one obtains from the data. In addition, in all of the tables I report on the regression that includes all of the independent variables. (A more comprehensive set of regression results is available from the author.)
Another issue with respect to model specification is whether there is an important simultaneity problem here. If it is the case (as I discuss in section 2) that the ios determines firms’ financing, compensation, and accounting choices, then the error terms in these regressions will be correlated with some of the independent variables, leading to inconsistent estimates of the coefficients. However, to estimate a simultaneous equation model requires specifying exactly what the relation between the ios and these other variables is, which is difficult given the limited state of our knowledge in this area [see Smith and Watts (1991)].
Table 6 provides the results for the inventory method choice regressions. The first equation provides evidence on the size, bonus plan, and debt/equity hypotheses that other studies investigate. Consistent with the size hypothesis, the coefficient on firm size is reliably negative (t-statistic of - 5.35). However, the coefficients on financial leverage and the bonus plan dummy are not significant, which is inconsistent with the debt/equity and bonus plan hypothe- ses. In the second regression I include the ROA measure along with firm size and financial leverage. The coefficient on this variable is reliably negative, which is consistent with firms with poor accounting performance making income-in- creasing accounting choices, although the negative coefficient may also indicate that riskier firms are more likely to choose LIFO.
Regression 3 in table 6 includes the four ios variables, I am able to reject the null hypothesis that the coefficients on these variables are all zero at the 0.0001 level. The pseudo R-square for this regression is 6.1 percent. The coefficient on the PP&E variable (which increases with assets-in-place) is reliably negative,

while that on R&D is reliably positive, implying that firms with relatively more assets-in-place are more likely to make the income-decreasing accounting
choice. Regression 4 in tab!e 6 includes firm size along with the four ios measures as
explanatory variables. Including the ios measures does not reduce the statistical significance of the size relation, and conversely, the statistical significance of the ios variables is not reduced by including firm size in regression. The p-value for the joint null hypothesis that the coefficients on the ios variables are all zero is significant at the 1% level and the pseudo R-square - of 14.3% - is larger than for the regressions that include either just the size variable or just the ios variables. It is again the case that the coefficient on the PP&E measure is reliably negative while that on R&D is reliably positive. The inferences do not change a great deal when I include all of the independent variables in regression 5. In addition to the size and ios variables, the ROA variable is negative and significant, and the pseudo R-square increases to 15.4%. Overall, this evidence indicates that the ios variables add explanatory power to the inventory regres- sions over and above that provided by firm size and ROA.
These results suggest that firms with relatively more assets-in-place are more likely to choose LIFO, which I have characterized as the income-decreasing accounting choice. However, the FIFO vs. LIFO choice also depends on these firms’ relative tax positions and on the relative tax benefits of these two accounting choices. The relative tax benefits of LIFO depend on the direction and rate of change in firms’ input prices, on the variability of firms’ physical inventory levels, and on firms’ effective tax rates [e.g., see Lee and Hsieh (1985) and Dopuch and Pincus (1988)]. These characteristics are likely to be correlated with the ios because: (i) the nature of the firm’s production process is likely to affect the variability of inventory levels, and (ii) the firms’ production process determines the inputs that are required. The more variable the firm’s inventory levels, the higher the probability of forced LIFO liquidations, and SO
the less attractive is LIFO. Thus, firms with relatively more growth opportuni- ties, because they also tend to be more risky, are less likely to select LIFO than are other firms. So the tax effects of the firm’s ios generate a prediction that firms with more assets-in-place will make the income-decreasing account- ing choice.
To investigate the tax explanation, I include in regressions 6-10 in table 6 a variable (‘Infl.‘) that measures the direction and rate of price change in these firms’ industries. Other things equal, the relative tax benefits of LIFO increase with higher (more positive) rates of change in firms’ input prices. I use data from the Bureau of Labor Statistics’ Producer Price Indices to group these firms’ industries into three equal-sized groups: those with high, medium, and low rates of price change since 1967 (similar to other studies, these are industry-level output price indices). I then define the ‘Infl.’ variable such that firms in the low group are coded 2, those in the medium group are coded 1, and those in the high
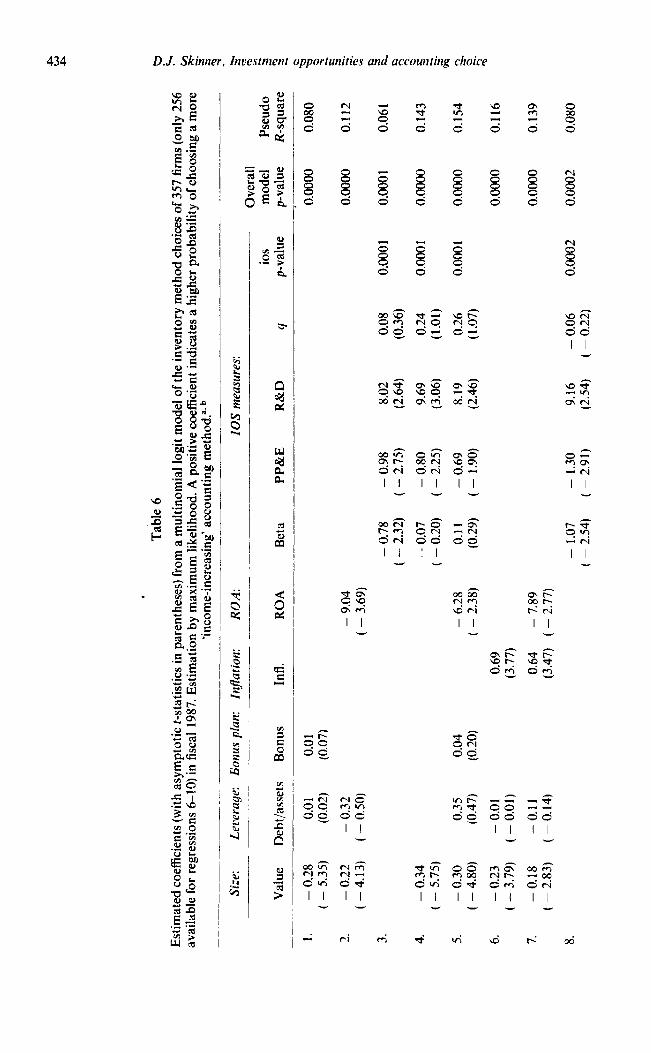
D.J. Skinner, hestment opportunities and accounting choice

9.
- 0.
31
0.47
0.
32
- 0.
12
- 0.
73
8.76
0.
24
0.01
69
0.00
00
0.15
1
( -
4.07
) (0
.53)
(1
.50)
(
- 0.
25)
( -
1.54
) (2
.17)
(0
.80)
10.
- 0.
26
0.36
0.
35
- 6.
23
0.01
-
0.58
6.
09
0.30
0.
0800
0.
0000
0.
163
( -
3.36
) (0
.41)
(1
.60)
(
- 2.
02)
(0.0
2)
( -
1.19
) (1
.44)
(0
.99)
_~
~~_
_
“The
tab
le
repo
rts
on m
ultin
omia
l lo
git
regr
essi
ons
of f
irm
s’ i
nven
tory
ac
coun
ting
scor
es
(cod
ed
from
5
for
FIFO
th
roug
h 1
for
LIF
O)
on v
ario
us
com
bina
tions
of
the
fol
low
ing
expl
anat
ory
vari
able
s.
bAll
expl
anat
ory
vari
able
s (e
xcep
t be
ta,
RO
A.
and
the
dum
my
vari
able
s)
are
calc
ulat
ed
for
each
fi
rm
as t
he a
vera
ge
over
ye
ar-e
nd
1985
thr
ough
ye
ar-e
nd
1987
val
ues,
and
so
are
bas
ed
on t
hree
ob
serv
atio
ns
for
each
fi
rm.
Val
ue
=
=
Deb
t’as
sets
=
D
:‘A
*cov
enan
t =
Bon
us
=
RO
A
=
Infl
. =
mar
ket
valu
e of
the
fir
m (
in m
illio
ns
of d
olla
rs)
mar
ket
valu
e of
equ
ity
plus
boo
k va
lue
of d
ebt;
book
va
lue
of l
ong-
term
de
bt d
ivid
ed
by t
he b
ook
valu
e of
tot
al
asse
ts;
debt
,‘as
sets
m
ultip
lied
by a
dum
my
vari
able
se
t eq
ual
to o
ne i
f th
e fi
rm h
as a
t le
ast
one
acco
untin
g-ba
sed
debt
co
vena
nt
and
zero
ot
herw
ise;
du
mm
y va
riab
le
set
to o
ne i
f th
e fi
rm h
as a
bon
us
plan
w
here
the
am
ount
of
the
aw
ard
is e
xplic
itly
tied
to a
n ac
coun
ting
earn
ings
nu
mbe
r an
d ze
ro
othe
rwis
e:
ten-
year
av
erag
e of
the
yea
rly
ratio
of
ope
ratin
g in
com
e (b
efor
e de
prec
iatio
n ex
pens
e an
d af
ter
adju
stin
g fo
r th
e ch
ange
in
the
LIF
O
rese
rve)
to
fir
m v
alue
. ex
pres
sed
as a
per
cent
age;
va
riab
le
code
d as
2/1
/O fo
r fi
rms
in i
ndus
trie
s th
at e
xper
ienc
ed
low
/med
ium
/hig
h ra
tes
of p
rice
cha
nge
sinc
e 19
67, a
s m
easu
red
by t
he
Bur
eau
of L
abor
St
atis
tics’
P
rodu
crr
Pric
e In
dice
s.
inse
stm
ent
oppo
rtun
ity
set
(10s
) m
easu
res:
B
eta
=
beta
of
the
fir
m’s
sto
ck
mul
tiplie
d by
the
MV
E/v
alue
ra
tio:
PPE
=
gr
oss
prop
erty
, pl
ant,
and
equi
pmen
t (a
t hi
stor
ic
cost
) di
vide
d by
the
mar
ket
valu
e of
the
fir
m;
R&
D
=
rese
arch
an
d de
velo
pmen
t ex
pens
e di
vide
d by
net
sal
es,
expr
esse
d as
a p
erce
ntag
e;
q =
es
timat
e of
Tob
in’s
q
ratio
(s
ee t
ext
for
deta
ils
of c
alcu
latio
ns).
The
io
s p-
valu
e is
tha
t fr
om
a te
st o
f th
e jo
int
hypo
thes
is
that
th
e co
effi
cien
ts
on
the
ios
prox
y va
riab
les
are
all
equa
l to
zer
o.
Mor
e sp
ecif
ical
ly,
the
ditf
eren
ce
betw
een
min
us t
wic
e th
e lo
g-lik
elih
ood
for
the
full
mod
el (
incl
udin
g th
e io
s va
riab
les)
and
min
us t
wic
e th
e lo
g-lik
elih
ood
for
the
redu
ced
mod
el
(exc
ludi
ng
the
ios
vari
able
s)
follo
ws
an a
sym
ptot
ic
chi-
squa
re
dist
ribu
tion
with
deg
rees
of
free
dom
eq
ual
to t
he n
umbe
r of
ios
var
iabl
es.
See,
e.g
., A
ldri
ch
and
Nel
son
(198
4, p
. 59
).

436 D.J. Skinner, Jncestment opportunities and accounting choice
group are coded 0, If the relative tax benefits of LIFO increase with higher rates of increase in firms’ input prices (and this helps explain the accounting choice), the Infl. variable will be positively related to accounting choice.25
The evidence indicates that tax-related incentives do help explain firms’ inventory method choices. When I include the Ink variable with firm size and financial leverage in regression 6, its coefficient is reliably positive (t-statistic of 3.77), consistent with the prediction that the relative tax benefits of LIFO increase with increases in input prices. The coefficient on firm size remains reliably negative. Similarly, when I include the Infl. variable along with firm size, financial leverage, and the ROA measure in regression 7, the coefficients on firm size and ROA are reliably negative and that of InIX reliably positive.26 [Some care must be exercised in comparing the results in equations 6-10 with those in equations l-5 since there are 357 firms with available data for equations l-5 but only 256 firms with available data for equations 6-10 (i.e., there are 101 firms without the inflation data).]
Regressions 9 and 10 in table 6 include the ios variables along with firm size, ROA, and the InP.. measure. The ios measures are less significant when all of these other variables are included than they were in regressions l-5, suggesting that the ios is correlated with tax incentives. (The fact that the ios variables are jointly significant at the 0.0002 level in regression 8 indicates that the different sample is not the cause of the decline in significance for these variables.) Consistent with this, firms with relatively more growth opportunities tend to be those for which the tax benefits of LIFO are relatively small: the ‘InIl.’ variable is negatively related to the PP&E variable (correlation of - 0.42) and positively related to R&D (0.25) and 4 (0.25) so that firms with relatively more assets- in-place tend to have experienced larger rates of price increase.
2JI have also used this variable to perform a check on my coding of LIFO as ‘income-decreasing’ and FIFO as ‘income-increasing’. If input prices are falling over some period of time, then FIFO is likely to be the income-decreasing accounting choice over that period. Therefore, it may be that my coding is incorrect for firms for which the price variable is coded 2 (relatively low rates of price increase) and correct for firms for which this variable is coded 0 (relatively high rates of price increase). If this is the case, I would expect a different relation between the probability of choosing FIFO and the independent variables for different levels of the price variable. However, when I run these regressions with the price variable included as an interactive dummy with the other indepen- dent variables, none of the interactive terms are significantly different from zero at the 10% level, which provides some assurance about the way that I code the inventory choice variable (these regressions are not reported in tables),
261n unreported regressions I also include a measure ot :hese firms’ net operating loss (NOL) carryforwards. Firms with relatively large NOL carryforwartis have little incentive to choose LIFO to minimize taxes. Consistent with this argument, I find that firms that use FIFO have significantly larger NOL carryforwards than firms that use LIFO (the mean and median differences are significant at the 5% level). However, the NOL carryforward variable is not significant in a multi- variate logit that also includes firm size, ROA, and lnfl. as independent variables. This could be due to collinearity: not surprisingly, the NOL carryforward variable is negatively related to ROA (correlation of - 0.44).

D. J. Skinner, hwestmenl opporrunitier and accounting choice 437
Panel A of table 7 reports ehe results for the depreciation method choice. The first regression in panel A characterizes extant results for the size, debt/equity, and bonus plan hypotheses. Consistent with these hypotheses, the probability of choosing the income-increasing accounting alternative (in this case straight-line depreciation) increases as financial leverage increases, is larger when the firm has a bonus plan that ties the bonus directly to accounting earnings, and decreases as firm size increases. The coefficients on all three variables are reliably different from zero, with t-statistics of - 3.72 (firm size), 4.09 (financial leverage), and 3.32 (bonus plan), and the pseudo R-square for this regression is 9.1 percent. The second regression includes the ROA measure along with the size, leverage, and bonus play variables. The coefficient on ROA is. insignificant.
According to the debt/equity hypothesis, financial leverage is important in these regressions because it proxies for managers’ incentives to choose income- increasing accounting procedures to loosen accounting-based debt covenants. If this is the case, there will be a relation between accounting choice and financial leverage for firms with accounting-based covenants but not for firms without such covenants. To test this, in regression 3 I include a dummy variable coded 1 if the firm has at least one accounting-based debt covenant and 0 otherwise, multiplied by the debt/assets variable, as well as including the debt/assets variable alone. The coefficient on this multiplicative dummy variable measures how the slope coefficient on debt/assets differs for firms with and without accounting-based debt covenants.
Similar to the results in Press and Weintrop (1990), the leverage variable remains significant (t-statistic of 2.46) in this regression while the multiplicative dummy variable is insignificant (t = 0.74). Thus, the relation between leverage and the depreciation choice does not seem to be due to accounting-based covenants, and so may reflect a direct effect of the ios on both accounting choice and leverage. (However, this test is probably biased against the multiplicative dummy variable because the debt/assets variable includes private as well as public debt, while the debt covenant dummy includes only covenants in public debt agreements.)
Regression 4 in panel A of table 7 includes the four ios measures. In this regression the null hypothesis that all of the coefficients on the ios proxy variables are zero is rejected at the 7% level. However, the only variable that is individually significant is asset beta, which has a negative coefficient, implying that firms with higher betas are more likely to select income-decreasing account- ing procedures.
When I include the ios measures along with all of the other variables in regression 5, they are only jointiy significant at the 10% level, and none of the ios variables is individually significant. In contrast, the firm size, financial leverage, and bonus plan variables remain statistically significant (their t-statistics are largely unaffected by including the ios measures). Moreover, the pseudo R-square in this regression is 9.8% which is similar to that for the first

438 D.J. Skinner, Inrestment opportunities and accounting choice
regression in the table. The ‘traditional’ variables thus seem to be more impor- tant than the ios variables. Because of collinearity in these data, this result does not necessarily imply that size, leverage, and the bonus plan are the ‘right’ variables and that the ios measures are not. However, the fact that the size, leverage, and bonus plan relations that other studies document are robust to including the ios variables is important, because it suggests that these variables do not ‘matter’ in other studies merely because they are correlated with the ios.
Table 7, panel B provides results for the choice of goodwill amortization period. The results in the first regression are similar to, but weaker than, those for depreciation: accounting choice is negatively related to firm size and posi- tively related to both debt/assets and the existence of a bonus plan. However, only the coefficient on debt/assets is reliably different from zero. The different results may be because tlic sample of firms here is different to those in the depreciation and inventory regressions: only 171 firms are included in panel B compared with 369 firms in panel A and 357 firms in table 6. Moreover, the 171 firms included here tend to be larger than those in the depreciation regressions (the difference in medians is significant at the 1% level) because the smaller sample firms tend not to report a goodwill choice. When I reestimate the depreciation regressions with only the 169 firms that report both goodwill and depreciation choices, the size and bonus plan relations become insignificant.
In regression 2 of panel B I again include the multiplicative dummy variable to see whether it is leverage per se, or the existence of accounting-based debt covenants in combination with leverage, that better explains accounting choice. In this regression the coefficient on the multiplicative dummy variable is positive and significant at the 10% level, while the coefficient on debt/assets becomes insignificant. Thus, for these firms leverage is only important for firms with accounting-based covenants, which is consistent with managers selecting in- come-increasing accounting procedures to loosen debt-covenant constraints.27
Regression 3 includes the four ios measures as explanatory variabies. The ios p-value is small (less than O.OOl), indicating that the ios variables together are related to the goodwill choice, and the pseudo R-square is 10.2%, larger than for either of the first two regressions in panel B. The two variables that are most significant are PP&E (t-statistic of - 1.75) and R&D (t-statistic of - 3.45). While the negative coefficient on R&D suggests that firms with more growth opportunities are more likely to select income-decreasing accounting proce- dures, the negative coefficient on gross PP&E suggests the opposite.
*‘These results are different to those in panel A: the multiplicative dummy variable was not significant in the depreciation regressions, while the debt/assets variable was significant. This difference is not due to the different samples - when I reestimate the depreciation regressions with only the 171 firms included in panel B, the coefficient on the debt/assets variable is still reliably positive, while that on the multiplicative dummy is still insignificant.

D. J. Skinner, hcesmrenr opportunities and uccounting choice 439
Regressions 4 and 5 in panel B of table 7 include the firm size, financial leverage, bonus plan, and ROA measures along with the ios variables. The ios variables, as a group, remain significant in the presence of the other variables. Moreover, the coefficients on PP&E and R&D are both negative, although only the coefficient on R&D is statistically significant. In addition, the coefficient on the multiplicative leverage variable is positive and significant at the 5% level, while the coefficient on the bonus plan dummy is positive and signi5cant at the 10% level. The results for goodwill are therefore consistent with the debt/equity and bonus plan hypotheses, but also indicate that the ios variables are important.
Finally, table 7, panel C reports results for regressions that combine these firms’ depreciation and goodwill choices in a single dependent variable, similar to Zmijewski and Hagerman (1981). 28 For these regressions I categorize the accounting choices of these firms into five different strategies, from most in- come-increasing (where the firm selects the most income-increasing alternative for both depreciation and goodwill) to most income-decreasing (where the firm selects the most income-decreasing alternative for both choices), and use these strategies as the dependent variable. 29 As with the Zmijewski-Hagerman tests, this should provide a more powerful test than considering either of these choices in isolation.
The evidence in the first two regressions in panel C of table 7 is again consistent with the traditional contracting explanations for accounting choice. The coefficients on the size, financial leverage, and the bonus plan dummy variables are all reliably different from zero, with the size variable negatively related to accounting choice and the debt/assets and bonus plan dummy variables both positively related to accounting choice. Regression 3 includes these variables along with the multiplicative debt covenant variable. The coeffi- cient on this variable is positive and marginally significant (t = 1.53), supporting the interpretation that leverage is important because it proxies for the existence of accounting-based debt covenants (again, the coefficient on this variable may be downward biased because the debt covenant dummy systematically excludes covenants from private debt agreements). This regression has a pseudo R-square of 15.4%.
Regression 3 in panel C includes the four ios variables. These variables are jointly significant at the 1% level, and the regression R-square is 10%. The
“1 do not include the inventory choice because, as noted above, this choice depends on tax as well as contracting considerations, and so seems to be a different decision from the other two accounting choices.
29Since the goodwill choice has only three levels (income-increasing, intermediate, and income- decreasing), I also collapse the depreciation choice into three levels. Since there are three levels for each of two choices, there are nine possible permutations and five unique strategies. Of the 229 firms that report both choices, 85 (37%) select strategy 5 (the most income-increasing strategy), 85 (37%) select strategy 4,39 (17%) select strategy 3, 14 (6%) select strategy 2, and 6 (3%) select strategy 1 (the most income-decreasing strategy).

Tab
le
7
Est
imat
ed
coef
fici
ents
(w
ith a
sym
ptot
ic
t-st
atis
tics
in p
aren
thes
es)
from
a m
ultin
omia
l lo
git
mod
el
of t
he d
epre
ciat
ion
(pan
el A
), g
oodw
ill
(pan
el B
), a
nd
com
bine
d de
prec
iatio
n-go
odw
ill
met
hod
choi
ces
of s
ampl
e fi
rms
in f
isca
l 19
87,
estim
atio
n by
max
imum
lik
elih
ood.
A
pos
itive
co
effi
cien
t in
dica
tes
a hi
gher
pr
obab
ility
of
cho
osin
g a
mor
e ‘i
ncom
e-in
crea
sing
’ ac
coun
ting
met
hod.
a*b
- 1.
7 _. 3.
4.
5.
1.
7 -.
3.
4.
5.
Siz
e:
Leu
erqe
: B
onus
pla
n:
RO
A:
10s
meu
sure
s:
____
__
-_-
___
___~
~__
__-
____
- O
vera
ll D
/A *
io
s m
odel
Ps
eudo
V
alue
D
ebt/a
sset
s co
vena
nt
Bon
us
RO
A
Bet
a PP
&E
R
&D
4
p-va
lue
p-va
lue
R-s
quar
e ~-
- __
__
___~
~__
(A)
Dep
reci
atio
n m
etho
d ch
oice
(3
69
firm
s)
- 0.
23
4.05
0.
85
( -
3.72
) (4
.09)
(3
.32)
- 0.
25
4.04
0.
83
( -
3.74
) (4
. IO
) (3
.23)
- 0.
18
3.10
0.
88
( -
2.97
) (2
.46)
(0
.74)
- 0.
26
3.46
1.
17
0.83
(
- 3.
52)
(2.5
5)
(0.9
6)
(3.1
9)
- 0.
10
2.47
0.
43
( -
1.16
) (2
.35)
(1
.40)
- 0.
09
0.70
2.
49
0.51
(
- 1.
05)
(0.4
9)
(1.8
7)
( 1.6
4)
- 0.
02
- 0.
35
( -
0.23
) (
- 0.
22)
- 0.
03
- 0.
17
( -
0.32
) (
- 0.
10)
2.64
0.
62
(1.9
3)
(1.8
8)
3.04
0.
56
(2.1
4)
(1.6
9)
_.
1.99
(0
.69)
- 1.
05
- 0.
15
- 0.
31
( -
2.67
) (
- 0.
54)
( -
0.09
)
3.83
-
0.44
-
0.18
2.
81
(1.2
0)
( -
0.97
) (
- 0.
61)
(0.7
4)
(B)
Goo
dwil
l rn
erho
d choi
ce (1
71 li
rms)
- 0.
56
- 1.
17
- 17
.45
0.28
0.
0007
0.
0007
0.
102
( -
1.03
) (
- 1.
75)
( - 3.
45)
(0.9
6)
- 7.
87
- 18
.83
0.51
0.
0004
0.
0001
0.
146
( -
1.93
) (
- 3.
52)
(i-8
1)
- 5.
25
0.05
-
1.15
-
17.2
5 0.
32
0.00
01
0.00
03
0.15
3 (
- 1.
19)
(0.0
7)
( -
1.56
) (-
3.
16)
(1.0
4)
0.00
00
0.09
1
o.oo
oo
0.06
5
o.oo
oo
0.06
7
- 0.
02
0.07
03
0.07
03
0.02
3 (
- 0.
09)
0.19
0.
0976
0.
0000
0.
098
(0.7
4)
0.01
86
0.05
5
0.00
91
0.07
3
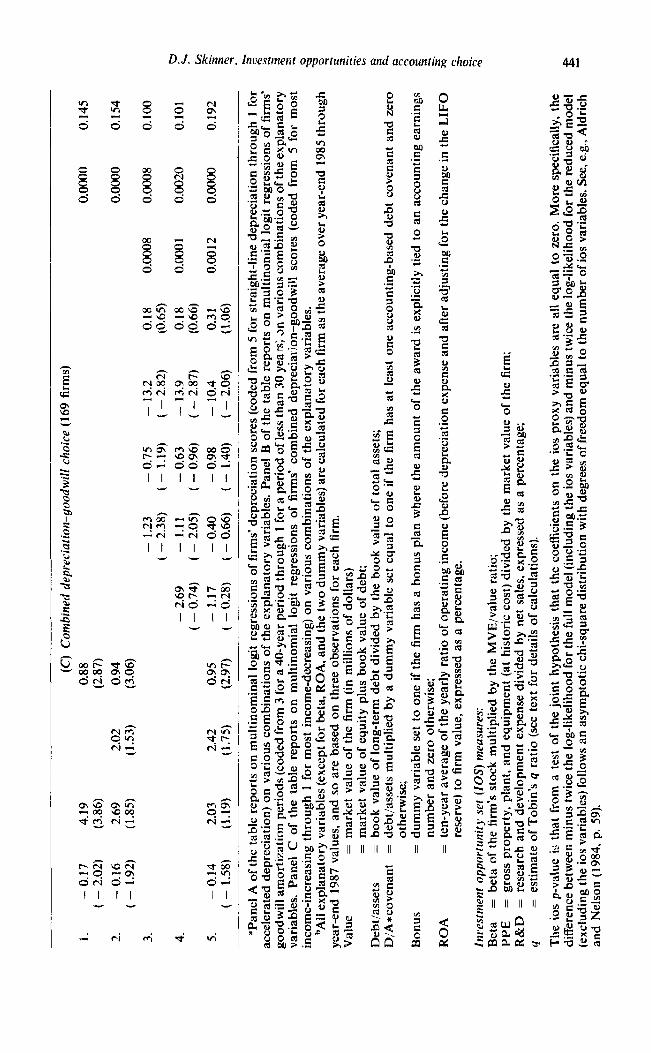
1.
- 0.
17
( -
2.02
) 3 __
-
0.16
(
- 1.
92)
3.
4.
5.
- 0.
14
( -
1.58
)
4.19
(3
.86)
2.69
(1
.85)
2.03
(1
.19)
2.02
(1
.53)
2.42
(1
.75)
(C)
Com
bine
d de
prec
iati
on-g
oodw
ill
choi
ce
(169
fi
rms)
0.88
(2
.87)
0.94
(3
.06)
- 1.
23
- 0.
75
- 13
.2
( -
2.38
) (
- 1.
19)
( -
2.82
)
- 2.
69
- 1.
11
- 0.
63
- 13
.9
( -
0.74
) (
- 2.
05)
( -
0.96
) (
- 2.
87)
0.95
-
I.17
-
0.40
-
0.98
-
10.4
(2
.97)
(
- 0.
28)
( -
0.66
) (
- 1.
40)
( -
2.06
)
o.oo
oo
0.14
s
o.oo
oo
0.15
4
0.18
0.
0008
0.
0008
0.
100
(0.6
5)
0.18
0.
0001
0.
0020
0.
101
(0.6
6)
0.31
0.
0012
0.
0000
0.
192
(1.0
6)
=Pan
el
A o
f th
e ta
ble
repo
rts
on
mul
tinom
inal
lo
git
regr
essi
ons
of f
irm
s’
depr
ecia
tion
scor
es
(cod
ed
from
5
for
stra
ight
-lin
e de
prec
iatio
n th
roug
h 1
for
acce
lera
ted
depr
ecia
tion)
on
va
riou
s co
mbi
natio
ns
of t
he
expl
anat
ory
vari
able
s.
Pane
l B
of
the
tabl
e re
port
s on
m
ultin
omia
l lo
git
regr
essi
ons
of f
irm
s’
good
will
am
ortiz
atio
n pe
riod
s (c
oded
fr
om
3 fo
r a
40-y
ear
peri
od
thro
ugh
1 fo
r a
peri
od
of l
ess
than
30
yea
rs;
sn
vari
ous
com
bina
tions
of
the
exp
lana
tory
va
riab
les.
Pa
nel
C
of
the
tabl
e re
port
s on
m
ultin
omia
l lo
git
regr
essi
ons
of
firm
s’
com
bine
d de
prec
iatio
n-go
odw
ill
scor
es
(cod
ed
from
5
for
mos
t in
com
e-in
crea
sing
th
roug
h 1
for
mos
t in
com
e-de
crea
sing
) on
va
riou
s co
mbi
natio
ns
of t
he
expl
anat
ory
vari
able
s.
bAli
expl
anat
ory
vari
able
s (e
xcep
t fo
r be
ta,
RO
A,
and
the
two
dum
my
vari
able
s)
are
calc
ulat
ed
for
each
fi
rm
as t
he a
vera
ge
over
ye
ar-e
nd
1985
thr
ough
ye
ar-e
nd
1987
va
lues
, an
d so
are
ba
sed
on
thre
e ob
serv
atio
ns
for
each
fi
rm.
Val
ue
= m
arke
t va
lue
of t
he
firm
(in
m
illio
ns
of d
olla
rs)
= m
arke
t va
lue
of e
quity
pl
us
book
va
lue
of d
ebt;
Deb
t/ass
ets
= bo
ok
valu
e of
lon
g-te
rm
debt
di
vide
d by
th
e bo
ok
valu
e of
tot
al
asse
ts;
D/A
*cov
enan
t =
debt
/ass
ets
mul
tiplie
d by
a
dum
my
vari
able
se
t eq
ual
to
one
if t
he
firm
ha
s at
le
ast
one
acco
untin
g-ba
sed
debt
co
vena
nt
and
zero
ot
herw
ise;
B
onus
=
dum
my
vari
able
se
t to
on
e if
the
fi
rm
has
a bo
nus
plan
w
here
th
e am
ount
of
the
aw
ard
is e
xplic
itly
tied
to
an
acco
untin
g ea
rnin
gs
num
ber
and
zero
ot
herw
ise;
R
OA
=
ten-
year
av
erag
e of
the
ye
arly
ra
tio
of o
pera
ting
inco
me
(bef
ore
depr
ecia
tion
expe
nse
and
afte
r ad
just
ing
for
the
chan
ge
in
the
LIF
O
rese
rve)
to
fi
rm
valu
e,
expr
esse
d as
a
perc
enta
ge.
Inve
stm
ent
oppo
rtun
ity
set
(IO
S)
mea
sure
s:
Bet
a =
beta
of
the
fi
rm’s
st
ock
mul
tiplie
d by
th
e M
VE
/val
ue
ratio
; PP
E
= gr
oss
prop
erty
, pl
ant,
and
equi
pmen
t (a
t hi
stor
ic
cost
) di
vide
d by
th
e m
arke
t va
lue
of t
he
firm
; R
&D
=
rese
arch
an
d de
velo
pmen
t ex
pens
e di
vide
d by
ne
t sa
les,
ex
pres
sed
as a
per
cent
age;
4 =
estim
ate
of T
obin
’s
q ra
tio
(see
te
xt
for
deta
ils
of c
alcu
latio
ns).
The
io
s p-
valu
e is
tha
t fr
om
a te
st
of t
he
join
t hy
poth
esis
th
at
the
coef
fici
ents
on
th
e io
s pr
oxy
vari
able
s ar
e al
l eq
ual
to
zero
. M
ore
spec
ific
ally
, th
e di
ffer
ence
be
twee
n m
inus
tw
ice
the
log-
likel
ihoo
d fo
r th
e fu
ll m
odel
(i
nclu
ding
th
e io
s va
riab
les)
an
d m
inus
tw
ice
the
log-
likel
ihoo
d fo
r th
e re
duce
d m
odel
(e
xclu
ding
th
e io
s va
riab
les)
fo
llow
s an
as
ympt
otic
ch
i-sq
uare
di
stri
butio
n w
ith
degr
ees
of f
reed
om
equa
l to
the
nu
mbe
r of
ios
var
iabl
es.
See,
e.g
., A
ldri
ch
and
Nel
son
(198
4,
p. 5
9).

442 D.J. Skinner, Investment opportunities and accounting choice
coefficients on R&D and beta are negative and reliably different from zero, again suggesting that firms with more assets-in-place (fewer growth opportuni- ties) are more likely to make the income-increasing accounting choice. In regression 4 I include the ROA variable along with the ios variables. Similar to the results in panels A and B, the ROA variable is not significant, and its inclusion does not affect the significance of the ios variables.
When I include all of the variables in regression 5, the pseudo R-square increases to 19.2% but only two of the coefficients are individually significant: the coefficient on the bonus plan dummy is reliably positive and the coefficient on R&D is reliably negative. Of the other variables, the one that is closest to being significant at the 5% level is that on the multiplicative debt/assets *covenants variable. The reduction in the individual significance of the other variables probably reflects the collinearity that exists between these variables.
Overall, the evidence in table 7 suggests that the ‘traditional’ explanations are important, even after controlling for the effect of the ios. Nevertheless, the ios variables do help explain these choices, both by themselves and in combination with the traditional variables. The results in table 7 also suggest that firms with more assets-in-place are more likely to choose income-increasing accounting procedures, which is opposite to the result for the inventory choice.
7. Discussion and summary
This study provides evidence on the relation between firms’ investment opportunities, the nature of their debt and compensation contracts, and their financial leverage, size, firm performance, and accounting procedures. There are three principal empirical results.
First, larger firms are more likely to select income-decreasing depreciation and inventory procedures, more highly-levered firms are more likely to select income-increasing depreciation and goodwill procedures, and firms with bonus plans are more likely to select income-increasing depreciation and goodwill procedures, than are other firms. These results confirm extant results in the literature, that is, they are consistent with the size, debt/equity, and bonus plan hypotheses. Importantly, the evidence indicates that these relations are robust to including measures of the ios and/or accounting performance (ROA) in accounting choice regressions.
Second, I document that the ios affects the nature of firm contracts: firms with more assets-in-place are more likely to have accounting-based debt covenants in their public debt agreements and are more likely to use bonus plans that tie the bonus directly to accounting earnings. As a result, managers of firms with more assets-in-place have larger incentives, given the nature of their firms’ contracts, to select income-increasing accounting procedures. Therefore, the ios affects accounting choice indirectly through its effect on the nature of firm contracts.

6). J. Skinner, Imesmzenr opporrunities und accounling choice 443
Third, the ios variables are correlated with all three of the accounting procedures that I examine. Moreover, except in the case of depreciation, the ios variables provide incremental explanatory power in regressions that also include firm size, financial leverage, and the bonus plan dummy as independent vari- ables. Thus, the evidence indicates that there is an association between the ios and accounting procedure choice, even after controlling for managers’ contrac- tual incentives to select particular accounting procedures.
More specifically, firms with larger ratios of assets-in-place to value are more likely to make ‘income-increasing’ depreciation and goodwill choices than other firms. However, while the ios proxy variables are also related to these firms’ inventory accounting choices, the directional association is opposite that for the depreciation and goodwill choices: firms with larger ratios of assets-in-place to value are more likely to make the ‘income-decreasing’ accounting choice (LIFO) than are other firms. One plausible explanation for this result is that firms’ inventory method choices are also affected by the relative tax costs of LIFO vs. FIFO, and that the relative tax costs of FIFO are smaller for firms with relatively more growth opportunities.
Overall, the evidence in this paper increases our understanding of current accounting practice in several ways. First, while there has been speculation in the literature about the effect of the ios on accounting choice, this study is the first to document this relation in a general way for a large, randomly-chosen, sample of firms. Importantly, the evidence suggests that previous evidence on the size, debt/equity, and bonus plan hypotheses cannot be explained by the fact that those studies exclude the ios, which is a potentially important correlated omitted variable. Second, this study documents that the ios systematically affects the nature of firm contracts, and thus affects managers’ contractual incentives to select particular accounting procedures. Finally, the evidence provides some limited support for the view that the ios affects accounting choice directly, which is expected if the ios affects which accounting procedures are optimal ex ante.
References
AICPA, 1988, Accounting trends and techniques, 42nd ed. (AICPA. New York, NY). Aldrich, John H. and Forrest D. Nelson, 1984, Linear probability, logit, and probit models (Sage
Publications, Beverly Hills, CA). Ball, Ray and George Foster, 1982, Corporate financial reporting: A methodological review of
empirical research, Supplement to Journal of Accounting Research 20, 161-234. Begley, Joy, 1990a, The use of debt covenants to control agency problems, Unpublished dissertation
(University of Rochester, Rochester, NY). Begley, Joy, 1990b, Debt covenants and accounting choice, Journal of Accounting and Economics
12, 125-139. Bradley, Michael, Gregg A. Jarrell, and E. Han Kim, 1984 On the existence of an optimal capital
structure: Theory and evidence, Journal of Finance 39, 8:7-880. Clinch, Greg, 1991, Employee compensatton a,rcf fins’ resear-. -h and development activity, Journal
of Accounting Research 29. 59-78.

444 D.J. Skinner, Imestmcnt opprtunities and accounting choice
Collins, Daniel W.. S.P. Kothari, Jay Shanken, and Richard G. Sloan, i992, Lack of !imeliness versus noise as explanations for low contemporaneous returns<arnings relation, Working paper (University of Rochester, Rochester, NY).
COX, D.R. and E.J. Snell, 1989, Analysis of binary data, 2nd ed. (Chapman and Hall, London). Dechow, Patricia M. and Richard G. Sloan, 1991, Executive incentives and the horizon problem: An
empirical investigation, Journal of Accounting and Economics 14, 51-89. Demski, Joel S., James M. Patell, and Mark A. Wolfson, 1984, Decentralized choice of monitoring
systems, The Accounting Review 59, 16-34. Dhaliwal, Dan S., Gerald Salamon, and E. Dan Smith, 1982, The effect of owner versus management
control on the choice of accounting methods, Journal of Accounting and Economics 4,41-53. Dopuch, Nicholas and Morton Pincus, 1988, Evidence on the choice of inventory accounting
methods: LIFO versus FIFO, Journal of Accounting Research 26, 28-59. Duke, Joanne C. and Herbert G. Hunt III, 1990, An empirical examination of debt covenant
restrictions and accounting-related debt proxies, Journal of Accounting and Economics 12, 45-63.
Foster, George, 1986, Financial statement analysis. 2nd ed. (Prentice-Hall, Englewood Cliffs, NJ). Gaver, Jennifer J. and Kenneth M. Gaver, 1993, Additional evidence on the association between the
investment opportunity set and corporate financing, dividend and compensation policies, Jour- nal of Accounting and Economics 16, forthcoming.
Hagerman, Robert L. and Mark E. Zmijewski, 1979, Some economic determinants of accounting policy choice, Journal of Accounting and Economics 1, 141-161.
Hall, Bronwyn H., Clint Cummins, Elizabeth S. Laderman, and Joy Mundy, 1988, The R&D master file documentation, Technical working paper no. 72 (National Bureau of Economic Research, Cambridge, MA).
Hamada, Robert S., 1972, The effects of the firm’s capital structure on the systematic risk of common stocks, Jottrnal of Finance 27,435452.
Healy, Paul M., 1985, The effect of bonus schemes on accounting decisions, Journal of Accounting and Economics 7,85-107.
Holthausen, Robert W., 1990, Accounting method choice: Opportunistic behavior, efficient con- tracting, and information perspectives, Journal of Accounting and Economics 12, 207-218.
Holthausen, Robert W. and Richard W. Leftwich, 1983, The economic consequences of accounting choice: Implications of costly contracting and monitoring, Journal of Accounting and Eco- nomics 5, 77- 117.
Kim, Kyungho, and Douglas A. Schroeder, i990, Analysts’ use of managerial bonus incentives in forecasting earnings, Journal of Accounting and Economics 13. 3-23.
Lambert, Richard A. and David F. Larcker, 1987, An analysis of the use of accounting ;:nd market measures of performance in executive compensation contracts, Journal of Accounting Research 25,85-125.
Lee, Chi-Wen Jevons and David A. Hsieh, 1985, Choice of inventory accounting meth,ods: Com- parative analyses of alternative hypotheses, Journal of Accounting Research 23, 468-485.
Leftwich, Richard, 1983, Accounting information in private markets: Evidence from private lending agreements, The Accounting Review 58, 23-42.
Leftwich, Richard, 1990, Aggregation of test statistics: Statistics vs. economics, Journal of Account- ing and Economics 12, 37-44.
Lilien, Steven, Martin Mellman, and Victor Pastena, 1988, Accounting changes: Successful versus unsuccessful firms, The Accounting Review 63, 642-656.
Lindenberg, Eric B. and Stephen A. Ross, 1981, Tobin’s r~ ratio and industrial organization, Journal of Business 54, l-32.
Long, Michael S. and Ileen B. Malitz, 1985, Investment patterns and financial leverage, in: B. Friedman, ed., Corporate capital structure in the United States (University of Chicago Press, Chicago, IL) 325-348.
Maddala, G.S., 1983, Limited-dependent and qualitative variables in econometrics, Econometrics Society monograph (Cambridge University Press, Cambridge).
Merck, Randall, Andrei Shleifer, and Robert W. Vishny, 1988, Management ownership and market valuation: An empirical analysis, Journal of Financial Economics 20, 293-315.
Myers, Stewart C., 1977, Determinants of corporate borrowing, Journal of Financial Economics 5, 147-175.

D. J. SliiiInei I .kccs:ment opporlunities and accounting choice 445
Press, Eric G. and Joseph B. Wcinrrop, ! 390, Accounting-based constraints in public and private debt agreements: Their association with leverage and their of Accounting and Economics 12,65-95.
I, impact on accounting choice, Journal
Sibson, Koberi E., i99g, Compensation, 5th ed. (American Management Association, New York, NY)
Smith, Clifford W., Jr. and Jerold B. Warner, 1979, On financial contrac;ir~~* .e. An analysis of bond covenants, Journal of Financial Economics 7, 117-161.
Smith, Clifford W., Jr. and Ross L. Watts, 1982, Incentive and tax effects of executive compensation plans, Australian Journal of Management 7, 139-157.
Smith, Clifford W., Jr. and Ross L. Watts, 1991, The investment opportunity set and corporate policy choices, Working paper (University of Rochester, Rochester, NY).
Sweeney, Amy P., 1991, The impact of debt-covenant violations on accounting choices, Working paper (Harvard Business School, Cambridge, MA).
Watts, Ross L.. 1977, Corporate financial statements, a product of the market and political processes, Australian Journal of Management 2, 53-78.
Watts, Ross L. and Jerold L. Zimmermman, 1986, Positive accounting theory (Prentice-Hall, Englewood Cliffs, NJ).
Watts, Ross L. and Jerold L. Zimmerman, 1990, Positive accounting theory: A ten year perspective, The Accounting Review 65, 131-156.
Zimmer, Ian, 1986, Accounting for interest by real estate developers. Journal of Accounting and Economics 8, 37-5 1.
Zmijewski, Mark E. and Robert L. Hagerman, 1981, An income strategy approach to the positive theory of accounting standard setting/choice, Journal of Accounting and Economics 3,129-149.