Embed Size (px)
Citation preview

8/14/2019 The Influentials: New approaches for Analyzing Influence on Twitter
http://slidepdf.com/reader/full/the-influentials-new-approaches-for-analyzing-influence-on-twitter 1/18
The Infuentials:New Approaches or
Analyzing Infuence on Twitter
a publication o the Web Ecology Project
Pub. 04 (2 September 2009)

8/14/2019 The Influentials: New approaches for Analyzing Influence on Twitter
http://slidepdf.com/reader/full/the-influentials-new-approaches-for-analyzing-influence-on-twitter 2/18
ANALYZING INFLUENCE ON TWITTER
2 September 2009 page 2
http://webecologyproject.org
AuthorsBy Alex Leavitt
with Evan Burchard, David Fisher, & Sam Gilbert
We would also like to thank Jon Beilin, Mac Cowell, and Tim Hwang or their invaluable contributions,
eedback, and support.
About The Web Ecology ProjectThe Web Ecology Project is an interdisciplinary research group based in Boston, Massachusetts
ocusing on using large scale data mining to analyze the system-wide ows o culture and com-
munity online. In addition to the task o understanding culture on the web through quantitative
research and rigorous experimentation, we are attempting to build a science around community
management and social media. To that end, we are building tools and conducting research that
enable planners to launch data-driven campaigns backed by network science.
For press or research inquiries, please visit our website (http://webecologyproject.org), contact
us via email at [email protected], or call Tim Hwang (CEO) at [973] 960-4955.
The Web Ecology Project releases this paper under a Creative Commons Attribution Share-Alike 3.0 license
(http://creativecommons.org/licenses/by-sa/3.0/).

8/14/2019 The Influentials: New approaches for Analyzing Influence on Twitter
http://slidepdf.com/reader/full/the-influentials-new-approaches-for-analyzing-influence-on-twitter 3/18
ANALYZING INFLUENCE ON TWITTER
2 September 2009 page 3
http://webecologyproject.org
Executive SummaryUsing a new methodology based on the content and responses o 12 popular users, we determined mea-
surements o relative inuence on Twitter. We examined an ecosystem o 134,654 tweets, 15,866,629 ol-
lowers, and 899,773 ollowees, and in response to the 2,143 tweets generated by these 12 users over a 10-
day period, we collected 90,130 responses published by other users.
Summary o Findings
An analysis o our methodology and statistics suggests that on Twitter, among various congurable con-
clusions:
• mashable is more inuential than CNN .
• sockington is more inuential than MCHammer, while MCHammer is more inuential than three ma-
jor social media analysts ( garyvee, Scobleizer, and chrisbrogan ).
• Celebrities with higher ollower totals (eg., THE_REAL_SHAQ and ijustine ) oster more conversation
than provide retweetable content.
• News outlets, regardless o ollower count, inuence large amounts o ollowers to republish their
content to other users.
8/14/2019 The Influentials: New approaches for Analyzing Influence on Twitter
http://slidepdf.com/reader/full/the-influentials-new-approaches-for-analyzing-influence-on-twitter 4/18
ANALYZING INFLUENCE ON TWITTER
2 September 2009 page 4
http://webecologyproject.org
Following Followers: Judging Inuence on TwitterAs a simple online platorm or conversation, Twitter is an ideal an ecological system through
which we can understand the relationship between users and their environments on the Web. Especially
compared to other social networks, Twitter simplies most o the extraneous eatures and boils down
its environment to people and content. The unusual simplicity o Twitter, though, continues to warp
perception o how the relationship between user and platorm operates. Many o the popularized stud-
ies examining inuence on Twitter ail to identiy the nuances o social interaction in the system. While
attempts have been made (eg., http://twinuence.com/about.php ), the analyses tend to ocus on the con-
nections between users rather than the relationship o users, content, and platorm. This report there-
ore aims to supplement previous investigations o the Twitter environment with more comprehensive
data sets to enhance new approaches to understanding the concept o “inuence” on social networks.
A ocus solely on the connections between users skews an understanding o how inuence oper-
ates and ows on Twitter. A popular metric o perceived inuence on Twitter measures the quantity o
a user’s ollowers. In general, the more ollowers a user possess, the more impact he appears to make in
the Twitter environment, because he seems more popular (namely, that users ollow him). This state-
ment makes senseassuming that Twitter acts as a successul broadcast medium, where a user publishes
a tweet and it is read by every ollower. However, this view o Twitter as a broadcast medium ignores the
potential or users to interact with the content on the platorm.
A similar and equally popular metric to measure inuence on Twitter relies on the ratio between
the number o a user’s ollowers and the number o other people that the user ollows (his audience, or
as we designate in this report, ollowees). This ratio, while better than the ormer method o counting
ollowers, is still imprecise. Again, a ratio based on audience ignores the ability or a user to interact with
content on the platorm. However, the ratio o ollowers to ollowees does inorm a better understanding
o how inuence can operate in Twitter’s environment.
8/14/2019 The Influentials: New approaches for Analyzing Influence on Twitter
http://slidepdf.com/reader/full/the-influentials-new-approaches-for-analyzing-influence-on-twitter 5/18
ANALYZING INFLUENCE ON TWITTER
2 September 2009 page 5
http://webecologyproject.org
The ratio o ollowers to ollowees may communicate the intended purpose or emergent practices
o a user. For example, i the ratio approaches innity (high ollower total versus low ollowee total), the
user account might be described as ocusing on the material aspect o Twitter. By material, we mean a
compulsion toward moving content to other users in the environment. In another instance, i the ratio
approaches 1 (an equal or near-equal amount o ollowers and ollowees), the user might be categorized
as a conversationalist. The user most likely ollows back a majority o his ollowers, to retain amiliarity
with more personal conversations. Contrarily, the materialistic user aims to collect ollowers as contacts
to whom the user may push content (who may then share the same content with other users). Finally, i
the ratio approaches zero (low ollower total versus high ollowee total), we might categorize the user as
a spammer. As an emergent behavior, the stereotypical spammer attempts to collect users with the intent
to push content to as many people as possible ater achieving a high ollower tally. However, most contem-
porary users can spot the stereotypical behavior o a spammer or bot, resulting in the low ollower total on
the spammer’s account.
While the ollower to ollowee ratio does not represent an accurate measurement o inuence on
Twitter, the ratio does inorm the community to types o users. Beore we apply these types to our under-
standing o online inuence, we must rst dene inuence.
Defning Inuence on Twitter An attempt to dene a universal concept o inuence on the Web remains dicult, because we
must account or the variations o platorms, uidity o environments, and evolving behaviors o users
online. Because each platorm is diferent, this report will rely on a denition o online inuence specic
to the environment o Twitter. Thereore, we dene inuence on Twitter as the potential o an action o a
user to initiate a urther action by another user. The term user is dened by Twitter’s platorm. The term
action deserves urther explanation.

8/14/2019 The Influentials: New approaches for Analyzing Influence on Twitter
http://slidepdf.com/reader/full/the-influentials-new-approaches-for-analyzing-influence-on-twitter 6/18
ANALYZING INFLUENCE ON TWITTER
2 September 2009 page 6
http://webecologyproject.org
Understanding the term action as it relates to inuence on Twitter depends on the undamen-
tal structure o ideas in the environment and how these ideas move. The undamental unit o content
on Twitter is the tweet (a user may type up to 140 characters and publish them to the web interace), so
an action on Twitter comprises all interactions o a user and that unit o content (tweet). While we can
analyze various types o inuential actions (eg., a view on YouTube or a like on Facebook), this report will
primarily ocus on actions specic to Twitter. Our analysis o inuence on Twitter, then, relies on the un-
derstanding o how actions shape behavior on the platorm.
Inuence as Actions; Actions as ResponsesWhile actions on Twitter comprise both those interactions recognized by the platorm as well as
unexpected emergent behaviors that become widely used by users, Twitter recognizes two actions intrin-
sic to the system that can occur: the reply and the retweet.
Reply: @username {content}
Example:
@chrisbrogan Thanks or this. I’m new to twitter and it was really helpul
Digitaltonto (on 2009-08-15 at 00:47:17)
Retweet : RT @username {content}
RT @aplusk great article thank U RT @Morgan_Johnston: this great article on health care by Whole Foods
coounder/CEO
cheerok (on 2009-08-15 at 00:31:10)
The reply and retweet are categorized as actions because they are applied by a user to a piece o content.
The reply acts as a response to another user’s tweet using new content, while the retweet operates as a ci-
tation or paraphrase o another user’s previous content. While both actions have diferent purposes, both

8/14/2019 The Influentials: New approaches for Analyzing Influence on Twitter
http://slidepdf.com/reader/full/the-influentials-new-approaches-for-analyzing-influence-on-twitter 7/18
ANALYZING INFLUENCE ON TWITTER
2 September 2009 page 7
http://webecologyproject.org
are meant to move content to other users (albeit in difering ways). I a reply or retweet exists with respect
to a given tweet, the actions are evidence or inuence that has occurred. A reply occurs because a user is
inuenced to reply to the content; a retweet occurs because a user is inuenced to reproduce the content.
Literally, the actions are markers o inuence.
Two other actions that appear requently on Twitter, extrinsic to the system yet popular enough to
have become adopted by users, require explanation: the mention and the attribution.
Mention: {content} @username ({content})
Watching @BarackObama speak in Colorado on @CNN
RareAir24 (on 2009-08-15 at 19:08:51)
Attribution: {content} via @username ({content})
Fire at Kuwaiti wedding kills dozens, ofcial media says http://bit.ly/wn95A (via @cnnbrk)
ChilliGaz (on 2009-08-15 at 19:40:18)
Similar to the reply and the retweet, the mention and the attribution are categorized as actions because
they too are applied by a user to a piece o content. We have separated the mention and the attribution
rom the more undamental reply and retweet because the ormer two actions are not ocially recognized
by the Twitter platorm. In act, a mention is similar to a reply, except a mention occurs at some point in
the tweet other than at the beginning. Comparably, an attribution is similar to a retweet, except an attribu-
tion borrows the symbology o the reply to provide a citation or previously published content.
We must also note here that, rst, while we distinguish the attribution rom the mention, we have
calculated them rom the same database query. Any measurement in this report o mentions also encap-
sulates attributions; however, we will distinguish the attribution as separate rom the mention later in the
paper (by tallying it alongside retweets in certain equations). Second, since mentions theoretically serve

8/14/2019 The Influentials: New approaches for Analyzing Influence on Twitter
http://slidepdf.com/reader/full/the-influentials-new-approaches-for-analyzing-influence-on-twitter 8/18
ANALYZING INFLUENCE ON TWITTER
2 September 2009 page 8
http://webecologyproject.org
the purpose o replies, and attributions the purpose o retweets, we have not expounded upon their use in
the explanation o inuence in the ollowing paragraphs. However, we can hypothesize that the applica-
tions o replies include mentions and the applications o retweets include attributions.
Categorizing Actions: Conversation & ContentIn the second-to-previous paragraph, we hint at a similar categorization or actions that we pre-
viously applied to users. Given two probable types o users, one ocused on conversation and another on
content, we can map these classications to actions -- replies and retweets, respectively -- to explain how
the relationship between users o and the actions on a platorm shapes inuence on Twitter. The pur-
pose o replies assumes that a conversation is the intended goal o the action. In writing a reply, the user
has been inuenced to respond to a previous unit o content published by another user. Similarly, with a
retweet (the objective o which is to push content), the user has been inuenced by a previous user’s con-
tent to reproduce the content or other users to view. In basic terms, we can see the reply as talking back
to the rst user and the retweet as passing on content to a third user. However, when assigning values o
inuence to these types o actions, we do not give preerence to one or the other.
Previously, we examined two possible approaches to measuring inuence on Twitter: 1) count-
ing the total number o ollowers a user possesses, and 2) calculating the ratio o a user’s ollowers to a
user’s ollowees. These two approaches still ignore the relationship between the user, the content, and the
platorm. The goal o this report is to move beyond these basic assertions about inuence by analyzing a
comprehensive set o replies, retweets, and other actions on Twitter that act as evidence or the inuential
potential o users.
Understanding Inuence with New DataFor this report, we gathered relevant data rom 12 Twitter users or 10 days, between 12:00 am 15
August 2009 and 12:00 am 25 August 2009. We ocused on a small number o celebrities, news outlets, and
social media analysts widely perceived to be among the more inuential users on Twitter. Based on the

8/14/2019 The Influentials: New approaches for Analyzing Influence on Twitter
http://slidepdf.com/reader/full/the-influentials-new-approaches-for-analyzing-influence-on-twitter 9/18
ANALYZING INFLUENCE ON TWITTER
2 September 2009 page 9
http://webecologyproject.org
content and connections o these 12 users, we examined a total o 134,654 tweets, 15,866,629 ollowers,
and 899,773 ollowees. In response to the 2,143 tweets generated by these 12 users o the 10 day period,
we collected 90,130 responses (actions) published by other users (which equates to 87,987 more messages
than total original tweets, or a total average o 42 responses per tweet).
We have listed the 12 users below, categorized into three distinct groups that we eel ultimately
represent the user types previously discussed. We have also calculated the total number o tweets pub-
lished by each user, the total number o each users’ ollowers, and the total number o users that each o
our 12 users ollows. These statistics were updated between 28 August 2009 and 30 August 2009, so they
may not necessarily reect the exact number o tweets, ollowers, and ollowees present during the 10-day
window that our data encompasses.
Celebrity Username Tweets Followers Followees
Ashton Kutcher aplusk 3,205 3,407,385 209
Shaquille O’Neil THE_REAL_SHAQ 2,072 2,092,541 562
Stanley Kirk Burrell MCHammer 6,016 1,331,797 31,202
Sockington sockington 5,711 1,089,984 380
Justine Ezarik ijustine 7,718 605,441 3,039News Outlet Username Tweets Followers Followees
CNN Breaking News cnnbrk 1,096 2,712,530 18
BarackObama.com BarackObama 330 2,018,016 761,851
Mashable.com mashable 17,914 1,363,510 1,925
CNN cnn 11,607 193,625 50
Social Media Analyst Username Tweets Followers Followees
Gary Vaynerchuk garyvee 7,532 862,790 9,683
Chris Brogan chrisbrogan 48,341 94,715 88,431
Robert Scoble Scobleizer 23,112 94,295 2,423
The above table has been arranged in decreasing order by total ollowers, based on the three distinct cat-
egories o users. These categories reveal certain resemblances to aspects o content user types and conver-
sation user types. Generally, news outlets aim to push content, social media analysts strive to perpetuate
conversations, and celebrities tend to do both (dependent on their personal practices and the community
8/14/2019 The Influentials: New approaches for Analyzing Influence on Twitter
http://slidepdf.com/reader/full/the-influentials-new-approaches-for-analyzing-influence-on-twitter 10/18
ANALYZING INFLUENCE ON TWITTER
2 September 2009 page 10
http://webecologyproject.org
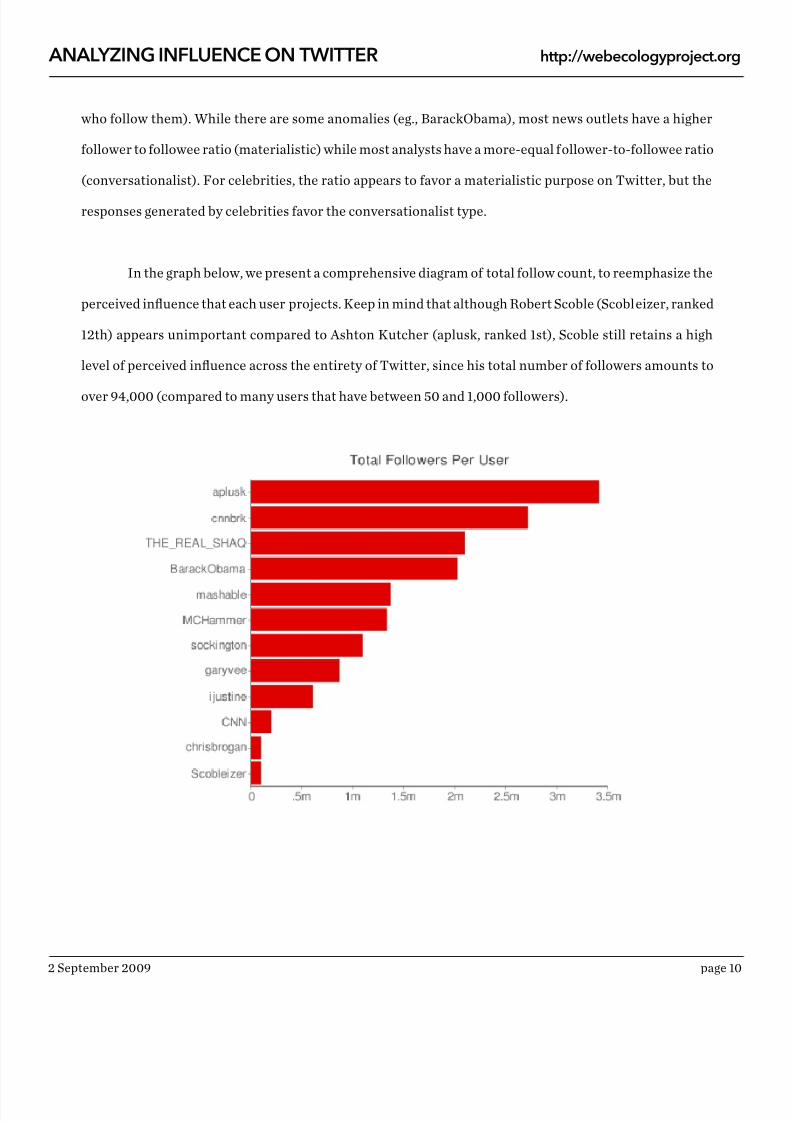
who ollow them). While there are some anomalies (eg., BarackObama), most news outlets have a higher
ollower to ollowee ratio (materialistic) while most analysts have a more-equal ollower-to-ollowee ratio
(conversationalist). For celebrities, the ratio appears to avor a materialistic purpose on Twitter, but the
responses generated by celebrities avor the conversationalist type.
In the graph below, we present a comprehensive diagram o total ollow count, to reemphasize the
perceived inuence that each user projects. Keep in mind that although Robert Scoble (Scobleizer, ranked
12th) appears unimportant compared to Ashton Kutcher (aplusk, ranked 1st), Scoble still retains a high
level o perceived inuence across the entirety o Twitter, since his total number o ollowers amounts to
over 94,000 (compared to many users that have between 50 and 1,000 ollowers).
8/14/2019 The Influentials: New approaches for Analyzing Influence on Twitter
http://slidepdf.com/reader/full/the-influentials-new-approaches-for-analyzing-influence-on-twitter 11/18
ANALYZING INFLUENCE ON TWITTER
2 September 2009 page 11
http://webecologyproject.org
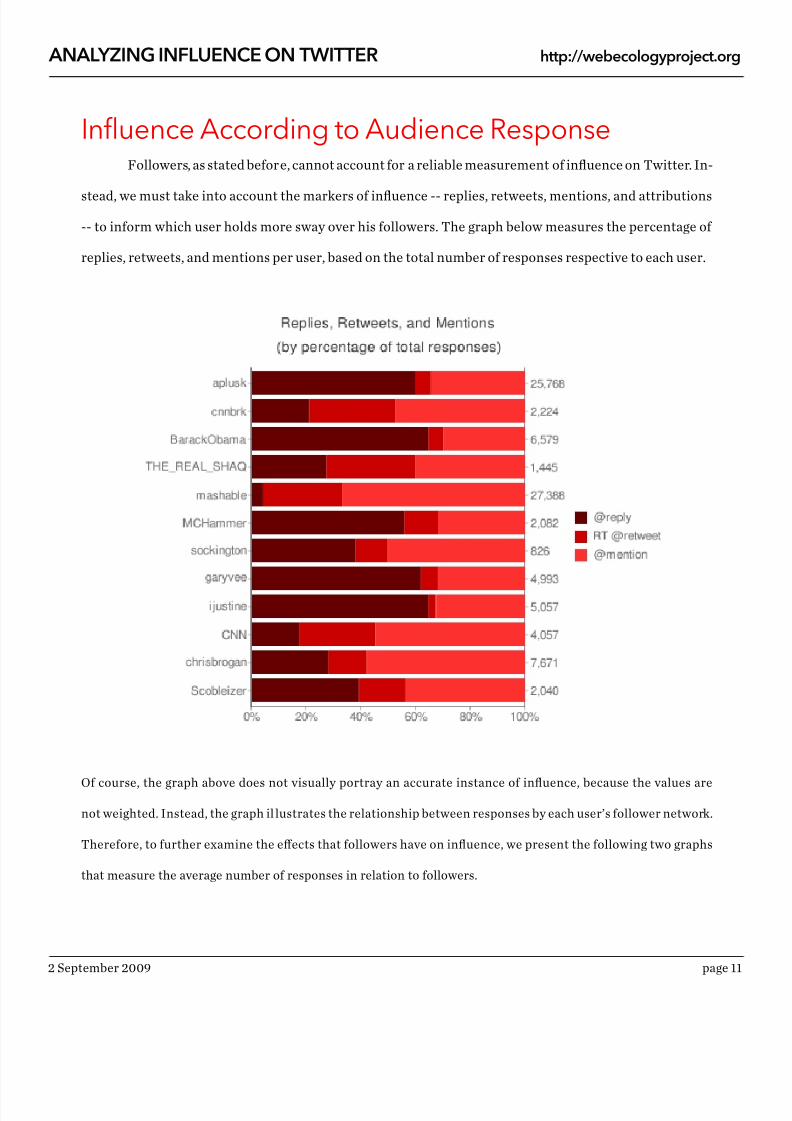
Inuence According to Audience ResponseFollowers, as stated beore, cannot account or a reliable measurement o inuence on Twitter. In-
stead, we must take into account the markers o inuence -- replies, retweets, mentions, and attributions
-- to inorm which user holds more sway over his ollowers. The graph below measures the percentage o
replies, retweets, and mentions per user, based on the total number o responses respective to each user.
O course, the graph above does not visually portray an accurate instance o inuence, because the values are
not weighted. Instead, the graph il lustrates the relationship between responses by each user’s ollower network.
Thereore, to urther examine the efects that ollowers have on inuence, we present the ollowing two graphs
that measure the average number o responses in relation to ollowers.
8/14/2019 The Influentials: New approaches for Analyzing Influence on Twitter
http://slidepdf.com/reader/full/the-influentials-new-approaches-for-analyzing-influence-on-twitter 12/18
ANALYZING INFLUENCE ON TWITTER
2 September 2009 page 12
http://webecologyproject.org
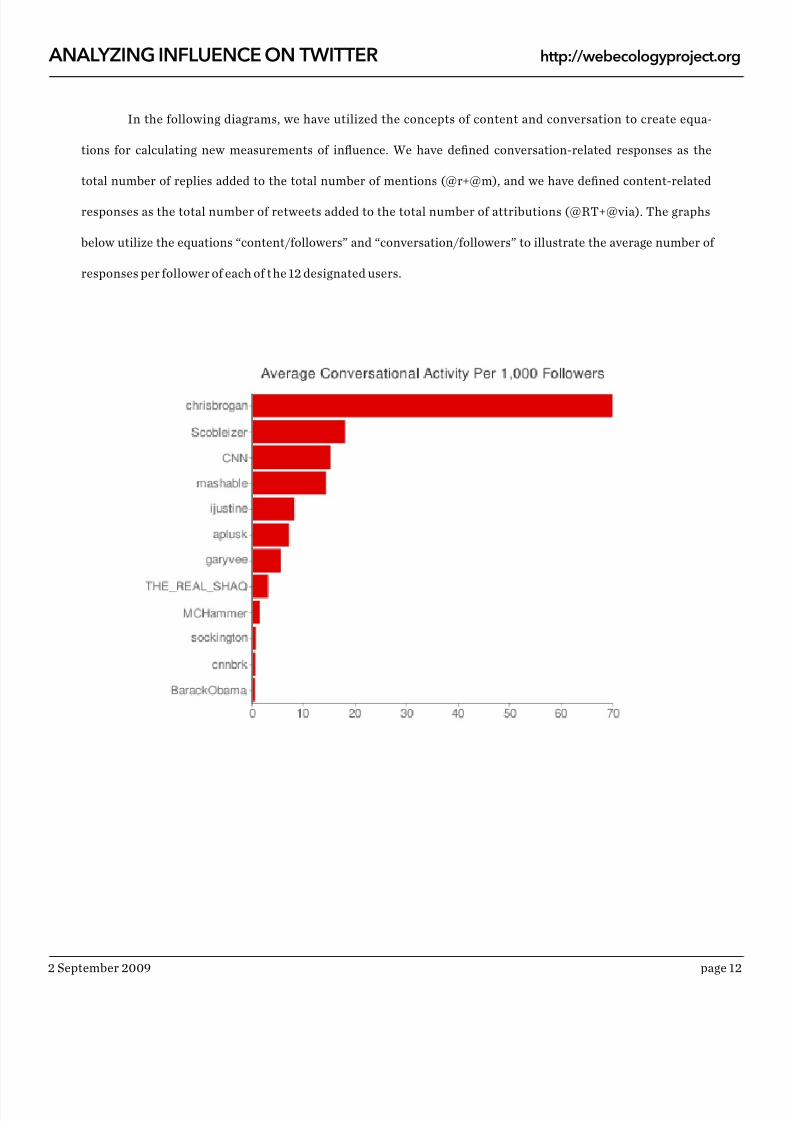
In the ollowing diagrams, we have utilized the concepts o content and conversation to create equa-
tions or calculating new measurements o inuence. We have dened conversation-related responses as the
total number o replies added to the total number o mentions (@r+@m), and we have dened content-related
responses as the total number o retweets added to the total number o attributions (@RT+@via). The graphs
below utilize the equations “content/ollowers” and “conversation/ollowers” to illustrate the average number o
responses per ollower o each o t he 12 designated users.

8/14/2019 The Influentials: New approaches for Analyzing Influence on Twitter
http://slidepdf.com/reader/full/the-influentials-new-approaches-for-analyzing-influence-on-twitter 13/18
ANALYZING INFLUENCE ON TWITTER
2 September 2009 page 13
http://webecologyproject.org
The two graphs above present an interesting theory, in that the social media analysts appear to dominate both
realms o content and conversation, thanks to their ollower network. CNN and Mashable.com also appear high
on the list o u sers that are able to interact well with their ollowers as well as push content easily to others.
Tweets & Responses: Actions and ReactionsWhile the above diagrams suggest that a user’s audience impacts how ideas move around said user
to a large extent, these graphs do not take into account the tweets created by our 12 users, especially in
relation to the responses the tweets generate. Returning to the graph representing the percentage o all
responses, this illustration o inuence is not entirely accurate because it does not account or the relative
amount o content produced. This is especially important since the original tweets are the inuencers that
inspire replies, retweets, etc. Below, we present the same percentages o responses in a graph that weighs
the comparison o responses against the total number o responses o other users.

8/14/2019 The Influentials: New approaches for Analyzing Influence on Twitter
http://slidepdf.com/reader/full/the-influentials-new-approaches-for-analyzing-influence-on-twitter 14/18
ANALYZING INFLUENCE ON TWITTER
2 September 2009 page 14
http://webecologyproject.org
The weighted graph above illustrates a signicantly diferent measurement o inuence than the previous
diagram. I we were to state that inuence is dictated by how many responses are generated, then we could
certainly argue that Mashable.com is more inuential than CNN Breaking News -- a bold statement, es-
pecially when more than twice as many users ollow cnnbrk than ollow mashable. However, the weighted
response statistics above must be compared to the amount o original tweets that inspired response. We
have provided these statistics in the graph below:

8/14/2019 The Influentials: New approaches for Analyzing Influence on Twitter
http://slidepdf.com/reader/full/the-influentials-new-approaches-for-analyzing-influence-on-twitter 15/18
ANALYZING INFLUENCE ON TWITTER
2 September 2009 page 15
http://webecologyproject.org
The relationship between the original tweet and any subsequent responses certainly matters. For exam-
ple, even though mashable and aplusk boast similar amounts o reactions (with a diference o 1620 in
avor o mashable), mashable originated more than 2.5 times as many original tweets to inuence those
responses. Thereore, aplusk exerted less efort to achieve near-similar success. Similarly, BarackObama
genereated more than 3 times as many responses in the ten-day period than did MCHammer; however,
MCHammer originated over 8 times as many original tweets, meaning that the much larger efort he ex-
erted was ultimately not as inuential as the efort by BarackObama.
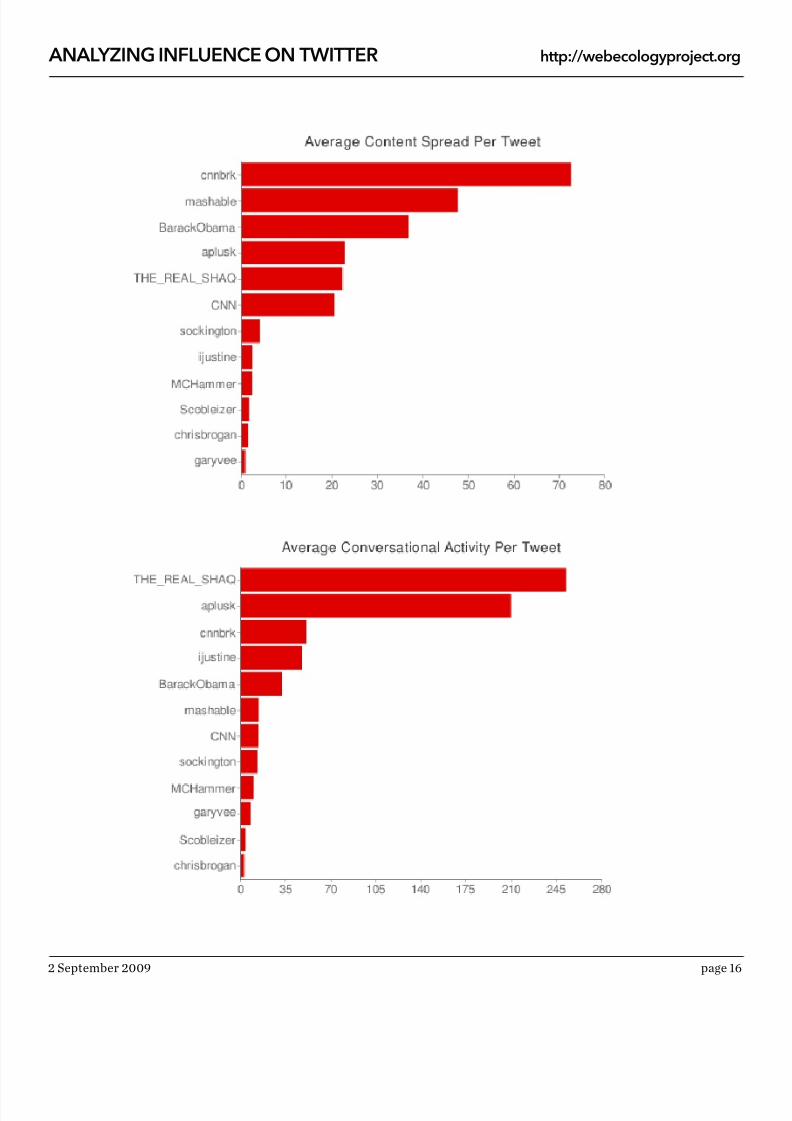
We have addressed the problematic relationship o original tweets and responses by averaging the
statistics in the graphs below. The graphs utilize the equations “conversation/tweets” (@r+@m/tweets)
and “content/tweets” (@RT+@via/tweets):
8/14/2019 The Influentials: New approaches for Analyzing Influence on Twitter
http://slidepdf.com/reader/full/the-influentials-new-approaches-for-analyzing-influence-on-twitter 16/18
ANALYZING INFLUENCE ON TWITTER
2 September 2009 page 16
http://webecologyproject.org

8/14/2019 The Influentials: New approaches for Analyzing Influence on Twitter
http://slidepdf.com/reader/full/the-influentials-new-approaches-for-analyzing-influence-on-twitter 17/18
ANALYZING INFLUENCE ON TWITTER
2 September 2009 page 17
http://webecologyproject.org
The measurement o inuence reected in these graphs most likely approaches the most accurate estima-
tion o inuence detailed in this report. To arm this statement, we must return to our Twitter-specic
denition o inuence online: the potential o an action o a user to initiate a urther action by another
user. The two graphs above account or the responses (urther actions) in relation to original tweets (ac-
tions with potential), while still theoretically accounting or the size o each user’s audience. Still, these
graphs do not account or the network o the 12 users’ ollowers, and as such remain signicantly diferent
rom the previous graphs depicting average response per 1,000 ollowers. The optimal situation o maxi-
mum inuence would account or the most ollowers possible executing the most actions. However, it is
entirely possible that one ollower published all o the responses or a given user.
What, thereore, do the discrepencies between original tweets and ollowers tell us about the data?
In the previous ollower graphs, social media analysts held most o the top ranks. Contrarily, in the tweet
graphs, they make up the last three spots in both graphs. On average, the data suggest that social media
analysts receive minimal reward or the efort they exert in maintaining a conversation with their ollow-
ers. For those users that succeed, most news outlets were more successul at having their content pushed
to other users. Celebrities, on the other hand, appear to inspire conversational responses with their ol-
lowers, yet with more success than the analysts.
These graphs suggest many statements based on various relationships o users, data, and platorm.
However, although the graphs above represent relative inuence among the 12 users, by no means do
these diagrams suggest that those ranked last are not inuential. For the most part, a general user on Twit-
ter tends to depend heavily on perceived inuence, whether it be total number o ollowers or the ratio
o ollowers to ollowees. This report, though, attempts to move beyond simple assertions o inuence to
create a better study o inuence on Twitter, supported by new approaches and quantitative data.

8/14/2019 The Influentials: New approaches for Analyzing Influence on Twitter
http://slidepdf.com/reader/full/the-influentials-new-approaches-for-analyzing-influence-on-twitter 18/18
ANALYZING INFLUENCE ON TWITTER
2 S t b 2009 18
http://webecologyproject.org
Future Approaches or Inuence AnalysisThis report strives to inuence other researchers to pursue inuence analysis based not solely on
ollowers but also on the relationship between ollowers and content, and the interaction o both in Twit-
ter’s system. Although we analyze how actions (responses to a user) represent the inuence o a user, our
study is limited by sample size, time range, and the ability to collect data. For instance, we hope in the u-
ture to develop a more complex algorithm that accounts or the combined inuence o both ollowers and
responses. We were not able to calculate user growth rate nor measure the number o responses per exact
original tweet. Also, given that this report studies inuence on Twitter, we cannot account or any external
inuence with respect to each user in our sample.
Though we admit our limitations, along with this report we are publishing a comprehensive vi-
sualization that marks each original tweet and each response (reply, retweet, and mention) along our
10-day timeline*. The graph specically shows density as a actor o inuence over time or the 2,143
original tweets and 90,130 responses related to our dozen users. While our graph does not provides la-
bels or tweet, time, etc., we encourage individual exploration o the data presented in the visualization.
The density o data varies considerably per user and per tweet. While we cannot assign each reply, retweet,
and mention to a specic original tweet, we can at least determine certain patterns o density per any giv-
en tweet. The two excerpts above reect the diference in density o responses that a certain tweet might
generate. By tracking the density o responses over time, we hope to inspire urther research into models
o inuence and web ecology as a whole.
* http://www.webecologyproject.org/wp-content/uploads/2009/09/bigdata-large-nal.jpg