Embed Size (px)
Citation preview

THE IMPACTS OF SOCIAL INFRASTRUCTURE INVESTMENT
A report for Local Trust June 2021

Sarah Snelson
James Collis
[email protected] [email protected]
Frontier Economics Ltd is a member of the Frontier Economics network, which consists of two separate companies based in Europe (Frontier
Economics Ltd) and Australia (Frontier Economics Pty Ltd). Both companies are independently owned, and legal commitments entered into by
one company do not impose any obligations on the other company in the network. All views expressed in this document are the views of Frontier
Economics Ltd.

frontier economics
THE IMPACTS OF SOCIAL INFRASTRUCTURE INVESTMENT
CONTENTS
Executive Summary 4
1 Introduction 8 1.1 The context of our research 8 1.2 Our approach 8
2 Why social infrastructure is important 11 2.1 Defining social infrastructure for this research 11 2.2 A framework for the outcomes from social infrastructure investment 13
3 The size and nature of gaps in social infrastructure investment in left-behind areas 21 3.1 There are differences in social infrastructure across left-behind areas 21 3.2 Differences in social infrastructure are associated with different economic
and social outcomes 25 3.3 There is a significant gap to be closed in left-behind areas 26
4 The returns on investment in social infrastructure in left-behind areas 27 4.1 Selection of outcomes for the return on investment analysis 28 4.2 The outcomes of the return on investment analysis 30 4.3 Non-monetised outcomes 31
5 Areas for further research 34 5.1 There is already a strong evidence base for investment 34 5.2 Opportunity to further develop the evidence base through continued
monitoring and evaluation 34
ANNEX A Framework 36
ANNEX B Rapid evidence assessment summary findings 37
ANNEX C References 44

frontier economics 4
THE IMPACTS OF SOCIAL INFRASTRUCTURE INVESTMENT
EXECUTIVE SUMMARY
Social infrastructure can play an important role in supporting the levelling-up
agenda in local areas. It creates institutions and physical spaces that foster
personal relationships, civic engagement and social networks, leading to more
cohesive and healthier societies.1 2 3
The political case for investing in social infrastructure to support economic, social
and fiscal outcomes in left-behind areas has been well articulated, and the Covid-
19 pandemic has only served to emphasise the role that social infrastructure
can play in supporting local communities.
Up until now, the economic case for such investment has not been as well
established. Recent analysis has identified 225 left-behind areas defined as having
both a deficit of social infrastructure and high levels of deprivation.4 Analysis of the
outcomes in these areas suggests a significant scale of opportunity for well-
targeted interventions to improve social infrastructure. Compared to the national
average, left-behind areas have over 13% more working-age people without
qualifications and 15% fewer with NVQ4 equivalent qualifications or above. They
also have a higher proportion of the economically inactive population who want a
job; the proportion is highest in the most left-behind areas.5 However, we also know
that people in left-behind areas are more likely to have long-term health issues as
well as having fewer skills than the national average. Life expectancy is lower by
around four years for men and three years for women,6 and almost one in four
people (24%) in these areas has a limiting long-term illness or chronic disability,
6.5% higher than the national average.7 There are likely to be a range of barriers
to overcome to help get those who want a job into employment.
Frontier Economics was commissioned by Local Trust to bring together existing
evidence to provide an independent assessment of the economic basis for
investment in social infrastructure and to quantify the potential scale of the
economic, social and fiscal returns from these investments.
Investment in social infrastructure has historically taken many different forms,
which has led to a fragmented and patchy evidence base. Existing evidence is of
variable quality, in part, because the nature of social infrastructure investment can
make it intrinsically hard to evaluate. This study cast the net wide, reviewing over
100 papers to identify a robust subset of available evidence that enables
estimates of the potential returns from the type of community-led social
infrastructure investment envisaged for the Community Wealth Fund to be
generated.
1 All-Party-Parliamentary Groups (2020), ‘Communities of trust: why we must invest in the social infrastructure of ‘left behind’ neighbourhoods’
2 Bennet Institute for Public Policy (2020), ‘Measuring wealth, delivering prosperity’ 3 What Works Wellbeing (2017), ‘Scoping review: social relations’ 4 https://localtrust.org.uk/insights/research/left-behind-understanding-communities-on-the-edge/ 5 OCSI (2020), ‘Left Behind Areas 2020 – Interim Set: Summary Dataset’ using 2011 Census data 6 OCSI (2020), ‘Left Behind Areas 2020 – Interim Set: Summary Dataset’ using ONS data 7 OCSI (2020), ‘Left Behind Areas 2020 – Interim Set: Summary Dataset’ using 2011 Census data

frontier economics 5
THE IMPACTS OF SOCIAL INFRASTRUCTURE INVESTMENT
COMMUNITY WEALTH FUND
Proposals for a Community Wealth Fund have been put forward by the
Community Wealth Fund Alliance, of which Local Trust is a founding member, to
help address the deficit of social infrastructure in left-behind areas, through
sustained community-led social infrastructure investments. The Community
Wealth Fund approach involves committing funds directly to left-behind
communities to use for social infrastructure investments of their own choosing. For
the purposes of this paper we assume a financial allocation of £1 million over a
ten-year period, which reflects the sums provided to communities under the Big
Local programme administered by Local Trust on behalf of The National Lottery
Community Fund.
We set a high bar for inclusion of evidence in our estimates of the returns to
social infrastructure investment. We selected estimates of impacts where a
plausible causal link can be established in theory and where the studies use
appropriate methods to isolate causal impacts, wherever possible. For our
quantitative analysis, wherever possible we selected evidence that was consistent
with a level three or above on the Maryland Scientific Methods Scale, consistent
with the What Works Centre for Growth.8 However, we also judged meta-analyses
to be sufficiently robust for inclusion, and any other evidence included was deemed
to be either consistent with our conservative assumptions or we applied additional
conservative assumptions when using it in our calculations. In general, we applied
conservative assumptions to translate that evidence into estimates of returns in
line with government guidance. Our approach was tested throughout with an
Advisory Group of leading sector experts.
Using only robust evidence and with conservative assumptions, we estimate that
a £1 million investment in community-led social infrastructure in a left-behind area
could generate approximately £1.2 million of fiscal benefits and £2 million of social
and economic benefits over a ten-year period.
8 https://whatworksgrowth.org/public/files/Scoring-Guide.pdf

frontier economics 6
THE IMPACTS OF SOCIAL INFRASTRUCTURE INVESTMENT
A £1 MILLION INVESTMENT IN SOCIAL INFRASTRUCTURE IN A LEFT-BEHIND AREA WOULD BE EXPECTED TO DELIVER BENEFITS OVER TEN YEARS OF:
There are also important non-monetised benefits that further enhance the
case for investment. Our analysis should also be seen in the context of the wider
qualitative evidence on the full breadth of outcomes from community-led social
infrastructure investment. Important benefits that are not or only partially included
in the monetised estimates due to limitations in the quantitative evidence include
improved social cohesion, civic engagement, reducing loneliness and
environmental benefits.
Typical of almost all areas of government investment, the evidence base is far from
perfect and would benefit from further studies that seek to get closer to causation
if possible, explore more deeply what works in different circumstances and
understand the role of complementary investments. But the conservative returns
we estimate cover only a subset of the channels to impact and, importantly,
exclude some of the likely significant impacts that flow directly from improved social
capital. Despite these limitations, these estimates provide a robust basis for
modelling a good return on investment. Because of our robust approach to what
evidence we included, these figures should be seen as a minimum possible return:
in reality, the return could be higher.
£1.2 million fiscal benefits:
£2 million economic and social benefits:

frontier economics 7
THE IMPACTS OF SOCIAL INFRASTRUCTURE INVESTMENT
The Community Wealth Fund could present a perfect opportunity to further enrich
the evidence base in these areas through more systematic monitoring and
evaluation of social infrastructure investments both for existing investment plans
and integrated within the designs for a Community Wealth Fund. This could
perhaps be in the context of a What Works Centre-style approach, specifically
focused on the value and effectiveness of community-led interventions at a
neighbourhood level.

frontier economics 8
THE IMPACTS OF SOCIAL INFRASTRUCTURE INVESTMENT
1 INTRODUCTION
1.1 The context of our research
The levelling-up of economic and social opportunities across the UK has become
a key policy agenda with strong political support and was a central theme of the
recent Queen’s Speech for the upcoming parliamentary session.9
Investment in social infrastructure can play an important role in supporting
the levelling-up agenda in local areas. Recent analysis has identified 225 left-
behind areas defined as having both a deficit of social infrastructure and high levels
of deprivation.10 The significant disparities in levels of social infrastructure among
local areas can act as a constraint on opportunities.11
Proposals for a Community Wealth Fund have been
put forward by the Community Wealth Fund Alliance, of
which Local Trust is a founding member, to help
address the deficit of social infrastructure in left-behind
areas through sustained community-led social
infrastructure investments. The Community Wealth
Fund approach involves committing funds directly to
left-behind communities to use for social infrastructure
investments of their own choosing. For the purposes of
this paper, we assume a financial allocation of
£1 million over a ten-year period, which reflects the
sums provided to communities under the Big Local
programme administered by Local Trust on behalf of
The National Lottery Community Fund.
Frontier Economics was commissioned by Local Trust to bring together existing
evidence to provide an independent assessment of the economic basis for
investment in social infrastructure and to quantify the potential scale of the
economic, social and fiscal returns from these investments.
1.2 Our approach
We took a systematic approach to our research, which involved the following:
A review of the existing evidence base, including over 100 research papers.
We scrutinised this evidence to draw on only robust findings from
evaluations and established research methods. We provide more detail on
how this review was done in ANNEX B and the list of papers sifted through is
in ANNEX C;
9 https://www.gov.uk/government/speeches/queens-speech-2021 10 https://ocsi.uk/2019/10/21/community-needs-index-measuring-social-and-cultural-factors/ 11 See, for example, Social Investment Business (2020), 'Strong social infrastructure can level up left-behind
places: here's how'
Social infrastructure
Source: Frontier Economics

frontier economics 9
THE IMPACTS OF SOCIAL INFRASTRUCTURE INVESTMENT
Developing a robust economic framework setting out how social
infrastructure can contribute to economic, social and fiscal outcomes, either
directly or through supporting the broader drivers of local outcomes;
Analysing the differences in conditions for left-behind areas with lower
levels of social infrastructure and estimating the scale of the opportunity in
terms of economic and social outcomes from closing these gaps;
Conservatively quantifying only those outcomes where the evidence is
sufficient to make robust estimates of the returns from potential investment in
social infrastructure in left-behind areas in line with best-practice government
guidance; and12
Identifying the opportunities to further the evidence base through
continued monitoring and evaluation.
Our approach was tested throughout with an Advisory Group of leading sector
experts.13 The rest of this report summarises the findings from our research.
12 https://www.gov.uk/government/publications/the-green-book-appraisal-and-evaluation-in-central-governent 13 We would like to thank the Advisory Group members for their invaluable guidance and advice. The Advisory
Group provided advice throughout the development of this research, but their involvement does not necessarily imply endorsement. The members of the Advisory Group were: Matt Leach (Chair), Local Trust; Michael Kenny, Institute of Public Policy; Zoe Billingham, Progressive Policy Institute; Stephen Aldridge, Ministry of Housing, Communities & Local Government; Stefan Noble, OCSI; Tony Chapman, University of Durham; Rob Macmillan, Sheffield Hallam University; Ingrid Abreu Scherer, What Works Wellbeing; Julie Froud, University of Manchester; Julian Legrand, London School of Economics; Richard Harries, Young Foundation; and Meg Kaufman, What Works Centre for Local Economic Growth
frontier economics 10
THE IMPACTS OF SOCIAL INFRASTRUCTURE INVESTMENT
THE ECONOMIC CASE
Our analysis focuses on a quantitative appraisal of the benefits from investment
in community-led social infrastructure. This represents a central aspect of the
‘economic case’ for investment, consistent with HM Treasury’s ‘Five Case
Model’ for public investment business cases. In line with this model, our
approach identifies ‘benefits that are quantifiable and can be expressed in
monetary equivalent terms’14 and we take an approach that is ‘prudent,
proportionate, and appropriate’:15
Prudent: we take a conservative approach to quantify only those outcomes for
which there is robust evidence. These are identified in two respects: first,
outcomes that have a clear causal link from social infrastructure investment in
theory and, second, outcomes that have robust quantitative evidence from past
evaluations or established research methods.
Proportionate: our approach is proportionate to the proposed investment and
opportunities, bringing together a coherent framework and analysis that utilises
the best evidence available from the existing literature.
Appropriate: we use evidence appropriate to the types of social infrastructure
that community-led investments are likely to undertake and tailored wherever
possible to the conditions and circumstances of left-behind areas.
It is important to note that the quantified benefits with this approach provide
only a partial analysis of the outcomes of social infrastructure investments.
As is typical for almost all such cases, there are a number of important social
outcomes that cannot be robustly quantified due to limitations in the evidence
base and inherent difficulties with measurement. Therefore, our analysis also
needs to be seen in the context of the wider qualitative evidence on the
full breadth of outcomes from community-led social infrastructure
investment. Because of our robust approach to the evidence included in our
benefit estimates, these figures should be seen as a minimum possible return:
in reality, the return could be higher.
14 HM Treasury (2018), ‘Guide to developing the programme business case – better business cases: for better outcomes’, p44
15 HM Treasury (2018), p41

frontier economics 11
THE IMPACTS OF SOCIAL INFRASTRUCTURE INVESTMENT
2 WHY SOCIAL INFRASTRUCTURE IS IMPORTANT
We developed a framework in which we identify four types of outcomes from social
infrastructure investment and three channels through which social infrastructure
contributes to these outcomes. We set out our framework in this section and
provide a selection of illustrative examples of the channels through which social
infrastructure investment leads to outcomes throughout. The details of the full set
of papers we reviewed are contained in ANNEX B and ANNEX C.
Section 4 has our monetised return on investments from an illustrative £1 million
investment in areas with similar characteristics to left-behind areas.
2.1 Defining social infrastructure for this research
Social infrastructure can involve a diverse set of investments that serve to bring
groups in the community together.16 It supports shared civic life through a
framework of institutions and physical spaces that foster personal relationships,
civic engagement and social networks, leading to more cohesive and healthier
societies.17 18 19
For the purposes of this research, we define social infrastructure as the types of
investments a local community could feasibly support across the following three
dimensions:20
Places and spaces: the physical places for people to meet within an area such
as community hubs, community-owned assets, community shops, social
centres, sport clubs, arts centres, heritage spaces and green spaces;
Community organisations: the local community organisations providing
services and bringing groups together for specific purposes, such as voluntary
groups, charitable groups, neighbourhood fora, local business groups and
social enterprises; and
Connectedness: through physical and digital connections, such as online
communication platforms and digital skills, community transport within and
between local communities, community transport links to places of work and
local walking/cycling infrastructure.
Community-led social infrastructure is broad in scope. It addresses the needs of
the wider community rather than a single cause or group and is characterised by
community ownership and control.21 There are a wide range of categories that
community-led investments focus on. As an illustration of the range of different
16 See, for example, Muringani, Fitjar and Rodriguez-Pose (2021), ‘Social capital and economic growth in the regions of Europe’
17 All-Party-Parliamentary Groups (2020), ‘Communities of trust: Why we must invest in the social infrastructure of ‘left behind’ neighbourhoods’
18 Bennet Institute for Public Policy (2020), ‘Measuring wealth, delivering prosperity’ 19 What Works Wellbeing (2017), ‘Scoping review: social relations’ 20 This definition is informed by our evidence review and the typical types of investments of past community-
led social infrastructure funding initiatives such as Big Local. 21 Wilson, McCabe, Macmillan, Ellis Paine (2020) ‘Rapid research COVID-19 – Community responses to
COVID-19: the role and contribution of community-led infrastructure’
frontier economics 12
THE IMPACTS OF SOCIAL INFRASTRUCTURE INVESTMENT
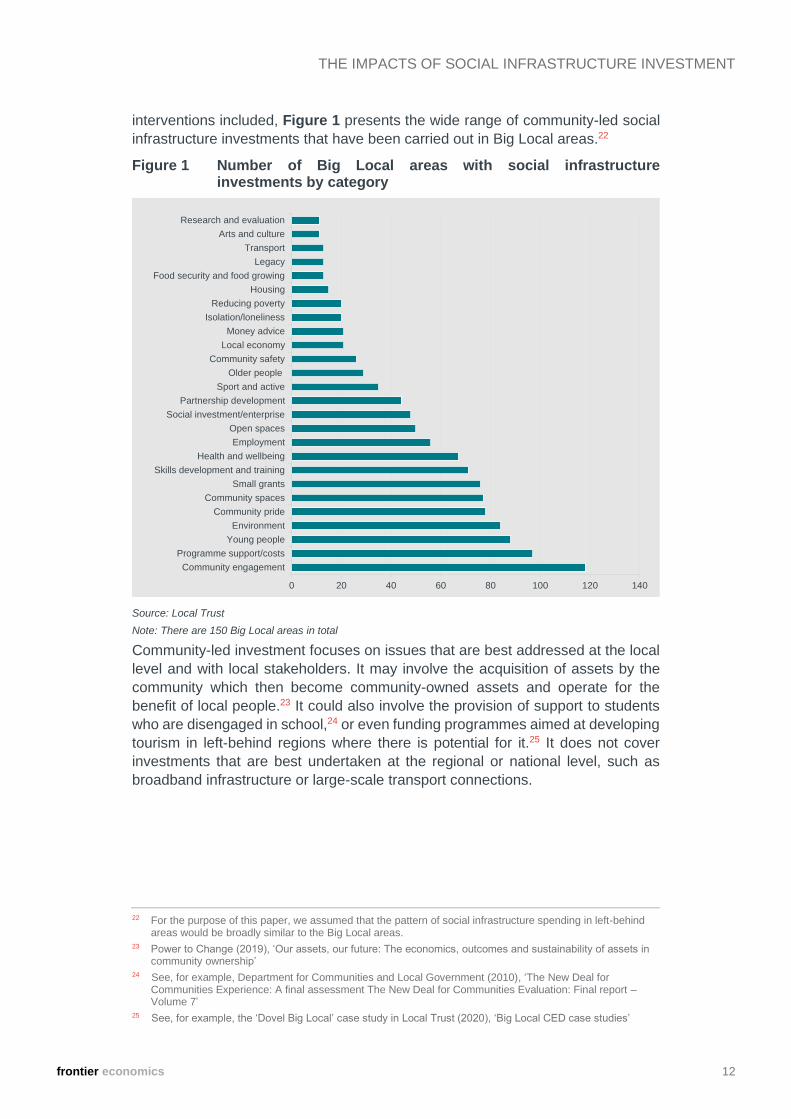
interventions included, Figure 1 presents the wide range of community-led social
infrastructure investments that have been carried out in Big Local areas.22
Figure 1 Number of Big Local areas with social infrastructure investments by category
Source: Local Trust
Note: There are 150 Big Local areas in total
Community-led investment focuses on issues that are best addressed at the local
level and with local stakeholders. It may involve the acquisition of assets by the
community which then become community-owned assets and operate for the
benefit of local people.23 It could also involve the provision of support to students
who are disengaged in school,24 or even funding programmes aimed at developing
tourism in left-behind regions where there is potential for it.25 It does not cover
investments that are best undertaken at the regional or national level, such as
broadband infrastructure or large-scale transport connections.
22 For the purpose of this paper, we assumed that the pattern of social infrastructure spending in left-behind areas would be broadly similar to the Big Local areas.
23 Power to Change (2019), ‘Our assets, our future: The economics, outcomes and sustainability of assets in community ownership’
24 See, for example, Department for Communities and Local Government (2010), ‘The New Deal for Communities Experience: A final assessment The New Deal for Communities Evaluation: Final report – Volume 7’
25 See, for example, the ‘Dovel Big Local’ case study in Local Trust (2020), ‘Big Local CED case studies’
0 20 40 60 80 100 120 140
Community engagement
Programme support/costs
Young people
Environment
Community pride
Community spaces
Small grants
Skills development and training
Health and wellbeing
Employment
Open spaces
Social investment/enterprise
Partnership development
Sport and active
Older people
Community safety
Local economy
Money advice
Isolation/loneliness
Reducing poverty
Housing
Food security and food growing
Legacy
Transport
Arts and culture
Research and evaluation

frontier economics 13
THE IMPACTS OF SOCIAL INFRASTRUCTURE INVESTMENT
2.2 A framework for the outcomes from social infrastructure investment
To quantify the scale of benefits from social infrastructure investments, it is first
necessary to understand how social infrastructure contributes to local outcomes.
Our framework provides an overarching way to understand the likely outcomes of
social infrastructure investments. In practice, there will be different channels within
this overarching framework for individual investments. This reflects the community-
led approach of the proposed Community Wealth Fund to empower local
communities to engage with the specific needs of their local area.26
A summary of our framework for understanding these channels is shown below.
This was developed through our evidence review and tested and refined with the
Advisory Group for this research. These channels of impact are all supported by
high quality evidence of the transmission mechanisms to the outcomes, having
been developed through our evidence review and refined with the Advisory Group
for this research. A more detailed framework is provided in ANNEX A.
Figure 2 A framework for social infrastructure investment outcomes
Source: Frontier Economics
There are three key channels through which social infrastructure contributes to
local outcomes:
26 CCHPR (2019) Cambridge Centre for Housing and Planning Research, Cambridge University, ‘Achieving local economic change: What Works?’ G Burgess, K Karampour, K Muir and P Tyler
Effects via other capital
Outcomes
Social outcomes
Community-led
social
infrastructure
investments
Drivers of local
economic
performance
Infrastructure,
innovation,
business
environment,
skills, quality
of place,
sustainability
health,
wellbeing,
crime, civic
engagementPlaces and
spaces
Social capital
e.g. social centres,
social bridging,
social bonding
Physical capital
e.g. community hubs
and assets
Human capital
e.g. volunteering,
training, aspirations
Natural capital
e.g. green spaces
Economic outcomes
productivity,
employment,
wages
Fiscal outcomes
taxes,
benefits, costs
of local
services
Environmental
outcomes
emissions,
biodiversity
Community
organisations
Direct effects via
social capital
Effects via local
economic
performance
Connectedness
Other complementary investments and policies

frontier economics 14
THE IMPACTS OF SOCIAL INFRASTRUCTURE INVESTMENT
Directly enhancing social capital: investments that support social centres or
deepen and expand connections across communities can contribute directly to
social outcomes;
Through supporting broader types of capital: social infrastructure
investments can enhance broader physical capital, human capital and natural
capital; and
Through supporting the drivers of local economic performance: social
infrastructure investments can also support the broader drivers of local growth.
We discuss these outcome channels in turn below.27 Each channel is supported
by a breadth of evidence identified in our evidence review. We provide selected
illustrations below with details of further evidence included in ANNEX B and the full
list in ANNEX C.
For the return on investment analysis in Section 4, we were not able to quantify all
of these channels and outcomes. Our monetisation of the costs and benefits
focused on investments in human and physical capital, with cultural spending
affecting social capital, and the effects on outcomes through local economic
performance drivers. This is set out in the figure below, but it does not imply that
all parts of a channel and outcome are monetised. For instance, we may not be
capturing all the investments in human capital which affect employment.
Figure 3 Channels and outcomes monetised in our framework
Source: Frontier Economics
27 The outcome channels form the basis of the ‘theory of change’ for social infrastructure investment; that is, the logical chain of cause and effect from the investment (see HM Treasury (2020), ‘The Green Book: Central Government Guidance on Appraisal and Evaluation’). We focus on key outcome channels to provide an overview of the expected change mechanisms and the underpinning evidence for social infrastructure, while recognising that the detailed theory of change would be specific to individual community-led investments.
Effects via other capital
Outcomes
Social outcomes
Community-led
social
infrastructure
investments
Drivers of local
economic
performance
Infrastructure,
innovation,
business
environment,
skills, quality
of place,
sustainability
health,
wellbeing,
crimePlaces and
spaces
Social capital
e.g. social centres,
social bridging,
social bonding
Physical capital
e.g. community hubs
and assets
Human capital
e.g. volunteering,
training, aspirations
Natural capital
e.g. green spaces
Economic outcomes
increased
GVA,
employment
Fiscal outcomestaxes,
benefits,
costs of
healthcare
and crime
Environmental
outcomes
emissions,
biodiversity
Community
organisations
Direct effects via
social capital
Effects via local
economic
performance
Connectedness
Other complementary investments and policies

frontier economics 15
THE IMPACTS OF SOCIAL INFRASTRUCTURE INVESTMENT
Social capital
Social capital, as articulated by the OECD,28 relates to the ‘links, shared values
and understandings in society that enable individuals and groups to trust each
other and so work together’. More specifically, bonding social capital relates to
closed networks that link groups of similar people, while bridging social capital
refers to open networks that link groups of different people.29
Investing in social infrastructure is a way of directly enhancing these two types of
social capital. By definition, social infrastructure investments are those that help to
create a collaborative environment by bringing together different members of
society. For example, in the UK there are over 6,000 community-owned assets,
such as community hubs, halls or centres, which support an estimated 151,000 net
additional volunteer hours per week, enhancing the wellbeing of both volunteers
and the communities they support.30
The link between social infrastructure investments and social capital is well
established in the literature. For example, following a review of 51 studies, What
Works Wellbeing found evidence that both community hubs and green and blue
space interventions enhance social cohesion, social interaction and bonding and
bridging social capital.31 It also found that these spaces may be especially valuable
for marginalised groups of people.
The Heritage Fund32 also found a wide range of evidence supporting the argument
that parks and green spaces can create opportunities for social interaction,
inclusion and cohesion – factors which are highly linked with social capital. For
example, social interactions in urban green spaces have been found to be helpful
for young people to make friends across different cultures,33 providing
opportunities for people from different ethnic groups to mingle34 and thus promoting
bridging social capital.
Some types of social capital are positively associated with economic growth. For
example, a recent study empirically established that bridging social capital is
associated with higher levels of regional economic growth. It also found that
bridging social capital can, to some extent, replace formal education in driving local
economic growth.35
Another study found that social trust, which is deeply related to social capital, is
positively related to social enterprises’ employment growth, revenue growth and
social impact development. It concluded that social enterprises do better in more
prosperous areas, because they have more prosperous markets and higher levels
28 https://www.oecd.org/insights/37966934.pdf 29 Putnam RD (2000), Bowling alone: America’s declining social capital. New York, NY: Springer. 30 See Power to Change (2019), ‘Our assets, our future: the economics, outcomes and sustainability of assets
in community ownership’ 31 What Works Wellbeing (2018), ‘Places, spaces, people and wellbeing: full review’ 32 Heritage Fund (2019), ‘Space to thrive – A rapid evidence review of the benefits of parks and green spaces
for people and communities’ 33 Seeland et al. (2009), ‘Making friends in Zurich’s urban forests and parks: The role of public green space for
social inclusion of youths from different cultures‘ 34 Peters et al. (2010), ‘Social interactions in urban parks: stimulating social cohesion’ 35 Muringani, Fitjar and Rodriguez-Pose (2021), ‘Social capital and economic growth in the regions of Europe’

frontier economics 16
THE IMPACTS OF SOCIAL INFRASTRUCTURE INVESTMENT
of social capital. In these areas people have stronger social networks and less
fears for neighbourhood safety.36
SOCIAL CAPITAL LINKS WITH GROWTH: AN EMPIRICAL STUDY
Research conducted by Muringani, Fitjar and Rodriguez-Pose (2020) found
bridging social capital to be associated with higher levels of regional economic
growth.
The authors addressed how bonding and bridging social capital affect regional
economic growth (measured by gross domestic product per capita) by using
data from 190 regions in 21 EU countries, covering eight waves of the
European Social Survey between 2002 and 2016.
Using a robust econometric approach, the authors found that bridging social
capital has a positive association with regional economic growth. They
concluded that policy-makers should focus mainly on promoting bridging social
capital (as opposed to bonding social capital), bringing together diverse groups,
as a way to achieve higher levels of development. The evidence on bonding
social capital is more mixed.
This can be a particularly effective approach in left-behind areas where
there are lower levels of formal education, as bridging social capital is found to
be more effective in promoting growth in low-skilled regions.
Physical, human and natural capital
Social infrastructure investment can influence the stock of physical, human and
natural capital. It can therefore complement conventional policy interventions that
often seek to support these broader types of capital.
For example, community training initiatives can help people to develop new skills
and look for employment opportunities (human capital).37 Similarly, investing in
community hubs is a way of increasing the physical capital in a local area, and
green space investments increase the stock of natural capital.
These investments in turn support social, economic, fiscal and environmental
outcomes through a variety of drivers (see Figure 2 ). One example is the positive
impact that green spaces can have on physical and mental health, which is widely
documented in the literature. The Heritage Fund reviewed 495 empirical studies
which studied this relationship and found conclusive evidence that access to parks
and green spaces has a positive influence on physical health and mental
wellbeing.38 It found various channels through which green spaces can have an
impact, namely:
Health, mortality and morbidity. For example, various studies show that
having exposure to the natural environment during pregnancy is associated
with increased birthweight, which is associated with better health
36 Power to Change (2017), ‘Neighbourhood economic models’ 37 For example, Centre for Regional Economic and Social Research, Sheffield Hallam University (2010),
‘Evaluation of the South Yorkshire Social Infrastructure Programme’ 38 Heritage Fund (2019), ‘Space to thrive – A rapid evidence review of the benefits of parks and green spaces
for people and communities’
frontier economics 17
THE IMPACTS OF SOCIAL INFRASTRUCTURE INVESTMENT
outcomes.39 40 41 Other studies found lower levels of mortality in
neighbourhoods with more green space, with the difference being most
significant in respect of respiratory42 and cardiovascular diseases.43
Physical activity and exercise. Several studies found the presence of nearby
green spaces to be associated with increased physical activity.44 45 46 Obesity
levels among children were also found to be lower in areas with more nearby
green space.47
Wellbeing and stress relief. For example, a cross-sectional study of four
European cities found consistent links between time spent purposefully in
green spaces and better levels of wellbeing and vitality.48 Another study found
that proximity to green spaces was associated with reduced anxiety and mood
disorders.49
Life satisfaction. Studies have found that living or moving to areas with more
green spaces is linked with sustained improvements in mental health.50 51 One
study in Australia attempted to quantify this effect and found the impact of green
space on life satisfaction to be equivalent to an implicit willingness-to-pay of
1,172 USD per household, for a 1 per cent increase in public green spaces.52
39 Dadvand et al. (2012), ‘Surrounding greenness and pregnancy outcomes in four Spanish birth cohorts’ 40 Markevych et al. (2014), ‘Surrounding greenness and birth weight: Results from the GINIplus and LISAplus
birth cohorts in Munich’ 41 James et al. (2015), ‘A review of the health benefits of greenness’ 42 Villeneuve et al. (2012), ‘A cohort study relating urban green space with mortality in Ontario, Canada’ 43 Astell-Burt et al. (2014), ‘Is neighborhood green space associated with a lower risk of type 2 diabetes?
Evidence from 267,072 Australians’ 44 Coombes et al. (2010), ‘The relationship of physical activity and overweight to objectively measured green
space accessibility and use’ 45 Toftager et al. (2011), ‘Distance to green space and physical activity: A Danish national representative
survey’ 46 James et al. (2015), ‘A review of the health benefits of greenness’ 47 Dadvand et al. (2014), ‘Risks and benefits of green spaces for children: A cross-sectional study of
associations with sedentary behavior, obesity, asthma, and allergy’ 48 Berg et al. (2016), ‘Visiting green space is associated with mental health and vitality: A cross-sectional study
in four European cities’ 49 Nutsford, Pearson and Kingham (2013), ‘An ecological study investigating the association between access
to urban green space and mental health’ 50 White et al. (2013), ‘Would you be happier living in a greener urban area? A fixed-effects analysis of panel
data.’ 51 Alcock et al. (2014), ‘Longitudinal effects on mental health of moving to greener and less green urban
areas’ 52 Ambrey and Fleming (2014), ‘Public greenspace and life satisfaction in urban Australia’

frontier economics 18
THE IMPACTS OF SOCIAL INFRASTRUCTURE INVESTMENT
CAPITAL INVESTMENT AS A DRIVER OF OUTCOMES: THE NEW DEAL FOR
COMMUNITIES
The New Deal for Communities (NDC) Programme was a place-based
regeneration programme led by the UK government to support some of
England’s most deprived areas. A total of £1.7 billion (constant 2007-08 prices)
was invested over the period from 1999 to 2008 on a range of community
initiatives which had a direct impact on the local stock of physical, natural and
human capital.
Physical and natural capital: The largest share of expenditure, 32% of the
total budget, was devoted to improving the housing and physical environment
of the areas; and
Human capital: The remaining share of the budget was devoted to initiatives
with a strong link to human capital: enhancing community capacity (18%),
supporting education interventions (17%), tackling worklessness (12%),
improving the health of locals (11%) and reducing crime rates (10%).
The programme evaluation found considerable positive change in the NDC
areas for the place-related and people-related outcomes considered, narrowing
the gaps with the rest of the country. The results were markedly positive in
terms of improvements to the mental wellbeing of locals: a differences-in-
differences analysis showed the SF36 mental health index of NDC areas to
have increased by 7 percentage points in relation to similarly deprived
comparator areas from 2002 to 2008.
The same analysis found that the NDC programme increased the probability
of people taking part in education or training in the past year by 4
percentage points in relation to the comparison group and in the same time
period.
Complementary investments and drivers of local economic performance
In addition to directly enhancing the different types of capital described above,
social infrastructure can influence other important drivers of local economic
performance and complement other public investments and policy levers.
For example:
Social infrastructure investment by the public sector can enhance the local
business environment, for example by making community-owned assets
available as office or business spaces with business-friendly conditions.53 This
can in turn attract private sector investment where it ordinarily would not due to
low returns, ultimately driving employment and inducing multiplier effects in the
economy. The lack of private sector investment can create a ‘spiral of decline’
where businesses leave, vacancies rise and unemployment rises, combining
to make the area even less attractive to businesses investing and moving into
the area.54
53 See, for example, the ‘Dovel Big Local’ case study in Local Trust (2020), ‘Big Local CED case studies’ 54 Social Investment Business (2020), 'Strong social infrastructure can level up left-behind places: here's how'

frontier economics 19
THE IMPACTS OF SOCIAL INFRASTRUCTURE INVESTMENT
More generally, enhancing connections across communities can facilitate the
cross-fertilisation of ideas55 that enhance innovation and local business
opportunities. This in turn can lead to new employment opportunities,56
resulting in better economic and wellbeing outcomes.
The broader drivers of local economic performance also influence the scale of
opportunity from social infrastructure investment. For example, investments in
community skills and employment training initiatives are likely to be more effective
at resulting in improved employment opportunities in areas that are well connected
to large centres of employment.
SKILLS AS A DRIVER OF LOCAL GROWTH: THE SYSIP CASE STUDY
The South Yorkshire Social Infrastructure Programme (SYSIP) was a local
regeneration programme which aimed to increase the sustainability of the
voluntary and community sector in South Yorkshire by providing support to
infrastructure organisations. A total of £21.4 million of funding was granted
between 2006 and 2009.
An important part of the programme consisted of skills development. Over the
programme’s duration, a total of 6,961 persons were assisted in their skills
development. This was mainly achieved through the group Academy for
Community Leadership and community learning initiatives delivered by a local
project (Sheffield Community Action Plans project).
Translating this figure into job creation and salary increases, the programme’s
evaluation report estimated a gross value added (GVA) increase resulting
from the development of skills of between £8.3 million and £13.9 million.
It is worth noting that skills development was only one of several components of
the programme, which was estimated to deliver total economic benefits of
between £21.4 million and £33.7 million of GVA.
Outcomes
Our framework identifies four types of outcomes that can result from social
infrastructure investments:
Social outcomes – these refer to wider societal benefits and include the
physical and mental health of community residents, their general wellbeing,
civic engagement and levels of crime within the community;
Economic outcomes – these refer to employment and unemployment rates, the
average income and income distribution in a community, and productivity
levels;
Fiscal outcomes – these refer to the effects on government budgets and
spending and include the level of tax collected from a community, spending on
benefits and costs of providing local services; and
55 See, for example, https://ourworldindata.org/social-networks-innovation-and-productivity 56 For example, Power to Change (2017), ‘Neighbourhood economic models’
frontier economics 20
THE IMPACTS OF SOCIAL INFRASTRUCTURE INVESTMENT
Environmental outcomes – these refer to environmental effects, such as a
community’s biodiversity and its level of greenhouse gas emissions.
The outcomes are not standalone. There are links between the different outcomes
which can reinforce each other. A reduction in unemployment is, for instance, an
economic outcome. However, a reduction in unemployment reduces the number
of recipients of unemployment benefits, and thus also affects fiscal outcomes.
Moreover, being in employment is associated with better health and wellbeing, in
turn affecting societal outcomes. Improved health within a community reduces the
costs of local health services, which reinforces the effect on fiscal outcomes.57
The effectiveness of investments in social infrastructure is, to some extent,
determined by local conditions. For instance, an important factor is the existing
level of human capital in a community. The evidence suggests that human capital
and bridging social capital act as substitutes for economic growth in a community.
On average, communities with lower levels of human capital experience higher
levels of economic growth following an increase in bridging social capital. This
suggests that social infrastructure investments may be particularly effective in
achieving economic growth when undertaken in low-skilled communities.58
Community-led investment operates at the community level and is led by the
community. Priorities for the community are agreed by the people who live within
the community and who organise and carry out the projects to achieve these
priorities themselves. The emphasis of community-led investment on local
residents taking and carrying out key decisions makes it an effective way of
achieving the most relevant outcomes for the community.59 60
Evidence on the scale of these outcomes is outlined further in Section 4.
57 See, for example, Department for Digital, Culture, Media & Sport (2018), ‘Evaluation of the economic impact and public value of the Superfast Broadband Programme’
58 Muringani, Fitjar, and Rodriguez-Pose (2021), ‘Social capital and economic growth in the regions of Europe’ 59 Local Trust (2020), ‘Rapid research COVID-19 – Community responses to COVID-19: Towards community-
led infrastructure’ 60 Local Trust (2020), ‘Rapid research COVID-19 – Community responses to COVID-19: The role and
contribution of community-led infrastructure

frontier economics 21
THE IMPACTS OF SOCIAL INFRASTRUCTURE INVESTMENT
3 THE SIZE AND NATURE OF GAPS IN SOCIAL INFRASTRUCTURE INVESTMENT IN LEFT-BEHIND AREAS
Building on analysis by Local Trust and Oxford Consultants for Social Improvement
(OCSI),61 we find that the gap in social infrastructure between left-behind areas
and the national average is significant, and this is important because our
framework identifies links from this to differences in social and economic
outcomes. Closing the gap in social infrastructure between left-behind areas and
the national average has the potential to lead to improvements in outcomes, such
as increasing skills and employment opportunities. This section sets out the
conditions faced by left-behind areas and the nature and size of the gaps that
investment in social infrastructure could seek to close.
We quantify the potential returns on investment in social infrastructure in areas with
similar characteristics to left-behind areas in Section 4. These investments could
go towards closing the gaps identified in this section.
3.1 There are differences in social infrastructure across left-behind areas
There are significant differences in levels of social infrastructure among local
areas. Recent research undertaken by OCSI for Local Trust highlighted these
disparities using a Community Needs Index measuring social infrastructure needs
in local areas.62 This explores social infrastructure differences across three
domains: civic assets, engaged communities and connectedness.
Civic assets measures the presence and density of physical community places
and spaces across the area.
Connectedness measures the connectivity to essential services, digital
infrastructure, the extent of isolation and the strength of the local job market.
Engaged Community measures the extent of third sector civic and community
activity and any barriers to participation and engagement.
The Community Needs Index aligns with our definition of social infrastructure as
covering places and spaces, community organisations and connectedness. The
index is slightly broader than our definition as it includes some of the local
conditions and enabling elements for successful social infrastructure investment,
such as job density. These domains cover a variety of indicators, as set out in the
following table.
61 Local Trust and OCSI (2019), ‘Left behind? Understanding communities on the edge’, https://localtrust.org.uk/insights/research/left-behind-understanding-communities-on-the-edge/
62 OCSI (2019), ‘Left behind? Understanding communities on the edge’

frontier economics 22
THE IMPACTS OF SOCIAL INFRASTRUCTURE INVESTMENT
Figure 4 Indicators in the three domains for the Community Needs Index
Civic Assets Connectedness Engaged Community
Density of community space assets
Job density in the travel-to-work area
Voter turnout in local elections
Density of education assets
Travel time to key services by public transport/walking
Registered charities per head
Density of sport and leisure assets
People living alone Big Lottery funding per head
Density of cultural assets
Households with no car Grand funding per head from major grant funders
Green spaces Broadband speeds SME lending by banks
Arts Council funding
Self-reported measures of community and civic participation
Strength of local social relationships
Leisure and cultural participation a) culture and heritage participation
Leisure and cultural participation b) participation in sport
Source: Local Trust (2019), ‘Left behind? Understanding communities on the edge’
The analysis by Local Trust and OCSI identified community needs for local areas.
This is shown in the following map, where a higher number indicates a higher
community needs score and therefore a lack of social infrastructure.

frontier economics 23
THE IMPACTS OF SOCIAL INFRASTRUCTURE INVESTMENT
Figure 5 Local authorities ranked by 2019 Community Needs Score
Source: Local Trust and OCSI, July 2019
Note: https://localtrust.org.uk/wp-content/uploads/2020/07/Left-Behind-Areas-IMD-2019-REVISED-SLIDE-DECK-with-revised-unemployment-slide-Read-Only-copy.pdf
Local Trust defines left-behind areas as wards with a community needs score in
the top 10% of all areas which are also within the top 10% of deprived areas, as
defined by the Indices of Multiple deprivation.
Our analysis of this data shows that the gap between left-behind areas and the
national average is significant: the 20% most left-behind areas have community

frontier economics 24
THE IMPACTS OF SOCIAL INFRASTRUCTURE INVESTMENT
needs that are almost three times as high as national averages.63 These areas
also have community needs that are approximately 25% greater than the average
among left-behind areas. The greatest differences are in levels of community
engagement, suggesting that social infrastructure investments targeting this
aspect of social infrastructure may be especially important. This is set out in
the following figure.
Figure 6 Community Needs Index and underlying domains for left-behind areas and the national average
Source: Frontier analysis of OCSI data
63 Left-behind areas are defined as those areas nationally that are among both the 10% most deprived and the 10% with highest community needs. This analysis uses data from OCSI (2019). Least social infrastructure is defined through the Community Needs Index.
0
20
40
60
80
100
120
140
160
180
200
CommunityNeeds Index
Civic Assets Connectedness EngagedCommunity
Ind
ex/
do
main
sco
re
Most left behind areas Average of left behind areas
National average
frontier economics 25
THE IMPACTS OF SOCIAL INFRASTRUCTURE INVESTMENT
3.2 Differences in social infrastructure are associated with different economic and social outcomes
Building on recent OCSI analysis,64 we combined the Community Needs Index with
other secondary data sets65 for those outcomes within our framework where we
were able to estimate monetised benefits (in Section 4):
health and wellbeing;
skills and employment; and
crime.
The intention of this analysis was to identify the size and nature of the gaps in
these areas. We set out the estimated returns from social infrastructure investment
in these areas in Section 4.
This evidence suggests significant gaps in skills, employment opportunities,
physical and mental health, and crime outcomes in left-behind areas.
Health and wellbeing outcomes
Life expectancy is lower for men by around four years and for women by
around three years in left-behind areas compared to the national average. Life
expectancy is similar compared to other deprived areas.66
Left-behind areas have almost one in four people (24%) with a limiting long-
term illness or chronic disability. This is higher than other deprived areas
(21%) and 6.5% higher than the national average (18%).67
The percentage of people with depression is 2% higher in left-behind areas
(12%) compared to the national average (10%), and 1% higher than other
deprived areas (11%).68
Skills and employment outcomes
On average, left-behind areas have over 13% more working-age people
without qualifications than the national average, and 3% more than other
deprived areas.69
Left-behind areas also have populations where fewer working-age people
have NVQ4 or above: 15% fewer than the national average (less than half of
the national average proportion) and 3% fewer than other deprived areas.70
64 NOMIS Annual Population Survey 2019 65 This includes Local Health data, NOMIS data, Department for Education, Department for Transport and
ONS datasets. 66 OCSI (2020), ‘Left Behind Areas 2020 – Interim Set: Summary Dataset’ using ONS data 67 OCSI (2020), ‘Left Behind Areas 2020 – Interim Set: Summary Dataset’ using 2011 Census data 68 OCSI (2020), ‘Left Behind Areas 2020 – Interim Set: Summary Dataset’ using data from GP registers
2017/18 69 OCSI (2020), ‘Left Behind Areas 2020 – Interim Set: Summary Dataset’ using 2011 Census data 70 OCSI (2020), ‘Left Behind Areas 2020 – Interim Set: Summary Dataset’ using 2011 Census data

frontier economics 26
THE IMPACTS OF SOCIAL INFRASTRUCTURE INVESTMENT
There is also a higher proportion of economically inactive people who
want a job in left-behind areas compared to the national average, and the
proportion wanting a job is highest in the most left-behind areas.71
Crime outcomes
Left-behind areas have higher rates of crime (92 per 1,000) compared to the
national average (83 per 1,000).72
□ Compared to other deprived areas, left-behind areas have more criminal
damage but less violent crime and anti-social behaviour. OCSI believes this
is linked to left-behind areas often being located in more peripheral areas
away from urban centres and nightlife.73
3.3 There is a significant gap to be closed in left-behind areas
Our analysis suggests there is a substantial gap in left-behind areas which
social infrastructure investment could play an important role in closing.
Section 4 quantifies the returns that a bundle of social infrastructure investments
in left-behind areas could achieve, according to previous robust evidence. Our
analysis here suggests that the size of the opportunity for investment in left-behind
areas is large. If outcomes in left-behind areas could be improved to the national
average, our analysis finds that, for example:74
Improving unemployment rates from the average of the left-behind areas to
the national average would reduce unemployment in these areas from 5.5% to
4.2%, a fall of almost one quarter;
Improving life satisfaction in the average of the left-behind areas to national
averages would increase life satisfaction in these areas from 7.58 to 7.71 (score
out of 10); and
Bringing crime rates in the average of the left-behind areas in line with the
national average would reduce crime in these areas by around nine incidents
for every 1,000 people, from 92 to 83, a fall of 10%.
While social infrastructure investment alone may not be able to close all of the
identified gaps, there is strong evidence of links between social infrastructure and
improvements in employment and wellbeing and reductions in crime, suggesting
this is likely to be an important part of the answer.
71 OCSI (2020), ‘Left behind areas 2020 – interim set: Summary dataset’ using 2011 Census data 72 Community Safety Partnerships: recorded crime rate for headline offences for year ending March 2020 73 OCSI (2020), ‘Left behind areas 2020 – interim set: Summary dataset’ using police data 74 This analysis compares the 20% of left-behind areas with the greatest community need, as defined by the
OCSI Community Needs Index, against national averages.

frontier economics 27
THE IMPACTS OF SOCIAL INFRASTRUCTURE INVESTMENT
4 THE RETURNS ON INVESTMENT IN SOCIAL INFRASTRUCTURE IN LEFT-BEHIND AREAS
The previous sections set out the relationships between social infrastructure and
outcomes, and the size of the gap between left-behind areas and the national
average. This section uses evidence from the outcomes of previous investments
in social infrastructure in areas with similar characteristics to left-behind areas. We
only include evidence that meets a high bar of robustness.
Our return on investment analysis is based on what returns an illustrative £1 million
in a basket of community-led social infrastructure investments in left-behind areas
could achieve over ten years. Because of our robust approach to what evidence
has been included, these figures should be seen as a minimum possible return: in
reality, the return could be higher.
A £1 MILLION INVESTMENT IN SOCIAL INFRASTRUCTURE IN A LEFT-BEHIND AREA WOULD BE EXPECTED TO DELIVER BENEFITS OVER TEN YEARS OF:
£1.2 million fiscal benefits:
£2 million economic and social benefits:

frontier economics 28
THE IMPACTS OF SOCIAL INFRASTRUCTURE INVESTMENT
FURTHER BENEFITS: NON-MONETISED
There are also important benefits that are not included in the monetised
estimates above due to limitations in the quantitative evidence, for example:
improved social cohesion, civic engagement, reduced loneliness and
environmental benefits.
These non-monetised benefits include findings that an investment in the
‘quality of place’ for a deprived neighbourhood could increase the
percentage improvement in the last two years from place-based outcomes
(such as community scores) relative to the national average by 4.1%. And
an American study found that people living in suburbs with high levels of
social infrastructure were 23% less likely to indicate they were
experiencing social isolation than those living in suburbs with low levels of
social infrastructure.
4.1 Selection of outcomes for the return on investment analysis
Using the evidence from our review, we estimate the potential scale of outcomes
that £1 million of social infrastructure investment could achieve, on average, in a
left-behind area. This is consistent with the proposed approach of the Community
Wealth Fund. Our method is summarised in the figure below.
Figure 7 Approach to return on investment analysis
Source: Frontier Economics
Basket of investments
We identify a plausible ‘basket’ of
investments, as shown in the table to the right.
This is intended to give an illustration of
broadly typical investment types, based on
investments in initiatives such as Big Local,
and for which it is feasible to estimate
monetised returns.
This is not intended to be exhaustive and, in
practice, investments will be tailored by a local
community to their identified needs.
Basket of investments
£1 million invested in:
Community assets
Community volunteering
Youth services
Employment and skills training
Sports groups
Cultural groups
Supporting troubled families
Source: Frontier Economics
frontier economics 29
THE IMPACTS OF SOCIAL INFRASTRUCTURE INVESTMENT
Scale of benefits
We then identify robust estimates from our evidence review to quantity the returns
on investment. This is a partial analysis as not all outcomes can be robustly
monetised from the evidence identified. Our evidence review was focused on
finding existing evidence where investments in social infrastructure were in areas
with similar characteristics to left-behind areas.
EVIDENCE SELECTION
We took a conservative approach to selecting evidence from the wide range of
reports assessed in our evidence review. This selection involved:
Focussing only on those outcomes with a clear causal link from social
infrastructure investment in theory, consistent with the framework we outlined
in Figure 2 in Section 2.2;
Using evidence from robust evaluations or established research methods. We
used the Maryland Scientific Methods Scale (SMS) to help identify robust
analyses. The SMS is a five-point scale for evaluations to rate how robust they
are. Wherever possible we selected evidence that was in line with level three
of the scale: this is consistent with the What Works Centre for Growth’s
approach.75 However, we also judged meta-analyses, such as BIS’s analysis
of additionality (details in ANNEX B), to be sufficiently robust for inclusion. Any
other evidence included, such as the national evaluation of the Troubled
Families programme (details in ANNEX B), was deemed to either be consistent
with conservative assumptions or we applied conservative assumptions when
using it in our calculations.
In practice, this means the evaluations we used all give consideration to the
causality of the outcomes estimated, either through their research methods
(such as econometric approaches) or through conservative assumptions on the
proportion of outcomes attributable to the intervention.
Wherever possible, we use evidence that is specific to the context of left-behind
areas, such as from past interventions in areas with similar characteristics. This
means that the returns on investment are appropriate to consider as possible
returns on investment in social infrastructure in left-behind areas.
Conservative assumptions
We then make conservative assumptions to apply the estimates from the literature
review to social infrastructure investments, aligning wherever possible with the
conditions in left-behind areas. These assumptions include factors such as the
‘additionality’ of the investments relative to what could otherwise have been
achieved, based on estimates from our evidence review and government
guidelines. We also make assumptions on the leveraging of match-funding
opportunities that increase the returns on public investment, using conservative
75 https://whatworksgrowth.org/public/files/Scoring-Guide.pdf

frontier economics 30
THE IMPACTS OF SOCIAL INFRASTRUCTURE INVESTMENT
estimates from similar past investments.76 Assumptions are also made on the likely
lifetime of the benefits, with most benefits conservatively assumed not to go
beyond a ten-year lifespan of investment.
As part of this, we convert the actual costs and benefits from various investments
into what the proportional benefits would have been if the investment was
£1 million. Previous programmes from which evidence is drawn made large
investments, with some programme costs running into billions. Our estimates
implicitly assume that the outcomes are scalable with the amount of investment.
The extent to which scalability may be possible for the Community Wealth Fund or
similar initiatives is not a specific focus of our analysis given the limitations of
current evidence to explore this aspect.
4.2 The outcomes of the return on investment analysis
Our analysis estimates the benefits over a ten-year period.77 Without knowing the
exact profile of when the investment costs are incurred and when the benefits start
to be realised, we are not able to provide further detail on the timing of these
outcomes.
Fiscal outcomes
Following this approach, we estimate a
£1 million investment could deliver
returns to the Exchequer of £1.2 million.
These returns result from impacts on
employment taxes, benefits and costs of local
services. Returns in employment taxes and
benefits are estimated at £0.5 million as a
result of supporting unemployed people into
work; these returns are ‘cashable’ as they
provide a direct saving to the Exchequer.78 Returns to healthcare services are
estimated at £0.6 million as a result of better health outcomes, supported through
increased employment and increased physical activities.79 The remaining £0.1
million of returns are from reductions in the cost of local services associated with
adult and juvenile offending and children in care.80 These returns to local services
76 Match funding of 16% is assumed, consisting of both financial and in-kind contributions. This is a conservative estimate from past Local Trust research, https://localtrust.org.uk/wp-content/uploads/2014/05/local_trust_getting_started_funding_summary.pdf
77 Where the existing evidence does not relate to a 10-year period, we assume that it can be converted into this timeline and we use a net present value calculation to present the findings. We note that some Big Local investments, which the illustrative basket of £1 million is broadly based on, are over 15 years.
78 This estimate uses evidence from the Department for Work and Pensions, published in the Greater Manchester CBA Model, https://greatermanchester-ca.gov.uk/what-we-do/research/research-cost-benefit-analysis/
79 These estimates use evidence from the Department for Work and Pensions, published in the Greater Manchester CBA Model; and the Sport Industry Research Centre (SIRC) at Sheffield Hallam University for Sport England ‘Social Return on Investment of Sport and Physical Activity in England’
80 This estimate uses evidence from the Department for Housing, Community and Local Government, ‘National evaluation of the Troubled Families Programme 2015 to 2020: evaluation overview policy report’
£1.2 million in fiscal returns On average over ten years from a £1 million investment in social infrastructure
frontier economics 31
THE IMPACTS OF SOCIAL INFRASTRUCTURE INVESTMENT
are mostly ‘non-cashable’ because, while they reduce pressures on local services,
this does not necessarily result in a direct cash saving.
Economic and social outcomes
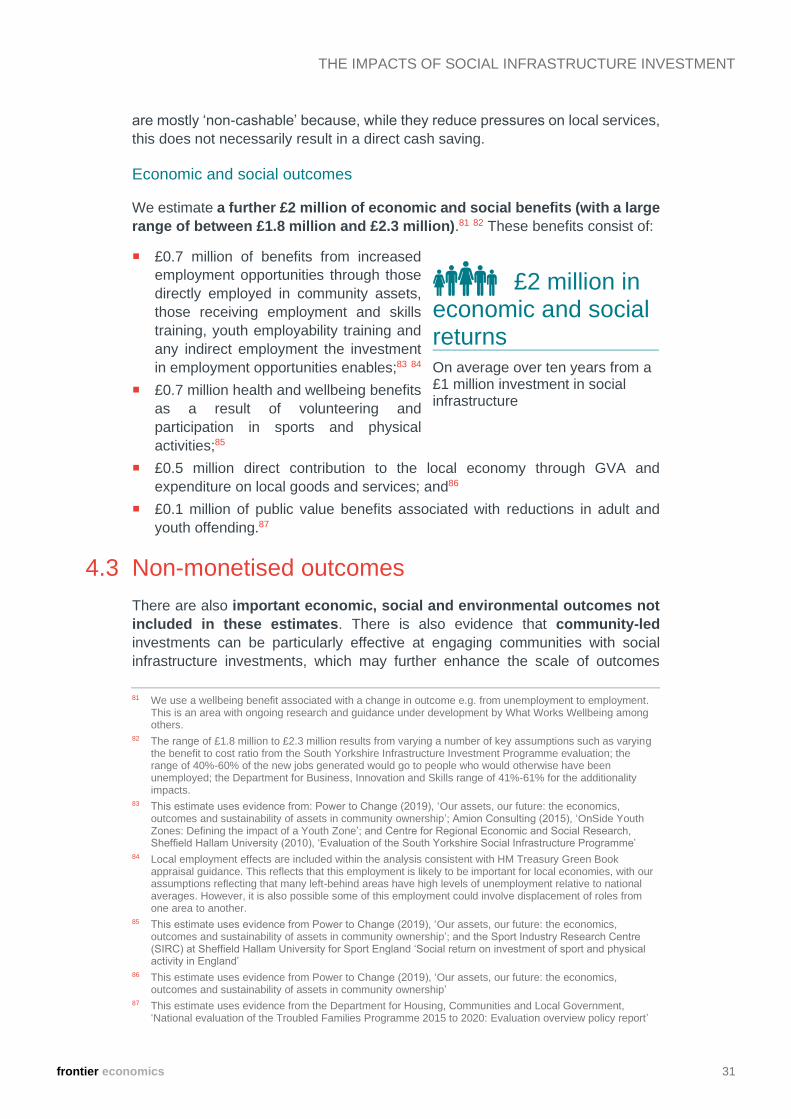
We estimate a further £2 million of economic and social benefits (with a large
range of between £1.8 million and £2.3 million).81 82 These benefits consist of:
£0.7 million of benefits from increased
employment opportunities through those
directly employed in community assets,
those receiving employment and skills
training, youth employability training and
any indirect employment the investment
in employment opportunities enables;83 84
£0.7 million health and wellbeing benefits
as a result of volunteering and
participation in sports and physical
activities;85
£0.5 million direct contribution to the local economy through GVA and
expenditure on local goods and services; and86
£0.1 million of public value benefits associated with reductions in adult and
youth offending.87
4.3 Non-monetised outcomes
There are also important economic, social and environmental outcomes not
included in these estimates. There is also evidence that community-led
investments can be particularly effective at engaging communities with social
infrastructure investments, which may further enhance the scale of outcomes
81 We use a wellbeing benefit associated with a change in outcome e.g. from unemployment to employment. This is an area with ongoing research and guidance under development by What Works Wellbeing among others.
82 The range of £1.8 million to £2.3 million results from varying a number of key assumptions such as varying the benefit to cost ratio from the South Yorkshire Infrastructure Investment Programme evaluation; the range of 40%-60% of the new jobs generated would go to people who would otherwise have been unemployed; the Department for Business, Innovation and Skills range of 41%-61% for the additionality impacts.
83 This estimate uses evidence from: Power to Change (2019), ‘Our assets, our future: the economics, outcomes and sustainability of assets in community ownership’; Amion Consulting (2015), ‘OnSide Youth Zones: Defining the impact of a Youth Zone’; and Centre for Regional Economic and Social Research, Sheffield Hallam University (2010), ‘Evaluation of the South Yorkshire Social Infrastructure Programme’
84 Local employment effects are included within the analysis consistent with HM Treasury Green Book appraisal guidance. This reflects that this employment is likely to be important for local economies, with our assumptions reflecting that many left-behind areas have high levels of unemployment relative to national averages. However, it is also possible some of this employment could involve displacement of roles from one area to another.
85 This estimate uses evidence from Power to Change (2019), ‘Our assets, our future: the economics, outcomes and sustainability of assets in community ownership’; and the Sport Industry Research Centre (SIRC) at Sheffield Hallam University for Sport England ‘Social return on investment of sport and physical activity in England’
86 This estimate uses evidence from Power to Change (2019), ‘Our assets, our future: the economics, outcomes and sustainability of assets in community ownership’
87 This estimate uses evidence from the Department for Housing, Communities and Local Government, ‘National evaluation of the Troubled Families Programme 2015 to 2020: Evaluation overview policy report’
£2 million in economic and social returns On average over ten years from a £1 million investment in social infrastructure

frontier economics 32
THE IMPACTS OF SOCIAL INFRASTRUCTURE INVESTMENT
achieved.88 These benefits are not included in the monetised estimates above due
to limitations in the evidence available to reach a robust quantitative estimate,
despite compelling qualitative evidence that these outcomes could be substantial.
However, we draw on a selection of evidence that indicates the potential impacts
and scale of such investments.
Social cohesion, civic engagement and loneliness
For example, our evidence review identified a wide range of literature on the
broader benefits of social capital in supporting social cohesion, civic
engagement and reduced loneliness for isolated individuals or communities.89
This includes an American study which found that people living in suburbs with
high levels of social infrastructure were 23% less likely to indicate they were
experiencing social isolation than those living in suburbs with low levels of social
infrastructure.90
Enhancing local green spaces
A number of community initiatives also deliver environmental benefits, for
example by enhancing local green spaces.91 This includes benefits such as
reducing urban temperatures and improving air quality.92
As discussed earlier, the Heritage Fund evidence review93 found that green spaces
were associated with health and wellbeing outcomes. This includes the finding
from an Australian study that a 1% increase in public green space increases
life satisfaction by the monetary equivalent of 1,172 USD per household. This
is not included in our monetised outcomes.
Wellbeing from participation in culture and sports
Analysis by Fujiwara et al. for the Department of Culture, Media and Sport in 2014
estimated the wellbeing impacts from participating in culture and sports. Updating
the findings to current prices, the average monetary value per person participating
in regular activities is £1,356.
However, without knowing the number of people involved in a Community Wealth
Fund project, it is difficult to estimate the total wellbeing impact. If 50 people were
to participate each year for ten years and if the wellbeing values were constant
over this time, the net present value of the benefits would be £0.58 million.
88 CCHPR (2019) Cambridge Centre for Housing and Planning Research, Cambridge University, ‘Achieving local economic change: What Works?’ G Burgess, K Karampour, K Muir and P Tyler
89 See, for example, What Works (2018), ‘Places, spaces, people and wellbeing: full review’; and What Works (2020), ‘A systematic review of the community wellbeing impact of community business’
90 Cox and Street(2019), The importance of place: Neighborhood amenities as a source of social connection and trust, AEI
91 See Cox and Street (2019), ‘The importance of place: Neighbourhood amenities as a source of social connection and trust’
92 See University of Leeds and United Bank of Carbon (2015), ‘A brief guide to the benefits of urban green spaces’
93 Heritage Fund (2019), ‘Space to thrive – A rapid evidence review of the benefits of parks and green spaces for people and communities’

frontier economics 33
THE IMPACTS OF SOCIAL INFRASTRUCTURE INVESTMENT
This is not included in our monetised outcomes due to uncertainty about how many
people this could apply to.
Improving the quality of place
The New Deal for Communities Programme final assessment looked at the impact
of investment in deprived areas over the period from 2002 to 2008 and analysed
place-related outcomes for crime, community and housing and the physical
environment. Compared to national outcomes, it found an 18% improvement in
deprived neighbourhoods that were invested in over the previous two years. When
weighted to a £1 million investment with benefits over ten years, this is a 4.1%
improvement relative to national outcomes. This assumes that there is a
cumulative effect per year from sustaining the intervention over time

frontier economics 34
THE IMPACTS OF SOCIAL INFRASTRUCTURE INVESTMENT
5 AREAS FOR FURTHER RESEARCH
While this research shows that there is already an evidence base which can
support the economic case for social infrastructure investment, there remain
opportunities for more research and analysis to expand and strengthen this
evidence. This section suggests where there are opportunities to further develop
this evidence base.
5.1 There is already a strong evidence base for investment
This study brought together a wide range of papers across a fragmented and
dispersed evidence base. The evidence reviewed for this research shows a
substantive evidence base on the nature of economic and social outcomes that
community-led social infrastructure can support. There is also evidence that allows
quantification to be made for a number of these outcomes, as reflected in our
analysis. These outcomes alone suggest potentially substantial fiscal, economic
and social benefits from social infrastructure investments.
5.2 Opportunity to further develop the evidence base through continued monitoring and evaluation
As with almost any public investment, there are aspects of the evidence base that
could be further strengthened. In particular, there are important outcomes for which
it is difficult to make reliable quantitative estimates despite a strong theoretical
basis or qualitative evidence suggesting that social infrastructure is impactful. It is
therefore important that the findings of this analysis are seen in the context of the
broader evidence base as a whole.
Areas that further research could investigate
Our findings suggest merit in future research to further increase understanding of
the following areas:
There are important outcomes from social infrastructure which it has not been
possible to quantify and/or monetise in this analysis, but which our framework
and the qualitative evidence suggest are important. These include benefits of
social capital in supporting social cohesion, civic engagement, reducing
loneliness for isolated individuals or communities, and environmental benefits
from community initiatives. Further research would be valuable to better
understand the scale of such outcomes, for example through further support
for monitoring and evaluation of local social infrastructure investments.
Local conditions can mean different types of social infrastructure may be more
or less effective in different areas. Costs and benefits may also be distributed
across different places as people travel or move between areas. Our analysis
used evidence closely matched to left-behind areas wherever feasible, but
there are also substantial differences among left-behind areas that will
influence the effectiveness of individual investments. Further research on this
frontier economics 35
THE IMPACTS OF SOCIAL INFRASTRUCTURE INVESTMENT
effectiveness in different conditions could help to support local communities in
determining which social infrastructure investments may be most beneficial for
their specific circumstances.
The effectiveness of social infrastructure investments is also likely to be
interrelated with the wider economic and policy environment through the links
between social infrastructure and the broader drivers of growth shown in our
framework. Research to further understand the associated policy
interdependencies could be beneficial for informing both social and broader
infrastructure investments. For instance, recent analysis of population growth
and greenfield sites in Australia highlighted how access to social infrastructure
can be estimated through granular spatial analysis, noting that social
infrastructure is necessary for community wellbeing. The report suggests that
this type of real-time spatial analysis can be used to identify where social
infrastructure investments are needed to avoid poor outcomes associated with
insufficient social infrastructure.94
Our research reviewed over 100 reports but does not represent a
comprehensive review of all available evidence and is necessarily focused on
those reports most relevant to our research. There was also limited evidence
available on the implications of the Covid-19 pandemic for social infrastructure
at the time of our review. There would be merit in further systematic reviews of
what is a growing but fragmented evidence base on social infrastructure
investments to draw out insights for future policy and to guide ongoing
research.
The Community Wealth Fund could present a perfect opportunity to further enrich
the evidence base in these areas through more systematic monitoring and
evaluation of social infrastructure investments, both for existing investment plans
and integrated within the designs for a Community Wealth Fund. This could
perhaps be in the context of a What Works Centre-style approach, specifically
focused on the value and effectiveness of community-led interventions at a
neighbourhood level.
94 Sarkar, S., Moylan, E., Wu, H., Shrivastava, R., Gurran, N. and Levinson, D. (2021) New housing supply, population growth, and access to social infrastructure, AHURI Final Report No. 356, Australian Housing and Urban Research Institute Limited, Melbourne, https://www.ahuri.edu.au/research/final-reports/356, doi: 10.18408/ahuri73233

frontier economics 36
THE IMPACTS OF SOCIAL INFRASTRUCTURE INVESTMENT
ANNEX A FRAMEWORK
Figure 8 A detailed framework for social infrastructure investment outcomes
Source: Frontier Economics
Social outcomesCommunity-led
social
infrastructure
investments
Drivers of local economic
performance
Skills
Infrastructure
Innovation
Business
environment
Quality of place
Health
Wellbeing
Crime
Places and
spaces
Social capital
Social centres
Social bridging
Social bonding
Physical capital
Community hubs,
assets and amenities
Digital access and
infrastructure
Enhancing local
transport
Human capital
Volunteering
Training
Aspirations
Supporting physical
and mental health
Natural capital
Green spaces
Sustainable
community assets
Sustainable local
transportSustainability
Civic engagement
Economic outcomes
Productivity
Employment
Wages
Fiscal outcomes
Increased tax
revenues
Reduced benefits
costs
Reduced costs of
local services
Environmental outcomes
Reduced GHG
emissions
Increased
biodiversity
Community
organisations
Direct effects via social capital
Indirect effects via local
economic performance
Connectedness
Other complementary investments and policies

frontier economics 37
THE IMPACTS OF SOCIAL INFRASTRUCTURE INVESTMENT
ANNEX B RAPID EVIDENCE ASSESSMENT SUMMARY FINDINGS
The literature reviewed for the rapid evidence assessment was collated from
different sources. An initial list of relevant literature provided by Local Trust was
supplemented with literature obtained from a wide range of searches on Google
Scholar. The remaining literature came from recommendations from Advisory
Group members.
All in all, this led to a literature list of 103 papers. Most of the literature was
published in the past five years, with a geographical focus on the UK, EU and USA.
A wide range of literature was reviewed, including academic papers, evaluations
and reports.
The papers from the literature list were reviewed in two stages. Firstly, the papers
were sifted to check whether they would contribute to the qualitative framework
and/or provide quantitative estimates of impact. If the paper was deemed to be in
scope and insightful, a detailed review was undertaken in the second stage. Out
of the initial 103 papers, 55 were reviewed in detail.
The following summary table sets out selected key papers95 used to inform our
qualitative framework. We employed a broad rating system of ‘good’, ‘moderate’
and ‘poor’ in our assessment of these papers. Note that we did not include any
‘poor’ papers as a key pieces of evidence.96 In principle, we considered papers that
rely on quantitative evidence to be ‘good’ evidence and those that rely solely on
qualitative evidence to be ‘moderate’ or ‘poor’ evidence, depending on the number
of assumptions and variety of evidence used. Some quantitative papers rely on
strong assumptions, in which case we considered those to be ‘moderate’ evidence
instead. Finally, we also considered papers which rely on meta-analysis of multiple
other papers to be ‘good’ evidence.
95 These papers reflect the references in the body of the report and demonstrate the types of evidence used to develop our framework. These sources also provide examples of evidence for the different channels of impact.
96 The Maryland Scientific Methods Scale is applicable for statistical research.

T
HE
IMP
AC
TS
OF
SO
CIA
L IN
FR
AS
TR
UC
TU
RE
INV
ES
TM
EN
T
fron
tier e
co
no
mic
s
38
Figure 9 Summary table of key papers informing qualitative framework
Author (year) Name of paper Brief description Channel of impact evidenced
Power to Change (2019)
Our assets, our future: the economics, outcomes and sustainability of assets in community ownership
An economic assessment of the assets in the community ownership sector in England
Good quantitative evidence on connection between social infrastructure and physical capital, human capital, employment and wellbeing.
What Works Wellbeing (2018)
Places, spaces, people and wellbeing: full review
A systematic review of interventions to boost social relations through improvements in community infrastructure (places and spaces)
Good quantitative and qualitative evidence on connection between both community hubs and green and blue spaces, and social capital. We note it concludes that not all evidence reviewed is itself strong but as a body of evidence we view it as good quality.
Muringani, Fitjar and Rodriguez-Pose (2021)
Social capital and economic growth in the regions of Europe
Assessment of the impact of (bonding or bridging) social capital on economic growth
Good quantitative evidence on connection between social capital and local economic growth.
RSA Action and Research Centre (2015)
Community Capital: the value of connected communities
Research on benefits of connected communities on social, fiscal and economic benefits
Good qualitative and quantitative evidence on connection between social infrastructure and wellbeing, employment and health.
Centre for Regional Economic and Social Research, Sheffield Hallam University (2010)
Evaluation of the South Yorkshire Social Infrastructure Programme
Performance assessment of the South Yorkshire Social Infrastructure Programme (SYSIP)
Moderate quantitative evidence on connection between social infrastructure and human capital, skills and employment.
Local Trust (2020) Big Local CED case studies Case studies of social infrastructure investments
Moderate qualitative evidence on connection between social infrastructure and business environment.
Sport Industry Research Centre, Sheffield Hallam University (2020)
Social return on investment of sport and physical activity in England
Quantification of the financial, economic and social impact of sport and physical activity in England
Good quantitative evidence on connection between sports and social capital, skills, health, wellbeing and crime.
Social Investment Business (2020)
Strong social infrastructure can level up left-behind places: here's how
The value of social infrastructure in levelling up areas
Moderate qualitative evidence on connection between social infrastructure and business environment.
Power to Change (2017)
Neighbourhood economic models
The role of trust and social capital in supporting effective economic markets
Good quantitative evidence on connection between social capital and innovation.

T
HE
IMP
AC
TS
OF
SO
CIA
L IN
FR
AS
TR
UC
TU
RE
INV
ES
TM
EN
T
fron
tier e
co
no
mic
s
39
Author (year) Name of paper Brief description Channel of impact evidenced
OECD (2020) Regional strategies for the social economy
Explores the links between strategies of the social economy and regional development
Good quantitative evidence on connection between social infrastructure and employment.
Heritage Fund (2019) Space to thrive – A rapid evidence review of the benefits of parks and green spaces for people and communities
Evidence review of the benefits of parks and green spaces for people and communities
Good quantitative evidence on connection between green spaces and social capital, quality of place, health and wellbeing.
Centre for Regional Economic and Social Research Sheffield Hallam University (2010)
The New Deal for Communities Evaluation: Final report – Volume 7
Impact assessment of New Deal for Communities Programme
Good quantitative evidence on connection between social infrastructure and wellbeing.
Centre for progressive policy (2020)
Productivity knocks: Levelling up with social infrastructure investment
Evidence on economic and fiscal benefits of social infrastructure
Good quantitative evidence on connection between various local growth drivers and outcomes (e.g. skills and productivity; childcare and employment).
Source: Frontier Economics
The summary table below presents the papers used to inform our return on investment analysis, which we consider
to have robust quantification evidence. We used the Maryland Scientific Methods Scale (SMS) to help identify robust
analyses. Wherever possible we selected evidence that was in line with level three of the scale: this is consistent
with the What Works Centre for Growth’s approach.97 However, we also judged meta-analyses, such as the
Department for Housing, Community and Local Government analysis of additionality, to be sufficiently robust for
inclusion. Any other evidence included, such as the national evaluation of the Troubled Families programme, was
deemed to either be consistent with conservative assumptions or we applied conservative assumptions when using
it in our calculations.
Note that there is some overlap between these papers and those listed in the previous table as a few papers provided
evidence to both inform our qualitative framework and our monetisation of the illustrative investment.
97 https://whatworksgrowth.org/public/files/Scoring-Guide.pdf

T
HE
IMP
AC
TS
OF
SO
CIA
L IN
FR
AS
TR
UC
TU
RE
INV
ES
TM
EN
T
fron
tier e
co
no
mic
s
40
Figure 10 Summary table of key papers informing return on investment analysis
Author (year) Name of paper Brief description Summary of method and key findings
Department for Work and Pensions (2019)
Greater Manchester CBA Model
Cost benefit analysis model that allows the value for money offered by different interventions to be considered
Cost benefit analysis providing a unit cost data base. Consistent with the Green Book financial case and enables the wider economic/public value case. This evidence underlies the fiscal benefits of jobs, including the fiscal health service benefits. The number of new jobs created comes from other sources including South Yorkshire Social Infrastructure Investment Programme evaluation.
This is consistent with how Power to Change (2019) assessed the fiscal benefits from new jobs.
Sport Industry Research Centre at Sheffield Hallam University (2019)
Social return on investment of sport and physical activity in England
Evaluation of the social returns on investments (SROIs) of sport and physical activity in England
Methodology: Relying on the SROI framework, the authors measure and compute the ratio between 1) the social value of sport and physical activity, and 2) the cost of providing opportunities for engagement in these activities. They rely on data from the Department of Health and Social Care and other academic research on the relationship between physical activity and social outcomes. They make conservative assumptions, suggesting that their findings underestimate the true social value of sport and physical activity in England. Some social outcomes are excluded due to insufficient evidence.
Key findings: For every £1 invested in sport and physical activity, authors estimate social returns of £3.28. A standard gross level of additionality of 51% was applied to our figures from the Department for Business, Innovation and Skills (2009) analysis.
Department for Housing, Community and Local Government (2019)
National evaluation of the Troubled Families Programme 2015 to 2020: Evaluation overview policy report
Evaluation of the economic and fiscal benefits of the Troubled Families Programme
Methodology: Outcomes of interest were compared between participants of the programme and a matched comparison group. The comparison group is matched as families who are eligible but not receiving Troubled Families Programme support. The difference is attributed to the impact of the programme.
Key evidence: Authors estimate returns per £1 invested of £2.28 of economic benefits, and £1.51 of fiscal benefits.

T
HE
IMP
AC
TS
OF
SO
CIA
L IN
FR
AS
TR
UC
TU
RE
INV
ES
TM
EN
T
fron
tier e
co
no
mic
s
41
Author (year) Name of paper Brief description Summary of method and key findings
Power to Change (2019)
Our assets, our future: The economics, outcomes and sustainability of assets in community
Assessment of the benefits of community-owned assets, including economic growth, local economic resilience and general wellbeing
Methodology: Based on case studies (27 across five local authority areas) and survey data from over 350 responses. The survey responses were validated against their community-owned asset database and included questions to provide quantitative information on benefits through gross value added (GVA); local expenditure; full-time equivalent jobs; and volunteer places. These benefits were provided on an annual basis: in our analysis we assumed these were constant over 10 years and took the net present value of 10 years of annual benefits.
The costs were assessed through the survey and supplementary datasets on community asset acquisitions and purchase prices. We used these costs over 10 years to get the benefit to cost ratio consistent with benefits over 10 years.
They were hereby able to estimate the overall contribution of community-owned assets to the UK economy at the sector level. These general estimates are not to be applied to a specific asset.
Key finding: Community-owned assets in the UK contribute a total of nearly £220 million in GVA to the economy every year.
Amion Consulting (2015)
OnSide Youth Zones: Defining the impact of a Youth Zone
Assessment of the economic benefits from the Youth Zone programme
Methodology: The authors quantify the economic impact of the programme by measuring key metrics associated with programme (e.g. number of people assisted in finding a job and survey results from over 200 respondents about changes in exercise) and valuing them according to the HACT Social Value Bank outcome valuation (e.g. general training for a job is valued at £2,507). Three youth zones were reviewed with survey data from almost 300 participants, parents and local businesses, and analysis of the training scheme and the outcomes for further education and jobs.
Key findings: Every £1 spent was estimated to deliver £2.03 of economic benefits. We use the social value of the youth zones on employability to quantify the youth employability benefits from investing in youth services. We make the assumption that 20% would otherwise not get a job, based on high levels of youth unemployment/ Not in Education, Employment or Training (NEETS) in deprived areas (see for instance https://www.nuffieldfoundation.org/sites/default/files/files/ACEVO%20Youth%20Unemplyment_lo_res.pdf)

T
HE
IMP
AC
TS
OF
SO
CIA
L IN
FR
AS
TR
UC
TU
RE
INV
ES
TM
EN
T
fron
tier e
co
no
mic
s
42
Author (year) Name of paper Brief description Summary of method and key findings
Centre for Regional Economic and Social Research, Sheffield Hallam University (2010)
Evaluation of the South Yorkshire Social Infrastructure Programme
Evaluation of local funding programme for infrastructure organisations
Methodology: The authors quantify the economic impact of the programme by measuring key metrics associated with it (e.g. number of people assisted in skills development) and rely on certain assumptions (e.g. that people starting a full-time position earn £25,000 per year) to translate increases in these into GVA returns in four areas: assistance to find employment, improvement in business performance, skills development and volunteering.
Key finding: Authors estimate a return between £1 and £1.60 for each £1 invested in the programme. We use the midpoint of this to estimate the benefits of investing in employment and skills, and we use the range to estimate the range of benefits.
Centre for Economics and Business Research (CEBR) (2013)
The contribution of the arts and culture to the national economy
An analysis of the macroeconomic contribution of arts and culture to the economy
Methodology: Activities of arts and cultures were identified using SIC codes. Apart from considering their direct contribution to the economy, the authors measured indirect contributions (spillovers) using CEBR’ s input‐output models
Key finding: For every £1 of salary paid by industry, an additional £2.01 is generated in the wider economy through indirect and induced multiplier effects. We use this benefit ratio to multiply the assumed investment in arts from the illustrative Community Wealth Fund.
Fujiwara (2013) A general method for valuing non-market goods using wellbeing data: three-stage wellbeing valuation
Approach to valuation using subjective wellbeing data
Methodology: Includes a review of other wellbeing methodologies. The three stages are an income model, a non-market good model and the monetary equivalent value. The aim is to use randomised controlled trials, although instrumental variables are used where this data does not exist, and to remove existing bias found in previous studies.
Key finding: The compensating surplus for unemployment is about £10,700 per year (2013 prices). We update this to current prices and use this as the wellbeing value for the increases in employment estimated by other sources.
Department for Business, Innovation and Skills (2009)
Research to improve the
assessment of additionality
Estimating the additionality of different types of investment
Methodology: The review covered 280 studies to understand additionality. Data was captured, without any re-calculation, on deadweight, leakage, displacement, substitution and multiplier effects. Where sufficient data existed, a net additionality ratio was then calculated.
Key finding: This paper computed that 51% of gross benefits from ‘regeneration through physical infrastructure’ can be net additional; that is, they would have been provided had the asset not been in community ownership. We use this 51% midpoint in our analysis with the 41%-61% range for our public value range.

T
HE
IMP
AC
TS
OF
SO
CIA
L IN
FR
AS
TR
UC
TU
RE
INV
ES
TM
EN
T
fron
tier e
co
no
mic
s
43
Author (year) Name of paper Brief description Summary of method and key findings
Local Trust (2014) Getting started funding in wave 3 areas
Big local funding overview Big Local areas received funding beyond £1 million through the programme by receiving in-kind funding and additional cash funding from partners or charities.
Key finding: For the wave 3 Big Local areas there were cash matches and in-kind matches (e.g. materials were 40% of total in-kind matching). The average total match funding was 16% of funding. We use this average match funding to increase the total benefit ratio to reflect this.
Hoxby (2000) Peer effects in the classroom: Learning from gender and race variation
Identification of peer effects in classroom learning performance
Methodology: Estimates are in the context of school learning and impacts on test scores. Assumes variation is within cohorts not classrooms to address selection bias and removes linear time trends for achievement outcomes.
We take the lower bound as a conservative assumption for both youth and adult employment training and applying that to associated outcome benefits. These effects seek to estimate the spill-over benefits from an individual's enhanced education via training on outcomes for their peers e.g. via raising aspirations
Key finding: Peer effect estimated between 10% and 55%. We use the lower bound as additional benefits from training improving the cohort of peers.
Source: Frontier Economics
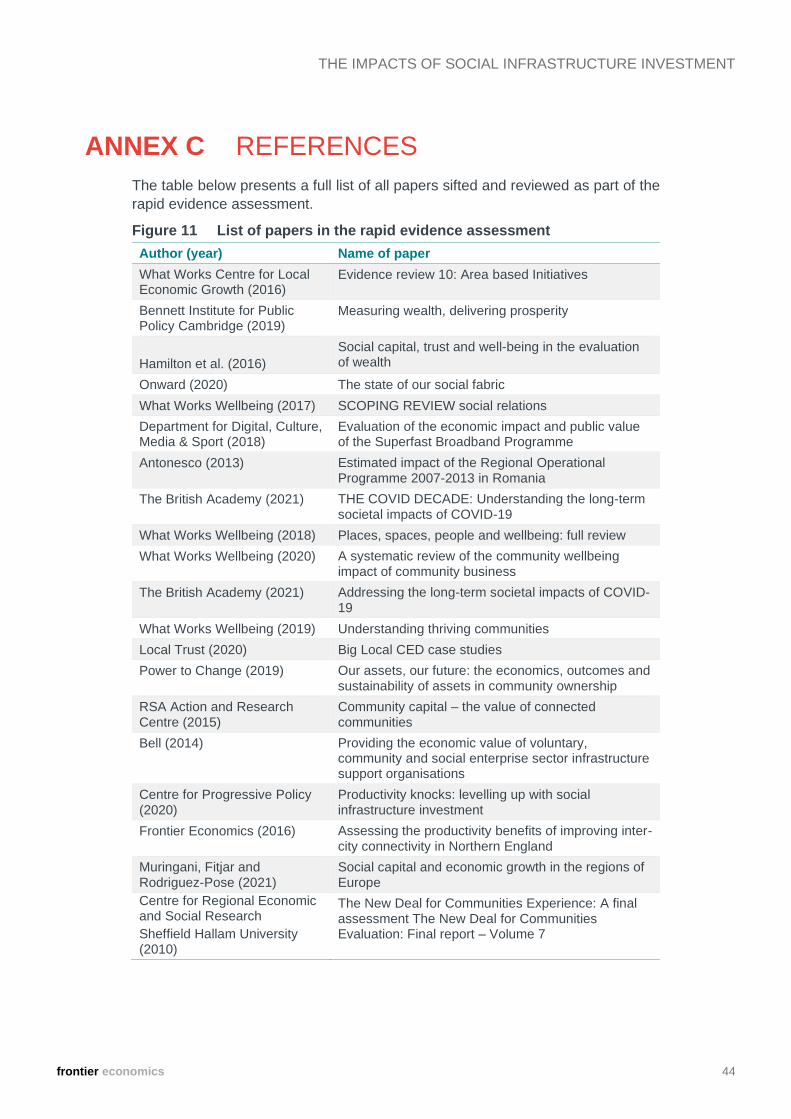
frontier economics 44
THE IMPACTS OF SOCIAL INFRASTRUCTURE INVESTMENT
ANNEX C REFERENCES
The table below presents a full list of all papers sifted and reviewed as part of the
rapid evidence assessment.
Figure 11 List of papers in the rapid evidence assessment
Author (year) Name of paper
What Works Centre for Local Economic Growth (2016)
Evidence review 10: Area based Initiatives
Bennett Institute for Public Policy Cambridge (2019)
Measuring wealth, delivering prosperity
Hamilton et al. (2016)
Social capital, trust and well-being in the evaluation of wealth
Onward (2020) The state of our social fabric
What Works Wellbeing (2017) SCOPING REVIEW social relations
Department for Digital, Culture, Media & Sport (2018)
Evaluation of the economic impact and public value of the Superfast Broadband Programme
Antonesco (2013) Estimated impact of the Regional Operational Programme 2007-2013 in Romania
The British Academy (2021) THE COVID DECADE: Understanding the long-term societal impacts of COVID-19
What Works Wellbeing (2018) Places, spaces, people and wellbeing: full review
What Works Wellbeing (2020) A systematic review of the community wellbeing impact of community business
The British Academy (2021) Addressing the long-term societal impacts of COVID-19
What Works Wellbeing (2019) Understanding thriving communities
Local Trust (2020) Big Local CED case studies
Power to Change (2019) Our assets, our future: the economics, outcomes and sustainability of assets in community ownership
RSA Action and Research Centre (2015)
Community capital – the value of connected communities
Bell (2014) Providing the economic value of voluntary, community and social enterprise sector infrastructure support organisations
Centre for Progressive Policy (2020)
Productivity knocks: levelling up with social infrastructure investment
Frontier Economics (2016) Assessing the productivity benefits of improving inter-city connectivity in Northern England
Muringani, Fitjar and Rodriguez-Pose (2021)
Social capital and economic growth in the regions of Europe
Centre for Regional Economic and Social Research
Sheffield Hallam University (2010)
The New Deal for Communities Experience: A final assessment The New Deal for Communities Evaluation: Final report – Volume 7

frontier economics 45
THE IMPACTS OF SOCIAL INFRASTRUCTURE INVESTMENT
Author (year) Name of paper
Neumark and Simpson (2015) Place-based policies
Social Investment Business (2020)
Social Investment Business – social infrastructure investment
Sheffield Hallam University (2010)
Evaluation of the South Yorkshire Social Infrastructure Programme
Centre for Progressive Policy (2020)
Shovel ready social infrastructure
Arts Council England (2013) The value of arts and culture to people and society
UK Women’s Budget Group (2016)
Investing in the care economy to boost employment and gender equality
Sport Industry Research Centre, Sheffield Hallam University for Sport England (2020)
Social Return on Investment of Sport and Physical Activity in England
Sport Industry Research Centre, Sheffield Hallam University for Sport England (2020)
The Economic Importance of Sport and Physical Activity in England
University of Manchester (2019)
Social Infrastructure: How shared spaces make communities work
Hickman (2021) Providing finance that charities and social enterprises need: Lessons learnt in how the Growth Fund is blending grants and loans to provide affordable finance to the voluntary sector
Card et al. (2009) Active labour market policy evaluations: A meta-analysis
Department for Business Innovation and Skills (2013)
Youth unemployment: Review of training for young people with low qualifications
What Works Centre for Local Economic Growth (2018)
Toolkit: Multiplier effects
Bennett Institute for Public Policy Cambridge (2021)
Townscapes 7. The value of social infrastructure
Department for Digital, Culture, Media & Sport (2014)
Quantifying and valuing the wellbeing impacts of culture and sport
Fujiwara (2013) A general method for valuing non-market goods using wellbeing data: Three-stage wellbeing valuation
Local Trust (2020) Part 1: Community Power Works
Cox and Street (2019) The importance of place: Neighborhood amenities as a source of social connection and trust
OECD (2020) Regional strategies for the social economy, OECD
What Works Centre for Local Economic Growth (2019)
What works: Evidence-based policy in disadvantaged places
Heritage Fund (2019) Space to thrive – A rapid evidence review of the benefits of parks and green spaces for people and communities
Sarkar et al. (2021) New housing supply, population growth, and access to social infrastructure
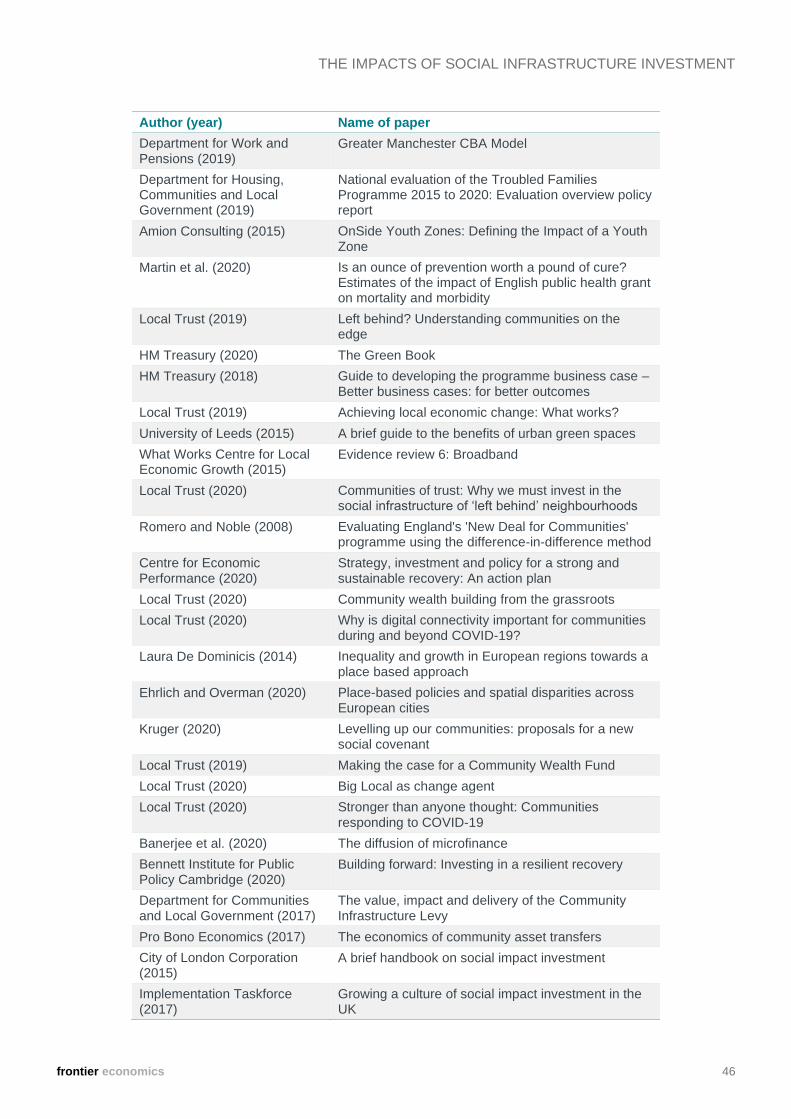
frontier economics 46
THE IMPACTS OF SOCIAL INFRASTRUCTURE INVESTMENT
Author (year) Name of paper
Department for Work and Pensions (2019)
Greater Manchester CBA Model
Department for Housing, Communities and Local Government (2019)
National evaluation of the Troubled Families Programme 2015 to 2020: Evaluation overview policy report
Amion Consulting (2015) OnSide Youth Zones: Defining the Impact of a Youth Zone
Martin et al. (2020) Is an ounce of prevention worth a pound of cure? Estimates of the impact of English public health grant on mortality and morbidity
Local Trust (2019) Left behind? Understanding communities on the edge
HM Treasury (2020) The Green Book
HM Treasury (2018) Guide to developing the programme business case – Better business cases: for better outcomes
Local Trust (2019) Achieving local economic change: What works?
University of Leeds (2015) A brief guide to the benefits of urban green spaces
What Works Centre for Local Economic Growth (2015)
Evidence review 6: Broadband
Local Trust (2020) Communities of trust: Why we must invest in the social infrastructure of ‘left behind’ neighbourhoods
Romero and Noble (2008) Evaluating England's 'New Deal for Communities' programme using the difference-in-difference method
Centre for Economic Performance (2020)
Strategy, investment and policy for a strong and sustainable recovery: An action plan
Local Trust (2020) Community wealth building from the grassroots
Local Trust (2020) Why is digital connectivity important for communities during and beyond COVID-19?
Laura De Dominicis (2014) Inequality and growth in European regions towards a place based approach
Ehrlich and Overman (2020) Place-based policies and spatial disparities across European cities
Kruger (2020) Levelling up our communities: proposals for a new social covenant
Local Trust (2019) Making the case for a Community Wealth Fund
Local Trust (2020) Big Local as change agent
Local Trust (2020) Stronger than anyone thought: Communities responding to COVID-19
Banerjee et al. (2020) The diffusion of microfinance
Bennett Institute for Public Policy Cambridge (2020)
Building forward: Investing in a resilient recovery
Department for Communities and Local Government (2017)
The value, impact and delivery of the Community Infrastructure Levy
Pro Bono Economics (2017) The economics of community asset transfers
City of London Corporation (2015)
A brief handbook on social impact investment
Implementation Taskforce (2017)
Growing a culture of social impact investment in the UK

frontier economics 47
THE IMPACTS OF SOCIAL INFRASTRUCTURE INVESTMENT
Author (year) Name of paper
Big Society Capital (2020) Big Society Capital – Impact report
Social Investment Scotland (2020)
Building an impact economy
What Works Centre for Local Economic Growth (2014)
Public realm – Briefing
What Works Centre for Local Economic Growth (2015)
Estate renewal – Evidence Review 5
What Works Centre for Local Economic Growth (2016)
Sports and Culture – Evidence Review 3
The British Academy (2020) The COVID Decade – understanding the long-term societal impacts of COVID-19
The Cohesion and Integration Network (2020)
The Social Cohesion Investment: Local areas that invested in social cohesion programmes are faring better in the midst of the Covid-19 pandemic
Ministry of Housing, Communities and Local Government (2018)
Measuring the impact of Community-Based English Language Provision – Findings from a Randomised Controlled Trial
Laurence (2018) Meeting, mixing, mending: How NCS impacts young people’s social integration
Localis (2020) Renewing neighbourhood democracy
Local Trust (2020) Below the radar: Exploring grants data for grassroots organisations
Local Trust (2020) Rapid research COVID-19 Stepping up and helping out: Grassroots volunteering in response to COVID-19
Creative Civic Change (2020) Preparing the ground – Learning from the first year of Creative Civic Change
New Local (2021) Community Power: The evidence
Local Trust (2020) Left behind topline summary
Local Trust (2018) Skittled out? The collapse and revival of England’s social infrastructure
OCSI (2020) Left-behind areas: Economic data dive
Onward (2020) Repairing our social fabric – Towards a new understanding of community strength
Rodriguez-Pose (2018) The revenge of the places that don’t matter (and what to do about it)
Onward (2020) The state of our social fabric – Measuring the changing nature of community over time and geography
New Local (2020) Think big, act small: Elinor Ostrom's radical vision for community power
Hopeful Towns (2020) Understanding community resilience in our towns
Industry Strategy Council (2021)
What does it take to ‘level up’ places? Evidence from international experience
What Works Wellbeing (2017) Drivers of wellbeing inequality
What Works Wellbeing (2020) A systematic review of the community wellbeing impact of community business

frontier economics 48
THE IMPACTS OF SOCIAL INFRASTRUCTURE INVESTMENT
Author (year) Name of paper
What Works Wellbeing (2021) Community hubs and green space – Real world evidence for enhancement of wellbeing
Social Life (2019) A new resilience model for Hounslow
What Works Wellbeing (2017) Measuring wellbeing inequality in Britain
Social Life (2019) Understanding local areas: making best use of existing data
What Works Wellbeing (2020) Volunteer wellbeing: What works and who benefits?
Local Trust (2020) Rapid research COVID-19 – Briefing 8
Local Trust (2020) Rapid research COVID-19 – Briefing 9
Local Trust (2020) Communities of trust: Why we must invest in the social infrastructure of ‘left behind’ neighbourhoods
Source: Frontier Economics

frontier economics 49
THE IMPACTS OF SOCIAL INFRASTRUCTURE INVESTMENT
www.frontier-economics.com