Embed Size (px)
Citation preview

JOURNAL OF FINANCIAL AND QUANTITATIVE ANALYSIS VOL. 19, NO. 1, MARCH 1984
The Impact of the Degrees of Operating andFinancial Leverage on Systematic Risk ofCommon Stock
Gershon N. Mandelker and S. Ghon Rhee*
I. Introduction
The capital asset pricing model postulates that the equilibrium retum on anyrisky security is equal to the sum of the risk-free rate of retum and a risk premiummeasured by the product of the market price of risk and the security's systematicrisk. In the capital asset pricing model, beta as an index of systematic risk is theonly security-specific parameter that affects the equilibrium retum on a risky se-curity.
The identification of the real determinants of the systematic risk of commonstock has received a great deal of attention in the finance and accounting litera-ture in recent years. A number of empirical studies have investigated the associa-tion between market-determined and accounting-determined risk measures (see[1], [2], [3], [12], [19], and [23]). These studies have increased our knowledgeabout correlations between betas of common stock and various accounting vari-ables or accounting betas. The studies cited also have provided further insightinto what forms of specification appear to best reduce the measurement errors inestimating accounting betas. In a review of their findings, Foster [10] concludesthat the choice of accounting variables has not been guided by a theoreticalmodel linking the firm's financing, investment, and production decisions with itscommon stock beta.
There have been limited efforts to utilize an empirical test design that ismore consistent with the definition of beta in the framework of the capital assetpricing model. Under the presumption that the firm's asset stmcture and capitalstmcture impact upon operating risk and financial risk, respectively, the separateeffect of either financial leverage or operating leverage on beta of common stockhas been examined. Hamada [13] reports that approximately one quarter of sys-
* University of Pittsburgh and University of Rhode Island, respectively. While retaining fullresponsibility for this paper, the authors would like to thank William Beranek, Dan Givoly, JeffreyJaffe, William Margrabe, and anonymous JFQA referees for their comments on earlier drafts of thepaper. The authors also thank J. Rock Chung for his assistance in computer work. Financial supportfor this paper was provided by the Faculty Research Grant, University of Pittsburgh.
45

tematic risk is explained by financial leverage while Lev [16] provides empiricalevidence that operating leverage, as measured by variable cost, is one of the realdeterminants of systematic risk. Two recent studies by Hill and Stone [14] andChance [6] represent more refined applications of the risk decomposition of Ha-mada [13] and Rubinstein [20]. Hill and Stone develop an accounting analogueto Hamada and Rubinstein's formula to investigate the joint impact of operatingrisk and financial structure on systematic risk. Chance conducts a direct test ofthe Hamada and Rubinstein formula by controlling operating risk to preserve theassumption of homogeneous risk class. Their findings provide considerable em-pirical support for Hamada and Rubinstein's formula.
Recent research efforts further explore the risk decomposition of Hamadaand Rubinstein by introducing the degrees of operating and financial leverageinto a model that explains betas of common stock. Although the degrees of thetwo types of leverage are extensively discussed in standard finance textbooks inrelation to their impact on the volatility of stockholders' returns or of earningsper share, their relationship with the systematic risk of common stock has notbeen fully resolved. A recent work by Brenner and Schmidt [5] further extendsRubinstein's analysis of the relationship between the characteristics of the firm'sreal assets and its common stock beta. They demonstrate how unit sales, fixedcosts, contribution margin, and the covariance of sales with returns on the marketportfolio affect systematic risk. Gahlon and Gentry [11] show that the beta of acommon stock is a function of the degrees of operating and financial leverages,the coefficient of variation of the total revenue, and the coefficient of correlationbetween earnings after interest and taxes and returns on the market portfolio.Unfortunately, it is difficult to investigate the impact of two types of leverage onoperating risk and financial risk in the framework of Gahlon and Gentry. This isso because the degrees of two types of leverage are introduced by an expansionof the coefficient of variation of earnings after interest and taxes. Nonetheless,theoretical analyses of Brenner and Schmidt and Gahlon and Gentry show muchpromise of enhancing our knowledge of the real determinants of beta.
As the degrees of two types of leverage are recognized in a model thatidentifies the real determinants of beta, this study explores two important empiri-cal issues. First, we examine the joint impact of the degrees of operating andfinancial leverage on the systematic risk of common stock. Although Hamadaand Rubinstein demonstrate that operating risk and financial risk constitute sys-tematic risk, it is not obvious how operating leverage and financial leverage arerelated to operating risk and financial risk, respectively, in their risk decomposi-tion. We demonstrate how the two types of leverage contribute to systematic riskof common stock. Second, we address the issue of "trade-offs" between operat-ing leverage and financial leverage, while investigating their combined effects onthe systematic risk of common stock. The interrelationship between operatingand financial leverage is widely discussed in the literature as a means of stabiliz-ing the relative riskiness of stockholders' investment. For example. Van Home([24], p. 784) states that:
Operating and financial leverage can be combined in a number of different ways to
46

obtain a desirable amount of risk of common stock. High operating leverage can beoffset with low financial leverage and vice versa.'
The trade-off option enables the firm to make asset (capital) structure deci-sions irrespective of their impact on systematic risk since the resultant change inthe degree of operating (financial) leverage can be offset by an adjustment in thedegree of financial (operating) leverage. This trade-off hypothesis has remained aconjectural matter despite its practical implications for management since it hasnot been substantiated by empirical evidence. This study provides empirical evi-dence on this hypothesis.
II. The Association between Systematic Risk and theDegrees of Operating and Financial Leverage
Hamada [13] and more recently Rubinstein [20] deserve credit for their ef-forts of decomposing systematic risk into operating risk and financial risk as indi-cated below
(1) p = P* + P*(l -
where (B = the levered firm's common stock beta,
P* = the unlevered firm's common stock beta,
T = the corporate income tax rate,
D = themarket value of debt, and
E = the market value of common equity.
P* measures operating risk while P*(l — T)D/E represents the financialrisk of common stock. Rubinstein suggests that operating risk reflects the com-bined effects of the degree of operating leverage, the pure systematic influence ofeconomy-wide events, and the uncertainty associated with the firm's operatingefficiency. Financial leverage magnifies this operating risk to produce financialrisk.
For an investigation of the association between systematic risk and the de-grees of operating and financial leverage, an alternative to the Hamada and Ru-binstein formula is necessary for the following reasons. First, equation (1) doesnot explicitly introduce the degrees of two types of leverage in its expression.Second, Hill and Stone [14] ably document various econometric problemscaused by a nonlinear multiplicative effect of financial structure on operating riskas measured by p*. Third, equation (1) assumes that corporate debt is risk free.Although this assumption is consistent with Modigliani and Miller's [18] tax cor-rection model, equation (1) must be modified to allow risky debt. With the intro-duction of risky debt, equation (1) is rewritten as
(2) p = [1 -»- (1 - T)D/£] P* - (1 -
I The words printed in italics are changed from the original statement.
47

where 3^ denotes beta of risky corporate debt.^ After a slight rearrangement, wewrite equation (2) as
(3) P = p* + (1 - T)(p* - ^j)D/E .
Financial risk as measured by (1 - T ) ( P * - ^j)DIE causes additionaleconometric problems associated with a multiplicative effect of financial struc-ture on the beta of risky debt. Although it is not an impossible task to resolvethese problems when investigating the real determinants of beta using equation(3), an alternative beta formula is derived to serve our purpose. This formulaexplicitly incorporates the degrees of operating leverage and financial leverage.By definition, the beta of common stocky is
where Rj, = the rate of retum on common stock j for the period from / - 1tof,
/?„, = the rate of retum on the market portfolio for the period from t- Hot,
Cov(') and CT (•) denote the covariance and variance operators, respec-tively. _ _
Suppose that Rj, = {Ilj,/Ej, _ ]) - 1 where FI , denotes eamings after inter-est and taxes at t and Ej, _ , represents the market value of common equity at t- 1. Substitution of this definition of ^^, into equation (4) yields
We can rearrange equation (5) by multiplying the first argument of the co-variance by Ily, _ 1 /Ily, _ , and subtracting a constant from it
(6) P, = ("-,-./^,-
2 Proposition II of Modigliani and Miller [17], [18] can be expressed as indicated below in thepresence of corporate income taxes and risky debt
(a) • E(R) = £(R*) + (1 - T) [£(«*) - E{R^D/E ,
where ^ = the rate of retum on the levered firm's common stock,R* = therateof retum on the unlevered firm's common stock, andRji = the rate of retum on risky debt.
According to the capital asset pricing model, £(R) = R^ -V [£(«„) - R/]p, E(k*^ = Rf +[E{RJ - Rj]^*,mdE{Rj) = R + [E{RJ - «^]p^, whereR^= the rate of retum on a risk-freeasset. Substitution of these expressions into (a) yields
48

The degree of financial leverage (DFL) is defined as the percentage changein n that results from a percentage change in X, where X denotes earnings beforeinterest and taxes. Thus,
(7) DFL =[(n,/n,_.)-i]/[(W .)-
Solving for (fly,/ 11 , _ i) - 1, we have
The degree of operating leverage (DOL) is measured by the percentagechange in X that is associated with a given percentage change in the units pro-duced and sold.3 Let Q denote the number of units. Thus,
Solving for (.Xj,/Xj,_i) - 1, we obtain
Successive substitution of (10) into (8) and (8) into (6) yields
(11) p. =
Let S denote sales in dollars. Thus, S = pQ where p is the price per unit. Bymultiplying the first argument of the covariance in ( l i ) by p/p, we obtain thedesired result
(12) P . = (DOL) (DFL) p° ,
where pP = Cov[(n^,_, /S^,_,)(V^; ' - i ) ' ^m<]/^~ (^m,) ' Note thatIly,. i/Sj,_, represents the net profit margin at r - 1 while Sj,/Ej,_, measures the
3 When the units produced and the units sold differ due to an uncertain demand for the products,stochastic cost-volume-profit analysis is introduced. (See [15] and [21].)
'' It is important to note that both DOL and DFL are not random variables. For example. DOL asdefined by (9) can be modified as
D O L =
where p = the price per unit.V = the variable cost per unit, andF = the total fixed costs.
Equation (a) represents another definition of DOL that indicates its nonrandomness. Likewise. DFLas defined by (7) can be rewritten as
^ ' = [(p- '^Qj.-1 - /=;,- • ] / [(p - '^Qj-1 - pj,-. - 'j,-1].
where / denotes interest expenses.
49

tumover ofthe firm's common equity for the period from / - 1 to r. The covaria-bility of the product of these two terms with retums on the market portfolio repre-sents the intrinsic business risk of common stock as measured by P,^. Furthernote that the unlevered firm, both operationally and financially, would nave DOL= 1 and DI^ = 1 . Therefore, this intrinsic business risk represents the system-atic risk of common stock when the firm is completely unlevered. When the firmis only financially unlevered, its common stock beta, denoted by p* in Hamadaand Rubinstein's formula, is equivalent to (DOL)Pj'. The role of DOL and DFLis clearly indicated by equation (12). Both DOL and DFL magnify intrinsic busi-ness risk of common stock.
Equation (12) is an altemative formula to the risk decomposition of Hamadaand Rubinstein. Because it explicitly introduces the degrees of two types ofleverage, its usefulness is obvious for an empirical investigation ofthe impact ofDOL and DFL on systematic risk. A nonlinear multiplicative effect of financialstmcture on operating risk as well as on the beta of risky corporate debt can beavoided by a logarithmic transformation of equation (12). This formula remainsvalid regardless of whether coporate debt is risky or not.
III. Empirical Test Design and Results
A. Data and Estimation Procedures
This study is based on a sample of 255 manufacturing firms during the pe-riod from 1957 to 1976. When selecting these firms, we require that their finan-cial data be on the Standard and Poor's Compustat Annual Data tape and thatmonthly stock price data be available on the Center for Research in SecurityPrices (CRSP) tape. Moody's Industrial Manuals (1957-1976) are used to verifysome ambiguous or missing financial data.
The first stage of the analysis involves the estimation of the degrees of oper-ating and financial leverage of the sample firms. Since the degree of leverage isbuilt on the familiar concept of elasticity, we use the following time-series re-gressions
7 = 1 255(13) LnX., = a. + c. Ln5., + «., ^ ^ ^
~ j = 1-255(14) Lnn., = b. + d. LnX., + e., ^ ^
where Uj, and ij, are disturbance terms. The estimated regression coefficients, Cjand dj, represent the degrees of operating leverage and financial leverage, re-spectively.^ In estimating Cj, the independent variable should be the number of
5 Alternative expressions for DOL and DFL as defined by (a) and (b) in footnote 4 becomeuseful to show that the unlevered firm, both financially and operationally, would have DOL = 1 andDFL = 1. The operationally unlevered firm will have f = 0 and DOL becomes unity from (a). Thefinancially unlevered firm will have / = 0 and DFL becomes unity from (b).
50

units produced and sold rather than annual sales in dollars. Because the quantityproduced and sold is not available from the income statement, following Lev[16], we use annual sales as a proxy as indicated by (13)." Estimation proceduresbased on (13) and (14) rest on the restrictive, ceteris paribus, assumption ofstationary elasticity over the estimation period. To examine the assumption ofstationarity, the Chow [7] and Fisher [9] test is conducted for each firm based onregressions over two subperiods, t, = 1957-1966 and t,, = 1967-1976. The testresults indicate that we cannot reject the hypothesis that the degrees of two typesof leverage are stable for approximately 90 percent of the firms at a = 5 percent.One possible option available would be to choose only those firms that pass theChow-Fisher test but this would reduce the size of the sample. Since we employa portfolio-grouping approach that should lessen the degree of nonstationarity ofthe coefficients, we decided not to eliminate any of the firms in our sample.^-^
The following market model is used to estimate the beta of each commonstock. The measurement of monthly rates of retum on the market portfolio isbased on a value-weighted index of the New York Stock Exchange stocks com-piled by CRSP.
~ ;• = 1-255(15) Rj, = a. + P / , , + V., , ^ ^
where v , denotes a disturbance term. Table 1 summarizes estimates of beta, thedegree of operating leverage, and the degree of financial leverage for 255 firms inthe sample by industry. The 255 firms are distributed over 10 different industriesunder the 2-digit SIC Industry Code.
B. Regression Results
We investigate the combined effects of the degrees of two types of leverageon systematic risk by using the following equation
(16) Lnpp = 7o + 7i LnDOL^ + 7
where P_, DOL^, and DFL_ are portfolio means of beta, the degree of operatingleverage, and the degree of^financial leverage. A portfolio-grouping approach is
* When negative earnings are observed for either X or 11. the following regressions are runwithout a logarithmic transformation
Xj, = <(., -f .t.^^,, + 8., . and
n., = <\,^ + ^jA^, + i.,.
After ( 2 and tji are estiinated. a;in (13) is approximated by <i>2{Sj/Xj) anddj^in (14)_is approximatedby <lj2(Xy/7Ij) where Sj. Xj. and iI denote the 20-year average values of S,,, Xj,. and Jlj,.
•' Lev [16] uses the annual sales as a proxy for the units produced and^sold.* In his examination of the assumption of stationarity. Lev [16] compares the estimates from
regressions for tbe whole period and a subperiod and concludes tbat tbe differences in estimatedcoefficients are minimal. He does not use any statistical test to support his findings.
' When those firms that did not pass the Chow-Fisher test were excluded from our sample, wefound tbat tbe overall results did not improve much from wbat is reported in tbe empirical portion ofthis paper.
51
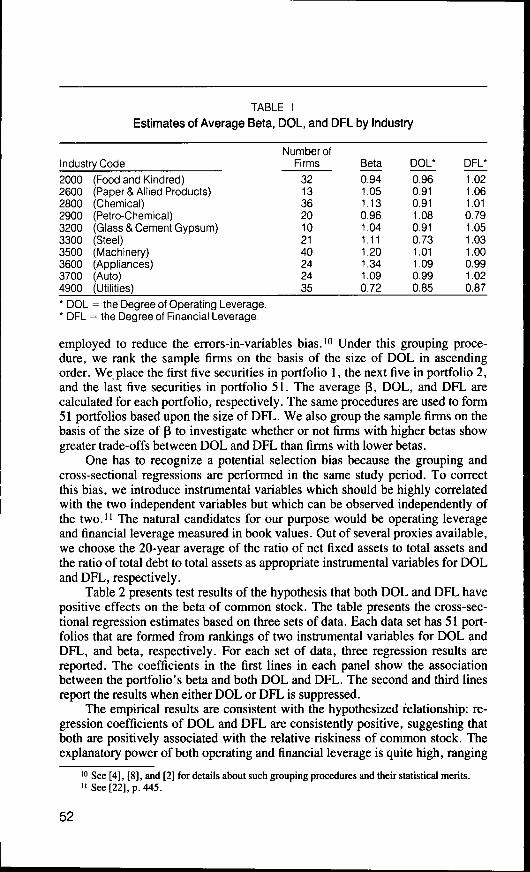
TABLE 1
Estimates of Average Beta, DOL, and DFL by Industry
Industry Code
2000260028002900320033003500360037004900
(Food and Kindred)(Paper & Allied Products)(Chennical)(Petro-Chemical)(Glass & Cement Gypsum)(Steel)(Machinery)(Appliances)(Auto)(Utilities)
Number ofFirms
32133620102140242435
Beta
0.941.051.130.961.041.111.201.341.090.72
DOL*
0.960.910.911.080.910.731.011.090.990.85
DFL*
1.021.061.010.791.051.031.000.991.020.87
* DOL = the Degree of Operating Leverage.* DFL = the Degree of Financial Leverage.
employed to reduce the errors-in-variables bias.'" Under this grouping proce-dure, we rank the sample firms on the basis of the size of DOL in ascendingorder. We place the first five securities in portfolio 1, the next five in portfolio 2,and the last five securities in portfolio 51. The average p, DOL, and DFL arecalculated for each portfolio, respectively. The same procedures are used to form51 portfolios based upon the size of DFL. We also group the sample firms on thebasis of the size of P to investigate whether or not firms with higher betas showgreater trade-offs between DOL and DFL than firms with lower betas.
One has to recognize a potential selection bias because the grouping andcross-sectional regressions are performed in the same study period. To correctthis bias, we introduce instmmental variables which should be highly correlatedwith the two independent variables but which can be observed independently ofthe two." The natural candidates for our purpose would be operating leverageand financial leverage measured in book values. Out of several proxies available,we choose the 20-year average of the ratio of net fixed assets to total assets andthe ratio of total debt to total assets as appropriate instmmental variables for DOLand DFL, respectively.
Table 2 presents test results of the hypothesis that both DOL and DFL havepositive effects on the beta of common stock. The table presents the cross-sec-tional regression estimates based on three sets of data. Each data set has 51 port-folios that are formed from rankings of two instmmental variables for DOL andDFL, and beta, respectively. For each set of data, three regression results arereported. The coefficients in the first lines in each panel show the associationbetween the portfolio's beta and both DOL and DFL. The second and third linesreport the results when either DOL or DFL is suppressed.
The empirical results are consistent with the hypothesized relationship: re-gression coefficients of DOL and DFL are consistently positive, suggesting thatboth are positively associated with the relative riskiness of common stock. Theexplanatory power of both operating and financial leverage is quite high, ranging
'" See [4], [8], and [2] for details about such grouping procedures and their statistical merits." See [22], p. 445.
52

from 38 percent to 48 percent. The bottom two panels of Table 2 present a sum-mary of results of the regressions without introducing instrumental variables.The estimates of DOL and DFL from (13) and (14) are used for ranking commonstocks in the sample, as discussed earlier. Observe that the overall results aresimilar to those obtained by using instrumental variables. The values of R^ aresmaller than those reported in the top two panels.
TABLE 2
Regression Results at Portfolio LevelIn Pp = 7o + 71 In DOLp + 721" DFLp + ep
1. Portfolios Formed Based upon Rankingsof instrumentai Variable for DOL
ii. Portfoiios Formed Based upon Rani<ingsof Instrumentai Variabie for DFL
iii. Portfoiios Formed Based upon Rani<ingsof Beta
iV. Portfoiios Formed Based upon Rankingsof DOL
.09{4.23)t
.06(2.35)*
.07(3.37)t
.09(4.58)t
.07(3.21 )t
.06(3.29)t
.12(3.87)t
.07(1.87)*
.07(2.23)t
.07(4.53)t
.06(4.12)t
.05(3.35)t
.32(2.50)t
.35(2.17)*
_
.37(3.37)t
.41(3.25)t
_
.73(3.80)t
.69(2.82)t
_
.14(3.06)t
.11(2.61)t
•y2
1.30(5.47)t
_
1.33(5.31 )t
.94(4.10)t
_
1.00(3.99)t
1.98(5.62)t
1.93(4.86)t
.37(1.71)*
_
.16( .73)
.43
.09
.36
.38
.17
.24
.48
.14
.33
.17
.12
.01
F-statistic
18.70t
4.72*
28.15t
15.33t
10.56t
15.96t
22.28t
7.97t
23.66t
4.99*
6.811
.53
12.26t
.13
23.05t
V. Portfolios Formed Based upon Rankings .07 .14 4.32 .34of DFL (4.26)t (1.15)t (4.93)t
.04 - .05 - .003(2.32)* ( .37)
.06 - .40 .32(4.25)t (4.80)t
Figures in parentheses are t-vaiues.t Statisticaiiy significant at a = 1 percent.* Statistically significant at a = 5 percent.
From Panel iV of Table 2, we note that DOL shows a higher explanatorypower relative to DFL, 12 percent versus 1 percent, when the magnitude of DOLis used for rankings of common stocks to form portfolios. On the other hand, the
53

regression results in the last panel show that DFL demonstrates much higher ex-planatory power than does DOL, 32 percent versus 0.3 percent, when the magni-tude of DFL is used for rankings of common stocks to form portfolios. Consider-ing the ranking method employed, it is not surprising. For example, whenranking is done according to DFL, we have 51 portfolios, each with variouslevels of DOL. Therefore, when DOL is used as an independent variable in theregression, we would indeed expect it to have a small explanatory power. A sim-ilar phenomenon would be observed when ranking is done on the basis of DOLwhile DFL is used as an independent variable in the regression. As reported inthe top two panels of Table 2, however, the same phenomena do not occur wheninstrumental variables are used for rankings of common stocks. When regressioncoefficients are estimated using 51 portfolios formed based upon rankings ofbeta, we find that DFL alone can explain as much as 33 percent of cross-sectionalvariation of betas and DOL alone explains 14 percent,'^ Because of limited data,we have not included an independent variable representing the intrinsic businessrisk of common stock. The estimates of the intercept that are significant in allregressions appear to capture the infiuence of this omitted variable. Furthermore,the intercept's estimates seem to be stable from one regression to another.
C. Tests of the Trade-Off Hypothesis between Operating Leverage andFinancial Leverage
The second hypothesis to be examined is the relationship between DOL andDFL. It has been proposed in the literature that management tries to stabilize thelevel of the beta of common stock. Frequent changes in the beta of commonstock, so it is argued, impose transaction costs on stockholders because they haveto rebalance their portfolios to maintain them at a desired level of risk. The de-gree of operating leverage is an important factor to be considered in the firm'sasset structure decisions. By changing from a labor-intensive manufacturing pro-cess to a capital-intensive one, a significant change would occur in the cost struc-ture of the firm. A rise in fixed costs and a simultaneous decline in variable costper unit increase the degree of operating leverage and thereby increase the rela-tive riskiness of common stocks. However, the firm's decision on the operatingleverage can be offset by its decision on its financial leverage. To save portfoliorevision costs to the stockholders, the two types of leverage can be chosen so thatchanges in the level of beta are minimized. If the level of intrinsic business risk isconstant, a change in DOL can be offset by a change in DFL and vice versa.Therefore, one would expect a cross-sectional negative correlation between DOLand DFL.
'2 When the cross-sectional regression is performed at the level of the individual firm, the fol-lowing results are obtained
Pj = ,05 + ,14Ln DOL,. + ,44Ln DFL_. R^ = ,1081
(3-3O)| (3,13) |, (4.92)
where figures in parentheses are t-values. They are statistically significant at a = 1 percent. Thesmaller R ^ reported for the regression can be attributed to measurement errors of variables at the levelof the individual firm,
54

Tahle 3 presents the estimated correlation coefficients for the 51 portfoliosformed from rankings of operating leverage, financial leverage, and heta, respec-tively. As expected, we observe consistent negative correlations hetween DOLand DFL. Negative correlations are particularly pronounced when either operat-ing leverage or financial leverage is used for ranking. The respective correlationsare pCDOL , DFL^) = - .30 and - .32 for the whole sample. These correla-tions are significant at a = 1 percent. When portfolios are formed on the basis ofthe rankings of beta, we observe a negative and nonsignificant correlation be-tween the two types of leverage, p(DOLp,DFLp) = - .05, for the whole sam-ple. To investigate why this happens, we divide the portfolios into twosubgroups, one group with low betas and another with high betas. It appears thatfirms with high betas engage in trade-offs more actively than do firms with lowbetas.
OperatingLeverage
FinancialLeverage
Beta
Low
High
Whole
Low
High
Whole
Low
High
Whole
TABLE 3Test Results of the Trade-off Hypothesis
Number ofPortfolios
25
26
51
25
26
51
25
26
51
Beta
1.02[10]
1.09[.11]
1.06[.11]
1.00[.12]
1.10[10]
1.06[.12]
.85[.14]1.25[.17]
106[.25]
DOL
.73[.17]
1.16[21]
.95[28]
.97[.10]
.93[13]
.95[.11].89
[•10]
1.00[14]
.95[13]
DFL
.99[.07].97
[06]
.98[.06]
.88[13]
1.08[.08]
.98[.14]
.94[.06]
1.01[.06]
.98[.07]
p(DOLp,DFLp)
-.26(1.26)
-.23(1.18)
-.30(2.19)t
-.32(1.61)#
-.31(1.59)#
-.32(2.39)t
- .08( .37)
-.49(2.73)t
-.05( -35)
Figures in parentheses are t-values.t Statistically significant at a = 1 percent.# Statistically significant at a = 10 percent.Figures in brackets are cross-sectional standard deviations.
The average DOL and DFL of the two subgroups also provide some evi-dence of balancing activities between the degrees of two types of leverage. Forportfolios formed based upon rankings of DOL, it appears that low DOL is com-bined with high DFL, .73 versus .99, and vice versa, 1.16 versus .97. The same
55

trend can be observed for portfolios formed from rankings of DFL. Low DFL iscombined with high DOL, .88 versus .97, and vice versa, 1.08 versus .93.
III. Summary
The unique aspect of this study is its explicit introduction of the degrees ofoperating leverage and financial leverage in investigating the joint impact of bothasset structure and capital structure on systematic risk. In this study, we recog-nize the role of DOL and DFL in magnifying the intrinsic business risk of com-mon stock. This study isolates the degree of operating leverage from operatingrisk to highlight the joint impact of DOL and DFL on the systematic risk of com-mon stock and to test the trade-off hypothesis between the two.
Our empirical findings suggest that the degrees of operating and financialleverage explain a large portion of the variation in beta. The conjecture that firmsengage in trade-offs between DOL and DFL seems to have gained strong empiri-cal evidence in our study. We found a significant correlation between the twotypes of leverage.
If corroborated by future studies, these findings may help us in prediction ofcorporate behavior. For example, a new technological breakthrough that requiresnew capital investment, shifting the firm to a higher degree of operating lever-age, may signal an offsetting shift in the degree of financial leverage. The find-ings of this study also may clarify to management that indeed such a policy iswidely followed and may help it understand why it is so. Corporate managersthen will have to sacrifice less of their time pondering it. Another practical meritof this study is that it can help us in formulating prediction models for the betasof common stock and the firm. Given the significant joint impact of the two typesof leverage, beta forecasting models can be improved in accuracy.
There are many issues to which this study and follow-up studies in this di-rection may contribute to our understanding of corporate financing and invest-ment decisions. We are engaged in examining further aspects of the issues. Onedirection we are pursuing is to introduce the instrinsic business risk of commonstock into the empirical model along with DOL and DFL. Another direction is aninvestigation of changes over time in both DOL and DFL and the relationshipbetween the two changes. A further investigation is warranted on changes of betaover time and corresponding changes in the degrees of operating and financialleverage.
References[1] Ball. R.. and P. Brown. "Portfolio Theory and Accounting." Journal of Accounting Re-
search. Vol. 7 (Autumn 1969), pp. 300-323.
[2] Beaver. W. H.; P. Kettler; and M. Scholes. "The Association between Market-Determinedand Accounting-Determined Risk Measures." The Accounting Review. Vol. 45 (October1970). pp. 654-682.
[3] Beaver. W. H.. and J. Manegold. "The Association between Market-Determined and Ac-counting-Determined Measures of Systematic Risk: Some Further Evidence." Journal of Fi-nancial and Quantitative Analysis. Vol. 10 (June 1975). pp. 231-284.
56

[4] Black, F.; M. C. Jensen; and M. Scholes. "The Capital Asset Pricing Model: Some EmpiricalTests." In Studies in the Theory of Capital Markets, M. C. Jensen, ed. New York: Ptaeger(1972).
[5] Brenner, M., and S. Schmidt. "Asset Characteristics and Systematic Risk." Financial Man-agement, Vol. 7 (Winter 1978), pp. 33-39.
[6] Chance, D. M. "Evidence on a Simplified Model of Systematic Risk." Financial Manage-ment, Vol. 11 (Autumn 1982), pp. 53-63.
[7] Chow, G. C. "Tests of Equality between Sets of Coefficients in Two Linear Regressions."Econometrica, Vol. 28 (July 1960), pp. 591-605.
[8] Fama, E. F.,and J. D. MacBeth. "Risk, Retum, and Equilibrium: Empirical Tests." Journatof Political Economy, Vol. 81 (May-June 1973), pp. 607-636.
[9] Fisher, F. M. ' 'Tests of Equality between Sets of Coefficients in Two Linear Regressions: AnExpository Note." Econometrica, Vol. 38 (March 1970), pp. 361-366.
[10] Foster, G. Financial Statement Analysis, 1st Ed. Englewood Cliffs, NJ: Prentice-Hall, Inc.(1978).
[11] Gahlon, J. M., and J. A. Gentry. "On the Relationship between Systematic Risk and theDegree of Operating and Financial Leverage." Financial Management, Vol. 11 (Summer1982), pp. 15-23.
[12] Gonedes, N. J. "Evidence on the Information Content to Accounting Numbers: Accounting-Based and Market-Based Estimates of Systematic Risk." Journal of Financial and Quantita-tive Analysis, Vol. 8 (June 1973), pp. 407-444.
[13] Hamada, R. S. "The Effects of the Firm's Capital Structure on the Systematic Risk of Com-mon Stocks, "yourna/o/fmance. Vol. 27 (May 1972), pp. 435-452.
[14] Hill, N. C , and B. K. Stone. "Accounting Betas, Systematic Operating Risk, and FinancialLeverage: A Risk-Composition Approach to the Determinants of Systematic Risk." Journal ofFinancial and Quantitative Analysis, Vol. 15 (September 1980), pp. 595-637.
[15] Ismail, B. E., and J. G. Louderback. "Operating and Satisfying in Stochastic Cost-Volume-Profit Analysis." Decision Sciences, Vol. 10 (April 1979), pp. 205-217.
[16] Lev, B. "On the Association between Leverage and Risk." yo«r«a/o/f"mancia/and QuanH-tative Analysis, Vol. 9 (September 1974), pp. 627-642.
[17] Modigliani, F. F., and M. H. Miller. "The Cost of Capital, Corporation Finance, and theTheory of Investment." American fconomic Review. Vol. 48 (June 1958),pp. 261-297.
[18] "Taxes and the Cost of Capital: A Correction." American EconomicReview, Vol. 53 (June 1963), pp. 433-444.
[19] Myers, S. C. "The Relation between Real and Financial Measures of Risk and Retum." InRisk and Return in Finance, I. Friend and J. L. Bicksler, eds. Cambridge: Ballinger Publish-ing Company (1977).
[20] Rubinstein, M. E. "A Mean-Variance Synthesis of Corporate Financial Theory." Journal ofFinance, Vol. 28 (March 1973), pp. 167-182.
[21] Shih, W. "A General Decision Model for Cost-Volume-Profit Analysis under Uncertainty."Accounting Review, Vol. 54 (October 1979), pp. 687-706.
[22] Theil, H. Principles of Econometrics. New York: John Wiley & Sons, Inc. (1971).
[23] Thompson, D. J. "Sources of Systematic Risk to Common Stocks." Journat of Business,Vol. 49 (April 1976), pp. 173-188.
[24] Van Home, J. C. Financial Management and Policy, 4th Ed. Englewood Cliffs, NJ: Prentice-Hall, Inc. (1977).
57