Embed Size (px)
Citation preview

The earthquake catalog of Japan tells a lotThe earthquake catalog of Japan tells a lot
(about natures of the earthquake)
Nobuo Hamada Japan Meteorological Agency

Earthquake catalog of instrumentally Earthquake catalog of instrumentally located earthquake over 80 years periodlocated earthquake over 80 years period(1923(1923--present, CMO, JMA & other organization)present, CMO, JMA & other organization)
Network uniformly covered Japan.Continuously operational throughout the period.Seismographs with similar response.All the phase data is in digital now.Repeatedly revised on the basis of the up to date knowledge of seismology

Yearly Number of Located EarthquakeYearly Number of Located Earthquake
1
10
100
1000
10000
100000
10000001923
1928
1933
1938
1943
1948
1953
1958
1963
1968
1973
1978
1983
1988
1993
1998
2003
Total Number
M≧3
M≧4
M≧5
M≧6

TopicsTopicsRelation between asperity distribution and aftershock activity ( viewing from magnitude frequency distribution of aftershocks) Variation of seismicity in the earthquake cycle (Preparatory, plecusory,aftershocksand post earthquake seismicity change)Precursory activities found before big earthquakes

After shocks of M8 After shocks of M8 class class earthquakesearthquakes
M
(One month period)Off ridge plate
Subducting slab
Cumulative Number
M>6

1923Kanto1923Kanto EarthquakeEarthquakeSourceSource isis nearnear thethe collisioncollision plateplate boundaryboundary

1938Off1938Off Fukushima(M7.5,7.Fukushima(M7.5,7.44,,・・・・・・))(7 major earthquakes associated with tsunamis.)
Subduction of seamounts would make complicated asperities along the plate interface.

InIn CaseCase ofof ShallowShallow InlandInland EarthquakeEarthquakeLarge difference in numbers of aftershock of Inland EarthquakesLarge difference in numbers of aftershock of Inland Earthquakes

2004Niigata2004Niigata--Chubu EarthquakeChubu EarthquakeLarge number of aftershocks is attributed to multiple faults.
(Similar process are expected for the case of the 1943 Tottori(M7.2) and the 1945 Mikawa(M6.8) earthquakes)
Aoki et al. (2006)
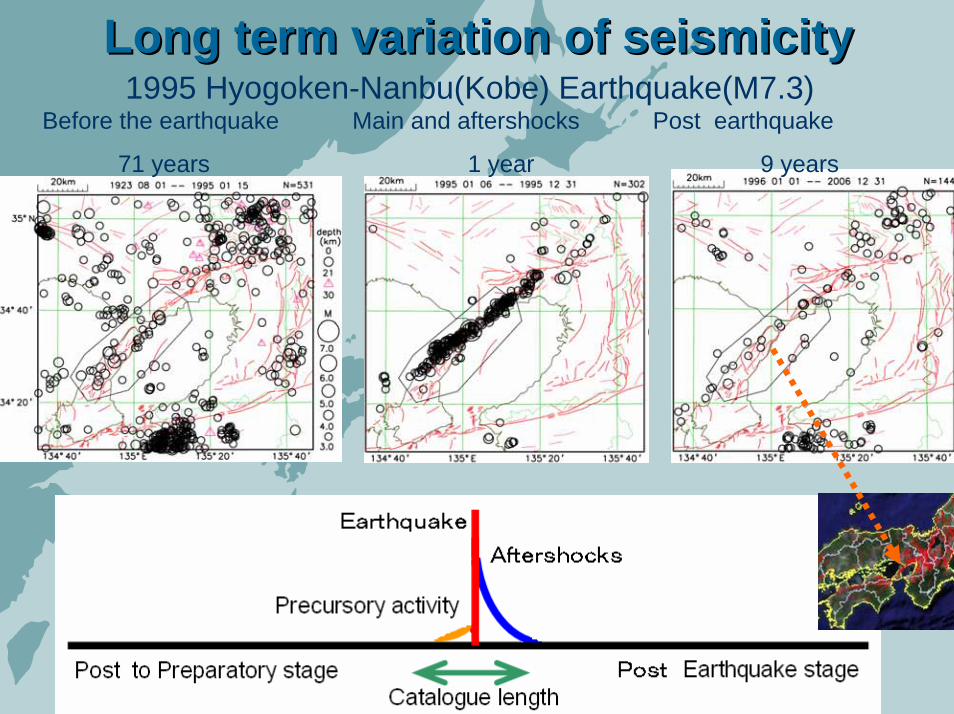
Long term variation of Long term variation of seismicityseismicityBefore the earthquake Main and aftershocks Post earthquake
71 years 1 year 9 years
1995 Hyogoken-Nanbu(Kobe) Earthquake(M7.3)

Long term variation of Long term variation of seismicityseismicity( historical event, ( historical event, 1858 Hi1858 Hi--EtsuEtsu Earthquake(M6.9)Earthquake(M6.9)
Micro-earthquakes are still present 140 years after the earthquake.(1997-)
Seismicity level is much lower than the case of Kobe for 60 years. (1923-1980)
M6.9,1858
Atotsugawa-Fault

Long term variation of Long term variation of seismicityseismicity( ( MatsushiroMatsushiro Earthquake Swarm Earthquake Swarm 19651965--19671967))
Activity is almost completely faded out in the core region of the swarm.
Initial stage
(1965Aug-1966Feb.)
Most Active Period
(1966Mar-Oct)
30years later
(1998-)

Quiescence before the earthquakeQuiescence before the earthquake
quiescenceHundreds years of seismicity &
20 years of quiescence
1994 S-Hyogo
M>3

Rise of Rise of seismicityseismicity before the earthquakebefore the earthquake2000 W-Tottori
Quiescence ? riseM>3
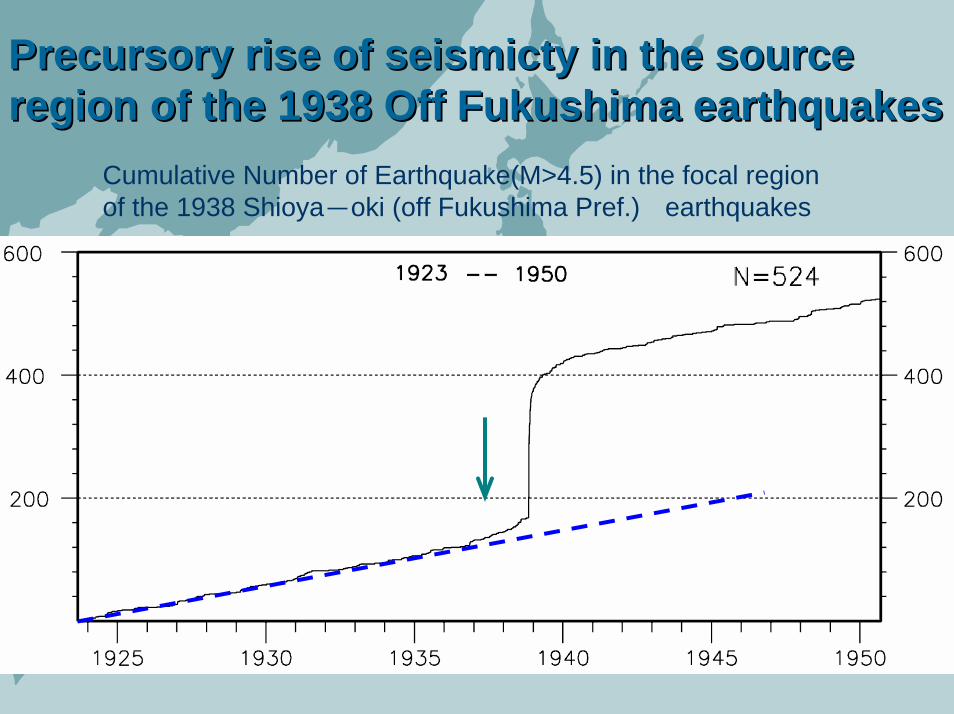
Precursory rise of Precursory rise of seismictyseismicty in the source in the source region of the 1938 Off Fukushima earthquakesregion of the 1938 Off Fukushima earthquakes
Cumulative Number of Earthquake(M>4.5) in the focal regionof the 1938 Shioya-oki (off Fukushima Pref.) earthquakes

ResumeResume
Intense aftershock occurrence is related to complicated source process and asperities.Various stages of seismicity in the earthquake cycle can be found.Various preparatory or precursory changes of seimsicity before major earthquake are also included. Waveforms observed at around10:35 Waveforms observed at around10:35 in Oct.09,2006 in Oct.09,2006 by the JMA networkby the JMA network
The earthquake catalog of Japan tells a lotThe earthquake catalog of Japan tells a lot

Waveforms observed at around10:35 in Oct.09,2006 Waveforms observed at around10:35 in Oct.09,2006 by the JMA networkby the JMA network
Original High-Pass Filter(5Hz>)Theoretical travel time
curves for P and S waves are indicated in the figures, based on the JMA standard velocity model.
Assumed hypocenterNorth 41.2゜East 129.2゜depth 0km