Embed Size (px)
Citation preview

The impact of the assimilation of altimeters and ASAR L2 wave data in the wave model MFWAM
Lotfi Aouf 1, Jean-Michel Lefèvre 1
1) Météo-France, Toulouse
12th Wave Hindcasting and Forecasting, Big Island 3 November 2011
Motivation
Assessement of the assimilation system in the new wave modelMFWAM (improving the wave forecast)
Satellite wave observations (Jason-1,Jason-2, Envisat Ra2 and ASAR, Cryosat-2) are available and are very helpful to correct the model errors
Preparation to future satellite missions CFOSAT, Altika, Jason3) complementary use of different instruments

Assimilation of satellite data (Altimeters, SAR) to improve Off shore Sea-state analyses and predictions Provide more accurate boundary conditions to coastal wave models
ENVISAT ASAR (only long waves are detectedif travelling in the azytmutal direction) MFWAM (3G global Model)
Differences between wave directions from model and observation (ENVISAT/ASAR)Simple OI scheme is used to correct the model mean wave direction, energy and frequencythen the model wave spectrum is corected according to the new mean parameters
Altimeter data (from ENVISAT and JASON) are also used to correct the energy spectra
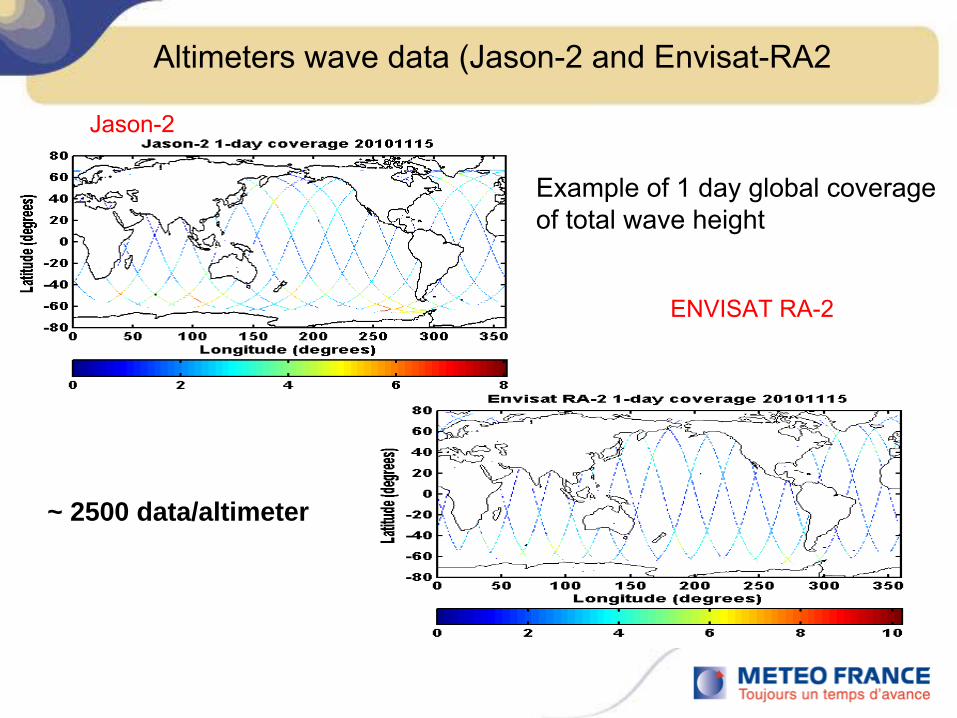
Jason-2
ENVISAT RA-2
Altimeters wave data (Jason-2 and Envisat-RA2
Example of 1 day global coverageof total wave height
~ 2500 data/altimeter

Methodology
1-
Implementation of the assimilation system
-
Preparation of the wave data
: Quality control procedure
-
The assimilation technique (distribution of covariance errorsof model and observation, partitioning and optimal interpolation)
2-
Investigating different scenarios of assimilation runs (altimetersor directional wave spectra) quantifying the contribution of each instrument
3-
Validation with independent wave data
--> How efficient the assimilation is
--> The contribution of each instrument for the impact
--> positive impact of the assimilation in case of highwaves (huricane season 2011)
--> Ways to optimize the assimilation system
Conclusions

Belharra wave
Meteo-France is responsible for issuing marine forecasts (wind and sea-state) at national level (Safety of people and goods, Navy, …) and international level (GMDSS: Global Maritime Distress and Safety System)
Setting a new warning system for coastal innundation and high waves
Need for improving global and coastal wave predictions
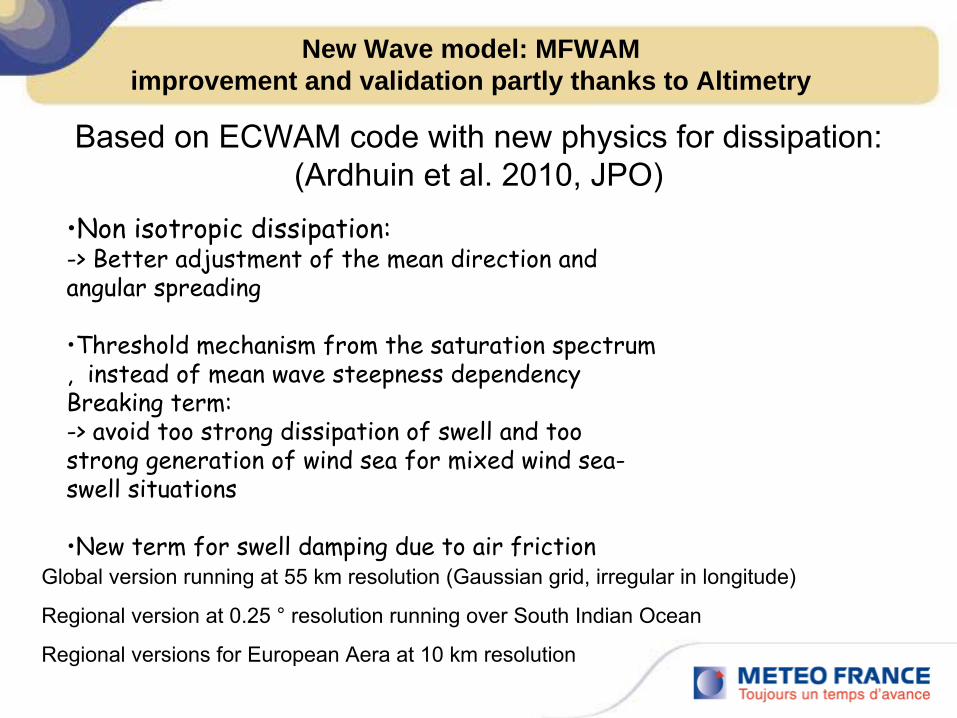
New Wave model: MFWAM improvement and validation partly thanks to Altimetry
Based on ECWAM code with new physics for dissipation: (Ardhuin et al. 2010, JPO)
•Non isotropic dissipation: -> Better adjustment of the mean direction and angular spreading
•Threshold mechanism from the saturation spectrum , instead of mean wave steepness dependency Breaking term: -> avoid too strong dissipation of swell and too strong generation of wind sea for mixed wind sea-
swell situations
•New term for swell damping due to air frictionGlobal version running at 55 km resolution (Gaussian grid, irregular in longitude)
Regional version at 0.25 °
resolution running over South Indian Ocean
Regional versions for European Aera at 10 km resolution

Courtesy of C
LS
The ASAR level 2 wave mode provides:
• Quality control procedure for ASAR wave spectra has been assessedin our previous studies (Aouf et al. 2008) (Threshold intervals for signalparameters ratio of signal to noise (3<r <30), normalised variance of ASAR imagettes (1-1.6))
•
Use of a variable cut-off for SAR wave spectra depending on the azimuthal cut-off, the orbit track angle and the wave direction from the model
ASAR wave spectrum (before cut-off) After using variable cut-off
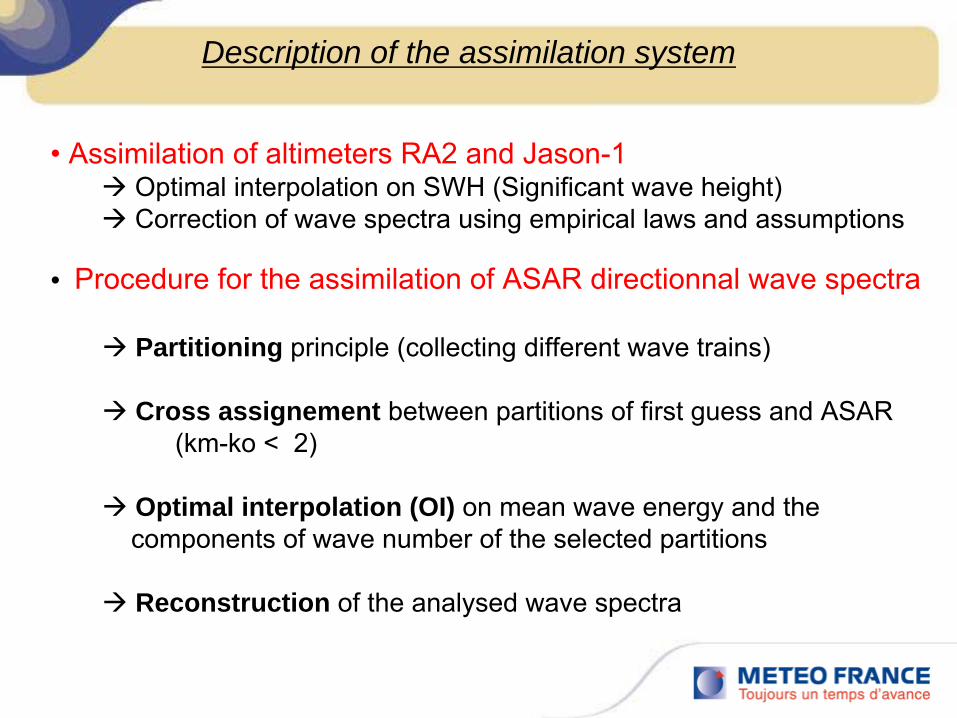
Description of the assimilation system
• Procedure for the assimilation of ASAR directionnal wave spectra
Partitioning principle (collecting different wave trains)
Cross assignement between partitions of first guess and ASAR(km-ko < 2)
Optimal interpolation (OI) on mean wave energy and thecomponents of wave number of the selected partitions
Reconstruction of the analysed wave spectra
• Assimilation of altimeters RA2 and Jason-1 Optimal interpolation on SWH (Significant wave height) Correction of wave spectra using empirical laws and assumptions
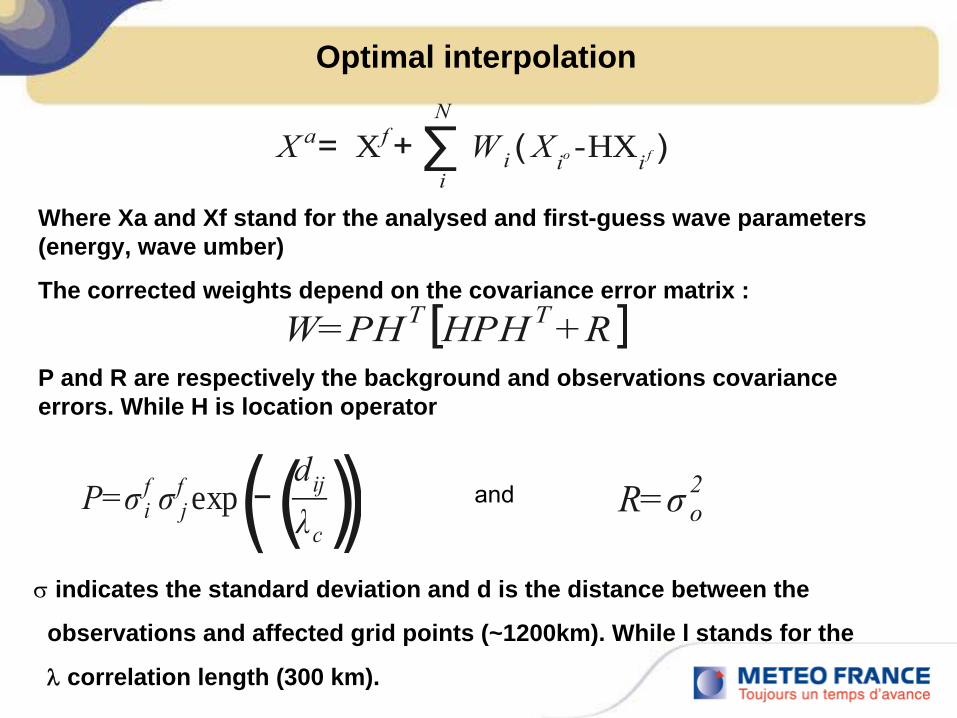
Where Xa and Xf stand for the analysed and first-guess wave parameters (energy, wave umber)
The corrected weights depend on the covariance error matrix :
P and R are respectively the background and observations covariance errors. While H is location operator
X a= Xf+∑i
N
Wi (Xio -HXi f )
W=PHT [HPHT+R ]
P=σ if σ jf exp(−(dijλc)) R=σ o
2and
Optimal interpolation
indicates the standard deviation and d is the distance between the
observations and affected grid points (~1200km). While l stands for the
correlation length (300 km).

EXP1 : Assimilation of ASAR wave spectra and altimeters Ra-2
and Jason-2
EXP2 : Assimilation ASAR wave spectra and altimeter Ra-2
EXP3 : Assimilation ASAR wave spectra only
EXP4 : Assimilation altimeters RA2 and Jason-2 only
Baseline run without assimilation
Description of runs : from Sep 2010 to Mar 2011(7 months)
• Test runs set-up-
Wave model MFWAM 441
(global coverage 0.5x0.5° irregular grid), wave spectrum in 24 frequencies (starting 0.035 Hz) et24 directions
-
ECMWF analysed winds every 6 hours-
Assimilation timestep 6 hours

Location of common Automatic Weather Stations AWS (wind + waves), all real time and on GTS
Most AWS located not very far from the coast and mainly in the northern hemisphere
partial model validation

VALIDATION OF EXP1 WITH BUOY DATA(buoy data not assimilated)

Bias = -0.03SI = 14.2%NRMS = 14.3%Slope = 0.98Intercept = 0.02
MFWAM with assimilation of both altimeters and ASAR(jason-2, Envisat-Ra2 and ASAR)
validation with Buoys data Sep 2010 tomarch 2011(7 months)
Bias=-0.02SI=15.6%NRMS=15.6%Slope=1.02Intercept=-0.08
Significant waveheight
Collected = 64880
With assimilation Without assimilation

Validation of the assimilation for mean period vs Buoy 51002
Bias=0.24RMSE=8%SI=7.5%Slope=1.04Intercept=0.36
Bias=0.38RMSE=8.8 %SI=8.24 %Slope=0.84Intercept=2.04
January 2011

VALIDATION OF EXP2 WITH JASON-2(Jason-2 data not assimilated
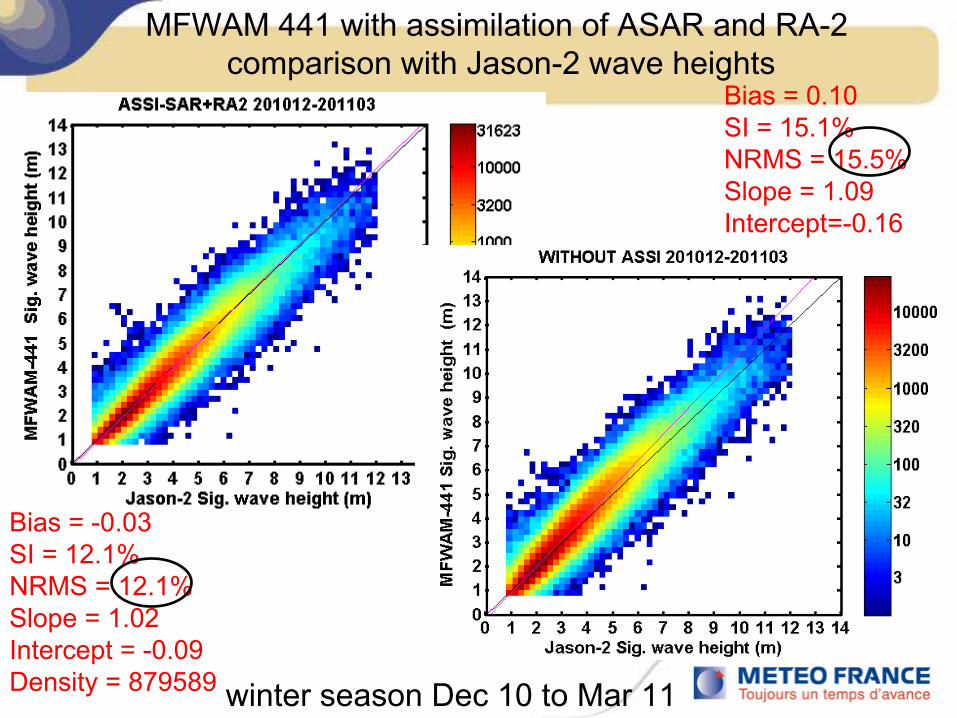
Bias = 0.10SI = 15.1%NRMS = 15.5%Slope = 1.09Intercept=-0.16
MFWAM 441 with assimilation of ASAR and RA-2comparison with Jason-2 wave heights
winter season Dec 10 to Mar 11
Bias = -0.03SI = 12.1%NRMS = 12.1%Slope = 1.02Intercept = -0.09Density = 879589
COMPARISON EXP2 VS EXP1REGARDING TO BUOYS

1 2 30
2
4
6
8
10
12
14
16
18
20
Comparison between EXP1 and EXP2 (Ra-2+ASAR)Validation with Buoys (Sig. Wave Height)
The assimilation index (%
)
: Reduction
of the NR
MS
E
1
: High latitudes North Atlan ||>50°2
: Intermediate basin 20°<||<50°3
: Tropics ||<20°
6.4%9.3%
2.8%
6.5%9.1%
17.5%
Sep 2010 to Mar 2011
EXP1: JA2+RA2+ASAR
EXP2:RA2+ASAR
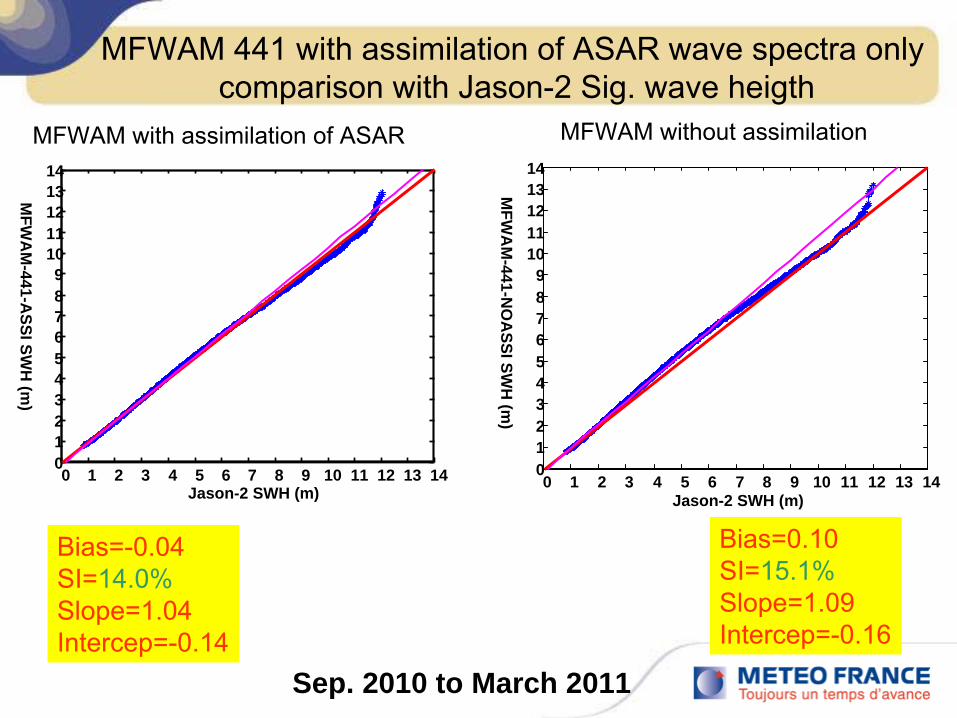
MFWAM 441 with assimilation of ASAR wave spectra onlycomparison with Jason-2 Sig. wave heigth
0 1 2 3 4 5 6 7 8 9 10 11 12 13 140123456789
1011121314
Jason-2 SWH (m)
MFW
AM
-441-ASSI SW
H (m
)
Bias=-0.04SI=14.0%Slope=1.04Intercep=-0.14
Bias=0.10SI=15.1%Slope=1.09Intercep=-0.16
0 1 2 3 4 5 6 7 8 9 10 11 12 13 140123456789
1011121314
Jason-2 SWH (m)
MFW
AM
-441-NO
ASSI SW
H (m
)
Sep. 2010 to March 2011
MFWAM with assimilation of ASAR MFWAM without assimilation

Impact of the assimilation of Altimeters and ASAR wave dataPeriod of forecast
Positive impact for the significant wave height
1 is 0-24h average period, 2 is 24-48h,….Comparison with Jason-2 and Envisat Ra-2 in the period of forecast
RM
SE
evolution after4-day forecast
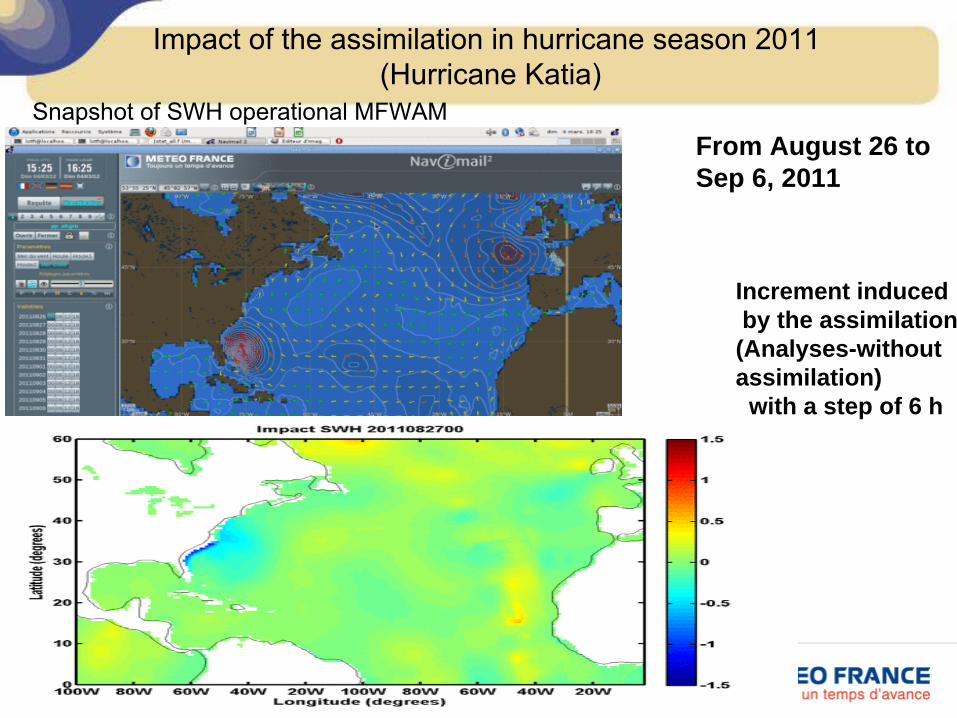
Impact of the assimilation in hurricane season 2011(Hurricane Katia)
From August 26 to Sep 6, 2011
Increment inducedby the assimilation(Analyses-withoutassimilation)with a step of 6 h
Snapshot of SWH operational MFWAM

Impact of the assimilation in case of hurricanesvalidation of SWH with Jason-2
Bias=-0.02SI=13.3%Slope=1.06Intercep=-0.19
Bias=0.11SI=14.6%Slope=1.12Intercep=-0.23
Forecast 24hours of the operational MFWAM with assimilation
Analyses of MFWAM without assimilation
Aug. 26 to Sep. 6, 2011
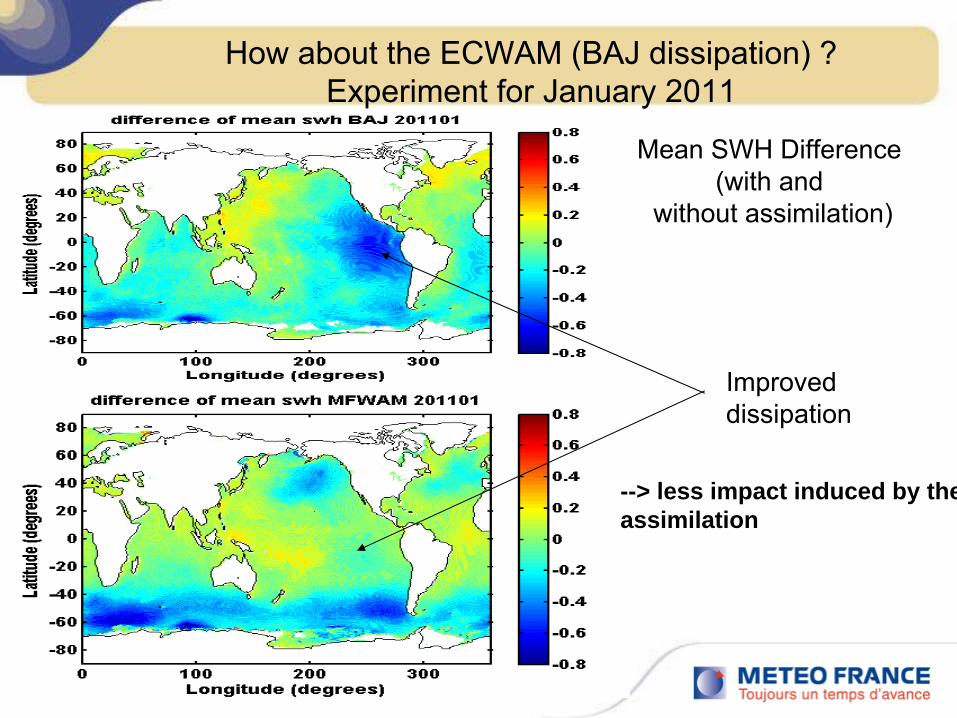
How about the ECWAM (BAJ dissipation) ?Experiment for January 2011
Mean SWH Difference (with and
without assimilation)
Improved dissipation
--> less impact induced by theassimilation

Conclusions and future works
The assimilation of altimeters Ra-2 and Jason-2 and ASAR wavein MFWAM spectra reveals a significant positive impact (in both forecast
and analysis periods).
Improvment of the assimilation scheme : use of correlation length depending on the wavelength of dominant wave trains, optimization of the correlation error functions
The assimilation system is already operational at MF since 17March 2011.
the use of multi source of satellite observations (ASAR+Altimeters) increase the impact (twice stronger in the tropics and intermediate ocean basinsEven with an improved wave model, data assimilation is still useful to improve
the wave forecast (room for model improvments)

The use of different ratio between model and observation error for wave height and components of wave number
Further investigations are needed to evaluate the impact of ASAR L2 wave spectra with the wave model MFWAM-441
Impact studies based on future directionnal spectral data from satellite : SWIM instrument on CFOSAT satellite (Chineese-French program, launch 2015), complementary use with the ASAR
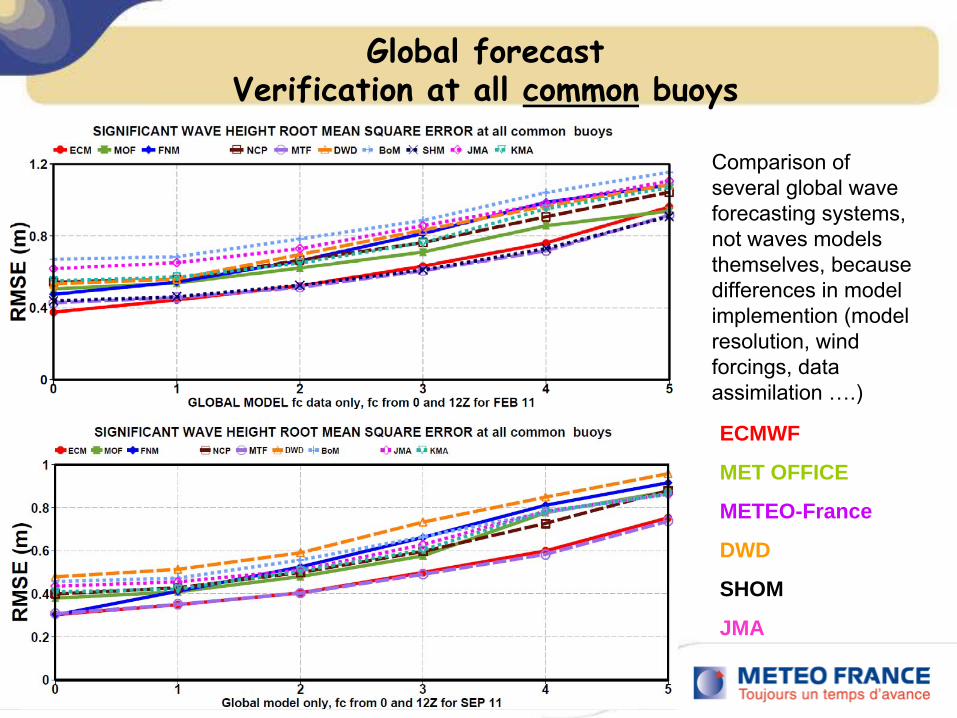
Global forecastVerification at all common
buoys
Comparison of several global wave forecasting systems, not waves models themselves, because differences in model implemention (model resolution, wind forcings, data assimilation ….)
ECMWF
MET OFFICE
METEO-France
DWD
SHOM
JMA

Global forecastVerification at all common
buoys
Comparison of several global wave forecasting systems, not waves models themselves, because differences in model implemention (model resolution, wind forcings, data assimilation ….)
ECMWF
MET OFFICE
METEO-France
DWD
SHOM
JMA