Embed Size (px)
DESCRIPTION
pp. [77-84]
Citation preview

PSAKUIJIR Vol. 4 No. 1 (January-June 2015)
[77]
The Impact of Terms of Trade and its Volatility
on Economic Growth: A Case of ASEAN Countries Patcharaporn Banchorndhevakul*, Dr.June Charoenseang** and Dr.Danupon Ariyasajjakorn***
Abstract
In this paper, the main purpose is to analyze the relationship between terms of trade
and its volatility on economic growth, considering that both net barter and income terms of trade and their volatilities are one of crucial factors to determine growth. By utilizing annual data of ASEAN countries, which are four emerging market economies, for the period 1981-
2010, using Unit root test, Johansen cointegration test, and Impulse response function are discussed to accomplish this study. In this paper, Johansen cointegration technique has been
adopted and found the existence of long run relation between GDP per capita and terms of trade and its volatility in ASEAN. Indonesian results of the level and volatility of net barter and income terms of trade have no effect on economic growth, with some exception of a
moderated effect from income terms of trade on growth. Philippines’ both terms of trade and its volatility leads to an obstacle and a stimulation to real domestic growth, respectively.
Thailand’s results show that an improvement in four types of terms of trade can enhance rea l GDP per capita.
Keywords: Net Barter Terms of Trade, Income Terms of Trade, Volatility, Economic Growth, ASEAN
Introduction
Background of the study
More economic integration will expand the volatility and uncertainty because of the
close association, so the level and volatility in the terms of trade are directly converged or diverged depended on the world export- import prices. In light of this gap, this paper focuses on the empirical relationship between the level and volatility in the terms of trade on
economic growth (real per capita gross domestic product) by considered Indonesia, the Philippines, and Thailand as the representative of ASEAN (the Association of Southeast
Asian Nations) emerging markets using time series data. These three ASEAN countries are small emerging economies which their GDP depends heavily on their export sector. Furthermore, Gross domestic product (GDP) of emerging markets grows continually by
heavily dependent on international trade, so the investigation in an effect of terms of trade on economic growth is beneficial to our nations because of almost 50 percent of GDP volatility
explained by the term of trade variation (Mendoza, 1995, 1997). For the past three decades or more, economic growth of many developing nations is
mainly depended on exports their primary products which prices are much more fluctuated
than the price of manufactured goods. Thanks to the international integration and an assistance of periphery’s government in industrialization, many developing nations have
developed the technological progress in their industrial sector. To obtain larger benefit and economic stability, emerging market economies which used to export their primary commodity to international markets have fostered industrialization and have increased the
* Master’s Student, Faculty of Economics, Chulalongkorn University; Email: [email protected]
** Assistant Professor, Faculty of Economics, Chulalongkorn University
*** Lecturer, Faculty of Economics, Chulalongkorn University

PSAKUIJIR Vol. 4 No. 1 (January-June 2015)
[78]
shares of manufactures in total exports (Figure 1).
Figure 1. Three ASEAN Merchandise export shares (%)
% of Goods Exports: Ores & Metals % of Goods Exports: Manufactures % of Goods Exports: Fuel % of Goods Exports: Food
% of Goods Exports: Agricultural Raw Materials
Terms of Trade and Economic Growth
A number of prior literatures represent that an expansion of the terms of trade are an
important determinants to boosting economic growth. To gain a basic understanding of net barter terms of trade and income terms of trade of each country, some researchers do their empirical evidences on specific countries (for example, Berge et al. 1997; Wong 2004; and
Fatima 2010). Suggestive evidences of Kaneko (2000) and Cakir (2009) in answer to the positive impact of commodity terms of trade on growth exist in their studies.
Terms of Trade Volatility and Economic Growth
According to the essay of Sapsford and Balasubramanyam (1994), the trend and
volatility in the terms of trade must be treated together as ‘twin-pillars’ for avoiding the problem of the less developed countries because export revenues from these countries depend
mainly on primary commodities (but nowadays some countries strongly export components and manufactured goods). Even if Blattman et al. (2004) explain, the secular change is less and less important to account for accumulation and growth than is volatility.
Few decades ago, a large number of researchers take an interest in studying the relationship between level and volatility in the terms of trade and economic growth. Most of
researches which explore the linkage of terms of trade and its volatility on economic growth are using cross-country evidence for considering the trend of many countries. The international trade is an important factor that drives the entire economy from low income
country to become wealthy. In the three past decades, many researchers pay attention at the volatility in the terms of trade as an important factor that influences the economic growth as a
result of the intention to stimulate the GDP. Export and import are the source of extending the economic growth. Numerous cross-country empirical results are confirmed the positive (negative) relationship of terms of trade (volatility) and growth (Basu and McLeod, 1992;
Easterly and Kraay, 2000; Bleaney and Greenaway, 2001; Blattman, Hwang, and Williamson, 2003, 2004, 2007; Turnovsky and Chattopadhyay, 2003; Williamson, 2008;
Mansfield and Reinhardt, 2008; Furth, 2010; Samimi, Sadeghi, and Sadeghi, 2011). The severe effect of the fluctuation in the terms of trade which affected on investor’s decision had led to deteriorated GDP per capita growth.
Most recent work using solely net barter terms of trade to measure terms of trade but this paper uses both net barter terms of trade and income terms of trade to investigated the
PSAKUIJIR Vol. 4 No. 1 (January-June 2015)
[79]
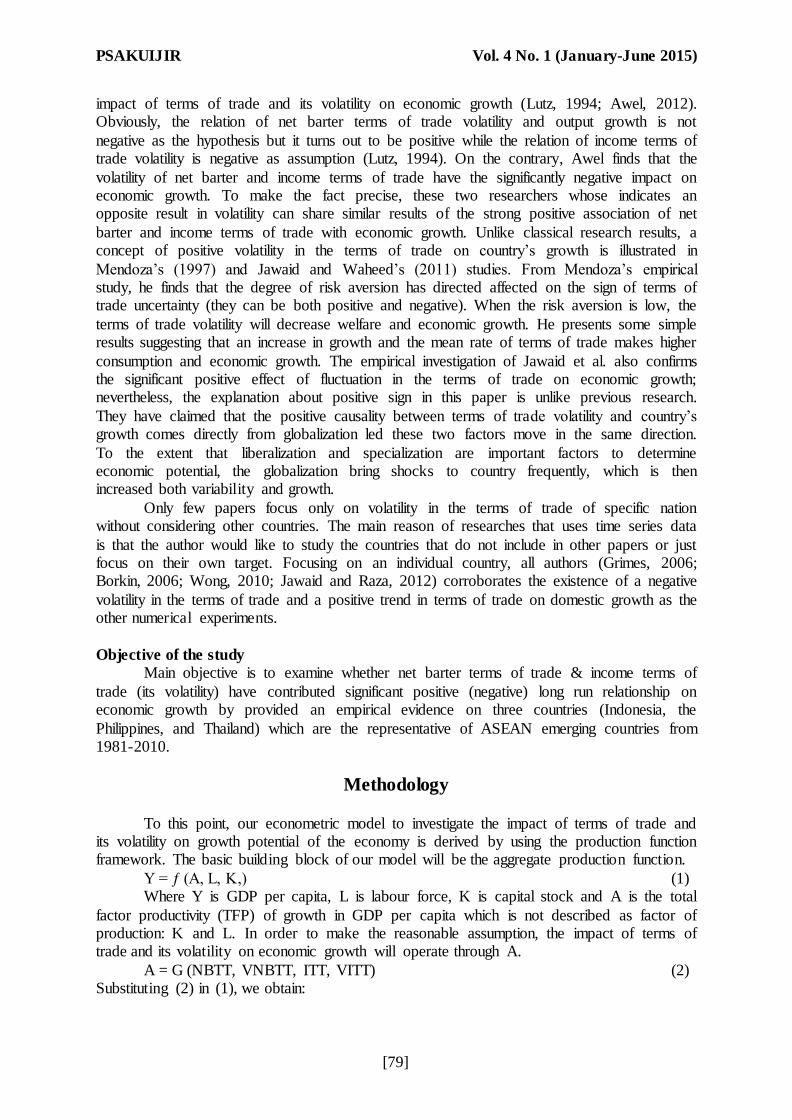
impact of terms of trade and its volatility on economic growth (Lutz, 1994; Awel, 2012). Obviously, the relation of net barter terms of trade volatility and output growth is not
negative as the hypothesis but it turns out to be positive while the relation of income terms of trade volatility is negative as assumption (Lutz, 1994). On the contrary, Awel finds that the
volatility of net barter and income terms of trade have the significantly negative impact on economic growth. To make the fact precise, these two researchers whose indicates an opposite result in volatility can share similar results of the strong positive association of net
barter and income terms of trade with economic growth. Unlike classical research results, a concept of positive volatility in the terms of trade on country’s growth is illustrated in
Mendoza’s (1997) and Jawaid and Waheed’s (2011) studies. From Mendoza’s empirical study, he finds that the degree of risk aversion has directed affected on the sign of terms of trade uncertainty (they can be both positive and negative). When the risk aversion is low, the
terms of trade volatility will decrease welfare and economic growth. He presents some simple results suggesting that an increase in growth and the mean rate of terms of trade makes higher
consumption and economic growth. The empirical investigation of Jawaid et al. also confirms the significant positive effect of fluctuation in the terms of trade on economic growth; nevertheless, the explanation about positive sign in this paper is unlike previous research.
They have claimed that the positive causality between terms of trade volatility and country’s growth comes directly from globalization led these two factors move in the same direction.
To the extent that liberalization and specialization are important factors to determine economic potential, the globalization bring shocks to country frequently, which is then increased both variability and growth.
Only few papers focus only on volatility in the terms of trade of specific nation without considering other countries. The main reason of researches that uses time series data
is that the author would like to study the countries that do not include in other papers or just focus on their own target. Focusing on an individual country, all authors (Grimes, 2006; Borkin, 2006; Wong, 2010; Jawaid and Raza, 2012) corroborates the existence of a negative
volatility in the terms of trade and a positive trend in terms of trade on domestic growth as the other numerical experiments.
Objective of the study
Main objective is to examine whether net barter terms of trade & income terms of
trade (its volatility) have contributed significant positive (negative) long run relationship on economic growth by provided an empirical evidence on three countries (Indonesia, the
Philippines, and Thailand) which are the representative of ASEAN emerging countries from 1981-2010.
Methodology
To this point, our econometric model to investigate the impact of terms of trade and its volatility on growth potential of the economy is derived by using the production function framework. The basic building block of our model will be the aggregate production function.
Y = ƒ (A, L, K,) (1) Where Y is GDP per capita, L is labour force, K is capital stock and A is the total
factor productivity (TFP) of growth in GDP per capita which is not described as factor of production: K and L. In order to make the reasonable assumption, the impact of terms of trade and its volatility on economic growth will operate through A.
A = G (NBTT, VNBTT, ITT, VITT) (2) Substituting (2) in (1), we obtain:

PSAKUIJIR Vol. 4 No. 1 (January-June 2015)
[80]
Y = ƒ (L, K, NBTT, time dummy) (3.1); Y = ƒ (L, K, VNBTT, time dummy) (3.2)
Y = ƒ (L, K, ITT, time dummy) (3.3); Y = ƒ (L, K, VITT, time dummy) (3.4)
Based on a production function framework, the author uses the cointegration model and VECM impulse response to investigate the long run effect of mean terms of trade and its volatility on economic growth. The regression model in this study is specified in the form
below. log Yt = β0 + β1 log Kt + β2 log Lt + β3 TOTt + D1+ D2+ et (4)
Where TOT is NBTT, ITT, VNBTT, and VITT, log is the natural logarithm, NBTTt is the level of net barter terms of trade, VNBTTt is volatility of net barter terms of trade, ITTt is the level of income terms of trade, VITTt is volatility of income terms of trade, and D1 and D2
are dummy variables for capturing the Asian financial crisis between 1997 to 1998 and the global financial crisis of 2007-2009 impacts on Indonesia, the Philippines and Thailand. D1
and D2 equal to 1 for period from 1997 to 1998 as well as 2007-2009 and 0 for the rest, and et is the error term at time t. Owing to the unavailable data of capital stock, the author chooses real gross fixed capital formation in the percentage of GDP to proxy capital stock. I consider
the Asian financial crisis and the global financial crisis using them as dummy variables to indicate the existence of crisis in our countries and to get more powerful, incorrect and stable
model. This time dummy variables have be added to catch a harshly crisis since these two crisis has affected macroeconomic variables in ASEAN economies at that period.
Data description and sources
In this study, a time series data set is used consisting of annual data on Indonesia, the
Philippines and Thailand during the 30-year period (1981-2010). GDP per capita, labor force, capital stock , and net barter terms of trade data are downloaded from World Bank’s, UNCTAD’s, and IMF’s official database meantime net barter terms of trade volatility,
income terms of trade, and income terms of trade volatility are computed by author’s calculation. Real GDP per capita defines as the dependent variable while other variables
define as explanatory variable. Real GDP per capita, capital, and labor data are reported in each country’ current local currency (Rupiah, Peso, and Thai Baht) because using value from foreign countries’ perspective like U.S. dollar has involved with exchange rate, so the result
will not capture some alternation such as monetary policy regime and could lead to incorrect answer. To measure volatility in terms of trade, GARCH (1,1)1 model is utilized in this study.
Results and Discussion
Before identifying the stationary of the variables, I investigate that time series variables are stationary by using Phillip Perror (PP) unit root test. Evidence for the PP test
has expected non-stationary in level but become stationary in the first difference. The logO t2
1 To measure terms of trade volatility, many researcher can calculate it from these 4 methods; standard
deviation, Generalized Autoregressive Conditional Heteroskedasticity model or GARCH (1,1), moving
averages, and moving standard deviations. The author has choose GARCH (1,1) to proxy terms of trade
volatility because of the limitation of online available data. An outstanding advantage of GARCH (1,1)
estimator is that we could get a maximum number of volatility which is a little bit less than total frequency
while the amount of volatility calculated by other methods is less than GARCH due to an inability to compute a
single year. An unavoidable disadvantage of GARCH is unexplained reasons in volatility’s variation and
symmetry of volatility on both positive and negative signs of previous shocks. 2 An extra exogenous variable logOt represented an oil price is added for controlling the fluctuated effect of oil
price change because Indonesia is the only fuel exporter in this region and the share of fuel export in total
exports is quite high which will directly affect every endogenous variable in this country.

PSAKUIJIR Vol. 4 No. 1 (January-June 2015)
[81]
which is an additional exogenous variable in an Indonesian equation is also stationary in the first difference. The results show that the variables might have a long run relationship. The
stationarity of error term checked from running simple linear OLS regression is necessary for choosing the following methods. If the calculated ADF statistics is higher than their critical
values, then the residual series is stationary then variables in each equation have to be co-integrated. From the results, it is seen that residuals of all models are cointegrated at level. That is, all tests do not accept the null hypothesis that residual has a unit root at level. As the
reason mention above, this study will adopted the VECM to analyze the long run relationship when error term is stationary at I(0).
Investigate the existence of a long run relationship of all variables by utilizing cointegration test of the Johansen and Jeuuselius (1990). For the results shown, there is the rejection of null hypothesis of no cointegration in four models of two types of terms of trade
and its volatility at 5% level of significance by having one to three cointegrating vector. The existence of long run relationship among variables in Indonesia’s, Philippines’ and
Thailand’s four models can be proved by using both Johansen cointegration test and ADF test error term.
Specific country analysis in Indonesia, Philippines, Thailand
The graphs of four models in three ASEAN countries present the VECM impulses for
any terms of trade shocks on the responses of GDP per capita, with some exceptional in Indonesia which considers an oil price as an additional exogenous variable in their models (Figure 2).
Indonesian three forth of terms of trade have no impact on real GDP growth because international trade in this country does not be the main driver of its economy (the left figure
of Figure 3). However, domestic consumption in Indonesia plays an important role in driving economy around 70 percent of GDP during the 1980s-2000s because of the highest population in this country, then production line will emphasize on internal consumption. As a
result above, it is not weird that net barter terms of trade have irresponsiveness to growth, hence it volatility will have non-impact on growth. Furthermore, income terms of trade seem
to discourage economic growth by having a significant negative relation. The magnitude of sharply decreased net barter terms of trade is larger than an increase in export volume index, so the income terms of trade continually declined during 1980s. Furthermore, reduced crude
oil price in the world market with the high share of fuel exports in its total exports can decline net barter terms of trade.
A supplementary time dummy variable will be added to catch an intensely internal crisis in Philippines during 1983-1986 as an exogenous variable since real GDP per head has declined in this period. To put the emphasis of negative impact from net barter and income
terms of trade which are shocks into aspect, both responses in domestic GDP per capita growth have be impeded by two innovations in the terms of trade. The net barter terms of
trade of this nation almost always stays below 100 which implies that the average price of imports is higher than export value per unit because actual economic growth of Philippines has elevated by internal consumption, for instance, the evidence in 1980s to 1995 and the last
three years of 2000s (the middle figure in Figure 3). To confirm my fact findings by IMF report, economic growth of Indonesia and Philippines has obviously discouraged by terms of
trade. This report gives the reasons that the terms of trade and an enhancement in global demand might have opposite movements (IMF, April 2014). Exact opposite results happen again in net barter and income terms of trade volatility along the whole ten periods according
to the implicitly positive sign. The reason for positive relationship between terms of trade volatility and growth is that the influence of globalization particularly from trade integration
in Philippines would lead to higher terms of trade volatility and higher economic potential.

PSAKUIJIR Vol. 4 No. 1 (January-June 2015)
[82]
The effect of level of net barter and income terms of trade on Thailand’s economic growth is insignificant positive because an increase in net barter and income terms of trade
will bring a rise in real GDP per capita for the entire time span. However, net barter and income terms of trade volatility enhances Thai domestic GDP growth-notably an unexpected
positive relationships; nevertheless, net barter terms of trade volatility react significant during the short horizon. Even if ordinary empirical evidences found negative linked between terms of trade volatility and growth, globalization on trade openness can lead to higher terms of
trade volatility and become the reason of higher economic potential. From the right figure of Figure 3, Thailand’s degree of openness since 1988 is larger than domestic consumption, so
the export will take part in determination of country’s growth.
Model Indonesia Philippines Thailand
NBTT
.00
.01
.02
.03
.04
.05
1 2 3 4 5 6 7 8 9 10
Response of LOGY_IDN to LOGY_IDN
.00
.01
.02
.03
.04
.05
1 2 3 4 5 6 7 8 9 10
Response of LOGY_IDN to LOGK_IDN
.00
.01
.02
.03
.04
.05
1 2 3 4 5 6 7 8 9 10
Response of LOGY_IDN to LOGL_IDN
.00
.01
.02
.03
.04
.05
1 2 3 4 5 6 7 8 9 10
Response of LOGY_IDN to LOGNBTT _IDN
-.02
.00
.02
.04
.06
.08
1 2 3 4 5 6 7 8 9 10
Response of LOGK_IDN to LOGY_IDN
-.02
.00
.02
.04
.06
.08
1 2 3 4 5 6 7 8 9 10
Response of LOGK_IDN to LOGK_IDN
-.02
.00
.02
.04
.06
.08
1 2 3 4 5 6 7 8 9 10
Response of LOGK_IDN to LOGL_IDN
-.02
.00
.02
.04
.06
.08
1 2 3 4 5 6 7 8 9 10
Response of LOGK_IDN to LOGNBTT _IDN
-.010
-.005
.000
.005
.010
1 2 3 4 5 6 7 8 9 10
Response of LOGL_IDN to LOGY_IDN
-.010
-.005
.000
.005
.010
1 2 3 4 5 6 7 8 9 10
Response of LOGL_IDN to LOGK_IDN
-.010
-.005
.000
.005
.010
1 2 3 4 5 6 7 8 9 10
Response of LOGL_IDN to LOGL_IDN
-.010
-.005
.000
.005
.010
1 2 3 4 5 6 7 8 9 10
Response of LOGL_IDN to LOGNBT T _IDN
.00
.02
.04
.06
.08
.10
.12
1 2 3 4 5 6 7 8 9 10
Response of LOGNBT T_IDN to LOGY_IDN
.00
.02
.04
.06
.08
.10
.12
1 2 3 4 5 6 7 8 9 10
Response of LOGNBT T_IDN to LOGK_IDN
.00
.02
.04
.06
.08
.10
.12
1 2 3 4 5 6 7 8 9 10
Response of LOGNBT T _IDN to LOGL_IDN
.00
.02
.04
.06
.08
.10
.12
1 2 3 4 5 6 7 8 9 10
Response of LOGNBT T _IDN to LOGNBT T_IDN
Response to Cholesky One S.D. Innov ations
-.03
-.02
-.01
.00
.01
.02
.03
1 2 3 4 5 6 7 8 9 10
Response of LOGY_PHL to LOGY_PHL
-.03
-.02
-.01
.00
.01
.02
.03
1 2 3 4 5 6 7 8 9 10
Response of LOGY_PHL to LOGK_PHL
-.03
-.02
-.01
.00
.01
.02
.03
1 2 3 4 5 6 7 8 9 10
Response of LOGY_PHL to LOGL_PHL
-.03
-.02
-.01
.00
.01
.02
.03
1 2 3 4 5 6 7 8 9 10
Response of LOGY_PHL to LOGNBTT _PHL
-.08
-.04
.00
.04
.08
.12
1 2 3 4 5 6 7 8 9 10
Response of LOGK_PHL to LOGY_PHL
-.08
-.04
.00
.04
.08
.12
1 2 3 4 5 6 7 8 9 10
Response of LOGK_PHL to LOGK_PHL
-.08
-.04
.00
.04
.08
.12
1 2 3 4 5 6 7 8 9 10
Response of LOGK_PHL to LOGL_PHL
-.08
-.04
.00
.04
.08
.12
1 2 3 4 5 6 7 8 9 10
Response of LOGK_PHL to LOGNBTT _PHL
-.010
-.005
.000
.005
.010
.015
1 2 3 4 5 6 7 8 9 10
Response of LOGL_PHL to LOGY_PHL
-.010
-.005
.000
.005
.010
.015
1 2 3 4 5 6 7 8 9 10
Response of LOGL_PHL to LOGK_PHL
-.010
-.005
.000
.005
.010
.015
1 2 3 4 5 6 7 8 9 10
Response of LOGL_PHL to LOGL_PHL
-.010
-.005
.000
.005
.010
.015
1 2 3 4 5 6 7 8 9 10
Response of LOGL_PHL to LOGNBTT _PHL
-.08
-.04
.00
.04
.08
1 2 3 4 5 6 7 8 9 10
Response of LOGNBT T _PHL to LOGY_PHL
-.08
-.04
.00
.04
.08
1 2 3 4 5 6 7 8 9 10
Response of LOGNBT T _PHL to LOGK_PHL
-.08
-.04
.00
.04
.08
1 2 3 4 5 6 7 8 9 10
Response of LOGNBT T _PHL to LOGL_PHL
-.08
-.04
.00
.04
.08
1 2 3 4 5 6 7 8 9 10
Response of LOGNBT T_PHL to LOGNBT T_PHL
Response to Cholesky One S.D. Innov ations
-.04
-.02
.00
.02
.04
.06
.08
1 2 3 4 5 6 7 8 9 10
Response of LOGY_THA to LOGY_THA
-.04
-.02
.00
.02
.04
.06
.08
1 2 3 4 5 6 7 8 9 10
Response of LOGY_THA to LOGK_THA
-.04
-.02
.00
.02
.04
.06
.08
1 2 3 4 5 6 7 8 9 10
Response of LOGY_THA to LOGL_THA
-.04
-.02
.00
.02
.04
.06
.08
1 2 3 4 5 6 7 8 9 10
Response of LOGY_THA to LOGNBTT_THA
-.05
.00
.05
.10
.15
.20
1 2 3 4 5 6 7 8 9 10
Response of LOGK_THA to LOGY_THA
-.05
.00
.05
.10
.15
.20
1 2 3 4 5 6 7 8 9 10
Response of LOGK_THA to LOGK_THA
-.05
.00
.05
.10
.15
.20
1 2 3 4 5 6 7 8 9 10
Response of LOGK_THA to LOGL_THA
-.05
.00
.05
.10
.15
.20
1 2 3 4 5 6 7 8 9 10
Response of LOGK_THA to LOGNBTT_THA
-.02
-.01
.00
.01
.02
1 2 3 4 5 6 7 8 9 10
Response of LOGL_THA to LOGY_THA
-.02
-.01
.00
.01
.02
1 2 3 4 5 6 7 8 9 10
Response of LOGL_THA to LOGK_THA
-.02
-.01
.00
.01
.02
1 2 3 4 5 6 7 8 9 10
Response of LOGL_THA to LOGL_THA
-.02
-.01
.00
.01
.02
1 2 3 4 5 6 7 8 9 10
Response of LOGL_THA to LOGNBTT_THA
-.02
-.01
.00
.01
.02
.03
1 2 3 4 5 6 7 8 9 10
Response of LOGNBTT_THA to LOGY_THA
-.02
-.01
.00
.01
.02
.03
1 2 3 4 5 6 7 8 9 10
Response of LOGNBTT_THA to LOGK_THA
-.02
-.01
.00
.01
.02
.03
1 2 3 4 5 6 7 8 9 10
Response of LOGNBTT_THA to LOGL_THA
-.02
-.01
.00
.01
.02
.03
1 2 3 4 5 6 7 8 9 10
Response of LOGNBTT_THA to LOGNBTT_THA
Response to Cholesky One S.D. Innov ations
ITT
-.01
.00
.01
.02
.03
.04
.05
1 2 3 4 5 6 7 8 9 10
Response of LOGY_IDN to LOGY_IDN
-.01
.00
.01
.02
.03
.04
.05
1 2 3 4 5 6 7 8 9 10
Response of LOGY_IDN to LOGK_IDN
-.01
.00
.01
.02
.03
.04
.05
1 2 3 4 5 6 7 8 9 10
Response of LOGY_IDN to LOGL_IDN
-.01
.00
.01
.02
.03
.04
.05
1 2 3 4 5 6 7 8 9 10
Response of LOGY_IDN to LOGIT T _IDN
-.04
.00
.04
.08
.12
1 2 3 4 5 6 7 8 9 10
Response of LOGK_IDN to LOGY_IDN
-.04
.00
.04
.08
.12
1 2 3 4 5 6 7 8 9 10
Response of LOGK_IDN to LOGK_IDN
-.04
.00
.04
.08
.12
1 2 3 4 5 6 7 8 9 10
Response of LOGK_IDN to LOGL_IDN
-.04
.00
.04
.08
.12
1 2 3 4 5 6 7 8 9 10
Response of LOGK_IDN to LOGIT T _IDN
-.008
-.004
.000
.004
.008
.012
1 2 3 4 5 6 7 8 9 10
Response of LOGL_IDN to LOGY_IDN
-.008
-.004
.000
.004
.008
.012
1 2 3 4 5 6 7 8 9 10
Response of LOGL_IDN to LOGK_IDN
-.008
-.004
.000
.004
.008
.012
1 2 3 4 5 6 7 8 9 10
Response of LOGL_IDN to LOGL_IDN
-.008
-.004
.000
.004
.008
.012
1 2 3 4 5 6 7 8 9 10
Response of LOGL_IDN to LOGIT T _IDN
-.02
.00
.02
.04
.06
.08
.10
1 2 3 4 5 6 7 8 9 10
Response of LOGIT T _IDN to LOGY_IDN
-.02
.00
.02
.04
.06
.08
.10
1 2 3 4 5 6 7 8 9 10
Response of LOGIT T _IDN to LOGK_IDN
-.02
.00
.02
.04
.06
.08
.10
1 2 3 4 5 6 7 8 9 10
Response of LOGIT T _IDN to LOGL_IDN
-.02
.00
.02
.04
.06
.08
.10
1 2 3 4 5 6 7 8 9 10
Response of LOGIT T_IDN to LOGIT T _IDN
Response to Cholesky One S.D. Innov ations
-.04
-.02
.00
.02
.04
1 2 3 4 5 6 7 8 9 10
Response of LOGY_PHL to LOGY_PHL
-.04
-.02
.00
.02
.04
1 2 3 4 5 6 7 8 9 10
Response of LOGY_PHL to LOGK_PHL
-.04
-.02
.00
.02
.04
1 2 3 4 5 6 7 8 9 10
Response of LOGY_PHL to LOGL_PHL
-.04
-.02
.00
.02
.04
1 2 3 4 5 6 7 8 9 10
Response of LOGY_PHL to LOGITT_PHL
-.12
-.08
-.04
.00
.04
.08
1 2 3 4 5 6 7 8 9 10
Response of LOGK_PHL to LOGY_PHL
-.12
-.08
-.04
.00
.04
.08
1 2 3 4 5 6 7 8 9 10
Response of LOGK_PHL to LOGK_PHL
-.12
-.08
-.04
.00
.04
.08
1 2 3 4 5 6 7 8 9 10
Response of LOGK_PHL to LOGL_PHL
-.12
-.08
-.04
.00
.04
.08
1 2 3 4 5 6 7 8 9 10
Response of LOGK_PHL to LOGITT_PHL
-.03
-.02
-.01
.00
.01
.02
1 2 3 4 5 6 7 8 9 10
Response of LOGL_PHL to LOGY_PHL
-.03
-.02
-.01
.00
.01
.02
1 2 3 4 5 6 7 8 9 10
Response of LOGL_PHL to LOGK_PHL
-.03
-.02
-.01
.00
.01
.02
1 2 3 4 5 6 7 8 9 10
Response of LOGL_PHL to LOGL_PHL
-.03
-.02
-.01
.00
.01
.02
1 2 3 4 5 6 7 8 9 10
Response of LOGL_PHL to LOGITT_PHL
-.10
-.05
.00
.05
.10
.15
1 2 3 4 5 6 7 8 9 10
Response of LOGITT_PHL to LOGY_PHL
-.10
-.05
.00
.05
.10
.15
1 2 3 4 5 6 7 8 9 10
Response of LOGITT_PHL to LOGK_PHL
-.10
-.05
.00
.05
.10
.15
1 2 3 4 5 6 7 8 9 10
Response of LOGITT_PHL to LOGL_PHL
-.10
-.05
.00
.05
.10
.15
1 2 3 4 5 6 7 8 9 10
Response of LOGITT_PHL to LOGITT_PHL
Response to Cholesky One S.D. Innov ations
-.02
.00
.02
.04
.06
1 2 3 4 5 6 7 8 9 10
Response of LOGY_THA to LOGY_THA
-.02
.00
.02
.04
.06
1 2 3 4 5 6 7 8 9 10
Response of LOGY_THA to LOGK_THA
-.02
.00
.02
.04
.06
1 2 3 4 5 6 7 8 9 10
Response of LOGY_THA to LOGL_THA
-.02
.00
.02
.04
.06
1 2 3 4 5 6 7 8 9 10
Response of LOGY_THA to LOGITT_THA
-.10
-.05
.00
.05
.10
.15
1 2 3 4 5 6 7 8 9 10
Response of LOGK_THA to LOGY_THA
-.10
-.05
.00
.05
.10
.15
1 2 3 4 5 6 7 8 9 10
Response of LOGK_THA to LOGK_THA
-.10
-.05
.00
.05
.10
.15
1 2 3 4 5 6 7 8 9 10
Response of LOGK_THA to LOGL_THA
-.10
-.05
.00
.05
.10
.15
1 2 3 4 5 6 7 8 9 10
Response of LOGK_THA to LOGITT_THA
-.02
-.01
.00
.01
.02
1 2 3 4 5 6 7 8 9 10
Response of LOGL_THA to LOGY_THA
-.02
-.01
.00
.01
.02
1 2 3 4 5 6 7 8 9 10
Response of LOGL_THA to LOGK_THA
-.02
-.01
.00
.01
.02
1 2 3 4 5 6 7 8 9 10
Response of LOGL_THA to LOGL_THA
-.02
-.01
.00
.01
.02
1 2 3 4 5 6 7 8 9 10
Response of LOGL_THA to LOGITT_THA
-.08
-.04
.00
.04
.08
.12
1 2 3 4 5 6 7 8 9 10
Response of LOGITT_THA to LOGY_THA
-.08
-.04
.00
.04
.08
.12
1 2 3 4 5 6 7 8 9 10
Response of LOGITT_THA to LOGK_THA
-.08
-.04
.00
.04
.08
.12
1 2 3 4 5 6 7 8 9 10
Response of LOGITT_THA to LOGL_THA
-.08
-.04
.00
.04
.08
.12
1 2 3 4 5 6 7 8 9 10
Response of LOGITT_THA to LOGITT_THA
Response to Cholesky One S.D. Innov ations
VNBTT
-.02
.00
.02
.04
.06
.08
1 2 3 4 5 6 7 8 9 10
Response of LOGY_IDN to LOGY_IDN
-.02
.00
.02
.04
.06
.08
1 2 3 4 5 6 7 8 9 10
Response of LOGY_IDN to LOGK_IDN
-.02
.00
.02
.04
.06
.08
1 2 3 4 5 6 7 8 9 10
Response of LOGY_IDN to LOGL_IDN
-.02
.00
.02
.04
.06
.08
1 2 3 4 5 6 7 8 9 10
Response of LOGY_IDN to GARCH_NBTT_IDN
-.02
.00
.02
.04
.06
1 2 3 4 5 6 7 8 9 10
Response of LOGK_IDN to LOGY_IDN
-.02
.00
.02
.04
.06
1 2 3 4 5 6 7 8 9 10
Response of LOGK_IDN to LOGK_IDN
-.02
.00
.02
.04
.06
1 2 3 4 5 6 7 8 9 10
Response of LOGK_IDN to LOGL_IDN
-.02
.00
.02
.04
.06
1 2 3 4 5 6 7 8 9 10
Response of LOGK_IDN to GARCH_NBTT_IDN
-.008
-.004
.000
.004
.008
1 2 3 4 5 6 7 8 9 10
Response of LOGL_IDN to LOGY_IDN
-.008
-.004
.000
.004
.008
1 2 3 4 5 6 7 8 9 10
Response of LOGL_IDN to LOGK_IDN
-.008
-.004
.000
.004
.008
1 2 3 4 5 6 7 8 9 10
Response of LOGL_IDN to LOGL_IDN
-.008
-.004
.000
.004
.008
1 2 3 4 5 6 7 8 9 10
Response of LOGL_IDN to GARCH_NBTT_IDN
-30
-20
-10
0
10
20
30
1 2 3 4 5 6 7 8 9 10
Response of GARCH_NBTT_IDN to LOGY_IDN
-30
-20
-10
0
10
20
30
1 2 3 4 5 6 7 8 9 10
Response of GARCH_NBTT_IDN to LOGK_IDN
-30
-20
-10
0
10
20
30
1 2 3 4 5 6 7 8 9 10
Response of GARCH_NBTT_IDN to LOGL_IDN
-30
-20
-10
0
10
20
30
1 2 3 4 5 6 7 8 9 10
Response of GARCH_NBTT_IDN to GARCH_NBTT_IDN
Response to Cholesky One S.D. Innov ations
-.03
-.02
-.01
.00
.01
.02
.03
1 2 3 4 5 6 7 8 9 10
Response of LOGY_PHL to LOGY_PHL
-.03
-.02
-.01
.00
.01
.02
.03
1 2 3 4 5 6 7 8 9 10
Response of LOGY_PHL to LOGK_PHL
-.03
-.02
-.01
.00
.01
.02
.03
1 2 3 4 5 6 7 8 9 10
Response of LOGY_PHL to LOGL_PHL
-.03
-.02
-.01
.00
.01
.02
.03
1 2 3 4 5 6 7 8 9 10
Response of LOGY_PHL to GARCH_NBTT_PHL
-.08
-.04
.00
.04
.08
.12
1 2 3 4 5 6 7 8 9 10
Response of LOGK_PHL to LOGY_PHL
-.08
-.04
.00
.04
.08
.12
1 2 3 4 5 6 7 8 9 10
Response of LOGK_PHL to LOGK_PHL
-.08
-.04
.00
.04
.08
.12
1 2 3 4 5 6 7 8 9 10
Response of LOGK_PHL to LOGL_PHL
-.08
-.04
.00
.04
.08
.12
1 2 3 4 5 6 7 8 9 10
Response of LOGK_PHL to GARCH_NBTT_PHL
-.01
.00
.01
1 2 3 4 5 6 7 8 9 10
Response of LOGL_PHL to LOGY_PHL
-.01
.00
.01
1 2 3 4 5 6 7 8 9 10
Response of LOGL_PHL to LOGK_PHL
-.01
.00
.01
1 2 3 4 5 6 7 8 9 10
Response of LOGL_PHL to LOGL_PHL
-.01
.00
.01
1 2 3 4 5 6 7 8 9 10
Response of LOGL_PHL to GARCH_NBTT_PHL
-10
0
10
1 2 3 4 5 6 7 8 9 10
Response of GARCH_NBTT_PHL to LOGY_PHL
-10
0
10
1 2 3 4 5 6 7 8 9 10
Response of GARCH_NBTT_PHL to LOGK_PHL
-10
0
10
1 2 3 4 5 6 7 8 9 10
Response of GARCH_NBTT_PHL to LOGL_PHL
-10
0
10
1 2 3 4 5 6 7 8 9 10
Response of GARCH_NBTT_PHL to GARCH_NBTT_PHL
Response to Cholesky One S.D. Innov ations
-.02
.00
.02
.04
.06
1 2 3 4 5 6 7 8 9 10
Response of LOGY_T HA to LOGY_THA
-.02
.00
.02
.04
.06
1 2 3 4 5 6 7 8 9 10
Response of LOGY_T HA to LOGK_THA
-.02
.00
.02
.04
.06
1 2 3 4 5 6 7 8 9 10
Response of LOGY_T HA to LOGL_THA
-.02
.00
.02
.04
.06
1 2 3 4 5 6 7 8 9 10
Response of LOGY_THA to GARCH_NBTT_THA
-.1
.0
.1
.2
1 2 3 4 5 6 7 8 9 10
Response of LOGK_T HA to LOGY_THA
-.1
.0
.1
.2
1 2 3 4 5 6 7 8 9 10
Response of LOGK_T HA to LOGK_THA
-.1
.0
.1
.2
1 2 3 4 5 6 7 8 9 10
Response of LOGK_T HA to LOGL_THA
-.1
.0
.1
.2
1 2 3 4 5 6 7 8 9 10
Response of LOGK_THA to GARCH_NBTT_THA
-.01
.00
.01
.02
1 2 3 4 5 6 7 8 9 10
Response of LOGL_T HA to LOGY_THA
-.01
.00
.01
.02
1 2 3 4 5 6 7 8 9 10
Response of LOGL_T HA to LOGK_THA
-.01
.00
.01
.02
1 2 3 4 5 6 7 8 9 10
Response of LOGL_THA to LOGL_THA
-.01
.00
.01
.02
1 2 3 4 5 6 7 8 9 10
Response of LOGL_THA to GARCH_NBTT_THA
-12
-8
-4
0
4
8
12
1 2 3 4 5 6 7 8 9 10
Response of GARCH_NBTT_THA to LOGY_THA
-12
-8
-4
0
4
8
12
1 2 3 4 5 6 7 8 9 10
Response of GARCH_NBTT_THA to LOGK_THA
-12
-8
-4
0
4
8
12
1 2 3 4 5 6 7 8 9 10
Response of GARCH_NBTT_THA to LOGL_THA
-12
-8
-4
0
4
8
12
1 2 3 4 5 6 7 8 9 10
Response of GARCH_NBTT_THA to GARCH_NBTT_THA
Response to Cholesky One S.D. Innov ations
VITT
-.01
.00
.01
.02
.03
.04
.05
1 2 3 4 5 6 7 8 9 10
Response of LOGY_IDN to LOGY_IDN
-.01
.00
.01
.02
.03
.04
.05
1 2 3 4 5 6 7 8 9 10
Response of LOGY_IDN to LOGK_IDN
-.01
.00
.01
.02
.03
.04
.05
1 2 3 4 5 6 7 8 9 10
Response of LOGY_IDN to LOGL_IDN
-.01
.00
.01
.02
.03
.04
.05
1 2 3 4 5 6 7 8 9 10
Response of LOGY_IDN to GARCH_IT T_IDN
-.04
-.02
.00
.02
.04
.06
.08
1 2 3 4 5 6 7 8 9 10
Response of LOGK_IDN to LOGY_IDN
-.04
-.02
.00
.02
.04
.06
.08
1 2 3 4 5 6 7 8 9 10
Response of LOGK_IDN to LOGK_IDN
-.04
-.02
.00
.02
.04
.06
.08
1 2 3 4 5 6 7 8 9 10
Response of LOGK_IDN to LOGL_IDN
-.04
-.02
.00
.02
.04
.06
.08
1 2 3 4 5 6 7 8 9 10
Response of LOGK_IDN to GARCH_IT T_IDN
-.010
-.005
.000
.005
.010
1 2 3 4 5 6 7 8 9 10
Response of LOGL_IDN to LOGY_IDN
-.010
-.005
.000
.005
.010
1 2 3 4 5 6 7 8 9 10
Response of LOGL_IDN to LOGK_IDN
-.010
-.005
.000
.005
.010
1 2 3 4 5 6 7 8 9 10
Response of LOGL_IDN to LOGL_IDN
-.010
-.005
.000
.005
.010
1 2 3 4 5 6 7 8 9 10
Response of LOGL_IDN to GARCH_IT T_IDN
-40
-20
0
20
40
60
80
1 2 3 4 5 6 7 8 9 10
Response of GARCH_ITT _IDN to LOGY_IDN
-40
-20
0
20
40
60
80
1 2 3 4 5 6 7 8 9 10
Response of GARCH_ITT _IDN to LOGK_IDN
-40
-20
0
20
40
60
80
1 2 3 4 5 6 7 8 9 10
Response of GARCH_IT T _IDN to LOGL_IDN
-40
-20
0
20
40
60
80
1 2 3 4 5 6 7 8 9 10
Response of GARCH_ITT _IDN to GARCH_ITT _IDN
Response to Cholesky One S.D. Innov ations
-.01
.00
.01
.02
.03
1 2 3 4 5 6 7 8 9 10
Response of LOGY_PHL to LOGY_PHL
-.01
.00
.01
.02
.03
1 2 3 4 5 6 7 8 9 10
Response of LOGY_PHL to LOGK_PHL
-.01
.00
.01
.02
.03
1 2 3 4 5 6 7 8 9 10
Response of LOGY_PHL to LOGL_PHL
-.01
.00
.01
.02
.03
1 2 3 4 5 6 7 8 9 10
Response of LOGY_PHL to GARCH_ITT _PHL
.00
.04
.08
.12
1 2 3 4 5 6 7 8 9 10
Response of LOGK_PHL to LOGY_PHL
.00
.04
.08
.12
1 2 3 4 5 6 7 8 9 10
Response of LOGK_PHL to LOGK_PHL
.00
.04
.08
.12
1 2 3 4 5 6 7 8 9 10
Response of LOGK_PHL to LOGL_PHL
.00
.04
.08
.12
1 2 3 4 5 6 7 8 9 10
Response of LOGK_PHL to GARCH_ITT _PHL
.00
.01
.02
1 2 3 4 5 6 7 8 9 10
Response of LOGL_PHL to LOGY_PHL
.00
.01
.02
1 2 3 4 5 6 7 8 9 10
Response of LOGL_PHL to LOGK_PHL
.00
.01
.02
1 2 3 4 5 6 7 8 9 10
Response of LOGL_PHL to LOGL_PHL
.00
.01
.02
1 2 3 4 5 6 7 8 9 10
Response of LOGL_PHL to GARCH_IT T_PHL
-10
0
10
20
30
1 2 3 4 5 6 7 8 9 10
Response of GARCH_IT T_PHL to LOGY_PHL
-10
0
10
20
30
1 2 3 4 5 6 7 8 9 10
Response of GARCH_IT T_PHL to LOGK_PHL
-10
0
10
20
30
1 2 3 4 5 6 7 8 9 10
Response of GARCH_IT T _PHL to LOGL_PHL
-10
0
10
20
30
1 2 3 4 5 6 7 8 9 10
Response of GARCH_ITT _PHL to GARCH_ITT _PHL
Response to Cholesky One S.D. Innov ations
-.02
-.01
.00
.01
.02
.03
1 2 3 4 5 6 7 8 9 10
Response of LOGY_T HA to LOGY_T HA
-.02
-.01
.00
.01
.02
.03
1 2 3 4 5 6 7 8 9 10
Response of LOGY_T HA to LOGK_T HA
-.02
-.01
.00
.01
.02
.03
1 2 3 4 5 6 7 8 9 10
Response of LOGY_T HA to LOGL_T HA
-.02
-.01
.00
.01
.02
.03
1 2 3 4 5 6 7 8 9 10
Response of LOGY_T HA to GARCH_IT T_T HA
-.08
-.04
.00
.04
.08
.12
1 2 3 4 5 6 7 8 9 10
Response of LOGK_T HA to LOGY_T HA
-.08
-.04
.00
.04
.08
.12
1 2 3 4 5 6 7 8 9 10
Response of LOGK_T HA to LOGK_T HA
-.08
-.04
.00
.04
.08
.12
1 2 3 4 5 6 7 8 9 10
Response of LOGK_T HA to LOGL_T HA
-.08
-.04
.00
.04
.08
.12
1 2 3 4 5 6 7 8 9 10
Response of LOGK_T HA to GARCH_IT T_T HA
-.008
-.004
.000
.004
.008
.012
1 2 3 4 5 6 7 8 9 10
Response of LOGL_T HA to LOGY_T HA
-.008
-.004
.000
.004
.008
.012
1 2 3 4 5 6 7 8 9 10
Response of LOGL_T HA to LOGK_T HA
-.008
-.004
.000
.004
.008
.012
1 2 3 4 5 6 7 8 9 10
Response of LOGL_T HA to LOGL_T HA
-.008
-.004
.000
.004
.008
.012
1 2 3 4 5 6 7 8 9 10
Response of LOGL_THA to GARCH_ITT_THA
-10
-5
0
5
10
1 2 3 4 5 6 7 8 9 10
Response of GARCH_ITT _THA to LOGY_T HA
-10
-5
0
5
10
1 2 3 4 5 6 7 8 9 10
Response of GARCH_ITT _THA to LOGK_T HA
-10
-5
0
5
10
1 2 3 4 5 6 7 8 9 10
Response of GARCH_ITT _THA to LOGL_THA
-10
-5
0
5
10
1 2 3 4 5 6 7 8 9 10
Response of GARCH_ITT_THA to GARCH_ITT _THA
Response to Cholesky One S.D. Innov ations
Figure 2 Graphs of Impulse Response Function in Indonesia, Philippines, and Thailand
Figure 3 Degree of Openness and Domestic Consumption in Indonesia,
Philippines, and Thailand
Degree of Openness Domestic Consumption

PSAKUIJIR Vol. 4 No. 1 (January-June 2015)
[83]
Conclusion and Policy Implication
This paper proposes an empirical evidence of the long run relationship between terms of trade (its volatility) and economic growth by using Johansen cointegration and
VECM impulse response analysis with annual time series data in case of Indonesia, Philippines, and Thailand over the period 1981-2010. The impacts of four types of terms of trade on economic growth are assessed through the impulse response functions. The
implications of positive terms of trade and negative its volatility effects on economic growth calling for a more holistic approach are discussed as followed because the country’s
characteristic has an important effect on the positive or negative long run relationship. The unique results could be attributable to a variety of individual characteristics in each nation, therefore, it does not matter that we can not find conclusion in ASEAN countries. Some
economy-specific differences appear in this study: for example, economies depended largely on its domestic consumption (for instance, Indonesia) show no relationship between terms of
trade and its volatility on real GDP per capita growth except negative impact from income terms of trade. Even for Philippines in which has depended on its domestic consumption presents that whenever net barter and income terms of trade (their volatilities) grows
(reduces), national real GDP growth will be enlarged. In Thailand, positive insignificant economic growth effects with respect to four types of terms of trade shocks is presented. A
beneficial recommendation, policy planners and business man should produce export products with premium quality which have more value added to increase country’s growth rate while government sector need to provide massive stimulus to support private sector.
References
Awel Ahmed Mohammed. (2012). “Terms of Trade Volatility and Economic Growth in Sub-Saharan Africa.” Munich Personal RePEc Archive Paper (45453): 1-24.
Basu Parantap and McLeod Darryl. (1992). “Terms of trade fluctuations and economic growth in developing economies.” Journal of Development Economics 3: 89-110.
Berge Kersti and Trevor Crowe. (1997). “The Terms of Trade Facing South Korea with Respect to Its Trade with LDCs and DMEs.” Queen Elizabeth House (QEU)
Working Paper (12): 1-47.
Blattman Christopher, Hwang Jason and Williamson Jeffrey G. (2003). “The Terms of Trade and Economic Growth in the Periphery 1870-1938.” National Bureau of Economic
Research Working Paper (9940). Blattman Christopher, Hwang Jason and Williamson Jeffrey G. (2004). “The impact of the
terms of trade on economic growth in the periphery, 1870–1939: volatility and secular
change.” National Bureau of Economic Research Working Paper (10600). Blattman Christopher, Hwang Jason and Williamson Jeffrey G. (2007). “Winners and losers
in the commodity lottery: The impact of terms of trade growth and volatility in the Periphery 1870-1939.” Journal of Development Economics 82: 156-179.
Bleaney Michael and Greenaway David. (2001). “The impact of terms of trade and real
exchange rate volatility on investment and growth in sub-Saharan Africa.” Journal
of Development Economics 65: 491-500.
Borkin Philip. (2006). “Past, Present and Future Developments in New Zealand’s Terms of Trade.” NEW ZEALAND TREASURY WORKING PAPER (06/09): 1-43.
Cakir Mustafa. (2009). “Terms of Trade and Economic Growth of Emerging Market
Economies.” The University of Johannesburg Journal for Applied Economic and
Econometric Research 6: 16-31.

PSAKUIJIR Vol. 4 No. 1 (January-June 2015)
[84]
Easterly William and Kraay Aart. (2000). “Small States, Small Problems? Income, Growth, and Volatility in Small States.” World Development 28 (11): 2013- 2027.
Fatima Nishat. (2010). “Analysing the Terms of Trade Effect for Pakistan.” Pakistan
Institute of Development Economics Working Papers (59).
Furth Salim B. (2010). “Terms of Trade Volatility and Precautionary Savings in Developing Economies.” DEGIT (Dynamics, Economic Growth, and International Trade) Conference Papers (c015_013).
Grimes Arthur. (2006). “A smooth ride: Terms of Trade, volatility, and GDP growth.” Journal of Asian Economics 17: 583-600.
IMF. (April 2014). World Economic Outlook: Recovery Strengthens, Remains Uneven. International Monetary Fund.
Jawaid Syed Tehseen and Waheed Abdul. (2011). “Effects of Terms of Trade and its
Volatility on Economic Growth: A Cross Country Empirical Investigation.” Journal
of Transition Studies Review 18 (2): 217-229.
Jawaid Syed Tehseen and Raza Syed Ali. (2012). “Effects of Terms of Trade and its Volatility on Economic Growth in India.” Munich Personal RePEc Archive Paper (38998).
Johansen S. and Juselius K. (1990). “Maximum Likelihood Estimation and Inference on Cointegration With Applications to the Demand of Money.” Oxford Bulletin of
Econometrics and Statistics 52 (2): 169-210. Kaneko Akihiko. (2000). “Terms of trade, economic growth, and trade patterns: a small
open- economy case.” Journal of International Economics 52: 169-181.
Lutz Matthias. (1994). “The Effects of Volatility in the Terms of Trade on Output Growth: New Evidence.” World Development 22 (12): 1959-1975.
Mansfield Edward D. and Reinhardt Eric. (2008). “International Institutions and Terms of Trade Volatility.” Unpublished manuscript [Online]. Available from: www.service. emory.edu/~erein/research/ToT.pdf
Mendoza Enrique G. (1995). “The Terms of Trade, the Real Exchange Rate and Economic Fluctuations.” International Economic Review 36 (1): 101–137.
Mendoza Enrique G. (1997). “Terms-of-trade uncertainty and economic growth.” Journal of
Development Economics 54: 323-356. Samimi Ahmad Jafari, Sadeghi Somaye and Sadeghi Soraya. (2011). “The Impact of the
Terms of Trade Volatility on Economic Growth: Evidence from Oil Exporting Countries.” International Journal of Economics and Management Engineering
(IJEME) 1 (1): 50-53. Sapsford David and Balasubramanyam Vudayagiri N. (1994). "The long-run behavior of the
relative price of primary commodities: Statistical evidence and policy implications."
World Development 22 (11): 1737-1745. Turnovsky Stephen J.and Chattopadhyay Pradip. (2003). “Volatility and Growth in
Developing Economies: Some Numerical Results and Empirical Evidence.” Journal of International Economics 59 (2): 267-295.
Williamson Jeffrey G. (2008). “Globlaization and the Great Divergence: Terms of Trade
Booms and Volatility in the Poor Periphery 1782-1913.” National Bureau of
Economic Research Working Paper (13841).
Wong Hock-Tsen. (2004). “Terms of Trade and Economic Growth in Malaysia.” Labuan
Bulletin of International Business & Finance 2 (2): 105-122. Wong Hock Tsen. (2010). “Terms of Trade and Economic Growth in Japan and Korea: an
Empirical Analysis.” Empirical Economics 38 (1): 139-158.