Embed Size (px)
Citation preview

The impact of self-employment onlabour-productivity growth: A Canadaand United States comparison
by John R. Baldwin and James Chowhan
Micro-economic Analysis Division18th floor, R.H. Coats Building, Ottawa, K1A 0T6
Telephone: 1 800 263-1136
This paper represents the views of the authors and does not necessarily reflect the opinions of Statistics Canada.
Catalogue no. 11F0027MIE — No. 016
ISSN: 1703-0404
ISBN: 0-662-34792-7
Research Paper
Economic analysis (EA) research paper series

The impact of self-employment on labour-productivity growth:
A Canada and United States comparison
by John R. Baldwin
and James Chowhan
11F0027MIE No. 016
ISSN: 1703-0404 ISBN: 0-662-34792-7
Micro-economic Analysis Division Statistics Canada
18th floor, R.H. Coats Building Ottawa, Ontario
K1A 0T6
How to obtain more information : National inquiries line: 1 800 263-1136 E-Mail inquiries: [email protected]
August, 2003
This paper represents the authors views and does not necessarily reflect the opinions of Statistics Canada. The authors are grateful to Desmond Beckstead for assistance on obtaining data on GDP per self-employed, Jean-Pierre Maynard for helpful discussion and suggestions and to Roger Sceviour for providing Longitudinal Administrative Data estimates.
Aussi disponible en français

Economic Analysis Research Paper Series - i - Statistics Canada 11F0027 No. 016
Table of Contents ABSTRACT ................................................................................................................................................................II
EXECUTIVE SUMMARY...................................................................................................................................... III
PREFACE................................................................................................................................................................. IV
1. INTRODUCTION ...................................................................................................................................................1
2. DEFINITIONS OF SELF-EMPLOYMENT ........................................................................................................3
3. GROWTH IN THE SELF-EMPLOYED IN THE 1990S: DATA COMPARISON ..........................................4
4. RELATIVE SUCCESS OF THE SELF-EMPLOYED IN THE 1990S ..............................................................7
5. MEASURES OF LABOUR PRODUCTIVITY ..................................................................................................12
6. RELATIVE SIZE OF SELF-EMPLOYMENT IN THE BUSINESS SECTOR..............................................16 NOMINAL GDP ........................................................................................................................................................16 HOURS WORKED.......................................................................................................................................................17 NUMBER OF JOBS......................................................................................................................................................17
7. LABOUR-PRODUCTIVITY GROWTH............................................................................................................18 NOMINAL OUTPUT PER HOUR WORKED.....................................................................................................................18 NOMINAL OUTPUT PER NUMBER OF JOBS..................................................................................................................19
8. CANADA AND UNITED STATES COMPARISON.........................................................................................22 DATA AND DEFINITIONS...........................................................................................................................................23 COMPARISON ...........................................................................................................................................................24
9. CONCLUDING REMARKS................................................................................................................................29
APPENDIX 1: INDUSTRY SIC DESCRIPTION ..................................................................................................33
APPENDIX 2: CANADIAN DATA .........................................................................................................................35
APPENDIX 3: U.S. DATA.......................................................................................................................................37
APPENDIX 4: SELF-EMPLOYMENT CLASSES...............................................................................................39
APPENDIX 5: INDUSTRY DIFFERENCES ........................................................................................................45
APPENDIX 6: DECOMPOSITION OF CAPITAL CONSUMPTION ALLOWANCES .................................49
APPENDIX 7: GDP PER WORKER IN THE SELF-EMPLOYED SECTOR...................................................52
APPENDIX 8: INDEX NUMBER DIFFERENCES BETWEEN WEIGHTED AVERAGES AND THEIR COMPONENTS ........................................................................................................................................................55
REFERENCES ..........................................................................................................................................................58

Economic Analysis Research Paper Series - ii - Statistics Canada 11F0027 No. 016
Abstract This paper examines the influence of the self-employed on the growth in labour productivity in the business sector. There has been a dramatic expansion of self-employment in the Canadian economy over the 1987 to 1998 period. In addition, a comparison is made of Canadian and United States experiences in this area over the 1987 to 1998 reference period. This paper argues that the expansion of the self-employed sector in Canada and the weak growth in Canadian self-employment net income over the decade has resulted in downward pressure being put on the growth in aggregate labour productivity in the business sector. In contrast, the growth in the net income of the self-employment group in the United States has outpaced overall productivity growth in the business sector throughout the 1990s. Almost all of the difference in labour-productivity growth between Canada and the United States in the 1990s can be attributed to the greater growth of self-employment in Canada and the poorer income performance of this group. Keywords: productivity growth, self-employment, Canada\U.S. comparison
Published by authority of the Minister responsible for Statistics Canada
© Minister of Industry, 2003
All rights reserved. No part of this publication may be reproduced, stored in a retrieval system ortransmitted in any form or by any means, electronic, mechanical, photocopying, recording orotherwise without prior written permission from Licence Services, Marketing Division, StatisticsCanada, Ottawa, Ontario, Canada K1A 0T6.
Economic Analysis Research Paper Series - iii - Statistics Canada 11F0027 No. 016
Executive Summary This paper focuses on the impact of the self-employed on labour-productivity growth in the Canadian business sector. Over the decade from 1988 to 1998, self-employment provided the majority of growth in jobs in Canada. But during this period, earnings per worker in the self-employed sector fell behind those in the business sector as a whole. This paper investigates the impact of these two events on aggregate productivity growth.
In order to measure the impact of self-employment on labour-productivity growth, the net income accruing to the self-employed is removed from aggregate business sector GDP to produce a residual, which measures growth in output in the Business-sector Apart from Self-employed (BASE). Then output per hour-worked in this category is compared to the growth in output per hour-worked in the aggregate business sector—the normal measure of productivity growth. Over the decade, the growth in the BASE sector cumulative growth rate is 3.7% higher than the growth rate in the aggregate business sector using an output-per-job measure. It is 2.9% using an output per hour-worked measure. This occurs because the growth in the net income per job (hours worked) accruing to the self-employed falls behind the growth in output per job (per hour worked) in the BASE sector beginning in 1994 and the resulting gap continues over the reference decade. The increasing proportion of self-employed in the economy and the lagging growth in the net income that they earned contributed to lower the growth in labour productivity in the aggregate business sector over the decade. A comparison is also made of Canada to the United States, asking whether the different productivity performance of the two countries over the 1987 to 1998 period is due to differences in the self-employment sector. The comparison shows that the self-employment category in the United States has had a significant positive effect on the growth in nominal output per hour-worked. Over the decade, the self-employment category has pulled up U.S. business-sector productivity by 4.1%; in Canada, this same category has provided a 2.9% drag on nominal output per hours worked. When the nominal output measures are deflated and the difference in cumulative growth rates is calculated, the gap in labour-productivity growth between the United States and Canada almost disappears.
Economic Analysis Research Paper Series - iv - Statistics Canada 11F0027 No. 016
Preface Productivity statistics describe how efficient an economy is in turning inputs into outputs. The most commonly used measure is that of labour productivity—the amount of output that the economy produces per unit of labour input (measured either per worker or per hour-worked). The level of labour productivity will be influenced by the amount of capital per worker that is used, the size of firms, the organizational and business practices of firms, and the level of advanced technology. Increasing the amount of capital available to workers increases labour productivity. Larger firms are able to more fully exploit economies of scale and have higher levels of labour productivity. Better organizational skills increase the amount of output per worker. New and advanced technologies tend to increase output per worker. Measures of labour productivity are generally defined as output per hour worked in the business sector. And they are used to evaluate the effectiveness of firms—in terms of providing capital to their workers, in exploiting economies of scale, in adopting the latest advanced business practices, in using advanced technologies. Cross-country productivity comparisons are used to infer differences in the relative efficiency of businesses in different countries. In trying to understand the reasons behind the productivity growth experienced by the aggregate business sector, analysts often decompose productivity growth into sub-components. The most frequently used decomposition is an industry breakdown. By examining the relative productivity growth of different industries, analysts attempt to isolate the areas where one country most lags another. This paper has adopted a different decomposition. Picot and Heisz (2000) have noted that one of the defining characteristics of the Canadian economy in the 1990s was the increase in self-employment. Most of the increase in workers between 1988 and 1995 in Canada was due to an increase in self-employment; this did not happen in the United States. In Canada, most of this increase in self-employed consisted of individuals who were not responsible for employing others. Cross-country comparisons of labour productivity estimates are implicitly used to infer differences in the efficiency of Canadian businesses. However, the business population is not monolithic. On the one hand, this population consists of goods and service ‘factories’ with large numbers of paid workers, that require substantial buildings, and that use large amounts of equipment. On the other hand are artists and professionals who are self-employed. These two groups can be roughly classified as the ‘factory’ and the ‘non-factory’ system. This nomenclature is not perfect because the latter can sometimes use a fair amount of capital and employ others, but it is a meaningful distinction on average. This paper therefore breaks the total business sector output into that portion of the output that accrues to the self-employed and the remainder—what might be referred to as the factory system. It generates estimates of the growth in GDP per hour-worked in each sector and compares this to the United States. It shows that while the growth in GDP per hour worked in the Canadian business sector as a whole has lagged that of the United States, once the income

Economic Analysis Research Paper Series - v - Statistics Canada 11F0027 No. 016
accruing to the self-employed group is excluded from the equation, the growth in labour productivity of the remainder—what might be called the factory sector—was essentially the same in the two countries. GDP per worker in the business sector lagged that of the United States because Canada had an increasing percentage of its workforce in self-employment and the income per worker of the self-employed fell considerably relative to that of the United States. The self-employed in this study consist of unincorporated individuals. They provide the bulk of the entrepreneurs in our society. It is tempting to conclude that it was our entrepreneurs who were the cause of the productivity slowdown in the early 1990s. But that is probably too simplistic an interpretation. It is more likely that in comparing total business sector productivity growth in the two countries in the 1990s, we are making the mistake of comparing two quite different ratios—even though we are calling them by the same name (output per worker), they are capturing different phenomenon. To understand this, we need to consider the meaning of comparisons that employ a measure of output per worker. Productivity can be measured not only as output per worker but also as output per available worker—as output divided by the labour force. This latter measure captures both how effective the economy is in transforming labour into output but also how effective it is in providing jobs for those members of society who indicate that they are ready to work. Such measures will differ across countries for all of the reasons that we outlined above—differences in capital intensity, in size of plants, in firms’ organizational abilities, and in the use of advanced technologies; but they will also differ because countries are not equally capable of offering gainful employment to the same proportion of their labour force. In effect, measures of GDP per capita provide one variant of this type of measure. GDP per capita is by definition equal to (GDP/hour worked) multiplied by (hours-worked per worker) multiplied by (number of workers divided by the labour force) multiplied by (the size of the labour force divided by the population). This measure will grow at a different rate than GDP/hour worked (the normal measure of labour productivity) if there is a change in any of the other three terms. In particular, if the percentage of the labour force that is employed (the third term) declines over a period of time, then GDP per capita will grow more slowly than labour productivity. This was the Canadian experience in the first part of the 1990s. (See Wells, Baldwin and Maynard, 1999). GDP per capita in Canada grew much more slowly than GDP per capita in the United States, while the growth in output per worker was more similar to that in the United States. The reason is that unemployment increased in Canada far more than in the United States—and thus the ratio of number of workers relative to the population declined in Canada relative to the United States. The measure of output per worker in the business sector combining both employment and self-employment that is used in this study is probably also affected by a similar phenomenon. In the early 1990s, as unemployment grew, there were fewer opportunities for regular employment. Restructuring led to substantial layoffs of many individuals who did not find regular work and it is possible that these individuals chose not to call themselves unemployed, but to classify themselves as self-employed. Similarly, hiring by firms slowed and those entering the labour force were less likely to find employment in normal forms of employment. The income earned by those choosing, or those being forced into self-employment, was not zero; but it was

Economic Analysis Research Paper Series - vi - Statistics Canada 11F0027 No. 016
considerably below the income of those who normally classified themselves as self-employed. More importantly, their inclusion in the overall estimate of labour productivity meant that the Canadian measure took on the flavour of a measure that captured not output per worker but output per potential worker—and these measures show that Canada performed worse than did the United States because of our inability to employ all those who were willing to work. The difference is that some of these laid-off workers did find some self-employment—but it provided a remuneration that was considerably below that which the self-employed had previously been able to generate. This phenomenon dragged down the measure of aggregate business-sector output per worker. In contrast, output per worker in the rest of the economy continued to increase in the 1990s in Canada at about the same pace as it did in the United States.

Economic Analysis Research Paper Series - 1 - Statistics Canada 11F0027 No. 016
1. Introduction Over the 1980s and 1990s, demographic trends and variations in the business cycle have lead to an increasing number of individuals moving into self-employment. Several studies document the extent of these impacts on: transitions in and out of self-employment (Kuhn and Schuetze, 2001); the differences in the role of self-employment between Canada and the United States (Lin, Yates, and Picot, 1999); and the individual entrepreneurs’ characteristics and previous labour market experience that are related to the likelihood of entry and exit into self-employment (Statistics Canada, Labour Force Update, 1997; Lin, Picot, and Yates, 1999). Most of this literature has focused on the causes of the evolution of this phenomenon, rather than its impact on the economy. This paper examines one way in which the growth of self-employment has affected the performance of the economy. It focuses specifically on the impact of the self-employed on labour-productivity growth in the Canadian business sector. A comparison is also made to differences that self-employment have had on the relative performance of the economies of Canada and the United States. The question of the influence of the self-employed on the growth in labour productivity arises and is of interest, because of the growth in self-employment in Canada during the recent decade. From 1990 to 1997, total net job growth for the entire Canadian economy was 5.0% (697,000 jobs); of this total, approximately one-half came from growth in the self-employed category. The self-employed run businesses of different types. On the one hand, some generate a large amount of GDP. They have employees and employ capital stock in the production process. On the other hand, others generate little in the way of GDP. They hire no employees; they use no capital except for perhaps a computer and a room in their house. The impact of the growth of the self-employed on labour productivity will depend on the distribution of the growth across these various types of business. The increase in the self-employed in the 1990s has come primarily from those who have no employees. During the period from 1989 to 1996, some 90% of self-employment growth was ‘own-account’—self-employed without paid help (LFS, 1997). This group earned substantially less than other self-employed and less than paid workers. We show below that the growth in self-employment that was experienced in Canada during the early 1990s was an important factor contributing to the stagnation of aggregate labour-productivity growth in the Canadian business sector. Productivity growth is typically understood to be a key factor contributing to a country’s standard of living. Labour productivity is a general measure used to follow changes in economic performance. An improvement in productivity can occur because of increases in productive efficiency brought about by research and development, the adoption of new technologies, innovative management, and increases in human capital. Statistics Canada’s labour-productivity program provides estimates that measure growth in real output per unit of labour input, measured in terms of hours-worked for the aggregate business sector and its composite industries. This measure of labour productivity is broad in scope and when decomposed into productivity growth at the industry level is often used to examine efficiency differences across industries.

Economic Analysis Research Paper Series - 2 - Statistics Canada 11F0027 No. 016
In contrast, this paper decomposes the aggregate business sector in a different way. It takes total GDP and then removes the net income of the self-employed from the total output produced and the number of self-employed workers from total employment. Because of the importance of self-employment during the 1990s, we ask what would have happened to labour productivity if self-employment had not grown so rapidly and if the earnings of the self-employed had not fallen behind those of paid workers. The investigation excludes the public sector and non-business sectors of the economy and includes only the business sector. In places, the self-employed will be broken into non-farm and farm self-employed components because the farm category is substantially different from the rest of the economy. This paper not only investigates the influence of self-employment on labour-productivity growth in the business sector, but it also explores various measures of labour productivity and definitions of self-employment. Two measures of labour productivity will be examined; the first uses hours worked as a measure of labour input; the second uses number of jobs. These measures will be discussed in more detail below.
Finally, a Canadian and United States comparison will also be made in this paper. Data series have been constructed that are qualitatively identical for each of the categories presented. This comparison will help to highlight one possible explanation of why labour-productivity growth in the Canadian business sector declined relative to the United States over the 1987 to 1998 period. The paper is structured in the following manner. Section 2 briefly defines the concept of self-employment used in this study. Section 3 discusses available data sources that can be used to measure the growth of self-employment. Section 4 describes the relative performance of the self-employed. Section 5 outlines the measures of labour productivity used and describes the data sources employed. Section 6 compares the growth in the share of net income of the self-employed and compares it to the growth in their share of hours worked. Section 7 presents an analysis of the changing trend in labour productivity over the decade for the various sub-sectors of the business sector. The Canadian and United States labour productivity comparison is made in Section 8. Finally, Section 9 presents some concluding remarks.
Economic Analysis Research Paper Series - 3 - Statistics Canada 11F0027 No. 016
2. Definitions of self-employment At Statistics Canada, two separate definitions of self-employment are used.1 First, the Labour Force Survey (LFS) defines two broad categories of workers: paid employees and the self-employed—that is, individuals who work for others and persons who work for themselves.2
In the total economy, paid employees include both private and public workers.3 Paid employees fulfil the following criteria: “hired by an employer, paid a wage or salary, do not own their own business, have EI premiums and income tax deducted at source, and are subject to labour legislation regarding such things as holiday pay and other benefits…” (Statistics Canada, Labour Force Update, 1997: p.5).
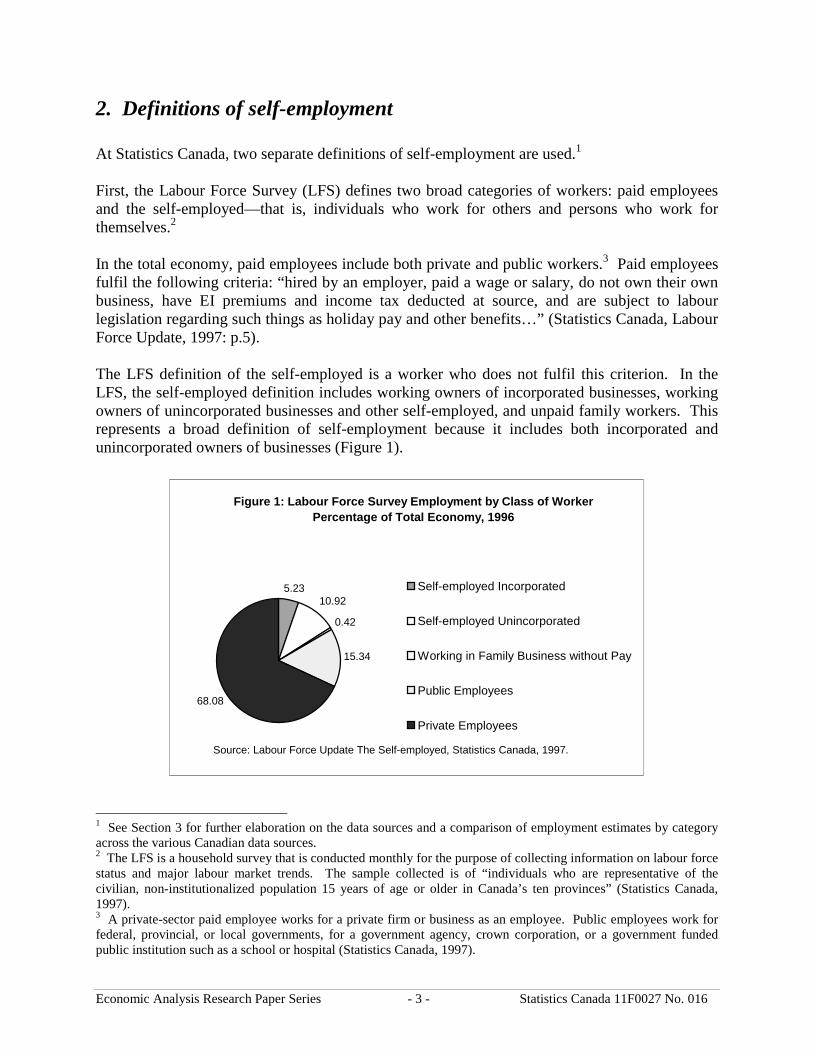
The LFS definition of the self-employed is a worker who does not fulfil this criterion. In the LFS, the self-employed definition includes working owners of incorporated businesses, working owners of unincorporated businesses and other self-employed, and unpaid family workers. This represents a broad definition of self-employment because it includes both incorporated and unincorporated owners of businesses (Figure 1).
Figure 1: Labour Force Survey Employment by Class of Worker Percentage of Total Economy, 1996
5.2310.92
0.42
15.34
68.08
Self-employed Incorporated
Self-employed Unincorporated
Working in Family Business without Pay
Public Employees
Private Employees
Source: Labour Force Update The Self-employed, Statistics Canada, 1997.
1 See Section 3 for further elaboration on the data sources and a comparison of employment estimates by category across the various Canadian data sources. 2 The LFS is a household survey that is conducted monthly for the purpose of collecting information on labour force status and major labour market trends. The sample collected is of “individuals who are representative of the civilian, non-institutionalized population 15 years of age or older in Canada’s ten provinces” (Statistics Canada, 1997). 3 A private-sector paid employee works for a private firm or business as an employee. Public employees work for federal, provincial, or local governments, for a government agency, crown corporation, or a government funded public institution such as a school or hospital (Statistics Canada, 1997).

Economic Analysis Research Paper Series - 4 - Statistics Canada 11F0027 No. 016
In the second case, the System of National Accounts (SNA) includes only unincorporated self-employed in its definition of the self-employed. Incorporated business owners are not included in the definition of the self-employed since working owners of an incorporated business are considered to be employees of the corporation.4 The self-employed incorporated individuals are included in the paid workers sector in the SNA. In order to estimate the productivity of employed as opposed to self-employed workers, estimates of the earnings contribution that is made to nominal GDP by the latter are needed. Since an approximation to this contribution exists in the SNA for the self-employed when defined as unincorporated,5 it is this definition for the self-employed that is used in this paper.6
3. Growth in the self-employed in the 1990s: Data comparison There are three Canadian data sources that can be used to examine the contribution made by self-employment to changes in total economy employment. The first is the Labour Force Survey. The second is the System of National Accounts that relies primarily on the Labour Force Survey, but also uses longitudinal administrative tax data. The third source is tax data (Longitudinal Administrative Data) that uses a sample of tax filers—either employed or self-employed. Employment counts from each of these categories are compared in Table 1. The SNA estimate of the self-employed in Table 1, which includes only unincorporated self-employed, is lower than the LFS estimate of the self-employed, which includes both self-employed unincorporated and incorporated workers. The growth in the SNA self-employed is also lower than the LFS concept that includes both the incorporated self-employed and unincorporated self-employed concept to define self-employed. The LFS uses a “main job” concept to make the class-of-worker distinctions for every person in the survey in order to produce an employment number. The LFS defines main job as the job or business involving the greatest number of usual hours worked (Statistics Canada, 1997). The LFS estimates for number of jobs and hours-worked are based on this main job or primary employment concept, and do not include secondary jobs or the hours worked in those estimates. The SNA estimates are different because the SNA uses a job concept. While benchmarking to the LFS estimates, the SNA adjusts the estimates to include multiple-job holders and individuals that were out-of-scope for the LFS population. However, the SNA does not include individuals as self-employed that report that they were not at work and not paid over the reference period—these persons are considered “unpaid absentees.”7 4 The self-employed that are incorporated business owners are not eligible for employment insurance coverage/benefits (Statistics Canada, Labour Force Update, 1997: 5). 5 This is the case because the data sources that feed the SNA are not detailed enough to distinguish self-employed incorporated individuals from other incorporated businesses. The primary source for self-employed unincorporated is Taxation Statistics derived from a stratified sample of the Canada Customs and Revenue Agency’s T1 returns (Statistics Canada, 1990). For more detail on data sources, see reference Statistics Canada, 1990. 6 The unpaid family workers class will be included with the self-employed unincorporated estimates for this study; however, this should not affect the results significantly since unpaid family workers, for hours worked, only accounted for 6.14% in 1987 and 3.23% in 1997 of the entire self-employed unincorporated class. 7 See Appendix 4 Section 3 for further details on unpaid absentees.

Economic Analysis Research Paper Series - 5 - Statistics Canada 11F0027 No. 016
For comparative purposes, estimates of the self-employed derived from the Longitudinal Administrative Data (LAD) tax file are also presented.8 On the LAD file, “self-employment, net income” is defined as “the sum of all net income earned from self-employment,” where sources of self-employment income include: business, professional, commission, farming, and fishing (Statistics Canada, 1998; 61).9 For each of these categories, gross income is also reported, where gross income is the entire income of the taxfiler’s unincorporated operation, before expenses and costs are deducted.
Both the self-employed net and gross income estimates from LAD can be used to obtain estimates of the employed and the unincorporated self-employed. To do so, we classify each individual as either employed or self-employed. And since some individuals report both employment and self-employment income, a rule must be devised to assign each individual to a category. We employ two separate rules in Table 1. In the first case, self-employment is defined to occur when net self-employment income is greater than wages (T4 earnings). This method, therefore, is in the spirit of the LFS in that it classifies an individual to his/her main source of income. But this measure differs from the LFS definition of self-employment in several ways. It differs first, in the way that the data are collected, since tax returns are collected at one time during the year and are representative of yearly activity,10 whereas the LFS is collected monthly and uses a six-month sample rotation design. Also the person reporting the information will differ and this will also be responsible for differences in the estimates across samples. For example, typically the individual filing a T1 return confirms the information on the return, whereas the LFS uses a proxy reporting approach, where the reference person reports the information for all members of the household.
8 The LAD is a random sample of 20% of the T1 Family File. For more detail on the development of this file, see reference Statistics Canada 1998. 9 In 1987, income from limited or non-active partnerships may have been included in this variable when it was part of self-employment business income. However, after this period, from 1988 to 1998 only the taxfiler’s proportion of active self-employment partnership income is included (Statistics Canada, 1998). 10 It is important to note that “until 1994, reporting of self-employment income was on a fiscal year basis and the fiscal year end was the taxation year for reporting this income. Beginning in 1995, most individuals are required to report self-employment income on a calendar year basis” (Statistics Canada, 1998: 17).

Estimates of the self-employed in the 1990s Table 1. Number of Jobs Comparison
System of National Accounts (SNA)1 Labour Force Survey (LFS) LAD7
Year
Total economy
All public and
private employees
Business
sector2
Self-employed3
Total
economy4
All public and
private employees
Self-employed5
Labour
market6
Net self-employment
Income > Wages Gross SE
Income > Zero
1987 12,586,131 11,330,399 9,793,355 1,255,732 12,318,600 10,622,900 1,695,700 13,057,400 930,450 1,557,800
1988 13,024,757 11,738,227 10,171,627 1,286,530 12,709,800 10,938,100 1,771,700 13,392,000 962,150 1,696,450
1989 13,333,635 12,016,792 10,434,298 1,316,843 12,986,000 11,183,300 1,802,700 13,759,750 1,003,250 1,775,600
1990 13,416,530 12,080,966 10,442,217 1,335,564 13,084,600 11,242,000 1,842,600 13,884,800 1,010,750 1,819,100
1991 13,177,410 11,826,953 10,137,605 1,350,457 12,851,500 10,964,200 1,887,300 13,732,200 1,013,950 1,858,400
1992 13,084,495 11,703,913 10,005,441 1,380,582 12,757,900 10,838,800 1,919,100 13,732,400 1,064,400 1,930,600
1993 13,229,118 11,745,599 10,109,421 1,483,519 12,858,700 10,831,800 2,026,900 13,808,200 1,124,850 2,023,550
1994 13,469,903 11,955,953 10,340,865 1,513,950 13,109,900 11,074,500 2,035,400 13,976,550 1,189,600 2,136,700
1995 13,692,847 12,180,961 10,554,627 1,511,886 13,357,900 11,260,600 2,097,300 14,180,500 1,241,150 2,260,000
1996 13,816,026 12,218,666 10,765,446 1,597,360 13,464,400 11,295,200 2,169,200 14,333,600 1,300,800 2,355,500
1997 14,113,291 12,436,497 11,112,352 1,676,794 13,773,600 11,420,000 2,353,600 14,686,000 1,366,550 2,439,300
1998 14,448,168 12,698,909 11,459,574 1,749,259 14,138,500 11,713,400 2,425,100 14,937,300 1,380,350 2,453,100 1 These estimates are generated from LFS estimates; they are adjusted for the productivity estimates to include LFS out of scope. 2 The Business Sector count includes only private employees and self-employed. 3 The self-employed component includes both Non-farm and Farm self-employed unincorporated, and unpaid family workers. 4 The LFS counts include both full-time and part-time employment. 5 The LFS self-employed component includes both incorporated and unincorporated self-employed; own-account and with paid help; and unpaid family workers. 6 Total Economy Labour Participation: the number of individuals reporting market earnings on the T1 Individual Tax Return (T4, other employment income, or self-employment income). 7 The Longitudinal Administrative Database counts do not include incorporated self-employed in the self-employment count.
Econom
ic Analysis R
esearch Paper Series - 6 - Statistics Canada 11F0027 N
o. 016

Economic Analysis Research Paper Series - 7 - Statistics Canada 11F0027 No. 016
A second measure of self-employment using the LAD is calculated by taking all tax filers whose gross self-employment income was greater than zero. This estimate is representative of all of the individuals filing T1 returns who have any self-employment activity. This is a very broad measure of self-employment because it does not take into consideration the concept of “main job.”
All three of the estimates show that self-employment has gone up considerably over the early part of the 1990s. The SNA estimates show a 15% increase in the total number of jobs in the business sector between 1987 and 1998, but self-employment increases by 39%. The LFS indicates that self-employment increased by 43% over the same period. Estimates of self-employment from the tax records using the main income concept increase by 48%.
4. Relative success of the self-employed in the 1990s While the self-employed were growing in the 1990s, their earnings were falling behind paid workers during this period. The LAD tax data can be used to investigate the success of self-employment over the 1990s by examining the increase in earnings per employee for both all employees and the increase in the net income received by the self-employed (Figure 2). In this graph, the self-employed are defined to be tax-filers with self-employment net income greater than wages. From 1989 to 1994, average personal labour income is flat and slightly declining for total self-employment (NTSE), whereas the average total economy labour income measure (TELP) increases steadily over the period. A measure for total earnings less those of the self-employed is consistently above the TELP measure. The growing gap between the TELP minus NTSE sector and the TELP sector is due to the flat growth of the NTSE sector through the period 1989-94.
Figure 2: Longitudinal Administrative DataCumulative Growth Comparison Across Sectors by Class of Worker
100
105
110
115
120
125
130
135
140
145
1987 1988 1989 1990 1991 1992 1993 1994 1995 1996 1997 1998
Year
Ave
rag
e P
erso
nal
Inco
me
per
Wo
rker
In
dex
(B
ase
1987
= 1
00)
Total Economy Labour Participation (TELP)
TELP minus NTSE
Total Self-employment Net Income greater than Wages (NTSE)

Economic Analysis Research Paper Series - 8 - Statistics Canada 11F0027 No. 016
The slowdown in earnings growth did not come from one particular group of the self-employed. To see this, we examined five groups that are identified on the LAD database—professionals, farmers, fishermen, commission earners, and businesses. The net income per person in each of these categories is presented in Figures 4 and 5. The self-employed business-income earners mainly drove the flat growth of total self-employed average personal labour income, from 1989 to 1994. The size of this group increased over the period—from 54.8% to 65.2% of the total self-employed (Figure 3). The proportion of earners with commissions increased slightly over the period. The farming self-employed group declined from 23.7% of the total self-employed to 14.0%. The fall in farming as a proportion of the total self-employed was caused by a dramatic decline in the number of farmers, with self-employment net income greater than wages, not by a decline in farming activity.11 The proportion of those reporting fishing earnings declined gradually over the period—from 4.1% to 1.9% of the total self-employed. The share of professionals reporting self-employed earnings remained relatively constant over the period. The average personal labour income of professionals over the period was significantly above the other self-employment categories (Figure 4). Their average income increased from $50,489 in 1987 to $70,355 in 1998. This group exerts a substantial upward pull on average income of total self-employment.
Figure 3: Incidence of Self-employed Categories
0
10
20
30
40
50
60
70
1987 1988 1989 1990 1991 1992 1993 1994 1995 1996 1997 1998
Year
Cat
ego
ries
as
a P
rop
ort
ion
of
the
To
tal S
elf-
emp
loye
d (
Per
cen
tag
e)
Business Commission Farming Fishing Professional
11 The number of self-employed farmers with net income greater than wages declined –13% over the period, where as the farmers with gross income greater than wages only declined –2% from 1987 to 1998.

Economic Analysis Research Paper Series - 9 - Statistics Canada 11F0027 No. 016
Figure 4: Longitudinal Administrative DataAverage Personal Incomes of Professional Self-employed
0
10,000
20,000
30,000
40,000
50,000
60,000
70,000
80,000
1987 1988 1989 1990 1991 1992 1993 1994 1995 1996 1997 1998
Year
Ave
rag
e P
erso
nal
Inco
me
(Sel
f-em
plo
ymen
t N
et In
com
e G
reat
er t
han
W
ages
)
Total Self-employed Professional
Figure 5: Longitudinal Administrative Data
Average Personal Incomes of the Self-employed by Category
7 000
9 000
11 000
13 000
15 000
17 000
19 000
21 000
23 000
25 000
27 000
1987 1988 1989 1990 1991 1992 1993 1994 1995 1996 1997 1998
Year
Ave
rag
e P
erso
nal
Inco
me
(Sel
f-em
plo
ymen
t N
et
Inco
me
Gre
ater
th
an W
ages
)
Total Self-employed Business Commission Farming Fishing
Average income for the business-income earners fell from 1990 to 1992, and only slightly increased over the remainder of the period (Figure 5). The business category is essentially a “catch-all” category on the T1 General tax return, since it is not as clearly defined as the other self-employment categories. This group is quite diverse ranging from artists to trade-persons. This group is the main contributor to the low growth in total self-employment earnings per person over the period. The average earnings of commission earners increased steadily over the period, except for declines in 1995 and 1998. Farm and fishing self-employed average incomes dipped to a low in the recession years 1990 to 1992, and thereafter showed a slight improvement.

Economic Analysis Research Paper Series - 10 - Statistics Canada 11F0027 No. 016
Figure 6: Cumulative Growth Rates of Jobs by Class of Worker Category
50
75
100
125
150
175
1987 1988 1989 1990 1991 1992 1993 1994 1995 1996 1997 1998Year
Ind
ex (
Bas
e 19
87 =
100
)
All paid workers jobs Self-employed paid workersSelf-employed no paid workers Unpaid family worker jobsTotal Self-employed
The slowing in the growth rates of the net earnings per worker of the self-employed is partially a reflection of the self-employment sector’s characteristics. The Labour Force Update (1997) reports that compared to employees, the earnings of self-employed peaked in 1989 and fell in the early 1990’s.12 They argue that this was partly due to the composition of occupations of the self-employed. An increasing percentage of the self-employed were working in service and artistic occupations than in high-paying managerial jobs.13 During the 1990s, several changes in the composition of the labour force occurred. First, the growth in total self-employment substantially outpaced that of paid workers (Figure 6). Second, the self-employed without employees grew more quickly than the self-employed who themselves hired other workers. The own-account grew by 65.4% over the 1987 to 1998 period, and accounted for almost 80% of the total self-employed by 1998. This is in contrast to the self-employed with employees and unpaid family workers whose job numbers declined over the period. A picture of the success and failure of the various groups of the self-employed can be derived from the Survey of Consumer Finance (SCF) and the Survey of Labour and Income Dynamics (SLID). These surveys allow us to calculate the net income of two separate groups of the unincorporated self-employed—those who have employees and those who work on their own account. The latter accounted for 107% of the total increase in unincorporated self-employed, during the period from 1987 to 1997 (Source: SCF). More importantly, ‘own-account’ self-employed was far less successful than most other workers. Over the period, own-account self-employed earnings ranged between 68% and 53% of the average received by paid workers, with the most dramatic differences appearing in the late 1990s
12 Recall that the LFS definition of self-employed includes incorporated individuals, whereas the System of National Accounts definition being used in this paper uses only unincorporated individuals in the self-employment definition. 13 It is also noteworthy that over 35% of self-employed worked 50 or more hours per week in 1996, and that the average work week was typically longer for the self-employed, ranging between approximately 16% to 20% longer than employee workers over the 1987 to 1997 decade (LFS Update, 1997).

Economic Analysis Research Paper Series - 11 - Statistics Canada 11F0027 No. 016
Figure 7: Average Remuneration, By Class of Worker
$10,000
$20,000
$30,000
$40,000
$50,000
$60,000
1987 1988 1989 1990 1991 1992 1993 1994 1995 1996 1997 1998 1999Year
Cu
rren
t D
olla
rs (
$)
Paid Workers (SCF) SE Employers (SCF) SE Own-account (SCF) Total SE (SCF)
Paid Workers (SLID) SE Employers (SLID) SE Own-account (SLID) Total SE (SLID)
Source: Statistics Canada, Survey of Consumer Finances (1987-1997), Survey of Labour and Income Dynamics (1996-1999). In SCF, labour information is collected for persons 15 years old and over. In SLID, labour information is collected for persons 16 to 69 years old.
(Figure 7). Further, own-account self-employed earned on average only about 50% of the per-capita net earnings received by self-employed with employees. The class of worker categories can be further broken down into main and other job groupings, since the SNA estimates include multiple jobholders. Appendix 4 Section 2 investigates whether or not persons taking on second jobs were driving the growth in self-employment. The appendix shows that the growth of self-employed with no paid workers, which is the primary group driving total self-employment growth, increased at the same rate for both main and other job categories, and that there was no substantial difference between these two groups. Thus, the relatively low average remuneration of the self-employed own account group was not due to the growth of self-employment as a secondary source of earnings. The expansion by a group of the self-employed, who supported no other workers in the economy, and who themselves received a net income that was low and falling relative to both other self-employed and to paid workers, would have had a downward impact on various measures of economic performance. In the next section, estimates of the impact of the growth of the self-employed on productivity performance are derived.

Economic Analysis Research Paper Series - 12 - Statistics Canada 11F0027 No. 016
5. Measures of labour productivity Labour productivity is calculated as the ratio of output to a measure of labour input:
t
tt N
YLP = , where Yt is output and Nt is labour input.14 Output is measured as the total value of
goods and services that are produced in the economy—captured either by the expenditures that are made or by the incomes that are paid to all factors of production. Measures of labour input are captured generally by hours-worked. The measure of output that will be used in this investigation is nominal Gross Domestic Product (GDP) at basic prices, as defined by the System of National Accounts productivity program.15 For this exercise, only the business sector will be used. The business sector excludes all non-business activities as well as the implicit rental value of owner-occupied dwellings. The non-business sector includes institutions such as government, education, hospitals and religious organizations.16 Two separate measures of labour productivity will be examined here. The first uses hours worked and the second uses number of jobs as a measure of labour input.
The number of hours-worked measure includes the total hours a person spends working, whether paid or not.17 The number of hours worked is the value of the annual average for all jobs multiplied by the annual average hours worked in all jobs (Statistics Canada, 1997).
The total number of jobs measure for the business sector includes employee jobs for incorporated businesses, employee jobs for unincorporated businesses, self-employment, and unpaid family
14 The output per labour input productivity measure reflects the composite effect of many influences. Such influences include, but are not limited to, changes in technology; capital investment; utilization of capacity; organization of production; and the characteristics and effort of the work force. 15 GDP at basic prices is equal to GDP from the input-output tables at factor cost plus indirect taxes on production minus subsidies on production. For a more detailed definition see Statistics Canada 2001 (156). The United States uses a market price measure of GDP. It is different from the Canadian basic price measure of GDP in that net indirect taxes on final products are excluded from the market price measure to get basic prices. An example of an indirect tax on final goods or services is the Goods and Services Tax (GST). The Canadian GDP from 1987 to 1996 is based on the 1980 Standard Industrial Classification (SIC) and from 1997 to 1998 on the North American Industry Classification System. These classification systems provide estimates that are not substantially different at the aggregate level. The United States GDP estimates are based on the SIC 1987 system. Both Canadian and United States GDP estimates include capitalized software. 16 Appendix 1 has a detailed break down of industries. The non-business industries 231 to 235 are non-profit organizations and 236 to 243 are government; all of these industries are omitted in this analysis and industry 201 Owner occupied dwellings is also excluded from the calculation of sector aggregates. For reference, the business sector in 1992 accounted for 77% of Canadian total GDP. 17 In general, the total number of hours worked includes regular and overtime hours, breaks, travel time, training in the workplace and time lost in brief work stoppages where workers remain at their posts. Total number of hours worked does not include time lost due to strikes, lockouts, annual vacation, public holidays, sick leave, maternity leave or leave for personal needs (Statistics Canada, 1997: 10).

Economic Analysis Research Paper Series - 13 - Statistics Canada 11F0027 No. 016
jobs.18 The number of jobs measure counts multiple jobholders more than once; simply, jobs are counted not persons.
The hours worked concept is the one used in Statistics Canada’s Productivity Measures program in the calculation of labour productivity and the number of jobs measure is included here for comparative purposes. The hours-worked measure has traditionally been used, because the number of jobs measure misses the impact of non-standard work arrangements (for example part-time, temporary and self-employed).19 As non-standard work arrangements rise, the number of jobs will increase but the number of hours-worked may not increase at the same rate. The hours-worked labour input measure is more sensitive to the increasing polarization in the distribution of jobs, between long- or short-hour jobs (Statistics Canada, 2001). The number-of-jobs measure does not capture the increasing variation in work arrangements, whereas the hours-worked measure picks up the heterogeneity in the various types of non-standard jobs that exist. In nominal terms, the estimate of GDP at basic prices is calculated as follows:
ititititit ITLSOSNIUBLIGDP +++= (1)
where ititit SLIWSLI += , (2)
and GDPit = gross domestic product at basic prices;
LIit = labour income; WSit = wages and salaries; SLIit = supplementary labour income;
NIUBit = net income, unincorporated business; OSit = operating surplus; and ITLSit = indirect taxes on production less subsidies on production. These factor incomes at current prices are further composites of other components. Labour income is made up of wages and salaries and supplementary income. Wages and salaries are made up of all payments to labour before deduction of taxes and contributions to social security. Payments include payments-in-kind, commissions, tips, bonuses, director’s fees, and taxable allowances. Supplementary income covers items such as unemployment insurance, pension funds, and other social insurance schemes; items that employers would contribute on behalf of the employee (Statistics Canada, 1989). The net income of unincorporated businesses includes a return to the owners for their entrepreneurship and risk and a return for their labour input. Both agricultural and non-agricultural proprietors are included in this, as are all professionals such as doctors and lawyers, and the net rent of persons from residential and non-residential property. Operating surplus includes business profits before taxes and dividend distribution, investment income other than net rental income of persons, capital consumption allowances and an
18 Unpaid family jobs are typically found in agriculture and retail trade sectors and other similar sectors where family firms are important. 19 Non-standard work includes part-time work, temporary work, multiple jobs and self-employed without paid employees (Krahn, 1995). Sunter (1993) also includes shift-work in the definition of non-standard work.

Economic Analysis Research Paper Series - 14 - Statistics Canada 11F0027 No. 016
inventory valuation adjustment.20 Finally, indirect taxes on production less subsidies on production are included to get estimates for GDP at basic prices.21 It should be noted that both the labour and the operating surplus could be separated into two components—those arising from activities by the incorporated (with an INC suffix) and the unincorporated sector (with an UNINC suffix).
ititititititit ITLSOSUINCOSINCNIUBLIUINCLIINCGDP +++++= (3)
The contribution of the unincorporated sector then consists of the net income earned by unincorporated business, the wages and salaries that unincorporated business pay to employees if they have any, and any operating surplus that is not reported as part of net income—any depreciation of capital and interest payments. In what follows, the impact on productivity growth of the self-employed will be examined by recalculating the numerator and the denominator of the output per worker measure. In the numerator, the net earnings accruing to the unincorporated business sector is removed from the total GDP measure. In the denominator, the hours worked of unincorporated self-employed are removed from total hours worked. In doing so, two distinct economic sectors are created (see Figure 8). These are: the Self-employed sector, whose sub-components are non-farm self-employed and farm self-employed, and the remainder of the commercial sector—what is referred to in this paper for expositional purposes as the Business-sector Apart from Self-employed (the BASE sector). The BASE sector consists mainly of the incorporated portion of the economy, where paid employees work in what can be described as goods and services “factories”. The opposite is the self-employed portion of the economy which, as has been demonstrated, consists mainly of unincorporated entrepreneurs working on their own—in a “non-factory” environment. In summary, we ask what the effect is of removing the net income that is attributed to the unincorporated self-employed from GDP when calculating labour productivity. In other words, we remove that part of GDP that accrues in the way of net income to the self-employed and ask what trajectory the remainder follows. Output per worker is equal to a weighted average of the net income accruing to self-employed workers and output per worker in the BASE sector, that is:
)/(*)/(*/ 21 SEMPNIUBWPRODBASEWEMPGDP += (4)
20 In operating surplus, dividends and interest income are regarded as re-distributions of income or transfers of income rather than income originating in the receiving industry. Also the capital consumption allowances (CCA) and inventory valuation adjustments (IVA) are included in the BASE sector (operating surplus category) as aggregate adjustments for all industries, as opposed to being broken out between the various factor incomes. This treatment of CCA and IVA is the same for the United States data. See Appendix 6, for a partial decomposition of operating surplus across the “incorporated” and “unincorporated” sectors. 21 The proportion of the net income of unincorporated business (NIUB) that is due to subsidies cannot be isolated from the factor income NIUB. This is true for the non-farm and farm self-employed. Thus, self-employment income for both Canada and the United States will have an upward bias equal to this subsidy component.

Economic Analysis Research Paper Series - 15 - Statistics Canada 11F0027 No. 016
where total employment (EMP) is equal to production worker employment (PROD) and self-employment (SEMP), that is:
EMP PROD SEMP= + (5)
and the weights (W1,W2) are just the ratios of production worker and self-employment to total employment, that is:
1 /W PROD EMP= and 2 /W SEMP EMP= (6)
In order to assess the impact of self-employment on the growth in on overall labour productivity, we remove that portion of GDP that is a joint return to hours-worked by the self-employed and the profits that they earn as a result of their risk-taking (NIUB) from business-sector GDP and calculate the productivity of the BASE sector. We are interested in investigating whether once this component is removed, productivity growth in the remainder (referred to here as the BASE) is higher than the total business-sector productivity growth rate.
It should be noted that we are not removing all of the GDP that is created by this self-employed group (see equation 3). And therefore, the incorporated as opposed to unincorporated dichotomy that we have referred to above is not perfect, since the employees of unincorporated businesses are included in the BASE sector. In other words, the wages and salaries, hours worked, and number of jobs of the paid workers in the unincorporated sector are included in the BASE sector in our calculations.22 But the earlier section of this paper that outlines the growth of the self-employed in the Canadian economy in the 1990s indicates that this omission is probably not serious for the interpretation of our results. For almost all of the increase in the self-employed over the period being studied came from that group of the self-employed who had no employees and therefore their net income probably captures almost all of their contribution to GDP. In order to test whether these omissions matter for the conclusions of this paper, we move from the net income per self-employed concept to GDP per worker in Appendix 7 for the most important segment of the self-employed sector—the ‘business’ group of self-employed. And when corrections are made to bring the measure of net income per self-employed worker closer to GDP per worker, the results are unchanged.
22 We are presently examining the feasibility of using tax files to remove the remaining component.

Economic Analysis Research Paper Series - 16 - Statistics Canada 11F0027 No. 016
Figure 8: Sector Breakout
Non-Business Sector
Total Economy Government and
Non-profit Organizations
Aggregate Business Sector
Business Sector Apart from Self-employed Non-Farm
(BASE)
Farm
Self-employed
Total Self-employed Sector
6. Relative size of self-employment in the business sector Nominal GDP The various components of nominal GDP used in this analysis—GDP in the business sector, the net income accruing to the self-employed, and the remainder (BASE component) are presented in Table 2. The self-employed group is also subdivided into farm and non-farm categories. To calculate the farm portion of the self-employed category, we defined the farm sector as livestock farms, field crop farms and service industries incidental to agriculture and the sum of the NIUB therein is taken as farm self-employed income. The self-employed proportion of nominal GDP is relatively stable overtime, increasing slightly over the period from 5.79% to 5.98%. The proportion of business-sector nominal GDP, due to the non-farm self-employed component, increased by 0.43%. On the other hand, the self-employed farm component declined over the period by -0.24%. This component was relatively volatile over the period ranging from a low of 0.27% to a high of 0.79%.

Economic Analysis Research Paper Series - 17 - Statistics Canada 11F0027 No. 016
Table 2. Nominal GDP (Canadian)—Categories as a Percentage of Aggregate Business Sector
Aggregate Total Self-employed
Year Business Sector BASE** Self-employed Non-Farm Farm
1987 100 94.21 5.79 5.24 0.56 1988 100 93.94 6.06 5.27 0.79 1989 100 94.21 5.79 5.33 0.46 1990 100 94.18 5.82 5.35 0.48 1991 100 93.98 6.02 5.63 0.39 1992 100 93.71 6.29 5.88 0.41 1993 100 93.52 6.48 5.95 0.53 1994 100 94.01 5.99 5.72 0.27 1995 100 94.03 5.97 5.46 0.51 1996 100 93.79 6.21 5.49 0.72 1997 100 94.08 5.92 5.63 0.28
1998 100 94.02 5.98 5.67 0.32 **Business-sector Apart from Self-Employed
Table 3. Hours Worked (Canadian)—Categories as a Percentage of Aggregate Business Sector
Aggregate Total Self-employed
Year Business Sector BASE** Self-employed Non-Farm Farm
1987 100 86.65 13.35 9.26 4.09 1988 100 86.79 13.21 9.38 3.83 1989 100 86.75 13.25 9.61 3.65 1990 100 86.49 13.51 9.87 3.64 1991 100 86.00 14.00 10.59 3.41 1992 100 85.70 14.30 10.76 3.54 1993 100 85.08 14.92 11.34 3.58 1994 100 85.04 14.96 11.55 3.40 1995 100 85.57 14.43 11.27 3.16 1996 100 85.09 14.91 11.74 3.17 1997 100 84.98 15.02 12.02 3.01
1998 100 84.75 15.25 12.40 2.85
**Business-sector Apart from Self-Employed
Hours worked In contrast to the self-employed share of nominal output, which grew only marginally, the share of hours worked by the self-employed grew over the 1987 to 1998 period by 14.2%. As a result, business-sector hours worked by the self-employed increased from 13.35 to 15.25% of the total (Table 3). This was mainly driven by the non-farm self-employed, whose proportion of all hours worked in the business sector increased from 9.26 to 12.40%. The share of hours worked by the farm self-employed decreased. Number of jobs The picture given of the contribution of the self-employed to total labour input is similar, whether measured as hours worked or number of jobs. The growth rate of the share of self-employed jobs grew by 39.3%, which was higher than the growth rate of the share of hours worked of 32.0%. Over the 1987 to 1998 period, the proportion of total jobs accounted for by

Economic Analysis Research Paper Series - 18 - Statistics Canada 11F0027 No. 016
the non-farm self-employed sub-sector increased from 9.4% to 12.9% (see Table 4). The farm sector declined. The number of jobs in the BASE sector has increased, over the reference period, though this occurred primarily after the recession years 1990 to 1992. The number of jobs in the self-employed farm sector declined over the 1987 to 1998 period by 19.0%—from 339,927 to 275,315 jobs (see Appendix 2). The number of jobs in the non-farm self-employed group has consistently trended upward over the reference period. The number of jobs increased from 1987 to 1998 in non-farm self-employed from 915,804 to 1,473,944—a 60.95% increase. This rate of increase was considerably greater than the 13.7% growth in jobs in the BASE sector.
Table 4. Number of Jobs (Canadian)—Categories as a Percentage of Aggregate Business Sector
Aggregate Total Self-employed
Year Business Sector BASE** Self-employed Non-Farm Farm
1987 100 87.18 12.82 9.35 3.47 1988 100 87.35 12.65 9.38 3.26 1989 100 87.38 12.62 9.59 3.03 1990 100 87.21 12.79 9.79 3.00 1991 100 86.68 13.32 10.51 2.81 1992 100 86.20 13.80 10.91 2.89 1993 100 85.33 14.67 11.74 2.94 1994 100 85.36 14.64 11.83 2.81 1995 100 85.68 14.32 11.70 2.63 1996 100 85.16 14.84 12.20 2.63 1997 100 84.91 15.09 12.53 2.56
1998 100 84.74 15.26 12.86 2.40
**Business-sector Apart from Self-Employed
7. Labour-productivity growth Nominal output per hour worked From 1987 to 1998, labour productivity in the business sector (GDP per hour worked) ranged from a low of $21.79 in 1987, to a high of $30.48 per hour in 1998, steadily increasing through the period (Table 5). This was lower than the residual that was calculated for the BASE sector—by removing the net income accruing to the self-employed from business-sector GDP and the hours-worked by the self-employed from total hours worked. The BASE sector increased from $23.69 to $33.81 between 1987 to 1998. This shows that the estimate of the growth in labour productivity in the business sector is about 10% lower than it would have otherwise been because of low hourly earnings of the self-employed in the non-farm and farm self-employed sub-sectors.

Economic Analysis Research Paper Series - 19 - Statistics Canada 11F0027 No. 016
Table 5. Canadian Nominal Output per Hour Worked (Dollars)
Aggregate Total Self-employed
Year Business Sector BASE** Self-employed Non-Farm Farm
1987 21.79 23.69 9.45 12.32 2.97 1988 22.89 24.78 10.50 12.86 4.72 1989 23.74 25.79 10.37 13.17 3.00 1990 24.38 26.55 10.51 13.21 3.18 1991 25.04 27.37 10.77 13.30 2.90 1992 25.71 28.11 11.30 14.04 3.00 1993 26.35 28.96 11.45 13.84 3.89 1994 27.40 30.29 10.97 13.57 2.16 1995 28.63 31.47 11.84 13.86 4.61 1996 29.17 32.15 12.15 13.65 6.60 1997 30.11 33.34 11.86 14.12 2.84
1998 30.48 33.81 11.96 13.93 3.37
**Business-sector Apart from Self-Employed
The rate of growth of the self-employed non-farm and farm sector has been below the growth in BASE sector GDP per hour worked over the period (see Table 6). The growth rate over the entire period for the BASE sector was 42.8%, which significantly out-paced the non-farm and farm self-employed, which over the period only grew 13.1% and 13.5%, respectively. The low rates of growth in non-farm and farm self-employment meant the growth rate of labour productivity in the business sector (39.9%) was 2.85% points lower than in the BASE sector over the entire time period.
Table 6. Year-to-Year Percentage Change in Nominal Output per Hour Worked (Canadian)
Aggregate Total Self-employed
Year Business Sector BASE** Self-employed Non-Farm Farm
1987 . . . . . 1988 5.09 4.62 11.10 4.38 59.01 1989 3.71 4.06 -1.24 2.41 -36.47 1990 2.69 2.96 1.34 0.33 6.19 1991 2.70 3.07 2.47 0.69 -9.01 1992 2.66 2.72 4.98 5.50 3.48 1993 2.49 3.03 1.28 -1.43 29.99 1994 3.99 4.59 -4.18 -1.94 -44.57 1995 4.51 3.89 7.90 2.18 113.73 1996 1.86 2.17 2.61 -1.56 42.96 1997 3.25 3.71 -2.33 3.46 -56.87
1998 1.21 1.42 0.78 -1.34 18.35
1987 to 1998 39.91 42.76 26.50 13.09 13.50 **Business-sector Apart from Self-Employed
Nominal output per number of jobs
The level of net earnings per unit of labour input from the self-employed using output per job of the self-employed should to be higher relative to the BASE sector than it was when measured as output per hour worked because the output-per-job measure is biased upward as a measure of labour input for the self-employed relative to the BASE sector by the growth in non-standard

Economic Analysis Research Paper Series - 20 - Statistics Canada 11F0027 No. 016
work arrangements.23 As the Labour Force Survey Update (1997) demonstrates, the self-employed typically work longer work-weeks and this results in a relatively lower labour productivity yielded by the output-per-hour than the output-per-job measure. But the non-farm self-employed output per job was also relatively flat over the period. Over the period, the BASE sector increased from a low of $43,349 to a high of $61,494 per job (see Table 7). Labour productivity in the BASE sector in 1987 was 8.1% higher than in the aggregate business sector—increasing to 11.0% higher by 1998. Once more, the BASE sector grows at a higher rate than the aggregate business sector. Over the decade, the growth rates of output per job are not that different than the output-per -hours worked growth rates for the total business sector and the BASE sector. The BASE sector output-per-job growth rate is not substantially different than the output per hour-worked growth rate (41.86% compared to 42.76%). This is also the case for the growth rate in the aggregate business sector—38.16% for output per job compared to 39.91% for output per hour-worked. There is a substantive difference between the two measures for the self-employed category (see Table 8). Particularly, the non-farm self-employed growth rate over the period is notably lower under the output-per-worker than the output-per-hour-worked measure. The total self-employed growth rates over the period, for the output per job and output per hours-worked measures, are 19.8% and 26.5%, respectively. This results from higher increases in self-employment jobs than hours worked. The difference between the growth rate for the aggregate business sector and the BASE sector is 3.7% for the output-per-jobs measure, which is greater than the difference between the output per hours-worked decade growth rate in the two sectors of 2.9%.
Table 7. Canadian Nominal Output per Number of Jobs (Dollars)
Aggregate Total Self-employed
Year Business Sector BASE** Self-employed Non-Farm Farm
1987 40,115 43,349 18,127 22,464 6,444 1988 42,375 45,572 20,299 23,800 10,234 1989 43,836 47,264 20,106 24,365 6,651 1990 44,722 48,294 20,367 24,425 7,098 1991 45,302 49,117 20,479 24,259 6,354 1992 46,256 50,286 21,079 24,918 6,598 1993 47,622 52,193 21,043 24,161 8,584 1994 50,055 55,128 20,475 24,199 4,782 1995 52,070 57,150 21,687 24,287 10,100 1996 53,329 58,731 22,322 24,002 14,535 1997 55,095 61,045 21,611 24,768 6,123
1998 55,424 61,494 21,724 24,425 7,268
**Business-sector Apart from Self-Employed
23 Non-standard work arrangements have been on the rise. They have increased from 28% of LFS total employment in 1989 to 33% in 1994 (Krahn, 1995: 39).

Economic Analysis Research Paper Series - 21 - Statistics Canada 11F0027 No. 016
Table 8. Year-to-Year Percentage Change in Nominal Output per Number of Jobs (Canadian)
Aggregate Total Self-employed
Year Business Sector BASE** Self-employed Non-Farm Farm
1987 . . . . . 1988 5.63 5.13 11.98 5.95 58.81 1989 3.45 3.71 -0.95 2.37 -35.01 1990 2.02 2.18 1.29 0.25 6.71 1991 1.30 1.70 0.55 -0.68 -10.47 1992 2.11 2.38 2.93 2.71 3.83 1993 2.95 3.79 -0.17 -3.04 30.10 1994 5.11 5.62 -2.70 0.16 -44.29 1995 4.03 3.67 5.92 0.37 111.22 1996 2.42 2.77 2.93 -1.18 43.91 1997 3.31 3.94 -3.19 3.19 -57.87
1998 0.60 0.74 0.53 -1.38 18.69
1987 to 1998 38.16 41.86 19.84 8.73 12.78
**Business-sector Apart from Self-Employed
Year-to-year growth rates are typically not the best measures for discerning long-term trends because of the effect of short-term cycles. The cumulative growth in labour productivity provides a better measure of long-term movements. The cumulative growth in labour productivity of both output per job and output per hour worked for both the business sector and the BASE sector has been increasing steadily over the period (Table 9 and Figure 9). However, from 1994 to 1998, the two sectors diverge, as the low productivity self-employment category accounts for a greater proportion of the hours worked and number of jobs in the economy. The self-employed category’s divergence from the BASE sector begins in 1994 and the gap continues to widen over the reference period. The difference in growth rates over the period for the business sector and the BASE sector ranges from 2.9% (hours worked measure) to 3.7% (number of jobs). Thus the increasing proportion of self-employed in the economy contributed to a lower growth rate in labour productivity over the decade.24
Table 9. Cumulative Growth in Nominal Output per Hour Worked (Base 1987 = 100) (Canadian)
Aggregate Total Self-employed
Year Business Sector BASE** Self-employed Non-Farm Farm
1987 100 100 100 100 100 1988 105.1 104.6 111.1 104.4 159.0 1989 109.0 108.9 109.7 106.9 101.0 1990 111.9 112.1 111.2 107.3 107.3 1991 114.9 115.5 113.9 108.0 97.6 1992 118.0 118.7 119.6 113.9 101.0 1993 120.9 122.3 121.1 112.3 131.3 1994 125.8 127.9 116.1 110.1 72.8 1995 131.4 132.9 125.2 112.5 155.5 1996 133.9 135.7 128.5 110.8 222.4 1997 138.2 140.8 125.5 114.6 95.9
1998 139.9 142.8 126.5 113.1 113.5
**Business-sector Apart from Self-Employed
24 The cumulative growth rate of the combined self-employment category exceeds both of its components because of differences in weighting schemes used to estimate each category. See Appendix 8.

Economic Analysis Research Paper Series - 22 - Statistics Canada 11F0027 No. 016
Figure 9: Canadian Cumulative Growth of Nominal Output per Hour Worked
100
110
120
130
140
1987 1988 1989 1990 1991 1992 1993 1994 1995 1996 1997 1998
Year
Ind
ex (
Bas
e 19
87 =
100
)
Aggregate Business Sector BASE** Self-employed
**Business-sector Apart from Self-Employed
These aggregate trends are also present across those industries that accounted for the largest share of self-employed mixed income. There are seven industries that comprise almost 85% of total self-employed mixed income; they are Agricultural and Related Services, Construction, Transportation, Retail Trade, Finance and Real-estate, Business Services, and Health and Social Services Industries. Appendix 5 presents the cumulative growth rates of the total self-employed category’s GDP, Hours-Worked, and Output per Hour Worked for these most influential industries. The general trend is toward a diminishing growth in self-employed output per hour-worked through the 1990’s across most of these seven select industries.
8. Canada and United States Comparison Canadian labour-productivity growth lagged behind that of the United States in the 1990s (Statistics Canada, 2001). The previous section has demonstrated that the lag in earnings in the Canadian self-employed component of the business sector had a detrimental effect on the growth in labour productivity. In this section, we ask whether the increasing trend to self-employment in Canada contributed to the gap between Canada and the United States. To answer this question, we first investigate whether the increase in the relative importance of self-employment is a characteristic of both the Canadian and United States economies. This comparison will focus specifically on how the contribution of self-employment to the growth in nominal output per hour differed between the two countries. A comparison will then be made between the cumulative growth of nominal and deflated output per hour worked over the decade.
Economic Analysis Research Paper Series - 23 - Statistics Canada 11F0027 No. 016
Data and Definitions For the cross-country comparison, data series are constructed that are as similar as possible. The U.S. data were obtained from the Bureau of Labor Statistics (BLS) and the Bureau of Economic Analysis (BEA). These data were available at a sufficient level of detail to allow the U.S. series to be matched to the Canadian series, with minor exceptions. The data on nominal output, hours-worked, all persons and employees for the business, non-farm, and farm sectors were obtained from the BLS and reflect the press release of December 6, 2001.25 The estimate of nominal gross domestic product for the business sector excludes general government, paid employees of private households, non-profit institutions and the imputed rental value of owner-occupied dwellings (BLS Handbook of Methods, 1997).26 Identical exclusions were also made for the labour inputs—hours worked and number of jobs. There is one minor difference that is worth noting. The aggregate business sector in Canada includes the private households service sector. In contrast, the U.S. removes the private households sector from the business sector. Thus, the private households’ portion is included in the Canadian series and is absent from the U.S. series.27 The U.S. hours-worked measure is calculated using an hours-at-work concept, which is conceptually the same as the Canadian definition.28 The definition of number of jobs is also conceptually the same as the Canadian. The estimate counts jobs rather than persons, and as a result, persons with more than one job are counted more than once. The hours-at-work measure of labour input is the more appropriate measure because it takes into consideration full-time, part-time, temporary employees and other non-standard work arrangements. The self-employed unincorporated entrepreneurs’ estimates for hours-at-work and the number of jobs is derived from the BLS data by taking the difference of all persons and employees estimates.29 The self-employed estimates of nominal gross domestic product were derived from the BEA “Proprietors’ Income by industry (1987 SIC basis) in millions of current dollars, 1987-1998.” The proprietors inventory valuation adjustments and capital consumption allowances 25 The BLS gets its non-farm employment data from the Current Employment Statistics (CES) program. These estimates are based on the payroll records of a sample of establishments. The Current Population Survey (CPS) is used to gather the information on farm, self-employed unincorporated (proprietors), and unpaid family workers. See the BLS Handbook of Methods Chapter 10 for more details (1997). 26 For reference the U.S. business sector nominal output accounted for about 83% of the value of gross domestic product in 1992—the business sector in 1992 accounted for 77% of Canadian total GDP. 27 For the United States, if the private households sector is included with the business sector it only accounts for between 0.19 to 0.17% of nominal GDP, declining over the decade; 0.99 to 0.82% of the hours worked and 1.57 to 1.19% of the number of jobs. Of the estimated 1.4 to 1.25 million employed in the private households sector it is estimated that (on average over the decade) 0.8% were self-employed. Thus given the relatively small impact of this sector on the business sector, it is reasonable to assume that its exclusion from the business sector will not significantly alter the results of this study. 28 Hours-at-work includes standby time, machine downtime, portal-to-portal time (if paid), wash-up time (if paid), short rest periods, coffee breaks, job site to job site travel time within the working day, away from home travel time if it cuts across the working day, and paid training; and excludes all forms of paid leave, where paid leave includes paid: vacation time, sick leave, holidays, and personal or administrative leave (BLS Handbook of Methods, 1997). 29 This estimate also includes unpaid family workers; however unpaid family workers are typically a small proportion of the aggregate economy. Nonetheless the inclusion of unpaid family workers makes the data series comparable to the Canadian series.

Economic Analysis Research Paper Series - 24 - Statistics Canada 11F0027 No. 016
were left in the business sector to make this series comparable to the Canadian “net income of unincorporated business” series. The BEA proprietors’ income data series were also adjusted to remove the imputed rent of owner occupied dwellings to make them consistent with the BLS published output data used in its productivity estimates.30 In summary, the U.S. data are conceptually equivalent to the Canadian data except for the absence of U.S. private households from the aggregate business sector.
Comparison The effect that the growth in self-employment has had on Canadian labour productivity needs to be assessed relative to changes that have occurred in the United States. The changes that occurred in the self-employed sector may be common to North American business or specific to Canada. Consider first the importance of the total self-employment category relative to the aggregate business sector in Canada and the United States. The changes in the self-employment category are mainly driven by changes in the non-farm self-employed category for both countries. In both countries, the share of GDP arising from the net income of self-employment was a relatively unchanging proportion of the aggregate business sector. The U.S. self-employment category increased from 7.0 to 7.8% from 1987 to 1998 and the Canadian category increased slightly from 5.8 to 6 .0% over the same period (Figure 10).
In contrast, the hours-worked and number-of-jobs measures tell a different story for each country. Canadian hours worked in the self-employment category increased from 13.4 to 15.3% of the total hours worked in the business sector and the number of jobs increased from 12.8 to 15.3% of the total over the same period. In contrast, self-employed hours worked in the U.S. decreased from 12.5 to 10.9% and the number of jobs fell from 11.2 to 9.8% of the total. Thus, in the self-employment category, Canadian net earnings remained constant as a proportion of business-sector nominal GDP, while hours worked and number of jobs as a percentage of the total rose. The U.S. followed a different path. In the U.S., the share of nominal GDP increased, while the proportion of hours worked and number of jobs fell.
30 The imputed rent of owner occupied dwellings (IROOD) for the self-employed (both non-farm and farm) was estimated by calculating the IROOD proportion of business sector nominal gross domestic product for both non-farm and farm and applying this proportion to the respective non-farm and farm proprietors income series to derive a non-farm and farm proprietors income net of the IROOD. The IROOD proprietors’ non-farm proportion was at its lowest at 7.91% in 1987 and highest at 8.51% in 1991 over the 1987 to 1998 period, and for farm, at its lowest at 4.95% in 1989 and its highest at 6.33% in 1995.

Economic Analysis Research Paper Series - 25 - Statistics Canada 11F0027 No. 016
Figure 10: Total Self-employment's Share of the Business SectorA Canadian and United States Comparison
0
2
4
6
8
10
12
14
16
1987 1988 1989 1990 1991 1992 1993 1994 1995 1996 1997 1998Year
Per
cen
tag
e
Canadian GDP Canadian Hours Worked U.S. GDP U.S Hours Worked
It is also noteworthy that the self-employment category as a proportion of the business sector for hours worked and number of jobs in Canada was between 4.4% and 5.5% higher than in the U.S. by 1998. In contrast, the share of GDP accounted for by the net income earned by the self-employed was approximately 1.9% lower in Canada than in the United States. The self-employment sector’s lower share of nominal GDP combined with a higher share of labour inputs in Canada relative to the United States contributed to differences in the business-sector labour productivity between the two countries. For the cross-country comparisons of labour productivity, a cumulative growth measure will be used. The focus in this comparison will be given to the hours-worked measure of labour productivity; however the results are similar for the number of jobs measure. The latter estimates are included in Appendices 2 and 3 for Canada and the U.S., respectively. A comparison of the aggregate business sector and the BASE sector shows that the self-employment category in the United States has had a significant positive effect on the growth in nominal output per hour-worked (Table 10). Over the period, the self-employment category has pulled up U.S. business-sector productivity by 4.1%; in Canada, this same category has provided a 2.9% drag on nominal output per hour worked. In the early 1990s, the recession stalled self-employment’s nominal earnings per hours worked in both countries (Figure 11); however, after 1991, the self-employment categories’ responses were quite different through the remainder of the reference period. In the case of the United States, the growth of self-employment’s nominal earnings per hour worked recovers and continues its upward trend, whereas the Canadian self-employment category continues to stagnate throughout the reference period, with a slight bounce in 1995 and 1996 that is diminished in 1997.
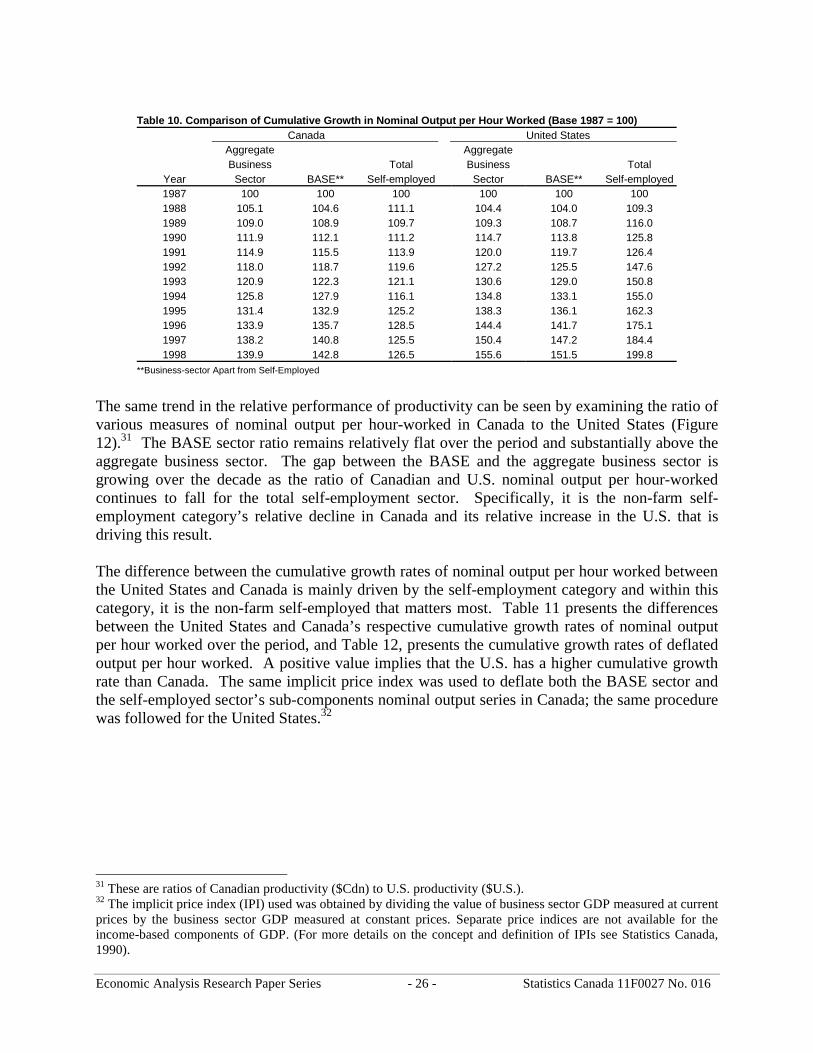
Economic Analysis Research Paper Series - 26 - Statistics Canada 11F0027 No. 016
Table 10. Comparison of Cumulative Growth in Nominal Output per Hour Worked (Base 1987 = 100) Canada United States Aggregate Aggregate
Business Total Business Total Year Sector BASE** Self-employed Sector BASE** Self-employed 1987 100 100 100 100 100 100 1988 105.1 104.6 111.1 104.4 104.0 109.3 1989 109.0 108.9 109.7 109.3 108.7 116.0 1990 111.9 112.1 111.2 114.7 113.8 125.8 1991 114.9 115.5 113.9 120.0 119.7 126.4 1992 118.0 118.7 119.6 127.2 125.5 147.6 1993 120.9 122.3 121.1 130.6 129.0 150.8 1994 125.8 127.9 116.1 134.8 133.1 155.0 1995 131.4 132.9 125.2 138.3 136.1 162.3 1996 133.9 135.7 128.5 144.4 141.7 175.1 1997 138.2 140.8 125.5 150.4 147.2 184.4 1998 139.9 142.8 126.5 155.6 151.5 199.8
**Business-sector Apart from Self-Employed
The same trend in the relative performance of productivity can be seen by examining the ratio of various measures of nominal output per hour-worked in Canada to the United States (Figure 12).31 The BASE sector ratio remains relatively flat over the period and substantially above the aggregate business sector. The gap between the BASE and the aggregate business sector is growing over the decade as the ratio of Canadian and U.S. nominal output per hour-worked continues to fall for the total self-employment sector. Specifically, it is the non-farm self-employment category’s relative decline in Canada and its relative increase in the U.S. that is driving this result. The difference between the cumulative growth rates of nominal output per hour worked between the United States and Canada is mainly driven by the self-employment category and within this category, it is the non-farm self-employed that matters most. Table 11 presents the differences between the United States and Canada’s respective cumulative growth rates of nominal output per hour worked over the period, and Table 12, presents the cumulative growth rates of deflated output per hour worked. A positive value implies that the U.S. has a higher cumulative growth rate than Canada. The same implicit price index was used to deflate both the BASE sector and the self-employed sector’s sub-components nominal output series in Canada; the same procedure was followed for the United States.32
31 These are ratios of Canadian productivity ($Cdn) to U.S. productivity ($U.S.). 32 The implicit price index (IPI) used was obtained by dividing the value of business sector GDP measured at current prices by the business sector GDP measured at constant prices. Separate price indices are not available for the income-based components of GDP. (For more details on the concept and definition of IPIs see Statistics Canada, 1990).

Economic Analysis Research Paper Series - 27 - Statistics Canada 11F0027 No. 016
Figure 11: Canada and United States Comparison of Cumulative Growth of Nominal Output per Hour Worked
100
110
120
130
140
150
160
170
180
190
200
1987 1988 1989 1990 1991 1992 1993 1994 1995 1996 1997 1998Year
Ind
ex (
Bas
e 19
87 =
100
)
Canadian Business Sector U.S. Business Sector
Canadian Self-employed U.S. Self-employed
Figure 12: Canadian and United States Nominal GDP per Hour Worked
0.40
0.50
0.60
0.70
0.80
0.90
1.00
1987 1988 1989 1990 1991 1992 1993 1994 1995 1996 1997 1998Years
Rat
ios
(Can
ada/
Un
ited
Sta
tes)
Business Sector BASE Total Self-employed Non-Farm Self-employed
Table 11. Difference between United States and Canada in the Cumulative Growth (Base 1987 = 100) of Nominal Output per Hour Worked Aggregate
Business Total Self-employed Year Sector BASE** Self-employed Non-Farm Farm
1987 0.00 0.00 0.00 0.00 0.00 1988 -0.72 -0.63 -1.82 7.05 -64.53 1989 0.36 -0.14 6.32 9.21 14.19 1990 2.80 1.67 14.57 19.37 11.41 1991 5.10 4.12 12.42 21.76 3.49 1992 9.21 6.86 28.00 37.05 21.91 1993 9.68 6.78 29.69 41.66 -7.37 1994 9.01 5.24 38.93 51.76 35.04 1995 6.91 3.29 37.06 61.28 -72.99 1996 10.53 5.93 46.59 70.51 -95.50 1997 12.12 6.39 58.88 77.81 22.19 1998 15.70 8.72 73.28 96.02 1.02
**Business-sector Apart from Self-Employed

Economic Analysis Research Paper Series - 28 - Statistics Canada 11F0027 No. 016
The non-farm self-employed category is the main determinant of the upward pull of the self-employment category on nominal output per hours worked in the United States. The difference in the cumulative growth in output per hour-worked in the self-employed sector between the U.S. and Canada increased by 73.28% over the period (Table 11). The cumulative difference in the nominal output per hour-worked in the aggregate business sector of 16 percentage points is almost halved to only 9 percentage points when the effect of the self-employed is removed. Canada’s lagging labour productivity growth relative to that of the U.S. is not as large when the influence of the self-employed is removed. Further, once nominal GDP is deflated and the comparisons are made in real-terms the result is even-more striking.33 The difference between the cumulative growth of deflated output per hour-worked, which was over 7 percentage points for real GDP falls to less than 2% when the Canadian and U.S. BASE sectors are compared over the decade (Table 12 and Figure 13). In other words, Canada’s deflated labour productivity growth deficit relative to the U.S. has become insignificant over the period, once the effects of divergent paths of the non-farm and farm self-employed sectors are removed from the business sector.
Table 12. Difference between United States and Canada in the Cumulative Growth (Base 1987 = 100) of Deflated Output per Hour Worked Aggregate
Business Total Self-employed Year Sector BASE** Self-employed Non-Farm Farm 1987 0.00 0.00 0.00 0.00 0.00 1988 -0.24 -0.17 -1.28 7.21 -61.22 1989 2.80 2.32 8.40 11.05 15.59 1990 4.15 3.13 14.84 19.15 11.92 1991 5.03 4.17 11.45 19.61 3.54 1992 7.77 5.73 24.03 31.87 18.79 1993 7.77 5.29 24.79 35.00 -6.78 1994 5.79 2.62 30.87 41.65 28.22 1995 4.12 1.16 28.73 48.59 -61.17 1996 7.49 3.78 36.42 55.72 -78.11 1997 7.81 3.27 44.73 59.75 16.25 1998 7.30 1.81 52.24 70.27 -3.13
**Business-sector Apart from Self-Employed
33 The Canada/U.S. ratio in nominal terms is not the same as when calculated in real terms because the Canadian and U.S. deflators are not equal.

Economic Analysis Research Paper Series - 29 - Statistics Canada 11F0027 No. 016
Figure 13: Canada and United States Comparison of Cumulative Growth of Deflated Output per Hour Worked
95
100
105
110
115
120
1987 1988 1989 1990 1991 1992 1993 1994 1995 1996 1997 1998
Year
Ind
ex (
Bas
e 19
87 =
100
)
Canadian BASE U.S. BASE Canadian Business Sector U.S. Business Sector
9. Concluding Remarks We have demonstrated that two characteristics of the Canadian self-employed sector have contributed to the growing gap between Canadian and U.S. labour productivity. First, net income per self-employed worker is much lower in Canada relative to paid workers than it is in the United States. Second, there was much weaker growth in self-employment net income in Canada over the 1990s. Together, these two factors resulted in continued downward pressure being put on the growth in business-sector labour productivity. The expansion of Canadian self-employment over the period and the flat growth in self-employment earnings per self-employed worker have resulted in an ever-increasing downward pressure on the growth of Canadian business-sector labour productivity. This process has contributed to lower growth in business-sector labour productivity in Canada than in the United States over the period. The differences between the United States and Canada indicate that there are fundamental structural differences between the self-employed sectors in the two economies. The U.S. non-farm self-employed tended to pull up estimates of business-sector nominal output per worker, whereas the Canadian non-farm self-employed dragged down the estimates of the nominal output per worker in the Canadian business sector. When the non-farm and farm self-employed are removed from the business sector, the labour-productivity gap between the United States and Canada virtually disappears. An explanation for the differences between the two countries throughout the 1990s may lie in labour market conditions, such as changing work arrangements, the relative importance of specific industries, and occupational distribution of the self-employed. Picot, Manser and Lin (1998) report that self-employment in Canada is more likely to be full-time, as opposed to part-

Economic Analysis Research Paper Series - 30 - Statistics Canada 11F0027 No. 016
time.34 They also found industrial concentration of the self-employed to be different between the two countries; the U.S. tends to have a higher proportion of the self-employed in the goods-producing sector (particularly construction) as opposed to the services sector relative to Canada. Over the 1990s, the percent of self-employed managers and precision production workers rose, while the percent of sales workers fell in the United States. The opposite was true of Canada, where sales occupations increased and the percentage of management occupations declined (Gauthier and Roy, 1997). But there is no dominant factor explaining these differences in the self-employed labour markets in the two countries. Picot, Manser and Lin argue that “the Canadian labour market adjusts to structural change more through depressed hiring than increased layoffs” (1998: 23). Individuals losing a job or attempting to enter the labour market for the first time during the 1990s recovery faced declining market opportunities. As a result, those seeking work found it more difficult to find paid full-time jobs. One manifestation of this was the emergence of a different type of self-employment during this period. The LFS Update (1997) reported that ninety percent of new self-employment growth, from 1989 to 1996, was “own-account”—self-employed without paid help. In 1995, 15.4% of the self-employed without paid help reported working in the self-employed sector, because no other work was available. The growth in this group of the self-employed, whose net income lagged that of paid workers in the rest of the economy, was not a result of a particular sector like farming doing particularly poorly. Longitudinal Administrative Data (LAD) (T1 General tax-files) were used to divide the self-employed into five categories (business, commission, farming, fishing, and professional). It was found that the self-employed business income category experienced the highest rate of growth in individuals reporting income, and that they were mainly responsible for the flat nominal growth in the average net incomes of the self-employed from 1989 to 1994. It was this catchall group that depressed the output per worker growth in Canada’s aggregate business sector. The productivity differences between the two countries reflect differences in capital intensity, plant size, firm organization, and the use of advanced technologies; they also reflect the differing effectiveness of each country in providing gainful employment to the same percentage of their labour force. The evidence points to a general problem in the self-employed sector—the new group of self-employed in the 1990s generally did not hire other individuals and were found generally in the catchall business group rather than in the professional or farmer or sales group. Moreover, occupational evidence indicates that Canadian unincorporated entrepreneurs tended to increasingly be engaged in lower paid self-employment opportunities, such as artists, relative to their U.S. counterparts who were more likely to be in higher paid management jobs.
The inclusion of individuals in the Canadian output per worker estimates who were entering low quality self-employment opportunities put a downward bias on the overall labour-productivity estimate. We cannot of course conclude that the self-employed sector was a general failure. Because we have not removed the total GDP being created by the self-employed, we cannot say that the failure of labour productivity in Canada to keep up with that of the United States was due
34 “The percentage of self-employment jobs that are full-time declined over the ’90s in both countries. However, 70% of the net new self-employment jobs created in the 1990s were full-time in Canada, compared to an unadjusted estimate of 35% for the U.S.” (Picot, Manser and Lin, 1998: 11). This study uses a broad definition of self-employment, which includes both the incorporated and unincorporated.

Economic Analysis Research Paper Series - 31 - Statistics Canada 11F0027 No. 016
to the inability of the self-employed sector to generate the same rate of growth of their sectoral GDP as did the self-employed in the United States. But we can say that it arises from their failure to earn the same net income as their American counterparts—that the amount that accrued to the self-employed in Canada as a return on their labour input and for risk-taking slowed substantially in Canada relative to the United States. And we have found that when corrections are made to the ‘business’ sector to transform net income per worker to GDP per worker, our conclusions remain unchanged The self-employed in this study consist of unincorporated individuals. They provide the bulk of the entrepreneurs in our society. It is tempting to conclude that it was our entrepreneurs who were the cause of the productivity slowdown in the early 1990s. But that is probably too simplistic an interpretation. It is more likely that in comparing the growth in total business-sector labour productivity in the two countries in the 1990s, we are making the mistake of comparing two statistical measures with different meanings. Even though we are calling them by the same name (output per worker), they are not measuring the same phenomenon. To understand this, we need to consider the meaning of an output per worker measure. Productivity can be measured not as output per worker but as output per available worker—as output divided by the labour force. The latter measure captures both how effective the economy is in transforming labour into output, but also how effective it is in providing jobs for those members of society who indicate that they are ready to work. Such measures will differ across countries for all of the reasons that we outlined above—differences in capital intensity, in size of plants, in firms’ organizational abilities, and in the use of advanced technologies; but they will also differ because countries are not equally capable of offering gainful employment to the same proportion of their labour force. In the first part of the 1990s, GDP per worker in Canada grew at the same rate as it did in the United States, but the number of workers relative to the labour force fell in Canada (Wells, Baldwin and Maynard, 1999). GDP per available worker in Canada grew much more slowly in Canada relative to the same measure in the United States. The reason is that unemployment increased in Canada far more than in the United States during the recession of the early 1990s—and thus the ratio of number of workers relative to those wanting to work declined in Canada relative to the United States. The measure of output per worker in the business sector combining both employment and self-employment that is used in this study, is probably also affected by a similar phenomenon. In the early 1990s, as unemployment grew, there were fewer opportunities for regular employment in Canada. Restructuring led to substantial layoffs of many individuals who did not find regular work and it is possible that these individuals chose not to call themselves unemployed, but to classify themselves as self-employed. Similarly, hiring by firms slowed and those entering the labour force were less likely to find employment in normal forms of employment. The income earned by those choosing or those being forced into self-employment was not zero, but it was considerably below those who normally classified themselves as self-employed. More importantly, their inclusion in the overall estimate of labour productivity meant that the Canadian measure took on the flavour of a summary statistic that captured output per potential worker—and these measures show that Canada performed worse than did the United States because of our
Economic Analysis Research Paper Series - 32 - Statistics Canada 11F0027 No. 016
inability to employ all those who were willing to work at incomes that had been experienced in the past. The difference is that some of these laid-off workers did find some self-employment—but it provided a remuneration that was considerably below that which the self-employed had previously been able to generate. This phenomenon dragged down the measure of aggregate output per worker in the business sector. In contrast, output per worker in the rest of the economy continued to increase in the 1990s in Canada at about the same pace as it did in the United States.
An implication of this is that the Canadian labour-productivity measure is not always a pure output per worker measure; in recessions, it takes on the characteristics of an output per potential worker measure. In these periods, this quasi-measure of output per potential worker captures two factors—first, how capable the economy is in transforming the labour of those who are working into output and second, how capable the economy is in providing jobs for those who indicate they are willing to work. Moreover, the labour-productivity measure does not always measure how efficient the core business sector in Canada is performing in terms of transforming inputs into outputs. It also measures how successful a society is in providing its workforce with meaningful and remunerative employment. Finally, the results of this paper stress that caution should be employed in making use of labour-productivity statistics to infer long-run trends over periods that are less than one business cycle in length. It has long been appreciated that labour-productivity measures should be used cautiously to infer long run changes in efficiency during a recession when capacity utilization of capital is less than 100%. What is not readily understood is that they can also exhibit cyclical fluctuations because of what is happening to labour markets—especially to the split between employed and self-employed. Labour-productivity measures should be used in conjunction with data capital utilization measures and with a careful analysis of any changes that are occurring in the split between the employed and self-employed.

Economic Analysis Research Paper Series - 33 - Statistics Canada 11F0027 No. 016
Appendix 1: Industry SIC description Mnemonic Description 001 Livestock farms 002 Field crop farms 003 Service industries incidental to agriculture 004 Fishing and trapping industries 005 Logging industry 006 Forestry services industry 007 Gold mines 008 Other metal mines 009 Iron mines 010 Asbestos mines 011 Potash mines 012 Salt mines 013 Other non-metal mines (except coal) 014 Coal mines 015 Crude petroleum and natural gas industries 016 Quarry and sand pit industries 017 Services ind. incidental to mineral extraction 018 Meat and meat products ind. (except poultry) 019 Poultry products industry 020 Fish products industry 021 Fruit and vegetable industries 022 Dairy products industries 023 Cereal grain flour, flour mixes, and cereal food ind. 024 Feed industry 025 Vegetable oil mills (except corn oil) 026 Biscuit industry 027 Bread and other bakery products industry 028 Cane and beet sugar industry 029 Chewing gum, sugar and chocolate confect. ind. 030 Tea and coffee industry 031 Other miscellaneous food products industries 032 Soft drink industry 033 Distillery products industry 034 Brewery products industry 035 Wine industry 036 Leaf tobacco industry 037 Tobacco products industry 038 Tire and tube industry 039 Rubber hose and belting industry 040 Other rubber products industries 041 Natural fibres processing and felt products ind. 042 Foamed and expanded plastic products industry 043 Plastic pipe and pipe fittings industry 044 Plastic film and sheeting industry 045 Plastic bag industry 046 Other plastic products industries n.e.c. 047 Leather tanneries 048 Footwear industry 049 Miscellaneous leather and allied products ind. 050 Man-made fibre and filament yarn industry 051 Other spun yarn and woven cloth industries 052 Wool yarn and woven cloth industry 053 Broad knitted fabric industry 054 Canvas and related products industry 055 Other textile products industries 056 Carpet, mat and rug industry 057 Men's and boys' clothing industries 058 Women's clothing industries 059 Children's clothing industry 060 Miscellaneous clothing and apparel industries 061 Hosiery industry 062 Sawmill, planing mill and shingle mill prod. ind. 063 Veneer and plywood industries 064 Prefab. wood. build., kitchen cabinet and vanity ind 065 Wooden door, window and other millwork ind.
066 Wooden box and pallet industry 067 Coffin and casket industry 068 Particle and wafer board industries 069 Wood preservation and other wood ind. n.e.c 070 Household furniture industries 071 Office furniture industries 072 Other furniture and fixture industries 073 Pulp industry 074 Newsprint industry 075 Paperboard, building board and other. paper ind. 076 Asphalt roofing industry 077 Paper box and bag industries 078 Other converted paper products industries 079 Commercial printing industries 080 Publishing industries 081 Combined publishing and printing industries 082 Platemaking, typesetting and bindery industry 083 Ferro-alloys industry and steel foundries 084 Other primary steel industries 085 Steel pipe and tube industry 086 Iron foundries 087 Non-ferrous metal smelting and refining ind. 088 Aluminum rolling, casting and extruding ind. 089 Copper and copper alloy roll., cast. and extr. ind. 090 Oth. roll., cast and extr. non-ferrous met. prod. ind. 091 Power boiler and heat exchanger industry 092 Pre-engineered metal build. ind. (excl. portable) 093 Fabricated structural metal products ind. n.e.c. 094 Ornamental and architectural metal prod. ind. 095 Stamped, pressed and coated metal prod. ind. 096 Wire and wire products industries 097 Hardware, tool and cutlery industries 098 Heating equipment industry 099 Machine shop industry 100 Other metal fabricating industries 101 Agricultural implement industry 102 Commercial refrig. and air cond. equip. ind. 103 Compressor, pump, turbine and other equip. ind. 104 Construction, mining and handling machinery ind. 105 Sawmill, woodwork., and other MandE ind. n.e.c. 106 Aircraft and aircraft parts industry 107 Motor vehicle industry 108 Truck and bus body and trailer industries 109 Motor vehicle engine and engine parts industry 110 Motor vehicle wiring assemblies industry 111 Motor vehicle stampings industry 112 Motor vehicle steering and suspension parts ind. 113 Motor vehicle wheel and brake industry 114 Plastic parts and access. for motor vehicles ind. 115 Motor vehicle fabric accessories industry 116 Other motor veh. access., parts and assemb. ind. 117 Railroad rolling stock industry 118 Shipbuilding and repair industry 119 Boatbuilding and repair industry 120 Other transportation equipment industries 121 Small electrical appliance industry 122 Major appliance ind. (electric and non-electric) 123 Electric lighting industries 124 Record player, radio and television receiver ind. 125 Telecommunication equipment industry 126 Electronic parts and components industry 127 Other communication and electronic equip. ind. 128 Electronic computing and peripheral equip. ind. 129 Electronic and other office, store and bus. mach. ind. 130 Electrical transformer industry 131 Switchgear, protect. and other electr. ind. equip. ind.

Economic Analysis Research Paper Series - 34 - Statistics Canada 11F0027 No. 016
132 Communications and energy wire and cable ind. 133 Battery industry 134 Miscellaneous electrical products industries 135 Clay products industries 136 Hydraulic cement industry 137 Concrete products industries 138 Ready-mix concrete industry 139 Glass and glass products industries 140 Abrasives industry 141 Lime industry 142 Other non-metallic mineral products industries 143 Refined petroleum products industries 144 Other petroleum and coal products industries 145 Industrial inorganic chemical industries n.e.c. 146 Industrial organic chemical industries n.e.c. 147 Agricultural chemical industries 148 Plastic and synthetic resin industry 149 Pharmaceutical and medicine industry 150 Paint and varnish industry 151 Soap and cleaning compounds industry 152 Toilet preparations industry 153 Other chemical products industries 154 Indicating, recording and controlling instr. ind. 155 Other scientific and professional equipment ind. 156 Jewellery and precious metal industries 157 Sporting goods industry 158 Toys and games industry 159 Sign and display industry 160 Floor tile, linoleum and coated fabric industry 161 Musical instrument and sound recording industry 162 Miscellaneous manufactured products ind. n.e.c. 163 Repair construction 164 Residential construction 165 Non-residential building construction 166 Road, highway and airport runway construction 167 Gas and oil facility construction 168 Electric power, dams and irrigation construction 169 Railway, and telecommunication construction 170 Other engineering construction 171 Construction, other activities 172 Air transport and related service industries 173 Railway transport and related service industries 174 Water transport and related services industries 175 Truck transport industries 176 Urban transit systems industry 177 Interurban and rural transit systems industry 178 Taxicab and other transportation industries 179 School and other bus operations industries 180 Other service ind. incidental to transportation 181 Natural gas pipeline transport industry 182 Crude oil and other pipeline transport industries 183 Grain elevator industry 184 Other storage and warehousing industries 185 Radio and television broadcasting industries
186 Cable television industry 187 Telecommunication carriers industries 188 Postal and courier service industries 189 Electric power systems industry 190 Gas distribution systems industry 191 Water systems and other utility industries n.e.c. 192 Wholesale trade industries 193 Retail trade industries 194 Central bank 195 Banks and other deposit accepting intermed. 196 Credit unions and caisses populaires 197 Other financial intermediary industries 198 Real estate operator industries 199 Insurance and real estate agent industries 200 Insurance industries 201 Owner occupied dwellings 202 Computer and related services 203 Accounting and legal services 204 Architectural, eng., and oth. scientific and tech. serv. 205 Advertising services 206 Miscellaneous business service industries 207 Educational service industries 208 Other health and social service industries 209 Health practitioners and medical laboratories ind. 210 Accommodation service industries 211 Food and beverage service industries 212 Motion picture, audio and video prod. and distrib. 213 Motion picture exhibition 214 Other amusement and recreational service ind. 215 Lotteries, bingos, casinos, etc. 216 Laundries and cleaners 217 Other personal service industries 218 Photographers 219 Mach. and equip., auto. and truck rent. and leasing serv. 220 Business and professional membership assoc. 221 Travel services 222 Other services n.e.c. 223 Oth. repair serv. and serv. to buildings and dwellings 231 N.B. - P Religious organizations 232 N.B. - P Welfare organizations 233 N.B. - P Sports and recreation clubs 234 N.B. - P Educational institutions 235 N.B. - P Other organizations 236 N.B. - G Hospitals 237 N.B. - G Residential care facilities 238 N.B. - G University education 239 N.B. - G Other educational serv. 240 N.B. - G Defence services 241 N.B. - G Other municipal govt. 242 N.B. - G Other provincial and territorial govt. 243 N.B. - G Other federal govt.

Economic Analysis Research Paper Series - 35 - Statistics Canada 11F0027 No. 016
Appendix 2: Canadian data Table A2.1: Canadian Nominal GDP*
Aggregate Total Self-employed
Year Business Sector BASE** Self-employed Non-Farm Farm
1987 392,864,108 370,101,303 22,762,805 20,572,331 2,190,474 1988 431,023,620 404,907,799 26,115,821 22,718,190 3,397,631 1989 457,400,472 430,923,665 26,476,807 24,371,276 2,105,531 1990 466,999,973 439,799,203 27,200,770 24,980,367 2,220,403 1991 459,258,016 431,601,601 27,656,415 25,844,867 1,811,548 1992 462,814,519 433,712,835 29,101,684 27,193,232 1,908,452 1993 481,431,513 450,214,279 31,217,234 28,668,174 2,549,060 1994 517,608,563 486,610,709 30,997,854 29,609,440 1,388,414 1995 549,579,827 516,791,093 32,788,734 29,990,362 2,798,372 1996 574,109,235 538,453,353 35,655,882 31,535,781 4,120,101 1997 612,231,114 575,994,476 36,236,638 34,498,035 1,738,603
1998 635,131,906 597,130,304 38,001,602 36,000,698 2,000,904 * Nominal GDP is reported in thousands of dollars. **Business-sector Apart from Self-Employed
Table A2.2: Canadian Hours Worked*
Aggregate Total Self-employed
Year Business Sector BASE** Self-employed Non-Farm Farm
1987 18,033,518 15,625,194 2,408,324 1,669,904 738,4201988 18,826,824 16,339,885 2,486,939 1,766,628 720,3111989 19,265,033 16,711,942 2,553,091 1,850,515 702,5761990 19,153,426 16,565,200 2,588,226 1,890,487 697,7391991 18,340,214 15,772,022 2,568,192 1,942,551 625,6411992 18,003,984 15,429,723 2,574,261 1,937,292 636,9691993 18,272,613 15,546,110 2,726,503 2,072,022 654,4811994 18,891,578 16,066,107 2,825,471 2,182,303 643,1681995 19,192,679 16,422,884 2,769,795 2,163,273 606,5221996 19,683,611 16,748,241 2,935,370 2,310,727 624,6431997 20,330,120 17,275,825 3,054,295 2,443,146 611,149
1998 20,837,761 17,659,369 3,178,392 2,584,085 594,307
* Hours Worked is reported in thousands of hours. **Business-sector Apart from Self-Employed
Table A2.3: Canadian Number of Jobs
Aggregate Total Self-employed
Year Business Sector BASE** Self-employed Non-Farm Farm
1987 9,793,361 8,537,630 1,255,731 915,804 339,9271988 10,171,624 8,885,094 1,286,530 954,529 332,0011989 10,434,302 9,117,459 1,316,843 1,000,274 316,5691990 10,442,217 9,106,653 1,335,564 1,022,728 312,8361991 10,137,605 8,787,148 1,350,457 1,065,370 285,0871992 10,005,441 8,624,859 1,380,582 1,091,329 289,2531993 10,109,421 8,625,902 1,483,519 1,186,547 296,9721994 10,340,865 8,826,915 1,513,950 1,223,590 290,3601995 10,554,627 9,042,741 1,511,886 1,234,816 277,0701996 10,765,446 9,168,086 1,597,360 1,313,896 283,4641997 11,112,352 9,435,558 1,676,794 1,392,860 283,934
1998 11,459,574 9,710,315 1,749,259 1,473,944 275,315
**Business-sector Apart from Self-Employed

Economic Analysis Research Paper Series - 36 - Statistics Canada 11F0027 No. 016
Table A2.4 Cumulative Growth in Nominal Output per Number of Jobs (Base 1987 = 100) (Canadian) Aggregate Total Self-employed
Year Business Sector BASE** Self-employed Non-Farm Farm
1987 100 100 100 100 100 1988 105.6 105.1 112.0 106.0 158.8 1989 109.3 109.0 110.9 108.5 103.2 1990 111.5 111.4 112.4 108.7 110.1 1991 112.9 113.3 113.0 108.0 98.6 1992 115.3 116.0 116.3 110.9 102.4 1993 118.7 120.4 116.1 107.6 133.2 1994 124.8 127.2 113.0 107.7 74.2 1995 129.8 131.8 119.6 108.1 156.7 1996 132.9 135.5 123.1 106.8 225.6 1997 137.3 140.8 119.2 110.3 95.0
1998 138.2 141.9 119.8 108.7 112.8
**Business-sector Apart from Self-Employed
Table A2.5 Canadian Deflated GDP per Hours Worked Cumulative Growth (Base 1987 = 100)
Aggregate Total Self-employed
Year Business Sector BASE** Self-employed Non-Farm Farm
1987 100 100 100 100 100 1988 100.4 99.9 106.1 99.7 151.8 1989 99.8 99.7 100.5 97.9 92.5 1990 100.1 100.3 99.5 95.9 96.0 1991 100.3 100.8 99.4 94.2 85.2 1992 102.3 102.9 103.7 98.8 87.6 1993 103.3 104.5 103.5 96.0 112.2 1994 106.6 108.4 98.4 93.3 61.7 1995 108.5 109.6 103.4 92.9 128.4 1996 108.2 109.7 103.9 89.6 179.8 1997 110.4 112.4 100.2 91.5 76.6
1998 112.9 115.2 102.1 91.2 91.6
**Business-sector Apart from Self-Employed
Figure A2.1: Canadian Cumulative Growth of Nominal Output per Number of Jobs
100
110
120
130
140
1987 1988 1989 1990 1991 1992 1993 1994 1995 1996 1997 1998
Year
Ind
ex (
Bas
e 19
87 =
100
)
Aggregate Business Sector BASE** Self-employed

Economic Analysis Research Paper Series - 37 - Statistics Canada 11F0027 No. 016
Appendix 3: U.S. data Table A3.1: United States Nominal GDP*
Aggregate Total Self-employed
Year Business Sector BASE** Self-employed Non-Farm Farm
1987 3,663,178,000 3,407,458,465 255,719,535 220,831,390 34,888,1441988 3,939,133,000 3,652,075,386 287,057,614 255,118,508 31,939,1061989 4,229,153,000 3,921,460,583 307,692,417 269,656,482 38,035,9351990 4,443,729,000 4,110,076,891 333,652,109 296,437,012 37,215,0981991 4,542,512,000 4,205,322,233 337,189,767 304,638,876 32,550,8921992 4,802,158,000 4,421,395,058 380,762,942 341,910,013 38,852,9291993 5,058,763,000 4,654,892,379 403,870,621 367,876,728 35,993,8931994 5,401,186,000 4,976,585,084 424,600,916 386,768,835 37,832,0811995 5,677,563,000 5,238,707,958 438,855,042 410,582,210 28,272,8321996 6,019,052,000 5,542,315,470 476,736,530 436,800,953 39,935,5771997 6,449,196,000 5,947,451,995 501,744,005 466,419,182 35,324,823
1998 6,821,790,000 6,287,387,848 534,402,152 503,477,631 30,924,521
* Nominal GDP is reported in thousands of dollars.
**Business-sector Apart from Self-Employed
Table A3.2: United States Hours Worked*
Aggregate Total Self-employed
Year Business Sector BASE** Self-employed Non-Farm Farm
1987 157,089,000 137,531,000 19,558,000 16,823,000 2,735,0001988 161,843,000 141,753,000 20,090,000 17,440,000 2,650,0001989 165,855,000 145,575,000 20,280,000 17,692,000 2,588,0001990 166,116,000 145,824,000 20,292,000 17,834,000 2,458,0001991 162,267,000 141,857,000 20,410,000 17,886,000 2,524,0001992 161,891,000 142,162,000 19,729,000 17,251,000 2,478,0001993 166,075,000 145,596,000 20,479,000 18,202,000 2,277,0001994 171,850,000 150,899,000 20,951,000 18,200,000 2,751,0001995 175,985,000 155,305,000 20,680,000 17,995,000 2,685,0001996 178,737,000 157,914,000 20,823,000 18,355,000 2,468,0001997 183,937,000 163,127,000 20,810,000 18,465,000 2,345,000
1998 187,994,000 167,535,000 20,459,000 18,342,000 2,117,000
* Hours Worked is reported in thousands of hours. **Business-sector Apart from Self-Employed
Table A3.3: United States Number of Jobs
Aggregate Total Self-employed
Year Business Sector BASE** Self-employed Non-Farm Farm
1987 90,129,000 80,032,000 10,097,000 8,750,000 1,347,0001988 92,824,000 82,448,000 10,376,000 9,060,000 1,316,0001989 94,779,000 84,314,000 10,465,000 9,188,000 1,277,0001990 95,567,000 84,982,000 10,585,000 9,351,000 1,234,0001991 94,157,000 83,406,000 10,751,000 9,480,000 1,271,0001992 93,671,000 83,235,000 10,436,000 9,187,000 1,249,0001993 95,503,000 84,767,000 10,736,000 9,574,000 1,162,0001994 98,485,000 87,546,000 10,939,000 9,578,000 1,361,0001995 100,864,000 90,118,000 10,746,000 9,440,000 1,306,0001996 102,897,000 92,122,000 10,775,000 9,569,000 1,206,0001997 105,275,000 94,483,000 10,792,000 9,638,000 1,154,000
1998 107,674,000 97,123,000 10,551,000 9,521,000 1,030,000
**Business-sector Apart from Self-Employed

Economic Analysis Research Paper Series - 38 - Statistics Canada 11F0027 No. 016
Table A3.4: Cumulative Growth in Nominal Output per Hours Worked (Base 1987 = 100) (United States)
Aggregate Total Self-employed
Year Business Sector BASE** Self-employed Non-Farm Farm
1987 100 100 100 100 100 1988 104.4 104.0 109.3 111.4 94.5 1989 109.3 108.7 116.0 116.1 115.2 1990 114.7 113.8 125.8 126.6 118.7 1991 120.0 119.7 126.4 129.8 101.1 1992 127.2 125.5 147.6 151.0 122.9 1993 130.6 129.0 150.8 154.0 123.9 1994 134.8 133.1 155.0 161.9 107.8 1995 138.3 136.1 162.3 173.8 82.5 1996 144.4 141.7 175.1 181.3 126.9 1997 150.4 147.2 184.4 192.4 118.1
1998 155.6 151.5 199.8 209.1 114.5
**Business-sector Apart from Self-Employed
Table A3.5: Cumulative Growth in Nominal Output per Number of Jobs (Base 1987 = 100) (United States)
Aggregate Total Self-employed
Year Business Sector BASE** Self-employed Non-Farm Farm
1987 100 100 100 100 100 1988 104.4 104.0 109.2 111.6 93.7 1989 109.8 109.2 116.1 116.3 115.0 1990 114.4 113.6 124.5 125.6 116.4 1991 118.7 118.4 123.8 127.3 98.9 1992 126.1 124.8 144.1 147.5 120.1 1993 130.3 129.0 148.5 152.2 119.6 1994 134.9 133.5 153.3 160.0 107.3 1995 138.5 136.5 161.3 172.3 83.6 1996 143.9 141.3 174.7 180.9 127.9 1997 150.7 147.8 183.6 191.8 118.2
1998 155.9 152.0 200.0 209.5 115.9
**Business-sector Apart from Self-Employed
Table A3.6: United States Deflated GDP per Hours Worked Cumulative Growth (Base 1987 = 100)
Aggregate Total Self-employed
Year Business Sector BASE** Self-employed Non-Farm Farm
1987 100 100 100 100 100 1988 100.1 99.7 104.8 106.9 90.6 1989 102.6 102.1 108.9 109.0 108.1 1990 104.3 103.4 114.3 115.1 107.9 1991 105.3 105.0 110.9 113.8 88.7 1992 110.1 108.6 127.8 130.7 106.4 1993 111.1 109.8 128.3 131.0 105.4 1994 112.4 111.0 129.2 135.0 89.9 1995 112.6 110.8 132.1 141.5 67.2 1996 115.7 113.5 140.3 145.3 101.7 1997 118.2 115.7 145.0 151.3 92.8
1998 120.2 117.0 154.3 161.5 88.5
**Business-sector Apart from Self-Employed

Economic Analysis Research Paper Series - 39 - Statistics Canada 11F0027 No. 016
Appendix 4: Self-employment classes This appendix provides a detailed discussion of the total self-employment category. Section 1 compares the growth rates of the various self-employment class of worker sub-categories. The total self-employment category is disaggregated into self-employed with paid workers (with employees), self-employed with no paid workers (own account), and unpaid family workers. Section 2 further delineates the self-employed class of worker categories into main job and other jobholders. This section compares the growth of workers entering self-employment as a primary or secondary job. Finally, Section 3 investigates the trend of unpaid absentees by class of worker to see if growth rates are consistent with aggregate class of worker growth rates. 1. Self-employed Class of Worker Comparisons The System of National Accounts (SNA) definition of self-employed only includes unincorporated self-employed. These self-employed can be further disaggregated into self-employed with paid workers (with employees), self-employed with no paid workers (own account), and unpaid family workers. Over the 1987 to 1998 period, the composition of the aggregate self-employed category changed dramatically. Self-employed with employees and unpaid family workers as a proportion of aggregate self-employment declined over this period, while self-employed own account became an increasing large proportion (Figure A4.1).
Figure A4.1: Class of Worker as a Proportion of Aggregate Self-employment
0
10
20
30
40
50
60
70
80
90
1987 1988 1989 1990 1991 1992 1993 1994 1995 1996 1997 1998Year
Per
cen
tag
e
All self-employed jobs paid workers All self-employed jobs no paid workers Unpaid family worker jobs
These changes in the composition of aggregate self-employment are further reflected in their respective cumulative growth rates over the period. The growth in aggregate self-employment substantially outpaces that of paid workers (Table A4.1). Further, the self-employed own account workers are driving the cumulative growth in the total self-employed category. This category grew 65.4% over the 1987 to 1998 period. This is in contrast to the self-employed with employees and unpaid family workers whose job numbers declined over the period.

Economic Analysis Research Paper Series - 40 - Statistics Canada 11F0027 No. 016
Table A4.1: Cumulative Growth Rates of Jobs by Class of Worker Category
Total Total Self-employed Self-employed Unpaid Family
Year Paid Workers Self-employedWith Paid Workers
With No Paid Workers Worker Jobs
1987 100.0 100.0 100.0 100.0 100.0
1988 103.6 102.4 99.7 105.4 87.2
1989 106.0 104.8 102.9 109.0 77.9
1990 106.6 106.3 101.6 111.9 76.4
1991 104.3 107.5 104.5 113.2 71.7
1992 103.3 109.8 101.2 117.6 75.0
1993 103.6 118.0 104.1 127.8 82.9
1994 105.6 120.4 106.7 132.6 66.7
1995 107.6 120.3 101.0 134.6 66.0
1996 108.0 127.1 102.0 144.9 62.2
1997 110.0 133.4 92.2 157.6 66.2
1998 112.3 139.2 95.6 165.4 63.3
The shift to self-employed no paid workers (own account) is indicative of changing incentives and opportunities. Either the benefits to being self-employed own account have increased over the period, or alternative opportunities have diminished pushing individuals into this most accessible category of self-employment. The Push hypothesis asserts that contractions in the economy “push” individuals who face unemployment (or an unsuitable paid-employment opportunity) into self-employment, and it assumes that these individuals are not different from their paid-worker counter-parts. Thus these ‘pushed’ individuals are only reacting to circumstances they are driven into and are not endowed with any special skills, knowledge, or talents that distinguish them from paid-workers. Counter to the Push theory is the Pull theory. The “pull” hypothesis argues that individuals that enter into self-employment possess particular skills, knowledge and tastes that distinguish them from paid-workers and that motivate them to pursue an entrepreneurial enterprise with its associated risks (Lin, Picot and Yates, 1999).
Kuhn and Schuetze (2001) use the Survey of Consumer Finance (SCF) for the years 1982 to 1998 and they find that over this period there is evidence that women were pulled into self-employment by improved opportunities (increasing human capital and large increases in the weekly wage of self-employed women relative to wage and salary earners) and that men were pushed by declining market opportunities (for example the employment to population ratio of men age (25 to 54) declined from 86.5 to 83.3 percent between the 1982-1989 and 1990-1998 periods.) (p.776) 2. Main Job and Other Job Comparisons The LFS uses a “main job” concept to make the class-of-worker distinctions for every person in the survey. The LFS defines main job as the job or business involving the greatest number of usual hours worked (Statistics Canada, 1997). The LFS estimates for number of jobs and hours-worked are based on this main job or primary employment concept, and do not include secondary jobs or the hours worked in those estimates. The SNA estimates are different because

Economic Analysis Research Paper Series - 41 - Statistics Canada 11F0027 No. 016
the SNA, while benchmarking to the LFS, adjusts the estimates to include multiple-job holders and individuals that were out-of-scope for the LFS population. Thus, in the SNA estimates, jobs can be categorized as main job or other job, where the main job is the primary job and the other job is secondary, and both are included in the SNA total job estimates.35 It is important to understand whether persons taking on second jobs to supplement their earnings are driving the growth in self-employment or if the growth is more general across the main and other job categories. This distinction is important, since persons with self-employment as their main job may be entering into this category with different motivations than those who work in self-employment as a secondary job. For example, individuals who enter into self-employment as a secondary job may only view their business activity as a hobby, such as hobby farmers and artists. The SNA estimates can further be divided into single jobholders (individuals with only one job—a primary job) and multiple jobholders (individuals with a primary and secondary job). The number of multiple jobholders equals the number of individuals with secondary or other jobs. The number of main jobholders is equal to the number of single plus multiple jobholders. The single-job-holder group makes up between 95.8% to 94.9% of the main jobholders, declining over the period; it is the single jobholder’s category that is the main influence on the main jobholder’s cumulative growth rate (Figure A4.2). The number of multiple jobholders increased from 494,863 to 692,642 over the period—an increase of 40.0%. This is quite dramatic when compared to the single jobholder increase of 12.9%. However, it must be recognized that other jobholders account for only 4% to 5% of the total economy, and therefore, this category is not a main factor affecting aggregate growth.
Figure A4.2: Cumulative Growth Rates by Type of Job Holder
100
110
120
130
140
150
1987 1988 1989 1990 1991 1992 1993 1994 1995 1996 1997 1998
Year
Ind
ex (
Bas
e 19
87 =
100
)
Single job holder Multiple job holder Total Main Job
35 The SNA estimates in this appendix are total economy estimates and include both business sector and non-business sector counts.

Economic Analysis Research Paper Series - 42 - Statistics Canada 11F0027 No. 016
The main and other job categories can be further broken-down by class of worker: paid workers, self-employed with paid workers, self-employed no paid workers, and unpaid family workers. For the main job category, the self-employed no paid workers has the highest cumulative growth rate over the period, increasing 64.6% (Figure A4.3). This category exerted an upward influence on the total main job category of at least 3.4%, since the total main job cumulative growth rate is greater than the paid worker rate, and self-employed with paid workers and unpaid family workers declined –4.9% and –37.7% between 1987 and 1998, respectively.
Figure A4.3: Cumulative Growth Rates by Class of Worker for Main Jobs
40
60
80
100
120
140
160
180
1987 1988 1989 1990 1991 1992 1993 1994 1995 1996 1997 1998Year
Ind
ex (
Bas
e 19
87 =
100
)
Number of paid workers Self-employed with paid workersSelf-employed No paid workers Unpaid familyTotal Main Job
For the other job category a similar trend in the cumulative growth rates by class of worker occurred. From 1987 to 1998, in the other job category, the growth in the self-employed no paid workers category is compensating for declines in self-employed with paid workers and unpaid family worker categories (Figure A4.4). Further, the self-employed no paid workers category is pushing the total other job cumulative growth rate higher by at least 5.1% above the paid worker category. The growth in the self-employed no paid workers category has resulted in a shift in the composition of the aggregate self-employed category, for both the main job and other job breakdown. The main job self-employed no paid workers category has increased over 10%, as a proportion of both total self-employment and main job self-employment (Figure A4.5). A similar percentage point increase occurred for the other job self-employed no paid workers category as a proportion of other job self-employed. Further, other job self-employed no paid workers as a proportion of total self-employment, has had a slight percentage point increase from 9.6% to 11.7%, over the period. This section shows that the growth of self-employed no paid workers, which is the primary group driving total self-employment growth, is increasing at the same rate for both main and other job categories, and that there is no substantial difference between these two groups. Thus, the relatively low average remuneration of the self-employed own account group is not primarily due to the growth of self-employment as a secondary source of earnings.

Economic Analysis Research Paper Series - 43 - Statistics Canada 11F0027 No. 016
Figure A4.4: Cumulative Growth Rates by Class of Worker for Other Jobs
40
60
80
100
120
140
160
180
1987 1988 1989 1990 1991 1992 1993 1994 1995 1996 1997 1998Year
Ind
ex (
Bas
e 19
87 =
100
)
Number of paid workers Self-employed with paid workers
Self-employed No paid workers Unpaid family
Total Other Job
Figure A4.5: Self-employed No Paid Help Main Job and Other Job Comparisons
0
10
20
30
40
50
60
70
80
90
100
1987 1988 1989 1990 1991 1992 1993 1994 1995 1996 1997 1998Year
Per
cen
tag
e
Main Job Self-employed No Paid Workers as a Proportion of Total Self-employed
Other Job SE No Paid Workers as a Proportion of Total SE
Main Job SE No Paid Workers as a Proportion of Main Job SE
Other Job SE No Paid Workers as a Proportion of Other Job SE 3. Unpaid Absentees Throughout this paper the SNA definition of workers does not include “unpaid absentees”, which are individuals who are not at work and are not paid over the reference period. This section shows that if we had included the unpaid absentees in the workers estimates the results would have been more startling, since this group within the own account self-employed has increased through the 1990s.
The proportion of total employment that is considered to be unpaid absentees has increased over the 1987 to 1998 period, from 3.3% to 3.9% (Figure A4.6). This is equivalent to a cumulative growth rate over the period of 36.9% (Figure A4.7). The increase is mainly due to the growth in unpaid absentees in the paid workers and self-employed no paid workers class of workers

Economic Analysis Research Paper Series - 44 - Statistics Canada 11F0027 No. 016
categories. The paid worker category is not only the largest class of worker category, but it also accounts for the largest proportion of unpaid absentees; this category accounts for between 81% declining to 74% of unpaid absentees over the period. The self-employed no paid help unpaid absentees are an increasing proportion of total economy unpaid absentees—increasing from 14.4% to 23.2% of all unpaid absentees over the 1987 to 1998 period.
Figure A4.6: Unpaid Absentee Categories as a Proportion of Class of Worker Categories
0
1
2
3
4
5
6
7
8
9
10
1987 1988 1989 1990 1991 1992 1993 1994 1995 1996 1997 1998Year
Per
cen
tag
e
Total Unpaid Absentees by Total Employment Paid workersSelf-employed with paid workers Self-employed no paid workersUnpaid family
The largest self-employment category is the self-employed no paid workers class. The proportion of this category that is unpaid absentees increased over the period from 7.1% to 9.5% (Figure A4.7). From 1987 to 1998, the cumulative growth rate of the self-employed no paid workers unpaid absentees is 121.5%. These are workers that claimed to be self-employed, but that did not fulfil the criteria of receiving revenue and working during the reference period of the Labour Force Survey.
Figure A4.7: Unpaid Absentees Cumulative Growth Rates by Class of Worker
50
75
100
125
150
175
200
225
1987 1988 1989 1990 1991 1992 1993 1994 1995 1996 1997 1998Year
Ind
ex (
Bas
e 19
87 =
100
)
Total (Unpaid Absentees) Paid workers
Self-employed with paid workers Self-employed no paid workers
Unpaid family

Economic Analysis Research Paper Series - 45 - Statistics Canada 11F0027 No. 016
Appendix 5: Industry differences In what follows, select industries are analysed for their effect on the self-employed category to reveal if the aggregate results are broad based or specific to changes in a particular industry. Specifically, seven industries whose proportion of self-employed Gross Domestic Product (GDP) is greater than 5% of total self-employed GDP, in at least one year over the 1987 to 1997 period, have been selected for the analysis.36 The Select Industries include Agricultural and Related Services, Construction, Transportation, Retail Trade, Finance and Real-estate, Business Services, and Health and Social Services Industries. Recall, the System of National Accounts productivity program uses mixed income less imputed rent of owner occupied dwellings (IROOD), which is a nominal Gross Domestic Product (GDP) at basic prices measure of self-employment output. The number of hours-worked measure includes the total hours a self-employed person spends working. Only the business sector is considered in this analysis. These seven select industries comprise between 82.4% to 84.4% of self-employment GDP, over the 1987 to 1997 period. Health and Social service industries makes up the largest proportion of the self-employed category ranging from a high of 30.4% in 1991 to a low of 25.1% in 1996. The Agricultural and Related Services industries have the most variability in terms of percentage point changes. Finance and Real estate industries have increased as a proportion of total self-employed GDP—rising steadily from 5.1% to 9.9% over the period. The remaining industries are quite stable with no dramatic shifts in their proportion of total self-employed GDP occurring over the period.
Figure A5.1: Select Industry's GDP as a Proportion of Total Self-employment GDP
0
5
10
15
20
25
30
35
1987 1988 1989 1990 1991 1992 1993 1994 1995 1996 1997
Year
Per
cen
tag
e
1 Agricultural and related service industries 30 Construction industries31 Transportation industries 37 Retail trade industries38 Finance & real estate industries 41 Business service industries43 Health and social service industries
36 The NAICS industry classifications used in 1998, and there after, are not comparable to the SIC industry classifications used over this 1987 to 1997 period at this level of industry detail. As a result, 1998 is omitted.

Economic Analysis Research Paper Series - 46 - Statistics Canada 11F0027 No. 016
The cumulative growth rates of the total self-employed category’s GDP, Hours-Worked, and Output per Hour Worked are presented for the most influential industries in Figure A5.2. The general trend is toward a diminishing growth in Total Economy Self-employed output per hour-worked through the 1990’s. This result is widespread across these seven select industries.37 There are interesting differences among these select industries; however, no one industry is driving the overall flattening in self-employed output per hour-worked over the entire period. In 1994, the decline in self-employed output per hour-worked is present in most select industries (Figure A5.2). The exceptions are Finance and Real-estate, which increased in 1994 after almost continuous decline since 1987, and Health and Social Services, which increased slightly still recovering from its decline that began in 1992. The most dramatic decline in 1994 came from Retail Trade industries, which had a year-to-year percentage decrease in output per hour-worked of –22%. The 1994 decline in the aggregate self-employed output per hour-worked is mainly due to a broad-based increase in the hours worked as opposed to a substantial decline in GDP (Figure A5.2). All of the select industries, except Agriculture, experienced increases in their hours worked cumulative growth rates in 1994. Further, the GDP of most industries increased slightly or remained flat, with the exception of Retail Trade and Agriculture industries, which experienced substantial declines in cumulative GDP growth. After 1994, output per hour-worked increased slightly across most select industries (Figure A5.3). In contrast, Health and Social Service and Business Service industries output per hour-worked continued to decline.
37 This Total Economy Self-employed cumulative growth rate of output per hour worked is identical to Figure 8’s Self-employment.

Economic Analysis Research Paper Series - 47 - Statistics Canada 11F0027 No. 016
Figure A5.2: Nominal Mixed Income (GDP), Hours-Worked, and Output per Hour Worked Cumulative Growth Comparison by Industry
Total Economy Self-employed
100
120
140
160
1987 1988 1989 1990 1991 1992 1993 1994 1995 1996 1997
Year
Cu
mu
lati
ve G
row
th In
dex
(B
ase
1987
= 1
00)
Mixed Income (GDP) Hours Worked Output per Hour Worked
Agriculture and Related Services Industries
0
50
100
150
200
250
1987 1988 1989 1990 1991 1992 1993 1994 1995 1996 1997
Year
Cu
mu
lati
ve G
row
th In
dex
(B
ase
1987
= 1
00)
Mixed Income (GDP) Hours Worked Output per Hour Worked
Construction Industries
80
90
100
110
120
130
140
150
1987 1988 1989 1990 1991 1992 1993 1994 1995 1996 1997
Year
Cu
mu
lati
ve G
row
th In
dex
(B
ase
1987
= 1
00)
Mixed Income (GDP) Hours Worked Output per Hour Worked
Transportation Industries
80
100
120
140
160
180
200
1987 1988 1989 1990 1991 1992 1993 1994 1995 1996 1997
Year
Cu
mu
lati
ve G
row
th In
dex
(B
ase
1987
= 1
00)
Mixed Income (GDP) Hours Worked Output per Hour Worked
Retail Trade Industries
80
90
100
110
120
130
140
150
160
1987 1988 1989 1990 1991 1992 1993 1994 1995 1996 1997
Year
Cu
mu
lati
ve G
row
th In
dex
(B
ase
1987
= 1
00)
Mixed Income (GDP) Hours Worked Output per Hour Worked
Finance and Real-estate Industries
60
100
140
180
220
260
300
340
380
1987 1988 1989 1990 1991 1992 1993 1994 1995 1996 1997
Year
Cu
mu
lati
ve G
row
th In
dex
(B
ase
1987
= 1
00)
Mixed Income (GDP) Hours Worked Output per Hour Worked
Business Services Industries
60
100
140
180
220
1987 1988 1989 1990 1991 1992 1993 1994 1995 1996 1997
Year
Cu
mu
lati
ve G
row
th In
dex
(B
ase
1987
= 1
00)
Mixed Income (GDP) Hours Worked Output per Hour Worked
Health and Social Service Industries
60
100
140
180
220
1987 1988 1989 1990 1991 1992 1993 1994 1995 1996 1997
Year
Cu
mu
lativ
e G
row
th In
dex
(B
ase
1987
= 1
00)
Mixed Income (GDP) Hours Worked Output per Hour Worked

Economic Analysis Research Paper Series - 48 - Statistics Canada 11F0027 No. 016
Figure A5.3: Output per Hour Worked for Select Industries
0
10
20
30
40
50
60
1987 1988 1989 1990 1991 1992 1993 1994 1995 1996 1997Year
Mix
ed In
com
e b
y H
ou
rs W
ork
ed
Agricultural and related service industries Construction industriesTransportation industries Retail trade industriesFinance & real estate industries Business service industriesHealth and social service industries

Economic Analysis Research Paper Series - 49 - Statistics Canada 11F0027 No. 016
Appendix 6: Decomposition of capital consumption allowances This appendix investigates the possibility of decomposing the factor incomes that comprise Gross Domestic Product further than has been done in the body of the paper, into incorporated and unincorporated components. The measure of output that is used in this investigation is nominal Gross Domestic Product (GDP) at basic prices, as defined by the System of National Accounts (SNA) productivity program.38 In nominal terms, the estimate of GDP at basic prices in the body of the paper is calculated as follows:
itititit ITLSOSNIUBLIGDP +++= (A6.1)
and
ititit NIUBBASEGDP += (A6.2)
and GDPit = gross domestic product at basic prices;
LIit = labour income (wages and salaries and supplementary labour income); NIUBit = net income, unincorporated business (self-employed); OSit = operating surplus; ITLSit = indirect taxes on production less subsidies on production; and
BASEit = business sector income apart from self-employed. For conceptual purposes, both the labour and the operating surplus could be separated into two components—those arising from activities by the incorporated (with an INC superscript) and the unincorporated sector (with an U superscript). The contribution of the unincorporated sector then consists of the net income earned by unincorporated business, the labour income that unincorporated business pay to employees if they have any, and any operating surplus that is not reported as part of net income.
itUit
INCitit
Uit
INCitit ITLSOSOSNIUBLILIGDP +++++= (A6.3)
itU
itINC
itit ITLSGDPGDPGDP ++= (A6.4)
where INCit
INCit
INCit OSLIGDP += (A6.5)
itUit
Uit
Uit NIUBOSLIGDP ++= (A6.6)
However, this conceptualization cannot be generated with the currently available SNA data for the entire self-employed sector. Specifically, a decomposition of the factor labour income into incorporated and unincorporated sectors is not possible for all self-employed groups. Research with tax files provides more information on the total labour income generated by the unincorporated sector in only the ‘business’ component of the self-employed (See Appendix 7).
38 GDP at basic prices is equal to GDP from the input-output tables at factor cost plus indirect taxes on production minus subsidies on production. For this exercise, only the business sector will be used. The business sector excludes all non-business activities as well as the implicit rental value of owner-occupied dwellings. The non-business sector includes institutions such as government, education, hospitals and religious organizations.

Economic Analysis Research Paper Series - 50 - Statistics Canada 11F0027 No. 016
Operating surplus is a mixture of many factor incomes, such as business profits before taxes, dividend and interest distributions, investment income (other than net rental income of persons), capital consumption allowance, and inventory valuation adjustment. Operating surplus can be separated into two components, and further decomposed into the mix of factor incomes that make-up operating surplus, as follows:
INcit
INcit
INcit
INcit
INCit IVACCAINTPROFOS +++= (A6.7)
Uit
Uit
Uit
Uit IVACCAINTOS ++= (A6.8)
where the above components that comprise operating surplus’s contribution to GDP are : PROFit = Corporate profits before taxes (NIUB in the unincorporated) INTit = interest and miscellaneous investment income CCAit = capital consumption allowance IVAit = inventory valuation adjustment It is important to note that business profits before taxes (PROF) in the incorporated sector is conceptually similar to the net income of unincorporated business (NIUB). Of all the above factor incomes, that comprise the unincorporated sector's operating surplus, only data on the capital consumption allowance (CCAU) is available for both non-farm and farm unincorporated self-employed. In regard to the remaining components, estimates of interest paid (INT) and inventory valuation adjustment (IVA) do not exist for the portion of unincorporated businesses related to non-farm and rental activity. However, data for INT and IVA is available for agriculture (farm income). For rental activity, only interest paid (mortgage expense) is available. Thus, the only further possible decomposition is as follows, from equations A6.4, A6.6, and A6.8:
)()( Uitit
Uit
Uit
Uitit
INCitit CCANIUBIVAINTLIITLSGDPGDP ++++++= (A6.9)
or from equation A6.2: )()( U
ititUititit CCANIUBCCABASEGDP ++−= (A6.10)
where Uitit CCABASEEBAS −=′ (A6.11)
Uititit CCANIUBES +=′ (A6.12)
With this further decomposition, defined by equation (A6.10), the following question can be answered: What is the effect on output per hour worked when the capital consumption allowance (CCA) attributed to unincorporated businesses is removed from the BASE sector and added to the net income of unincorporated businesses? Before the addition of CCA component to NIUB, the nominal net earnings of the self-employed (NIUB) ranged from $22.7 to $38.0 billion, over the 1987 to 1998 period. With the inclusion of the CCA component, self-employed output increases to a range of $36.9 to $62.2 billion.
The addition of CCA to NIUB results in an increase in the level of output per hour worked in the unincorporated self-employed business sector; this occurs because only the numerator has

Economic Analysis Research Paper Series - 51 - Statistics Canada 11F0027 No. 016
changed and not the denominator—the hours worked by the unincorporated self-employed. However, this does not imply a change in the output per hour worked cumulative growth rate of the BASE sector. With the removal of the unincorporated sector’s CCA from the BASE sector, the BASE sector’s output per hour worked cumulative growth rate only decreases by 0.4%, from 1987 to 1998. The addition of CCA to NIUB increases the output per hour worked cumulative growth rate for the self-employed from 26.5% to 27.9%, over the same period—a difference of only 1.4%. Thus, over the period, the growth rate for both of these sectors is not substantially affected by this modification (Figure A6.1).
Figure A6.1: Comparison of Canadian Cumulative Growth of Nominal Output per Hour Worked
(With and without the inclusion of the unincorporated sector's capital consumption allowance)
100
110
120
130
140
1987 1988 1989 1990 1991 1992 1993 1994 1995 1996 1997 1998Year
Ind
ex (
Bas
e 19
87 =
100
)
Aggregate Business Sector (GDP) BASE' SE' BASE SE (NIUB)
Further, the difference in the aggregate business sector and BASE sector’s growth rates falls from 2.9% to a difference of 2.5%, when BASE′ is used. Thus, the general trend is unchanged, even after the re-composition of the self-employed category. The self-employed category can still be identified as dragging down the aggregate business sector’s output-per-hour-worked growth rate over the reference period.

Economic Analysis Research Paper Series - 52 - Statistics Canada 11F0027 No. 016
Appendix 7: GDP per worker in the self-employed sector This study has asked whether it was the performance of the self-employed sector during the 1990s that created a drag on the productivity performance of the Canadian business sector. This was investigated by comparing productivity in the self-employed sector to productivity in the remaining part of the economy, the BASE sector—broadly referring to these as productivity in the unincorporated (entrepreneurial) as opposed to the corporate (factory) sector. Productivity in the self-employed sector was measured as net income per self-employed. It was noted, however, that this measure was only an approximation to the GDP per worker in the self-employed sector. As equation A7.1 indicates:
t
ttttt SEE
WSINTDEPNIGDPSES
+++= (A7.1)
where GDPSES = GDP per worker in self-employed sector
NI = Net Income (of all T1 filers) DEP = Depreciation INT = Interest WS = Employee Earnings (Wages and Salaries) SEE = Self-employed plus the Employees of the Self-employed
GDP per worker in the self-employed sector differs from the net income per self-employed worker for two reasons. First, GDP includes more categories than just net income received by the self-employed. It also includes the returns to capital—depreciation and interest payments. Second, the self-employed also employ some workers and their wages should be included as part of factor incomes if we are to calculate total factor incomes in the self-employed sector. In order to calculate GDP per worker in the self-employed sector, we need to supplement the numerator of the measure actually used and we need to add the number of employees of the self-employed to the denominator to create a more complete measure of GDP per worker. In the main section of the paper, we argued that these omissions were not likely to be serious for several reasons. First, the self-employed did not operate large-scale factories and were, therefore, not likely to be generating much in the way of returns to capital. Second, the type of self-employment growth that occurred in the 1990s did not generate growth in employment and therefore distortions were not likely to be large on that front. It was the lack of growth in self-employment net income per worker that dragged the overall labour productivity downward. If self-employment did not generate additional employment during this decade, failure to consider this factor would have already biased downward the growth rate that we estimated relative to its true value. The methodology used in this paper was adopted because the detailed data to make the correction that is required, the inclusion of the employees of the self-employed and their factor income, are not available for both Canada and the United States.

Economic Analysis Research Paper Series - 53 - Statistics Canada 11F0027 No. 016
In this section, the size of the bias caused by our methodology is investigated. This is done for one sector of the Canadian self-employed—the self-employed who belonged to the business sector. Detailed tax data needed to estimate the additional components are available for this sector. These are the self-employed who are not fisherman, professionals, farmers, or commercial salesman. The self-employed business sector was the largest and the fastest growing sector in the 1990s. Its slowdown in net income growth was symptomatic of the slowdown that affected the entire self-employed sector. As such, while it provides only part of the story, it is the key part of the story. To investigate the other components of GDP, a tax file was used that contains a sample of records of all those who filed a supplementary tax schedule detailing their expenditures for the period 1994 to 1997. As Table A7.1 shows (rows 1 and 3), these individuals accounted for about half of all those who reported any self-employment earnings in the business sector. Their net earnings (row 4) start about 25% higher than those of all self-employed in the business sector (row 2) and climb to 39% of the group as a whole (row 8). This sample therefore consists of the higher income earners in this group. In order to calculate the total factor income accruing to this group of self-employed, we add in depreciation per filer (row 5) and interest payments per filer (row 6). When this is done, income per filer is increased by 31%, from $18,080 (row 4) to $23,679 (row 7) in 1994. But these changes do not increase the growth rate of the income per filer (column 5). Net income per filer increased by 22% over the period when these additional factors were not considered. The second adjustment that is required involves the addition of wages paid to employees hired by the self-employed. Here direct and indirect wages paid are added in from the expense schedule (line 9). Unfortunately, the tax schedules do not include a count of number of employees. In order to estimate number of employees, total wages and salaries paid (line 9) are divided by the earnings per job in the non self-employed sector (data implicit in Figure 2) to produce an imputed number of jobs (line 10).39 Value added per worker (line 11) is about 40% higher than the net income per expense schedule filer (line 4). But this ratio remained relatively constant over the period (between 1.36 and 1.42). The growth rate of this measure was only 23% (line 11), from 1994 to 1997, about the same as the growth rate of the net income per worker 22% (line 4). The conclusion in the main part of the paper relied on the fact that net income per worker grew more slowly in the self-employed sector than elsewhere. But we have shown here that extending our definition would have slowed the rate even further. We therefore conclude that our use of the net income per worker measure provides a conservative estimate of the impact of the self-employed sector on aggregate productivity growth.
39 This non-self-employed sector is similar to the BASE sector; it is the difference between Total Economy Labour Participation (TELP) and the Total Self-employed (NTSE), where the self-employed are those that have total self-employment net-income greater than wages. The average personal income per job (filer) for the TELP minus NTSE is used to impute employees of the self-employed (line 10)--Line 10 is the ratio of wages and salaries of the employees by average personal income per job.

Economic Analysis Research Paper Series - 54 - Statistics Canada 11F0027 No. 016
Finally we combine our results for the self employed who filed a tax schedule with the remainder who did not file a schedule. In doing so, we presume the latter had no employees, no depreciation or interest expense—or they would have filed an expense schedule. In this case, net income is equal to GDP. When we do that, we see that value added per worker for the entire business sector (row 13) increases by about 35% relative to the net income of all self-employed business filers that was reported in line 2—the concept used throughout the paper. It is noteworthy that the increase in GDP per worker was 10% over the period, compared to the 10% that was reported for net income per worker. Making the correction to net income per worker to transform it to GDP per worker in the self-employed sector has no effect on the growth rate. The paper argues that that increases in the self-employed pulled down the estimate on the growth in overall labour productivity because the growth rate in the self-employed was higher than for workers elsewhere, because the growth in GDP per worker was less in this sector and because GDP per worker was lower in this sector. We have just shown that moving to a more comprehensive measure of GDP per worker would have left the growth rate below that used in this paper and therefore still further behind the growth rate in the corporate or base sector. It is also the case that making corrections to net income per worker to bring it to GDP per worker would have left this still well behind overall output per worker. From Table 7, GDP per worker in 1997 in the BASE sector was $54,636, considerably above the $24,719 in the non-farm self-employed sector. Moving the latter up by 35% (line 14 in Table A7.1) would still leave GDP per worker in the self-employed non-farm sector considerably below the overall average. We conclude that the measure used herein to represent productivity in the self-employed sector is a reasonable proxy for the purposes of this paper. Table A7.1. Value added in business self-employed sector Category
1994
1995
1996
1997
1997/1994
Complete tax files 1) Counts 716,,950 757,950 812,800 873,300 1.22 2) Net income 14,484 14,795 15,149 15,879 1.10
Filers with additional expense schedule 3) Counts 430,547 446,739 382,845 430,415 1.00 4) Net income per filer 18,080 17,584 19,086 22,091 1.22 5) Depreciation per filer 3,320 3,640 4,192 4,879 1.47 6) Interest per filer 2,278 2,395 3,463 3,786 1.66 7) Net + Dep + Interest per filer 23,679 23,619 26,740 30,756 1.30 8) Total (line 7)/Net (line 4) 1.31 1.34 1.40 1.39
Employees of self-employed 9) Wages and salaries (000) 4,404,770 4,638,723 4,599,046 4,816,330 1.09 10) Imputed jobs 163,752 168,558 164,123 166,029 1.01 11)Value added per job (filers plus employee jobs) 24,566 24,688 27,125 30,270 1.23 12)Line 11/Line 2 1.36 1.40 1.42 1.37
The entire business sector 13)Value added per job 19,530 20,020 20,311 21,565 1.10 14)Line 13/Line 4 1.35 1.35 1.34 1.36

Economic Analysis Research Paper Series - 55 - Statistics Canada 11F0027 No. 016
Appendix 8: Index number differences between weighted averages and their components This section explains why the cumulative growth of total self-employed (SE) of 126.5 from 1987 to 1998 (see Table 9) exceeds both of its components cumulative growth rates of 113.1 and 113.5, for Non-farm (NF) and Farm (F) over this period, respectively. Nominal Gross Domestic Product at basic prices for the Total Self-employed and the number of jobs or hours worked are as follows:
Ft
NFt
SEt GDPGDPGDP += (A8.1)
Ft
NFt
SEt NNN += , (A8.2)
where NF is Non Farm and F is Farm, and both components of SE. Nominal labour productivity for Total Self-employed is:
+
++
=
++=
= F
tNFt
Ft
Ft
NFt
NFt
Ft
NFt
Ft
NFt
SEt
SEtSE
t NN
GDP
NN
GDP
NN
GDPGDP
N
GDPLP
•
++
•
+= F
t
Ft
Ft
NFt
Ft
NFt
NFt
Ft
NFt
NFtSE
t N
GDP
NN
N
N
GDP
NN
NLP
•
++
•
+= F
tFt
NFt
FtNF
tFt
NFt
NFtSE
t LPNN
NLP
NN
NLP
[ ] [ ]( )Ft
Ft
NFt
NFtF
tNFt
SEt LPNLPN
NNLP •+•
+= 1
(A8.3)
SE
tLP is an arithmetic employment weighted average of both Non-Farm and Farm labour
productivity (LP). Thus, the estimate of Total Self-employment LP (see Table 5 and Figure A8.1) falls between Non-Farm and Farm self-employment LP, since the weights, by definition, sum to unity. However, the Total Self-employment LP’s proximity to the Non-Farm and Farm LP, upper and lower bounds, respectively, will depend on the weights. In this case the weight for the Non-Farm is substantially higher than Farm. The weight of Non-Farm increases over the period from 69% to 81%, from 1987 to 1998, whereas the Farm weight falls over the period from 31% to 19%. As a result, due to the growth in the Non-Farm weight, the Total Self-employed LP and the Non-Farm LP trends tend to converge, as the size of Farm employment weights decline, over the reference period.

Economic Analysis Research Paper Series - 56 - Statistics Canada 11F0027 No. 016
Figure A8.1: Arithmetic Employment Weighted Average Decomposition
0.0
2.0
4.0
6.0
8.0
10.0
12.0
14.0
16.0
1987 1988 1989 1990 1991 1992 1993 1994 1995 1996 1997 1998
Year
Labo
ur P
rodu
ctiv
ity
(Dol
lars
per
Hou
r W
orke
d)
0
0.1
0.2
0.3
0.4
0.5
0.6
0.7
0.8
0.9
Em
ploy
men
t Wei
ghts
by
Yea
r
Total Self-employed (left axis) Non-Farm (left axis) Farm (left axis)
Non-Farm (right axis) Farm (right axis)
The intuitive result provided above, explaining how the Total Self-employed labour productivity is bounded by the Non-Farm and Farm categories, does not hold when we look at the cumulative growth of labour productivity within the Total Self-employed by category. The cumulative growth for the Total Self-employed is as follows:
•
++
•
+
•
++
•
+=
F
F
FNF
F
NF
NF
FNF
NF
Ft
Ft
Ft
NFt
Ft
NFt
NFt
Ft
NFt
NFt
SE
SEt
N
GDP
NN
N
N
GDP
NN
N
N
GDP
NN
N
N
GDP
NN
N
LP
LP
0
0
00
0
0
0
00
00
•
++
•
+
•
++
•
+=
FFNF
FNF
FNF
NF
FtF
tNFt
FtNF
tFt
NFt
NFt
SE
SEt
LPNN
NLP
NN
N
LPNN
NLP
NN
N
LP
LP
000
00
00
00
(A8.4)
Where the base period is 0 and the reference period is t. It is clear from equation A8.4 that the employment weights, which vary drastically across time, are the cause of the seemingly counter intuitive result in Table 9. For comparison Table A8.1 presents the Total Self-employed labour productivity weighted by employment from a particular year—using only the 1987 employment weights and using only the 1998 employment weights respectively. These examples show that using a constant fixed weight, from either 1987 or 1998 years, will give a labour productivity cumulative growth rate of approximately 13%, over the 1987 to 1998 period; however, the weighting scheme used in Table 9 was not a fixed weight, and it resulted in a labour productivity cumulative growth rate of 26.5%, over the 1987 to 1998 period.

Economic Analysis Research Paper Series - 57 - Statistics Canada 11F0027 No. 016
Table A8.1: Components of Total Self-employment Labour Productivity
Total Self-employed Labour Productivity
Employment Weights Weighted by Employment in:
Year Non-Farm Farm Each Year Year 1987 Year 1998
1987 0.693 0.307 9.45 9.45 10.57
1988 0.710 0.290 10.50 10.36 11.34
1989 0.725 0.275 10.37 10.05 11.27
1990 0.730 0.270 10.51 10.14 11.34
1991 0.756 0.244 10.77 10.11 11.36
1992 0.753 0.247 11.30 10.65 11.97
1993 0.760 0.240 11.45 10.79 11.98
1994 0.772 0.228 10.97 10.07 11.43
1995 0.781 0.219 11.84 11.03 12.13
1996 0.787 0.213 12.15 11.49 12.33
1997 0.800 0.200 11.86 10.66 12.01
1998 0.813 0.187 11.96 10.69 11.96
1987 to 1998 117.25 60.98 126.50 113.13 113.11
Economic Analysis Research Paper Series - 58 - Statistics Canada 11F0027 No. 016
References Gauthier, J. and R. Roy. 1997. “Diverging Trends in Self-Employment in Canada.” Applied Research Branch Strategic Policy, R-97-13E. Human Resources Development Canada: Ottawa. Krahn, H. 1995. “Non-standard Work on the Rise.” Perspectives on Labour and Income. Catalogue no. 75-001E. 7(4):35-42 (Winter). Ottawa: Statistics Canada. Kuhn, P.J. and H.J. Schuetze. 2001. “Self-employment Dynamics and Self-employment Trends: A Study of Canadian Men and Women, 1982-1998.” Canadian Journal of Economics. 34(3):760-784. Lin, Z., G. Picot and J. Yates. 1999. The Entry and Exit Dynamics of Self-employment in Canada. Analytical Studies Research Paper Series 11F0019MPE1999134. Analytical Studies Branch. Ottawa: Statistics Canada. Lin, Z., J. Yates and G. Picot. 1999. Rising Self-employment in the Midst of High Unemployment: An Empirical Analysis of Recent Development in Canada. Analytical Studies Research Paper Series 11F0019MPE1999133. Analytical Studies Branch. Ottawa: Statistics Canada. Picot, G., M. Manser and Z. Lin. 1998. The Role of Self-employment in Job Creation in Canada and the United States. OECD-CERF-CILN International Conference on Self-employment. Burlington, Ontario, Canada. Picot, G. and R. Dupuy. 1998. Development and Use of a Canadian Longitudinal Worker File. Business and Labour Market Analysis Division. Ottawa: Statistics Canada. Picot, G. and A. Heisz. 2000. The Performance of the 1990s Canadian Labour Market. Analytical Studies Research Paper Series 11F0019MPE2000148. Analytical Studies Branch. Ottawa: Statistics Canada. Schuetze, H. 2000. “Taxes, Economic Conditions and Recent Trends in Self-employment: A Canada-U.S. Comparison.” Labour Economics. 7(5):507-544. Statistics Canada. 1989. A User Guide: To the Canadian System of National Accounts. Catalogue no. 13-589E. Ottawa: Ministry of Supply and Services Canada. Statistics Canada. 1990. Guide to the Income and Expenditure Accounts. Sources and Methods Series. Catalogue no. 13-603E. Ottawa: Ministry of Supply and Services Canada. Statistics Canada. 1997. Guide to the Labour Force Survey. Catalogue no. 71-543-GIE. Ottawa: Ministry of Industry. Statistics Canada. 1997. Labour Force Update: The Self-employed. Catalogue no. 71-005-XPB. Autumn 1997 Vol. 1 No. 3. Ottawa: Ministry of Industry.

Economic Analysis Research Paper Series - 59 - Statistics Canada 11F0027 No. 016
Statistics Canada. 1998. Longitudinal Administrative Databank Dictionary 1998. Catalogue No. 12-585-XIE. Small Area and Administrative Data Division. Ottawa: Ministry of Industry. Statistics Canada. 2001. Productivity Growth in Canada. Catalogue no. 15-204-XPE. Analytical Studies Branch. Ottawa: Statistics Canada. Sunter, D. 1993. “Working Shift.” Perspectives on Labour and Income. Catalogue no. 75-001E. 5(1):16-23 (Spring). Ottawa: Statistics Canada. U.S. Department of Labor. Bureau of Labor Statistics. “Productivity Measures: Business Sector and Major Subsectors.” BLS Handbook of Methods. Washington D.C.: April 1997. Wells, S., J.R. Baldwin and J.-P. Maynard. 1999. “Productivity Growth in Canada and the United States.” Canadian Economic Observer. Catalogue No. 11-010 (September): 3.1-3.9. Ottawa: Statistics Canada.


![EMPLOYMENT AND LABOUR RELATIONS ACT CAP 366tanzania.go.tz/egov_uploads/documents/Employment and LAbour... · chapter 366 _____ employment and labour relations act [principal legislation]](https://img.dokumen.tips/doc/110x75/5ab3c5f17f8b9a7e1d8e8ff0/employment-and-labour-relations-act-cap-and-labourchapter-366-employment.jpg)