Embed Size (px)
Citation preview

Impact of Project GLAD on Literacy - 1
THE IMPACT OF PROJECT GLAD ON FIFTH-GRADE LITERACY:
SHELTERED INSTRUCTION AND ENGLISH LEARNERS
IN THE MAINSTREAM CLASSROOM
Presented at the annual meeting of the American Educational Research Association
April 2015–Chicago
DRAFT Please do not cite without the authors’ permission
Authors: Theresa Deussen [email protected]
Angela Roccograndi [email protected]
Makoto Hanita [email protected]
Elizabeth Autio [email protected]
Claudia Rodriguez-Mojica [email protected]
Mailing address for all authors: Education Northwest 101 SW Main, Suite 500 Portland, Oregon 97204
The research reported here was supported by the Institute of Education Sciences, U.S. Department of Education, through Grant R305A100583 to Education Northwest. The opinions expressed are those of the authors and do not represent views of the Institute or the U.S. Department of Education.

Impact of Project GLAD on Literacy - 2
THE IMPACT OF PROJECT GLAD ON FIFTH-GRADE LITERACY: SHELTERED INSTRUCTION AND ENGLISH LEARNERS IN THE
MAINSTREAM CLASSROOM
With the increased population of English learners (ELs) in U.S. schools, educators need effective
instructional approaches that help students develop their English proficiency while also
learning grade-level academic content (Tharp, Estrada, Dalton, & Yamaguchi, 2000). One way to
combine the two is sheltered instruction, which provides intentional linguistic and other
supports to ELs to facilitate their learning of grade-level content (Echevarria, Short, & Powers,
2006). As a recent review of the research makes clear, however, to date we have only limited
research evidence to demonstrate that sheltered instruction helps close the achievement gap
between ELs and non-ELs (Goldenberg, 2013).
Project GLAD (Guided Language Acquisition Design) is an example of an approach to
sheltered instruction that is widely used on the West Coast. Project GLAD is a multicomponent
K–12 instructional model designed to build academic English and grade-level content
knowledge for students at varying levels of English language proficiency. It is billed as an
approach to use in a linguistically heterogeneous classroom and one that is of benefit to all
students, but particularly ELs. Until this study, however, Project GLAD had never been
formally evaluated. This paper reports on two years of results from a cluster randomized trial of
Project GLAD that examines the impact on the literacy learning of two cohorts of fifth-grade
students.
PRIOR RESEARCH ON SHELTERED INSTRUCTION
In sheltered instruction, teachers employ a wide range of instructional strategies and
adjustments to classroom activities and arrangements to support the understanding of ELs

Impact of Project GLAD on Literacy - 3
without interfering with the learning of non-ELs in the classroom. Strategies typically include
the use of visual, as well as linguistic, representations of information, deliberate scaffolds (e.g.,
sentence frames to help students construct oral or written responses), explicit connections to
prior student experiences, and structured opportunities to interact with peers about academic
topics. Although originally conceived of as a way to make content accessible, it is often used to
continue to build ELs’ academic English skills.
There are a variety of instructional approaches that embrace the goals of sheltered
instruction, though they may emphasize different ways to achieve those goals. The most widely
used sheltered instruction model is SIOP (which takes its name from the Sheltered Instruction
Observation Protocol, a tool for assessing the presence of scaffolds and supports for ELs in the
classroom). In the SIOP model, teachers work within an explicit framework for the creation and
delivery of lessons that include the sheltered instructional supports listed above. Teachers
identify a specific content and language objective for each lesson, and then build a lesson
designed to achieve those objectives. A SIOP lesson relates key lesson concepts to students’
background experiences, teaches new concepts in comprehensible ways (using appropriate
speech, extra wait time, body language, scaffolds, etc.), and uses proven instructional strategies
to support comprehension. A SIOP lesson also builds in opportunities for students to interact
and provides time for students to practice and apply their learning. The lesson should be
delivered with strong classroom management and sufficient time for students to fully engage in
all activities, and should wrap up with review and at least an informal assessment of learning
(Short & Echevarria, 2005). The exact instructional strategies or techniques teachers employ to

Impact of Project GLAD on Literacy - 4
deliver a lesson with all of these components permit some variation in teaching style and
depend in part on the grade level and content area of the class.
Evidence on the efficacy of SIOP on student learning is still limited. In one study, Short,
Fidelman, & Loguit (2012) compared the literacy skills of students in middle and high school
classrooms with and without SIOP; they found significant positive impacts for writing, oral
language, and English proficiency scores, although not for reading. In this study, however, only
one school was assigned to treatment and one to comparison conditions, raising issues of
confounding. In another study that focused on the use of SIOP in middle school classrooms,
researchers found no significant differences between treatment and control conditions, although
very small sample sizes certainly reduced the power of that study (Echevarria, Richards-Tutor,
Canges, & Francis, 2011). From that same study, researchers compared high and low
implementers of SIOP and found that higher implementation was positively related to higher
achievement in science (Short, Echevarria, & Richards-Tutor, 2011). However, selection bias
may have also shaped those results, as other teacher characteristics may have been correlated to
the willingness or ability to implement at a high level. To date, no study of SIOP has met the
rigorous methodological standards of the What Works Clearinghouse (U.S. Department of
Education, 2013a).
Other approaches share much in common with sheltered instruction but add a particular
emphasis or component. For example, QuEST (Quality English and Science Teaching) aims to
merge the teaching of middle school science with the development of English vocabulary and in
addition to professional development for teachers, provides some curricular materials in
support of this goal. Building on a school district’s existing curriculum adoption and labs,

Impact of Project GLAD on Literacy - 5
researchers developed and delivered professional development that combined hands-on,
inquiry-based science instruction with specific scaffolds to support ELs (e.g., illustrations of
vocabulary concepts, graphic organizers, demonstrations and modeling, and ongoing
discussion among teachers and students). In professional development, teachers learn to
provide explicit instruction in 15 new vocabulary words each week and to respond to students
in ways that encourage ELs to clarify and elaborate on their contributions. Unlike SIOP, QuEST
also provides curricular materials, such as a teacher guide, instructional charts, and supplies for
hands-on science activities for two, month-long units (August, Branum-Martin, Cárdenas-
Hagan, & Francis, 2009).
An initial small study of QuEST found significant positive impacts for both science
knowledge and vocabulary for ELs (August et al., 2009). However, a more recent study of a
somewhat revised version of this program (QuEST 2) with a larger sample found positive
impact on vocabulary outcomes for ELs, but not for science outcomes (August et al., 2014).
Because the same teachers implemented both the treatment (QuEST) and control (“typical
instruction”), it is possible that some of the instructional components that teachers found useful
made their way into the control classes and diminished differences in student outcomes,
although in their observations, researchers did not find evidence of contamination.
A third sheltered instruction approach, the Quality Teaching for English Learners
program, or QTEL, provides middle and high school teachers of current and former ELs with
intensive professional development and tailored, customized approaches designed to improve
instruction and outcomes for their students. Teachers attend a seven-day summer institute,
participate in four to six cycles of coaching, and take part in monthly collaborative lesson design

Impact of Project GLAD on Literacy - 6
meetings. During this time, they learn to design and implement lessons based on principles of
high expectations and a rigorous curriculum, and they learn to use scaffolds and intentionally
designed discussions that focus on language.1
A 2012 randomized controlled trial of QTEL, which included 52 California schools and
was conducted by a third-party evaluator, found no impact on student outcomes in English
language arts or English language development. It also found no effect on teacher attitudes,
knowledge, or practice as measured by the SIOP protocol (Bos et al., 2012). The study
experienced high rates of student and teacher attrition and perceived low levels of teacher
implementation, all of which may have decreased the study’s power to detect an impact. For
now, though, the approach remains unproven.
The instructional approach we studied, Project GLAD, shares some characteristics
with the other approaches described here, but instead of providing a lesson framework or
curricular materials, it gives teachers a set of very specific, multistep instructional
strategies to support students at various levels of English language proficiency, including
native speakers. Like other approaches, it uses scaffolds, intentionally designed small-
group interaction, graphic organizers, and nonlinguistic representations of content to
ensure ELs can access the content being taught. While Project GLAD is often popular with
teachers (Lucas & Mackin, 2012), the model had not undergone any previous formal
evaluation of its impact on student learning. Our study addresses this gap in the research
literature.
1 QTEL may be described as “similar to sheltered instruction” in many of its approaches, but it relies less on a particular framework or specific strategies and more on preparing teachers to design lessons in response to their specific students.

Impact of Project GLAD on Literacy - 7
Our specific research questions are:
• What is the impact of Project GLAD on the reading comprehension, vocabulary,
and writing achievement of ELs?
• Does Project GLAD have a different impact on ELs at different levels of English
proficiency?
• What is the impact of Project GLAD on the reading comprehension, vocabulary,
and writing achievement of non-ELs in the same classrooms?
THE INTERVENTION
Project GLAD is a teacher-developed model of professional development for mainstream
classroom teachers that has existed in more or less the same form since 1991 (Brechtel, 2001). It
operates out of the National Training Center (NTC) at the Orange County Department of
Education (OCDE). The NTC certifies Project GLAD trainers and provides training for
educators. At the time of the study, Project GLAD had 259 fully certified and active trainers.
According to the NTC, as many as 300,000 teachers in 18 states and several countries have been
trained in the Project GLAD instructional approach (personal communication, OCDE,
December 2014).
Project GLAD does not provide teachers with a set curriculum, teacher’s guide or
student-ready material. Instead, it trains teachers in 35 instructional strategies.2 Teachers then
use the strategies with the district-adopted curriculum already in their classroom. Thus, Project
GLAD specifies not what is taught, but rather how it is taught. Proponents argue that this
flexibility is one of the program’s strengths. At the same time, the absence of ready-made
2 At the onset of our study, some trainers included a few additional strategies. The NTC at the OCDE has since standardized training to introduce 50 strategies in the course of a seven-day training.

Impact of Project GLAD on Literacy - 8
instructional material means that it can be time-consuming for teachers to create the visuals
required for many of the strategies.
Project GLAD includes many instructional components supported by recent research.
Project GLAD, for example, makes use of a variety of graphic organizers, which support
reading comprehension (U.S. Department of Health and Human Services, 2000) and may
specifically help ELs acquire the main concepts from a text (Kame’enui & Carnine, 1998).
Strategies such as observation charts, team tasks, and process grids require that students work
together in pairs or small groups. These strategies encourage teachers to organize students into
collaborative, heterogeneous groupings—also helpful to ELs (August & Shanahan, 2006)—and
provide multiple structured ways for teachers to provide opportunities for students to talk in
pairs and small groups. In terms of vocabulary instruction, there has been growing consensus
that teaching a smaller number of words in depth is better than teaching a large number of
words at the definition-only level (Beck, McKeown, & Kucan, 2002; Graves, 2000, 2006; Stahl &
Nagy, 2006). While Project GLAD encourages teachers to include academic vocabulary in
strategies such as pictorial input charts, comparative input charts, and narrative input charts, it
does not specify how to select the academic vocabulary or how many words should be taught at
a time.
When delivering the Project GLAD professional development, the NTC organizes the 35
instructional strategies into four categories: focus and motivation; input; guided oral practice;

Impact of Project GLAD on Literacy - 9
and reading and writing. Table 1 displays the full list of 35 strategies, organized into the four
categories.3
Focus and Motivation. There are seven strategies in the focus and motivation category.
These strategies are designed to establish a cooperative learning environment and build student
interest by connecting to their background knowledge. They emerged from research pointing to
the importance of effective behavior management for promoting higher levels of student
engagement and learning (Bohn, Roehrig, & Pressley, 2004; Emmer & Stough, 2001). Behavior-
focused strategies in this category include the three personal standards (i.e., show respect, make
good decisions, solve problems), scouts, and literacy awards. Students are expected to
demonstrate the three behavior standards and are rewarded by the “scouts” when they do.
Scouts are fellow students who are responsible for looking for peers who demonstrate the three
standards in class; they then distribute the literacy awards. The awards are simply squares of
paper with authentic pictures and academic text that are linked to the unit being taught.
Other focus and motivation strategies work to build or activate background knowledge,
as the contribution of background knowledge to comprehension is also well documented and
perhaps even more crucial for ELs (August & Shanahan, 2006; Kamil, 2003). With the
observation chart, for example, students circle the room with a partner at the start of a new unit,
examining photographs and drawings related to the topic and jotting down their observations.
Using inquiry charts—another strategy—they record what they know (or believe they know)
about the topic, as well as what they want to know.
3 Some of the strategies have multiple steps and may fit into more than one category. In table 1, we list the strategies in the categories that the NTC used at the time our study began.

Impact of Project GLAD on Literacy - 10
Input. Five strategies in the input category help teachers deliver new information in
various formats (e.g., images, objects, graphic organizers, as well as mini-lectures and texts) so
that students can understand grade-level content regardless of English language proficiency.
The emphasis on visual input for ELs is supported by a range of research findings over the past
two and a half decades (Lee, Deaktor, Hart, Cuevas, & Enders, 2005; Sowell, 1989). Using input
strategies, teachers create visual supports (e.g., sketches and charts) to model how students
might organize information and to produce classroom-created posters that remain on the walls
so students can refer back to them. One strategy, the 10/2 lecture, breaks teacher direct
instruction into 10-minute increments with 2-minute breaks. Students use the 2-minute break to
discuss what they have learned with a partner. The 10/2 lecture may help students better access
grade-level content because they have the opportunity to reflect and discuss what they’re
learning as they learn, instead of leaving discussion to the end of a much longer lecture.
Guided Oral Practice. Ten guided oral practice strategies provide opportunities for
students to use their new knowledge and develop vocabulary and language structures in an
emotionally safe environment. This is intended to facilitate understanding of the material
taught via the input strategies. Project GLAD relies heavily on paired and small-group
conversations in an effort to give students more opportunity to talk. Strategies that minimize
student talk in front of the whole class may also help reduce possible anxiety about speaking in
English in front of a larger group. This is important, given that a study by Woodrow (2006)
found that Australian students in an advanced English for Academic Purposes course reported
their main stressors as performing in English in front of classmates and talking in English to
native speakers. Anxiety about performance could interfere with students’ attention to and

Impact of Project GLAD on Literacy - 11
understanding of new information and impede the creation of connections between new
knowledge and prior knowledge (Ellis, 2012).
The sentence patterning chart is a strategy that provides students the opportunity to
practice their oral language in an entertaining, nonthreatening way. On sentence patterning
charts, the teacher creates columns for the five parts of speech and leads students in identifying
examples of each part of speech, generally using vocabulary from the current thematic lesson.
The teacher or a student writes the selected words in the appropriate columns and then helps
the students combine words from the chart to make sentences in a particular order: adjective
noun-verb-adverb-prepositional phrase. The whole group then “sings” the sentences (e.g.,
“persistent paleontologists dig deeply in the caves”) to the tune of Farmer in the Dell; older
students may create a rap instead. Practicing oral language as part of a larger group provides
opportunities for students to practice both vocabulary and sentence structure without calling
attention to themselves as individuals.
Reading and Writing. There are 13 strategies in the reading and writing category. These
strategies are designed to help students read grade-level text and produce subject-appropriate
writing (narrative or expository). Project GLAD encourages teacher use of a gradual-release-of
responsibility model where teachers scaffold students’ reading and writing skills through
whole-class modeling, then small group, and finally individual practice. Teachers also create a
print-rich environment to ensure students have readily available resources to utilize for reading
and writing. For example, the “story map” strategy has teachers model how to map out a
narrative that students have read or how to create a map for a story they want to write. The
teacher’s example is posted in the classroom as a reference for students as they work on their

Impact of Project GLAD on Literacy - 12
own story maps. The “cooperative strip paragraph” strategy starts students writing
informational text as a group task, before they proceed to their own individual writing; they
also learn revising and editing skills as a whole group before working in their table teams, and
then independently. Prior research suggests this scaffolding process can be beneficial not only
for ELs, but for all students (Davis & Miyake, 2004; Kuhn et al., 2006; Walqui & van Lier, 2012).
In another strategy, students also work together in expert groups, a strategy in which every
student becomes an expert on one area within a broader topic, takes notes, and then teaches the
information to the rest of the group. Within a unit on rocks and minerals, one member of each
table team might become the “expert” on sedimentary rocks, while others specialize in igneous
or metamorphic rocks.
Although teachers may select individual strategies and implement them as isolated
activities, the strategies are intended to be implemented as a coherent whole over a multiweek
thematic unit. Typically, teachers use many of the motivation and input strategies early in the
unit and focus on student writing towards the end of the unit, but some strategies have multiple
uses over time (e.g., the student-created definitions in the cognitive content dictionary may
support students’ eventual writing of their own texts).
Learning to use 35 instructional strategies, many of them with multiple steps, is a
challenging task. Therefore, Project GLAD provides intensive professional development
following a highly structured seven-day training sequence, often supported by additional
follow-up coaching. Teachers begin by attending a two-day introductory workshop led by two
certified Project GLAD trainers. This workshop introduces the strategies and addresses

Impact of Project GLAD on Literacy - 13
language acquisition, cross-cultural respect, engagement, management of small-group work,
and differentiation.
After the two-day workshop, teachers attend a five-day classroom demonstration. For
five consecutive mornings, teachers observe two trainers teach a class in their own school using
Project GLAD strategies. The demonstrating trainers teach an entire thematic unit in a week in
order to be able to show all of the strategies. Depending on the trainers, the setting, and the
grade level of the students, trainers may demonstrate units on different topics. While one
trainer demonstrates, the other coaches the observing teachers: preparing them before the
lesson starts; whispering explanations during the lesson; and answering questions during
breaks. In the afternoons of the demonstration days, trainers support teachers as they plan
lessons that are connected to state standards. Following the demonstration, trainers provide
ongoing onsite coaching. The amount of coaching varies and is negotiated between the district
and trainers.
DATA AND METHODS
Research Setting and Participants. We conducted our study in Idaho over two school years—
Year 1 in academic year 2011–2012 and Year 2 in 2012–2013. We selected Idaho because, like
many other states, it had recently experienced a rapid increase in the number of ELs, and both
principals and administrators expressed a strong need for appropriate professional
development. Fortunately, unlike other western states, its districts did not have prior experience
with Project GLAD professional development, making it a good setting for a “clean”
randomized trial. We successfully recruited 21 districts and 30 schools to participate. Almost
half (47%) of the schools were in rural settings, with the others were located in towns (23%),

Impact of Project GLAD on Literacy - 14
cities (17%), or suburbs (13%). Most of the schools served students in preschool or kindergarten
through grade 5 (60%) and the size of the student population ranged from 216 to 727, with a
mean of 478 students4. All schools served current and former (reclassified) ELs, although in
Year 1, one school did not have any ELs in fifth grade and in Year 2, two schools did not.5
Originally, students were classified in three different language proficiency groups: 1)
current Limited English Proficient (LEP) students, eligible for Title III services because they had
scored at Level 3 or lower on the Idaho English Proficiency Assessment (IELA) or because of
teacher recommendation; 2) reclassified LEP (LEP-X) students who were formerly eligible for
Title III services and had exited the program within the previous two years by virtue of scoring
at a Level 4 or higher on the IELA or due to teacher recommendation; and 3) non-EL, a group
that combined students who had never been classified as LEP and/or students who had been
reclassified in second grade or earlier, as the state data system did not permit the identification
of students who had exited LEP status more than two years earlier. Statewide, we know that up
to a third of Idaho ELs were reclassified by second grade. Although we do not have that data
for the specific districts in our study (Nishioka, Burke, & Deussen, 2012), we expect that some
portion of the non-EL group consisted of former ELs who exited early in elementary school.
For our study, we decided to combine the categories of current LEP students and LEP-X
students into a single “ever-EL” group. We had several reasons for this decision. First, it
increased the statistical power of our analyses. In both years, we had a fairly small number of
students classified as current EL (3.6% and 3.1% in Year 1 and Year 2, respectively) and a larger
4 (http://www.sde.idaho.gov/site/statistics/fall_enrollment.htm). 5 We used school demographic data from spring 2009 to recruit schools during the 2010–2011 school year. All of the schools served ELs when we recruited them for the study, but many experienced a decline in the EL population between 2009 and 2010.

Impact of Project GLAD on Literacy - 15
number of former EL (8.4% in Year 1 and 9.9% in Year 2); merging them increased our n and
hence our power to detect effects. More important, we noted that baseline reading
comprehension, vocabulary, and state reading assessment scores of current EL and former EL
students in Year 1 were very similar, although this was less true in Year 2 (table 4). Finally,
research on reclassified ELs suggested that they continue to have similar needs for language
support even after reclassification (Gándara & Rumberger, 2007). Our combined category, ever-
EL, made up 13 percent of the total sample in Years 1 and 2.
The combination of current and former ELs into a single group made even more sense to
us when we looked more closely at the English proficiency level of the two groups. Because
Idaho permitted the classification of students as current or former EL to be based not only on
tests scores but also on teacher judgement, students who performed at the same level on the
IELA might end up with either classification. While all students who scored at proficiency
levels “beginning” and “advanced beginning” (levels 1 and 2 on the IELA) were designated as
current ELs, a quarter of students at the “intermediate” proficiency level (level 3) were more
likely to be current than former ELs. All students in the “early fluent” and “fluent” categories
(levels 4 and 5) were designated as former ELs.
Our ever-EL sample (n = 588 across both years) was predominantly Hispanic (92.2%)
and largely eligible for free and reduced-price lunch [FRL] (93.2%); about half of the students
were female (45.6%); one in seven (14.1%) was eligible for special education (SPED). Our non-
EL sample (n = 3,895 across both years with 1,956 in Year 1 and 1,939 in Year 2) was
predominantly non-Hispanic (75.8%), more than half were eligible for FRL (58.0%), half were
female (49.4%), and fewer than 10 percent (7.5%) were special education eligible. While there

Impact of Project GLAD on Literacy - 16
were no statistically significant differences in demographics between the non-EL students in the
treatment and control groups, there were significantly larger proportions of students eligible for
special education in Year 1 than Year 2 (9.0% versus 6.1%).
At each school, only fifth-grade teachers participated in the study. Across both years,
113 teachers participated (45.1% in the treatment and 54.9% in the control group). Most teachers
were White (98.2%), female (79.6%), and had been teaching for more than a decade. While three
teachers from the control group (4.8%) reported having received prior professional
development in Project GLAD, none in the treatment group had. Many (60.7%) had prior
exposure to SIOP, however, and some reported having received other prior training to support
ELs (20.9%). These demographics were similar for the treatment and control groups, although
control teachers were significantly more experienced (16.1 versus 10.3 years).
Research Design and Procedures
Recruitment and Random Assignment. We recruited schools during the fall and winter of the
2010–2011 school year. While we initially planned to use teacher-level random assignment,
during the recruitment phase we instead used school-level random assignment because
teachers vigorously objected to being assigned to a different condition than other members of
their grade-level team. While this reduced the power of our study, it increased teacher buy-in,
facilitated collaboration among teachers, and was more typical of the way Project GLAD is
usually implemented at a school.
In May 2011, we randomly assigned the 30 participating schools to treatment or control
conditions (15 schools to each condition). We began Year 1 with 92 fifth-grade classrooms—42
in treatment schools and 50 in control schools. In Year 2, after losing one treatment school, we
Impact of Project GLAD on Literacy - 17
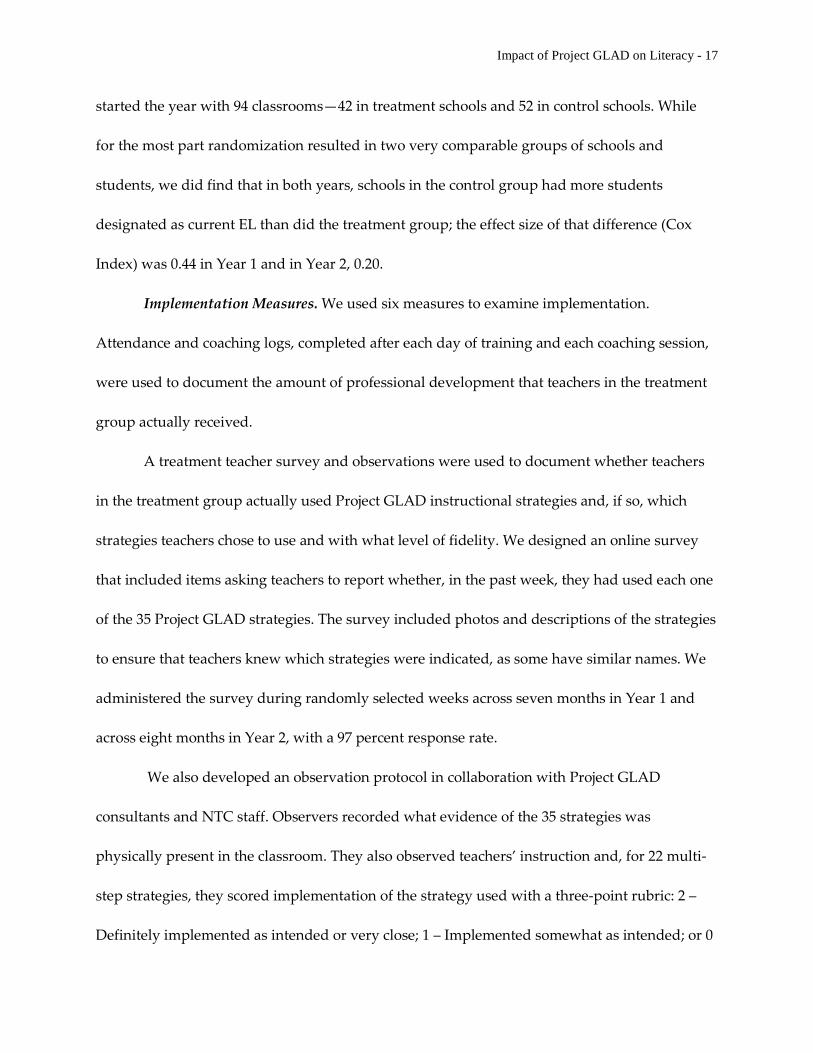
started the year with 94 classrooms—42 in treatment schools and 52 in control schools. While
for the most part randomization resulted in two very comparable groups of schools and
students, we did find that in both years, schools in the control group had more students
designated as current EL than did the treatment group; the effect size of that difference (Cox
Index) was 0.44 in Year 1 and in Year 2, 0.20.
Implementation Measures. We used six measures to examine implementation.
Attendance and coaching logs, completed after each day of training and each coaching session,
were used to document the amount of professional development that teachers in the treatment
group actually received.
A treatment teacher survey and observations were used to document whether teachers
in the treatment group actually used Project GLAD instructional strategies and, if so, which
strategies teachers chose to use and with what level of fidelity. We designed an online survey
that included items asking teachers to report whether, in the past week, they had used each one
of the 35 Project GLAD strategies. The survey included photos and descriptions of the strategies
to ensure that teachers knew which strategies were indicated, as some have similar names. We
administered the survey during randomly selected weeks across seven months in Year 1 and
across eight months in Year 2, with a 97 percent response rate.
We also developed an observation protocol in collaboration with Project GLAD
consultants and NTC staff. Observers recorded what evidence of the 35 strategies was
physically present in the classroom. They also observed teachers’ instruction and, for 22 multi-
step strategies, they scored implementation of the strategy used with a three-point rubric: 2 –
Definitely implemented as intended or very close; 1 – Implemented somewhat as intended; or 0

Impact of Project GLAD on Literacy - 18
– Not really implemented as intended. Observers were trained to use the protocol; inter-rater
reliability averaged 96 percent agreement. The team of observers conducted 75 observations in
in Year 1 (about two per teacher) and 115 in Year 2 (about three per teacher). In both years,
observations lasted an average of 41 minutes each.
To determine the degree to which teachers implemented observed strategies with
fidelity, we converted the rubric scores into percentages. On the rubric, each strategy had a
different number of total possible points because we rated each step of the strategy and some
strategies involved more steps than others. We calculated implementation fidelity scores as the
percentage of possible points that teachers actually received on any observed strategy.
The control teacher survey and observations were used to determine if control teachers
implemented Project GLAD strategies (or something similar) in their own classrooms. The use
of Project GLAD by control teachers was of particular concern because strategies such as
graphic organizers or the activation of prior knowledge have become widely adopted practices
since the program was developed more than 20 years ago. This meant that “business as usual”
in the comparison schools might include components of Project GLAD or something very
similar. We developed a paper survey in Year 1 and an online survey in Year 2. The Year 1
survey included items on demographics and prior experience; the Year 2 survey was closely
aligned to the treatment survey and included items about teachers’ familiarity with and use of
the 35 strategies. Control surveys were administered annually in the spring; we had an overall
response rate of 100 percent. Observers used a modified version of the same observation
protocol to document whether or not teachers used any Project GLAD strategies or used

Impact of Project GLAD on Literacy - 19
strategies that were similar. The same team of trained observers conducted 92 observations in
Year 1 and 102 in Year 2; most of these (92.8%) were in science or social studies classes.
Delivery of the Intervention. Teachers in the treatment schools attended the initial two-
day workshop in August 2011, before the school year started. Demonstrations took place in
several different schools in various locations around the state in October; teachers attended
either the demonstration in their own school or in one that was geographically convenient for
them. Because there was some teacher turnover between Years 1 and 2, we repeated the
workshop and demonstrations in August and October 2012 for the eight new fifth-grade
teachers in the treatment schools.
For our study, we provided teachers with three days of coaching per school, per year,
for two years: an amount that seemed feasible for districts to actually purchase. During onsite
coaching, Project GLAD trainers visited classrooms to provide additional support, model
strategies, observe teachers, answer questions, and work with grade-level teams to continue
developing units. In most cases, coaching was delivered to grade-level teams of teachers who
observed and provided feedback to one another, together with the trainer. Early on, the trainer
providing the coaching also demonstrated some strategies in teachers’ classrooms.
Outcome Measures. To assess Project GLAD’s impact in English language arts, we used
three assessments: the Gates-MacGinitie reading comprehension and vocabulary tests and the
6+1 Trait® Writing assessment. Student assessments were group administered by teachers,
following instructions provided by the research team.
Reading comprehension and vocabulary. Teachers administered the Gates-MacGinitie
multiple-choice reading comprehension and vocabulary assessments at the beginning and end

Impact of Project GLAD on Literacy - 20
of both school years, using alternate test forms. Students took the Gates-MacGinitie reading
comprehension and vocabulary assessments during two 45-minute periods (one each for
comprehension and vocabulary). The assessments were scored by Riverside Publishing.
Writing. Teachers administered an expository writing activity each spring, in which they
asked students to respond to one of three prompts related to fifth-grade, Idaho science
standards. Students were provided 45-minutes over three days to write a polished essay. These
essays were independently scored by two raters using the 6+1 Trait ® Writing rubric. Trait-based
writing approaches break writing down into specific components that can be taught and
assessed separately. The six core traits are ideas, organization, voice, word choice, sentence
fluency, and conventions; the seventh (“+1”) trait of presentation is sometimes assessed as well,
although we did not use it for our study. Because of the time requirements to administer the
writing assessment, we did not ask teachers to conductad a pretest; instead we used the fall
Gates-MacGinitie reading comprehension as a covariate.
Analysis of Outcome Data. Because Project GLAD was designed to address the
specific needs of ELs in mainstream classrooms with non-ELs, we felt it was important to
examine the impact on each group of students separately—to determine both whether the
intervention met its goal of assisting ELs and whether this modification of instruction had any
impact, positive or negative, on non-ELs. As a result, we ran analyses separately for ELs and
non-ELs, testing treatment effects separately for each outcome measure. We analyzed the
student data with a two-level hierarchical linear model (HLM) to reflect nesting of students
within school, which was the unit of treatment assignment. We used HLM 6.06 (Raudenbush,

Impact of Project GLAD on Literacy - 21
Bryk, & Congdon, 2008) to estimate the treatment effect. Expressed as HLM equations, our
model was
Student level yij = b0j + b1j (PRE)ij + eij
School level b0j = g00 + g01(TRT)j + u0j
b1j = g10
In this model, an individual student’s outcomes are predicted by the overall
performance level of his/her school (b0j), as well as by his/her own academic (reading)
achievement at baseline (PREij). The overall performance level of the school, in turn, is
predicted by its treatment status (TRTj). We assume the effect of individual achievement at
baseline to be invariant across schools (g10). Random error is accounted for by eij and u0j,
individual and school-level error terms, respectively. We centered baseline academic
achievement on the covariate (PREij) on the grand-mean, both to improve the estimation of
treatment effect and to facilitate the interpretation of results.
Initially we estimated the treatment impact separately for Year 1 and Year 2 using the
above analysis model, as we thought the Year 1 impact might differ from that in Year 2 as
teachers became more proficient with GLAD. Nevertheless, we also thought it worthwhile to
estimate a pooled (Year 1 and 2) treatment impact. After calculating separate impact estimates
for Year 1 and Year 2, we pooled the data across the two years and performed a year-as
moderator analysis (by adding an indicator variable of Year, as well as the Year-by-Treatment
interaction term to the above analysis model). Results of these analyses indicated no difference
in the impact of ever-ELs across years (table 2); we therefore only present their pooled impact
estimates. Our analysis of ELs at different IELA levels, year-as-moderator results also indicated

Impact of Project GLAD on Literacy - 22
a consistent level of treatment impact across the two years. However, year-as-moderator results
for non-ELs revealed a difference in the impact across the two years; therefore, we present the
impact estimates for those two years separately.
RESULTS
In this section, we begin by describing broad patterns in implementation, as important context
for understanding the findings. We then report findings for each of our three research
questions.
Teachers’ Participation in the Professional Development. All treatment teachers
received training and coaching to implement Project GLAD. Only two of the 42 teachers did not
attend all 45 hours of the workshop and demonstration, and most teachers participated in the
follow-up coaching each year as planned. Teachers received an average number of 16.9 hours of
coaching per year in Year 1 (a range of 11–20) and 16.6 hours (a range of 5–26) in Year 2. In
addition to the three coaching visits per year, teachers could call or email the trainer assigned to
coach at their school at any time with questions. In Year 1, an average of 40.7 percent of teachers
reported requesting and receiving such support in any given month; this figure dropped to an
average of 31.4 percent of teachers in Year 2.
Treatment Teachers’ Use of Project GLAD Strategies. Every treatment teacher in the
study implemented some aspects of Project GLAD. Teacher survey responses indicated that
they used an average of 12.5 different strategies per week in Year 1 and 11.9 in Year 2. Teachers
began implementing Project GLAD strategies immediately following the training and continued
to use the strategies through the end of the year; their level of use varied little over the course of
the school year.

Impact of Project GLAD on Literacy - 23
A focus on the means alone, however, could obscure the large variation among teachers
(table 5). We averaged the number of Project GLAD strategies used in a week across each
teacher’s seven surveys (eight in Year 2) and found large variations; at one end a teacher
implemented an average of only 2.6 strategies per week, while on the other end a different
teacher averaged 23 strategies per week over the first year. In Year 2, the range extended from
0.5 strategies to 25.9 strategies per week. Thus, we had a large range of implementation levels in
our study. While trainers report that they often see this in schools they work with, we do not
have empirical data to determine whether the means and ranges we saw were typical, higher, or
lower than in other settings.
Not only did teachers implement a different number of strategies, but they also varied in
the types of strategies they implemented. Across the two years of implementation, teachers
were less likely to use strategies in the Reading and Writing category than in the other three
categories. Even within categories, some strategies were used more often than others.
We also looked at whether or not teachers used the strategies with fidelity, using the
scoring method described earlier in this paper. Overall average implementation fidelity scores
were 69.6 percent in Year 1 and 74.7 percent in Year 2. Strategies with the highest fidelity scores
in Year 1 were not necessarily the strategies with the highest fidelity scores in Year 2.
Description of “Business as Usual” in the Control Condition. Teachers in control
schools were asked to continue providing “business as usual” (BAU). In Idaho, instruction of
ELs takes place almost entirely in English. According to a recent report to the Idaho state
legislature (Nava & Hall, 2014), between 2010 and 2011 an average of 41 percent of ELs received
some sort of sheltered instruction, with the remainder receiving either pull-out English as a

Impact of Project GLAD on Literacy - 24
Second Language [ESL] (28%), content-based ESL in classrooms that teach content and English
only to ELs (12%), or structured English immersion with some primary language support (10%).
Ten percent of ELs received some form of bilingual education. These program models represent
the options for BAU at the control schools, and mirrored the prior experience of teachers in the
treatment schools.
What we most wanted to learn about BAU in the control schools was whether teachers
used Project GLAD or Project GLAD-like strategies, but we found little evidence of their use.
Survey responses from teachers in the control group indicated that they had very limited
exposure to Project GLAD. Only 5 percent (n = 3) of control teachers indicated having ever
participated in any Project GLAD training. Fewer than 7 percent of the control teachers had any
other exposure to Project GLAD, such as having seen online Project GLAD units, observed
Project GLAD instruction, or received any Project GLAD coaching. Only 7 percent of teachers in
the control group reported using any Project GLAD strategies in their teaching during the
school year. When we asked control teachers if they were familiar with Project GLAD
instructional strategies, 85 percent in Year 1 and 77 percent in Year 2 answered “not at all.”
When we presented the teachers in the control schools with a photograph and
description of each instructional strategy at the end of Year 2, a different picture emerged.
Instead of simply asking, “Do you use Project GLAD strategies?,” we asked for each strategy,
“How familiar are you with this instructional strategy?” and “How often do you use this
strategy?” Overall, teachers in the control schools reported that they were familiar with an
average of 15.3 of the 35 Project GLAD strategies and had used at least 11.3 of them at some
point, though not necessarily regularly. Despite reporting being somewhat familiar with the

Impact of Project GLAD on Literacy - 25
Project GLAD strategies, in observations we saw teachers in the control classrooms using few
instructional strategies that were recognizable as Project GLAD, or even somewhat similar. Of
35 possible strategies, in Year 1 we observed teachers in control schools using an average of 0.7
strategies (a range of 0 to 5 in any given observation); in Year 2 we observed them using an
average of 0.3 strategies (a range of 0 to 4). To the degree that we observed any Project GLAD or
“GLAD-like” strategies, we observed the 10/2 Lecture, Numbered Heads (a small group
management strategy), Picture File Cards, graphic organizers, and chants.
In sum, teachers in treatment schools implemented Project GLAD, though frequency
and fidelity of implementation varied. Furthermore, although teachers in control schools
reported using some instructional strategies similar to Project GLAD, we very rarely witnessed
this when we observed their classroom instruction.
Student outcomes. Despite losing one treatment school in Year 2, overall and
differential attrition were within allowable ranges at the cluster (school) level (U.S. Department
of Education, 2013b). Overall and differential attrition were also within allowable ranges for
both ELs and non-ELs on each outcome.
What is the impact of Project GLAD on the reading comprehension, vocabulary, and writing
achievement of ELs? Gates-MacGinitie reading comprehension and vocabulary and 6+1 Trait®
Writing unadjusted, descriptive statistics are provided in table 4. Compared to the control
group, the treatment group had higher Gates-MacGinitie pretest scores and higher posttest
scores on all outcomes, except the writing trait of voice.
Table 5 reports the HLM results, significance tests, and effect sizes for ELs in reading
comprehension, vocabulary, and writing. Again, all impact estimates are positive, except the

Impact of Project GLAD on Literacy - 26
writing trait of voice. In three areas—reading comprehension, vocabulary, and the writing trait
of ideas—estimate impacts approach significance (p ≤ 0.1). The largest effects were seen in the
writing trait of ideas (Hedges’ g = 0.22), reading comprehension (Hedges’ g = 0.16), vocabulary
(Hedges’ g =0.14), and word choice (Hedges’ g = 0.14).
Does Project GLAD have a different impact on ELs at different levels of English proficiency?
We also conducted our HLM analyses with groups of ELs at different levels of English
proficiency (table 6). These results indicate that Project GLAD had a much larger impact on ELs
at the “intermediate” level (Level 3 on the IELA). Impact estimates were all positive and
significant at the p ≤ 0.05 level in the areas of vocabulary and writing (ideas, organization, and
sentence fluency) and in reading comprehension at the p ≤ 0.10 level. Effect sizes were also
much larger than those for all ELs, especially in the areas of ideas (g =.46), organization (g = .39),
sentence fluency (g = .38), and vocabulary (g = .38).
What is the impact of Project GLAD on non-ELs in the same classroom? Gates-MacGinitie
reading comprehension and vocabulary and 6+1 Trait® Writing unadjusted, descriptive
statistics are provided in table 7. Compared to the control group, the intervention group had
higher Gates-MacGinitie pretest scores and higher posttest scores on many outcomes, with the
exceptions of writing conventions in Years 1 and 2 and the writing traits of organization, voice,
and sentence fluency in Year 2.
Table 8 reports HLM results for non-ELs in reading comprehension, vocabulary, and
writing for Years 1 and 2. In Year 1, all impact estimates were positive; all results were non-
significant, with the exception of the writing trait of ideas where the estimate impact
approached the significance level of p ≤ 0.10. The largest effects were seen in the writing trait of

Impact of Project GLAD on Literacy - 27
ideas (Hedges’ g of 0.21), word choice (g = 0.14), organization (g = 0.13), and sentence fluency (g
=0.12). In Year 2, all impact estimates were negative, with the exception of word choice. All
results but one were nonsignificant; only the impact estimate for vocabulary approached the
significance level of p ≤ 0.10. The largest effects were seen in the writing trait of voice (Hedges’ g
= -0.14) and sentence fluency (g = -0.13).
DISCUSSION
Our study examined the impact of Project GLAD professional development for teachers on
the literacy achievement of two cohorts of ELs. We found that although most teachers
received the full training and coaching, implementation of Project GLAD at the classroom
level varied substantially across teachers. While a few teachers used many strategies on a
regular basis, many used only a subset of the strategies, and some strategies were rarely
used at all.
Despite the uneven implementation, our outcome results found that Project GLAD
did provide some benefit to fifth-grade ever-ELs—in reading comprehension (Hedges’ g =
0.16), vocabulary (Hedges’ g = 0.14), and in the writing traits of ideas and organization
(Hedges’ g = 0.22 and 0.11, respectively). The effect size for vocabulary was smaller than
the effect on vocabulary found for the Quest2 model (August et al., 2009), although that
study used a proximal, researcher-designed vocabulary measure, rather than the more distal
measure we used for this study. Otherwise, we have little basis for comparing the effect sizes
we found to those of other approaches to sheltered instruction.
What we do know is that Project GLAD, on its own, is not sufficient to close the
achievement gap between ever-ELs and non-ELs. Mean scores for ever-ELs on the Gates

Impact of Project GLAD on Literacy - 28
MacGinitie moved from the 13th percentile at the pretest to the 18th percentile at posttest. In
contrast, non-ELs began the year at the 52nd percentile and ended the year at the 56th
percentile, suggesting that ELs need more than the language support they get in the mainstream
classroom through Project GLAD. At the same time, we also know that at least in some settings
where Project GLAD is used, it may be the only language support that ELs receive at all
(Stephens & Johnson, 2015).
When we examined the question of whether Project GLAD might have a different
impact on ELs at different levels of proficiency, we found that these effect sizes were
substantially larger for intermediate ELs, ranging from 0.29 to 0.46 for all measures except the
writing trait of conventions. These effect sizes offer greater promise of starting to close the
achievement gap, but we do not yet know the mechanisms that make Project GLAD most
effective for this subset of ELs.
When considering the impact of an instructional approach designed to be used with a
linguistically heterogeneous student population in the mainstream classroom, it is necessary to
consider the impact on non-ELs as well. Here we found different results across the two cohorts
of students. In the first year, overall we found no significant differences between non-ELs in the
treatment and control conditions, although all the adjusted means were positive. The one
exception to this finding was in the writing trait of ideas, where non-ELs in the treatment
schools outperformed their counterparts in control schools (Hedges’ g = 0.21, approaching
significance). We took this to mean that there was no harm to non-ELs from the use of Project
GLAD strategies and possibly some benefit to their writing.

Impact of Project GLAD on Literacy - 29
In the second year, however, we found effects—generally nonsignificant—in a negative
direction. On the vocabulary measure, a small negative impact approached statistical
significance (Hedges’ g = -0.08) and other effects were consistently in a negative direction.
Although we examined these results to determine whether changes in student demographics or
baseline literacy achievement might account for the different results over the two years, we
have not been able to identify an explanation with the available data.
Considering our findings (i.e., some benefit for ever-ELs, greater benefit for students at
the intermediate level, and contradictory effects for non-ELs in the same classroom) and the
prevalence of sheltered instruction as a way to meet the needs of the growing number of ELs in
American classrooms, there is a clear need for additional rigorous studies of both
implementation and impact. Practitioners need stronger evidence to make good decisions about
instructional approaches, and our students deserve instruction that can be beneficial to all.

Impact of Project GLAD on Literacy - 30
Tables
Table 1. Project GLAD instructional strategies, organized by category Motivation strategies Input strategies Three behavior standards Super scientist/Literacy awards Cognitive content dictionary Observation charts Big books Inquiry chart Scouts
Graphic organizer Pictorial input chart Comparative input Narrative input chart 10/2 lecture
Guided oral practice strategies Reading & writing strategies Chants/Poetry Sentence patterning chart Picture file card Team tasks Mind maps T graph Team points Process grid Numbered heads Personal interaction
Story map Cooperative strip paragraph Writers’ workshop ELD group frame ELD review/retell Clunkers and links Focused reading Ear-to-ear reading Learning logs Interactive journals Expert group Home/School connection Portfolios

Impact of Project GLAD on Literacy - 31
Table 2. Comparison of Year 1 and Year 2 pretest reading comprehension scores across EL status Year 1 Year 2
N Pretest
N Pretest
M NPR M NPR
Reading
Comprehension
Current EL 80 464.5 16 68 449.6 7
Former EL 187 469.3 20 215 472.0 22
Non-EL
Vocabulary
1943 501.0 51 1919 500.3 50
Current EL 80 452.4 9 64 439.8 5
Former EL 187 460.7 15 217 463.0 16
Non-EL
ISAT Reading
1956 499.6 50 1926 499.2 50
Current EL 75 199.2 NA 59 191.9 NA
Former EL 183 200.8 NA 220 203.3 NA
Non-EL 1871 213.0 NA 1850 213.5 NA
Table 3. Treatment by year interaction effects for ever-EL, current EL and non-EL samples z (p) for Treatment x Year Interaction*
Ever-EL Current EL Non-EL
Reading
Comprehension
-0.79
(0.43)
1.17
(0.24)
-1.58
(0.12)
Vocabulary -1.12
(0.26)
-0.47
(0.64)
-2.60
(<0.01)

Impact of Project GLAD on Literacy - 32
Writing - Ideas -0.44
(0.66)
-0.44
(0.66)
-1.46
(0.15)
Writing - Organization -0.62
(0.53)
0.53
(0.60)
-2.38
(0.02)
Writing - Voice 0.00
(1.00)
0.69
(0.49)
-3.63
(<0.01)
Writing - Word Choice -0.46
(0.65)
-0.88
(0.38)
-0.86
(0.39)
Writing - Sentence
Fluency
-0.47
(0.64)
0.83
(0.41)
-3.93
(<0.01)
Writing - Conventions 0.70
(0.48)
0.48
(0.63)
-1.13
(0.26)
*If z is negative, Year 2 impact was smaller than Year 1 impact.

Impact of Project GLAD on Literacy - 33
Table 4. Unadjusted descriptive statistics for comprehension, vocabulary, and writing assessments, ever-ELs only
Pretest Posttest
M S
D
n M S
D
n
Gates-MacGinitie Reading Comprehension
Treatment 469.83 26.07 223 481.08 30.21 206
Control 466.50 27.21 360 474.10 28.38 321
Gates-MacGinitie Vocabulary
Treatment 462.33 27.15 220 477.70 27.28 206
Control 456.42 25.28 361 470.21 27.44 321
6 Trait Writing (no pretest available)
Writing – Ideas
Treatment 3.75 0.69 195
Control 3.58 0.69 313
Writing - Organization
Treatment 3.56 0.57 195
Control 3.44 0.65 313
Writing – Voice
Treatment 3.95 0.47 195
Control 3.96 0.48 313
Writing - Word Choice

Impact of Project GLAD on Literacy - 34
Treatment 3.94 0.44 195
Control 3.86 0.46 313
Writing - Sentence Fluency
Treatment 3.63 0.58 195
Control 3.60 0.58 313
Writing - Conventions
Treatment 3.78 0.51 195
Control 3.74 0.50 313

Impact of Project GLAD on Literacy - 35
Table 5. HLM results for reading comprehension, vocabulary, and writing outcomes, ever- ELs only
Treatment (Project GLAD)
Control (BAU)
Impact: GLAD - BAU
(SE) Test
statistic Effect size
Intercept + TX
coefficient (n)
Intercept (n) TX
coefficient (SE)
z = p = Hedges’ g
Gates-MacGinitie Reading Comprehension
479.18 (204)
474.73 (315)
4.45 (2.41)
1.84 0.07 0.16
Gates-MacGinitie Vocabulary
477.93 (201)
474.14 (319)
3.79 (2.19)
1.73 0.08 0.14
Writing – Ideas 3.73 (193)
3.58 (310)
0.15 (0.09)
1.68 0.09 0.22
Writing-Organization
3.53 (193)
3.46 (310)
0.07 (0.08)
0.88 0.38 0.11
Writing - Voice 3.95 (193)
3.98 (310)
-0.03 (0.06)
-0.44 0.66 -0.05
Writing – Word Choice
3.92 (193)
3.86 (310)
0.06 (0.05)
1.22 0.22 0.14
Writing - Sentence Fluency
3.56 (193)
3.55 (310)
0.01 (0.07)
0.14 0.89 0.02
Writing Conventions
3.77 (193)
3.75 (310)
0.02 (0.06)
0.40 0.69 0.05

Impact of Project GLAD on Literacy - 36
Table 6. HLM results for reading comprehension, vocabulary and writing outcomes, intermediate ELs only
Treatment (Project GLAD)
Control (BAU)
Impact: GLAD - BAU
(SE) Test
statistic Effect size
Intercept +TX
Coefficient (n)
Intercept (n) TX
Coefficient (SE)
z = p = Hedges’ g
Gates-MacGinitie Reading Comprehension
470.11 (48)
462.84 (90)
7.27 (4.46)
1.63 0.10 0.29
Gates-MacGinitie Vocabulary
468.54 (45)
459.22 (90)
9.32 (4.06)
2.29 0.02 0.38
Writing – Ideas 3.54 (47)
3.26 (84)
0.28 (0.12)
2.34 0.02 0.46
Writing – Organization
3.43 (47)
3.21 (84)
0.22 (0.10)
2.15 0.03 0.39
Writing – Voice 3.93 (47)
3.82 (84)
0.11 (0.08)
1.39 0.16 0.25
Writing – Word Choice
3.81 (47)
3.70 (84)
0.11 (0.07)
1.50 0.13 0.25
Writing - Sentence Fluency
3.53 (47)
3.34 (84)
0.19 (0.08)
2.29 0.02 0.38
Writing Conventions
3.66 (47)
3.65 (84)
0.01 (0.08)
.016 0.88 0.03

Impact of Project GLAD on Literacy - 37
Table 7. Unadjusted descriptive statistics for comprehension, vocabulary and writing assessments, non-ELs only
Pretest Posttest
D D
Gates-MacGinitie Reading Comprehension
Year 1
Treatment
02.7 4.7 24 14.1 8.3 29
Control
99.4 5.0 019 10.1 0.1 21
Year 2
Treatment
02.0 3.8 78 11.6 5.5 01
Control
98.8 4.3 041 11.0 7.1 32
Gates-MacGinitie Vocabulary
Year 1
Treatment
01.1 2.0 28 19.1 4.1 29
Control
98.2 1.5 028 15.5 5.2 26
Year 2
Treatment
02.0 0.2 80 14.4 2.7 99
Control
96.8 0.5 046 12.4 3.2 44

Impact of Project GLAD on Literacy - 38
Writing - Ideas
Year 1
Treatment
.2 .6 25
Control
.0 .6 31
Year 2
Treatment
.3 .8 87
Control
.2 .7 30
Writing - Organization
Year 1
Treatment
.9 .5 25
Control
.8 .5 31
Year 2
Treatment
.0 .6 87
Control
.0 .6 30
Writing - Voice
Year 1

Impact of Project GLAD on Literacy - 39
Treatment
.2 .4 25
Control
.1 .4 31
Year 2
Treatment
.3 .6 87
Control
.3 .5 30
Writing - Word Choice
Year 1
Treatment
.2 .5 25
Control
.1 .4 31
Year 2
Treatment
.3 .5 87
Control
.2 .5 30
Writing - Sentence Fluency
Year 1
Treatment
.0 .5 25
Control

Impact of Project GLAD on Literacy - 40
.9 .5 31
Year 2
Treatment
.1 .6 87
Control
.1 .5 30
Writing - Conventions
Year 1
Treatment
.1 .5 25
Control
.1 .4 31
Year 2
Treatment
.2 .6 87
Control
.2 .5 30

Impact of Project GLAD on Literacy - 41
Table 8. HLM results for reading comprehension, vocabulary and writing outcomes, non-ELs only
Treatment (Project GLAD)
Control (BAU)
Impact: GLAD - BAU
(SE) Test
statistic Effect size Intercept +
TX Coefficient
(n)
Intercept (n) TX
Coefficient (SE)
z p Hedges’ g
Gates-MacGinitie Reading Comprehension
Year 1 513.64 (827)
512.00 (914)
1.64 (1.98)
0.83 0.42 0.04
Year 2 510.79 (795)
512.47 (923)
-1.68 (1.36)
-1.23 0.23 -0.05
Gates-MacGinitie Vocabulary
Year 1 518.29 (829)
516.78 (926)
1.51 (1.50)
1.01 0.32 0.04
Year 2 512.14 (795)
514.84 (941)
-2.70 (1.38)
-1.96 0.06 -0.08
Writing - Ideas
Year 1 4.16 (823)
4.03 (923)
0.13 (0.07)
1.84 0.08 0.21
Year 2 4.19 (782)
4.19 (924)
-0.00 (0.10)
-0.01 0.99 -0.00
Writing - Organization
Year 1 3.87 (823)
3.80 (923)
0.07 (0.06)
1.12 0.27 0.13
Year 2 3.98 (782)
4.00 (924)
-0.02 (0.09)
-0.22 0.83 -0.03
Writing - Voice
Year 1 4.13 (823)
4.10 (923)
0.03 (0.06)
0.59 0.56 0.08
Year 2 4.25 (782)
4.32 (924)
-0.07 (0.07)
-1.05 0.30 -0.14
Writing - Word Choice
Year 1 4.14 (823)
4.08 (923)
0.06 (0.05)
1.14 0.26 0.14
Year 2 4.24 (782)
4.22 (924)
0.02 (0.06)
0.28 0.78 0.03
Writing - Sentence Fluency
Year 1 3.94 (823)
3.88 (923)
0.06 (0.05)
1.13 0.27 0.12
Year 2 4.03 (782)
4.10 (924)
-0.07 (0.08)
-0.93 0.36 -0.13
Writing- Conventions
Year 1 4.09 (823)
4.06 (923)
0.03 (0.03)
0.97 0.34 0.07
Year 2 4.14 (782)
4.15 (924)
-0.01 (0.07)
-0.11 0.92 -0.01

Impact of Project GLAD on Literacy - 42
References
Almagauer, I. (2005). Effects of dyad reading instruction on the reading achievement of Hispanic third-grade English language learners. Bilingual Research Journal, 29(3), 509–526.
Arnold, D. H., McWilliams, L., & Arnold, E. H. (1998). Teacher discipline and child misbehavior in day care: Untangling causality with correlational data. Developmental Psychology, 34(2), 276–287.
August, D., Branum-Martin, L., Cárdenas-Hagan, E., & Francis, D. J. (2009). The impact of an instructional intervention on the science and language learning of middle grade English language learners. Journal of Research on Educational Effectiveness, 2(4), 345–376.
August, D., & Shanahan, T. (Eds.). (2006). Developing literacy in second-language learners: Report of the National Literacy Panel on Language-Minority Children and Youth. Mahwah, NJ: Lawrence Erlbaum.
Beck, I. L., McKeown, M. G., & Kucan, L. (2002). Bringing words to life: Robust vocabulary instruction. New York, NY: Guilford Press.
Behr, M. J., Lesh, R., Post, T. R., & Silver, E. A. (1983). Rational-number concepts. In R. Lesh & M. Landau (Eds.), Acquisition of mathematics concepts and processes (pp. 91–126). New York, NY: Academic Press.
Bohn, C. M., Roehrig, A. D., & Pressley, M. (2004). The first days of school in the classrooms of two more effective and four less effective primary-grades teachers. Elementary School Journal, 104(4), 269–287.
Brechtel, M. (2001). Bringing it all together: Language and literacy in the multilingual classroom (Rev. ed.). Carlsbad, CA: Dominie Press.
Brendefur, F., & St. Michell, W. (2009). Limited English Proficient (LEP) Program: 2009 legislative report. Boise, ID: Idaho State Department of Education.
Davis, E. A., & Miyake, N. (2004). Guest editors’ introduction: Explorations of scaffolding in complex classroom systems. Journal of the Learning Sciences, 13(3), 265–272.
Echevarria, J., Richards-Tutor, C., Canges, R., & Francis, D. (2011). Using the SIOP model to promote the acquisition of language and science concepts with English learners. Bilingual Research Journal, 34(3), 334–351.

Impact of Project GLAD on Literacy - 43
Echevarria, J., Short, D., & Powers, K. (2006). School reform and standards-based education: A model for English-language learners. Journal of Educational Research, 99(4), 195–210.
Ellis, R. (2012). Language teaching research and language pedagogy. Malden, MA: John Wiley & Sons.
Emmer, E. T., & Stough, L. M. (2001). Classroom management: A critical part of educational psychology, with implications for teacher education. Educational Psychologist, 36(2), 103– 112.
Gándara, P., & Rumberger, R. W. (2007). Resource needs for California’s English learners. Retrieved from Stanford University, Center for Education Policy Analysis website: http://cepa.stanford.edu/sites/default/files/gandara.pdf
Genesee, F., Lindholm-Leary, K., Saunders, W., & Christian, D. (2006). Educating English language learners: A synthesis of research evidence. New York, NY: Cambridge University Press.
Gersten, R., & Baker, S. (2000). What we know about effective instructional practices for English-language learners. Exceptional Children, 66(4), 454–470.
Gersten, R., Baker, S. K., Shanahan, T., Linan-Thompson, S., Collins, P., & Scarcella, R. (2007). Effective literacy and English language instruction for English learners in the elementary grades (IES Practice Guide, NCEE 2007-4011). Retrieved from U.S. Department of Education, Institute of Education Sciences, National Center for Education Evaluation and Regional Assistance, What Works Clearinghouse website: http://ies.ed.gov/ncee/wwc/PracticeGuide.aspx?sid=6
Goldenberg, C. (2013). Unlocking the research on English learners: What we know—and don’t yet know—about effective instruction. American Educator, 37(2), 4–11, 38.
Idaho State Department of Education. (2012). Idaho English Language Proficiency Assessment: 2012 technical report. Retrieved from https://www.sde.idaho.gov/site/assessment/IELA/docs/scoreReports/2012%20IELA%20T echnical%20Report_Final.pdf
Kame'enui, E. J., & Carnine, D. W. (Eds.). (1998). Effective teaching strategies that accommodate diverse learners. Upper Saddle River, NJ: Merrill/Prentice Hall.
Kamil, M. L. (2003). Adolescents and literacy: Reading for the 21st century. Washington, DC: Alliance for Excellent Education.
Impact of Project GLAD on Literacy - 44
Kuhn, M. R., Schwanenflugel, P. J., Morris, R. D., Morrow, L. M., Woo, D. G., Meisinger, E. B. … Stahl, S. A. (2006). Teaching children to become fluent and automatic readers. Journal of Literacy Research, 38(4), 357–387.
Lee, O., Deaktor, R. A., Hart, J. E., Cuevas, P., & Enders, C. (2005). An instructional intervention’s impact on the science and literacy achievement of culturally and linguistically diverse elementary students. Journal of Research in Science Teaching, 42(8), 857–887.
Lee, O., & Fradd, S. H. (1998). Science for all, including students from non-English language backgrounds. Educational Researcher, 27(4), 12–21.
Lee, O., Maerten-Rivera, J., Penfield, R. D., LeRoy, K., & Secada, W. G. (2011). Science achievement of English language learners in urban elementary schools: Results of a first-year professional development intervention. Journal of Research in Science Teaching, 45(1), 31–52.
Nava, C., & Hall, N. (2014). Limited English Proficient (LEP): 2014 legislative report. Retrieved from Idaho State Department of Education website: https://www.sde.idaho.gov/site/publications/communications_docs/2014/2014%20LEP% 20Legislative%20Report_FINAL.pdf
Nishioka, V., Burke, A., & Deussen, T. (2012). English language proficiency levels of limited English proficient students in Idaho (Issues & Answers Report, REL 2012-125). Retrieved from U.S. Department of Education, Institute of Education, National Center for Education Evaluation and Regional Assistance, Regional Educational Laboratory Northwest website: http://ies.ed.gov/ncee/edlabs/projects/project.asp?ProjectID=290
Raudenbush, S. W., Bryk, A. S, & Congdon, R. (2008). HLM 6 for Windows [Computer software]. Skokie, IL: Scientific Software International.
Saenz, L. M., Fuchs, L. S., & Fuchs, D. (2005). Peer-assisted learning strategies for English language learners with learning disabilities. Exceptional Children, 71(3), 231–247.
Sowell, E. J. (1989). Effects of manipulative materials in mathematics instruction. Journal for Research in Mathematics Education, 20(5), 498–505.
Stahl, S. A., & Nagy, W. E. (2006). Teaching word meanings. Mahwah, NJ: Lawrence Erlbaum.

Impact of Project GLAD on Literacy - 45
Stephens, C., & Johnson, D. C. (2015). ‘Good teaching for all students?’: Sheltered instruction programming in Washington state language policy. Language and Education, 29(1), 31–45.
Tharp, R. G., Estrada, P., Dalton, S. S., & Yamauchi, L. (2000). Teaching transformed: Achieving excellence, fairness, inclusion, and harmony. Boulder, CO: Westview Press.
U.S. Department of Education, Institute of Education Sciences, National Center for Education Evaluation and Regional Assistance, What Works Clearinghouse. (2013a). Sheltered Instruction Observation Protocol® (SIOP®): WWC intervention report (Updated ed.). Retrieved from http://ies.ed.gov/ncee/wwc/interventionreport.aspx?sid=460
U.S. Department of Education, Institute of Education Sciences, National Center for Education Evaluation and Regional Assistance, What Works Clearinghouse. (2013b). Evidence review protocol for interventions for English language learners, version 2.2. Retrieved from http://ies.ed.gov/ncee/wwc/documentsum.aspx?sid=22
U.S. Department of Health and Human Services, National Institute of Child Health and Human Development, National Reading Panel. (2000). Report of the National Reading Panel. Teaching children to read: An evidence-based assessment of the scientific research literature on reading and its implications for reading instruction (NIH Pub. No. 00-4769). Retrieved from http://www.nichd.nih.gov/publications/pubs/nrp/Pages/smallbook.aspx
Vaughn, S., Martinez, L. R., Linan-Thompson, S., Reutebuch, C. K., Carlson, C. D., & Francis, D. J. (2009). Enhancing social studies vocabulary and comprehension for seventh-grade English language learners: Findings from two experimental studies. Journal of Research on Educational Effectiveness, 2(4), 297–324.
Walqui, A., & van Lier, L. (2010). Scaffolding the academic success of adolescent English language learners: A pedagogy of promise. San Francisco, CA: WestEd.
Wenglinsky, H. (2000). How teaching matters: Bringing the classroom back into discussions of teacher quality. Retrieved from Educational Testing Service website: https://www.ets.org/Media/Research/pdf/PICTEAMAT.pdf
Woodrow, L. J. (2006). A model of adaptive language learning. Modern Language Journal, 90(3), 297–319.