Embed Size (px)
Citation preview

NBER WORKING PAPER SERIES
THE IMPACT OF ORGANIZATIONAL BOUNDARIES ON HEALTHCARE COORDINATION AND UTILIZATION
Leila AghaKeith Marzilli Ericson
Xiaoxi Zhao
Working Paper 28179http://www.nber.org/papers/w28179
NATIONAL BUREAU OF ECONOMIC RESEARCH1050 Massachusetts Avenue
Cambridge, MA 02138December 2020, Revised September 2021
The authors gratefully acknowledge research support by NIH grant P30AG012810. We thank Mohan Ramanujan, Len McCain and Elizabeth Adams for their assistance obtaining and managing the data. We thank Jason Abaluck, Amitabh Chandra, Kimberley Geissler, Thomas Koch, Jennifer Kwok, James Rebitzer, Adam Sacarny, Jonathan Skinner, Douglas Staiger, Jessica Van Parys, and Annetta Zhou for helpful comments. The views expressed herein are those of the authors and do not necessarily reflect the views of the National Bureau of Economic Research.
NBER working papers are circulated for discussion and comment purposes. They have not been peer-reviewed or been subject to the review by the NBER Board of Directors that accompanies official NBER publications.
© 2020 by Leila Agha, Keith Marzilli Ericson, and Xiaoxi Zhao. All rights reserved. Short sections of text, not to exceed two paragraphs, may be quoted without explicit permission provided that full credit, including © notice, is given to the source.

The Impact of Organizational Boundaries on Healthcare Coordination and Utilization Leila Agha, Keith Marzilli Ericson, and Xiaoxi ZhaoNBER Working Paper No. 28179December 2020, Revised September 2021JEL No. D23,I11,L14
ABSTRACT
We measure organizational concentration—the distribution of a patient's healthcare across organizations—to examine how firm boundaries affect healthcare efficiency. First, when patients move to regions where outpatient visits are typically concentrated within a small set of firms, their healthcare utilization falls. Second, for patients whose PCPs exit the market, switching to a PCP with 1 standard deviation higher organizational concentration reduces utilization by 21%. This finding is robust to controlling for the spread of healthcare across providers. Increases in organizational concentration predict improvements in diabetes care and are not associated with greater use of emergency department or inpatient care.
Leila AghaDepartment of EconomicsDartmouth College6106 Rockefeller HallHanover, NH 03755and [email protected]
Keith Marzilli EricsonBoston University Questrom School of Business595 Commonwealth AvenueBoston, MA 02215and [email protected]
Xiaoxi ZhaoDepartment of Economics, Boston University [email protected]
Introduction
Transaction costs and imperfect information can make it difficult to coordinate production
across firm boundaries (Coase 1937; Williamson 1985). The determinants of firm boundaries
have been the subject of substantial theoretical and empirical investigation, particularly
in the literature on vertical integration (Lafontaine and Slade 2007). Yet, we know less
about how firm boundaries affect firm performance (Mullainathan and Scharfstein 2001),
and empirical studies from different industries find mixed results.1
In healthcare, the challenges of cross-firm coordination are particularly salient; patient
care is often produced with the input of many healthcare providers working in separate orga-
nizations. Geographically and over time, there is substantial variation in the organizational
structures those providers operate in. An increasing fraction of US physicians is employed by
large practices or hospitals (Welch et al. 2013), which may mitigate these coordination chal-
lenges. Integrated care organizations such as the Mayo Clinic, Intermountain Healthcare,
and Kaiser Permanente are often held up as models of clinical efficiency and coordinated care
(Enthoven 2009). Yet empirical evidence on how organizational boundaries affect healthcare
delivery is limited.
In this paper, we investigate how organizational boundaries affect healthcare utilization.
Existing evidence has shown that when coordination of care is more difficult, healthcare uti-
lization tends to be higher. Higher utilization can be a sign of reduced efficiency, particularly
when it is not accompanied by commensurate improvements in care quality. Coordination
challenges can emerge when healthcare for an individual patient is spread across many in-
dividual providers (Agha et al. 2019; Frandsen et al. 2015), or when provider teams have
fewer repeat interactions (Agha et al. forthcoming, Kim et al. 2020, Chen forthcoming).
Cebul et al. (2008) argue that fragmentation across organizations may also be an important
source of healthcare inefficiency. Organizational boundaries can affect coordination costs;
e.g., healthcare firms often restrict information transmission to external providers by limit-
ing transfer across electronic medical record systems. Providers may invest in firm-specific
relationships and infrastructure that improve productivity (Huckman and Pisano 2006). Fi-
nally, organizational fragmentation can affect incentives for clinical process improvement and
other efficiency-enhancing investments due to common agency problems and spillovers that
prevent firms from reaping the full benefit of their investments (Frandsen et al. 2019).
We introduce the concept of “organizational concentration,” which measures the distribu-
tion of a patient’s outpatient visits across organizations. A patient’s healthcare has maximal
1For example, see Seru (2014); Pierce (2012); Stroebel (2016); Forbes and Lederman (2010); Forman andGron (2011).
1

organizational concentration if all of their outpatient care is billed by the same organization.
This construct builds on earlier work studying provider concentration (Pollack et al. 2016;
Agha et al. 2019). Organizational concentration describes the realized experience of a given
patient, and so is distinct from market concentration measures used in antitrust research,
which instead measure provider market power for pricing. Patients who receive all their
healthcare from one firm will have high organizational concentration even if there are many
firms in the market. Conversely, a patient may have low organizational concentration in a
highly concentrated market if they receive healthcare from many different specialty practices,
even if each practice has a monopoly in that specialty.
To our knowledge, we are the first paper to measure organizational concentration sys-
tematically, so we begin with a detailed descriptive analysis. Using insurance claims data for
a 20% sample of Medicare fee-for-service enrollees from 2007-2016, we construct a measure
of each patient’s experienced organizational concentration. There is substantial heterogene-
ity across regions in organizational concentration, even conditional on the spread of patient
care across providers. Studying patients who move across regions, we find that moving to a
location with a higher level of organizational concentration is associated with lower health-
care utilization. While these results suggest that organizational concentration leads to lower
healthcare spending, they should be interpreted with caution because other attributes of
regional practice style and place effects may be correlated with the level of organizational
concentration.
To isolate variation in organizational concentration from other aspects of the local prac-
tice environment, we exploit quasi-experimental variation in patient assignment to physicians
generated by physician exits. We examine the experiences of patients whose primary care
provider (PCP) exits the local market, either due to a move or retirement, following recent
work by Fadlon and Van Parys (2020) and Kwok (2019). Since patients may endogenously
sort to new PCPs on the basis of changes in their health status, we use an instrumental
variable strategy that leverages mean reversion to predict the change in a patient’s as-
signed PCP’s average organizational concentration, adapting the approach used by Laird
and Nielsen (2017) and Abaluck et al. (2021). When PCPs with low organizational con-
centration exit the market, their patients switch to more typical PCPs with higher average
concentration and subsequently experience lower healthcare utilization. Using this variation,
we estimate that patients who switch to a PCP with 1 SD higher organizational concentra-
tion have approximately 21% lower healthcare utilization in our preferred, most controlled
specification. This finding is robust to controlling for the number and types of providers
that the patient visits.
Our results indicate that organizational boundaries contribute additional frictions that
2

drive increased healthcare utilization, and this pattern does not simply reflect the challenges
of spreading care across multiple providers. Although we cannot fully isolate a PCP’s ten-
dency for organizational concentration from every other possible dimension of PCP practice
style, our estimated effect remains large in specifications that control for the spread of patient
care across providers, the size of the PCP’s practice group, as well as other PCP character-
istics (residency training, experience, gender). To the extent that observable variables are
informative about selection on unobservables, this supports the claim that organizational
concentration is an important independent contributor to spending variation (Oster 2019).
Finally, we investigate how organizational concentration influences quality of care. We
use several measures related to distinct dimensions of healthcare quality, spanning gaps in
primary care, appropriate management of chronic conditions, and use of testing and imag-
ing. We find no strong evidence that changes in PCP organizational concentration predict
changes in inpatient or emergency department visits. For patients with a chronic condi-
tion (diabetes), switching to a PCP with higher levels of organizational concentration leads
to better adherence to recommended care guidelines. This finding from diabetes care pro-
vides suggestive evidence that greater organizational concentration may facilitate improved
management of chronic conditions.
Taken together, our findings suggest that lower organizational concentration worsens care
efficiency: when patient care frequently crosses firm boundaries, utilization increases with no
evidence of offsetting quality improvements. This pattern may be a sign of the coordination
difficulties associated with low organizational concentration.
High levels of organizational concentration arise when most of the providers a patient con-
sults are integrated within the same firm. Our research is motivated by earlier work finding
the effects of firm integration on productive efficiency are theoretically ambiguous. Bring-
ing transactions into the same firm could improve communication (Arrow 1975) and reduce
contracting barriers (Hart and Moore 1990; Hart and Holmstrom 2010). On the other hand,
integration may also lead resources within the firm to be allocated less efficiently (Alonso
et al. 2008; Friebel and Raith 2010). Moreover, integration may improve coordination in
stable environments but lead to worse adaptation to change (Dessein 2014).
Empirical evidence from other industries on how integration affects firm performance
has found mixed results. Mullainathan and Scharfstein (2001), Seru (2014), and Pierce
(2012) document downsides to integration including less efficient capacity management, lower
innovation, and insufficient knowledge sharing. By contrast, Stroebel (2016), Forbes and
Lederman (2010), Forman and Gron (2011) find benefits of firm integration including superior
information, better performance, and faster technology adoption. Atalay et al. (2014) argue
that integration facilitates the efficient intrafirm transfer of intangible inputs, such as high
3

quality managerial oversight and planning. We build on this literature by studying how firm
boundaries affect health care delivery, a setting where the potential benefits of improved
coordination, knowledge-sharing, and management are high, and rich insurance claims data
allows us to track the production process.
Within healthcare, there is limited evidence on how the integration of healthcare providers
affects care delivery. Although large consolidated practice groups argue they can deliver lower
cost, higher quality healthcare by improving coordination, leveraging returns to specializa-
tion, and facilitating fixed cost investments, empirical evidence of these benefits is limited
(Cutler and Scott Morton 2013). Recent work suggests that hospital mergers and acquisi-
tions of physician practices do not spur improvements in clinical quality or health outcomes
(Beaulieu et al. 2020; Koch et al. 2018).2 We build on this research by studying changes
in the extent to which individual patient care crosses firm boundaries, rather than focusing
on short-run effects of mergers and acquisitions. Care coordination depends on the ease
of communication across multiple providers who treat the same patient, but mergers may
simply bring competing providers—who rarely would have treated the same patient—into
the same firm. Further, the process of organizational transformation is often slow. Because
this paper does not focus on short-run effects of mergers, the effects we study may reflect
longer-run operational changes associated with integration.
This paper is also related to a growing literature investigating differences in practice
patterns across individual physicians. Across a variety of care contexts, individual physician
quality and practice style have important effects on care outcomes.3 Recent work by Kwok
(2019) and Fadlon and Van Parys (2020) documents that primary care physicians in partic-
ular have substantial influence on patients’ healthcare spending. We build on this insight by
investigating one important dimension of PCP practice environment and referral patterns,
i.e. the PCP’s tendency to concentrate patient care within organizations.
The paper is organized as follows. Section 1 introduces our measure of organizational
concentration. Section 2 describes our data and sample selection. Section 3 reports descrip-
tive statistics on regional variation in organizational concentration and uses movers between
regions to explore how regional variation in organizational concentration may contribute to
regional variation in healthcare utilization. Section 4 lays out our main empirical strat-
egy exploiting PCP exits to explore the impact of organizational concentration. Section 5
presents the results on how healthcare utilization and quality outcomes change when a pa-
2These acquisitions may even raise healthcare spending, as physicians shift the site of care from doctors’offices to hospital outpatient settings (Koch et al. 2017) and exploit reimbursement rules that allow hospital-owned physician practices to charge additional facility fees (Capps et al. 2018; Whaley et al. 2021).
3For example, see Gowrisankaran et al. (2017); Molitor (2018); Chan et al. (2019); Currie and MacLeod(2017); Currie et al. (2016); Sahni et al. (2016).
4
tient switches to a PCP with a different level of organizational concentration. Section 6
concludes.
1 Defining Organizational Concentration
In this project, we study the coordination frictions that arise when healthcare is spread
across organizational boundaries. To do so, we define organizational concentration, adapt-
ing a concentration index that has been used in prior literature to measure the spread of
patient care across providers.4 Specifically, we use a Herfindahl–Hirschman Index (HHI)
that calculates how outpatient healthcare received by a patient is spread across organiza-
tions. We measure organizational concentration using outpatient care, following previous
literature defining continuity of outpatient care across individual physicians (Nyweide and
Bynum 2017; Nyweide et al. 2013). This allows us to consider the impact of outpatient orga-
nizational concentration on the likelihood that a patient requires an emergency department
visit or hospitalization.
We calculate patient i’s share of outpatient visits at each organization j, in a year t.
Organizational concentration is then defined as the sum of squared shares across all the
organizations:
OrgConcit =∑j
share2ijt. (1)
In general, organizational concentration is higher when a patient visits fewer organizations.
When a patient’s outpatient visits are uniformly distributed across N organizations, this
measure is simply 1/N . When a patient receives all the visits from one organization, this
concentration measure will be 1. Lower values correspond to patient care that is spread more
diffusely across organizations.
Defining provider concentration
To distinguish our findings from prior analyses, we will study variation in organizational
concentration conditional on provider concentration. Provider concentration measures the
spread of patient healthcare across providers. Following Agha et al. (2019), we construct a
measure of provider care concentration where the shareipt measures the share of patient i’s
outpatient visits in year t for each provider p:
ProvConcit =∑p
share2ipt. (2)
4Pollack et al. (2016) provides an overview and comparison of commonly used measures of care continuity.
5

This measure will capture the challenges of coordinating healthcare across many providers,
thus allowing us to distinguish them from the frictions that are specific to crossing organi-
zational boundaries.
2 Data and Sample Construction
2.1 Patient sample selection
Our primary source of data is a 20% sample of Medicare Fee-For-Service (FFS) Part A
and Part B claims data from 2007-2016. The 10-year panel data allows us to observe both
patient moves and PCP exits. We use the Carrier, Inpatient, and Outpatient claims files
to measure care utilization and spending.5 Patient demographics (age, sex, zip code) and
chronic conditions are extracted from the Master Beneficiary Summary file with the Chronic
Condition segment. In the remainder of this section, we describe the sample restrictions
implemented to construct our main analytic samples.
Initial sample restrictions
We restrict our sample to Medicare beneficiaries who are 65–99 years old (inclusive) and
continuously enrolled in Medicare FFS. After these restrictions, our data covers 9,675,113
beneficiaries. Our organizational concentration measure is defined based on Carrier file
claims with an outpatient place of service; we drop 417,638 beneficiaries who did not have any
visits of this type. This comprises our Broad Sample. From this Broad Sample, we define two
separate analytic samples for different purposes. First, we define a “Patient Mover Sample”
for a descriptive analysis studying regional variation in organizational concentration. Second,
we define a “PCP Exit Sample” for our primary analysis studying the relationship between
PCPs’ organizational concentration and patient care utilization. We describe each of these
samples below.
Patient Mover Sample
We construct a Patient Mover Sample for our initial descriptive analysis. Sample restrictions
defined here follow the construction process outlined in Agha et al. (2019). We assigned each
patient to a hospital referral region (HRR) on an annual basis, using the zip code reported
5The Inpatient file contains institutional inpatient claims, and the Outpatient file contains claims frominstitutional outpatient providers such as hospital outpatient departments or community mental healthcenters. The Carrier file contains non-institutional claims billed by individual providers such as physicians,and these claims can result from services provided at either outpatient or inpatient settings.
6
in the Beneficiary Summary File. Further, we require that the patient received at least 75%
of billed claims within that HRR; we drop beneficiaries who do not meet this requirement.
To be included as a mover, the patient’s HRR must have changed once (and only once) in
our 10-year period. Further, the beneficiary must be continuously in the sample from two
years before their move to two years after. Our sample includes all 25,814 moving patients
who meet these criteria.
PCP Exit Sample
We construct a PCP Exit Sample for our main analysis. This analysis focuses on beneficiaries
who change their attributed PCP due to the original PCP’s relocation or retirement. We
attribute each patient to their plurality PCP in each year, defined as the internist, family
practice physician, or medical specialist who bills a plurality of the patient’s Evaluation &
Management (E&M) visits that year; ties are broken randomly. We exclude patients who
have no E&M visits and thus cannot be matched to a provider, as well as patients whose
plurality provider is a surgeon or non-physician. If a patient cannot be matched to a PCP
according to this algorithm, they will be excluded from the PCP Exit Sample. For more
details on the PCP attribution, see Appendix A.1.
We limit this analysis to patients whose initial attributed PCP either moved (i.e. relo-
cated once to a different HRR) or retired (i.e. bills no further Medicare claims). We also
exclude patients who move across HRRs themselves. We require that the patient have the
same plurality PCP for four years prior to the PCP’s exit, limiting the sample to exits that
occur in 2011–2016 to ensure four years of pre-exit observations. In addition to the four
years of pre-exit observations for every patient, we also include up to four years of data
following the exit. The PCP Exit Sample includes 51,570 beneficiaries. These patients are
initially attributed to one of 25,650 exiting PCPs; including both the exiting PCPs and the
destination PCPs, this sample covers 72,231 PCPs.
2.2 Measuring organizational concentration
Measuring Organizations
The next step is to construct our measure of organizational concentration. We begin by
identifying provider organizations delivering outpatient care to each patient. We limit to
provider services billed in the Carrier claims file and provided in an outpatient setting.6 We
then define a visit by aggregating claims to a unique provider-date pair.
6For details on how we identify relevant claims, see Appendix A.1.
7

We use the federal tax ID numbers (TINs) associated with each Carrier file claim to
identify provider organizations. Our sample covers 447,009 TINs. TINs provide a measure
of financial organization, with integrated physician practices typically billing under a unique
TIN, although some large provider groups may organize themselves into subsidiaries, billing
under separate TINs (Baker et al. 2016). In these cases, TINs may still delineate organi-
zational boundaries within the firm, even though they are not a perfect measure of firm
boundaries.
We find that our baseline TIN-based measure of organizational concentration is highly
correlated with an alternative definition based on physicians’ reported organizational ties in
the CMS Physician Compare database. Physician Compare data is only available for the
final three years of our sample (2014-2016), so we cannot use it as our baseline analysis,
which tracks organizational concentration over a longer time period. In years where both
measures are available, we use the affiliations reported in Physician Compare to construct
an alternative measure of organizational ties, and compare this to our baseline TIN-based
definition. The organizational concentration measures are correlated at 0.95 when averaged
at the HRR level, and are correlated at 0.85 when averaged at the PCP level. For more
detail comparing these measures of organizational ties, see Appendix A.2.
Earlier work by Baker et al. (2014), Austin and Baker (2015) and Baker et al. (2020)
has also used TINs to measure local competition across physician provider groups. This
research has shown that areas with higher market concentration pay higher prices for physi-
cian services. While this prior work suggests that providers sharing the same TINs are able
to leverage oligopoly power in areas with high market concentration, our paper will test
whether TIN-based measures of business organization are predictive of clinical integration
that may yield offsetting benefits for patients and payers.
Aggregating organizational concentration to the PCP-level and HRR-level
Defining HRR-level concentration. We calculate organizational concentration at the
patient-year level following the definition in equation 1. To characterize the pattern of
organizational concentration at the hospital referral region (HRR) level, we simply average
the patient-level measures across all patients within the relevant region. To construct these
regional averages, we use the broad sample excluding individuals who move between HRRs
at any point.
Defining PCP-level concentration. Our primary empirical strategy exploits variation
in PCPs’ tendencies towards organizational concentration. To construct these PCP averages,
we use the broad sample excluding individuals who do not match to a PCP.
8

To account for statistical noise in PCP organizational concentration, we apply a conven-
tional empirical Bayes correction (Morris 1983). This correction shrinks the estimated PCP
concentration towards the doctor’s mean, in proportion to the amount of estimation error.7
Since we require that patients match to their exiting PCP for four years prior to the exit, we
use a four-year history to define the PCP’s organizational concentration style. The average
patient in our broad sample is seen by a PCP who has 144 other attributed patients over
the lookback period.
To investigate the degree of shrinkage, we calculate “pseudo shrinkage coefficients” for
organizational concentration, defined as each physician’s demeaned Bayesian posterior di-
vided by the demeaned raw (not shrunk) estimate. A coefficient of one implies no shrinkage.
The median coefficient is 0.97, with the 10th percentile at 0.83. This distribution suggests
relatively little shrinkage, consistent with the high correlation (0.98) between the raw and
shrunk measures.
For regression analyses at the HRR and PCP level, we exclusively rely on jackknifed
versions of these organizational concentration measures that omit the index patient to avoid
bias driven by an individual patient’s need for more specialized care.
Paralleling the procedure for organizational concentration, we calculate HRR and PCP
level measures of provider concentration to include in some regressions. This measure is
also jackknifed, and the PCP level provider concentration is shrunk with an empirical Bayes
procedure.
2.3 Outcome measures
Our primary outcome variable is a patient’s annual healthcare utilization, which aggregates
a patient’s spending across the Medicare Inpatient, Outpatient and Carrier claim files. Uti-
lization measures are constructed using a fixed set of annual Medicare prices expunged of
regional price adjusters.8
We also study the relationship between organizational concentration and several utilization-
based measures of healthcare quality. We study two measures related to the use of hospital
care: a binary indicator for any inpatient hospitalization, and a binary indicator for any
7To implement the empirical Bayes correction, we estimate a random effects model where patient-levelorganizational concentration depends on year fixed effects and PCP-year random effects. To achieve jack-knifing, we omit the index patient from this regression. We recover empirical Bayes estimates of PCP-yearorganizational concentration as the sum of the year fixed effect and the best linear unbiased predictor of thePCP-year random effect.
8Medicare prices include some regional adjustments on the basis of local wage indices, and we do notwant this source of regional variation in wage indices to confound the relationship between organizationalconcentration and spending. Following Finkelstein et al. (2016), we adjust total spending to strip awayvariation that is due to regional price adjustments.
9

emergency department (ED) visit. We also examine the effects of organizational concentra-
tion on the indicators of healthcare quality for patients with diabetes: receipt of an HbA1c
test and LDL test. These outcomes are only defined for the sub-sample of patients with
diabetes, as defined by the Chronic Condition Warehouse; tests are identified with HCPCS
codes. Finally, a potential cost of poorly coordinated care is low-value imaging and labora-
tory tests; we look at total utilization of these services. See Appendix A.1 for further details
on data construction.
3 Descriptive Evidence on Organizational Concentra-
tion
3.1 Summary statistics
Table 1 provides summary statistics for the Broad Sample (column 1), the Patient Mover
Sample (column 2), and the PCP Exit Sample (column 3). The average level of organiza-
tional concentration is about 0.45 in all three samples, demonstrating that most patients
regularly seek outpatient care across multiple organizations. The average level of provider
concentration is slightly lower, which we would expect, given that patients will often see
multiple providers within the same organization. In the Broad Sample and Patient Mover
Sample, average care utilization is about $9000 per year; utilization is lower in the PCP Exit
Sample, perhaps in part due to the disruptive impact of PCP exits. Patients in the Patient
Mover and PCP Exit samples are older on average than in the Broad Sample, likely because
they must be observed for a few years in sample prior to the move or exit event.
We use standard deviations of the patient-level, PCP level, and HRR level measures
of organizational concentration to interpret the scale of our regression results. Appendix
Table A1 further reports the mean and standard deviation of organizational concentration,
provider concentration, and total utilization at these different levels. The raw standard
deviation of organizational concentration across PCPs reported there (0.108) is slightly larger
than the standard deviation after Empirical Bayes shrinkage (0.096); the estimates are very
close, consistent with minimal shrinkage. To interpret the scale of our subsequent results, we
reference the 0.1 estimated standard deviation of organizational concentration across PCPs.
We examine how organizational concentration varies across regions in Figure 1. Large
variation between regions in healthcare usage suggests that some regions may be inefficient
(Skinner 2011), and prior research has sought to explain why this variation exists (e.g.
Cutler et al. 2019; Molitor 2018; Frakes 2013; Finkelstein et al. 2016). Our figure displays
residual variation in organizational concentration across regions, after accounting for the role
10

of provider concentration, age, sex, and race. As shown in the map, the West and Upper
Midwest have higher organizational concentration than would be predicted by their provider
concentration and demographics, while the South and Mid Atlantic have lower organizational
concentration.
Figure 2 shows binned scatter plots relating organizational concentration and total health-
care utilization. Panel A shows the relationship between these variables averaged at the
regional (HRR) level, while Panel B shows the relationship at the PCP-level. Panel A
illustrates that regions with higher organizational concentration have lower levels of care
utilization on average, while Panel B shows that patients of PCPs with higher organiza-
tional concentration have lower levels of healthcare utilization. The patterns shown in these
graphs motivate our analytic approach, as they suggest a link between organizational con-
centration and care utilization. An alternative version of these graphs shown in Appendix
Figure A1 demonstrates that the negative relationship between organizational concentration
and utilization persists after controlling for provider concentration.
3.2 Regional variation in organizational concentration and patient
moves
Previous work has examined patients who move between regions to identify the effect of
regional practice variation on spending (Finkelstein et al. 2016; Agha et al. 2019). Here, we
use the same mover design to examine how changes in regional organizational concentration
are associated with healthcare utilization of patients who move. When moving between
regions, patients are exposed to a change in the local pattern of organizational concentration.
Following prior work, we run regressions of the form:
Yit = λO∆OrgConcHRRi × postit + λP∆ProvConcHRR
i × postit +X ′itγ + εit (3)
where Yit is the outcome of interest, ∆OrgConcHRRi is the change in regional organizational
concentration experienced when patient i moves, and ∆ProvConcHRRi is the change in re-
gional provider concentration experienced when the patient moves. We include in Xit an
individual fixed effect, ξi; γt, a year fixed effect; and τ(i,t), a vector of event-time fixed effects
indicating the year relative to the patient move.
Figure 3 presents event study graphs. Panel A shows that when patients move to a
region with higher average organizational concentration, they experience an immediate and
persistent increase in their individual organizational concentration. Table 2 reports cor-
responding regression results, summarizing how changes in regional average organizational
concentration translate into individual patients’ experiences when they move. If all regional
11

variation were due to differences in the types of patients that lived in each region, then we
would expect zero pass-through, while if movers fully adopted the average patterns of care
in each region they lived, we would expect 100% pass-through. The regression in column 1
shows that about 80% of the regional difference in organizational concentration translates
into patient-level changes in organizational concentration. These results are consistent with
(Finkelstein et al. 2016), which found that place-based characteristics account for slightly
more than half of regional variation in spending.
Figure 3 Panel B shows that when patients move to a region with higher average or-
ganizational concentration, they experience a decline in healthcare utilization. The final
columns of Table 2 quantify this effect. Column 2 shows that moving to a region with 1
standard deviation (SD) greater regional organizational concentration (an increase of 0.05)
is associated with a 5.6% decline in total utilization. However, we know that changes in
regional organizational concentration are also correlated with changes in regional provider
concentration. Column 3 adds a control for the region’s provider concentration, and finds
that the relationship between organizational concentration and total utilization diminishes
only slightly: a 1 SD increase in regional organizational concentration is associated with
a 3.9% decline in total utilization. These results suggest that the spread of patient care
across distinct organizations is an important predictor of regional variation in health care
utilization.
4 Identification Strategy: PCP Exits
4.1 Motivation
In the previous section, we described how regional variation in organizational concentration
predicts spending outcomes. A challenge for interpreting these findings is that regional or-
ganizational concentration may also be correlated with other features of the local healthcare
environment. To address this concern, we study PCP exits. When a PCP exits a local
market, due to a retirement or long-distance move, that PCP’s patients must find new care
providers within their local market. This natural experiment allows us to study exogenous
variation in PCP practice style holding constant many features of the local healthcare envi-
ronment.
Organizational concentration may depend on a patient’s PCP as a result of the PCP’s
referral decisions. PCPs may deliberately choose to refer preferentially to other providers
within a multispecialty practice. In addition, PCPs themselves may be affiliated with a large
organization that is tied to many local specialists, increasing the organizational concentration
12

that would occur even without preferential referrals. We characterize each PCP’s practice
pattern with their average organizational concentration. We then test what happens to
patient-level organizational concentration and healthcare utilization when a PCP exit forces
the patient to switch to a new PCP with a different level of organizational concentration.
Our study of PCP exits thus analyzes how a change in the organizational concentration
of a patient’s assigned PCP affects the patient’s outcomes. Because we observe patients
who switch PCPs, we can include patient fixed effects in our regression model to control for
any fixed patient attributes that influence their healthcare utilization. However, patients
may endogenously sort to new PCPs on the basis of changes in their demand for care. For
instance, patients who have gotten sicker may deliberately seek out multispecialty practices
or well-known health systems when their original PCP exits. This type of sorting would
bias our estimation of how organizational concentration affects healthcare spending within a
difference-in-differences framework, since patient fixed effects would not adequately capture
changes over time. As a result, we focus our analysis on an instrumental variables strategy
adapted from Laird and Nielsen (2017) and Abaluck et al. (2021).
Our instrumental variables (IV) approach exploits the statistical property of mean rever-
sion to predict the change in the organizational concentration of a patient’s assigned PCP
after their original PCP exits. Patients whose initial PCP was highly concentrated will, on
average, experience a decrease in their PCP’s organizational concentration when they switch
providers. Patients whose initial PCP had low concentration will, on average, experience an
increase in their PCP’s organizational concentration.
Although the PCP exit strategy approach holds the regional practice environment fixed,
PCP practice style is still multidimensional. A PCP’s organizational concentration may be
correlated with other aspects of the PCP’s practice style. Prior research has documented
that concentrating patient care within a narrow set of providers (provider concentration) is
associated with lower levels of utilization (Agha et al. 2019; Hussey et al. 2014; Frandsen
et al. 2015). To establish that the impact of organizational concentration is distinct from
the well-studied phenomenon of provider concentration, our main regression specifications
include both measures. We instrument for the change in provider concentration using an
analogous approach to that used for organizational concentration: the provider concentration
practice style of the exiting PCP.
4.2 Estimating Equations
In this section, we lay out a formal instrumental variable econometric framework adapted
from Abaluck et al. (2021). We are ultimately interested in λO, the causal effect of the PCP’s
13

organizational concentration on patient utilization. Let OrgConcPCPit and ProvConcPCP
it be
the organizational and provider concentration of patient i’s PCP p in year t. These jackknifed
concentration measures will reflect a combination of the causal effect of the PCP’s practice
style on a patient’s concentration and the endogenous sorting of patients to PCPs.
We first specify the causal effect βpt of each patient’s PCP on their healthcare utilization
Yipt, and then consider how this causal effect is related to organizational concentration. Let
Dipt be a vector of dummy variables that report whether patient i is attributed to PCP p in
year t. The following regression estimates the causal effect βpt of the PCPs themselves:
Yipt =∑p
βptDipt +X ′iptγ + ξi + εipt (4)
where ξi is an individual fixed effect, and εipt is an idiosyncratic error term. We have
X ′ipt = θt + τ(i,t) , where θt are calendar year fixed effects, and τ(i,t) are event time fixed
effects. In some specifications, X ′ipt further controls for PCP characteristics such as gender,
experience, training, and the number of doctors and number of claims billed to the PCP’s
tax ID number (as a proxy for organization size).
Then, we can write the relationship between the PCP’s causal utilization effect and our
concentration measures as follows:
βpt = λOOrgConcPCPit + λPProvConc
PCPit + ηpt (5)
where λO tells us how much a PCP’s causal spending effect changes when PCP organizational
concentration is higher, holding constant other PCP characteristics, and ηpt contains resid-
ual unobserved variation in PCP spending effects that is unrelated to PCP concentration
measures or other observed PCP characteristics. When we substitute 5 into 4, we have:
Yipt = λOOrgConcPCPit + λPProvCon
PCPit +X ′
iptγ + ξi + ηpt + εipt (6)
Recall that ξi is a patient fixed effect (which we will estimate) and ηpt and εipt are unobserved
error terms.
The endogeneity concern with a simple differences-in-differences approach is that εipt
might be correlated with OrgConcPCPit (or ProvConcPCP
it ). For example, this correlation
could arise if negative health shocks lead patients to switch to doctors with lower organiza-
tional concentration or provider concentration. To circumvent this endogeneity, we (1) select
our sample to only include patients who are forced to switch providers because their original
PCP retires or moves, and (2) instrument for the change in a patient’s PCP’s organizational
concentration.
14

To account for this source of endogeneity, we instrument for PCP organization orga-
nizational concentration in equation 6 with the level of patient’s original PCP’s organiza-
tional concentration interacted with a post-exit indicator. Let the instrument be Z1it =
OrgConcPCPi,orig × postit. We also instrument for the change in the PCP’s provider concentra-
tion, Z2it = ProvConcPCPi,orig × postit. Let Zit = [Z1it Z2it].
Our first stage equation is then:
OrgConcPCPit = ΠZZ
′it + ΠXX
′ipt + πi + νipt (7)
where the coefficients on the instrument, ΠZ , show how post-exit OrgConcPCPit is related to
the patient’s original PCP’s concentration measures. We also estimate an additional parallel
first stage equation for ProvConcPCPit .
4.3 Identification assumptions
The conditions below are necessary for the IV strategy to be valid. We explore the evidence
supporting these assumptions in Section 5.1. To simplify notation, we define Z1it be the
residualized instrument Z1it after partialling out Xipt, patient fixed effects and Z2it; corre-
spondingly, Z2it is the residualized instrument after partialling out Xipt, patient fixed effects,
and Z1it. Let Zit = [Z1it Z2it].
1. First Stage Relevance: Cov(Z1it, OrgConcPCPit ) 6= 0 and Cov(Z2it, P rovConc
PCPit ) 6=
0. This is the assumption that the instruments predict the endogenous variables and
satisfy the standard rank condition. In our case, we find patients whose PCPs exit
switch to more typical PCPs; the first stage relationship is strong.
2. No Differential Shocks: Cov(Z1it, εipt) = 0 and Cov(Z2it, εipt) = 0. This condition
requires that patients whose original PCP had high organizational or provider concen-
tration do not have different shocks in healthcare demand after the exit than patients
whose original PCP had low concentration. In other words, unobserved patient-health
demand shocks cannot be correlated with the instrument. This is not directly testable,
but event-study graphs are illuminating here, as they test whether patient-health uti-
lization shocks in the years leading up to the exit are related to concentration levels of
the exiting PCP.
3. No Differential PCP Selection Cov(Z1it, ηipt) = 0 and Cov(Z2it, ηipt) = 0. The
residual spending effect ηipt of patient i’s PCP p cannot be correlated with the instru-
ment. In our context, this combines a familiar restriction— selection on observables
only—plus the fallback condition described in Abaluck et al. (2021).
15

The fallback condition is necessary to interpret λO as an estimate of the average re-
lationship between PCP organizational concentration and patient care utilization in
the population. This assumption requires that patients’ second-choice PCPs need to
have similar relationship between organizational concentration and utilization as their
first-choice PCPs and the choices of patients whose PCPs did not exit.9
Selection on observables only is then necessary to interpret λO as the causal effect
of PCP organizational concentration on spending: further factors (besides organiza-
tional concentration) that influence a PCP’s spending effect are uncorrelated with the
instrument after residualizing observable control variables. It is sufficient that these
characteristics be uncorrelated with PCP organizational concentration.
5 Results
Before discussing our IV results in detail, we begin by illustrating the variation that identifies
our main finding. In Figure A2, we show that patients experience sizeable changes in PCP
organizational and provider concentration after their initial PCP exits. The distribution of
these changes is approximately symmetrically distributed, with similar numbers of patients
experiencing increases and decreases in PCP concentration. 71% of patients in our sample
switch to PCPs in a different organization when their original PCP exits. Even within firms,
PCPs vary in their referral practices and their tendency to concentrate those referrals within
their organization. On average, patients who switch to a new PCP organization experi-
ence a 0.075 absolute-value change in PCP organizational concentration, whereas patients
who maintain the same PCP organization experience a 0.050 absolute-value change in PCP
organizational concentration. This evidence suggests that much of the variation in PCP
organizational concentration is at the PCP-level, and not solely a feature of firm structure.
Appendix Figure A3 builds intuition for our IV approach by showing a binned scatter
plot where the x-axis is the patient’s origin PCP organizational concentration and the y-
axis is the change in PCP organizational concentration after the exit. The graph shows the
expected regression-to-the-mean pattern: patients whose origin PCP had high organizational
concentration will, on average, experience a decline in organizational concentration after the
first PCP exits.
9Note that with Abaluck et al. (2021)’s fallback condition embedded in the no differential PCP selectionassumption, we do not require a monotonicity assumption. Abaluck et al. (2021) show that the fallbackand monotonicity assumptions are non-nested, and that the fallback condition can be microfounded fromstandard discrete choice models. In our context, the alternative monotonicity assumption would require, forinstance, that above-median organizational concentration PCPs receive a higher share of patients movingfrom above- versus below median-organizational concentration PCPs.
16

Refining this analysis, Figure 4 provides a graphical look at our main IV specification.
These binned scatterplots show the residualized value of the instrumental variable along the
x-axis and residualized outcomes on the y-axis, after conditioning on our baseline set of
control variables (patient fixed effects, year fixed effects, and event time fixed effects). Panel
A corresponds to our first stage regression, showing that larger values of the residualized IV
predict declines in PCP organizational concentration. Patients whose origin PCPs have high
organizational concentration will on average switch to a lower-concentration PCP after the
origin PCP exits, and conversely for patients with low-concentration origin PCPs. Panel B
corresponds to our reduced form regression, showing that larger values of the IV correspond
to increases in patient care utilization. Patients whose original PCPs have high organiza-
tional concentration tend to experience increases in health care utilization. The patterns
in Panels A and B are approximately symmetric across high and low concentration origin
PCPs, suggesting our results are driven by responses to both increases and decreases in PCP
concentration. Panel C corresponds to a fallback test of assumption 3; we discuss this result
in more detail below.
5.1 Tests of IV assumptions
We will now describe the evidence supporting each of the IV assumptions laid out in Sec-
tion 4.3.
First Stage Relevance: First stage relevance, as required by Assumption 1, is shown
in the bottom panel of Table 3, which shows first stage results from our three main spec-
ifications. Columns 5 and 6 have identical first stage equations, with PCP organizational
concentration as the only endogenous variable. In column 7, we add PCP provider concen-
tration as an additional endogenous variable, paralleling the setup in the previous section.
In column 8, we control for additional PCP characteristics, including PCP gender, specialty
training, and medical school graduation year. The first stage F-tests reported in Table 3
show that the instruments are strong in all specifications.
No Differential Shocks: Recall that Assumption 2 requires that patients whose origin
PCPs had different levels of concentration do not have different shocks to healthcare demand.
This assumption is not directly testable, but we can explore its plausibility by investigating
pre-trends in healthcare utilization. Specifically, we consider event study figures that allow
us to assess whether patients whose origin PCP had higher organizational concentration
experience different shocks to healthcare demand over the years leading up to the PCP
exit. Results are shown graphically in Figure 5. These graphs exploit the same variation
underlying our instrumental variables approach. The endogenous variables of interest are the
17

interaction of these relative event time fixed effects with the change in PCP organizational
concentration (in the year after minus the year before the exit). The instrumental variables
are the vector of interactions between relative event time fixed effects and the original PCP’s
organizational concentration.
Figure 5 illustrates that when a patient’s PCP exits the local market, the patient’s care
outcomes shift towards the practice style of their new PCP. In Panel A, we show that if
the new provider is predicted to have higher organizational concentration (so their patients
receive care at fewer distinct organizations), the patient’s experienced organizational con-
centration also increases. This establishes that PCP organizational concentration plays an
important role in shaping patient-level organizational concentration, even when the patient
remains in the same geographic location and maintaining the same insurance coverage. In
Panel B, we show that if the new provider is predicted to have greater organizational con-
centration, the patient’s total healthcare utilization declines.
In both panels of this graph, we note an absence of pre-trends prior to the move. This
demonstrates that patients whose original PCPs have different levels of organizational con-
centration are not on differential trends of care utilization prior to the original PCP’s exit.
This pattern supports the validity of our IV strategy. We also see that in the year of the
PCP exit and the year following, patients have the largest year-over-year changes on both ex-
perienced organizational concentration and utilization. The new PCP’s influence may grow
over time, as they gradually shape the set of referred providers that the patient consults. In
subsequent years 2 through 5, patients’ care evolves to conform more closely to the practice
style of their new PCP.
Appendix Figure A4 replicates this finding, but splits the sample according to the origin
PCP’s level of organizational concentration. Results are noisier in these subsamples, but
generally consistent with the pooled results. Patients who are likely to experience a decrease
in organizational concentration experience increases in care utilization (see Panel B); the
converse result is shown in Panel A.
No Differential PCP Selection: Next, we consider assumptions related to the sorting
of patients to PCPs. Assumption 3 requires that further factors besides organizational
and provider concentration that influence a PCP’s spending effect must be uncorrelated
with the instrument. In the next section, we will discuss the robustness of our findings to
adding controls for PCP characteristics and practice environment, including PCP gender,
experience, residency training, and characteristics of the PCP’s practice organization. Larger
firms may hire higher quality staff, have greater capital investment, or different managerial
quality; by controlling for the size of the PCP’s practice organization, we can separate
18

any general benefits of having a PCP who is employed by a large firm from the effects of
organizational concentration. Our results remain consistent as we enrich the set of PCP
characteristics included as control variables.
In addition, we explore the fallback test proposed by Abaluck et al. (2021). In the spirit
of a conventional balance test, we can investigate the fallback assumption using a proxy for
ηpt. In the broad sample, we regress patient spending on PCP characteristics (PCP gender,
experience, residency training, and characteristics of the PCP’s practice organization), and
calculate the fitted values. We then regress the fitted values (predicted PCP spending) on
observational PCP organizational concentration. The residual of this regression (called the
“forecast residual”) provides a proxy for ηpt, measuring residual variation in PCP utilization
that is predictable by PCP characteristics but orthogonal to organizational concentration.
In the PCP exit sample, we then use the forecast residual as an outcome variable in a
regression that parallels our reduced form specification, testing whether the forecast residual
is correlated with the instrumental variable. This will test whether second-choice PCPs have
“atypical residuals” ηpt, i.e. high spending effects given their organizational concentration.
Figure 4 Panel C shows no significant relationship between the forecast residual and the
instrumental variable, conditional on patient fixed effects, year fixed effects, and event time
fixed effects.
5.2 PCP organizational concentration and utilization
This section reports our main findings, applying the instrumental variables strategy to inves-
tigate how PCP organizational concentration affects healthcare utilization. After discussing
our baseline findings, we consider several alternative specifications, and then explore the
relationship between organizational concentration and care quality.
Our IV regressions in Table 3 show that the effects of organizational concentration on
utilization are large and robust to accounting for other dimensions of PCP practice style,
training, and practice setting. We instrument for PCP organizational concentration with
the original PCP’s level of organizational concentration times a post-PCP-exit indicator.
Corresponding reduced form regressions are reported in Appendix Table A2 Panel A. These
reduced form regressions show a positive relationship between the instrumental variable and
patient’s care utilization: patients whose original PCPs have higher organizational fragmen-
tation experience an increase in their care utilization after the original PCP exits.
The estimated first stage equation in Table 3 specification 5 is strong, and shows that
coming from an origin PCP with a 0.1 higher (one SD) organizational concentration predicts
the patient will experience a 0.035 relative decline in PCP organizational concentration after
19

the exit.10 The associated second stage with this specification in Column 1 finds that about
58% of the variation in PCP organizational concentration practice style translates into the
patient’s individually experienced organizational concentration.
Columns 2-4 contain our main IV results relating organizational concentration to care
utilization, while columns 6-8 contain the associated first stage equation.11 Column 2 shows
that a 0.1 increase in organizational concentration leads to a 19% decline in healthcare
utilization.12 Column 3 shows that this effect attenuates only slightly when provider concen-
tration is included as an additional endogenous variable. Though the standard error on the
estimate doubles, the relationship between organization concentration and care utilization
remains large and statistically significant at the 1% level. This result shows that the frictions
that arise when care crosses firm boundaries are distinct from previously studied concepts
of provider concentration.
The main hurdle to interpreting this relationship as the causal effect of organizational
concentration is that PCPs with more concentrated practice styles may differ along other di-
mensions besides their organizational concentration. By focusing on PCP exits experienced
by patients who are not themselves moving, we are able to hold constant many features of
the local healthcare environment. Nevertheless, PCPs’ training, organization size, and taste
for aggressive care may covary with the PCP’s tendency to concentrate care within an orga-
nization. To address this concern, we introduce controls for PCP gender, residency training,
and experience (based on medical school graduation year). Further, we control for the size
of the PCP’s practice organization, as measured by the log number of distinct providers
billing to the TIN, as well as the log number of claims billed to the TIN. By controlling for
the organization size, we can account for the possibility that physicians working in larger
practice groups have different quality, practice style, or access to capital inputs.
Reassuringly, we find no attenuation of the relationship between the PCP’s organizational
concentration and patient utilization once we account for PCP characteristics and practice
size. Our preferred, most controlled specification (Column 4) shows that a 0.1 increase in
PCP organizational concentration is predicted to reduce health care spending by 21%. The
robustness of our findings to these controls provides evidence that our results are driven
by differences in organizational concentration, and are not an artifact of different practice
10In order to interpret the first stage equation, recall that the equation contains an individual patient fixedeffect. A coefficient of –1 would indicate that the predicted decline in PCP’s organizational concentrationwould move one-for-one with the origin PCP’s organizational concentration, as would occur if patients sortedrandomly to PCPs.
11Note that columns 5 and 6 share a common first stage since they differ only in the choice of the dependentvariable, so column 6 simply repeats column 5.
12To calculate this effect size, we use the slope coefficient of −2.120 in the following expression: 1 −e−2.120∗.1 = 0.191.
20

settings, physician training, or experience.
5.3 Robustness and alternative specifications
Difference in differences results. These findings can be contrasted with the difference-
in-differences specifications reported in Appendix Table A2 Panel B. The difference-in-
differences specification continue to include patient fixed effects and timing fixed effects.
The key independent variable of interest is the change in PCP concentration (in the year
after minus the year before the exit) interacted with a dummy for the post-PCP-exit period.
Without the instrumental variable approach, we estimate a smaller effect of PCP organi-
zational concentration on care utilization, although effects remain negative and statistically
significant in all specifications. These results are likely attenuated due to confounding. Pa-
tients who find themselves in worsening health are more likely to seek out care at large, inte-
grated practices that include a wide array of specialists. PCPs affiliated with these practices
are likely to have higher organizational concentration, but the patients who endogeneously
select them may have increasing demand for health care services. This comparison highlights
the motivation behind the instrumental variables approach. Specifically, a patient’s choice
of new PCP after their original PCP exits is likely to be endogenous to changes in the pa-
tients’ demand for care. By isolating the variation in PCP organizational concentration that
is predictable due to mean reversion, the IV approach avoids relying on these endogenous
selection patterns to estimate the impact of organizational concentration.
Exploring the role of PCP provider concentration. Appendix Table A3 provides
more detail on our results, specifically reporting our instrumental variable results on how
PCPs’ provider concentration practice style affects care utilization. In column 2, we estimate
an alternative specification that only includes PCP provider concentration as an endogenous
variable, omitting organizational concentration from the model. As expected, patients whose
PCPs tend to concentrate their patients’ care within a smaller set of providers also have
lower spending. This finding corroborates the pattern found in the earlier literature on
provider fragmentation (Agha et al. 2019; Frandsen et al. 2015; Austin and Baker 2015),
and shows that the finding holds under a new identification strategy– our instrumental
variables approach. However, once we add PCP organizational concentration as an additional
endogenous variable in our IV framework, the estimated effect of provider concentration
attenuates, as seen in columns 3 and 4. In our most controlled specification, we cannot
reject a zero effect of provider concentration. These results suggest that some of the spending
previously attributed to the spread of care across providers may have actually reflected the
challenges of coordination across organizations. Accounting for the role of organizational
21
coordination diminishes the role of provider concentration.
Alternative controls for PCP organizational structure. One concern for interpreting
our findings is that PCPs with high organizational concentration might practice in large,
multispecialty firms, which may have better care or management quality for reasons unrelated
to organizational concentration. In our baseline specifications, we control for log number
of doctors in and log number of claims billed by the PCP’s organization, as proxies for
organization size. In Appendix Table A4, we alternatively control for indicator variables for
5 quintiles of the organization’s number of doctors and number of claims (in columns 2 and
3), as well as an indicator for whether the PCP practices in a multi-specialty firm (in column
3). Our effect size remains similar in magnitude after the addition of these controls.
Accounting for patient demand for specialized care. Appendix Table A5 establishes
that the relationship we uncover is also robust to alternative approaches to accounting for
the distribution of patient care across different providers. In column 2, we enrich our instru-
mental variable specification to include a quadratic function of PCP provider concentration
as an endogenous variable (in addition to the existing linear term). To accommodate the
additional endogenous variable, we also expand the set of instrumental variables to include
a quadratic of origin PCP provider concentration multiplied by a post-exit indicator. This
specification relaxes the functional form assumption modeling the relationship between PCP
provider concentration and care utilization. The estimated relationship between PCP or-
ganizational concentration and care utilization remains nearly unchanged, compared to our
baseline results.
In Appendix Table A5 column 3, we test an alternative approach to accounting for the
spread of patient care across providers. This specification controls for splines in the num-
ber of generalist providers the patient sees, as well as the number of specialist providers
the patient sees. The estimated effect of organizational concentration remains large and
statistically significant; the point estimate is actually larger than that reported in Table 3.
The larger coefficient suggests these results may in fact overstate the relationship between
organizational concentration and care utilization. Specifically, patients with high organiza-
tional concentration PCPs who consult many doctors may have less underlying demand for
care than patients who see more doctors with a low organizational concentration PCP. This
could occur, for example, if large practices with greater organizational concentration (be-
cause they cover a wider breadth of specialists) also tend to rotate patients across providers
more commonly.
22

5.4 Decomposing the effects on utilization and care quality
We have documented that switching to a PCP with higher organizational concentration
increases care utilization. In this section, we consider what forms of utilization are most
responsive to this change and explore how they relate to quality of care.
Utilization-based quality of care measures. While the quality of ambulatory care is
multidimensional and difficult to quantify empirically, we present evidence on a variety of
measures related to the provision of high-value care (recommended monitoring of patients
with diabetes), use of intensive care settings (inpatient or emergency department), and
utilization of testing and imaging, which may signal deficiencies in outpatient care. Results
are reported in Table 4. Regressions in this table use the most controlled specification from
Table 3, including PCP provider concentration as an endogenous variable and controlling
for the full set of PCP characteristics and PCP organization size.
An important pathway by which organizational concentration could reduce total spending
is by reducing the use of inpatient care. Recall that we define organizational concentration
solely using outpatient provider interactions. As a result, there is no direct, mechanical
relationship between organizational concentration and the PCP’s propensity to recommend
hospitalization, since care delivered in the hospital setting will not contribute to the concen-
tration measure. We do not find statistically significant effects of changes in organizational
concentration on hospital-related outcomes, though standard errors are large: a one SD in-
crease (0.1) in organizational concentration predicts a 0.85 percentage point decline in the
probability of having any inpatient visit (95% CI: -3.6 to +1.9 percentage points).13
Heavy use of emergency departments (EDs) is sometimes interpreted as a sign of a weak
primary care relationship, since patients may substitute ED care for services that could
otherwise be provided more cheaply and efficiently in an office setting. Our estimates suggest
that patients switching to high organizational concentration PCPs are less likely to visit the
emergency department, although the effect is only statistically significant at the 10% level.
Next, we investigate process of care measures for patients with diabetes. We rely on two
quality of care measures, adapted from the HEDIS guidelines: receiving a regular HbA1c test
and LDL test. Switching to a physician with 0.1 higher organizational concentration leads to
a 11 percentage point increase in HbA1c testing and a 11 percentage point increase in LDL
tests; these relationships are statistically significant at the 1% level. Patients with diabetes
are more likely to receive guideline-concordant care when their PCP has greater organiza-
tional concentration. Recall that this specification does not simply reflect the benefits of
13Appendix Table A8 shows that a one SD increase in organizational concentration leads to an estimated$587 reduction in inpatient spending, (95%CI: -$1360 to $187).
23
being treated in a large practice group (which might proxy for investment in clinical decision
support or other electronic reminder system), because we control for the size of the PCP’s
practice organization. Rather, this finding suggests that keeping the patient’s primary and
specialty care integrated may lead to fewer gaps in care for chronically ill patients.
Finally, we turn to testing and imaging. Using claims from the Carrier and Outpatient
files, we identify utilization of testing or imaging services in an outpatient setting. (For more
details on construction of this measure see Appendix A.1.) Switching to a PCP with 0.1
higher organizational concentration reduces the likelihood of having any outpatient testing
and imaging spending by 3 percentage points, and reduces total utilization in this category
by 12% among patients with non-zero imaging or testing claims.
In Appendix Table A6, we investigate changes in repeated imaging, which we define as
imaging of the same body part with the same imaging modality repeated within 30 days.
This measure is limited because it captures only images billed through the Carrier claims;
some repeated images might be performed in the Outpatient hospital setting, but due to
the different coding conventions across these claims, we do not include them in our measure
of repeated imaging. The coefficient on repeated imaging is very imprecisely estimated
relative to the mean and not significantly different from zero. These findings suggest that
while reduced imaging may contribute to the utilization reductions, these reductions are not
primarily driven by changes to repeated imaging tests.
Preventive care services Appendix Table A7 further investigates the relationship be-
tween organizational concentration and measures of preventive care provision, using measures
of preventive care adapted from Curto et al. (2019). Three of these services are recommended
for certain elderly patients by the US Preventive Services Task Force (USPSTF).14 Two of
the recommended services (mammograms, prostate cancer screening) have no significant
relationship with PCP organizational concentration. One recommended service (colorectal
cancer screening) is performed less frequently when the patient’s PCP has higher organiza-
tional concentration; the implications of this finding for care quality are ambiguous, since
colorectal cancer screening is not recommended at an annual frequency for all patients. We
find no significant changes in pap smears or pelvic exams, two categories of care that the
USPSTF does not recommend for patients over 65. We also find no relationship between
PCP organizational concentration and flu vaccination or cardiovascular screenings, neither
of which are covered by a USPSTF guideline.
14For more details on the construction of these outcomes and the relevant USPSTF guidelines, see Ap-pendix A.1.
24
Decomposing changes in care utilization. To provide a more complete picture of the
sources of utilization changes, Appendix Table A8 disaggregates our findings on the basis of
the location and type of care delivered. We have defined categories of care utilization that
cut across the three files from which we draw Medicare claims, aggregating institutional and
provider billings where appropriate. The purpose of this decomposition is to construct five
disjoint categories that together sum up to our total utilization amount: (1) care delivered in
an inpatient setting, (2) care delivered in a doctor’s office or outpatient hospital setting, (3)
outpatient laboratory tests and diagnostic imaging, (4) care delivered in an emergency de-
partment, (5) other provider-submitted bills (including home health, dialysis, rehabilitation
centers, etc.). For more details on this decomposition, see Appendix A.1.
Point estimates in column 1 suggest that higher PCP organizational concentration leads
to lower utilization across all five types of care, although only the effects on emergency
department utilization and outpatient testing and imaging are statistically significant at
the 5% level. Along the extensive margin, switching to a more concentrated PCP reduces
the probability that a patient will have any outpatient testing or imaging. There is also a
small effect on the propensity to have any outpatient office visits. Along the intensive margin,
switching to a more concentrated PCP significantly reduces log utilization (among those with
positive utilization in that category) for every type of care except inpatient hospitalizations.
Taken together, these findings suggest that the relationship between PCP organizational
concentration and total utilization is driven in part by use of outpatient services, testing,
imaging, and emergency department utilization. Point estimates suggest that reduced spend-
ing on inpatient care may also be an important part of the total effect, but inpatient uti-
lization results are not precisely estimated. These patterns suggest that when outpatient
providers are integrated within a firm, patients tend to receive fewer costly services, with no
offsetting increase in inpatient hospitalizations.
6 Conclusion
Coordination challenges arise when clinical care is split across firm boundaries. Firms may
both facilitate informal relationships among care providers, as well as make firm-specific
investments in coordination technology. In the healthcare setting, coordination technology
could include messaging systems, investments in health information technology, and estab-
lished norms for passing off patient information across providers.
Studying patients who move regions, we document that regions with higher levels of
organizational concentration also have lower levels of care utilization. This pattern suggests
a role for organizational concentration in explaining regional variation in healthcare spending.
25

Our main analysis studies patients who stay in the same area after their PCP exits
the local market due to a retirement or move. Patients who switch to a PCP with higher
organizational concentration experience reductions in care utilization, relative to patients
who switch to a PCP with lower organizational concentration. These relationships persist
after conditioning on detailed measures of how many generalist and specialist providers the
patient sees, and how concentrated the patient’s care is across those providers. This evidence
indicates that the organizational ties between a patient’s healthcare providers have an impact
on their total healthcare utilization.
Our estimated effect (approximately a 20% decrease in utilization from a 1 SD increase
in PCP organizational concentration) is large relative to other healthcare interventions. By
way of comparison, Agha et al. (2019) find that moving to a region with 1 SD higher provider
fragmentation increases care utilization by 10%. Clemens and Gottlieb (2014) estimate that a
2 percent increase in payment rates leads to a 3 percent increase in healthcare utilization. The
introduction of a major policy initiative, Accountable Care Organizations and the Medicare
Shared Savings Program, led to comparatively small reductions (less than 5%) in spending
(McWilliams et al. 2018).
Although switching to a PCP with greater organizational concentration is associated
with lower total utilization of physician services, we see no evidence that higher organi-
zational concentration reduces quality of care. In fact, PCPs with greater organizational
concentration perform better on these measures of effective care for patients with diabetes.
Taken together, these findings point to a potential mechanism by which higher organiza-
tional concentration lowers utilization. When providers share an organizational affiliation,
they are likely to have lower barriers to information sharing and greater trust. These bene-
fits may reduce gaps in care—e.g. resulting in better monitoring of diabetes patients—and
improve hand-offs between providers. In turn, these improvements may allow providers to
avoid unnecessary referrals, ensure that referred patients have already completed the requi-
site workup, and centralize follow-up care with the patient’s PCP. Each of these effects may
reduce low-value visits that generate repeated contact with specialists.
It is also worth considering alternative explanations of these findings. Large organizations
may hire higher-quality physicians. Alternatively, it may be more difficult to get a timely
appointment in a large, multi-specialty practice. If this were the case, we would expect
that our result would attenuate when we account for the size of the PCP’s organizational
affiliation or an indicator for whether the PCP is part of a multispecialty practice, but our
empirical estimates show no such attenuation. Even though PCPs with higher organizational
concentration have lower use of outpatient services, testing, and imaging, we see no evidence
of offsetting increases in inpatient or emergency department care.
26

While our results suggest potential savings associated with care delivered at integrated
multispecialty practices, any gains from reduced utilization would need to be weighed against
the higher prices likely paid by private insurance providers to larger practices that have
more bargaining power. The Medicare claims we study are paid at administratively set
prices, so an investigation of countervailing price effects is beyond the scope of this paper.
Another consideration is that private insurance plans may use alternative approaches to care
management (e.g. high deductibles or preauthorization requirements) that might limit the
utilization of low organizational concentration PCPs, attenuating the relationship described
here.
Our findings illuminate the role that firm boundaries play in organizing economic activ-
ity. These results raise the question of whether mergers that create multispecialty physician
practices generate savings from reduced utilization. If these gains occur, they may take
time to develop as providers adapt to changing communication systems and adopt new re-
ferral patterns. Future research examining the detailed mechanisms of how these boundaries
affect teamwork and care coordination may be able to show how some of the benefits of
organizational concentration could be replicated without financial integration– for exam-
ple, through better integration of health information technology systems, or by co-locating
distinct provider groups.
References
Abaluck, J., M. M. C. Bravo, P. Hull, and A. Starc (2021). Mortality effects and choice across
private health insurance plans. Quarterly Journal of Economics 136 (3), 1557–1610.
Agha, L., K. M. Ericson, K. H. Geissler, and J. B. Rebitzer (Forthcoming). Team relation-
ships and performance: Evidence from healthcare referral networks. Management Science.
Agha, L., B. Frandsen, and J. B. Rebitzer (2019). Fragmented division of labor and health-
care costs: Evidence from moves across regions. Journal of Public Economics 169, 144–159.
Alonso, R., W. Dessein, and N. Matouschek (2008, March). When does coordination require
centralization? American Economic Review 98 (1), 145–179.
Arrow, K. J. (1975). Vertical integration and communication. The Bell Journal of Eco-
nomics 6 (1), 173–183.
Atalay, E., A. Hortacsu, and C. Syverson (2014). Vertical integration and input flows.
American Economic Review 104 (4), 1120–48.
27
Austin, D. R. and L. C. Baker (2015). Less physician practice competition is associated with
higher prices paid for common procedures. Health Affairs 34 (10), 1753–1760.
Baker, L. C., M. K. Bundorf, and D. P. Kessler (2020). Does multispecialty practice enhance
physician market power? American Journal of Health Economics 6 (3), 324–347.
Baker, L. C., M. K. Bundorf, and A. Royalty (2016, October). Measuring physician practice
competition using Medicare data. In A. Aizcorbe, C. Baker, E. R. Berndt, and D. M.
Cutler (Eds.), Measuring and Modeling Health Care Costs, pp. 351–377. University of
Chicago Press.
Baker, L. C., M. K. Bundorf, A. B. Royalty, and Z. Levin (2014). Physician practice com-
petition and prices paid by private insurers for office visits. JAMA 312 (16), 1653–1662.
Beaulieu, N. D., L. S. Dafny, B. E. Landon, J. B. Dalton, I. Kuye, and J. M. McWilliams
(2020). Changes in quality of care after hospital mergers and acquisitions. New England
Journal of Medicine 382 (1), 51–59.
Capps, C., D. Dranove, and C. Ody (2018). The effect of hospital acquisitions of physician
practices on prices and spending. Journal of Health Economics 59, 139–152.
Cebul, R. D., J. B. Rebitzer, L. J. Taylor, and M. E. Votruba (2008). Organizational
fragmentation and care quality in the US healthcare system. Journal of Economic Per-
spectives 22 (4), 93–113.
Chan, David C, J., M. Gentzkow, and C. Yu (2019, November). Selection with variation
in diagnostic skill: Evidence from radiologists. Working Paper 26467, National Bureau of
Economic Research.
Chen, Y. (Forthcoming). Team-specific human capital and team performance: Evidence
from doctors. American Economic Review .
Clemens, J. and J. D. Gottlieb (2014). Do physicians’ financial incentives affect medical
treatment and patient health? American Economic Review 104 (4), 1320–49.
Coase, R. (1937). The theory of the firm. Economica 4 (16), 386–405.
Currie, J. and W. B. MacLeod (2017). Diagnosing expertise: Human capital, decision
making, and performance among physicians. Journal of labor economics 35 (1), 1–43.
Currie, J., W. B. MacLeod, and J. Van Parys (2016). Provider practice style and patient
health outcomes: the case of heart attacks. Journal of Health Economics 47, 64–80.
28

Curto, V., L. Einav, A. Finkelstein, J. Levin, and J. Bhattacharya (2019). Health care
spending and utilization in public and private medicare. American Economic Journal:
Applied Economics 11 (2), 302–32.
Cutler, D., J. S. Skinner, A. D. Stern, and D. Wennberg (2019). Physician beliefs and patient
preferences: A new look at regional variation in health care spending. American Economic
Journal: Economic Policy 11 (1), 192–221.
Cutler, D. M. and F. Scott Morton (2013). Hospitals, market share, and consolidation.
JAMA 310 (18), 1964–1970.
Dessein, W. (2014). Incomplete contracts and firm boundaries: New directions. Journal of
Law, Economics, & Organization 30, i13–i36.
Enthoven, A. C. (2009). Integrated delivery systems: The cure for fragmentation. American
Journal of Managed Care 15 (12), S284.
Fadlon, I. and J. Van Parys (2020). Primary care physician practice styles and patient care:
Evidence from physician exits in medicare. Journal of Health Economics 71, 102304.
Finkelstein, A., M. Gentzkow, and H. Williams (2016). Sources of Geographic Variation
in Health Care: Evidence From Patient Migration. The Quarterly Journal of Eco-
nomics 131 (4), 1681–1726.
Forbes, S. J. and M. Lederman (2010). Does vertical integration affect firm performance?
Evidence from the airline industry. The RAND Journal of Economics 41 (4), 765–790.
DOI: 10.1111/j.1756-2171.2010.00120.x.
Forman, C. and A. Gron (2011). Vertical integration and information technology investment
in the insurance industry. Journal of Law, Economics, & Organization 27 (1), 180–218.
Frakes, M. (2013). The impact of medical liability standards on regional variations in physi-
cian behavior: Evidence from the adoption of national-standard rules. American Economic
Review 103 (1), 257–76.
Frandsen, B., M. Powell, and J. B. Rebitzer (2019). Sticking points: common-agency
problems and contracting in the US healthcare system. The RAND Journal of Eco-
nomics 50 (2), 251–285.
Frandsen, B. R., K. E. Joynt, J. B. Rebitzer, and A. K. Jha (2015). Care fragmentation,
quality, and costs among chronically ill patients. Am J Manag Care 21 (5), 355–362.
29

Friebel, G. and M. Raith (2010, May). Resource allocation and organizational form. Amer-
ican Economic Journal: Microeconomics 2 (2), 1–33.
Geissler, K. H., B. Lubin, and K. M. M. Ericson (2020). The role of organizational affiliations
in physician patient-sharing relationships. Medical Care Research and Review 77 (2), 165–
175.
Gowrisankaran, G., K. A. Joiner, and P.-T. Leger (2017, December). Physician practice
style and healthcare costs: Evidence from emergency departments. Working Paper 24155,
National Bureau of Economic Research.
Hart, O. and B. Holmstrom (2010, May). A theory of firm scope. The Quarterly Journal of
Economics 125 (2), 483–513.
Hart, O. and J. Moore (1990, December). Property rights and the nature of the firm. Journal
of Political Economy 98 (6), 1119–1158.
Huckman, R. S. and G. P. Pisano (2006). The firm specificity of individual performance:
Evidence from cardiac surgery. Management Science 52 (4), 473–488.
Hussey, P. S., E. C. Schneider, R. S. Rudin, D. S. Fox, J. Lai, and C. E. Pollack (2014).
Continuity and the costs of care for chronic disease. JAMA internal medicine 174 (5),
742–748.
Kim, S.-H., H. Song, and M. Valentine (2020). Staffing temporary teams: Understanding
the effects of team familiarity and partner variety. Working paper.
Koch, T. G., B. W. Wendling, and N. E. Wilson (2017). How vertical integration affects
the quantity and cost of care for medicare beneficiaries. Journal of Health Economics 52,
19–32.
Koch, T. G., B. W. Wendling, and N. E. Wilson (2018). The effects of physician and
hospital integration on medicare beneficiaries’ health outcomes. Review of Economics and
Statistics , 1–38.
Kwok, J. H. (2019). How do primary care physicians influence healthcare? Evidence
on practice styles and switching costs from Medicare. Working Paper . https://www.
jenniferkwok.com/s/JenniferKwok_PrimaryCarePhysicians_JMP.pdf.
Lafontaine, F. and M. Slade (2007, September). Vertical integration and firm boundaries:
The evidence. Journal of Economic Literature 45 (3), 629–685.
30

Laird, J. and T. Nielsen (2017). Physician prescribing behaviors on prescription drug use
and labor supply: Evidence from movers in Denmark. Working paper.
McWilliams, J. M., L. A. Hatfield, B. E. Landon, P. Hamed, and M. E. Chernew (2018).
Medicare spending after 3 years of the medicare shared savings program. New England
Journal of Medicine 379 (12), 1139–1149. PMID: 30183495.
Molitor, D. (2018). The evolution of physician practice styles: evidence from cardiologist
migration. American Economic Journal: Economic Policy 10 (1), 326–56.
Morris, C. N. (1983). Parametric empirical Bayes inference: theory and applications. Journal
of the American Statistical Association 78 (381), 47–55.
Mullainathan, S. and D. Scharfstein (2001, May). Do firm boundaries matter? American
Economic Review 91 (2), 195–199.
Nyweide, D. J., D. L. Anthony, J. P. Bynum, R. L. Strawderman, W. B. Weeks, L. P.
Casalino, and E. S. Fisher (2013). Continuity of care and the risk of preventable hospital-
ization in older adults. JAMA Internal Medicine 173 (20), 1879–1885.
Nyweide, D. J. and J. P. Bynum (2017). Relationship between continuity of ambulatory care
and risk of emergency department episodes among older adults. Annals of Emergency
Medicine 69 (4), 407–415.
Oster, E. (2019). Unobservable selection and coefficient stability: Theory and evidence.
Journal of Business & Economic Statistics 37 (2), 187–204.
Pierce, L. (2012, February). Organizational Structure and the Limits of Knowledge Sharing:
Incentive Conflict and Agency in Car Leasing. Management Science 58 (6), 1106–1121.
Pollack, C. E., P. S. Hussey, R. S. Rudin, D. S. Fox, J. Lai, and E. C. Schneider (2016).
Measuring care continuity: A comparison of claims-based methods. Medical care 54 (5),
e30.
Sahni, N. R., M. Dalton, D. M. Cutler, J. D. Birkmeyer, and A. Chandra (2016). Surgeon
specialization and operative mortality in united states: Retrospective analysis. BMJ 354,
i3571.
Seru, A. (2014, February). Firm boundaries matter: Evidence from conglomerates and R&D
activity. Journal of Financial Economics 111 (2), 381–405.
31
Skinner, J. (2011, January). Causes and Consequences of Regional Variations in Health Care.
In M. V. Pauly, T. G. Mcguire, and P. P. Barros (Eds.), Handbook of Health Economics,
Volume 2 of Handbook of Health Economics, pp. 45–93. Elsevier.
Stroebel, J. (2016). Asymmetric information about collateral values. The Journal of Fi-
nance 71 (3), 1071–1112. DOI:10.1111/jofi.12288.
Welch, W. P., A. E. Cuellar, S. C. Stearns, and A. B. Bindman (2013). Proportion of
physicians in large group practices continued to grow in 2009–11. Health Affairs 32 (9),
1659–1666.
Whaley, C. M., X. Zhao, M. Richards, and C. L. Damberg (2021). Higher medicare spend-
ing on imaging and lab services after primary care physician group vertical integration:
Study examines higher medicare spending on imaging and lab services after primary care
physician group vertical integration. Health Affairs 40 (5), 702–709.
Williamson, O. (1985). The Economic Institutions of Capitalism: Firms, Markets, Relational
Contracting. Free Press.
32
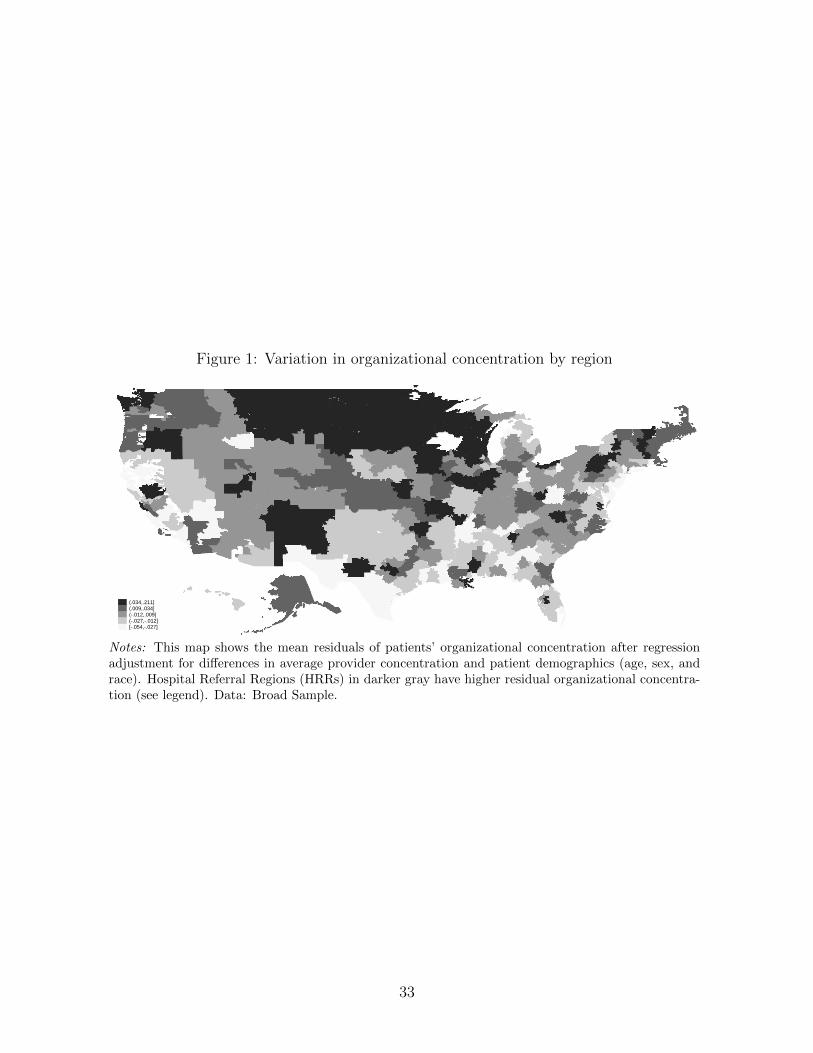
Figure 1: Variation in organizational concentration by region
(.034,.211](.009,.034](-.012,.009](-.027,-.012][-.054,-.027]
Notes: This map shows the mean residuals of patients’ organizational concentration after regressionadjustment for differences in average provider concentration and patient demographics (age, sex, andrace). Hospital Referral Regions (HRRs) in darker gray have higher residual organizational concentra-tion (see legend). Data: Broad Sample.
33

Figure 2: Relationship between organizational concentration and healthcare utilization
(A) HRR level
7.9
88.
18.
28.
3Lo
g to
tal u
tiliz
atio
n
.35 .4 .45 .5 .55Organizational care concentration
(B) PCP level
7.6
7.8
88.
28.
4Lo
g to
tal u
tiliz
atio
n
.3 .4 .5 .6 .7Organizational care concentration
Notes: Binned scatterplots. Panel (A) shows the relationship between HRR organizational concentrationand care utilization across regions. Patients are attributed to HRRs by their reported zipcode. Panel (B)shows the relationship between PCP organizational care concentration and patient utilization in the PCPExit Sample. Patients are attributed to PCPs using the plurality assignment rule described in Section 2.
34

Figure 3: Event study figures for patients who move between regions
(A) Response of patients’ organizational concentration to changes in regionalorganizational concentration
-.5
0.5
1P
atie
nt o
rgan
izat
iona
l car
e co
ncen
trat
ion
(coe
ffici
ent)
-5 -4 -3 -2 -1 0 1 2 3 4 5Year relative to move
(B) Response of patients’ total utilization to changes in regional organiza-tional concentration
-2-1
.5-1
-.5
0.5
Pat
ient
log
utili
zatio
n (c
oeffi
cien
t)
-5 -4 -3 -2 -1 0 1 2 3 4 5Year relative to move
Notes: The two subplots show the estimates and 95% confidence intervals from two separate regressions.The dependent variable in Panel A is patients’ organizational concentration, and in Panel B is log utilization.The figure plots the coefficients on the change in regional organizational concentration interacted with yearrelative to move. Both regressions control for calendar year fixed effects, and patient fixed effects. Standarderrors are clustered at HRR and patient levels.
35

Figure 4: Binned scatterplots illustrating the PCP exit IV strategy
(A) First stage
slope: -0.349 (0.005)
-.1-.0
50
.05
.1PC
P O
rgan
izatio
nal C
once
ntra
tion
-.1 -.05 0 .05 .1Instrumental Variable
(B) Reduced Form
slope: 0.739 (0.053)
-.1-.0
50
.05
.1Lo
g of
hea
lthca
re u
tiliza
tion
-.1 -.05 0 .05 .1Instrumental Variable
(C) Fallback
slope: 0.008 (0.014)
-.1-.0
50
.05
.1Pr
edict
ed F
orec
ast R
esid
ual
-.1 -.05 0 .05 .1Instrumental Variable
Notes: All panels residualize both dependent and independent variables to control for calendar year fixedeffects, event time fixed effects, and patient fixed effects. Panel A illustrates the first stage: patients whoseoriginal PCP has higher organizational concentration on average experience a decrease in their PCP’s orga-nizational concentration after the original PCP exits. Panel B illustrates the reduced form: patients whoseoriginal PCP had higher organizational concentration on average experience an increase in total utilization.Panel C illustrates the fallback condition: original PCP concentration is uncorrelated with the forecastresidual. Sample size: 304,954.
36

Figure 5: Event study figures for patients whose PCP exits
(A) Response of patients’ organizational concentration to changes in PCPorganizational concentration
0.2
.4.6
.8P
atie
nt o
rgan
izat
iona
l car
e co
ncen
trat
ion
(coe
ffici
ent)
-4 -3 -2 -1 0 1 2 3 4Year relative to exit
(B) Response of patients’ total utilization to changes in PCP organizationalconcentration
-2-1
.5-1
-.5
0.5
Pat
ient
log
utili
zatio
n (c
oeffi
cien
t)
-4 -3 -2 -1 0 1 2 3 4Year relative to exit
Notes: The two panels show the estimates and 95% confidence intervals from two separate regressions. Thedependent variable in Panel A is patients’ organizational concentration, and in Panel B is log utilization.The endogenous variables are the interaction of these relative event time fixed effects with the change in PCPorganizational concentration (in the year after minus the year before the exit). The instrumental variablesare the vector of interactions between relative event time fixed effects and the origin PCP’s organizationalconcentration. Both regressions control for calendar year fixed effects, event time fixed effects, and patientfixed effects. Because the partially treated event year 0 (year of PCP exit) is included in these specificationsbut excluded elsewhere, these regressions have 350,782 observations, slightly more than in Table 3. Standarderrors are clustered at PCP and patient levels.
37

Table 1: Summary statistics of different samples
(1) (2) (3)
Broad Sample Patient Mover Sample PCP Exit Sample
Organizational concentration 0.45 0.44 0.46
(0.27) (0.26) (0.25)
Provider concentration 0.38 0.36 0.38
(0.27) (0.25) (0.24)
Total utilization ($) 8696 8972 7517
(17,649) (16,239) (14,144)
Age 75.94 78.48 78.17
(7.53) (7.46) (6.96)
Sex: Female 0.58 0.66 0.62
Race: White 0.87 0.90 0.87
Has Diabetes 0.28 0.27 0.36
Has Hypertension 0.61 0.65 0.76
Has Heart disease 0.32 0.34 0.33
N patient-year obs 48,604,598 214,064 304,954
N patients 9,177,819 25,814 51,570
N assigned PCPs 72,231
Notes: This table reports means and then standard deviations in parentheses. Column 1 describes theBroad Sample. Column 2 describes the sample underlying our mover analysis; this sample restricts topatients who move across regions. Column 3 describes the sample underlying our analysis of PCP exits;this sample restricts to patients whose PCP exits the local market. The number of assigned PCPs incolumn 3 includes exiting PCPs as well as the PCPs patients switched to.
38
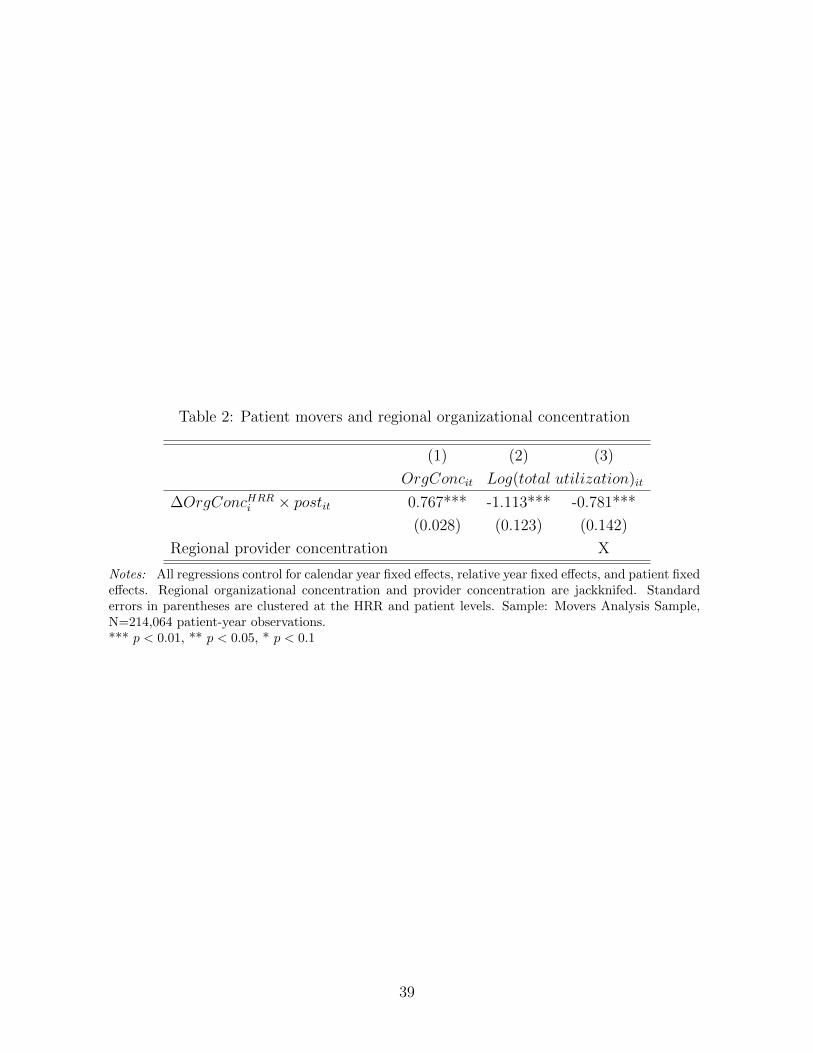
Table 2: Patient movers and regional organizational concentration
(1) (2) (3)
OrgConcit Log(total utilization)it
∆OrgConcHRRi × postit 0.767*** -1.113*** -0.781***
(0.028) (0.123) (0.142)
Regional provider concentration X
Notes: All regressions control for calendar year fixed effects, relative year fixed effects, and patient fixedeffects. Regional organizational concentration and provider concentration are jackknifed. Standarderrors in parentheses are clustered at the HRR and patient levels. Sample: Movers Analysis Sample,N=214,064 patient-year observations.*** p < 0.01, ** p < 0.05, * p < 0.1
39

Table 3: The effect of organizational concentration on utilization, identified from PCP exits
Second stage (1) (2) (3) (4)
OrgConcit Log(total utilization)it
OrgConcPCPit 0.583*** -2.120*** -1.625*** -2.385***
(0.027) (0.152) (0.287) (0.440)
First stage (5) (6) (7) (8)
OrgConcPCPit
OrgConcPCPi,orig × postit -0.349*** -0.349*** -0.249*** -0.203***
(0.005) (0.005) (0.007) (0.007)
F-statistic 33, 199 33, 199 8951 4648
PCP provider concentration X X
PCP characteristics, org. size X
Notes: Each column represents an instrumental variables regression. The instrument is the exitingPCP’s organizational concentration (jackknifed) multiplied by a post-exit indicator. Specification1’s outcome variable is the individual patient’s realized organizational concentration. Specifications2-4’s outcome variable is the patient’s log total utilization. All regressions control for calendar yearfixed effects, relative year fixed effects, and patient fixed effects. Specifications (3) and (4) includePCP provider concentration as an additional endogenous variable, instrumented by the originalPCP’s provider concentration multiplied by a post indicator. Specification (4) controls for PCPcharacteristics: gender, experience quartile indicators, residency training indicators (internal medicinevs. family practice), and the PCP’s organization size (log total number of claims billed to the PCP’sTIN, and the log number of unique providers billing to the PCP’s TIN). Standard errors in parenthesesare clustered at the PCP and patient levels. Cragg-Donald Wald F-test reported for first-stage. ThePCP Exit Sample has 304,954 patient-year observations.*** p < 0.01, ** p < 0.05, * p < 0.1
40

Table 4: Organizational concentration and quality-related utilization
(1) (2)
Mean of Coefficient on
dependent variable OrgConcit
Dependent variable:
A. Hospital outcomes
Any inpatient visit 0.145 -0.085
(0.137)
Any emergency department visit 0.252 -0.273*
(0.151)
B. Diabetes care outcomes
Any HbA1C test 0.631 1.078***
(0.264)
Any LDL test 0.590 1.111***
(0.276)
C. Imaging and testing outcomes
Any outpatient testing or imaging 0.951 -0.313***
(0.072)
Log of outpatient testing & imaging utilization (if > 0) 6.092 -1.236**
(0.533)
Notes: Each row corresponds to a regression. The specifications match that reported in column (4)of Table 3, but with different outcome variables. All regressions control for changes in PCP providerconcentration, PCP characteristics, PCP organization size, as well as calendar year fixed effects, relativeyear fixed effects, patient fixed effects. Both changes in PCP organizational concentration and changesin PCP provider concentration are instrumented for using the exiting PCP’s practice style. Standarderrors are clustered at the PCP and patient levels. Panel A uses the full PCP Exit Sample (304,954patient-year observations). Panel B uses the subset of the PCP Exit Sample of patients identified withdiabetes as chronic condition (106,614 patient-year observations). The first specification in Panel Cuses the full PCP Exit Sample (304,954 observations), and the final specification has sample size of289,979 (only observations with positive utilization of testing and imaging). *** p < 0.01, ** p < 0.05,* p < 0.1
41

The Impact of Organizational Boundaries on Healthcare
Coordination and Utilization
Leila Agha, Keith Marzilli Ericson, Xiaoxi Zhao
September 3, 2021
A Online Appendix
A.1 Sample construction
Attributing patients to PCPs We attribute each patient to their plurality PCP in a
given year based on the patient’s Evaluation & Management (E&M) visit in that year. When
the number of E&M visits is tied, we first use the total number of visits; if there is still a
tie, we then select randomly.
To index PCP, we adopted the taxonomy classification from Geissler et al. (2020). That
classification maps physicians’ taxonomy to five groups—primary care, medical specialist,
surgical specialist, excluded specialist, non-physician. In this study, we index physicians in
the first two groups as PCP.
Identifying PCP exits Our main analysis analyzes two types of PCP exit—relocation
and retirement.
To identify PCP relocation events, we first assign each PCP a plurality HRR based on
the total number of outpatient visits in a year. About 90% of PCPs only practice in one
HRR each year. We then index PCPs whose plurality HRRs changed as relocating PCPs.
To identify PCP retirements, we looked at the national claims sample. If the last year
in which the PCP bills any claims is before the end of our study period—2016, the PCP is
identified as retired.
Defining concentration measures Both organizational concentration and provider con-
centration measures are initially constructed using all outpatient Carrier visits. To identify
care delivered in an outpatient setting, we restrict to Carrier claims with place of service
listed in Appendix Table A9. About 85% of visits measured in the Carrier claim file are
classified as outpatient care by this definition.
1
Defining multispecialty organization By combining claims with the physician specialty
taxonomy from Geissler et al. (2020), we develop a definition of a multispecialty organization.
For an organization in a year, if at least 10% of claims are with PCPs and at least 10% are
with non-PCPs, then the organization is indexed as a multispecialty organization.
Utilization decomposition Results reported in Appendix Table A8 decompose total
utilization into several components of interest. To investigate the effect of organizational
care concentration on different types of utilization, we separate the total utilization into
inpatient, outpatient office visits, emergency department, testing and imaging, and other
types of outpatient.
• Inpatient utilization: This outcome combines all claims from the Inpatient file, along
with Carrier file claims that indicate inpatient hospital place of service (place of service
code is “23 Inpatient Hospital”).
• Outpatient visits: This outcome combines claims from the Carrier and Outpatient
files. Carrier file claims are included here if they do not meet the criteria below for
imaging/testing or emergency department care and the care was provided in an office
or an hospital outpatient department (places of service code equal to “11 Office” or
“22 Outpatient Hospital”).
• Testing and imaging: This outcome is from the Carrier and Outpatient files. They are
constructed using the Berenson-Eggers Type of Service (BETOS) codes and revenue
center codes. More specifically, for Carrier claims, an imaging or lab test is a claim with
BETOS code starting with “I” or “T” and place of service is outpatient. For claims
in the Outpatient files, they are included if the revenue center codes are in Appendix
Table A10.
• Emergency department: This outcome is based on the Carrier and Outpatient files. For
Carrier claims, they are included if the place of service is Emergency room at hospital
or the procedures codes indicate emergency department (HCPCS codes 99281-99285).
Outpatient claims are included if the revenue center indicates emergency room or
professional fee related to emergency room. (i.e. revenue center codes 0450-0459 or
0981)
Preventive care measurement The preventive service outcomes reported in Appendix
Table A7 were constructed using HCPCS codes and ICD codes, following the procedure
defined by Curto et al. (2019). Some of the preventive services we study are recommended by
2

the US Preventive Services Task Force (USPTF), with age- and/or gender-specific guidelines.
For any guideline with evidence level “C” or better, we limit the sample to the USPTF
recommended population.15
More specifically
• Mammogram: recommended by USPTF for women age 50–74.
We limit to women ages 65–74.
• Pap smear: not recommended by USPTF for women over 65.
We limit to women (any age).
• Pelvic exam: not recommended by USPTF for women over 65.
We limit to women (any age).
• Prostate cancer screening: recommended by USPTF for men age 55–69.
We limit to men age 65–69.
• Flu vaccine: no USPTF guideline governs flu vaccination, but indicated annually for
all ages and genders.
No sample restrictions.
• Colorectal cancer screening: recommended by USPTF for age 45–84.
We limit to 65–84.
• Cardiovascular screening: no USPTF guideline exists governing cardiovascular screen-
ing of this type (including blood cholesterol level tests.)
No sample restrictions.
A.2 Organization Identifiers
We use Tax Identifcation Numbers (TINs) to identify organizations in our main analysis, but
TINs are not a perfect measure of organizational boundaries. Large health systems could
use more than one TIN for payments. Using data from 2016, we compare TIN affiliations
with another organization identifier—–the Group Practice ID (PAC ID) assigned by PECOS
and reported in the Physician Compare file.
For most organizations, we could map the two IDs one-to-one. Among physicians affil-
iated with one organization, 94.5% of PAC IDs have only one TIN. For the impact of the
ID definition on our organizational concentration measure, Appendix Figure A5 shows the
15USPTF guidelines are available here: https://www.uspreventiveservicestaskforce.org/uspstf/
topic_search_results?topic_status=P. Accessed Aug. 12, 2021.
3
percentiles of organizational concentration using the two different identifiers. The dots lay
very close to the 45-degree line (the green line), showing that there is a very high correlation
between the percentile of TIN and PAC IDs.
We were particularly concerned about the possibility of ID-induced measurement error
for large physician networks. Physician networks often have multiple TINs, although they
contract as a single organization. Based on network comparisons from Geissler et al. (2020),
we investigated three large contracting networks in Massachusetts that have the greatest
tendency to keep referrals within the network, suggesting a functional organizational identity
with practical effects on care patterns. For these three networks, Atrius Health, Fallon
Clinic (Reliant Medical Group), and Southcoast Physicians Network, we found 1141, 479,
and 433 individual health care providers, respectively. Further, although all three networks
have multiple TINs, 98%–99% of claims for affiliated physicians were billed to one TIN for
each network. This provides reassuring evidence that TINs provide a useful measure of
organizational boundaries that aligns closely with alternative definitions.
4

A.3 Appendix Tables and Figures
5

Figure A1: Relationship between Organizational Concentration and Healthcare Utilization(residualized by provider concentration).
(A) HRR level
-.15
-.1
-.05
0.0
5.1
Res
idua
lized
log
tota
l util
izat
ion
-.05 0 .05 .1 .15Residualized organizational care concentration
(B) PCP level
-.15
-.1
-.05
0.0
5R
esid
ualiz
ed lo
g to
tal u
tiliz
atio
n
-.1 0 .1 .2 .3Residualized organizational care concentration
Notes: These binned scatterplots show the relationship between residualized organizational concentrationand residualized total healthcare utilization. Panel (A) shows the relationship between these measuresaveraged at the Hospital Referral Region level. Panel (B) shows the relationship between these measures av-eraged at the PCP level: an observation is a PCP, and displays the average log utilization and organizationalconcentration of their attributed patients.
6

Figure A2: Histograms of change in PCP concentration before and after PCP exit
(A) Distribution of change in PCP Organizational Concentration
02
46
Den
sity
-.5 0 .5Change in PCP Organizational Concentration
(B) Distribution of change in PCP Provider Concentration
02
46
Den
sity
-.5 0 .5Change in PCP Provider Concentration
Notes: The two subplots show histograms illustrating the distribution of changes in PCP concentrationmeasures after vs. before PCP exit. These numbers are calculated as the concentration measure of thepatient’s plurality PCP in the period +1 after their PCP exits minus the concentration measure of theirexiting PCP in period -1.
7

Figure A3: Simple binscatter illustrating the identifying variation
-.1
-.05
0.0
5.1
Cha
nge
in P
CP
Org
aniz
atio
nal C
once
ntra
tion
.3 .4 .5 .6 .7Origin PCP Organzational Concentration
Notes: The figure illustrates the variation underlying the first stage of our IV regressions. It shows thatpatients whose original PCP has higher organizational concentration on average experience a decreasein their PCP’s organizational concentration after the original PCP exits. Panel B illustrates the reducedform, showing that patients whose original PCP had higher organizational concentration on averageexperience an increase in total utilization after the original PCP exits.
8
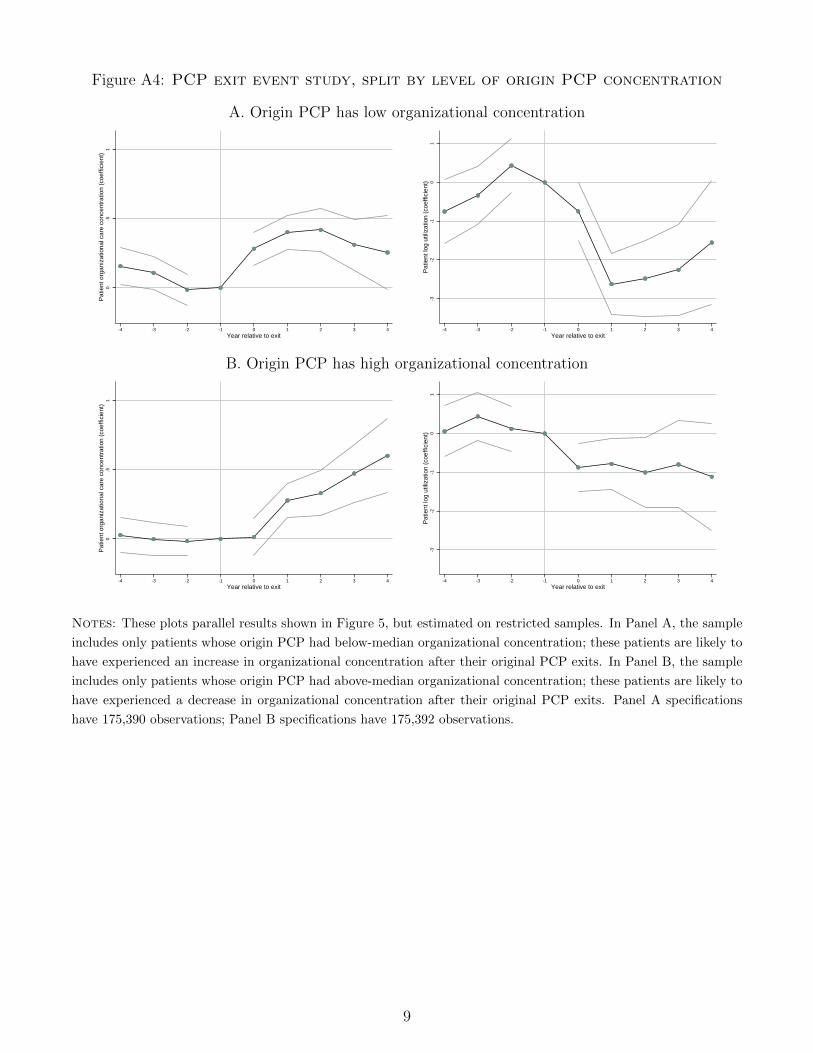
Figure A4: PCP exit event study, split by level of origin PCP concentration
A. Origin PCP has low organizational concentration0
.51
Pat
ient
org
aniz
atio
nal c
are
conc
entr
atio
n (c
oeffi
cien
t)
-4 -3 -2 -1 0 1 2 3 4Year relative to exit
-3-2
-10
1P
atie
nt lo
g ut
iliza
tion
(coe
ffici
ent)
-4 -3 -2 -1 0 1 2 3 4Year relative to exit
B. Origin PCP has high organizational concentration
0.5
1P
atie
nt o
rgan
izat
iona
l car
e co
ncen
trat
ion
(coe
ffici
ent)
-4 -3 -2 -1 0 1 2 3 4Year relative to exit
-3-2
-10
1P
atie
nt lo
g ut
iliza
tion
(coe
ffici
ent)
-4 -3 -2 -1 0 1 2 3 4Year relative to exit
Notes: These plots parallel results shown in Figure 5, but estimated on restricted samples. In Panel A, the sample
includes only patients whose origin PCP had below-median organizational concentration; these patients are likely to
have experienced an increase in organizational concentration after their original PCP exits. In Panel B, the sample
includes only patients whose origin PCP had above-median organizational concentration; these patients are likely to
have experienced a decrease in organizational concentration after their original PCP exits. Panel A specifications
have 175,390 observations; Panel B specifications have 175,392 observations.
9

Figure A5: Q-Q plot of organizational concentration
0.2
.4.6
.81
PA
C ID
as
orga
niza
tion
ID
0 .2 .4 .6 .8 1TIN as organization ID
Unit of observation = patient-year
Notes: This figure compares the percentiles of organizational concentration measure using PAC ID as orga-nization ID to the percentiles using TIN as organization ID. The line is the 45-degree line. Each dot is apercentile.
10

Table A1: Standard deviation of concentration measures
Std. Dev.
A. Patient level
Organizational concentration 0.244
Provider concentration 0.248
B. PCP level
Organizational concentration (after E.B. shrinkage) 0.096
Organizational concentration (raw) 0.108
Provider concentration (after E.B. shrinkage) 0.083
Provider concentration (raw) 0.095
C. Hospital referral regional level
Organizational concentration 0.047
Provider concentration 0.028
Notes: This table summarizes the variation in provider concentration and organization concentration at dif-ferent levels of aggregation. Panel A reports the standard deviation of patient-level concentration measures(N=9,177,819). Panel B reports the standard deviation of PCP-level concentration measures before and afterEmpirical Bayes shrinkage (based on 2012 concentration levels for 615,148 PCPs). Panel C reports the standarddeviation of region-level concentration measures. In all three panels, there is one observation per patient, sohigh volume PCPs (in Panel B) and regions (in Panel C) have greater weight in this calculation.
11

Table A2: Additional specifications of PCP exit analysis
A. Reduced form results
(1) (2) (3) (4)
OrgConcit Log(total utilization)it
OrgConcPCPi,orig × postit -0.204*** 0.733*** 0.412*** 0.459***
(0.010) (0.053) (0.065) (0.066)
B. Difference in differences results
(5) (6) (7) (8)
OrgConcit Log(total utilization)it
∆OrgConcPCP (i) × postit 0.402*** -1.023*** -0.228*** -0.307**
(0.010) (0.058) (0.083) (0.087)
PCP provider concentration X X
PCP characteristics & org. size X
Notes: In Panel A, this table shows the results of the reduced form regressions underlying the instrumentalvariable results reported in Table 3. In Panel B, this table estimates a difference in differences equation withoutusing the instrumental variable strategy to predict variation in the change in organizational concentrationafter a PCP exit. For the difference in differences specification, the key independent variable of interest isthe change in the patient’s PCPs’ organizational concentration one year after the exit minus one year beforethe exit. All specifications (in both panels) control for calendar year fixed effects, event time fixed effects,and patient fixed effects. In specifications 1 and 5, the outcome variable is the individual patient’s realizedorganizational concentration and in specifications 2-4 and 6-8 the outcome variable is the patient’s log oftotal utilization. Specifications 3 and 4 include a second instrumental variable: original PCP’s providerconcentration multiplied by a post indicator. Specifications 7 and 8 also control for the change in PCPprovider concentration. Specifications 4 and 8 controls for PCP characteristics: gender, experience quintileindicators, training indicators (internal medicine vs. family practice), and the PCP’s organization size (logtotal number of claims billed to the PCP’s TIN, and the log number of unique providers billing to the PCP’sTIN). Standard errors have two-way clustering at PCP and patient levels.*** p < 0.01, ** p < 0.05, * p < 0.1
12
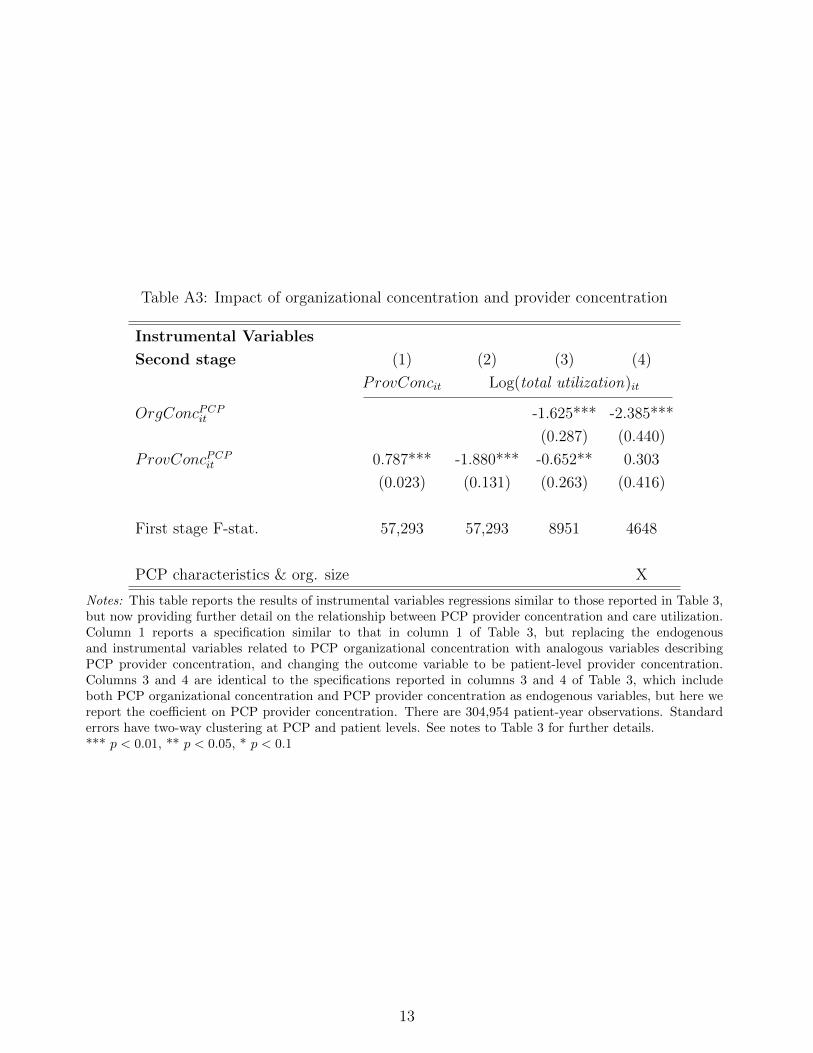
Table A3: Impact of organizational concentration and provider concentration
Instrumental Variables
Second stage (1) (2) (3) (4)
ProvConcit Log(total utilization)it
OrgConcPCPit -1.625*** -2.385***
(0.287) (0.440)
ProvConcPCPit 0.787*** -1.880*** -0.652** 0.303
(0.023) (0.131) (0.263) (0.416)
First stage F-stat. 57,293 57,293 8951 4648
PCP characteristics & org. size X
Notes: This table reports the results of instrumental variables regressions similar to those reported in Table 3,but now providing further detail on the relationship between PCP provider concentration and care utilization.Column 1 reports a specification similar to that in column 1 of Table 3, but replacing the endogenousand instrumental variables related to PCP organizational concentration with analogous variables describingPCP provider concentration, and changing the outcome variable to be patient-level provider concentration.Columns 3 and 4 are identical to the specifications reported in columns 3 and 4 of Table 3, which includeboth PCP organizational concentration and PCP provider concentration as endogenous variables, but here wereport the coefficient on PCP provider concentration. There are 304,954 patient-year observations. Standarderrors have two-way clustering at PCP and patient levels. See notes to Table 3 for further details.*** p < 0.01, ** p < 0.05, * p < 0.1
13

Table A4: Instrumental variable analysis of PCP exits, additional controls
Instrumental Variables
Second stage (1) (2) (3)
Log(total utilization)it
OrgConcPCPit -2.385*** -2.255*** -2.215***
(0.440) (0.418) (0.427)
First stage F-stat. 4648 5073 4882
PCP provider conc. X X X
PCP characteristics X X X
PCP org. size (log) X
PCP org. size (5 bins) X X
PCP multi-specialty practice X
Notes: See notes to Table 3. For reference, specification (1) replicates the results reported in (4) of Table 3.Column 2 substitutes the control for number of physicians and number of claims in the organization with5 quintile indicator variables for each measure of organization size. Column 3 adds a control variable formulti-specialty practice.*** p < 0.01, ** p < 0.05, * p < 0.1
14

Table A5: Instrumental variable analysis of PCP exits, alternative functional forms for providerconcentration
Instrumental Variables
Second stage (1) (2) (3)
Log(total utilization)it
OrgConcPCPit -2.385*** -2.366*** -2.929***
(0.440) (0.439) (0.363)
First stage F-stat. 4648 3151 4606
PCP provider concentration X X X
PCP characteristics X X X
PCP organizational size X X X
PCP provider concentration quadratic X
Spline N generalists seen by patient X
Spline N specialists seen by patient X
Notes: See notes to Table 3. For reference, specification (1) replicates the results reported in (4) of Table 3. Inspecification (2), we add a quadratic term in PCP provider concentration as an additional endogenous variable.To identify the model, we add an additional quadratic instrumental variable as well: (OrgConcPCP
i,orig)2postit.In specification (3), the regression adds new control variables that account for the number of distinct providerseach patient sees. Specifically, these specifications control for a 4-knot spline in the number of generalistproviders (as defined in Table A1: family practice, internal medicine training, or geriatrics training) anda 4-knot spline in the number of specialist providers (with any other training type). Standard errors havetwo-way clustering at PCP and patient levels.*** p < 0.01, ** p < 0.05, * p < 0.1
15

Table A6: Organizational concentration and repeated imaging
(1) (2)
Mean of Coefficient on
dependent variable OrgConcit
Dependent variable:
Total imaging scans 1.448 -1.504
(0.987)
Total repeated imaging 0.280 -0.226
(0.517)
Notes: Each row corresponds to a regression. The specifications match that reported in column (4) of Table 3,but with alternative dependent variables. Sample size is 304,954.
*** p < 0.01, ** p < 0.05, * p < 0.1
16
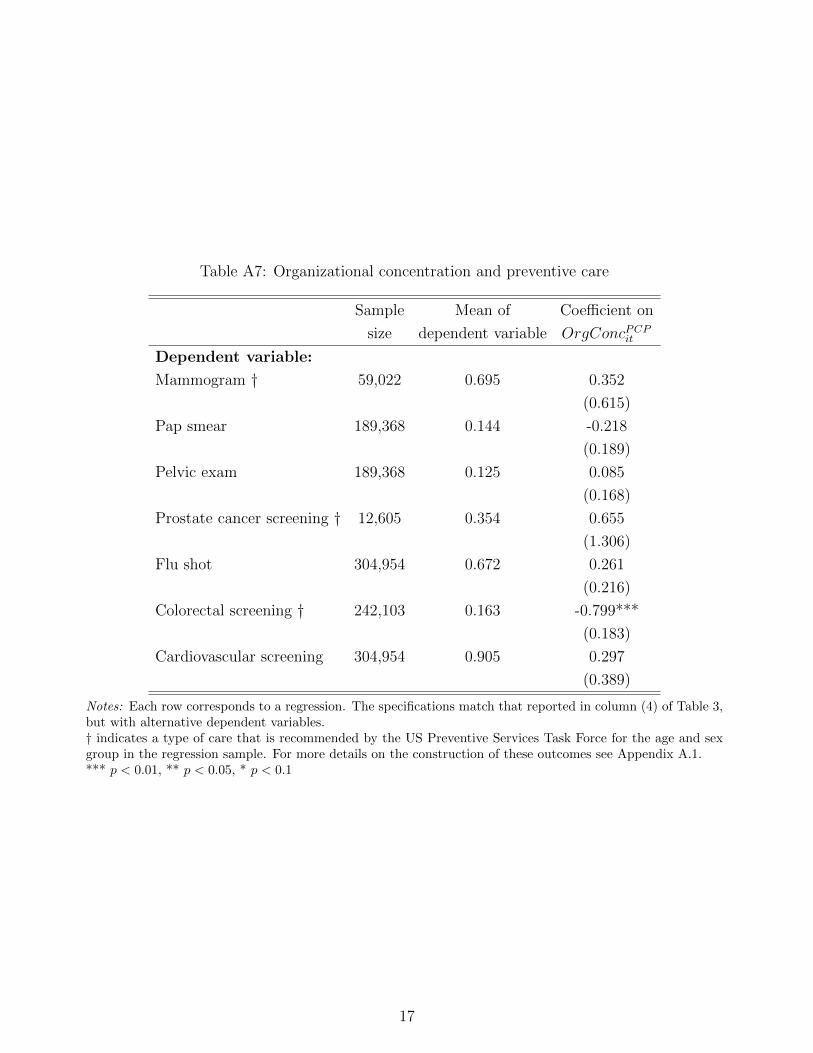
Table A7: Organizational concentration and preventive care
Sample Mean of Coefficient on
size dependent variable OrgConcPCPit
Dependent variable:
Mammogram † 59,022 0.695 0.352
(0.615)
Pap smear 189,368 0.144 -0.218
(0.189)
Pelvic exam 189,368 0.125 0.085
(0.168)
Prostate cancer screening † 12,605 0.354 0.655
(1.306)
Flu shot 304,954 0.672 0.261
(0.216)
Colorectal screening † 242,103 0.163 -0.799***
(0.183)
Cardiovascular screening 304,954 0.905 0.297
(0.389)
Notes: Each row corresponds to a regression. The specifications match that reported in column (4) of Table 3,but with alternative dependent variables.† indicates a type of care that is recommended by the US Preventive Services Task Force for the age and sexgroup in the regression sample. For more details on the construction of these outcomes see Appendix A.1.*** p < 0.01, ** p < 0.05, * p < 0.1
17

Table A8: Instrumental variable analysis of PCP exits, spending decomposition
Dependent variable:
(1) (2) (3) (4)
Mean utilization Sample with > 0 Utilization Any utilization Log(Utilization) Log(1+Utilization)
(in $) spending (for col. 3) (in $) (indicator) (if > 0)
Spending category:
Total utilization 7517 304,953 -14,088*** -2.385*** -2.387***
(5399) (0.440) (0.440)
Inpatient (hosp. & prof.) 3008 44,245 -5867 -0.085 0.097 -1.107
(3870) (0.137) (1.448) (1.248)
Outpatient visits (hosp. & prof.) 2346 304,854 -438 -0.010** -1.707*** -1.767***
(1924) (0.004) (0.357) (0.358)
Outpatient testing & imaging (hosp. & prof.) 1351 289,979 -4202** -0.313*** -1.236** -2.675***
(1759) (0.072) (0.533) (0.635)
Emergency department 357 76,854 -1009** -0.273* -1.787*** -2.365**
(407) (0.151) (0.641) (1.006)
Other (incl. home health, urgent care, etc.) 454 226,637 -516 -1.581*** -2.825*** -9.579***
(381) (0.174) (0.623) (1.067)
Notes: See notes to Table 3. This table replicates the instrumental variable specification reported in Table 3specification (4) with alternative outcome variables that decompose Medicare billing depending on the typeof bill. For details on how we define each category of spending, see Appendix A.1. The full sample size is304,954; column 3 sample size varies by row and is reported in the table.*** p < 0.01, ** p < 0.05, * p < 0.1
18

Table A9: List of place of service codes included as outpatient care
Place of Service Code Place of Service Name
05 Indian Health Service Free-standing Facility
07 Tribal 638 Free-standing Facility
11 Office
17 Walk-in Retail Health Clinic
20 Urgent Care Facility
22 On Campus-Outpatient Hospital
49 Independent Clinic
50 Federally Qualified Health Center
53 Community Mental Health Center
57 Non-residential Substance Abuse Treatment Facility
58 Non-residential Opioid Treatment Facility
62 Comprehensive Outpatient Rehabilitation Facility
65 End-Stage Renal Disease Treatment Facility
71 Public Health Clinic
72 Rural Health Clinic
Notes: These codes are used to identify claims in the Medicare Carrier File for services that take place in anoutpatient facility.
19

Table A10: List of revenue center codes included as testing and imaging codes
Revenue Center Code Short description
0300-0319 Laboratory
0320-0329 Radiology diagnostic
0400-0409 Other imaging services
0482 Cardiology-stress test
0483 Cardiology-Echocardiology
0610-0619 Magnetic resonance technology
0730-0749 EKG/ECG
0971 Professional fees-laboratory
0972 Professional fees-radiology diagnostic
Notes: These revenue center codes are used to identify outpatient testing and imaging claims.
20