Embed Size (px)
Citation preview

THE IMPACT OF INDONESIA’S
INFRASTRUCTURE DELIVERY
Developed by :
www.tuskadvisory.com

iii
THE IMPACT OF INDONESIA’S INFRASTRUCTURE DELIVERY
The Impact of Indonesia's Infrastructure Delivery Developed by Tusk Advisory Authors: Ir. Raj Kannan Raj is the founder and managing director of Tusk Advisory. A chartered engineer and graduate of the University of Oxford, he has been involved in major infrastructure transactions, led fiscal, institutional and regulatory policy reforms, and managed infrastructure project delivery for over 28 years, 13 of which were in Indonesia.
Dr. Nicholas Morris Nicholas is a director of Tusk Advisory. He’s been involved in economic policy development for most of his 40-year career, and has worked in Indonesia for over 17 years. Nicholas graduated from Oxford, and was the founder of London Economics and the CEO of an economics think tank in Australia. He is also an adjunct professor at the University of New South Wales, Australia.
Aditya Luhut Sibarani Luhut is a project manager of Tusk Advisory and has been involved in key infrastructure projects in Indonesia, including MRT Jakarta project, LRT and BRT Medan and the Trans Sumatera Toll Road. He has also led a number of research projects for the company. Luhut is a graduate of the Bandung Institute of Technology.
Astrid Handari Astrid is an engagement manager of Tusk Advisory. She has been involved in projects such as Trans Sumatera Toll Road, Jakarta Sewerage System and drinking water supply system (SPAM) in various cities across Indonesia. Astrid holds a Masters in Strategic Marketing and Consulting from University of Birmingham, United Kingdom.

Foreword
v
THE IMPACT OF INDONESIA’S INFRASTRUCTURE DELIVERY
Foreword Many countries and political leaders announce ambitious infrastructure programmes as part of an election platform or manifesto but very few actually follow through. As a strategic advisory firm focussed exclusively in the infrastructure space, we are often called on by governments to help develop watershed economic and infrastructure programmes that are aimed at increasing their economic growth; but only in rare cases do we see the display of the required political courage to implement such programmes. A number of years ago, Tusk Advisory was engaged to undertake a two-year study to analyse and benchmark eight different sectors within infrastructure in Indonesia. We submitted this as a background study for the development of the Indonesian government’s medium-term development plan called RPJMN 2015 – 2019. This work involved a team of our international and local infrastructure experts, and we subsequently worked with many of the Government’s key ministries and agencies to produce an infrastructure plan that focussed on generating economic growth and increasing competitiveness of the country. In late 2014, the then incoming administration of President Joko Widodo adopted components of the RPJMN 2015-2019 as its development manifesto with specific focus on nine nation-building goals called NAWA CITA. These addressed the implementation of infrastructure projects, increasing maritime connectivity, reducing logistics costs and improving social equity. Such lofty goals by incoming administrations are very common and thus like most consultants, we were sceptical. As a result, after 3-years of massive infrastructure delivery effort led by the Government, we thought it was timely that we mobilise a special team to estimate its impact on the economy, and on inequality and poverty, resulting from the myriad projects under construction and completed. On behalf of Tusk Advisory, I am proud to present this seminal body of work, which provides empirical evidence that the current under construction and completed projects, that are estimated to cost over $100 billion, will in fact move Indonesia to 7% GDP growth by the year 2023, on the key assumption that the projects that are under construction are in fact completed and operational by their respective due dates. Ir. Raj Kannan Managing Director

Acknowledgements
vii
THE IMPACT OF INDONESIA’S INFRASTRUCTURE DELIVERY
Acknowledgements This report was developed by a team of consultants from Tusk Advisory (Tusk), which included Ir. Raj Kannan, Dr. Nicholas Morris, Aditya Luhut Sibarani and Astrid Handari. Background research was provided by Nanda Erian, Akbar Wicaksana, Diane Anggraeni, Indra Gautama, Aryo Adilantip and Pantas Lawrentsius. Laksmi Satria provided graphic design and production support. Tusk would like to thank the Coordinating Minister for Economic Affairs, Dr. Darmin Nasution, and his senior officers for their valuable time and input. Tusk is particularly grateful to Dr. Wahyu Utomo, the Deputy Minister for Infrastructure and Regional Planning, Dr. Ir. Bastary Pandji Indra, the Secretary of the KPPIP Implementation Team, Ir. Rainier Haryanto, the Program Director of KPPIP, and project directors of KPPIP, namely Joseph Tobing, Dr. Henry Toruan, Ir. Triharyo (Hengky) Susilo and Dr. Max Antameng. Tusk is also grateful for the input received from the Coordinating Minister for Maritime Affairs, General (Rtd) Luhut Binsar Pandjaitan and his senior team including the Deputy Minister for Infrastructure, Ir. Ridwan Djamaluddin. Tusk would like to also thank the Minister for Planning and the Head of Bappenas, Dr. Bambang Brodjonegoro and his officers and experts, including Ir. Wismana Adi Suryabrata, Dr. Ir. Rachmat Mandiana, Drs. Sri Bagus Guritno, Dra. Rahma Iryanti, Ekoputro Adijayanto and Prasetyo Singgih for their comments and input. Additionally, Tusk would like to thank Dr. Luky Alfirman, the Director General of Budget Financing and Risk Management at the Ministry of Finance and his team. Tusk also appreciates the valuable inputs and comments it received during a series of one-on-one interviews and focus group discussions with various subject matter experts and academics, and from CEOs and senior officers of State-Owned Enterprises, as well as local and international private sector corporations consulted during the development of the report. In particular, Tusk would like to express its gratitude to Prof. Dr. Mohamad Ikhsan, from the University of Indonesia; Dr. Danang Parikesit from Gadjah Mada University; Leo Putera Rinaldy, Chief Economist of Mandiri Sekuritas; and Destry Damayanti from the Indonesian Deposit Insurance Agency. Finally, the authors would like to thank the directors of Tusk, namely Shuhaela Zen, Adelina Halim, Radju Munusamy and Amanda Djojonegoro for their expert advice and insights. Thank you also to all Tuskans involved in organising and resourcing the various group discussions, interviews, printing and launch of this report. In particular, special thanks to Metri Annisa, Clarina Andreny, Mariza Arif, Kevin Samsi, Rusydi Fauzan Achdiputra, Dewi Mulyasari and Fidya Marita.


Photo Credit: Rajbir Ahluwalia

This page is intentionally left blank

Table of Contents
xi THE IMPACT OF INDONESIA’S INFRASTRUCTURE DELIVERY
Table of Contents Foreword ....................................................................................................................... v Acknowledgements ........................................................................................................ vii Table of Contents ........................................................................................................... xi List of Figures ................................................................................................................. xii List of Tables .................................................................................................................. xiii Executive Summary ........................................................................................................ xv Chapter 1 Why Infrastructure Investment Matters ........................................................ 1
1.1 Introduction .................................................................................................... 3 1.2 Impact on Economic Growth .......................................................................... 4 1.3 “Crowding Out” and Causation ....................................................................... 5 1.4 Impact on Poverty and Inequality .................................................................... 5
Chapter 2 Recent Indonesian Government Initiatives .................................................... 7
2.1 Indonesia’s Overall Development Strategy ...................................................... 9 2.2 Indonesia’s National Strategic Projects ............................................................ 10 2.3 Implementation Strategies ............................................................................... 11
Chapter 3 Existing Estimates of the Impact of Infrastructure on Growth ...................... 15
3.1 Elasticities ....................................................................................................... 17 3.2 Physical Measures ........................................................................................... 18 3.3 Meta-analysis .................................................................................................. 18 3.4 Differences between Developed and Developing Countries ............................ 19 3.5 Investment and Growth in Indonesia ............................................................... 20 3.6 Indonesian Studies .......................................................................................... 23
Chapter 4 The Determinants of Economic Growth in Emerging Markets ...................... 25 4.1 Purpose ........................................................................................................... 27 4.2 Regression Results ........................................................................................... 29 4.3 Caveats ........................................................................................................... 30 4.4 Impact of the Policy Stimuli ............................................................................ 31
Chapter 5 Impact of Infrastructure on Inequality and Poverty ...................................... 35 5.1 Literature on Growth and Inequality ................................................................ 37 5.2 The Impact of Infrastructure Investment on Poverty ......................................... 38 5.3 New Empirical Estimates ................................................................................. 40
5.3.1 Impact on Inequality ..................................................................... 41 5.3.2 Impact on Poverty ......................................................................... 43
Conclusion ..................................................................................................................... 47 References ..................................................................................................................... 49 Technical Annex 1 ......................................................................................................... 54 Technical Annex 2 ......................................................................................................... 58

List of Figures
xii THE IMPACT OF INDONESIA’S INFRASTRUCTURE DELIVERY
List of Figures Figure 1. Estimated Impact of the Government’s Infrastructure Investment ................ xvi
(Current and Future) on Indonesian Inequality Figure 2. Estimated Long-term Impact of the Government’s Infrastructure ................ xvii
Investment (Current and Future) on Indonesia’s Growth Rate Figure 3. Estimated Impact of the Government’s Infrastructure Investment ............... xix (current and future) on Indonesian Poverty Figure 4. The Ten Benefits of Infrastructure Investments (Non-comprehensive) ......... 4 Figure 5. Overview of National Strategic Projects (PSN) for 2017 ............................ 11
(As per October 2017) Figure 6. KPPIP’s Role ............................................................................................... 12 Figure 7. BKPM’s Role .............................................................................................. 13 Figure 8. PINA’s Role ................................................................................................ 14 Figure 9. Growth in Indonesian GDP and Real Capital Stock .................................... 20 Figure 10. Approved Foreign Direct Investment in Indonesia and GDP Growth, ......... 21
1983-2008 (US$ Billion, Constant 2010 Prices) Figure 11. Share of Gross Fixed Capital Formation (GFCF) in GDP and ..................... 22
GDP Growth (%), 1951-2008 Figure 12. GDP Growth Rates for 32 Developing and Emerging Market .................... 28
Countries 1990-2016 Figure 13. Estimated Long-term Impact of Undergoing Infrastructure ......................... 32
Investment on Growth of Indonesia Figure 14. Estimated Long-term Impact of Undergoing Infrastructure ......................... 33
Investment on Indonesia Growth Rate Figure 15. The Impact of Infrastructure Programmes on Poverty .................................. 47 Figure 16. Prediction Test for the Whole Average ...................................................... 56 Figure 17. Prediction Test for Indonesia ..................................................................... 57

List of Tables
xiii THE IMPACT OF INDONESIA’S INFRASTRUCTURE DELIVERY
List of Tables Table 1. Relationship between Infrastructure Investment and Economic Growth in .... xviii
Indonesia, China, India, Malaysia and Singapore (1991-1996) Table 2. Relationship between Infrastructure Investment and Economic Growth in .... xviii
Indonesia, China, India, Malaysia and Singapore (2000-2014) Table 3. Regression Results for the 32 Countries’ GDP Growth (1990-2016) ............. 29 Table 4. Coefficient Estimates of the Three Main Drivers of Growth .......................... 30 Table 5. Estimated Growth Stimuli from Immediate Projects and Full Programme ...... 31 Table 6. Relationship between Infrastructure Investment and Economic Growth in .... 34
Indonesia, China, India, Malaysia and Singapore (1991-1996) Table 7. Relationship between Infrastructure Investment and Economic Growth in .... 34
Indonesia, China, India, Malaysia and Singapore (2000-2014) Table 8. Regression Results for Gini Index (World Bank Estimate) ............................. 41 Table 9. Estimated Immediate Projects and Full Programme Effect on Inequality ....... 42 Table 10. Regression Results for Poverty Headcount Ratio (at US$3.20 a Day) ............ 43 Table 11. Estimated Immediate Projects and Full Programme Effect on Poverty ........... 44 Table 12. Correlation Matrix between Real GDP Growth and Other Explanatory ........ 54
Variables in the Equation

Photo Credit: Rajbir Ahluwalia

Executive Summary
xv
THE IMPACT OF INDONESIA’S INFRASTRUCTURE DELIVERY
Executive Summary Infrastructure is widely recognised as one of the key factors affecting economic growth, and facilitating reductions in inequality and poverty, particularly in developing economies. The Indonesian government, under the leadership of President Joko Widodo (popularly known as Jokowi) has in the last three years been taking steps to arrest two decades of inadequate investment in the country’s infrastructure. The Jokowi administration has introduced US$342 billion worth of infrastructure projects under its Priority and Strategic Infrastructure Programme. Delivery measures include substantially larger budget allocations to infrastructure delivery ministries, increased capital injections to relevant State-Owned Enterprises (SOEs), substantial empowerment of infrastructure-related government bodies and establishment of new institutions to enhance infrastructure delivery.
Gone are the days when the Indonesian government would plan infrastructure programmes and projects but consistently come up short at delivering. The Jokowi administration, in contrast, has placed considerable store on delivering infrastructure, leading from the front in de-bottlenecking project implementation, including enabling land clearance, allocating the needed government budgets and recently introducing various innovative funding schemes to enable delivery of these projects. In this seminal and independent1 report, Tusk Advisory is pleased to present new empirical evidence which estimates the impact of the government’s infrastructure capital expenditure on economic growth, as well as enabling reductions in inequality and poverty. We find that the Indonesian government has been astute in focusing on infrastructure-led growth, and that Indonesia’s growth rate will be increased substantially.
1 This independent report is a component of Tusk’s Infrastructure Knowledge Series, fully funded by Tusk.
US$100 Billionprojects are under-construction or completed
7.2GDP growth
by 2023
With the completion of 50% of the balance of the programme, Indonesian GDP growth will be
9.3by 2030
GINI Index down by
Poverty down to
%
%
8%2pointsby 2030by 2030
As of December 2017,
The completion of the above US$100 Billion projects by 2019/2020 will result in Indonesian GDP growth of
Priority and strategic infrastructure programme worth
US$342 Billion

Executive Summary
xvi
THE IMPACT OF INDONESIA’S INFRASTRUCTURE DELIVERY
As a consequence, inequality is expected to be reduced, with the GINI index dropping from its current level of 0.40 to around 0.38.
Figure 1. Estimated Impact of the Government’s Infrastructure Investment (Current and Future) on Indonesian Inequality Source: Tusk Advisory Estimate, 2018 Among the key findings of this report are that between 2015 and 2017:
• The government has completed 62 projects with an estimated value of US$4.2 billion.
• As of December 2017, there were over 224 projects under construction with an estimated value of US$99.2 billion.
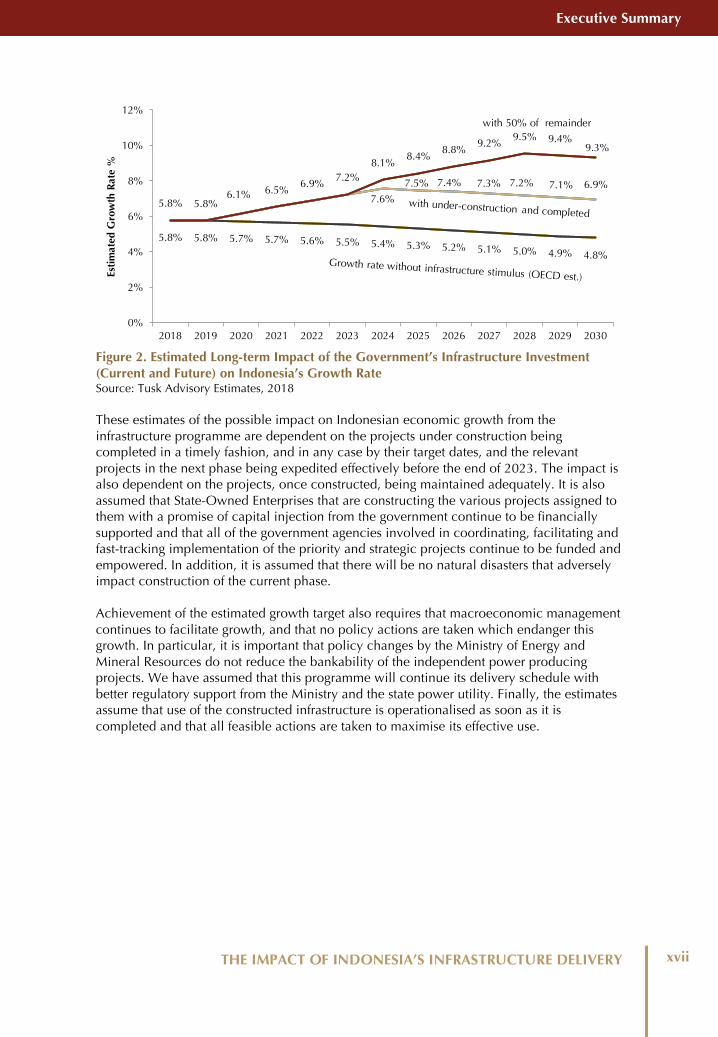
Based on the above US$100 billion of under-construction and completed projects, Tusk Advisory’s analysis shows that the Jokowi administration’s aim of reaching 7% growth in the near term is achievable. In fact, we find that the completion of the current projects under construction would result in the country achieving a 2.16% increase, thus raising the country’s GDP growth rate to 7.2% by 2023. The growth rate would be increased to over 9% by 2030, if half of the remaining programme were completed by 2023 as shown in the following chart:
-2.5
-2
-1.5
-1
-0.5
0
Inequality Reduction(GINI Index) by 2030
Under Construction or Completed (US$103.44
billion)
With 50% of Remainder (US$222.91
billion)
Executive Summary
xvii
THE IMPACT OF INDONESIA’S INFRASTRUCTURE DELIVERY
Figure 2. Estimated Long-term Impact of the Government’s Infrastructure Investment (Current and Future) on Indonesia’s Growth Rate Source: Tusk Advisory Estimates, 2018 These estimates of the possible impact on Indonesian economic growth from the infrastructure programme are dependent on the projects under construction being completed in a timely fashion, and in any case by their target dates, and the relevant projects in the next phase being expedited effectively before the end of 2023. The impact is also dependent on the projects, once constructed, being maintained adequately. It is also assumed that State-Owned Enterprises that are constructing the various projects assigned to them with a promise of capital injection from the government continue to be financially supported and that all of the government agencies involved in coordinating, facilitating and fast-tracking implementation of the priority and strategic projects continue to be funded and empowered. In addition, it is assumed that there will be no natural disasters that adversely impact construction of the current phase. Achievement of the estimated growth target also requires that macroeconomic management continues to facilitate growth, and that no policy actions are taken which endanger this growth. In particular, it is important that policy changes by the Ministry of Energy and Mineral Resources do not reduce the bankability of the independent power producing projects. We have assumed that this programme will continue its delivery schedule with better regulatory support from the Ministry and the state power utility.Finally, the estimates assume that use of the constructed infrastructure is operationalised as soon as it is completed and that all feasible actions are taken to maximise its effective use.
5.8% 5.8% 5.7% 5.7% 5.6% 5.5% 5.4% 5.3% 5.2% 5.1% 5.0% 4.9% 4.8%
7.6%
7.5% 7.4% 7.3% 7.2% 7.1% 6.9%
5.8% 5.8% 6.1% 6.5%
6.9% 7.2% 8.1%
8.4% 8.8%
9.2% 9.5% 9.4%
9.3%
0%
2%
4%
6%
8%
10%
12%
2018 2019 2020 2021 2022 2023 2024 2025 2026 2027 2028 2029 2030
Esti
mat
ed G
row
th R
ate
%with 50% of remainder

Executive Summary
xviii
THE IMPACT OF INDONESIA’S INFRASTRUCTURE DELIVERY
These expected growth rates are achievable, given the history of Indonesia and its Asian neighbours. In this report, we have demonstrated the close relationship between infrastructure investment and economic growth. This relationship is reflected in the experience of Indonesia, China, India, Malaysia and Singapore in the 1991-1996 period, as shown in the following table: Table 1. Relationship between Infrastructure Investment and Economic Growth in Indonesia, China, India, Malaysia and Singapore (1991 – 1996)
1991-1996 Average GFCF % Average GDP Growth % Indonesia 32.4% 7.2%
China 39.8% 11.9% India 26.1% 5.5%
Malaysia 39.8% 9.6% Singapore 34.7% 8.5%
Source: Tusk Advisory Analysis of WDI data In that period, China achieved an average GDP growth rate of nearly 12% on the back of a Gross Fixed Capital Formation (GFCF) of around 40%. Inspection of the table shows that those countries that invested most grew fastest. Indonesia during the same period achieved an average growth rate of 7.2%. The same pattern can be found in more recent years, as shown in the table below. Table 2. Relationship between Infrastructure Investment and Economic Growth in Indonesia, China, India, Malaysia and Singapore (2000 – 2014)
2000 - 2014 Average GFCF % Average GDP Growth % Indonesia 28.0% 5.3%
China 42.8% 9.8% India 35.7% 7.0%
Malaysia 23.5% 5.1% Singapore 26.6% 5.8%
Source: Tusk Advisory Analysis of WDI data In the period 2000-2014, China invested even more, as a percentage of GDP, and kept its average growth rate near to 10%, despite the Global Financial Crisis. India increased its investment in fixed assets to nearly 36%, and as a result achieved an average growth rate of 7%. Malaysia invested considerably less, and as a result saw its growth rate fall to around 5%. Singapore had a similar experience. Indonesia allowed its investment to fall to an average of 28% of GDP, and achieved an average growth rate of 5.3%. Using a similar approach to that employed for the relationship between infrastructure and growth, it is estimated that the projects under construction or completed could knock over one point off the Gini Index for Indonesia, while the full (US$342.39 billion) programme might be expected to knock in excess of three points off. This represents about 2.7% and 7.8% of the current Gini Index respectively (which was estimated to be around 40 points in 2016). It is also estimated that the projects under construction or completed could reduce poverty (based on the international standard of US$3.20/day) by over 4.4%, while the full (US$342.39 billion) programme could reduce poverty by 14.8%. If, as we have assumed for the growth rate estimates above, half of the remainder can be completed by 2023, with full

Executive Summary
xix
THE IMPACT OF INDONESIA’S INFRASTRUCTURE DELIVERY
impact on growth by 2028, the combined effect would be to knock two points off the Gini index and reduce poverty, on this basis, by just under 10%.2 However, Indonesia’s national poverty line is much lower than US$3.20 per day. In 2016, the national level was set at US$0.92/day, on which basis Indonesia’s poverty rate has been estimated recently to be 10.9%.2 Applying the same percentage effect as we have estimated above to this lower estimate, the implied reduction in poverty from the projects which have been completed or under construction would be 1.4%, reducing measured poverty to 9.5%. If in addition half of the remaining programme were to be implemented, this could reduce the national poverty measure by a little over 3%, bringing it down to below 8%. The potential impact on poverty is presented in the chart below:
* At 2011 Purchasing Power Parity (PPP) ** Converted from IDR using average IDR/US$ exchange rate for 2016 Figure 3. Estimated Impact of the Government’s Infrastructure Investment (Current and Future) on Indonesian Poverty Source: Tusk Advisory Estimate, 2018 While the government’s delivery track record to date has been impressive, these achievements have predominantly been on the strength of the government budget channelled via a number of State-Owned Enterprises, some of which are cash constrained. Going forward, it is imperative that the government also consider alternative strategies to fund these SOEs as well as harnessing the financial, management and technological capabilities of the private sector, both to ensure the current build-out continues to its targeted completion date of 2019/2020 and also to complete the other portions of the government’s priority and strategic projects by the delivery targets. It is encouraging to note that the government is cognizant of the continued need for fresh capital and has been active in facilitating innovative funding schemes, including
22 For more detail on the various poverty lines and estimates, please see Chapter 5.
31.4%
27%
21.8%
10.9% 9.5% 7.7%
0
5
10
15
20
25
30
35
International Poverty Line: US$3.20/day*
National Poverty Line:US$0.92/ day**
Base, without Infrastructure Programme
With Completed and Under-Construction Projects, achieved by 2023
With Half of the Remaining Programme, achieved by 2030
1010.9%

Executive Summary
xx
THE IMPACT OF INDONESIA’S INFRASTRUCTURE DELIVERY
the historic issuance of Future Revenue Based Securities (FRBS) locally by a number of infrastructure SOEs. The government has also enabled watershed rupiah denominated bonds (called Komodo Bonds) in the London Stock Exchange. The government is in the final leg of issuing new regulations to monetise some of its key infrastructure assets via Limited Concession Schemes (LCS). LCS allows the generation of fresh capital for infrastructure from the private sector, without selling any government assets. This report is presented in 5 Chapters: Chapter 1 – Provides a generic overview of the benefits of infrastructure with particular focus on the impact of better infrastructure on enhanced employment; multiplier effects; improved productivity; enhanced human capital; improved land values; better coordination and access between regions; more sustainable environmental outcomes; and more innovation. This chapter also discusses the phases of infrastructure delivery during which infrastructure delivers faster growth: first, during the construction period a significant amount of labour and other local inputs are used; and second, on a continuing basis, better infrastructure improves the functioning of the economy. As a result, a major infrastructure programme has the potential to put the overall economy on a higher growth trajectory. There is also considerable evidence that better infrastructure has a strong potential role to play in reducing inequality and poverty, although care needs to be taken to ensure that this works in practice. Chapter 2 – Presents the details of the Jokowi administration’s infrastructure programme, namely the Priority Projects, the National Strategic Projects (PSN) and the 35 GW electricity programme, with a total estimated cost of US$342.39 billion. As stated earlier, to date 286 projects are under construction or have been completed with a total value of US$103.44 billion. The projects span energy, roads, railways, ports, airports, water and sewerage and IT. This chapter also discusses the various roles played by key government agencies supporting infrastructure delivery, particularly the Committee for Acceleration of Priority Infrastructure Delivery (Komite Percepatan Penyediaan Infrastruktur Prioritas - KPPIP) and the Indonesia Investment Coordinating Board (Badan Kordinasi Penanaman Modal - BKPM) and finds that both have made substantial contributions in unlocking infrastructure delivery. Chapter 3 – Summarises the international and Indonesian evidence which demonstrates the positive impact of infrastructure on economic growth, especially in developing countries such as Indonesia. Elasticities (the increment to GDP of a 1% increase in the capital stock) have been estimated of between 0.1% and 0.5%. Studies which focus on physical measures, such as kilometres of roads, electricity generating capacity, and number of telephones, also find sizeable effects. This chapter also demonstrates a strong correlation between Indonesia’s GDP growth and its capital stock, foreign direct investment (FDI) and Gross Fixed Capital Formation (GFCF). Indonesian literature discussed in this chapter shows strong effects from these factors. Chapter 4 – Provides new empirical evidence of the impact of infrastructure on growth in developing and emerging market countries, and groups of countries, based on a database of 32 such countries for the period 1990 to 2016. As detailed in the Technical Annex, we have developed econometric estimates of the coefficients for different factors on economic growth. GFCF, FDI and value added in manufacturing all emerge as significant contributors. These estimates result in a 2.16% impact on GDP growth, on a continuing basis, from the projects which are under construction and completed

Executive Summary
xxi
THE IMPACT OF INDONESIA’S INFRASTRUCTURE DELIVERY
(US$103.44 billion) and a 6.89% impact from the whole (US$342.39 billion) programme. The precise pattern of the increases in GDP growth depends on how quickly the overall investment can be realised. We have taken the conservative approach of assuming that half of the remaining programme can be implemented in the years 2020-2023, with the impact phased over the period 2024-2028. This would raise the growth rate further to over 9.3% by 2030.3 3 Chapter 5 – Summarises the international and Indonesian literature on the relationship between growth, inequality and poverty, and provides new estimates of the potential impact of infrastructure investment. As with the impact on GDP growth, much depends on choice of infrastructure and effective implementation, and experience varies from country to country. We have followed a similar procedure to that employed for GDP growth, this time using a database of 25 countries for the same time period (1990 to 2016). For inequality, we find beneficial effects from GFCF (our proxy for infrastructure investment), net inflows of FDI and manufacturing value added. Using a similar process to that employed for the relationship between infrastructure and growth, we estimate that the projects which have been completed or are under construction may knock over one point off the Gini Index for Indonesia,44 while the full (US$342.39 billion) programme might be expected to knock in excess of three points off. This would reduce the Gini Index from its current level of 0.40 to 0.39 and 0.37 respectively. We also find a positive impact in reducing poverty for GFCF, for exports, and for manufacturing value added. In conclusion, this report builds on international and Indonesian literature that provides evidence showing a clear link between infrastructure and economic growth, and the resulting impact on inequality and poverty. We have reinforced this evidence by providing new empirical estimates based on panel data for a large sample of emerging market and developing countries over a twenty-seven-year period. These estimates suggest that the infrastructure programmes already underway will put Indonesia on a higher growth trajectory – with expected growth rates in excess of 7% by 2023 – and that if at least half of the remaining plans for infrastructure are implemented in the early part of the next decade, this growth rate could increase to over 9% by 2030.
3 This estimate is based on the most recent OECD forecast for the Indonesian growth rate, which fall from 5.78% to 4.78% between 2018 and 2030. 4 The Gini Index is a measure of the statistical dispersion of the income distribution across a nation. See section 5.3 for a definition.


Why InfrastructureInvestment Matters1


Chapter 1 | Why Infrastructure Investment Matters
3
THE IMPACT OF INDONESIA’S INFRASTRUCTURE DELIVERY
1.1 Introduction
nfrastructure is the backbone of any modern economy. All businesses require safe and secure energy and water supply, waste disposal, communications, and transport for their workers and goods. Where these are not available, the
productivity of the businesses will be lower, and so will be economic growth. Improving infrastructure, especially when the existing supply is limited, is an effective way of enhancing economic growth. However, just how effective this is depends on how well the infrastructure investment is implemented, and how well it is subsequently used and maintained. Building a road that no-one uses, or simply building additional government offices, has limited effect on growth. In contrast, reducing serious congestion or providing electricity and water when there is no existing supply can be transformative. Properly implemented, improved infrastructure can also make an important contribution to reducing poverty and inequality. The government led by President Joko Widodo (popularly known as ‘Jokowi’) has emphasised the need to improve the economic situation of all parts of Indonesia, including the poorer, Eastern provinces. Budgetary and institutional reforms have been implemented to achieve rapid and sustainable growth, with a particular focus on development of infrastructure which takes advantage of Indonesia’s geographical position and long coastlines. A stated objective is to reduce inequality between localities and ethnic groups, and to reduce poverty.
I

Chapter 1 | Why Infrastructure Investment Matters
4
THE IMPACT OF INDONESIA’S INFRASTRUCTURE DELIVERY
Working out just how much a particular infrastructure programme will increase economic growth is a complex task. The impact will depend on exactly what new infrastructure is provided, what already exists, and how it is used. Different types of infrastructure will have different effects depending on the economic activity they need to support. In countries that already have a well-developed infrastructure, the incremental effect may be smaller, while in countries – like Indonesia – that have a severe shortage, the effect will in all likelihood be profound.
1.2 Impact on Economic Growth There are many ways in which an infrastructure project affects economic growth, including the ten items set out in Figure 4 below:
Figure 4. The Ten Benefits of Infrastructure Investments (Non-comprehensive) Source: Tusk Advisory Analysis, 2018 In previous work (Morris and Tsjin, 2015) we have discussed the importance of effective implementation strategies and choice of projects in ensuring that all these effects have the maximum possible impact. We also set out how a well empowered and resourced agency, such as KPPIP (the Committee for Acceleration of Infrastructure), could make a major difference to the delivery of key infrastructure projects (Kannan and Morris, 2014). Social infrastructure also makes a big difference: a better trained, healthier and happier workforce will in the medium-to-long-term be more productive. Similarly, effective institutional infrastructure reduces inefficiency and uncertainty, and can enable substantial improvements to economic performance.
Direct labour employment during
the construction phase
Indirect employment in local industries
which supply goods and services to the
project
Multiplier effects from spending by those who work on the project
and by these local industries
Improved land values in areas affected by the
project
Removal of bottlenecks,
congestion and other impediments to efficient business
activities
Business innovations made
possible by the project which
could not otherwise occur
Reductions in production costs
and hence improvements in
international competitiveness
Enhanced availability of human capital achieved through
reduced transit times, connectivity, etc.
Better co-ordination and access between regions/areas which
are linked by the project
Specific effects of the project on the
productivity of particular
agricultural, industrial or service
sectors

Chapter 1 | Why Infrastructure Investment Matters
5
THE IMPACT OF INDONESIA’S INFRASTRUCTURE DELIVERY
1.3 “Crowding out” and Causation However, in calculating the benefits arising from infrastructure investment it is important to take into account ‘crowding out’ and other costs. If the labour which is used in construction could have been employed productively elsewhere, or if the capital used for the project prevents other productive investment, then these effects need to be netted off. Clearly, projects which predominately use local inputs, in an economy where neither labour nor capital is particularly scarce, will be likely to have the greatest direct effect on economic growth. Various commentators have questioned the direction of causation, as to whether it is infrastructure causing an increase in economic growth, or whether it is some other stimulus generating the growth, which in turn creates an increase in infrastructure spending. Infrastructure is needed in either case, whether to drive growth or to enable growth which is the result of other stimuli.
1.4 Impact on Poverty and Inequality There is a large international, and some Indonesian, literature on the relationship between growth, poverty and inequality. How much effect each infrastructure investment has depends on choice of project and on effective implementation. However, the literature, taken as a whole, does demonstrate a large and beneficial effect. Non-income factors seem also to be important for policies that address poverty and inequality, such as education, health, gender discrimination and popular participation in decision making. Case studies presented below from China, Bolivia and Thailand (among many others) all demonstrate the important enabling effect that well-targeted infrastructure development can have on poverty reduction. The literature also demonstrates the strong positive impact of transport and energy (especially electricity) infrastructure in increasing economic opportunities for the poor, especially in the agricultural sector.


Recent IndonesianGovernment Initiatives2


Chapter 2 | Recent Indonesian Government Initiatives
9
THE IMPACT OF INDONESIA’S INFRASTRUCTURE DELIVERY
2.1 Indonesia’s Overall Development Strategy
n a speech on August 16, 2016, President Joko Widodo (“Jokowi”) set out “three ground-breaking steps to alleviate poverty, unemployment and social inequality [namely] acceleration of infrastructure, preparation of productive capacity and human resources... [and] … deregulation and debureaucratisation”. He went on to describe
how the Government would “build infrastructure facilities more evenly throughout the country to strengthen inter-regional connectivity and reduce social inequality and poverty”.5 In a later speech he emphasised how “We want the people [throughout Indonesia] to feel the benefits of infrastructure development, the smooth connectivity and the decrease in logistics costs”.6 The Jokowi administration has thus recognised the importance of infrastructure in achieving all these goals. So it increased the budget for the Ministry of Public Works and Housing by over 60% from 2014 to 2015 and provided a cash injection to infrastructure-related State-Owned Enterprises. As a result, Indonesia is currently constructing over US$100 billion of infrastructure across the nation, not only in the economic powerhouses of the islands of Java and Sumatra, but also in the regions of Kalimantan, Sulawesi, Papua, and even in the small islands of Maluku. In total over 146 priority and strategic infrastructure projects, and one electricity programme, are under construction or have been completed during the Jokowi administration period, including parts of the Trans Sumatra Highway, the future infrastructure backbone of Sumatra; the 2000 MW super-clean coal power plant in Central Java; the Jakarta MRT and LRT projects; the construction of railways in Sulawesi; and the construction of special economic zones in Papua. In choosing these projects, there has been a clear focus on equitable infrastructure development throughout the Indonesian archipelago.
5 Source: Cabinet Secretary, full script: http://setkab.go.id/pidato-kenegaraan-presiden-republik-indonesia-dalam-rangka-hut-ke-71-proklamasi-kemerdekaan-ri-di-depan-sidang-bersama-dpr-ri-dan-dpd-ri-jakarta-16-agustus-2016/.
6 Source: Cabinet Secretary, full script: http://setkab.go.id/pidato-presiden-republik-indonesia-pada-sidang-tahunan-mpr-ri-16-agustus-2017-di-gedung-mpr-ri-jakarta/.
I

Chapter 2 | Recent Indonesian Government Initiatives
10
THE IMPACT OF INDONESIA’S INFRASTRUCTURE DELIVERY
However, there have been some critiques of Jokowi’s development strategy. There is concern about ambitious infrastructure development not being supported by sufficient tax revenue. The dominance of the informal sector in employment, decreasing export and import activities, and reluctance to make necessary commodity price adjustments (e.g., to electricity and fuel prices) may leave insufficient infrastructure financing and have implications for macro-economic stability.7 There are also concerns about other issues such as employment, prices of basic supplies, and poverty alleviation, as reported by numerous domestic surveys in 2017. Nevertheless, public satisfaction in the current Government is on a rising trend, ranging from 55% to more than 70%, implying, inter alia, that the majority of Indonesia’s citizens agree with the Government’s policy of boosting infrastructure development outside the island of Java.8
2.2 Indonesia’s National Strategic Projects Presidential Regulation No. 3/ 2016 j.o. Presidential Regulation No. 58/ 2017 has defined a far reaching set of National Strategic Projects (PSN) for Indonesia, which consists mostly of physical infrastructure projects, to be delivered during the Jokowi administration. First established in 2016, the PSN have been updated annually by KPPIP based on selection criteria and inputs from project owners. In PSN 2017, there are 245 projects and 2 programmes (i.e., an electricity programme and an airline industry programme) with a total estimated investment value of IDR4,417 trillion (around US$339.82 billion).9 Adding the completed projects from PSN 2016, the total estimated investment value of the whole PSN will be IDR4,451 trillion (around US$342.39 billion). Excluding projects under the electricity programme, 127 projects are under construction and 19 projects have so far been completed with a total value of US$81.06 billion. The complete project list from PSN 2017 includes roads, railways, ports, airports, water and sewerage and IT, which are set out in the figure 5. As part of the PSN, the electricity programme contributes a significant portion of the total investment. Currently, there are 97 under-construction and 43 completed electricity projects across Indonesia with an estimated total value of US$21.67 billion and US$0.71 billion respectively. These projects comprise 16 GW out of the planned 35 GW to be delivered during the Jokowi administration period.
7 Source: Faisal Basri, available at https://faisalbasri.com/, accessed on January 3, 2018.
8 We examined multiple surveys by Saiful Mujani Research & Consulting (SMRC), Indo Barometer, Centre for Strategic and International Studies (CSIS) and Lembaga Survei KedaiKOPI in 2017 on the performance of Indonesia Government 3 years after the commencement of the new President and cabinet.
9 The investment value is based on updates per February 2018, excluding 12 projects that had no investment value. The data on investment value is currently subject to a verification process with the Executive Office of President (KSP) and Indonesia’s National Government Internal Auditor (BPKP). The exchange rate used is US$1 = IDR13,000.

Chapter 2 | Recent Indonesian Government Initiatives
11
THE IMPACT OF INDONESIA’S INFRASTRUCTURE DELIVERY
Figure 5. Overview of National Strategic Projects (PSN) for 2017 (As of October 2017) Source: KPPIP, 2017 The complete list of under-construction and completed PSN projects, including projects in the electricity programme, is provided in the Technical Annex.
2.3 Implementation Strategies The implementation of major infrastructure programmes in Indonesia involves numerous agencies, including the Committee for Acceleration of Infrastructure (KPPIP) and the Indonesia Investment Coordinating Board (BKPM). KPPIP focuses on ensuring that priority infrastructure projects are delivered and financed effectively, while BKPM focuses on encouraging private investment and increasing the ease of doing business in Indonesia.
BALI & NUSA TENGGARA
61 projectsUS$ 49.1 B
JAWA
93 projectsUS$ 84.2 B
PAPUA & MALUKU
13 projectsUS$ 34.5 B
SULAWESI
27 projectsUS$ 25.2 B
SUMATERA
61 projectsUS$ 49.1 B
Exchange Rate: US$1 = IDR 13,000
KALIMANTAN
24 projectsUS$ 43.3 B
NATIONAL
2 Programs12 Projects
US$ 102.6 B
US$49.1 Bn US$43.3 Bn
US$25.2 Bn
US$34.5 Bn
US$102.6 BnUS$0.8 Bn
US$84.2 Bn
15 projects
JAVA
2 Programmes
ROAD
74Projects
RAILWAY
23Projects
SEAPORT
10Projects
AIRPORT
8Projects
INDUSTRIAL ZONE
30Projects
HOUSING
3Projects
NATIONAL BORDER
POST
3Projects
WATER SANI-
TATION
9Projects
DAM
54Projects
IRRIGA-TION
7Projects
TECH-NOLOGY
4Projects
SMELTER
6Projects
OIL & GAS
12Projects
FISHERY
1Project
SEA DIKE
1Project
PSN INCLUDES 15 SECTORS AT PROJECT LEVEL AND 2 SECTORS AT PROGRAM LEVEL
PROJECTS
PROGRAMS
ELECTRICITY 1 Program SMALL- MEDIUM AIRPLANE 1 Program
PSN INCLUDES 15 SECTORS AT PROJECT LEVEL AND 2 SECTORS AT PROGRAMMES
PROGRAMMES
Programme Programme

Chapter 2 | Recent Indonesian Government Initiatives
12
THE IMPACT OF INDONESIA’S INFRASTRUCTURE DELIVERY
As a special task force for infrastructure delivery, KPPIP was initiated under Presidential Regulation No. 75/ 2014 (which was later amended by Presidential Regulation No. 122/ 2016 on Acceleration of Priority Infrastructure Delivery). The original aim of KPPIP was to be an agency similar to Indonesia Bank Restructuring Agency (IBRA) with fiscal and policy powers,
which was specially established to solve crises (see Kannan and Morris, 2014, for discussion of the initial objectives). KPPIP is mandated to improve the quality of project preparation and to coordinate acceleration efforts required in order to meet the target of infrastructure delivery. Its role includes advising on policy and strategy, selecting priority projects, determining the optimum funding scheme for priority projects, providing monitoring and debottlenecking assistance for specific projects, providing facilities for project preparation such as Outline Business Cases (OBC), and facilitating capacity and institutional building related to priority project delivery. KPPIP also supports various other policy and regulatory developments. KPPIP has been actively involved in supporting the State Asset Management Agency (LMAN) in the reimbursement process of funds spent in advance by the Toll Road Business Entity (BUJT) for the purpose of land procurement for Priority Projects and National Strategic Projects. KPPIP also provides support on Public-Private Partnership (PPP) implementation, including the policy development of availability payments by Regional Governments and other alternative financing such as Limited Concession Schemes (LCS). A key value add from KPPIP has been its ability to harness the input from other infrastructure-related government agencies, including LMAN, in facilitating land acquisition for priority projects; and the PPP Centre at the Ministry of Finance, for14quick decisions on Viability Gap Funding (VGF) and transaction management. In addition, KPPIP has also been a key dialog partner for other coordinating ministries and Bappenas in promoting their respective infrastructure plans, particularly PINA,10 which has been at the forefront of devising innovative solutions to structure non-government funding for infrastructure projects. KPPIP’s collaborative work with a number of multilateral and bilateral funding agencies has also helped to fast track the delivery of the current infrastructure construction programme.
Figure 6. KPPIP's Role Source: KPPIP, 2017
1410 The role of PINA is described in Figure 8.

Chapter 2 | Recent Indonesian Government Initiatives
13
THE IMPACT OF INDONESIA’S INFRASTRUCTURE DELIVERY
The Investment Coordinating Board of the Republic of Indonesia, or BKPM, is a non-departmental government agency that was first established in 1973 by replacing the existing Technical Committee on Investment (under the Foreign Capital Investment Advisory Committee and further regulated through the Presidential Regulation No. 90 Year 2007 on Investment Coordinating Board). In 2009, BKPM was separated from the Ministry of State-Owned Enterprises and was repositioned as an independent agency to create a
“National Single Window for Investment”. It is assigned under, and reports directly to, the President and is positioned at ministry level. The three main tasks of BKPM are to simplify licensing procedures, to assist and facilitate investment projects and to enhance investment results. The ultimate mandate for BKPM is to boost domestic and foreign direct investment by creating a conducive investment climate and seeking investments that will improve social cohesion and employment conditions in Indonesia. BKPM’s role includes analysing and proposing national investment planning; coordinating implementation of national policies in the field of investment; analysing and proposing a policy of investment services; determining norms, standards, and procedures for the implementation of investment services; developing opportunities and potential investments in the region by empowering business entities; creating investment maps for Indonesia; coordinating promotional activities and investment cooperation; developing sector investment through fostered investment; aiding the removal of various obstacles; consulting on problems faced by investors; and providing licensing services and investment facilities. In relation to infrastructure development, the aim of BKPM, as stipulated under their strategy road map, is also to channel the investment towards hard infrastructure such as roads, bridges, and ports; as well as soft infrastructure, such as health services and education. This strategic initiative was first defined in January 2016 under Economic Policy Package II. This included launching a 3-hour licensing service to acquire infrastructure investment permits in Indonesia, which previously required 23 days or more. Furthermore, through Presidential Instruction the service was mandated to focus on investment within four infrastructure-related sectors: energy & mineral resources, transportation, public works, and communication & information.
Figure 7. BKPM's Role Source: BKPM, 2018

Chapter 2 | Recent Indonesian Government Initiatives
14
THE IMPACT OF INDONESIA’S INFRASTRUCTURE DELIVERY
The financing of the implementation of major infrastructure programmes in Indonesia has been a particular concern of the Jokowi administration. As well as initiating state budget allocation to ministries and cash injections to SOEs , the Government has set up a land bank function in BLU LMAN and various support schemes for PPPs, and is now starting to explore more ways to attract private sector funding, for example, through Non-Government Budget Infrastructure Funding (PINA).
President Joko Widodo has mandated the Ministry of National Planning Agency (Bappenas) to seek alternative funding that would contribute to the development of strategic infrastructure projects. In this spirit, a non-government budget infrastructure funding scheme or widely known as PINA was initiated under Presidential Regulation No. 20/2016 and Ministerial Decree of National Development Planning/Head of Bappenas No. 70/M. PPN/HK/12/2016 on the establishment of the government facilitation team for non-state budget investment funding. PINA is mandated to become a funding scheme where private investors, who are committed to invest in infrastructure projects in Indonesia, can provide equity financing without intervention/ guarantee/ subsidy from the government. It also aims to achieve the optimisation of SOE and private sector contributions in the funding of infrastructure projects, which is intended to cover 58.7% of the total infrastructure budget needed. The key value of PINA is that, first, the scheme allows projects to be funded from alternative funding sources, separate from the state budget, that are widely available locally or internationally using various types of investments from capital investment to stock raising. Under the PINA scheme, priority projects are chosen by their likelihood to support the achievement of priority target development; to give economic and social benefit for Indonesian citizens; and to give commercial benefit. As a result, selected priority projects will be constructed faster.
Figure 8. PINA’s Role Source: Bappenas, 2018

Existing Estimates of the Impact
of Infrastructure on Growth3


Chapter 3 | Existing Estimates of the Impact of Infrastructure on Growth
17 THE IMPACT OF INDONESIA’S INFRASTRUCTURE DELIVERY
3.1 Elasticities
here is a large international literature which seeks to pin down the effects of infrastructure on economic growth, dating from the seminal work of Aschauer (1989). This literature demonstrates clearly that well-designed infrastructure investments can increase economic growth, and improve productivity and land
values. Aschauer estimated that the elasticity of GDP in the US with respect to (non-military) public capital was 0.39 and with respect to “core infrastructure” (roads and other transport, energy and water) was 0.24. Put another way, this means that a doubling of core infrastructure capital in the US could raise GDP by 24%. Aschauer also found that a one per cent increase in the stock of public sector capital could boost GDP by 0.38 to 0.56 per cent annually, on a continuing basis. Estache, Speciale and Veredas (2005) carried out a major investigation of the impact of infrastructure on Sub-saharan Africa (using the World Development Indicators database we have also used for the analysis in this report). Their work provides evidence of some quite large elasticities for particular types of infrastructure in developing countries (0.19 for telecommunication, 0.50 for electricity, 0.34 for roads and 0.46 for water). They also show that countries with stronger legal traditions are more able to take advantage of better infrastructure. More recent studies, while confirming a positive effect, have found lower elasticities when averaged across many countries, including developed countries. For example, Calderon, Moral-Benito, and Serven (2011) estimated the output elasticity of infrastructure using a large cross-country panel data set covering 88 countries, spanning the years 1960-2000 and containing more than 3,500 annual observations. They found, after correcting for reverse causality from output to infrastructure and for potential cross-country heterogeneity, an average elasticity of between 0.07 and 0.10. Comparing these studies suggests that we might expect to find larger elasticities in developing and emerging market countries than in those where the basic infrastructure is already established.
T

Chapter 3 | Existing Estimates of the Impact of Infrastructure on Growth Chapter 1 | Why Infrastructure Investment Matters
18 THE IMPACT OF INDONESIA’S INFRASTRUCTURE DELIVERY
3.2 Physical Measures Some authors have noted that financial capital is not a good measure of actual infrastructure investment as there are many ‘leakages’ through, for example, corruption or diversion of funds to non-productive investments (such as excessively large office buildings for public officials). As a result, many researchers have used physical measures of infrastructure such as kilometres of paved roads, kilowatts of electricity generating capacity, and number of telephones. An example is Canning and Pedroni (2004), who found that increases in these measures do, on average, induce long-run growth effects, but that they are under-supplied (relative to the growth-optimising level) in some countries and over-supplied in others, which helps to explain the wide variation in elasticity estimates across countries. Mo, Chi and Campbell (2014) examined how changing the physical and spatial pattern of road infrastructure affected the Guangxi Zhuang Autonomous Region (GXZAR) in Southern China in the years 1993-2007. With GDP growth as the dependent variable, they used initial highway condition, investment in fixed assets and control variables (population density, education and health) as independent variables in an exploratory spatial data analysis (ESDA). They found that highway construction and investment both produce the strongest effect in the first years after the road is built, but that this effect diminishes over time. Baum-Snow et al. (2016) found that, in China, a 10% expansion in road length (within 450km of a prefecture city) reduced the population of smaller cities by an estimated 1.6%, due to migration, and increased the population of the average larger city by 2.5%. Further, they found that a 10% reduction in travel time to an international port resulted in a 1.6% increase in GDP, a 1% increase in local population and a 0.5% increase in GDP per capita.
3.3 Meta-analysis
The enormous number of empirical studies of the impact of infrastructure, often with conflicting results, has spawned a further literature which attempts ‘meta-analysis’ by seeking to combine the results from numerous different researchers. Bom and Ligthart (2011), for example, carried out a regression analysis based on 578 estimates from 68 studies covering the period 1983-2008. Controlling for a variety of technical issues, they estimated an average long run public capital elasticity of 0.14-0.17.

Chapter 3 | Existing Estimates of the Impact of Infrastructure on Growth
19 THE IMPACT OF INDONESIA’S INFRASTRUCTURE DELIVERY
The most recently published example, focused on transport infrastructure, is that of Holmgren and Merkel (2017), which explored 776 elasticity estimates originating from 78 different studies. The average estimated elasticity in these studies was 0.107, but there was wide variation – some 23% found negative elasticities (that is, ‘crowding out’ and other effects outweighing the beneficial effects), while one estimate (Pinnoi, 1994) put the elasticity as high as 3.49. Seeking to make sense of these widely varying estimates, the authors used econometric techniques to pin down what was causing the variation.
Among significant explanators of lower estimated elasticities are being in the US (which already has significant transport infrastructure) and having more productive uses for capital. Investing in roads (elasticity 0.23) was found to be more productive for manufacturing and construction output than investing in airports (elasticity 0.17), and to have a higher impact on the services and agricultural sectors (0.30 and 0.33 respectively). Port infrastructure was shown to be particularly important for the agriculture sector, with an estimated elasticity of 0.52 outside the USA. A recent survey of the literature by the New Zealand Department of Transport (2014) concluded that “Although there is considerable variance in the empirical evidence, the studies are broadly consistent with the conclusion that a 1 per cent increase in [the] public capital stock could result in a one-off, sustained increase in GDP of 0.2 per cent for a developed economy”.
3.4 Differences between Developed and Developing Countries
As we have noted above, there is potentially a large difference in impact between those countries where infrastructure is already developed, and those, such as Indonesia, where substantial deficiencies exist. In addition, we can expect the ‘crowding out’ and other effects to be smaller where productivity is low and excess human capital exists, again the case for Indonesia. Obtaining practical guidance from the international literature as to the likely growth effects of a particular infrastructure programme in a given country is difficult. One problematic issue is the interpretation of the growth elasticities that most studies report, which require new infrastructure investment to be related to the size of the existing capital stock.

Chapter 3 | Existing Estimates of the Impact of Infrastructure on Growth Chapter 1 | Why Infrastructure Investment Matters
20 THE IMPACT OF INDONESIA’S INFRASTRUCTURE DELIVERY
In many developing countries, including Indonesia, there is no comprehensive and reliable measure of the quality or quantity of existing infrastructure. So, it becomes necessary to seek guidance from the correlation between past growth rates and past levels of infrastructure investment at a country level. Evidence for Indonesia having poor basic infrastructure is provided in Ray and Ing (2016) that highlights the various reasons for Indonesia’s infrastructure deficits. Ismail and Mahyideen (2015) report Indonesia as having a lowly 78th ranking in infrastructure performance based on the World Competitiveness Index, with a particularly poor result for roads and ports. Across Asia, they found strong growth effects resulting from increases in telecommunication provision (10% increase leading to a 1% increase in economic growth), internet (10% increase leading to 2% growth), and electricity reliability (1% improvement increasing growth by 1.1%).
3.5 Investment and Growth in Indonesia The figure below shows how Indonesia’s real GDP growth rate (after allowing for inflation) varied over the period 1960 to 2016, and compares this to the development of Indonesia’s capital stock.
Figure 9. Growth in Indonesian GDP and Real Capital Stock Source: Tusk Advisory Analysis, 2017 Real GDP growth rates sourced from WDI database, World Bank. Capital stock estimates from University of Groningen and University of California, Davis, Capital Stock at Constant National Prices for Indonesia [RKNANPIDA666NRUG], retrieved from FRED, Federal Reserve Bank of St. Louis; https://fred.stlouisfed.org/series/RKNANPIDA666NRUG, November 12, 2017.
-15%
-10%
-5%
0%
5%
10%
15%
-2%
0%
2%
4%
6%
8%
10%
12%
1960 1965 1970 1975 1980 1985 1990 1995 2000 2005 2010 2015
Gro
wth
in r
eal G
DP
Gro
wth
in r
eal c
apita
l sto
ck
Growth in real capital stock Growth in real GDP
Asian Financial Crisis

Chapter 3 | Existing Estimates of the Impact of Infrastructure on Growth
21 THE IMPACT OF INDONESIA’S INFRASTRUCTURE DELIVERY
There has been a strong correlation in most periods between growth in the real capital stock11 and growth in real GDP for Indonesia. However, the figure above also highlights the serious impact of the 1997-1998 Asian financial crisis on the Indonesian economy. Growth in the capital stock slumped from around 10% per annum to under 2%. Pre-crisis real GDP growth rates of 7-9% fell to around 5-6% in the post-crisis period following this change. Pinning down the investment in infrastructure that underpins this variable GDP growth experience is also problematic. One indicator of the strength of such investment is approved foreign direct investment (FDI), although of course this includes investment in other commercial activities and excludes domestic investment in infrastructure. Lindblad (2015) has assembled data on Indonesian FDI for the period 1983 to 2008, as shown in the figure below.
Figure 10. Approved Foreign Direct Investment in Indonesiaa and GDP Growthb, 1983-2008 (US$ Billion, Constant 2010 Prices) aAdjusted from constant 2008 price to constant 2010 price based on US$ CPI inflation of 4% between 2008 to 2010; bCalculated from US$ 2010 constant price. Source: Tusk Advisory analysis, based on approved FDI data (excluding oil and gas industry) taken from Ramstetter (2000, 37), BKPM and CEIC Indonesia Database presented in Lindblad (2015, Figure 2 and 3) and adjusted to 2010 constant prices; GDP growth data is taken from WDI Database (2017); US$ CPI inflation rate is taken from Bureau of Labor Statistics, United States Department of Labor. Inspection of the pattern of FDI and comparison with real GDP growth rates again shows some correlation between the acceleration of FDI in the late 1980’s to the crisis and achievement and maintenance of 7-9% real growth, the collapse of FDI coincident with the crisis, and the lower levels of FDI and real growth subsequently. As shown in the graph, there was a spike in 1995 in FDI, which was the result of policy change, primarily the significant deregulation of foreign investment in 1994 by the issuance of Government Regulation No. 20/ 1994 (about Shareholding of Companies Established as Foreign Investments). Other aspects were related to large infrastructure projects involving private foreign firms and higher portfolio flows as the result of interest rate falls in the US and the perception of increased risk after the Mexican crisis subsided (Barlow and Hardjono, 1996).
11 ‘Real capital stock’ means the value of physical assets, adjusted for inflation.
-15%
-5%
5%
15%
25%
35%
45%
55%
65%
-15
-5
5
15
25
35
45
55
65
1983 1986 1989 1992 1995 1998 2001 2004 2007
(%, c
onst
ant
2010
, U
S$ d
olla
r)
App
rove
d FD
I (U
S$ b
illio
n, c
onst
ant
2010
pr
ices
)
Approved FDI (US$ billion, constant prices) year 2008
GDP growth (annual %)

Chapter 3 | Existing Estimates of the Impact of Infrastructure on Growth Chapter 1 | Why Infrastructure Investment Matters
22 THE IMPACT OF INDONESIA’S INFRASTRUCTURE DELIVERY
A second useful indicator of infrastructure investment is Gross Fixed Capital Formation (GFCF). Van der Eng (2009) has assembled such data for Indonesia for the period since 1950, as shown in the figure below, both from National Accounts and from input-output tables. This analysis highlights the particularly poor period of fixed capital investment in Indonesia from the mid 1990’s to about a decade ago.
Figure 11. Share of Gross Fixed Capital Formation (GFCF) in GDPa and GDP Growth (%)b, 1951-2008 a Calculated from current price series; bCalculated from US$ 2010 constant price. Sources: GFCF share is calculated for 1951-57 from Joesoef (1973) and ECAFE (1964); 1958-2008 from the national accounts; 1969, 1971, 1975, 1980, 1985, 1990, 1995, and 2000 from the Input-Output Tables of Indonesia; GDP growth is taken from WDI database (2017) and only available from 1961. Although these simple comparisons are not definitive, and the time lags between investment and subsequent improvement in growth are indeterminate, all three comparisons indicate a relationship between the sluggish growth of the period since the Asian financial crisis and weak infrastructure investment.
-15%
-10%
-5%
0%
5%
10%
15%
20%
25%
30%
1950 1960 1970 1980 1990 2000
National accounts
Input-Output Tables
GDP growth (constant 2010 price)

Chapter 3 | Existing Estimates of the Impact of Infrastructure on Growth
23 THE IMPACT OF INDONESIA’S INFRASTRUCTURE DELIVERY
3.6 Indonesian Studies Over the last fifteen years, various Indonesian researchers have provided empirical estimates of the impact of infrastructure on growth, and other economic indicators, for the various regions of Indonesia. Sibarani (2002), using data for 26 provinces in Indonesia between 1983 and 1997 found that electricity and education infrastructure had a significant effect on income per capita in Indonesia, while improvements to roads and telephones also contributed. Yanuar (2006) found that physical capital, roads, telephones, health and education infrastructure all had a positive and significant effect on economic growth. Prasetyo (2008) concluded that clean water, electricity, road length, capital stock and the strength of regional authority had a significant impact on economic growth in Western Indonesia. Prasetyo and Firdaus (2009) also used panel data for 26 provinces to show that economic growth was influenced by electricity, road and water infrastructure. Electricity was estimated to have the greatest impact on economic growth, followed by paved roads and clean water. Anwar, Mirdad and Pujianto (2013) estimated the impact on economic growth of improvements to road, electricity and water infrastructure in the island of Java during the period 2000-2009. They found that every 1% improvement in infrastructure added 0.78% to the growth rate. Maryaningsih et al. (2014) analysed the influence of infrastructure across 33 provinces in Indonesia. They estimated a cross-sectional model which related regional real GDP per capita to real investment, average years of schooling (a proxy for human capital), some physical measures of infrastructure (road length, loading/ unloading in ports and number of electricity subscribers) as well as some ‘control’ variables (percentage living in cities, trade openness, size of government and share of agriculture in GDP). Their results demonstrated that growth in GDP per capita was affected significantly by electricity supply, ports and overall investment. There is also some evidence in the literature that the initiatives taken in RPJMN 2015-2019 and implemented by the Jokowi government will have a positive impact on the effectiveness of Indonesia’s infrastructure. Guswandi (2017) has highlighted how infrastructure performance is a key factor in determining global competitiveness, improving macroeconomic performance, government efficiency and business efficiency. He constructed an index based on the existing condition of infrastructure in Indonesia and on future investment. This index of infrastructure competitiveness was predicted to increase from 3.8 in 2015 to 4.6 in 2019, a change which he predicted would result in Indonesia’s World ranking moving from 81 in 2015 to 65 in 2019.


The Determinants of Economic
Growth in Emerging Markets4


Chapter 4 | The Determinants of Economic Growth in Emerging Markets
27
THE IMPACT OF INDONESIA’S INFRASTRUCTURE DELIVERY
4.1 Purpose
he literature summarised above provides considerable evidence that investment in infrastructure has a significant, and positive, effect on economic growth. This is particularly the case in a country such as Indonesia, which – for a variety of historical reasons – has a substantial infrastructure deficit, and which has an
abundance of underutilised human and physical resources. However, the literature does not yet give us sufficient guidance on how large the effect of the recent initiatives to improve infrastructure might be for Indonesia. So in this chapter, we report new empirical work which explores the growth experience of a selection of 32 developing and emerging market countries and groups of countries over the period 1990 to 2016. Our data set was extracted from the World Bank ‘World Development Indicators’ (WDI) database.12 Focusing on growth in real Gross Domestic Product (GDP), we have used regression analysis of relevant explanatory variables (detailed in the Technical Annex) to estimate coefficients for those variables which were indicated to be relevant by theory and found to be significant in preliminary model testing. The Technical Annex also describes the various adjustments which were necessary to the WDI data to account for missing variables and the tests we undertook to ensure robustness of our estimates. We have validated the model by exploring alternative lag structures, excluding particular countries (e.g., China) from the analysis, exploring how well the estimates fit both within period (for Indonesia and for the average of our 32 countries) and out of period (re-estimating using only data to 2008, i.e., prior to the GFC) and then seeing how well the model predicts the period from 2009 to 2016. The details of these tests are provided in the Technical Annex: the coefficients estimated by the model seem quite stable under different specifications and the predictions remain intuitively plausible.
12 See https://data.worldbank.org/data-catalog/world-development-indicators, version used last updated on 15th September 2017.
T

Chapter 4 | The Determinants of Economic Growth in Emerging Markets Chapter 1 | Why Infrastructure Investment Matters
28
THE IMPACT OF INDONESIA’S INFRASTRUCTURE DELIVERY
The figure below shows how the growth rates of the countries in our database have varied over the period 1991 to 2016. Essentially what our regression analysis is doing is seeking to find understandable explanations – with a focus on the role of infrastructure – for the complex pattern of growth rates shown in the figure below.
Figure 12. GDP Growth Rates for 32 Developing and Emerging Market Countries 1991-2016 Source: Tusk Advisory Analysis, using the data set extracted from the World Bank’s World Development Indicators (WDI) database (2017).
Cambodia, 13.3%
Indonesia, -13.1%
Iran, Islamic Rep., -6.6%
Myanmar, 13.7%
Papua New Guinea, 18.2%
Singapore, 15.2%
-20%
-15%
-10%
-5%
0%
5%
10%
15%
20%
Argentina BangladeshBrazil CambodiaCentral Europe and the Baltics ChileChina ColombiaEgypt, Arab Rep. Hong Kong SAR, ChinaHungary IndiaIndonesia Iran, Islamic Rep.Lao PDR MalaysiaMexico MyanmarPacific island small states PakistanPapua New Guinea PeruPhilippines PolandRussian Federation SingaporeSouth Africa Sri LankaSub-Saharan Africa (excluding high income) ThailandTurkey Vietnam
China, 14.2%
Russia, -14%
Argentina, -10.9%
Russia, -7.8%

Chapter 4 | The Determinants of Economic Growth in Emerging Markets
29
THE IMPACT OF INDONESIA’S INFRASTRUCTURE DELIVERY
4.2 Regression Results Our main econometric results are as follows: Table 3. Regression Results for the 32 Countries' GDP Growth (1990-2016)
Multiple Regression for GDP Growth *100 R-Square
Adjusted R-square
Std. Err. of Estimate Summary
0.56 0.32 0.31 Regression Table Coefficient Constant 5.44** Population growth (annual %) 0.28 General government final consumption expenditure (% of GDP) -0.16** Gross fixed capital formation (% of GDP) 0.15*** Foreign direct investment, net inflows (% of GDP) 0.09* High-technology exports (% of manufactured exports) -0.02*
Inflation, GDP deflator (annual %) -0.00** Manufacturing, value added (% of GDP) 0.07* Services, etc., value added (% of GDP) -0.07*** Asian Financial Crisis -3.75*** Global Financial Crisis -3.74***
Note: * denotes significance at 95% level, ** at 99% level and *** at 99.9% level Source: Tusk Advisory Estimates, 2018 Overall, the regression equation we have tested explains more than 30% of the variance in real GDP growth for the group of countries we have selected. This is an acceptable level for large pooled cross-sectional panel data. All the variables listed above were found to be statistically significant at the 95% confidence interval (t-Value > 2), except population growth. Gross Fixed Capital Formation (GFCF) was the most significant variable in explaining variance in growth in real GDP, with a t-Value > 7. GFCF, foreign direct investment and value added in manufacturing all, as expected, make an important contribution to economic growth. The Asian and Global Financial crises are shown to have had a strong negative impact on growth. Large government expenditures, as expected, also have a negative impact, with excessive spending on bureaucracy diverting resources from productive use. Inflation also has a negative influence. Countries in this group (of developing and emerging markets) that have concentrated on the development of high-technology exports and development of the services sector may have done so at the expense of short-term growth through resources, agriculture or manufacturing industries, by diverting resources from these activities (although hopefully laying the foundations for future growth).

Chapter 4 | The Determinants of Economic Growth in Emerging Markets Chapter 1 | Why Infrastructure Investment Matters
30
THE IMPACT OF INDONESIA’S INFRASTRUCTURE DELIVERY
For the three main drivers of growth, we have the following range of coefficient estimates at the 95% level. Table 4. Coefficient Estimates of the Three Main Drivers of Growth
Regression Table Coefficient (Confidence Interval 95%)
Lower Upper Gross fixed capital formation (% of GDP) 0.10 0.19 Foreign direct investment, net inflows (%) of GDP)
0.04 0.13
Manufacturing, value added (% of GDP) 0.02 0.11
Source: Tusk Advisory Estimates, 2018
4.3 Caveats The coefficients estimated above provide us with a useful method whereby we can explore the impact of different policy changes. However, a variety of caveats should be noted. First, we have not proven causation. Regressions such as those undertaken here demonstrate a strong relationship between growth and the various explanatory variables we have used. But it is possible that some the growth we observe was in fact the result of other influences, and the improvements in explanatory variables – such as investment, FDI, improvement in manufacturing performance – were themselves enabled by this growth. However, a variety of studies have sought to test for causation and most of them have concluded that the direction of influence is in fact from investment and productivity improvements to growth. 13 In any case, infrastructure is needed either way, to drive growth or to support growth which is initiated by other stimuli. Second, the period we have been examining has been a turbulent one, with three financial crises (Asian, South American and Global), and associated violent swings in global economic management. In particular, the Global Financial Crisis (GFC) was preceded by a period of excessive leverage, followed first by emergency monetary easing on a global scale and then by periods of austerity in various countries. These external influences have, of course, had an impact on the growth of all the countries in our sample, to differing extents. Third, this work utilises relatively simple econometrics. The use of a Computable General Equilibrium (CGE) model of the type utilised by Irawan et al. (2012) has potential to provide further insights into how the dynamics of the Indonesian economy work, and may also be useful in exploring the expected timing pattern for impacts such as those we highlight below.
13 This literature dates from the pioneering work of Alicia Munnell (1992), who analysed the criticisms of Aaron, Jorgenson, Hulten, Schwab, Tatom and others. She observed that the time lag between investment and subsequent impact was hard to determine and that this was a reason why such authors find a misspecification of regression equations. Although she recognised that there were impacts in both directions – output increased the need for investment, while investment drove output – she observed that “this mutual influence can exist without necessarily tainting the coefficient on … capital …. in estimated production functions”. Previously Eberts and Fogarty (1987) had found causation running in both directions using public and private investment data from 1904 to 1978 for 40 metropolitan areas. More recent work includes that of Rousseau and Vuthipadadom (2005), who used vector autoregressive models to show that financing of investment had a causal effect on growth in ten Asian economies.

Chapter 4 | The Determinants of Economic Growth in Emerging Markets
31
THE IMPACT OF INDONESIA’S INFRASTRUCTURE DELIVERY
4.4 Impact of the Policy Stimuli We can use the coefficients reported above, along with the level of each of the explanatory variables taken from the WDI database, to estimate the impact of a particular change in each of the variables. We focus on four particular influences to estimate the likely impact of the policy changes described in Chapter 2. These are fixed capital investment, foreign direct investment (FDI), manufacturing value added and the overall cost of government. In the table below, we estimate the growth stimuli for the $103.44 billion of investment in projects which are currently being constructed or have been completed, and for the US$342.39 billion PSN programme as a whole. For the purposes of this illustration, we have calculated an expected FDI share of the programmes as US$42.83 billion and US$120.78 billion respectively.14 It is hard to attribute a particular part of the improvement in manufacturing productivity which is anticipated to these programmes, but we have taken the conservative estimate of a 20% improvement for the whole programme and 5% for the immediate projects. Finally, it is again hard to pin down exactly how far the cost of government might be reduced by the policy changes now under way. However, we have taken a conservative estimate of 5% for the immediate changes and 10% in the longer term. Table 5. Estimated Growth Stimuli from Immediate Projects and Full Programme
Immediate Projects
2016 level
%GDP
Stimulus US$ bn
% change
%GDP Growth Impact
Central Low High
Fixed Capital Investment
32.57 103.44
11.10 1.61% 1.16% 2.06%
FDI 0.40 42.83 4.59 0.40% 0.20% 0.61% Manufacturing Value Added
20.51 5 1.03 0.07% 0.02% 0.11%
Cost of Government
9.45 -5 -0.47 0.07% 0.10% 0.05%
TOTAL 2.16% 1.48% 2.83%
Full Programme 2016 level
%GDP
Stimulus US$ bn
% change
%GDP Growth Impact
Central Low High
Fixed Capital Investment
32.57 324.39
36.73 5.34% 3.85% 6.83%
FDI 0.40 120.78 12.96 1.14% 0.56% 1.71% Manufacturing Value Added
20.51 20 4.10 0.27% 0.08% 0.45%
Cost of Government
9.45 -10 -0.94 0.15% 0.20% 0.09%
TOTAL 6.89% 4.69% 9.09% Note: 95% confidence interval Source: Tusk Advisory Estimates, 2018
14 Details in Technical Annex.

Chapter 4 | The Determinants of Economic Growth in Emerging Markets Chapter 1 | Why Infrastructure Investment Matters
32
THE IMPACT OF INDONESIA’S INFRASTRUCTURE DELIVERY
Taken as a whole, this procedure estimates a 2.16% impact on economic growth from the projects which are under construction or have been completed, and a 6.89% impact on growth from the whole programme. The ‘Central’, ‘Low’ and ‘High’ estimates reported in the table reflect the 95% confidence interval of the coefficient estimates. That is, given the variance in the data, there is a 95% chance that the ‘correct’ estimates lie in this range. So, at this level of confidence, we can say that the likely growth impact of the immediate projects will be between 1.48% and 2.83%, and of the whole programme from 4.69% to 9.09%. The precise timing of these two impacts is indeterminate, and of course the impact of the full programme will be spread out over many years. A proportion of the impact – for example the improvement to productivity and, hopefully, the reduction to the cost of government – could be expected to persist, and thus recur in future periods. However, the extent to which the full benefits of the investments made in this period will in fact be realised into the long term will depend on a variety of reinforcing policies yet to be developed. Nevertheless, we assume that the build-out of the projects which are currently under construction will be complete by 2019, with the impact phased in over the subsequent five years. This will raise the GDP growth rate to just over 7% by 2023, and add just under US$400 billion to GDP by 2030. The precise pattern of the increases which will occur in GDP growth from the larger programme are hard to predict as this depends on how quickly the overall investment can be realised, but we have taken the conservative approach of assuming that half of the remaining programme can be implemented in the four years 2020-2023, with the impact phased over the period 2024-28.15 This would add a further US$275 billion to GDP by 2030. The overall investment (of > US$220 billion) would add a combined total of US$673 billion to GDP by 2030, to bring Indonesia’s GDP to around US$2.65 trillion (compared to the current OECD estimate without the impact of the new investment of US$1.98 trillion). These impacts can be seen in the following graph:
Figure 13. Estimated Long-term Impact of Undergoing Infrastructure Investment on Growth of Indonesia Source: Tusk Advisory Estimates, 2018
15 The impact of the second phase is also assumed to be 20% lower than the first phase, to allow both for the earlier projects being those that were prioritised as having higher impact, and the fact that as infrastructure improves the value of incremental investment is less.
'Business as usual' (OECD), US$1,981 billion
With US$103.44 bn investments,
US$2,379 billion
With additional US$119 bn, US$2,654 billion
1,000
1,500
2,000
2,500
3,000
2017 2018 2019 2020 2021 2022 2023 2024 2025 2026 2027 2028 2029 2030
GD
P U
S$ b
illio
n, c
onst
ant
2017
pri
ces

Chapter 4 | The Determinants of Economic Growth in Emerging Markets
33
THE IMPACT OF INDONESIA’S INFRASTRUCTURE DELIVERY
Based on the scenario above, our analysis shows an increase in the growth rate to 7.2% by 2023, peaking at 9.5% on 2028, with technical correction to 9.3% by 2030. The full picture of these growth rate estimates can be seen in the figure below:
Figure 14. Estimated Long-term Impact of Undergoing Infrastructure Investment on Indonesia Growth Rate Source: Tusk Advisory Estimates, 2018 These estimates of the possible impact on Indonesian economic growth from the infrastructure programme are dependent on the projects under construction being completed in a timely fashion, and in any case by their target dates, and the relevant projects in the next phase being expedited effectively before the end of 2023. The impact is also dependent on the projects, once constructed, being maintained adequately. It is also assumed that State-Owned Enterprises that are constructing the various projects assigned to them with a promise of capital injection from the government continue to be financially supported and that all of the government agencies involved in coordinating, facilitating and fast-tracking implementation of the priority and strategic projects continue to be funded and empowered. In addition, it is assumed that there will be no natural disasters that adversely impact the continued construction of the current phase and that at least 50% of the balance are constructed and completed by their respective due dates. Achievement of the estimated growth target also requires that macroeconomic management continues to facilitate growth, and that no policy actions are taken which endanger this growth. In particular, it is important that policy changes by the Ministry of Energy and Mineral Resources do not reduce the bankability of the independent power producing projects. We have assumed that this programme will continue its delivery schedule with better regulatory support from the Ministry and the state power utility.Finally, the estimates assume that use of the constructed infrastructure is operationalised as soon as it is completed and that all feasible actions are taken to maximise its effective use. These expected growth rates should not come as a surprise, given the history of Indonesia and its Asian neighbours. In this report, we have demonstrated the close relationship between infrastructure investment and economic growth. This relationship is reflected in
5.8% 5.8% 5.7% 5.7% 5.6% 5.5% 5.4% 5.3% 5.2% 5.1% 5.0% 4.9% 4.8%
7.6% 7.5% 7.4% 7.3% 7.2% 7.1% 6.9%
5.8% 5.8% 6.1% 6.5%
6.9% 7.2%
8.1% 8.4%
8.8% 9.2%
9.5% 9.4% 9.3%
0%
2%
4%
6%
8%
10%
12%
2018 2019 2020 2021 2022 2023 2024 2025 2026 2027 2028 2029 2030
Esti
mat
ed G
row
th R
ate
%

Chapter 4 | The Determinants of Economic Growth in Emerging Markets Chapter 1 | Why Infrastructure Investment Matters
34
THE IMPACT OF INDONESIA’S INFRASTRUCTURE DELIVERY
the experience of Indonesia, China, India, Malaysia and Singapore in the 1991-1996 period, as shown in the following table: Table 6. Relationship between Infrastructure Investment and Economic Growth in Indonesia, China, India, Malaysia and Singapore (1991-1996)
1991-1996 Average GFCF % Average GDP Growth % Indonesia 32.4% 7.2%
China 39.8% 11.9% India 26.1% 5.5%
Malaysia 39.8% 9.6% Singapore 34.7% 8.5%
Source: Tusk Advisory Analysis of WDI data In that period China, which achieved GFCF of nearly 40%, achieved an average GDP growth rate of nearly 12%. Inspection of the table shows that those countries that invested most grew fastest. Indonesia in that period achieved an average growth rate of 7.2%. The same pattern can be found in more recent years, as shown in the table below: Table 7. Relationship between Infrastructure Investment and Economic Growth in Indonesia, China, India, Malaysia and Singapore (2000-2014)
2000-2014 Average GFCF % Average GDP Growth % Indonesia 28.0% 5.3%
China 42.8% 9.8% India 35.7% 7.0%
Malaysia 23.5% 5.1% Singapore 26.6% 5.8%
Source: Tusk Advisory Analysis of WDI data In the period 2000-2014, China invested even more, as a percentage of GDP, and kept its average growth rate near to 10%. India increased its investment in fixed assets to nearly 36%, and as a result achieved an average growth rate of 7%. Malaysia invested considerably less, and as a result saw its growth rate fall to around 5%. Singapore had a similar experience. Indonesia allowed its investment to fall to an average of 28% of GDP, and achieved an average growth rate of 5.3%.

Impact of Infrastructure on
Inequality and Poverty5


Chapter 5 | Impact of Infrastructure on Inequality and Poverty
37
THE IMPACT OF INDONESIA’S INFRASTRUCTURE DELIVERY
5.1 Literature on Growth and Inequality
he recent literature on the effects of growth on inequality and poverty dates from Barro’s (1999) study. This study provides examples of how inequality changes in response to economic development: that it first increases then decreases, and also shows that reducing inequality improves growth in poor/ developing countries.
This study was followed by Banerjee and Duflo (2000), who identified an ‘inverted U-shape’ where changes in inequality (in any direction) reduced growth in the next period, but had positive impacts later. Banerjee’s findings were later confirmed by Zhang and Wan (2008) using data on China. For Indonesia, our view is that the trend will be upwards, partly because of the additional land reforms that the Jokowi Administration has pursued actively since 2015. As of December 2017, the government has already issued over 4 million land titles and it is expected that by the end of 2019, the total land titles issued will be approximately 21 million. Almost all international studies on the impact of land reforms, where land titles have been issued, point to a marked reduction in poverty.16 Klasen (2005) discussed how several non-income factors seem to be important for policies that address poverty and inequality, such as education, health, gender discrimination and popular participation in decision making. His work on Bolivia contributed to international understanding of how income growth is associated with the non-income growth of poor-income groups and how pro-poor growth strategies benefit poor-income groups in non-income dimensions. The Bolivian case study highlights how policy interventions which target those who are particularly deprived in the respective dimension (such as education, nutrition and health) could be effective at reducing non-income poverty.
16 See Barraclough, Solon L. (1999), “Land Reform in Developing Countries: The Role of the State and Other Actors” (Discussion Paper No. 101, June 1999, United Nations (UNRISD)); and Deininger, Klaus, Songqing Jin and Hari K. Nagarajan (2007) ‘Land Reform, Poverty Reduction and Economic Growth: Evidence from India’ (Policy Research Working Paper no. WPS 4448. World Bank).
T

Chapter 5 | Impact of Infrastructure on Inequality and Poverty Chapter 1 | Why Infrastructure Investment Matters
38
THE IMPACT OF INDONESIA’S INFRASTRUCTURE DELIVERY
DFID (2009) suggested the idea of controlling the initial inequality of assets such as land and education to improve growth by utilising asset ownership as collateral for access to financial market. Their study suggested that controlling land and education can be effective in reducing asset inequality. Increasing inequality has been experienced recently by many countries, including developed ones (Vieira, 2012). Ravallion’s (2001) study on the experience of developing countries in the 1980s and 1990s provides a detailed analysis of the impact of growth on inequality. Some studies using cross-country data have struggled to find a clear unidirectional link between growth and inequality (for example, Ravallion 2007), perhaps because of the many other influences which influence inequality more directly. More recent work includes Lorenzi (2016), who used a detailed international survey to demonstrate that economic growth increases income inequality in some cases. However, this study focuses mainly on developed countries, most notably the United States, and recognises that different results could emerge in poor or developing countries. In particular, Lorenzi emphasised that to make pro-growth policies beneficial, the policies needed to be properly implemented. The study identifies several factors that facilitate both economic growth and equality, such as political freedom, property rights, social mobility education, rule of law and wealth transfer.
5.2 The Impact of Infrastructure Investment on Poverty
There is also a large international literature that aims to identify the specific role of infrastructure investment in influencing the reduction of poverty. A literature review by Brenneman and Kerf (2002) summarised evidence that basic infrastructure (energy, water and sanitation, ICT and transportation) did have a significant impact on the poorest people in society. The literature they cited demonstrates the strong positive impact of transport and energy (especially electricity) infrastructure in increasing economic opportunities for the poor via facilitating new activities or increasing productivity in industries which employ the poor, especially in the agricultural sector.

Chapter 5 | Impact of Infrastructure on Inequality and Poverty
39
THE IMPACT OF INDONESIA’S INFRASTRUCTURE DELIVERY
Ali and Pernia (2003) provided an analytical framework depicting the links between infrastructure and poverty reduction through effects on agricultural productivity, non-agricultural employment and non-agricultural productivity. They summarised relevant evidence, for example, that irrigation and electricity supply can contribute to poverty reduction. These findings were reinforced in a study by Calderón and Servén (2005), who concluded that the availability and quality of infrastructure services for the poor in developing countries had a significant positive impact on their health and/ or education, and hence on income and welfare, albeit with a time lag. Kwon’s (2005) study on Indonesia, and Balisacan and Pernia’s (2002) parallel research on the Philippines provide examples of empirical evidence of such links in the transportation sector. Kwon’s (2005a) study of the poverty impact of roads in Indonesia found that road investments improve the impact of provincial economic growth on poverty reduction with an elasticity of poverty incidence decline to growth in provincial GDP of 0.33 in good-road provinces and 0.09 in bad-road provinces. Another study by Kwon (2005b) reveals that similar effects also occurred in the People’s Republic of China (PRC). A study by Warr (2005) in Lao PDR found that road improvement can generate a positive and highly significant impact on poverty, suggesting that 13 per cent of the decline in rural poverty between 1997/1998 and 2002/2003 could be attributed to improved road access alone. Setboonsarng’s (2006) study provides evidence that in poor, agriculture-focused, rural areas of Indonesia, transport infrastructure lowers the costs of inputs and facilitates access to credit facilities, extension services and output markets with better prices. The benefits of transport infrastructure enable increased productivity of farm and non-farm activities and further diversification into higher value products.
In other work, a 1% increase in irrigation was estimated to lead to a 0.31% rise in the incomes of the poor (Balisacan and Pernia, 2002). Furthermore, in PRC, Fan et al. (2002) estimated an elasticity of 0.41, implying that a 1% increase in irrigation is associated with a 0.41% increase in agricultural output per worker and 1.13% drop in poverty incidence. Fan et al. (2002) also estimated a strong impact of electricity investment on poverty, showing that for every 10,000 Yuan spent for development of electricity, there were 2.3 persons brought out of poverty. Other reports have highlighted that implementation difficulties associated with electrification, for example extremely low incomes, lack of credit opportunities and low potential for

Chapter 5 | Impact of Infrastructure on Inequality and Poverty Chapter 1 | Why Infrastructure Investment Matters
40
THE IMPACT OF INDONESIA’S INFRASTRUCTURE DELIVERY
agricultural productivity improvement, can prevent the poorest from obtaining economic benefit from electrification (Ali and Pernia, 2003). A recent study by Yusuf and Sumner (2015) highlighted implementation difficulties in Indonesia, given weak national indicators for poverty, food prices and wages of farmers. Several Indonesian studies have nevertheless shown that infrastructure reduces poverty. Lestari (2008), using a data series for Indonesia from 1976-2006, showed that infrastructure spending in Indonesia had a positive impact in reducing poverty headcount, although relatively modest. Nugraheni and Priyarsono’s (2012) study, using panel data from 200 regencies/ cities in 2006-2009, also estimated that infrastructure spending, represented by ratio of electrification, clean water accessibility and road supply, had a significant positive impact on poverty level.
5.3 New Empirical Estimates The literature summarised above provides considerable evidence that both growth and infrastructure are associated with reductions in both inequality and poverty. Following a similar methodology to that reported in Chapter 4, we therefore explored the determinants of inequality and poverty in the developing and emerging market countries over the period 1990 to 2016. Our data set was extracted from the World Bank ‘World Development Indicators’ (WDI) database, and utilised data for 25 countries.17 We performed two regression analyses, using as dependent variables the Gini index18 and a poverty level of US$3.20 per day (2011 PPP, % of population), of relevant explanatory variables which were indicated to be relevant by theory and found to be significant in preliminary model testing. The variables that we used were derived from the same initial dataset (i.e., the list of potential variables to be tested in preliminary model testing) that we used for the regression analysis of growth in Chapter 4.
17 Cambodia, Central Europe and the Baltics, Hong Kong, People’s Republic of Korea, Pacific Islands, Singapore and sub-Saharan Africa were excluded from the analysis because no poverty or inequality data for these countries is reported in the WDI database. Enhancements and adjustments to the data for other countries are reported in the Technical Annex.
18 The Gini Index is a measure of the statistical dispersion of the income distribution across a nation. The measure was developed by the Italian statistician and sociologist Corrado Gini and published in his 1909 paper ‘Concentration and dependency ratios’. A Gini Index of unity (one) implies that one person has all the income or wealth, while a Gini Index of zero implies equal distribution across all citizens. In OECD countries, in the late 20thcentury, the Gini Index varied between 0.24 (Slovenia) and 0.49 (Chile) (see OECD (2012)). Indonesia’s estimated Gini Index increased from about 0.33 to about 0.40 between 1990 and 2016.

Chapter 5 | Impact of Infrastructure on Inequality and Poverty
41
THE IMPACT OF INDONESIA’S INFRASTRUCTURE DELIVERY
5.3.1 Impact on Inequality As with the growth regressions reported in Chapter 4, we focused on the main drivers of growth to explore their impact on inequality, as reflected in the Gini Index. The main regression results are shown below: Table 8. Regression Results for Gini Index (World Bank Estimate)
Multiple Regression for GINI index (World Bank estimate) Summary
R-Square Adjusted R-
square Std. Err. Of
Estimate
0.09 0.08 8.56
Regression Table Coefficient
Constant 36.33*** General government final consumption expenditure (% of GDP) 0.59*** Gross fixed capital formation (% of GDP) -0.04 Foreign direct investment, net inflows (% of GDP) -0.08 Manufacturing, value added (% of GDP) -0.04
Note: * denotes significance at 95% level, ** at 99% level and *** at 99.9% level Source: Tusk Advisory Estimates, 2018 There are, of course, many other factors which explain the inequality which exists in a particular country. As a result, the R2 for this regression is relatively low and the relevant variables exhibit quite low significance. However, the coefficients on the variables we have selected still give us an indication of the likely impact of changes to these variables on inequality. All four have the expected sign – i.e., investment and productivity improvements are shown to decrease inequality, while a larger size of government is detrimental to inequality. Reducing the latter frees up resources which can then be used to improve the incomes of poorer citizens.

Chapter 5 | Impact of Infrastructure on Inequality and Poverty Chapter 1 | Why Infrastructure Investment Matters
42
THE IMPACT OF INDONESIA’S INFRASTRUCTURE DELIVERY
Following the procedure adopted to investigate the relationship between the infrastructure programme and growth, we have carried out similar computations in the table below, both for the projects which are under construction or have been completed (US$103.44 billion) and for the full (US$342.39 billion) programme. Table 9. Estimated Immediate Projects and Full Programme Effect on Inequality
Immediate Projects
2016 level
%GDP
Stimulus US$ bn
% change
%GDP Inequality Impact
Central High Low
Fixed Capital Investment
32.57 103.44 11.10 -0.40% -1.71% 0.91%
FDI 0.40 42.83 4.59 -0.38% -1.23% 0.48%
Manufacturing Value Added
20.51
5 1.03 -0.05% -0.18% 0.09%
Cost of Government
9.45
-5 -0.47 -0.28% -0.21% -0.35%
TOTAL -1.10% -3.33% 1.12%
Full Programme 2016 level
%GDP
Stimulus US$ bn
% change
%GDP Inequality Impact
Central High Low
Fixed Capital Investment
32.57 342.39 36.73 -1.32% -5.66% 3.01%
FDI 0.40 120.78 12.96 -1.07% -3.48% 1.35%
Manufacturing Value Added
20.51
20 4.10 -0.18% -0.71% 0.35%
Cost of Government
9.45
-10 -0.94 -0.55% -0.41% -0.70%
TOTAL
-3.13% -10.26% 4.00%
Note: 95% confidence interval Source: Tusk Advisory Estimates, 2018 The table shows that the immediate projects may knock some 1.1 points off the Gini Index for Indonesia, while the full programme might be expected to knock about 3 points off. This represents about 2.8% and 7.8% of the current Gini Index (which was estimated to be around 40 points in 2016). However, as emphasised in the literature summarised above, such a beneficial effect does depend on the projects being implemented in a way which does indeed improve the welfare of poorer people (as the government clearly intends).

Chapter 5 | Impact of Infrastructure on Inequality and Poverty
43
THE IMPACT OF INDONESIA’S INFRASTRUCTURE DELIVERY
5.3.2 Impact on Poverty For poverty, we followed a similar procedure. The regression results are presented below. Table 10. Regression Results for Poverty Headcount Ratio (at US$3.20 a Day)
Multiple Regression for Poverty headcount ratio at US$3.20 a day (2011 PPP) (% of population) Summary
R-Square Adjusted R-square
Std. Err. of Estimate
0.69 0.69 14.78
Regression Table Coefficient
Constant 13.91* Population growth (annual %) 12.39*** Exports of goods and services (% of GDP) -0.32*** General government final consumption expenditure (% of GDP) 0.79*** Gross fixed capital formation (% of GDP) -0.46 Foreign direct investment, net inflows (% of GDP) 0.27 High-technology exports (% of manufactured exports) -0.38*** Manufacturing, value added (% of GDP) -0.20 Asia 40.62***
Note: * denotes significance at 95% level, ** at 99% level and *** at 99.9% level Source: Tusk Advisory Estimates, 2018 Overall, the regression equation we have tested explains nearly 70% of the variance in poverty (poverty headcount ratio at US$3.20 a day, 2011 PPP, % of population) for the group of countries we have selected.19 In part, this is because we have included a dummy variable for Asia, where poverty was greater, especially at the beginning of the period, than in the (predominately South American) other countries in our database. All the variables listed above, except FDI, were found to be statistically significant at the 99% confidence level (t-Value >2 in absolute terms). High population growth has a detrimental impact on poverty. As expected, improvements in economic performance and infrastructure investment are associated with reductions in poverty headcount. Exports are shown to be beneficial. The other two variables which have a strong positive impact in reducing poverty are Gross Fixed Capital Formation (GFCF) – our proxy for infrastructure investment – and manufacturing value added. Further research, beyond the scope of this report, is needed on other factors with potential to reduce poverty (such as good implementation of poverty reduction policy, local action and empowerment of the poor) and mechanisms to ensure that investment has a pro-poor focus.
19 This poverty level of US$3.20 a day is an international standard used by the World Bank and others to make comparison between countries. In 2015, as recorded in the WDI data, Brazil had a poverty level of 9.3%, while Chile had a poverty level of 3.1%. Indonesia, in contrast, is recorded as having 33.80% of its population in poverty on this basis, also in 2015.

Chapter 5 | Impact of Infrastructure on Inequality and Poverty Chapter 1 | Why Infrastructure Investment Matters
44
THE IMPACT OF INDONESIA’S INFRASTRUCTURE DELIVERY
Carrying out the same computations as for growth and inequality reveals the following results: Table 11. Estimated Immediate Projects and Full Programme Effect on Poverty
Immediate Projects
2016 level
%GDP
Stimulus US$ bn
% change
%GDP Poverty Impact
Central High Low
Fixed Capital Investment
32.57 103.44 11.10 -5.07% -7.48% -2.65%
FDI 0.40 42.83 4.59 1.24% -0.30% 2.78% Manufacturing Value Added
20.51 5 1.03 -0.21% -0.46% 0.05%
Cost of Government
9.45 -5 - 0.47 -0.38% -0.22% -0.53%
TOTAL -4.41% -8.46% -0.36%
Full Programme 2016 level
%GDP
Stimulus US$ bn
% change
%GDP Poverty Impact
Central High Low Fixed Capital Investment
32.57 342.39 36.73 -16.77% -24.76% -8.79%
FDI 0.40 120.78 12.96 3.50% -0.84% 7.85% Manufacturing Value Added
20.51 20 4.10 -0.83% -1.85% 0.19%
Cost of Government
9.45 -10 -0.94 -0.75% -0.43% -1.07%
TOTAL -14.85% -27.89% -1.81% Note: 95% confidence interval Source: Tusk Advisory Estimates, 2018 Properly implemented, we might therefore expect the immediate projects to contribute a reduction of 4.41%, while the full programme may reduce poverty by some 14.85%. At a poverty level of US$3.20 per day, this would reduce Indonesia’s poverty rate from the latest estimated level of 31.4% (2016) to 27% and 17% respectively. However, Indonesia’s national poverty line is much lower than US$3.20 per day. In 2016, the national level was set at US$0.92 per day,20 on which basis Indonesia’s poverty rate has been estimated recently to be 10.9%.21 Applying the same percentage effect as we have estimated above to this lower estimate, the implied reduction in poverty from the projects which have been completed or under construction would be 1.4%, reducing measured poverty to 9.5%. If in addition half of the remaining programme were to be implemented, this could reduce the national poverty measure by a little over 3%, bringing it down to below 8%.
20 This national poverty line is defined as the expenditure required to obtain 2,100 calories per day, along with a small amount for other basic household items. In 2016, this rate was IDR 372,114/month in cities, which equated (at 2016 exchange rates) to US$0.96/day, and lower in rural areas. Source: National Statistics Office ‘Garis Kermiskinan Menurut Provinsi, 2013-2017’.
21 World Bank (2017) Country Poverty Brief: East Asia and Pacific: Indonesia, available at http://databank.worldbank.org/data/download/poverty/B2A3A7F5-706A-4522-AF99-5B1800FA3357/9FE8B43A-5EAE-4F36-8838-E9F58200CF49/60C691C8-EAD0-47BE-9C8A-B56D672A29F7/Global_POV_SP_CPB_IDN.pdf.

Chapter 5 | Impact of Infrastructure on Inequality and Poverty
45
THE IMPACT OF INDONESIA’S INFRASTRUCTURE DELIVERY
These effects are illustrated in the figure below:
* At 2011 Purchasing Power Parity (PPP) ** Converted from IDR using average IDR/US$ exchange rate for 2016 Figure 15. The Impact of Infrastructure Programmes on Poverty Source: Tusk Advisory Estimates, 2018
31.4%
27%
21.8%
10.9% 9.5% 7.7%
0
5
10
15
20
25
30
35
International Poverty Line: US$3.20/day*
National Poverty Line:US$0.92/ day**
Base, without Infrastructure Programme
With Completed and Under-Construction Projects, achieved by 2023
With Half of the Remaining Programme, achieved by 2030
10.9%


Conclusion
47
THE IMPACT OF INDONESIA’S INFRASTRUCTURE DELIVERY
Conclusion
his report has demonstrated the crucial role played by infrastructure in accelerating economic growth and in reducing poverty and inequality. It has also outlined the additional budget allocations, reforms to institutional structures, and introduction of innovative financing that have been used to accelerate
infrastructure delivery in Indonesia. The difficulty faced by Indonesia in the past has been that planned infrastructure has not been implemented. Recognising this, the Jokowi administration has increased the budget for the Ministry of Public Works and Housing by over 60% from 2014 to 2015, provided cash injections to infrastructure-related State-Owned Enterprises and implemented numerous other reforms. As a result, Indonesia is currently constructing over US$100 billion of infrastructure projects, and has plans for US$240 billion more. Our survey of international and Indonesian literature sets out existing evidence which shows clearly the link between infrastructure and growth, inequality and poverty. We have reinforced this evidence by providing new empirical estimates based on panel data for a large sample of emerging market and developing countries. These estimates suggest that the infrastructure programme already underway will put Indonesia on a higher growth trajectory – with expected growth rates in excess of 7% by 2023 – and that if at least half of the remaining plans for infrastructure are implemented in the early part of the next decade, this growth rate could increase to over 9% by 2030. Moreover, the impact of infrastructure investment on inequality and poverty reduction is also significant, with this implementation estimated to knock some two points off the Gini index and reduce poverty, based on the national poverty standard, to around 8% While the government’s delivery track record to date has been impressive, these achievements have predominantly been on the strength of the government budget channelled via a number of State-Owned Enterprises, some of which are cash constrained. Continuation of budget allocations on the scale which have been provided for the current phase is currently constrained by the government’s inability to raise its target tax revenue, and by laws which put a ceiling on the government budget deficit at 3% of GDP. These problems mean that alternative funding strategies need to be developed, a matter the government is currently addressing. Going forward, it is therefore imperative that the government continues to develop effective ways to fund the relevant SOEs as well as harnessing the financial, management and technological capabilities of the private sector, both to ensure the current build-out continues to its targeted completion date of 2019/ 2020 and also to complete the other portions of the government’s priority and strategic projects by the delivery targets. In the recent past, the government has actively encouraged some of its SOEs to securitise the future revenue from their more established projects, examples being that the government’s largest public listed toll road company, PT Jasa Marga, raised IDR 2.6 Trillion through Indonesia’s very first Future Revenue Based Security (FRBS) and the issuance of rupiah denominated bonds on the London Stock Exchange. Further asset recycling through the use of Limited Concession Schemes (LCS) and other mechanisms should also be explored, as it can have a considerable role to play in solving future funding constraints.
T


References
49
THE IMPACT OF INDONESIA’S INFRASTRUCTURE DELIVERY
References
Ali, I. and E. M. Pernia (2003) ‘Infrastructure and Poverty Reduction – What is the Connection?’ (ERD Policy Brief Series, Economics and Research Department, Number 13, ADB).
Anwar, N., A. J. Mirdad and H. Pujianto (2013) ‘Influence of Infrastructure, Investment and Human Resource to the Regional Economics Growth’ (International Proceedings of Economics Development and Research, Vol. 67: 45-49).
Aschauer, D. (1989) ‘Is Public Expenditure Productive?’ Journal of Monetary Economics 23, 177-200.
Asra, A. (2000) ‘Poverty and Inequality in Indonesia: Estimation, decomposition and key issues’ (Journal of the Asia Pacific Economy, Volume 5 (1/2) 2000: 91-111).
Balisacan, A. M., and E. M. Pernia (2002) ‘Probing Beneath Cross- National Averages: Poverty, Inequality, and Growth in the Philippines.’ (ERD Working Paper Series No. 7, Economics and Research Department, Asian Development Bank, Manila).
Banerjee, A. V. and E. Duflo (2000) ‘Inequality and Growth: What Can the Data Say?’ (NBER Working Paper No. 7793, July 2000, JEL No. D31, O41, P16).
Barlow, C. and J. Hardjono (1996) ‘Indonesia Assessment 1995: Development in Eastern Indonesia’ (Institute of Southeast Asian Studies, Singapore, and Research School of Pacific and Asian Studies, Australia).
Barraclough, Solon L. (1999), “Land Reform In Developing Countries: The Role of the State and Other Actors” (Discussion Paper No. 101, June 1999, United Nations (UNRISD)).
Barro, R. J. (1999) ‘Inequality and Growth in a Panel of Countries’ (Harvard University).
Baum-Snow, Nathaniel, Loren Brandt, Vernon Henderson, Matthew Turner and Qinghua Zhang (2016) ‘Highways, Market Access and Urban Growth in China’ (SERC/Urban Programme Discussion Paper No. 200), available at http://www.spatialeconomics.ac.uk/textonly/SERC/publications/download/sercdp0200.pdf.
Bom, P. R. D. & J. Ligthart (2011) ‘Public Infrastructure Investment, Output Dynamics, and Balanced Budget Fiscal Rules’ (International Center for Public Policy Working Paper Series, at AYSPS, GSU paper1119, International Center for Public Policy, Andrew Young School of Policy Studies, Georgia State University).
Brenneman, A. and M. Kerf (2002) ’Infrastructure and poverty linkages: A literature review (mimeograph)’ (World Bank, Washington, D.C.).
Calderón, C., and L. Servén (2005) ‘The effects of infrastructure development on growth and income distribution’ (World Bank Policy Research Working Paper 3643. World Bank, Washington, D.C.).
Calderón, C., Moral-Benito, E. and Servén, L. (2011) ‘Is Infrastructure Capital Productive? A Dynamic Heterogeneous Approach’ (Policy Research Working Paper 5682, World Bank, Washington, DC).
Canning, David and Peter Pedroni (2004) ‘The Effect of Infrastructure on Long Run Economic Growth’ (Harvard, November 2004).
Chen, C., H. Zhao and Y. Zhou (2017) ‘Foreign Direct Investment and Wage Inequality: Evidence from the People’s Republic of China’ (ADBI Working Paper Series, No. 734).
Deininger, Klaus, Songqing Jin and Hari K. Nagarajan (2007) ‘Land Reform, Poverty Reduction and Economic Growth: Evidence from India’ (Policy Research Working Paper no. WPS 4448. World Bank).

References
50
THE IMPACT OF INDONESIA’S INFRASTRUCTURE DELIVERY
Eberts, Randall W. and Michael S. Fogarty (1987) ‘Estimating the Relationship between Local Public and Private Investment’ (Working Paper No. 8703, Federal Reserve Bank of Cleveland, May 1987).
Estache, Antonio, Biagio Speciale and David Veredas (2005) ‘How much does infrastructure matter to growth in Sub-Saharan Africa?’ (The World Bank, ECARES, Universite Libre de Bruxelles).
Fan, S., L. X. Zhang, and X. B. Zhang (2002) ‘Growth, Inequality, and Poverty in Rural China: The Role of Public Investments’ (Research Report 125, International Food Policy Research Institute, Washington, D.C.).
Figini, P. and Görg (2006) ‘Does Foreign Direct Investment Affect Wage Inequality? An Empirical Investigation’ (IZA Discussion Paper No. 2336).
Freeman, R.B., R. Oostendorp and M. Rama (2001) ‘Globalization and Wages’ work in progress quoted in Rama, M. (2001) ‘Globalization and Workers in Developing Countries’ (Policy Research Working Paper, No. 2958, World Bank).
Gini, C. (1909) ‘Concentration and dependency ratios’ (in Italian). English translation in Rivista di Politica Economica, 87 (1997), 769–789.
Halmos, K. (2011) ‘The Effect of FDI, Exports and GDP on Income Inequality in 15 Eastern European Countries’ (Acta Polytechnica Hungarica, Vol. 8, No. 1).
Herzer, D. and P. Nunnenkamp (2011) ‘FDI and Income Inequality: Evidence from Europe’ (Kiel Working Paper No. 1675).
Holmgren, Johan and Axel Merkel (2017) ‘Much ado about nothing? A meta-analysis of the relationship between infrastructure and economic growth’ Research in Transportation Economics 63, 13-26.
Im, H. and J. McLaren (2015) ‘Does Foreign Direct Investment Raise Income Inequality in Developing Countries? A New Instrumental Variables Approach’ (University of Virginia).
Irawan, Tony, Djoni Hartono, Ferry Irawan and Arief Anshory Yusuf (2012) ‘Infrastructure Improvement and its Impacts on the Indonesian Economic Performance’, 27 Journal of Indonesian Economy and Business 3, 293 – 302.
Ismail, Normaz Wana and Jamilah Mohd Mahyideen (2015) ‘The Impact of Infrastructure on Trade and Economic Growth in Selected Economies in Asia’ (ADBI Working Paper 553, December 2015).
Jensen, N. and Rosas, G. (2007) ’Foreign Direct Investment and Income Inequality in Mexico, 1990–2000’ (International Organization, 61(3), 467-487. doi:10.1017/S0020818307070178).
Kannan, Raj and Morris, Nicholas (2014) ‘Delivering Indonesia's infrastructure more effectively with real powers’ (Public Infrastructure Bulletin: Vol.1:Iss. 9, Article 7).
Klasen, S. (2005) ‘Economic Growth and Poverty Reduction: Measurement and Policy Issues’ (OECD Development Centre, Working Paper No. 246, DEV/DOC (2005-06).
Kwon, E. (2005a) ‘Infrastructure, Growth and Poverty Reduction in Indonesia: A Cross-Sectional Analysis.’ (Paper presented at the ADBI Workshop on Transport Infrastructure and Poverty Reduction, ADB Manila, 18–22 July 2005).
Kwon, E. (2005b) ‘Road Development and Poverty in the People’s Republic of China.’ (Presented at the ADBI Workshop on Transport Infrastructure and Poverty Reduction, ADB Manila, 18–22 July 2005).
Lestari, F. C. (2008) ‘Poverty and Government Spending for Infrastructure: Case Study on Indonesia, 1976-2006’ (Bachelor Degree Thesis, Undergraduate Program IPB, Bogor) (in Bahasa).
Liebenehm, S. (2017) ‘Temporal Stability of Risk Attitudes and the Impact of Adverse Shocks. A Panel Data Analysis from Thailand and Vietnam’ (World Development 102, pages 262-274).

References
51
THE IMPACT OF INDONESIA’S INFRASTRUCTURE DELIVERY
Lindblad, J. Thomas (2015) ‘Foreign Direct Investment in Indonesia: Fifty Years of Discourse’ 51 Bulletin of Indonesian Economic Studies 2, 217-237.
Lipsey, R.E. and F. Sjöholm (2001) ‘Foreign Direct Investment and Wages in Indonesian Manufacturing’ (NBER Working Paper 8299).
Lipsey, R.E. and F. Sjöholm (2004) ‘Foreign direct investment, education and wages in Indonesian manufacturing’ (Journal of Development Economics, Vol. 73, No. 1).
Lorenzi, P. (2016) ‘Inequality and Economic Growth’ (Springer Science+Business Media New York 2016, Soc (2016) 53:474–478).
Makmuri, A. (2017) ‘Infrastructure and inequality: An empirical evidence from Indonesia’ (Economic Journal of Emerging Markets, 9(1) April 2017, 29-39).
Maryaningsih, Novi, Oki Hermansyah and Myrnawati Savitri (2014) ‘The Role of Infrastructure on Economic Growth in Indonesia’ 17 Bulletin of Monetary, Economics and Banking 1, 55-88.
Matsuoka, A. (2001) ‘Wage Differentials among Local Plants and Foreign Multinationals by Foreign Ownership Share and Nationality in Thai Manufacturing’ (ICSEAD working paper series 2001-25).
Mo, Xiugen, Guangqing Chi, Charles Campbell (2014) ‘The Temporal and Spatial Effect of Highways on China’s Economic Growth’ 5 Journal of Business and Economics 10, 1785-1801.
Moore, J. D. and J. A. Donaldson (2015) ‘Human-Scale Economics: Poverty Reduction in North-eastern Thailand’ (International Studies Association Global South Conference 2015, Singapore Management University, 2015).
Morris, Nicholas, and Irene Tsjin (2015) ‘How to Solve Indonesia’s Infrastructure Crisis’ (East Asia Forum, 10 June), available at http://www.eastasiaforum.org/2015/06/10/how-to-solve-indonesias-infrastructure-crisis/.
Munnell, Alicia H. (1992) ‘Policy Watch Infrastructure Investment and Economic Growth’ 6 Journal of Economic Perspectives 4, 189–19.
New Zealand Department of Transport (2014) ‘Contribution of transport to economic development: International literature review with New Zealand perspectives’ (November 2014).
Nugraheni, D. and D. S. Priyarsono (2012) ‘Local Financial Performance, Infrastructure, and Poverty: An Analysis of Districts/Municipalities in Indonesia 2006–2009’ (Jurnal Ekonomi dan Pembangunan Indonesia Vol. 12 No. 2, Januari 2012: 148-167 ISSN 1411-5212) (in Bahasa).
OECD (2012) ‘Income distribution – Inequality: Income distribution – Inequality – Country tables’.
Pellegrin, S. and Sirtori, E. (2012) ‘Methodologies to Assess the Impact of Infrastructure Projects in International Development Evaluations’ (Center for Industrial Studies, Working Paper No. 02/2012).
Prasetyo, B. A., D. S. Priyarsono, and S. Mulatsih (2013) ‘Infrastructure, Economic Growth and Inequality in Indonesia Land Borders’ (Economic Journal of Emerging Markets, October 13 5(2) 99-108).
Prasetyo, R.B. (2008) ‘Inequality and Influence of Infrastructure on Economic Development’ (Bachelor of Economics Thesis, IPB, Bogor) (in Bahasa).
Prasetyo, Rindang Bangun, and Muhammad Firdaus (2009) ‘The Effect of Infrastructure on Economic Growth in Indonesia’ 2 Journal of Economic and Development Policy2, 222-236 (in Bahasa).
Ramstetter, Eric D. (2000) ‘Recent Trends in Foreign Direct Investment in Asia: The Aftermath of the Crisis to Late 1999’ (Working Paper Series Vol. 2000-02, February 2000, The International Centre for the Study of East Asian Development, Kitakyushu).
Ravallion, M. (2001) ‘Growth, Inequality and Poverty Looking Beyond the Averages’ (Word Development Journal, pages 1803-1815).

References
52
THE IMPACT OF INDONESIA’S INFRASTRUCTURE DELIVERY
Ravallion, M. (2007) ‘Inequality is Bad for the Poor, Chapter 2 in Inequality and Poverty Re-examined’ (edited by Jenkins and Micklewright, Oxford University Press, 2007).
Ray, David and Lili Yan Ing (2016) ‘Addressing Indonesia’s Infrastructure Deficit’ (52 Bulletin of Indonesian Economic Studies 1, 1-25).
Rousseau, Peter L. and Dadanee Vuthipadadorn (2005) ‘Finance, investment, and growth: Time series evidence from 10 Asian economies’ 27 Journal of Macroeconomics 1, 87-106.
Rye, S. (2016) ’Foreign Direct Investment and its effects on Income inequality: An empirical approach using instrumental variable estimation’ (University of Oslo).
Setboonsarng, S. (2006) ‘Transport Infrastructure and Poverty Reduction’ (ADBI Research Policy Brief No. 21).
Sibarani, Mauritzh H.M. (2002) ‘Contributions Infrastructure for Economic Growth in Indonesia (26 provinces in Indonesia in 1983-1997)’ (University of Indonesia Working Paper).
Suanes, M. (2016) ‘Foreign direct investment and income inequality in Latin America: a sectoral analysis’ (CEPAL REVIEW 118, pages 45-61).
Tan, H. (2000) ‘Technological Change and Skills Demand: Panel Evidence from Malaysian Manufacturing’ (Working Paper, the World Bank Institute).
Tsai, P. L. (1995) ‘Foreign direct investment and income inequality: Further evidence’ (World Development, Vol. 23, issue 3, pages 469-483).
United Kingdom Department for International Development (DFID) (2008) ‘Growth: Building jobs and prosperity in developing country’.
Van der Eng, Pierre (2009) ‘Capital formation and capital stock in Indonesia, 1950–2008’ 45 Bulletin of Indonesian Economic Studies 3, 345-37.
Velde, D. W. (2003) ‘Foreign Direct Investment and Income Inequality in Latin America: experiences and policy implications’ (Overseas Development Institute).
Vieira, S. (2012) ‘Inequality on The Rise? An assessment of current available data on income inequality, at global, international and national levels’ (World Economic and Social Survey 2013).
Warr, P. (2005) ‘Road Development and Poverty Reduction: The Case of Lao PDR’ (ADB Institute Discussion Paper No. 25).
Yanuar, R. (2006) ‘Infrastructure Development Linkages and Output Growth and Impacts to the Gaps in Indonesia’ (Master of Science Thesis, Postgraduate Program IPB, Bogor) (in Bahasa).
Yusuf, A.A. and A. Sumner (2015) ‘Survey of Recent Developments: Growth, Poverty, and Inequality Under Jokowi’ (Bulletin of Indonesian Economic Studies, Vol. 51, No. 3, 2015: 323–48).
Zhang, Y. and G. Wan (2008) ‘Inequality and Growth in Modern China’ (Oxford Scholarship Online, ISBN-13: 9780199535194).
Zhao, Y. (2001) “Foreign direct investment and relative wages: The case of China”, China Economic Review 12, pp. 40-57.

Technical Annex
53
THE IMPACT OF INDONESIA’S INFRASTRUCTURE DELIVERY
Technical Annex 1 Data and Methodology
A. Determinants of Economic Growth Our analysis is based on a ‘Solow model’ of economic growth, and, following Estache et. Al (2005), we employ a Cobb-Douglas production function where income (GDP) is a function of the effect of infrastructure capital, the productivity of human capital, technological progress and labour. Formally, we have:
GDP(t)= IK(t)α H(t)β (A(t)L(t))1-α-β ,0< α + β < 1
where GDP(t) is income in time period t, I is a composite index of the impact of various infrastructures, K is the stock of infrastructure capital, H is the stock of human capital, A is technology and L is labour. α and β are the share of income attributable to physical and human capital respectively. The parameter constraint 0 < α + β < 1 ensures decreasing returns to capital. The Index I =ϖ γ where ϖ are physical amounts of infrastructure such as km of roads, MW of electricity, water and sanitation facilities etc. and γ reflects the elasticity of the infrastructure in GDP. We are interested in finding explanations for the growth in GDP for country i in period t. The above equation suggests that this will be a function of the growth of productive capital and labour, with infrastructure of various kinds playing an important role. Better infrastructure will improve the productivity of both labour and capital. To convert this theoretical model to a form which can be estimated econometrically, we need to decide on the most appropriate procedure relevant to our dataset. We have a pooled cross-section and time series of observations from 32 developing and emerging market countries and groups of countries, and a range of investment, productivity and control variables. Following Ismail and Mahyideen (2015), we employ a Pooled Cross Section/ Time Series estimation, for which the formal specification is as follows:
ΔYit = α0 + α1ΔPOPit + α2Kit + α3ΔPRODit + α4CONTROLit + α5DUMMIES + εit Where ΔY is the annual growth in real GDP, ΔPOP is annual growth in population, K is investment in fixed capital, ΔPROD is productivity improvement, CONTROL are environmental variables such as size of government, inflation and state of technological development, and the DUMMIES capture the effects of financial crises in the period.

Technical Annex
54
THE IMPACT OF INDONESIA’S INFRASTRUCTURE DELIVERY
The variables used as proxies for these explanators, and for a variety of control variables, were as follows:
ΔY = Growth in real GDP (in constant 2010 US$) ΔPOP = annual percentage growth in population K = (1) Gross Fixed Capital Formation as a % of GDP (2) Foreign Direct Investment as a % of GDP ΔPROD = Value added in Manufacturing and Services as % GDP CONTROL = (1) General Government Final Consumption Expenditure as % GDP (2) High technology exports as % manufactured exports (3) Inflation (GDP deflator, annual %) DUMMIES = 1/0 for Asian Financial Crisis (1998) 1/0 for Global Financial Crisis (2009)
The control variables were chosen by first exploring the significance of a range of variables available in the World Development Indicators database in terms of their ability to explain differences in observed growth rates. The following is the correlation matrix between the dependent variable (growth in real GDP) and the various explanatory variables used in our final equation, using data set that is described in the next sub-chapter. Table 12. Correlation Matrix between Real GDP Growth and Other Explanatory Variables in the Equation
Correlation Matrix
I II III IV V VI VII VIII IX X XI
I 1.00 0.15 -0.34 0.31 0.06 0.04 -0.14 0.14 -0.26 -0.18 -0.19
II 0.15 1.00 -0.42 -0.14 -0.09 0.14 -0.02 -0.17 -0.36 0.04 -0.04
III -0.34 -0.42 1.00 -0.17 -0.08 0.02 0.06 0.04 0.26 0.00 0.04
IV 0.31 -0.14 -0.17 1.00 0.12 0.24 -0.04 0.38 -0.04 0.00 0.03
V 0.06 -0.09 -0.08 0.12 1.00 0.20 -0.07 -0.20 0.43 -0.02 -0.01
VI 0.04 0.14 0.02 0.24 0.20 1.00 -0.06 0.38 0.03 0.02 0.01
VII -0.14 -0.02 0.06 -0.04 -0.07 -0.06 1.00 0.08 -0.04 -0.01 -0.03
VIII 0.14 -0.17 0.04 0.38 -0.20 0.38 0.08 1.00 -0.16 0.02 -0.04
IX -0.26 -0.36 0.26 -0.04 0.43 0.03 -0.04 -0.16 1.00 -0.02 0.03
X -0.18 0.04 0.00 0.00 -0.02 0.02 -0.01 0.02 -0.02 1.00 -0.04
XI -0.19 -0.04 0.04 0.03 -0.01 0.01 -0.03 -0.04 0.03 -0.04 1.00
List of explanatory variables:
I. GDP Growth *100 II. Population growth (annual %)
III. General government final consumption expenditure (% of GDP) IV. Gross fixed capital formation (% of GDP) V. Foreign direct investment, net inflows (% of GDP)
VI. High-technology exports (% of manufactured exports) VII. Inflation, GDP deflator (annual %)
VIII. Manufacturing, value added (% of GDP) IX. Services, etc., value added (% of GDP) X. Asian Financial Crisis
XI. Global Financial Crisis Source: Tusk Advisory Analysis, 2018

Technical Annex
55
THE IMPACT OF INDONESIA’S INFRASTRUCTURE DELIVERY
Casual inspection of the table shows that the strongest correlation with economic growth is the cost of government (on a negative basis)22 followed by Gross Fixed Capital Formation (GFCF). None of the coefficients are sufficiently correlated with each other to cause problems with multicollinearity in the econometric estimation process. Tests for stability etc. also failed to identify such problems.
B. Data Sources and Adjustments The World Bank ‘World Development Indicators’ (WDI) database, for the period 1990 to 2016, annual data was used. The data may be sourced at http://databank.worldbank.org/data/reports.aspx?source=world-development-indicators. The version we used was last updated on September 14, 2017. 32 comparator countries and groups of countries were chosen, in order to focus on developing and emerging market economies. These were Argentina, Bangladesh, Brazil, Cambodia, Central Europe and the Baltics, Chile, China, Colombia, Egypt, Hong Kong, Hungary, India, Indonesia, Iran, Korea, Laos, Malaysia, Mexico, Pacific island small states, Pakistan, Papua New Guinea, Peru, Philippines, Poland, Russian Federation, Singapore, South Africa, Sri Lanka, Sub-Saharan Africa (excluding high income countries), Thailand, Turkey and Vietnam. The WDI database provides us with a wide range of possible explanatory variables. We chose relevant variables based on a combination of our knowledge of what might affect economic growth and test regressions to identify which variables had the most explanatory power within a simple linear model specification. The World Development Indicators database has significant missing data, where the relevant country has not reported this. We corrected for missing data by linear interpolation, extension of data to final and initial years, and in some cases acceptance of zero values (for example for the high-tech exports of Laos) for regression analysis on the factors of economic growth. For regression analysis on poverty and inequality, we used data on the poverty headcount ratio (with the poverty line set at US$3.20 a day, 2011 PPP) and Gini Ratio respectively. We corrected missing data from the WDI database for poverty and inequality by linear interpolation and extension of data to final and initial years. For inequality, we interpolated missing data between two available data points by applying average values; and for missing data in initial or final years, we applied the same value with the succeeding or preceding year. We also added data from other sources, i.e., World Income Inequality Database for India and Indonesia Central Bureau of Statistics (BPS) as well as Asra (2000) for Indonesia. For poverty, we applied linear interpolation in general and average values if the gap between two available data points was very wide. Seven countries/ groups of countries were excluded from both regression analyses due to unavailability of sufficient data, i.e., Cambodia, Central Europe and the Baltics, Hong Kong, People’s Republic of Korea, Pacific Islands, Singapore and sub-Saharan Africa, leaving a total of 25 countries. In order to identify the likely FDI component of the PSN programme, we took the typical share of investment in Indonesia from BKPM’s data on Foreign and Domestic Investment. The FDI share of private investment, historically, has been around 60-70%, of which we used 60% as a conservative estimate. For the under-construction and completed projects, US$71.38 billion out of US$103.44 billion are to be sourced from private sector, while for the whole programme of US$342.39 billion, US$201.3 billion would be sourced from private sector. Therefore, we estimated FDI of US$42.83 billion and US$120.78 billion for under-construction and completed projects and the whole programme respectively.
22 General Government Final Consumption Expenditure as % GDP.

Technical Annex
56
THE IMPACT OF INDONESIA’S INFRASTRUCTURE DELIVERY
For the manufacturing added value target, we used data from Berita Satu article 23 to estimate that in 2016 manufacturing industry contributed 17% of GDP. The Ministry of Industry aims to raise this value to 23% in 2019 (an improvement of 35% of the base value). Not all of this can be attributed to the infrastructure programme. We used an estimate of a 5% improvement in manufacturing value added from the projects and 20% from the programme as a whole.
C. Testing the Robustness of Empirical Estimates In order to check the robustness of the econometric model described above, we carried out various tests: 1. Removal of China from the database. The test aimed to identify whether China’s exemplary performance in the period was swamping other results or not. The results of from this test were broadly similar, but the coefficients were slightly smaller, as expected – reflecting China’s particularly strong growth response to investment and FDI stimuli. Based on this test, we kept China in the database for prediction. 2. Lag Test The test aimed to check whether a longer lag between the impact of the investments, etc., and subsequent growth would generate a better model specification. We tested a two-year and a three-year lag for this test. Based on the result of the test, we concluded that the one-year lag performed best in terms of the total variance explained, thus we used a one-year lag for prediction. 3. Prediction Test for the Whole Average In this test, we examined predictive power: how well the predicted values from the model reflected the actual outcomes for the average of the 32 countries and group of countries. Below is the graph showing comparison of the actual GDP growth (on average for all the countries) against estimated GDP growth.
Figure 16. Prediction Test for the Whole Average Source: Tusk Advisory Analysis, 2018
23 Source: Investor Daily Indonesia/ Berita Satu (January 13, 2017), ‘Industri Manufaktur’ (accessible at http://id.beritasatu.com/tajuk/industri-manufaktur/155174).
0%
1%
2%
3%
4%
5%
6%
7%
8%
1992
1993
1994
1995
1996
1997
1998
1999
2000
2001
2002
2003
2004
2005
2006
2007
2008
2009
2010
2011
2012
2013
2014
2015
2016
GDP Growth Estimated GDP growth

Technical Annex
57
THE IMPACT OF INDONESIA’S INFRASTRUCTURE DELIVERY
Although the equation does not explain everything that is driving growth as there are deviations between the estimates and outturn, the deviations between estimated and actual growth are understandable and explainable by factors external to the parameters we have examined. First, South American and some other countries experienced a problem in 2002 we have not explicitly included. In the period prior to the Global Financial Crisis in 2008, excessive leverage worldwide led to unsustainable growth levels in some countries. Post-GFC, emergency quantitative easing led to a brief expansion. From 2010 onwards, many countries introduced austerity policies and worldwide growth was sluggish at the time. 4. Prediction test for Indonesia We also tested the predictive power of the model for Indonesia data; we restricted the estimation to a sub-period of 1990 to 2008 and then examined how well the coefficients predicted subsequent growth. Below is a graph showing comparison of GDP growth of the actual Indonesia GDP growth against the estimated GDP growth.
Figure 17. Prediction Test for Indonesia Source: Tusk Advisory Analysis, 2018 Although the model tracks reasonably well in the pre-Asian Financial Crisis period around 1998, it under-predicts the (devastating) impact of the crisis on Indonesian growth. The estimated growth shows around 3%-4% growth while the actual was around minus 13%-14%.Furthermore, in the last fifteen years, based on the development of the key variables, the model would have expected Indonesia to grow at about 2% faster than it in fact did. This pattern has remained similar and worsened in the past five plus years. However, the initiatives taken by the Jokowi Government, including removing oil subsidies, restructuring budget processes, etc. – seem to have prevented further decline in the growth rate after 2014. Further work could seek to understand the reasons for the smaller response in the Indonesian case to the various stimuli. These include many of the issues which implementation teams are trying to fix – regulatory inconsistencies, land acquisition problems, poor maintenance, etc. 5. Stability Test This test checked whether dropping one or more variables affected the coefficients on other variables or not. The results show that the coefficients seem stable to the omission of a variety of variables, with coefficients for the other variables ‘picking up’ the variance that those variables previously explained.
-15%
-10%
-5%
0%
5%
10%
1992
1993
1994
1995
1996
1997
1998
1999
2000
2001
2002
2003
2004
2005
2006
2007
2008
2009
2010
2011
2012
2013
2014
2015
2016
Actual real GDP growth Estimated GDP growth

Technical Annex
58
THE IMPACT OF INDONESIA’S INFRASTRUCTURE DELIVERY
Technical Annex 2
Completed and Under-construction Infrastructure Projects We compiled and examined infrastructure projects in the PSN list that were completed or under-construction in order to estimate the impact they have on economic growth, inequality reduction and poverty reduction. The infrastructure projects consist of non-electricity programme PSN projects and electricity projects. On the list for non-electricity PSN projects, starting with 171 completed and under-construction PSN projects as of December 2017, we removed 9 projects that had no project value, 13 projects that are not considered as physical infrastructure (e.g., smelters and national border posts) and 3 projects that are unlikely to finish by 2023 (e.g., SHIA Express Railway and Waste-to-Energy projects in major cities). We have included some Special Economic Zones and other area development projects in the list where the investment covers infrastructure facilities, such as ports and power plants. As a result, 146 projects were listed for our calculation with a total estimated value of US$81.06 billion (IDR1,053.74 trillion).24 The result for non-electricity projects is shown in succeeding pull out pages. On top of the abovementioned PSN projects, we also examined the details of projects in the electricity programme. We have compiled a complete list of 140 electricity projects, of which only 64 projects had a clear estimate of project values. The project values for the remaining projects were estimated based on the average multiplier of US$ million against capacity (MW) of the power plant with similar technology/ electricity source or using available information from reliable sources in press releases, such as from Ministry of Energy and Mineral Resources (MEMR). Project values that were sourced from the 2015 database were inflated using average Indonesia CPI for 2016 and 2017 of 3.53% and 3.81% respectively.25 Based on our calculation, the total estimated value for the completed and under-construction electricity projects is US$22.38 billion (IDR290.93 trillion). The status of the electricity projects is typically presented as Commercial Operation Date with Certificate for Operational Feasibility (COD/ SLO), commissioning and construction. For our analysis, we treated COD/ SLO and commissioning projects as completed projects. The result for electricity projects is shown in the succeeding pull out pages.
24 Exchange rate used was US$1 = IDR13,000.
25 Historic CPI inflation of Indonesia on yearly basis by Inlation.eu, data is accessible at http://www.inflation.eu/inflation-rates/indonesia/historic-inflation/cpi-inflation-indonesia.aspx).

Completed and Under-construction Non-electricity Programme PSN Projects(as of December 2017)
BALI AND NUSA TENGGARA
No. Project ProvinceEst. Investment
Value (US$ million)*
1 Kalibaru Port DKI Jakarta 9232 Tanjung Priok Access Road (16.7km) DKI Jakarta 4823 Mojokerto - Surabaya Toll Road (36.3km) East Java 3834 Jatigede Dam, Sumedang, West Java West Java 371
5Development of Soekarno Hatta Airport (Including Terminal 3)
DKI Jakarta 362
6 Soreang - Pasirkoja Toll Road (11km) West Java 1167 Gempol - Pandaan Toll Road East Java 1138 Bajulmati Dam, Banyuwangi, East Java East Java 359 Nipah Dam, Madura, East Java East Java 16
10 Jakarta - Bandung High Speed Railway DKI Jakarta, West Java 4,43511 Jakarta Mass Rapid Transit North - South Corridor DKI Jakarta 3,043
12Development of Jambaran – Tiung Biru Gas Field Unitization
East Java 2,056
13 Java Integrated Industrial Port Estate (JIIPE) Industrial Area East Java 2,017
14Implementation of Integrated Light Rail Transit in Jakarta, Bogor, Depok and Bekasi Region
DKI Jakarta, West Java 1,769
15 Jakarta - Cikampek II Elevated Toll Road (64km) DKI Jakarta, West Java 1,24816 Krian - Legundi - Bunder - Manyar Toll Road (38.3km) West Java 940
17 Double Track in South JavaWest Java, Central Java, Yogyakarta and East Java
917
18 Solo - Ngawi Toll Road (90.1km) Central Java 872
19Semanan - Sunter Toll Road (20.2km) - part of the 6 routes of the DKI Jakarta
DKI Jakarta 851
20 Batang - Semarang Toll Road (75km) Central Java 85021 Cileunyi - Sumedang - Dawuan Toll Road (59km) West Java 647
22Duri Pulo - Kampung Melayu Toll Road (12.7km) - part of the 6 routes of the DKI Jakarta
DKI Jakarta 628
23 Ciawi - Sukabumi Toll Road (54km) East Java 59824 Semarang - Solo Toll Road (72.6km) Central Java 573
25Implementation of Public Railways in the DKI Jakarta Province
DKI Jakarta 565
26 Bekasi - Cawang - Kampung Melayu Toll Road (21.04km) DKI Jakarta, West Java 55427 Wilmar Serang Industrial Zone Banten 53828 Pejagan - Pemalang Toll Road (57.5km) Central Java 52629 Kendal Industrial Zone Central Java 485
30Ulujami - Tanah Abang Toll Road (8.7km) - part of the 6 routes of the DKI Jakarta
DKI Jakarta 470
31 Serpong - Balaraja Toll Road (30km) Banten 465
32Pasar Minggu - Casablanca Toll Road (9.2km) - part of the 6 routes of the DKI Jakarta
DKI Jakarta 460
JAVA
No. Project ProvinceEst. Investment Value
(US$ million)*1 Labuan Bajo Airport, Komodo Island East Nusa Tenggara 512 Titab Dam, Buleleng District, Bali Bali 383 Mandalika Special Economic Zone West Nusa Tenggara 1694 Napungete Dam East Nusa Tenggara 685 Bintang Bano Dam West Nusa Tenggara 676 Raknamo Dam East Nusa Tenggara 557 Rotiklod Dam East Nusa Tenggara 368 Tanju Dam West Nusa Tenggara 239 Development of Kupang Port East Nusa Tenggara 17
10 Mila Dam West Nusa Tenggara 8
KALIMANTAN
No. Project ProvinceEst. Investment Value
(US$ million)*1 Sentani Airport, Jayapura Papua 1132 Tangguh LNG Train-3 Project West Papua 8,0003 Morotai Special Economic Zone North Maluku 5234 Sorong Special Economic Zone West Papua 1855 Sultan Babullah Airport, Ternate North Maluku 104
MALUKU AND PAPUA
No. Project ProvinceEst. Investment Value
(US$ million)*1 Mutiara Airport, Palu Central Sulawesi 1072 Matahora Airport, Wakatobi Southeast Sulawesi 513 Morowali Special Economic Zone Central Sulawesi 5,6004 Konawe Special Economic Zone Southeast Sulawesi 5,0005 Bantaeng Special Economic Zone South Sulawesi 3,500
6Makassar - Parepare Railway (Phase I: development of West Crossing Lane of South Sulawesi)
South Sulawesi 635
7 Bitung Special Economic Zone North Sulawesi 1778 Makassar New Port South Sulawesi 1459 Palu Special Economic Zone Central Sulawesi 131
10 Kuwil Kawangkoan Dam North Sulawesi 110
11Development of a Dam and Irrigation System in Baliase Irrigation Area
South Sulawesi 103
12Prabumulih - Kertapati Railway (part of the Trans Sumatera Railway Network)
South Sulawesi 87
13 Palu - Parigi Road (83.6km) Central Sulawesi 8514 Ladongi Dam Southeast Sulawesi 6515 Lolak Dam North Sulawesi 6416 Passeloreng Dam South Sulawesi 5417 Karalloe Dam South Sulawesi 40
18Construction of Irrigation System in Gumbasa Irrigation Area
Central Sulawesi 12
SULAWESI
SUMATERA
No. Project ProvinceEst. Investment
Value (US$ million)*
1Palapa Ring Broadband in 57 Districts using Public Private Partnership (PPP) in Infrastructure Provision
National 449
2 Development of Natural Gas Pipeline Network for HouseholdsSumatera,
Kalimantan and Java203
No. Project ProvinceEst. Investment
Value (US$ million)*
33 Pandaan - Malang Toll Road (37.62km) East Java 45934 Kertosono - Mojokerto Toll Road (40.5km) East Java 42335 Serang - Panimbang Toll Road (83.6km) Banten 41036 International Airport in DI Yogyakarta Province DI Yogyakarta 40037 Cengkareng - Batu Ceper - Kunciran Toll Road (14.2km) Banten 385
38Kemayoran - Kampung Melayu Toll Road (9.6km) - part of the 6 routes of the DKI Jakarta
DKI Jakarta 380
39 Kertajati Airport West Java 378
40Sunter - Pulo Gebang Toll Road (9.4km) - part of the 6 routes of the DKI Jakarta
DKI Jakarta 378
41 Cimanggis - Cibitung Toll Road (25.4km) West Java 34842 Umbulan Drinking Water Supply System East Java 34643 Cibitung - Cilincing Toll Road (34km) DKI Jakarta, West Java 32544 Tanjung Lesung Special Economic Zone Banten 32345 Pemalang - Batang Toll Road (39.2km) Central Java 31446 Ngawi - Kertosono Toll Road (87km) East Java 29547 Pasuruan - Probolinggo Toll Road (31.3km) West Java 27348 Kunciran - Serpong Toll Road (11.2km) Banten 26849 Depok - Antasari Toll Road (21.5km) DKI Jakarta, West Java 23150 Gempol - Pasuruan Toll Road (34.2km) East Java 21351 Cinere - Jagorawi Toll Road (14.6km) DKI Jakarta, West Java 20252 Giant Sea Wall DKI Jakarta 18553 Serpong - Cinere Toll Road (10.1km) Jabodetabek 17154 Development of Ahmad Yani Airport, Semarang Central Java 16855 Leuwikeris Dam West Java 15756 Cipanas Dam West Java 11057 Karian Dam Banten 9758 Bogor Ring Road Toll Road (11km) West Java 7659 Ciawi Dam West Java 6460 Bendo Dam East Java 6061 Gondang Dam Central Java 5262 Tukul Dam East Java 5263 Tugu Dam East Java 5064 Logung Dam Central Java 4765 Gongseng Dam East Java 4066 Kuningan Dam West Java 4067 Sukamahi Dam West Java 3868 Sindang Heula Dam Banten 3769 Pidekso Dam Central Java 36
70Construction of Irrigation System in LeuwigoongIrrigation Area, Garut Regency
West Java 23
REGIONAL AND NATIONAL
*Exchange rate used was US$1 = IDR13,000
Under-construction projectCompleted projectNote:
No. Project ProvinceEst. Investment
Value (US$ million)*
1 Fatmawati Soekarno Airport, Bengkulu Bengkulu 1292 Belawan - Sei Mangkei Gas Pipe with Capacity of 75 mmscfd North Sumatera 933 Rajui Dam, Pidie District, Aceh Aceh 114 Paya Seunara Dam, Sabang, Aceh Aceh 45 Dumai Industrial Zone Riau 1,3776 Kayu Agung - Palembang - Betung Toll Road (112km) South Sumatera 1,334
7 Bakauheni - Terbanggi Besar Toll Road (140.9km) - part of the 8 routes of Trans Sumatera
Lampung 1,292
8 Pekanbaru - Kandis - Dumai Toll Road (131.5km) - part of the 8 routes of Trans Sumatera
Riau 1,247
9 Kisaran - Tebing Tinggi Toll Road (68.9km) - part of the 8 routes of Trans Sumatera
North Sumatera 1,035
10 South Sumatera Province Light Rail Transit (Metro Palembang) South Sumatera 962
11 Terbanggi Besar - Pematang Panggang Toll Road (100km) - part of the 8 routes of Trans Sumatera
Lampung 913
12 Pematang Panggang - Kayu Agung Toll Road (85km) - part of the 8 routes of Trans Sumatera
South Sumatera 776
13 Tanjung Buton Industrial Zone Riau 54014 Sei Mangkei Special Economic Zone North Sumatera 39515 Manado - Bitung Toll Road (39km) North Sumatera 394
16 Medan - Kualamanu - Lubuk Pakam - Tebing Tinggi Toll Road (62km)
North Sumatera 313
17 Palembang - Simpang Indralaya Toll Road (22km) - part of the 8 routes of Trans Sumatera
South Sumatera 254
18 Way Sekampung Dam Lampung 14119 Keureuto Dam Aceh 134
20 Medan - Binjai Toll Road (16km) - part of the 8 routes of Trans Sumatera
North Sumatera 123
21 Belitung Special Economic Zone Bangka Belitung 11522 Raden Inten II Airport, Lampung Lampung 113
23 Construction of Supporting Channel in Umpu System Irrigation Area (Way Besai)
South Sumatera 83
24 Rukoh Dam Aceh 78
25Tebing Tinggi - Kuala Tanjung (supporting the Sei MangkeiSpecial Economic Zone, part of the Trans Sumatera Railway Network)
North Sumatera 58
26 Construction of Irrigation System in Lhok Guci Irrigation Area Aceh 2327 Construction of Irrigation System in Lematang Irrigation Area South Sumatera 2128 Muara Sei Gong Dam Riau Islands 20
29 Construction of Irrigation System in Jambo Aye Kanan Irrigation Area
Aceh 18
No. Project ProvinceEst. Investment
Value (US$ million)*
1 Juwata Airport, Tarakan North Kalimantan 107
2Development of Jangkrik and Jangkrik North East Muara Bakau Field
East Kalimantan 3,500
3 Tanah Kuning Industrial Zone North Kalimantan 1,6144 Balikpapan - Samarinda (99km) East Kalimantan 7675 Ketapang Industrial Zone West Kalimantan 308
6Maloy Batuta Trans Special Economic Zone (Kalimantan Province)
East Kalimantan 200
7 Syamsuddin Noor Airport South Kalimantan 1788 Tapin Dam South Kalimantan 699 Tjilik Riwut Airport, Palangkaraya Central Kalimantan 25
10 Marangkayu Dam East Kalimantan 2111 Teritip Dam East Kalimantan 2012 Special Economic Zone Maloy Port East Kalimantan 16
SUMATERA29 projects | US$11,996 Million
4 projectsUS$237 Million
25 projectsUS$11,759 Million
COMPLETED UNDER CONSTRUCTION
KALIMANTAN12 projects | US$6,825 Million
1 projectUS$107 Million
11 projectsUS$6,718 Million
COMPLETED UNDER CONSTRUCTION SULAWESI18 projects | US$15,966 Million
2 projectSUS$158 Million
16 projectsUS$15,808 Million
COMPLETED UNDER CONSTRUCTION
JAVA70 projects | US$36,162 Million
9 projectsUS$2,801 Million
61 projectsUS$33,361 Million
COMPLETED UNDER CONSTRUCTION
BALI DAN NUSA TENGGARA10 projects | US$532 Million
2 projectsUS$89 Million
8 projectsUS$443 Million
COMPLETED UNDER CONSTRUCTION
MALUKU AND PAPUA5 projects | US$8,925 Million
1 projectUS$113 Million
4 projectsUS$8,812 Million
COMPLETED UNDER CONSTRUCTION
REGIONAL AND NATIONAL2 projects | US$652 Million
0 projectUS$0
2 projectsUS$652 Million
COMPLETED UNDER CONSTRUCTION

Completed and Under-construction Electricity Programme PSN Projects(as of December 2017)
SUMATERA52 projects | US$7,169 Million
15 projectsUS$3,025 Million
37 projectsUS$4,144 Million
COMPLETED UNDER CONSTRUCTION
KALIMANTAN13 projects | US$1,720 Million
3 projectsUS$122 Million
10 projectsUS$1,598 Million
COMPLETED UNDER CONSTRUCTION SULAWESI15 projects | US$1,316 Million
5 projectsUS$96 Million
10 projectsUS$1,220 Million
COMPLETED UNDER CONSTRUCTION
JAVA34 projects | US$14,870 Million
9 projectsUS$98 Million
25 projectsUS$14,772 Million
COMPLETED UNDER CONSTRUCTION BALI DAN NUSA TENGGARA13 projects | US$463 Million
4 projectsUS$65 Million
9 projectsUS$398 Million
COMPLETED UNDER CONSTRUCTION
MALUKU AND PAPUA12 projects | US$394 Million
1 projectUS$17 Million
11 projectsUS$377 Million
COMPLETED UNDER CONSTRUCTION
NATIONAL1 project | US$1 Million
1 projectsUS$1 Million
0 projectUS$0
COMPLETED UNDER CONSTRUCTION
No Project Province
Est. Investment Value
(US$ million)*
1 IPP Mini Hydro Lebak Tundun 8 MW Banten 18 2 IPP Mini Hydro Cikopo-2 7.4 MW West Java 17 3 IPP Mini Hydro Lebak Barang 7 MW Central Java 16 4 IPP Mini Hydro Cianten 1B 6.2 MW West Java 14 5 IPP Mini Hydro Cianten 3 5.8 MW West Java 13 6 IPP Mini Hydro Cisanggiri 3 MW West Java 7 7 IPP Mini Hydro Logawa Baseh 3 MW Central Java 7 8 IPP (AP-IP) Diesel Karimunjawa 4 MW Central Java 5 9 IPP Mini Hydro Banyumlayu 0.46 MW Central Java 1 10 IPP Steam Jawa-7 2000 MW Banten 3,028 11 IPP Steam Jawa Tengah (PPP) 950 MW Central Java 1,612 12 IPP Steam Jawa-8 (Exp Cilacap) 1000 MW Central Java 1,612 13 IPP Steam Jawa Tengah (PPP) 950 MW Central Java 1,532 14 IPP Steam Jawa-4 (Ekspansi Tj Jati B) 1000 MW Central Java 1,514 15 IPP Steam Jawa-4 (Ekspansi Tj Jati B) 1000 MW Central Java 1,514
16PLN Gas and Steam Muara Tawar Add-on 2,3,4 650 MW
West Java 699
17 PLN Gas and Steam Jawa-2 (Tj Priok) 600 MW DKI Jakarta 548 18 PLN Gas and Steam Muara Karang 500 MW DKI Jakarta 457 19 PLN Steam Lontar Exp 315 MW Banten 440
20PLN Hydro Upper Cisokan Pump Storage (FTP2) 520 MW
West Java 391
21PLN Hydro Upper Cisokan Pump Storage (FTP2) 520 MW
West Java 391
22 PLN Gas and Steam Grati 300 MW East Java 274 23 PLN Gas and Steam Jawa-2 (Tj Priok) 200 MW DKI Jakarta 183 24 PLN Hydro Jatigede (FTP2) 110 MW West Java 177
25IPP (AP- IP) Gas and Steam Grati Add-on Blok 2 150 MW
East Java 161
26 PLN Gas and Steam Grati 150 MW East Java 137 27 IPP Mini Hydro Cilaki 1B 9.69 MW West Java 22 28 IPP Mini Hydro Pusaka-1 8.8 MW West Java 20 29 IPP Mini Hydro Cibalapulang-2 6.5 MW West Java 15 30 IPP Mini Hydro Cicatih 6.4 MW West Java 14 31 IPP Mini Hydro Cibalapulang-3 6 MW West Java 14 32 IPP Mini Hydro Kalapa Nunggal 3 MW West Java 7 33 IPP Mini Hydro Pusaka-3 3 MW West Java 7 34 PLN Gas Engine Bawean 2 MW East Java 3
No. Project Province
Est. Investment Value
(US$ million)*
1 IPP Hydro Batang Toru (Tapsel) 510 MW North Sumatera 1,6682 IPP Steam Sumut-1 300 MW North Sumatera 4193 IPP Steam Bengkulu 200 MW Bengkulu 279
4PLN Gas and Steam Sumbagut-2 Peaker (Arun Ekspansi) 250 MW
Aceh 269
5 IPP Geothermal Muara Laboh (FTP2) 80 MW West Sumatera 1896 IPP Hydro Semangka (FTP2) 56 MW Lampung 90
7PLN Diesel Pulau Terluar dan Daerah Perbatasan (Sumatera) 32.6 MW
Multiprovinces 39
8 IPP (AP-Batam) Gas/Gas Engine Mobile PP Paya Pasir 75 MW North Sumatera 32
9 IPP (AP-Batam) Gas/Gas Engine Mobile PP Bangka 25 MW Bangka Belitung 19
10 IPP Hydro Pakkat 10 MW North Sumatera 16
11IPP (AP-Batam) Gas/Gas Engine Mobile PP Suge/Belitung 25 MW
Bangka Belitung 11
12 IPP Mini Hydro Batu Balai/Manna 4 MW Bengkulu 913 IPP Mini Hydro Guntung 4 MW West Sumatera 914 IPP Biogas Sungai Terlung 2 MW Bangka Belitung 615 IPP Biomass Tanjung Batu 1 MW Riau Islands 216 IPP Hydro Hasang (FTP2) 39 MW North Sumatera 6317 IPP Mini Hydro Batang Toru 3 10 MW North Sumatera 2318 IPP Mini Hydro Parluasan 10 MW North Sumatera 2319 IPP Mini Hydro Lintau I 9 MW West Sumatera 2020 IPP Mini Hydro Parmonangan 9 MW North Sumatera 20
21IPP (AP-Batam) Gas/Gas Engine Mobile PP Lampung Tarahan 100 MW
Lampung 43
22IPP (AP-Batam) Gas/Gas Engine Mobile PP Balai Pungut 75 MW
Riau 32
23 IPP Mini Hydro Sei Wampu 9 MW North Sumatera 20
24 IPP (AP-Batam) Gas/Gas Engine Mobile PP Bangka 25 MW Bangka Belitung 19
25 PLN Gas/Gas Engine Mobile PP Nias 25 MW North Sumatera 1926 PLN Gas/Gas Engine Mobile PP Nias 25 MW North Sumatera 1927 IPP Mini Hydro Aek Tomuan-1 8 MW North Sumatera 1828 IPP Mini Hydro Lae Kombih 3 8 MW North Sumatera 1829 IPP Mini Hydro Sidikalang-2 7.4 MW North Sumatera 1730 IPP Hydro Krueng Isep #1 10 MW Aceh 1631 IPP Hydro Krueng Isep #2 10 MW Aceh 1632 IPP Mini Hydro Raisan Hutadolok 7 MW North Sumatera 1633 IPP Mini Hydro Raisan Nagatimbul 7 MW North Sumatera 1634 IPP Mini Hydro Karai 7 6.7 MW North Sumatera 1535 IPP Mini Hydro Rahu 2 6.4 MW North Sumatera 1436 IPP Mini Hydro Padang Guci 6 MW Bengkulu 1437 IPP Mini Hydro Simbelin-1 6 MW North Sumatera 1438 IPP Hydro Pakkat 8 MW North Sumatera 1339 IPP Biomass Tempilang 6 MW Bangka Belitung 1240 IPP Mini Hydro Aek Sisira Simandame 4.6 MW North Sumatera 1041 IPP Biomass Gunung Batin Baru 5 MW Lampung 1042 IPP Biogas Cengkong 2 MW Bangka Belitung 643 IPP Biofuels Pegantungan 5 MW Bangka Belitung 644 IPP Mini Hydro Lubuk Sao II 2.6 MW West Sumatera 645 IPP Biogas Gunung Pelawan 1.2 MW Bangka Belitung 446 IPP Mini Hydro Induring 2 MW West Sumatera 347 IPP Biogas Karang Anyer 1 MW Jambi 348 IPP Biogas Namosialang 1 MW North Sumatera 349 IPP Biogas Pagar Merbau 1 MW North Sumatera 350 IPP Biogas Rantau sakti 1 MW Riau 351 IPP Biogas Blankahan 0.8 MW North Sumatera 252 IPP Biomass Tanjung Batu 1 MW Riau Islands 2
SULAWESI
No Project ProvinceEst. Investment
Value
(US$ million)* 1 PLN Gas/ Gas Engine Gorontalo Peaker 100 MW Gorontalo 75
2 IPP Mini Hydro Bantaeng 1 4.2 MW South Sulawesi 9
3 IPP Mini Hydro Pongbatik 3 MW South Sulawesi 7
4 IPP Solar Gorontalo 2 MW Gorontalo 5
5PLN Diesel Pulau Terluar dan Daerah Perbatasan (Sulawesi) 0.4 MW
Multiprovinces -
6 IPP Steam Jeneponto 2 125 MW South Sulawesi 259
7 IPP Steam Jeneponto 2 125 MW South Sulawesi 259
8 IPP Steam Kendari 3 100 MW Southeast Sulawesi 207
9 IPP Wind Sidrap 70 MW South Sulawesi 150
10 IPP Hydro Malea 90 MW South Sulawesi 143
11 IPP Steam Sulbagut 1 100 MW Gorontalo 103
12 PLN Gas Engine Bau-Bau 30 MW Southeast Sulawesi 48
13 PLN Gas/Gas Engine Mobile PP Sultra (Kendari) 50 MW Southeast Sulawesi 21
14 IPP Mini Hydro Belajen 8.3 MW South Sulawesi 19
15 IPP Mini Hydro Bungin III 5 MW South Sulawesi 11
No Project Province
Est. Investment Value
(US$ million)*
1IPP (AP-Batam) Gas/Gas Engine Mobile PP Pontianak #1-3 75 MW
West Kalimantan 81
2IPP (AP-Batam) Gas/Gas Engine Mobile PP Pontianak #4 25 MW
West Kalimantan 27
3PLN Diesel Pulau Terluar dan Daerah Perbatasan (Kalimantan) 12.4 MW
Multiprovinces 15
4 IPP Steam Kalbar-1 200 MW West Kalimantan 414
5 IPP Steam Kalsel (FTP2) 200 MW South Kalimantan 207
6 IPP Steam Kaltim (FTP2) 200 MW East Kalimantan 207 7 IPP Steam Kaltim 4 (Ekspansi-2 Embalut) 200 MW East Kalimantan 207
8 PLN Gas Engine Bangkanai (FTP2) 140 MW Central Kalimantan 166
9 PLN Steam Kalselteng 2 200 MW South Kalimantan 150
10 IPP Steam Kalselteng 1 100 MW Central Kalimantan 103
11 IPP Steam Kalselteng 1 100 MW Central Kalimantan 103
12 PLN Gas/Gas Engine Mobile PP Kaltim 30 MW East Kalimantan 23
13 PLN Gas Engine Tanjung Selor 15 MW North Kalimantan 18
No Project Province
Est. Investment Value
(US$ million)*
1PLN Diesel Pulau Terluar dan Daerah Perbatasan (Maluku) 14.4 MW
Multiprovinces 17
2 PLN Gas Engine Jayapura Peaker 40 MW Papua 83
3 PLN Gas Engine Merauke 20 MW Papua 43
4 PLN Gas Engine MPP Jayapura 50 MW Papua 40
5 PLN Gas Engine Ambon Peaker 30 MW Maluku 35
6 PLN Gas Engine MPP Ternate 30 MW Maluku Utara 35
7 PLN Gas Engine Biak 15 MW Papua 34
8 IPP Steam Nabire - Kalibobo 14 MW Papua 29
9 PLN Gas Engine Langgur 20 MW Maluku 24
10 PLN Gas Engine MPP Nabire 20 MW Papua 24
11 PLN Gas Engine Seram Peaker 20 MW Maluku 24
12 PLN Mini Hydro Kalibumi 2.6 MW Papua 6
MALUKU AND PAPUA
No Project ProvinceEst. Investment
Value(US$ million)*
1IPP (AP-Batam) Gas/Gas Engine Mobile PP Lombok unit 1 25 MW
West Nusa Tenggara 27
2IPP (AP-Batam) Gas/Gas Engine Mobile PP Lombok unit 2 25 MW
West Nusa Tenggara 27
3PLN Diesel Pulau Terluar dan Daerah Perbatasan (NTT) 6.8 MW
Multiprovinces 8
4 IPP Mini Hydro Muara 1.4 MW Bali 3 5 PLN Gas and Steam Lombok Peaker 100 MW West Nusa Tenggara 118
6 PLN Gas and Steam Lombok Peaker 50 MW West Nusa Tenggara 59 7 PLN Gas Engine Bima 50 MW West Nusa Tenggara 59 8 PLN Gas Engine Sumbawa 50 MW West Nusa Tenggara 59 9 PLN Gas Engine Maumere 40 MW East Nusa Tenggara 47
10 PLN Gas Engine Kupang Peaker 40 MW East Nusa Tenggara 30 11 PLN Gas Engine Mobile PP Flores 20 MW East Nusa Tenggara 21 12 IPP Mini Hydro Sedau 1.3 MW West Nusa Tenggara 3 13 IPP Mini Hydro Sita - Borong 1 MW East Nusa Tenggara 2
BALI AND NUSA TENGGARA
No Project ProvinceEst. Investment
Value(US$ million)*
1PLN Diesel Pulau Terluar dan Daerah Perbatasan (Papua) 1.2 MW
National 1 *Exchange rate used was US$1 = IDR13,000
Under-construction projectCompleted projectNote:
SUMATERA JAVA KALIMANTAN
NASIONAL

INDONESIAPenthouse / Level 21Sona Topas TowerJalan Jendral Sudirman Kav 26Jakarta 12920Tel: +62 21 250 6668Fax: +62 21 250 6228
SINGAPORELevel 25One Raffles QuayNorth TowerSingapore 048583Tel: +65 6622 5718Fax: +65 6622 5999
www.tuskadvisory.comEmail: [email protected]