Embed Size (px)
Citation preview

Impact of Regional Road Infrastructure Improvement on Intra-
Regional Trade in ECOWAS
Uduak S. Akpan
Infrastructure Consortium for Africa (ICA), c/o African Development Bank (AfDB), Tunis, Tunisia.
ABSTRACT
This study employs the gravity model of trade to examine the impact of improving the quality of a regional road
infrastructure in the ECOWAS sub-region, from its current level to the level of roads in South Africa, on intra-
regional trade. The study augments the traditional gravity model to include variables for language, common
border, and road quality. The positive difference in per capita GDP of trading partners is also included to test the Linder hypothesis. The parameters in the model are estimated using the Tobit postulation and the result
shows that such improvement will lead to a US$397.80million (5.27%) increase in intra-regional trade relative
to the 2012 level, ceteris paribus. Moreover, the ancillary benefits of improvement in road quality in terms of
increased movement of factors of production will foster further intra-regional trade in the medium and long
terms. To enhance the benefits of the improvement in the road quality, ECOWAS governments needs to put in
place other “soft” infrastructures to fast-track the achievement of the objectives of the ECOWAS trade
liberalization scheme. However, increasing the quality of roads demands huge financial investment, thus a cost-
benefit trade-off must be carefully considered.
Keywords: Road quality, Regional Infrastructure, Lagos-Dakar corridor, Intra-regional trade, ECOWAS.
Disclaimer: The author thanks the staff of Infrastructure Consortium for Africa (ICA) for
their significant inputs to this article. Also thanked are Jonas Chianu, Snott Mukukumira,
Salisu Isihak, Simplice Asongu, Uduakobong Obot and Christian Nguena for their comments
on the article. The views contained in this article are solely those of the author and should
neither be interpreted nor construed to represent the views of ICA or any of her members and
partners. The author takes full responsibility for any error or omission in the article.
1.0 Introduction
Despite her potentials in human and natural resources, Africa’s human development indices
have been appalling over the years. According to the 2012 Human Development Report of
the United Nations Development Programme (UNDP), 31 of the 44 countries in Sub-Saharan
Africa (i.e. about 70%) have Human Development Index (HDI) less than 0.5 (UNDP, 2013).
Unfortunately, the situation has been similar for the past two decades. Some of the reasons
for this low level of development are weak institutions, non-conducive socio-political
environment, unfavorable geographical location, and lack of quality infrastructure. As part of
the Africa Infrastructure Country Diagnostic reports, Yepes et al. (2008), Foster (2008), and
Foster & Briceño-Garmendia (2010) highlight Africa’s extensive infrastructure deficit. Low-
Corresponding author. Tel: +2348064740389
E-mail address: [email protected] This paper was written during the author’s internship with the African Development Bank where he was
assigned to the NEPAD, Regional Integration and Trade Department (ONRI) in the Infrastructure Consortium
for Africa (ICA) Division.

income countries in Africa lag behind low-income countries in other regions in almost all
infrastructure indicators especially in transport and energy sectors as shown in Table 1.
The African Development Bank (AfDB) complements these studies by providing detailed
statistics on the infrastructure situation in Africa (AfDB, 2011). To salvage this situation,
African countries, together with multilateral and regional institutions like the AfDB and New
Partnership for African Development (NEPAD) have increased efforts, through policies and
programmes, to explore and develop the economic potentials of Africa, one of which is
through promotion of regional infrastructure projects in the transport sector. The importance
of regional infrastructure projects is multifarious. Infrastructure provides necessary social
services and acts as an input to private sector production of goods and services, augments
capital and labour, and reduces overall cost of production due to reduced overhead cost
(Ayogu, 2007).
Studies have examined the importance and/or role of infrastructure to economic development
of Africa (Calderón & Servén, 2010; Ajakaiye & Ncube, 2010, etc). Other studies have
examined the role of (regional) infrastructure, especially good road networks, in promoting
intra-regional trade, economic development, cooperation and integration (Buys et al., 2010;
Ndulu, 2006; Mbekeani, 2010; Bafoil & Ruiwen, 2010; AfDB, 2012; UNCTAD, 2013; etc).
Mbekeani (2010) conducted a comprehensive review of global experiences on the role of
infrastructure in promoting trade and regional economic integration and provided lessons for
Africa. Ndulu (2006) highlighted the disadvantages of geography, sovereign, and ethno-
linguistic fragmentation in developing infrastructure that will promote regional integration
and growth in sub-Saharan Africa and advocated a regional approach in promoting
investments in regional infrastructure. In summary, these studies have noted that the
availability of good regional infrastructure promotes economic exchange between countries
in close geographical proximity across different sectors. Infrastructure provides access to key
economic inputs such as knowledge, resources, and technology; reduces the barriers to free
movement of goods and persons, and increases access to the market for goods and services.
Transport infrastructure promotes cross-border trade and investment, improves countries’
competitiveness, and raises domestic output, thus fostering regional integration. In contrast,
poor infrastructure reduces the mobility of different factors of production which in-turn
reduces firms’ productivity by increasing the overhead, logistics, and transportation costs,
thus reducing firms’ ability to compete internationally.
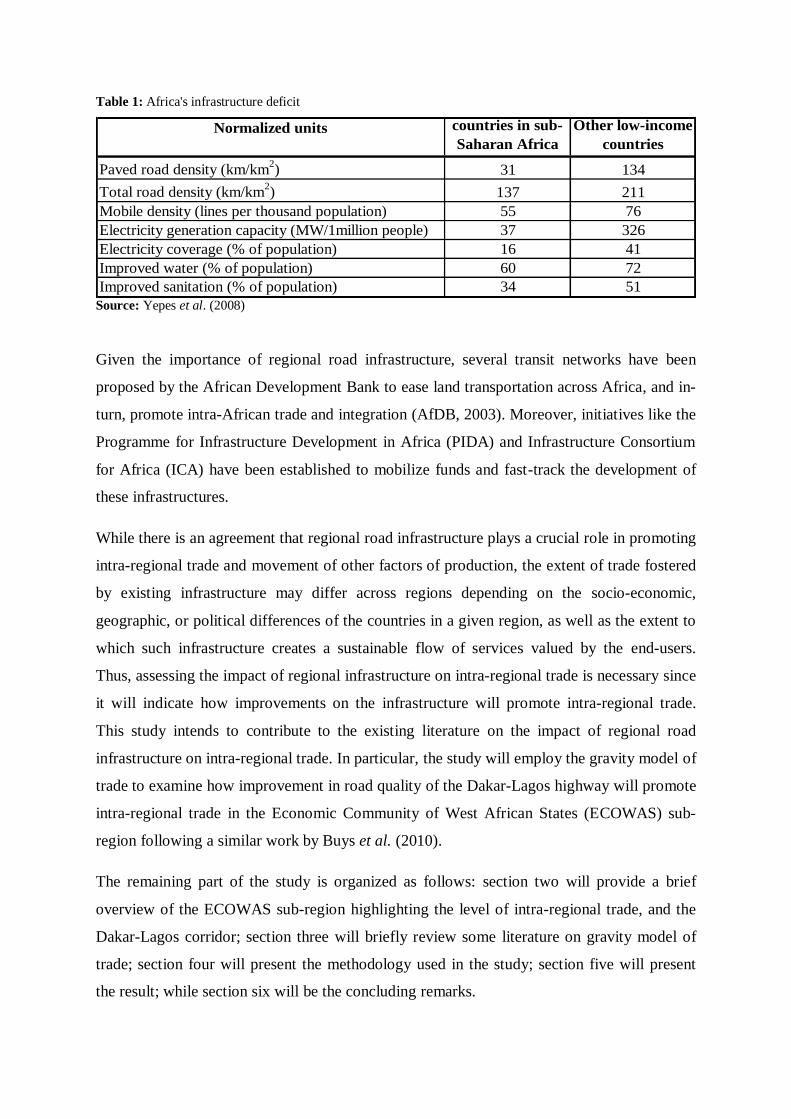
Table 1: Africa's infrastructure deficit
Normalized units
Low-income
countries in sub-
Saharan Africa
Other low-income
countries
Paved road density (km/km2) 31 134
Total road density (km/km2) 137 211
Mobile density (lines per thousand population) 55 76
Electricity generation capacity (MW/1million people) 37 326
Electricity coverage (% of population) 16 41
Improved water (% of population) 60 72
Improved sanitation (% of population) 34 51
Source: Yepes et al. (2008)
Given the importance of regional road infrastructure, several transit networks have been
proposed by the African Development Bank to ease land transportation across Africa, and in-
turn, promote intra-African trade and integration (AfDB, 2003). Moreover, initiatives like the
Programme for Infrastructure Development in Africa (PIDA) and Infrastructure Consortium
for Africa (ICA) have been established to mobilize funds and fast-track the development of
these infrastructures.
While there is an agreement that regional road infrastructure plays a crucial role in promoting
intra-regional trade and movement of other factors of production, the extent of trade fostered
by existing infrastructure may differ across regions depending on the socio-economic,
geographic, or political differences of the countries in a given region, as well as the extent to
which such infrastructure creates a sustainable flow of services valued by the end-users.
Thus, assessing the impact of regional infrastructure on intra-regional trade is necessary since
it will indicate how improvements on the infrastructure will promote intra-regional trade.
This study intends to contribute to the existing literature on the impact of regional road
infrastructure on intra-regional trade. In particular, the study will employ the gravity model of
trade to examine how improvement in road quality of the Dakar-Lagos highway will promote
intra-regional trade in the Economic Community of West African States (ECOWAS) sub-
region following a similar work by Buys et al. (2010).
The remaining part of the study is organized as follows: section two will provide a brief
overview of the ECOWAS sub-region highlighting the level of intra-regional trade, and the
Dakar-Lagos corridor; section three will briefly review some literature on gravity model of
trade; section four will present the methodology used in the study; section five will present
the result; while section six will be the concluding remarks.

2.0 The ECOWAS sub-region1
ECOWAS is a regional group of 15 countries2, founded on May 28, 1975 with the adoption
of the ECOWAS treaty in Lagos, Nigeria. Its mission is to promote economic integration in
all fields of economic activity, particularly industry, transport, telecommunications, energy,
agriculture, natural resources, commerce, monetary and financial questions, social and
cultural matters etc. In 1993, the ECOWAS treaty was revised to accelerate the process of
regional integration. ECOWAS has a combined population of 318.5 million and GDP of
$US264.2billion (constant 2005) based on 2012 figures from the World Bank, and covers a
total surface area of 6.1 million km2.
In an effort to promote intra-regional trade and establish a common market in the sub-region,
the ECOWAS trade liberalization scheme was established in 1979 (adopted in 1990 and
amended in 2003). The objectives of the scheme include:
i. elimination of customs duties and taxes having equivalent effect on products from
member states
ii. abolition of non-tariff barriers between member state exchanges
iii. establishment of a common external tariff (CET) on products from other countries
imported in the community
iv. organization of trade fairs etc.
In 2000, the sub-region was proclaimed a free trade area and plans are still ongoing to
transform the sub-region into a functional custom union. Despite its efforts in promoting
intra-regional trade, available data show that contrary to the expectations of the trade
liberalization scheme which is to promote intra-regional trade, there has been little
improvement in the level of intra-regional trade by member countries when compared to
bilateral trade with trading partners and the rest of the world. The share of intra-regional
exports in the total export of member countries in the sub-region is decreasing, albeit slowly,
while export to the rest of the world (i.e. world excluding other ECOWAS countries,
mainland China, France, Japan, United Kingdom, and U.S.A.) is steadily increasing. In
addition, the share of intra-regional imports in the total imports of member countries is
decreasing steadily while imports from mainland China are increasing (see Fig. 1 for
aggregated trade flows and Appendices 1 and 2 for trade flows at country level).The reasons
1 Unless stated otherwise, all information presented in this section is obtained from the websites of ECOWAS,
UEMOA and AfDB (2003). 2 Benin, Burkina Faso, Cape Verde, Cote d’Ivoire, The Gambia, Ghana, Guinea, Guinea Bissau, Liberia, Mali,
Niger, Nigeria, Senegal, Sierra Leone, and Togo.

for the current situation may be the increase in demand from ECOWAS member countries for
low-cost technology-based products manufactured in China, poor interconnection between
member countries due to poor regional infrastructure, among others.
Some member countries of the ECOWAS sub-region also belong to a regional economic
community. The West African Economic Monetary Union (Union Économique et Monétaire
Ouest-Africaine, UEMOA, in French) is a custom union and currency union established in
1994 to promote economic integration among ECOWAS member countries that share the
CFA franc as a common currency (Benin, Burkina Faso, Côte d’Ivoire, Guinea-
Bissau, Mali, Niger, Senegal, and Togo). The objectives of UEMOA include: greater
economic competitiveness, through open markets, in addition to the rationalization and
harmonization of the legal environment; the creation of a common market; the harmonization
of fiscal policies; among others.
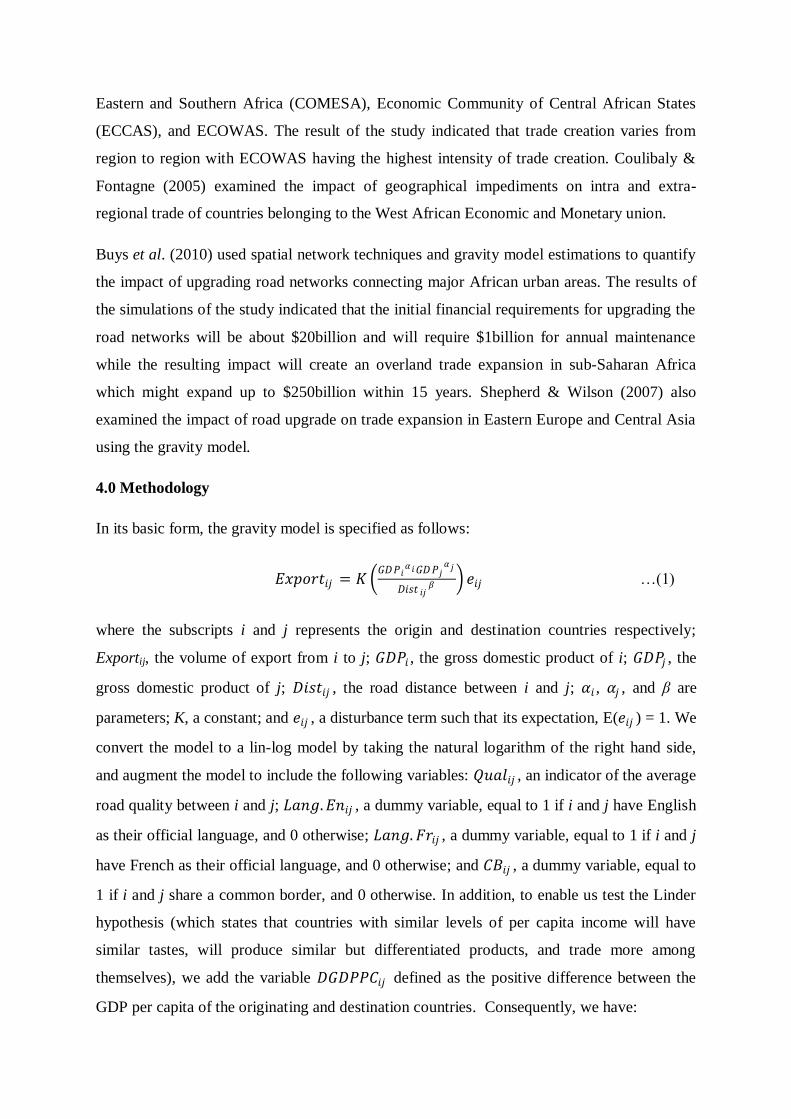
The Lagos-Dakar Corridor, also called the Trans Coastal West African highway, is one of the
nine trans-African highways proposed by the African Development Bank to promote land
transport in Africa. The main importance of the Highway is that it provides the most direct,
and in some cases the only, road connection between the capitals of the countries along its
alignment. It also provides the starting points for the roads leading from the ports to the
landlocked countries in the hinterland. The highway covers a total of 4010 km of which 3260
are paved in various areas. Fig. 2 shows the span of the Lagos-Dakar corridor.
Figure 1: Aggregated trade flows of ECOWAS sub-region Source of data: IMF-direction of trade

Figure 2: The Lagos-Dakar highway
Source: AfDB (2003)
3.0 Review of Gravity Model of Trade
The gravity model is used in social science to describe economic activities that have the
properties of the Newton’s law of gravity i.e. contains some elements of volume and distance,
e.g. trade and immigration. The most basic form of the model assumes that the volume of
trade between two countries is directly proportional to the relative sizes of the origin and
destination countries and inversely proportional to the distance between them. The model was
originated by Tinbergen (1962) and Poyhonen (1963) and over the years it has been
rationalized from several theoretical viewpoints such as the Heckscher-Ohlin relative factor
abundance trade theory (Deardorff, 1998). Empirical studies employing the model often
extend the number of variables to account for linguistic differences, political and economic
ties between trading partners, border and exchange rate regimes between trading partners,
political tensions, trade association membership, road quality etc. (Frankel, 1997; Carrillo-
Tudela & Li, 2004; Longo & Sekkat, 2004; Coulibaly & Fontagne, 2005; Buys et al., 2010;
etc.).
Longo & Sekkat (2004) examined the impact of infrastructure availability, economic policy,
and internal political tensions using gravity model. Geda & Kebret (2007) assessed the
problems and prospects of regional economic integration in Africa and thereafter employed
the gravity model to empirically determine the most important factor influencing intra-
regional trade using common market for Eastern and Southern Africa (COMESA) as a case
study. Musila (2005) applied the gravity model to estimate the intensity of trade creation and
trade diversion in three regional economic communities in Africa: common market for
Eastern and Southern Africa (COMESA), Economic Community of Central African States
(ECCAS), and ECOWAS. The result of the study indicated that trade creation varies from
region to region with ECOWAS having the highest intensity of trade creation. Coulibaly &
Fontagne (2005) examined the impact of geographical impediments on intra and extra-
regional trade of countries belonging to the West African Economic and Monetary union.
Buys et al. (2010) used spatial network techniques and gravity model estimations to quantify
the impact of upgrading road networks connecting major African urban areas. The results of
the simulations of the study indicated that the initial financial requirements for upgrading the
road networks will be about $20billion and will require $1billion for annual maintenance
while the resulting impact will create an overland trade expansion in sub-Saharan Africa
which might expand up to $250billion within 15 years. Shepherd & Wilson (2007) also
examined the impact of road upgrade on trade expansion in Eastern Europe and Central Asia
using the gravity model.
4.0 Methodology
In its basic form, the gravity model is specified as follows:
𝐸𝑥𝑝𝑜𝑟𝑡𝑖𝑗 = 𝐾 𝐺𝐷𝑃𝑖
𝛼 𝑖𝐺𝐷𝑃𝑗𝛼𝑗
𝐷𝑖𝑠𝑡 𝑖𝑗𝛽 𝑒𝑖𝑗 …(1)
where the subscripts i and j represents the origin and destination countries respectively;
Exportij, the volume of export from i to j; 𝐺𝐷𝑃𝑖 , the gross domestic product of i; 𝐺𝐷𝑃𝑗 , the
gross domestic product of j; 𝐷𝑖𝑠𝑡𝑖𝑗 , the road distance between i and j; 𝛼𝑖 , 𝛼𝑗 , and β are
parameters; K, a constant; and 𝑒𝑖𝑗 , a disturbance term such that its expectation, E(𝑒𝑖𝑗 ) = 1. We
convert the model to a lin-log model by taking the natural logarithm of the right hand side,
and augment the model to include the following variables: 𝑄𝑢𝑎𝑙𝑖𝑗 , an indicator of the average
road quality between i and j; 𝐿𝑎𝑛𝑔.𝐸𝑛𝑖𝑗 , a dummy variable, equal to 1 if i and j have English
as their official language, and 0 otherwise; 𝐿𝑎𝑛𝑔. 𝐹𝑟𝑖𝑗 , a dummy variable, equal to 1 if i and j
have French as their official language, and 0 otherwise; and 𝐶𝐵𝑖𝑗 , a dummy variable, equal to
1 if i and j share a common border, and 0 otherwise. In addition, to enable us test the Linder
hypothesis (which states that countries with similar levels of per capita income will have
similar tastes, will produce similar but differentiated products, and trade more among
themselves), we add the variable 𝐷𝐺𝐷𝑃𝑃𝐶𝑖𝑗 defined as the positive difference between the
GDP per capita of the originating and destination countries. Consequently, we have:

𝐸𝑥𝑝𝑜𝑟𝑡𝑖𝑗 =
𝛼0 + 𝛼1𝑖 𝑙𝑛𝐺𝐷𝑃𝑖 + 𝛼1
𝑗𝑙𝑛𝐺𝐷𝑃𝑗 + 𝛽1𝑙𝑛𝐷𝑖𝑠𝑡𝑖𝑗 + 𝛽2𝑙𝑛𝑄𝑢𝑎𝑙𝑖𝑗 + 𝛽3𝑙𝑛𝐷𝐺𝐷𝑃𝑃𝐶𝑖𝑗 +
𝜆1𝐿𝑎𝑛𝑔.𝐸𝑛𝑖𝑗 + 𝜆2𝐿𝑎𝑛𝑔. 𝐹𝑟𝑖𝑗 + 𝜆3𝐶𝐵𝑖𝑗 + 𝜀𝑖𝑗 ; E(𝜀𝑖𝑗 ) = 0 …(2)
where 𝜀𝑖𝑗 is the disturbance term and 𝛼0, 𝛼1𝑖 , 𝛼1
𝑗, 𝛽1, 𝛽2, 𝛽3, 𝜆1, 𝜆2 and 𝜆3 are parameters to
be estimated. A lin-log model is used because where there is no export between two countries
(i.e. 𝐸𝑥𝑝𝑜𝑟𝑡𝑖𝑗 = 0) the natural logarithm of export, 𝑙𝑛𝐸𝑥𝑝𝑜𝑟𝑡𝑖𝑗 , cannot be obtained.
Estimating the lin-log specification presented in equation (2) using ordinary least squares
(OLS) will produce biased and inconsistent results since the dependent variable is truncated
at zero, thus, the Tobit model is used (Longo & Sekkat, 2004; Geda & Kebret, 2007).
The gravity model assumes that the volume of trade between two countries is directly
proportional to the economic size of the countries and inversely proportional to the distance
between the countries. Thus, a priori, the study expects 𝛼1𝑖 and 𝛼1
𝑗 to have positive values,
and 𝛽1 to have a negative value. Good quality roads will generally reduce the cost of
transporting goods by road thus increase trade, consequently, 𝛽2 is expected to have a
positive sign. Based on Linder’s hypothesis, it is expected that the smaller the absolute value
of the difference between the GDP per capita of i and j, the larger the volume of export.
Therefore, 𝛽3 is expected to be negative. There is likely to be more trade between countries
that have a common border or speak the same language than with those that do not have these
qualities, thus 𝜆1, 𝜆2, and 𝜆3 are expected to be positive.
The study covers only the 11 coastal countries along the Lagos-Dakar highway (i.e.
excluding Burkina Faso, Cape Verde, Mali, and Niger). Data on the volume of exports are
obtained from the International Monetary Fund Direction of Trade database, IMF-DOT, for
year 2012 (expressed in current million US$; and GDP and GDP per capita from the World
Bank database (current US$, expressed in millions), for year 2012. Data on road distance
between two countries (measured as the distance between the capital/reference cities of the
countries on the Lagos-Dakar highway, are obtained from AfDB (2003). For example,
distance between Senegal and Sierra Leone is calculated as distance between Dakar (Senegal)
and Masiaka (Sierra Leone) on the Lagos-Dakar highway. The computed distances are
provided in appendix 3.

Table 2: Percentage paved roads and road transport quality index
Country % of paved roads
Guys et al. (2010) Present study
South Africa 60.00 100.00 100.00
Gambia, The 35.40 41.60 43.34
Togo 31.60 37.00 34.11
Senegal 29.30 36.00 38.07
Nigeria 30.90 32.30 41.61
Ghana 18.40 27.00 26.51
Benin 20.00 25.10 26.48
Guinea 16.50 23.10 20.35
Core d'Ivoire 9.70 14.40 15.24
Guinua Bissau 10.30 13.20 13.87
Sierra Leone 7.90 9.60 12.07
Liberia 6.20 7.10 8.49
Road Transport Quality Index
The study adopts road transport quality index methodology used by Buys et al. (2010) as
follows:
Let 𝑄𝑖 be the road quality index of country i. Then:
𝑄𝑖 = 𝑅𝑖𝑎1𝐺𝑖
𝑎2𝐶𝑖𝑎3 …(3)
where Ri is the percentage of roads that are paved in country i (1999 data obtained from Buys
et al. 2010)3; Gi, the GDP per capita of country i as a proxy for capacity to maintain roads
4
(2012 data, purchasing power parity (PPP) constant 2005 US$, World Bank); Ci, the World
Bank’s Country Policy and Institutional Capacity (CPIA) index for transparency,
accountability and corruption for country i as a proxy for delays and cost inflicted on truckers
(2012 report, World Bank, 2013)5; while a1, a2 and a3 are weights assigned to the variables
based on the contribution of each variable to the average road quality in a country, such that,
a1 + a2 + a3 is analogous to returns-to-scale and is expected to be ≥ 1. Usually, 0.5 ≤ a1 ≤ 1,
since the percentage of paved roads is the most important measure of road quality, and 0 ≤ a2
≤ 0.5; 0 ≤ a3 ≤ 0.5 . Also note that if a1=1, a2=0, a3=0; then 𝑄𝑖 = 𝑅𝑖 . We follow Buys et al.
(2010) and assign a1 twice the combine weight of a2 and a3, and specify a mildly increasing-
returns function (a1=0.8, a2=0.2, a3=0.2) as a good approximation to road transport quality
differentials. Data on percentage of paved roads show that South Africa has the highest
percentage of paved roads in Africa. Thus, the study uses South Africa as a benchmark,
calculates 𝑄𝑖 for the countries considered in this study and South Africa, and benchmarks the
3 There are no updated cross sectional data covering all ECOWAS countries 4 Government expenditure on infrastructure maintenance as percentage of GDP is a better proxy for capacity to
maintain roads. However, data on the variable are unavailable for African countries. 5 South Africa is not included. The study assigned the highest value (i.e. Kenya = 4.59) to South Africa

calculated 𝑄𝑖 relative to 100, where 𝑄𝑆𝑜𝑢𝑡 𝐴𝑓𝑟𝑖𝑐𝑎 = 100. As noted by Shepherd & Wilson
(2007), this approach is valuable as it shows that “upgrading road quality is not just about
bitumen, but also requires maintenance capacity and the ability to control unofficial
payments”. The result is comparable to that calculated by Buys et al. (2010) and is presented
in Table 2. The road quality between i and j is measured as the distance-weighted road
quality index for transit countries6. The model covers 110 observations and is estimated using
the method of maximum likelihood with Eviews 6.0.
5.0 Results and Discussions
The summary of our estimated coefficients which show the marginal effects of the regressors
on the latent variable of export, Export*, is presented in Table 3 (the complete result is
presented in Appendix 4). From Table 3, we observe that all the main regressors possess the
expected signs. In contrast, only one dummy variable, Lang.Fr, has the expected positive
sign. The negative sign of Lang.En suggests that English speaking countries in the ECOWAS
sub-region are more likely to trade with Francophone countries than with other Anglophone
countries in the sub-region. The dummy variable CB also has a negative sign contrary to
expectation. This suggests that ECOWAS countries are more likely to trade with member
countries not having a common border than with those having a common border. However,
although the result suggests this, a more plausible explanation for this contradiction may be
that the IMF-DOT data for 2012 does not fully capture cross border trade flows in the sub-
region, or the volume of trade via shipment to member countries with non-adjoining borders
is generally higher than that via roads to countries that have a common border.
Table 3: Estimated results
Variable Coefficient Std. Error z-Statistic Prob. Significance at 5%
C -888.6383 539.1377 -1.6483 0.0993 significant
LOG(GDPI) 68.7819 13.9106 4.9446 0.0000 very significant
LOG(GDPJ) 40.9301 13.6378 3.0012 0.0027 very significant
LOG(DIST) -39.5187 38.3979 -1.0292 0.3034 not significant
LOG(QUAL) 101.8236 100.4585 1.0136 0.3108 not significant
LOG(DGDPPC) -9.7858 18.0272 -0.5428 0.5872 not significant
LANG_EN -20.9760 56.8879 -0.3687 0.7123 not significant
LANG_FR 31.2284 58.4328 0.5344 0.5930 not significant
CB -36.6205 71.3304 -0.5134 0.6077 not significant
Dependent Variable: EXPORT
6 For example, road quality between Guinea and Cote d’Ivoire = 20.35 102 +12.07 115 +12.07 292 +8.49 119 +8.49 412 +15.25(614)
1654= 12.6081

We now proceed to the marginal effects of the regressors. First, we note that in the Tobit
model, the marginal effects of the estimated coefficients on the latent form of the dependent
variable are the estimated coefficients7. The result shows that ceteris paribus: if the GDP of
an originating country increases by 1%, on average, intra-regional export will increase by
US$0.69million; if the GDP of a destination country increases by 1%, on average, intra-
regional export will increase by US$0.41million; and if the average quality of road between
the originating country increases by 1%, on average, intra-regional export will increase by
US$1.01million. The coefficient of the distance suggests that if the distance that will be
covered in transporting goods increases by 1%, on average, there will be a US$0.40 reduction
in the value of intra-regional exports. The Linder’s hypothesis holds true for intra-regional
trade in ECOWAS sub-region for year 2012. The result shows that for every 1% decrease in
the absolute value of the difference between the GDP per capita of the originating and
destination countries, on average, trade will increase by US$0.1 million. This further shows
that policies that support macroeconomic convergence in the ECOWAS sub-region
inadvertently promote intra-regional trade.
Next, we examine the impact of the completion of the Lagos-Dakar highway on intra-
regional trade in the ECOWAS sub-region. The study views the completion of the Lagos-
Dakar highway as being equivalent to an increase in the average road quality between i and j
(𝑄𝑢𝑎𝑙𝑖𝑗 ) from its current level (shown in the road transport quality index) to the level of
South Africa i.e. 100. Based on the distance-weighted road quality used in this study, the
average road quality from Dakar to Lagos, relative to the index of quality of road in South
Africa (i.e. 100), is 20.38. Thus, ceteris paribus, increasing the Lagos-Dakar average road
quality from 20.38 to 100 (i.e. 391% increase), has the potential of increasing intra-regional
trade by US$397.80million, which is equivalent to a 5.27 increase from its current level.
6.0 Concluding Remarks
The nexus between transport infrastructure and trade has long been established in the
literature. Infrastructure provides access to key economic inputs such as knowledge,
resources, and technology; reduces the barriers to free movement of goods and persons, and
increases the market for goods and services. Regional transport infrastructure promotes cross-
border trade and investment, improve countries’ competitiveness, and raise domestic output,
7 This is different from the marginal effects of the estimated coefficient on the observed dependent variable
which is usually multiplied by a scaled factor (which shows the probability of an uncensored observation at
given values of the independent variable(s)).

thus fostering regional integration. This study set out to examine the impact of improving the
quality of regional road infrastructure in the ECOWAS region from its current level to the
level of roads in South Africa on intra-regional trade and observed that such improvement
will lead to a US$397.80million (5.27%) increase in intra-regional trade relative to the 2012
level, all other things being equal. Moreover, the ancillary benefits of improvement in road
quality in terms of increased movement of factors of production will foster further intra-
regional trade in the medium and long terms. To enhance the benefits of the improvement in
the road quality, ECOWAS governments needs to put in place other “soft” infrastructures to
fast-track the achievement of the objectives of the ECOWAS trade liberalization scheme.
However, increasing the quality of roads demands huge financial investment, thus a cost-
benefit trade-off must be carefully considered.
References
AfDB. (2003). Review of the Implementation Status of the Trans-African Highway and the
Missing Links. Tunis: African Development Bank and United Nations Economic
Commission for Africa.
AfDB. (2011, December). Africa Infrastructure Knowledge Programme: Handbook on
Infratsructure Statistics. Retrieved August 13, 2013, from African Development
Bank:
http://www.afdb.org/fileadmin/uploads/afdb/Documents/Publications/AfDB%20Infra
structure_web.pdf
AfDB. (2012). Development Effectiveness Review 2012: Promoting Regional Integration .
Retrieved August 13, 2013, from African Development Bank :
http://www.afdb.org/fileadmin/uploads/afdb/Documents/Project-and-
Operations/Development%20Effectiveness%20Review%202012%20-
%20Promoting%20Regional%20integration.pdf
Ajakaiye, O., & Ncube, M. (2010). Infrastructure and Economic Development in Africa: An
Overview. Journal of African Economies , 19, 3-12.
Ayogu, M. (2007). Infrastructure and Economic Development in Africa: A Review. Journal
of African Economies , 16, 75–126.
Bafoil, F., & Ruiwen, L. (2010). Re-examining the Role of Transport Infrastructure in Trade,
Regional Growth and Governance: Comparing the Greater Mekong Subregion (GMS)
and Central Eastern Europe (CEE). Journal of Current Southeast Asian Affairs , 29
(2), 73-119.

Buys, P., Deichmanna, U., & Wheelerb, D. (2010). Road Network Upgrading and Overland
Trade Expansion in Sub-Saharan Africa. Journal of African Economies , 19 (3), 399–
432.
Calderón, C., & Servén, L. (2010). Infrastructure and Economic Development in Sub-
Saharan Africa. Journal of African Economies , 19, 13-87.
Carrillo-Tudela, C., & Li, C. (2004). Trade Blocks and the Gravity Model: Evidence from
Latin American Countries. Journal of Economic Integration , 19 (4), 667–89.
Coulibaly, S., & Fontagne, L. (2005). South–South Trade: Geography Matters. Journal of
African Economies , 15 (2), 313–41.
Deardorff, A. V. (1998). Determinants of Bilateral Trade: Does Gravity Work in a Classical
World? In J. A. Frankel (ed.), The Regionalization of the World Economy. Chicago:
University of Chicago Press.
Foster, V. (2008, September ). Overhauling the Engine of Growth: Infrastructure in Africa.
Retrieved August 12, 2013, from World Bank:
http://siteresources.worldbank.org/INTAFRICA/Resources/AICD_exec_summ_9-30-
08a.pdf
Frankel, J. A. (1997). Regional Trading Blocs in the World Trading System. Washington DC:
Institute for International Economics.
Foster, V., & Briceño-Garmendia, C. (2010). Africa’s Infrastructure: A time for
transformation. Retrieved August 13, 2013, from Infrastructure Africa:
http://infrastructureafrica.org/system/files/AIATT_Consolidated_smaller.pdf
Geda, A., & Kebret, H. (2007). Regional Economic Integration in Africa: A Review of
Problems and Prospects with a Case Study of COMESA. Journal of African
Economies , 17 (3), 357–394.
Longo, R., & Sekkat, K. (2004). Economic Obstacles to Expanding. World Development , 32
(8), 1309–1321.
Mbekeani, K. K. (2010). Infrastructure, Trade Expansion and Regional Integration: Global
Experience and Lessons for Africa. Journal of African Economies , 19, 88-113.
Musila, J. W. (2005). The Intensity of Trade Creation and Trade Diversion in COMESA,
ECCAS and ECOWAS: A Comparative Analysis. Journal of African Economies , 14
(1), 117–141.
Ndulu, B. (2006). Infrastructure, Regional Integration and Growth in Sub-Saharan Africa:
Dealing with the Disadvantages of Geography and Sovereign Fragmentation. Journal
of African Economies , 15, 212-244 .

Poyhonen, P. (1963). A Tentative Model for the Volume of Trade between Countries.
Weltwirtschaftliches Archiv , 90, 93–9.
Shepherd, B., & Wilson, J. S. (2007). Trade, Infrastructure, and Roadways in Europe and
Central Asia: New Empirical Evidence. Journal of Economic Integration , 22 (4),
723-747.
Tinbergen, J. (1962). An analysis of world trade flows. In J. Tinbergen (ed.), Shaping the
World Economy. New York: The Twentieth Century Fund.
UNCTAD. (2013, April). Supporting infrastructure development to promote economic
integration: the role of the public and private sectors. Retrieved July 31, 2013, from
United Nations Conference on Trade and Development:
http://unctad.org/meetings/en/SessionalDocuments/cimem6d2_en.pdf
UNDP. (2013). Human Development Reports. Retrieved June 26, 2013, from United Nations
Development Programme: http://hdr.undp.org/en/reports/global/hdr2013/
World Bank. (2013, June). 2012 CPIA Results for Africa. Retrieved August 12, 2013, from
World Bank: http://www-
wds.worldbank.org/external/default/WDSContentServer/WDSP/IB/2013/06/26/00035
6161_20130626125251/Rendered/PDF/788430WP0P13200CPIA0Report020130v12.
Yepes, T., Pierce, J., & Foster, V. (2008). Making Sense of Africa’s Infrastructure
Endowment: A Benchmarking Approach. New York: World Bank.

APPENDIX 1: EXPORT FLOWS Benin
Burkina Faso
Cape Verde
Cote d’Ivoire
Gambia
Ghana
Guinea Bissau
Guinea
Liberia
Mali
Niger
Nigeria
Senegal
Sierra Leone
Togo
Source of data: IMF-Direction of trade
0%
20%
40%
60%
80%
100%
2003 2004 2005 2006 2007 2008 2009 2010 2011 2012
other ECOWAS members CHINA (P.R. mainland)
France Japan
UK U.S.A.
Rest of the world
0%
20%
40%
60%
80%
100%
2003 2004 2005 2006 2007 2008 2009 2010 2011 2012
other ECOWAS countries China, P.R. mainland
France Japan
UK U.S.A.
rest of the world
0%
20%
40%
60%
80%
100%
2003 2004 2005 2006 2007 2008 2009 2010 2011 2012
other ECOWAS countries China, P.R. mainland
France Japan
UK U.S.A.
rest of the world
0%
20%
40%
60%
80%
100%
2003 2004 2005 2006 2007 2008 2009 2010 2011 2012
other ECOWAS countries China, P.R. mainland
France Japan
UK U.S.A.
Rest of the world
0%
20%
40%
60%
80%
100%
2003 2004 2005 2006 2007 2008 2009 2010 2011 2012
Other ECOWAS countries China, P.R. mainland
France Japan
UK U.S.A
Rest of the world
0%
20%
40%
60%
80%
100%
2003 2004 2005 2006 2007 2008 2009 2010 2011 2012
other ECOWAS countries China, P.R. mainland
France Japan
UK U.S.A.
Rest of the world
0%
20%
40%
60%
80%
100%
2003 2004 2005 2006 2007 2008 2009 2010 2011 2012
other ECOWAS countries China, P.R. mainland
France Japan
UK U.S.A
rest of the world
0%
20%
40%
60%
80%
100%
2003 2004 2005 2006 2007 2008 2009 2010 2011 2012
other ECOWAS countries China, P.R. mainland
France Japan
UK U.S.A.
rest of the world
0%
20%
40%
60%
80%
100%
2003 2004 2005 2006 2007 2008 2009 2010 2011 2012
other ECOWAS countries China, P.R. mainland
France Japan
UK U.S.A.
rest of the world
0%
20%
40%
60%
80%
100%
2003 2004 2005 2006 2007 2008 2009 2010 2011 2012
other ECOWAS countries China, P.R. mainland
France Japan
UK U.S.A.
rest of the world
0%
20%
40%
60%
80%
100%
2003 2004 2005 2006 2007 2008 2009 2010 2011 2012
other ECOWAS countries China, P.R. mainland
France Japan
UK U.S.A.
Rest of the world
0%
20%
40%
60%
80%
100%
2003 2004 2005 2006 2007 2008 2009 2010 2011 2012
other ECOWAS countries China, P.R. mainland
France Japan
UK U.S.A.
rest of the world
0%
20%
40%
60%
80%
100%
2003 2004 2005 2006 2007 2008 2009 2010 2011 2012
other ECOWAS countries China, P.R. mainland
France Japan
UK U.S.A.
rest of the world
0%
20%
40%
60%
80%
100%
2003 2004 2005 2006 2007 2008 2009 2010 2011 2012
other ECOWAS countries China, P.R. mainland
France Japan
UK U.S.A
rest of the world
0%
20%
40%
60%
80%
100%
1 2 3 4 5 6 7 8 9 10
other ECOWAS countries China, P.R. mainland
France Japan
UK U.S.A.
rest of the world

APPENDIX 2: IMPORT FLOWS Benin
Burkina Faso
Cape Verde
Cote d’Ivoire
Gambia
Ghana
Guinea Bissau
Guinea
Liberia
Mali
Niger
Nigeria
Senegal
Sierra Leone
Togo
Source of data: IMF-Direction of trade
0%
20%
40%
60%
80%
100%
2003 2004 2005 2006 2007 2008 2009 2010 2011 2012
other ECOWAS members CHINA (P.R. mainland)
France Japan
UK U.S.A.
Rest of the world
0%
20%
40%
60%
80%
100%
2003 2004 2005 2006 2007 2008 2009 2010 2011 2012
other ECOWAS countries China, P.R. mainland
France Japan
UK U.S.A.
rest of the world
0%
20%
40%
60%
80%
100%
1 2 3 4 5 6 7 8 9 10
other ECOWAS countries China, P.R. mainland
France Japan
UK U.S.A.
rest of the world
0%
20%
40%
60%
80%
100%
1 2 3 4 5 6 7 8 9 10
other ECOWAS countries China, P.R. mainland
France Japan
UK U.S.A.
Rest of the world
0%
20%
40%
60%
80%
100%
2003 2004 2005 2006 2007 2008 2009 2010 2011 2012
Other ECOWAS countries China, P.R. mainland
France Japan
UK U.S.A
Rest of the world
0%
20%
40%
60%
80%
100%
2003 2004 2005 2006 2007 2008 2009 2010 2011 2012
other ECOWAS countries China, P.R. mainland
France Japan
UK U.S.A.
Rest of the world
0%
20%
40%
60%
80%
100%
2003 2004 2005 2006 2007 2008 2009 2010 2011 2012
other ECOWAS countries China, P.R. mainland
France Japan
UK U.S.A
rest of the world
0%
20%
40%
60%
80%
100%
1 2 3 4 5 6 7 8 9 10
other ECOWAS countries China, P.R. mainland
France Japan
UK U.S.A.
rest of the world
0%
20%
40%
60%
80%
100%
2003 2004 2005 2006 2007 2008 2009 2010 2011 2012
other ECOWAS countries China, P.R. mainland
France Japan
UK U.S.A.
rest of the world
0%
20%
40%
60%
80%
100%
2003 2004 2005 2006 2007 2008 2009 2010 2011 2012
other ECOWAS countries China, P.R. mainland
France Japan
UK U.S.A.
rest of the world
0%
20%
40%
60%
80%
100%
2003 2004 2005 2006 2007 2008 2009 2010 2011 2012
other ECOWAS countries China, P.R. mainland
France Japan
UK U.S.A.
Rest of the world
0%
20%
40%
60%
80%
100%
2003 2004 2005 2006 2007 2008 2009 2010 2011 2012
other ECOWAS countries China, P.R. mainland
France Japan
UK U.S.A.
rest of the world
0%
20%
40%
60%
80%
100%
2003 2004 2005 2006 2007 2008 2009 2010 2011 2012
other ECOWAS countries China, P.R. mainland
France Japan
UK U.S.A.
rest of the world
0%
20%
40%
60%
80%
100%
2003 2004 2005 2006 2007 2008 2009 2010 2011 2012
other ECOWAS countries China, P.R. mainland
France Japan
UK U.S.A
rest of the world
0%
20%
40%
60%
80%
100%
1 2 3 4 5 6 7 8 9 10
other ECOWAS countries China, P.R. mainland
France Japan
UK U.S.A.
rest of the world

APPENDIX 3: Distance between focal cities on the Lagos-Dakar highway
Span of road Country length (km)
Dakar (Senegal) to Senegal/Gambia border Senegal 274
Senegal/Gambia border to Barra (Gambia)* Gambia 25
Banjul* (Gambia) to Gambia/Senegal border Gambia 72
Gambia/Senegal border to Senegal/Guinea Bissau border Senegal 117
Senegal/Guinea Bissau border to Safim (Guinea Bissau)** Guinea Bissau 110
Safim (Guinea Bissau) to Guinea Bissau/Guinea border Guinea Bissau 285
Guinea Bissau/Guinea border to PK36 (Guinea)** Guinea 337
PK36 (Guinea) to Guinea/Sierra Leone border Guinea 102
Guinea/Sierra Leone border to Masiaka (Sierra Leone)** Sierra Leone 115
Masiaka (Sierra Leone) to Sierra Leone/Liberia border Sierra Leone 292
Sierra Leone/Liberia border to Monrovia (Liberia) Liberia 119
Monrovia (Liberia) to Liberia/Cote d'Ivoire border Liberia 412
Liberia/Cote d'Ivoire border to Abidjan (Cote d'Ivoire) Cote d'Ivoire 614
Abidjan (Cote d'Ivoire) to Cote d'Ivoire/Ghana border Cote d'Ivoire 165
Cote d'Ivoire/Ghana border to Accra (Ghana) Ghana 392
Accra (Ghana) to Ghana/Togo border Ghana 191
Ghana/Togo border to Lome (Togo) Togo 10
Lome (Togo) to Togo/Benin border Togo 55
Togo/Benin border to Cotonou (Benin) Benin 92
Cotonou (Benin) to Benin/Nigeria border Benin 30
Benin/Nigeria border to Lagos (Nigeria) Nigeria 90
Total length (Dakar -Lagos) *** 3899
*There is a break between Barra and Banjul
**Safim to Bissau is connected by a separate trunk. Same as Masiaka to Freetown and PK36 to Conakry
*** Does not add up to 4010 due to adjoining trunks i.e. Safim - Bissau in Guinea Bissau; PK36 - Conakry in Guinea; and
Masiaka - Freetown in Sierra Leone
Source: AfDB (2003)
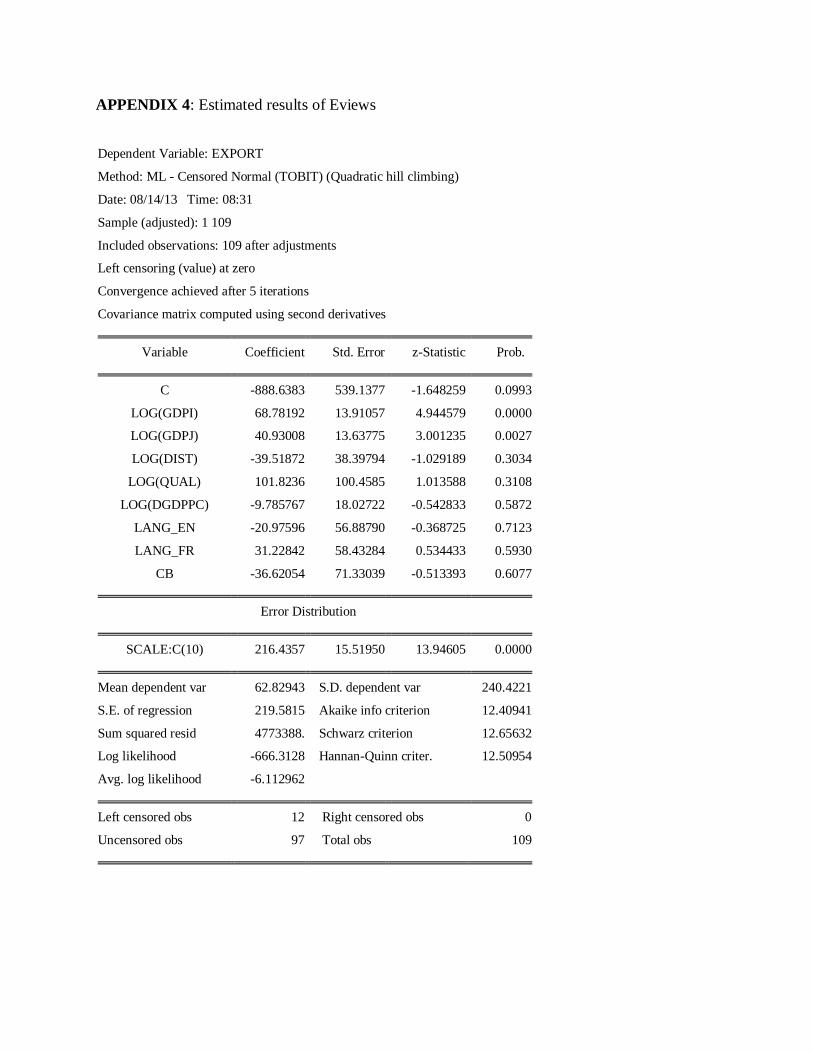
APPENDIX 4: Estimated results of Eviews
Dependent Variable: EXPORT
Method: ML - Censored Normal (TOBIT) (Quadratic hill climbing)
Date: 08/14/13 Time: 08:31
Sample (adjusted): 1 109
Included observations: 109 after adjustments
Left censoring (value) at zero
Convergence achieved after 5 iterations
Covariance matrix computed using second derivatives
Variable Coefficient Std. Error z-Statistic Prob.
C -888.6383 539.1377 -1.648259 0.0993
LOG(GDPI) 68.78192 13.91057 4.944579 0.0000
LOG(GDPJ) 40.93008 13.63775 3.001235 0.0027
LOG(DIST) -39.51872 38.39794 -1.029189 0.3034
LOG(QUAL) 101.8236 100.4585 1.013588 0.3108
LOG(DGDPPC) -9.785767 18.02722 -0.542833 0.5872
LANG_EN -20.97596 56.88790 -0.368725 0.7123
LANG_FR 31.22842 58.43284 0.534433 0.5930
CB -36.62054 71.33039 -0.513393 0.6077
Error Distribution
SCALE:C(10) 216.4357 15.51950 13.94605 0.0000
Mean dependent var 62.82943 S.D. dependent var 240.4221
S.E. of regression 219.5815 Akaike info criterion 12.40941
Sum squared resid 4773388. Schwarz criterion 12.65632
Log likelihood -666.3128 Hannan-Quinn criter. 12.50954
Avg. log likelihood -6.112962
Left censored obs 12 Right censored obs 0
Uncensored obs 97 Total obs 109