Embed Size (px)
Citation preview
Review of Marketing Science Working Papers
Volume 2 | Issue 1 Article 1
12-6-2002
The Impact of Frequent Shopper Programs inGrocery RetailingDavid BellHarvard University
Rajiv LalHarvard University, [email protected]
Follow this and additional works at: http://services.bepress.com/roms
This Working Paper is brought to you for free and open access by Berkeley Electronic Press Services. It has been accepted for inclusion in Review ofMarketing Science Working Papers by an authorized administrator of Berkeley Electronic Press Services.
Recommended CitationBell, David and Lal, Rajiv (2002) "The Impact of Frequent Shopper Programs in Grocery Retailing," Review of Marketing ScienceWorking Papers: Vol. 2: Iss. 1, Article 1.Available at: http://services.bepress.com/roms/vol2/iss1/paper1

The Impact of Frequent Shopper Programs in Grocery Retailing
AbstractFrequent Shopper programs are becoming ubiquitous in retailing. Retailers seem unsure however aboutwhether these programs are leading to higher loyalty, or to higher profits. In this paper we analyze data from aUS supermarket chain that has used a number of frequent shopper rewards to improve sales and profitability.We find that while these programs are profitable, this is only because substantial incremental sales to casualshoppers (cherry pickers) oset subsidies to already loyal customers. In this way our findings are inconsistentwith existing theories about how frequent shopper programs are supposed to work. We construct our ownHotelling-like model that explicitly models cherry picking behavior and show that its predictions match thedata quite closely. We further test the predictions of our model by characterizing the impact of such programson trip frequency and basket size. We then use the model to examine more complex scenarios. For example,our analysis suggests that frequent shopper programs may be unprofitable if they eliminate all cherry picking.This may explain why some retailers seem dissatisfied with their programs. We end by proposing a solutionthat retains the benefits of the frequent shopper programs and yet continues to let supermarkets benefit fromprice discrimination.
This working paper is available in Review of Marketing Science Working Papers: http://services.bepress.com/roms/vol2/iss1/paper1
The Impact of Frequent ShopperPrograms in Grocery Retailing
David Bell and Rajiv Lal 1
July 12, 2002
1David Bell is the George M. Moffett Professor of Agriculture and Business, andRajiv Lal is the Stanley Roth Sr. Professor of Retailing, both at the Harvard Busi-ness School, Boston, MA, 02163. The authors wish to thanks Professors AnandBodapati, Bharat Anand, Alvin Silk and participants of the marketing seminarsat Harvard Business School, Simon School of Business, University of Rochester,Stern School of Management, NYU, University of Virginia and Wharton School ofManagement, for their many helpful comments and suggestions.
1
Bell and Lal: The Impact of Frequent Shopper Programs in Grocery Retailing
Published by Berkeley Electronic Press Services, 2002
Abstract
Frequent Shopper programs are becoming ubiquitous in retailing. Retailersseem unsure however about whether these programs are leading to higherloyalty, or to higher profits. In this paper we analyze data from a US super-market chain that has used a number of frequent shopper rewards to improvesales and profitability. We find that while these programs are profitable, thisis only because substantial incremental sales to casual shoppers (cherry pick-ers) offset subsidies to already loyal customers. In this way our findings areinconsistent with existing theories about how frequent shopper programs aresupposed to work. We construct our own Hotelling-like model that explic-itly models cherry picking behavior and show that its predictions match thedata quite closely. We further test the predictions of our model by char-acterizing the impact of such programs on trip frequency and basket size.We then use the model to examine more complex scenarios. For example,our analysis suggests that frequent shopper programs may be unprofitableif they eliminate all cherry picking. This may explain why some retailersseem dissatisfied with their programs. We end by proposing a solution thatretains the benefits of the frequent shopper programs and yet continues tolet supermarkets benefit from price discrimination.
2
Review of Marketing Science Working Papers, Vol. 2, Iss. 1 [2002], Art. 1
http://services.bepress.com/roms/vol2/iss1/paper1

1 Introduction
Ever since the acclaimed success of Frequent Flyer Programs in the airlineindustry, companies in many retail sectors such as hotels, financial services,and grocery, have rushed to introduce “frequent shopper programs.” Theseprograms offer various incentives and rewards to consumers on the basis ofcumulative purchases from a given provider, be it a store, a service, or amanufacturer. The simplest frequent shopper program is perhaps a volumediscount as in the case of the Discover card where one gets 2% of spendingas cash back at the end of the year. More elaborate programs include tieredreward structures backed by a combination of a sort of volume discount (afree ticket for every 25,000 miles), a variety of services and a plethora ofdirect mail offers with varying degrees of customization.
These programs are expensive to launch and maintain. According to NickAgarwal, a spokesperson for Asda, U.K., “it cost us 8 million [pounds] peryear just to run the loyalty card trial and would have cost 60 million to roll outnationally (Curtis, Oct 7, 1999).” More recently, Starwood Hotels and Re-sorts Worldwide Inc. launched an aggressive frequent-guest program backedby a $50 million advertising campaign (The Wall Street Journal, February 2,1999). One of the most sophisticated programs of this type is being used inthe casino industry with Harrah’s investing more than $100 million in com-puters and software to develop and implement a “frequent bettor program.”The “Total Rewards” Program launched in 1997 was recently modified toinclude gold, platinum and diamond thresholds for frequent gamblers.
While it is difficult to document the economic value of these programs, TheWall Street Journal (May 5, 2000) reports that “the results are impressiveenough that other casinos are copying some of Harrah’s more discerniblemethods. Wall Street analysts are also beginning to see Harrah’s - long adowdy also-ran in the flashy casino business - as gaining an edge on its ri-vals. Harrah’s stock price has risen quickly in recent weeks as investors havereceived news of the marketing results. And the company’s earnings havemore than doubled in the past year.” According to Gary Loveman, Harrah’sCOO, “gamblers are promiscuous - we have customers who play around witheverybody,” and therefore the idea behind the reward program is to “growthe business by getting more from Harrah’s existing casinos and customer
1
3
Bell and Lal: The Impact of Frequent Shopper Programs in Grocery Retailing
Published by Berkeley Electronic Press Services, 2002
base” (The New York Times, December 27, 1999).
In the theoretical literature, success of these frequent shopper programs isargued to be due to reduced price competition through the creation of switch-ing costs (Klemperer 1987). The argument is that as consumers continue todedicate an increasing share of their wallet in the category to one brand or toone store, they incur a cost to switch to a different store or brand because ofinertia effects. Since in many sectors consumers subscribe to several frequentshopper programs and regularly buy more than one brand, one may surmisethat these inertia effects may not be significant enough to result in profitableloyalty programs. Fortunately, these results are shown to persist even withendogenous switching costs as in Caminal and Matutes (1990) and Kim, Shiand Srinivasan (2000) where consumers are awarded a cash discount for re-peat purchases. In a model where firms compete over two periods and someconsumers (heavy buyers) buy in both periods while others (light buyers) buyin only one period, it is shown that a cash coupon for purchasing in both pe-riods reduces price competition in the second period leading to higher overallprofitability. The cash coupon provides an incentive to the heavy buyers toremain loyal in the second period and therefore acts as a switching cost tothe consumers. In contrast, the results in Kopalle, et al. (1999) suggest that“reward programs can be viewed as powerful, multi-period price promotions.”
Success of loyalty programs can also be argued on the basis of the work byHeskett, Sasser and Schlesinger (1997) who document the value of focusingattention on the most loyal customer. They argue that as customer reten-tion costs are generally lower than customer acquisition costs, companiesare better off focusing attention on their more loyal customers especiallysince the top 20% of customers account for 80% of revenues and often morethan 100% of profits. Brian Woolf (1996), based on his experience with loy-alty/frequent shopper programs, makes two claims: (i) Retailers should notfocus on getting new customers but on retaining and reaffirming the loyaltyof the most profitable existing ones, and (ii) Retailers should use the in-formation available through frequent shopper cards to determine their mostprofitable customers and charge them lower prices, through special offers ortargeted coupons, while their less profitable customers should have to payfull price. This will, he argues, cause the more profitable customers to in-crease the amount of money they spend with the retailer, thus increasing
2
4
Review of Marketing Science Working Papers, Vol. 2, Iss. 1 [2002], Art. 1
http://services.bepress.com/roms/vol2/iss1/paper1

the retailer’s profits. Similarly, Dowling and Uncles (1997) conclude that“... programs must enhance the overall value of the product and service andmotivate loyal buyers to make their next purchase.
In summary, there are at least two competing reasons for the success of fre-quent shopper programs: (a) reduced price competition and therefore higherprofits due to switching costs, and (b) reduced marketing expenses by focus-ing attention on retaining the loyal customers and capturing an increasingshare of their wallet.
Few studies shed light on the effectiveness of frequent shopper programs.Dowling and Uncles (1997) conclude that “given the popularity of loyaltyprograms, they are surprisingly ineffective.” Sharp and Sharp (1997) studiedthe impact of the Fly Buys, Australia’s largest consumer loyalty program cov-ering more than 20 percent of Australian retail spending and enrolling almost25% of Australians. Consumers gathered points at participating retailers andredeemed them for flights and accommodation. Based on transaction datafrom a consumer panel, the authors conclude that only “two of the six loy-alty program participants showed substantial excess loyalty deviation,” butsuch deviations were also observed for non-members of the loyalty program.The authors conclude that they find no evidence to support an increasedpenetration or purchase frequency resulting from the incentive effects. Asecond study investigated the profitability of Tesco’s loyalty program usingdata on market share and share of category requirements during 1994, 1996,and 1997, and concluded that “on the evidence available, there has been lit-tle impact on the share loyalty of individual customers so far” (East, Hoggand Lomax 1998). Hence the veracity of the theoretical arguments presentedabove is yet to be documented.
The only direct evidence in support of frequent shopper programs is availablein Dreze and Hoch (1998) who experimented with a Baby Bucks program fora period of six months at all 70 locations of ABCO Markets in Phoenix andTucson, AZ. The program, backed by radio and TV commercials, windowbanners, both in-aisle overhead banners and shelf talkers, offered consumersBaby Bucks that could be redeemed for a $10 store-wide gift certificate afterspending $100 during an earn period in the “baby products” category. Theprogram yielded a 25% increase in category sales, transaction size on baby
3
5
Bell and Lal: The Impact of Frequent Shopper Programs in Grocery Retailing
Published by Berkeley Electronic Press Services, 2002

products also went up by 7.5% and the number of customers buying babyproducts rose by 25% while store traffic increased by only 5%.
In this paper we investigate the effectiveness of frequent shopper programsin grocery retailing. Grocery retailing is one of the least profitable sectorsof the economy with net margins of 1-2% and the competition for shoppersis fierce. There aren’t many ways to differentiate grocery stores. Weeklyfliers in any given geographical area, based on the same vendor supportedtrade promotions, are also unable to create a point of difference in the eyesof the consumer. Not surprisingly, grocery shoppers have become well knownfor their promiscuity, with most shopping at more than one store regularly.Even more importantly, these shoppers are known to split their weekly gro-cery baskets across several competing formats. Given the success of frequentflyer programs in an environment where one airline is perceived to be nodifferent than another, the grocery industry has moved to adopt the frequentshopper program as a panacea for its misfortunes.
Many frequent shopper programs deliver discounts at the check-out and al-low shoppers to earn a rebate for buying a targeted amount of grocerieswithin a well defined period. As the latest craze in the grocery industry,61% of retailers had or planned to have a frequent shopper program, ac-cording to a Food Marketing Institute survey (The Commerial Appeal, May17,1998). More recently, Retail Advertising and Marketing Association In-ternational reported that the average household participating in any frequentshopper program has 3.2 cards (Shepherdson, Feb 2000). Sixty-six percentof U.S. households belong to at least one grocery frequent shopper programand 57% belong to two. However, the success of these loyalty programs inthe grocery industry is unclear (Kramer, Sept 15, 2000). Kramer contendsthat even though Grocery Manufacturers of America’s most recent reporton the subject argues that “leveraging consumer data is critically importantto the future of the grocery industry, on the basis of Kraft’s and Procter &Gamble’s experience at Wegmans, Wegmans is the exception rather than therule. Most frequent shopper programs are really frequency programs thatuse discounts to sway consumer loyalty. This short term approach eventu-ally becomes just a sophisticated form of matchable price competition. Mostcard programs are offered to shoppers indiscriminately and deliver incentivesacross the board, regardless of shopper value.” In this paper we provide the
4
6
Review of Marketing Science Working Papers, Vol. 2, Iss. 1 [2002], Art. 1
http://services.bepress.com/roms/vol2/iss1/paper1
first empirical study of the impact of different implementations of frequentshopper programs on household shopping behavior in grocery retailing.
The rest of the paper is organized as follows. In the next section we ana-lyze frequent shopper data that have been made available to us by a grocerychain. We find that while the program achieved its objective of increasingspending by its best customers, more surprisingly, we find that the increasein spending by customers in lower spending deciles is even greater than thatby its best customers. In contrast, the redemption of the rewards is the high-est among the higher spending deciles. The chain makes incremental profitsfrom the frequent shopper programs despite the programs’ lack of profitabil-ity with the best customers.
In section 3 we construct a model whose predictions match our empiricalfindings. Our Hotelling-like one-period model explicitly allows for consumersto cherry-pick between competing stores. It predicts that frequent shopperprograms improve profitability when one of the competing stores offers a pro-gram. Our model shows that the increase in profits stems from the reductionin shopping costs motivated by the rewards of the frequent shopper program.These system wide savings are reflected in higher profits to the stores andbetter prices to consumers who increasingly shop for the basket at a singlestore. We use data on trip frquency and basket size to provide empiricalsupport for our theoretical model.
In section 4, we extend our model of frequent shopper programs in two ways.First, we demonstrate that frequent shopper programs continue to be prof-itable even when the competing store offers a frequent shopper program.Second, we consider situations where stores sell to consumers with varyingshopping costs. We show that frequent shopper programs can reduce prof-itability by denying stores the opportunity to price discriminate betweencustomers. In this more realistic setting we discover how and why frequentshopper programs can be a money sink for competing stores.
We conclude with a discussion of our results and directions for future re-search.
5
7
Bell and Lal: The Impact of Frequent Shopper Programs in Grocery Retailing
Published by Berkeley Electronic Press Services, 2002

2 Frequent Shopper Program Data
We have been provided frequent shopper program data by a supermarketchain in the mid-west U.S.A. that prefers to be anonymous. The chain hasa dominant share of its market. The clientele of this chain tends to be moreupscale, older, more educated, with higher income and a smaller family. Theonly major source of competition is from Albertsons which did not have aloyalty card. The chain has had a card program since late 1995 and has usedit to provide a variety of benefits to its card customers in the form of cliplesscoupons, item discounts, video rentals, rewards for loyalty, surprise rewardsand automatic contest entries. By 1998, the chain had about 200,000 house-holds in the program with about the top 20% of customers accounting for80% of sales. Almost 90% of sales and 70% of transactions were reported tobe swiped through the card.
During 1998 and 1999 the chain implemented a series of reward programsto increase sales to its best customers. In 1998 the chain introduced threedifferent kinds of frequent shopper programs. The first, around Easter, was aham promotion where consumers who spent $475 or more in the store duringa six-week earn period received a certificate for a whole ham to be redeemedduring a five-week period around Easter. Those spending between $325 -$474 received a certificate for a half ham. A second frequent shopper rewardprogram was run during another six-week period during April-May with theredemption period set for the month of June. In this program, consumershad to spend $600 or more to get a certificate for a 15% discount couponfor a single purchase, a 10% discount coupon was awarded to those spendingbetween $450 - $599 and a 5% discount coupon was mailed to those spendingbetween $150 - $449. The final frequent shopper program of the year wasimplemented for a period of eight weeks starting soon after Labor Day andending before Thanksgiving. Customers spending more than $815 got a cer-tificate for a Butterball turkey plus a 15% discount coupon to be redeemedover the following four-week period. Customers spending between $625 -$815 received a certificate for a Butterball turkey, and consumers spendingbetween $485 - $624 received a certificate for a Little Butterball turkey.
In 1999, the supermarket chain did not run a ham promotion but improvedthe terms of the 5/10/15% discount to 10/15/20%. This frequent shopper
6
8
Review of Marketing Science Working Papers, Vol. 2, Iss. 1 [2002], Art. 1
http://services.bepress.com/roms/vol2/iss1/paper1
program was also implemented during a six-week period during April-May,1999, with the redemption period set for the month of June. In this program,consumers had to spend $600 or more to get a certificate for a 20% discountcoupon for a single purchase, a 15% discount coupon was awarded to thosespending between $400 - $599 and a 10% discount to those spending between$200 - $399. The chain also ran an improved turkey promotion in 1999 bydecreasing the required spending levels to qualify for a discount coupon. Cus-tomers spending more than $750 over a six-week period earned a certificatefor a Butterball turkey plus a 15% discount coupon to be redeemed over athree-week period. Customers spending between $500 - $749 received a cer-tificate for a Butterball turkey, and consumers spending between $250 - $499received a certificate for a Little Butterball turkey.
2.1 Analysis of the Ham Program
As indicated earlier, the objective of the ham program was to increase salesto the best customers (as articulated by Woolf 1996) and consequently theprofitability of the stores. To analyze the impact of the ham program andestimate the differential impact on the best customers (high spenders) andthe worst customers (low spenders), household spending data are availableto us for the following time periods: a pre-ham promotion period, denotedas P1, lasting from Jan 1 - Feb 7, 1998; the ham promotion period, denotedas P2, during Feb 8 - March 21, 1998; and the redemption period, denotedas P3, of March 22 - April 18, 1998. We also have data for the correspondingthree periods in 1999 when no such ham program was offered. The availabledata can be summarized as shown in Table 1 with the six different periodsidentified as P1-P6. Moreover, we know that all those who qualified to receivea reward by spending more than $325 during the earn period were mailed areward to be redeemed during P3. All households who redeemed the awardare also identified in our data set.
In order to estimate the impact of the Ham program on the best and worstcustomers, our approach is to look at a pool of best customers (defined later)and estimate the change in spending levels during the ham promotion periodas compared to a control condition. The control condition provides an esti-mate of the spending level that could be expected of them in the absence of
7
9
Bell and Lal: The Impact of Frequent Shopper Programs in Grocery Retailing
Published by Berkeley Electronic Press Services, 2002

the ham program. We can then compare these changes across consumers whoredeemed the reward versus those who did not redeem the reward to iden-tify the impact of the program. This analysis is based on the presumptionthat consumers who are not interested in the program or do not pay atten-tion to the program, do not change their shopping behavior and thereforedo not redeem the reward even if they qualify. In contrast, consumers whopay attention to the program are also likely to redeem the reward. Hence,a comparison of the changes in spending levels during the ham promotionperiod across these two groups of consumers provides an estimate of the im-pact of the ham program. Similar estimates for the low spenders provide usthe variance in the impact of the program across the consumer population.We recognize that there may be some customers who paid attention to thefrequent shopper program but could not redeem the reward for other extra-neous reasons or some who had not heard of the program until they receiveda coupon in the mail. Such possibilities are likely to result in our estimatesof the impact of the program to be conservative.1
1More precisely, we hypothesize that if a consumer is involved in the program, theimpact of the program as measured by the spending level in the promotion period is
Sj
involved = Sj
control + Effect of the Program + error, and
Skuninvolved = Sk
control + error,
where Sj are all the households that are involved in the frequent shopper program andtherefore pay attention and respond to it; Sk are all the households that are not involvedin the program, pay no attention to it and therefore are not affected by it. However, wehave no indication of a household’s level of involvement in our data set. We only observeif the household redeemed the reward that was mailed to them upon qualifying for one.Therefore,
Slredeemed = Sl
control + Effect of the Program ∗ β + error, and
Smdid not redeem = Sm
control + Effect of the Program ∗ α + error,
where β captures the impact of consumers who redeemed the award but did not hearabout it and α captures the fact that some consumers might have been affected by theprogram but did not redeem the reward for some extraneous reasons. Thus the differencebetween those who redeemed the reward and those who did not redeem the reward providesa conservative estimate of the impact of the frequent shopper program.
8
10
Review of Marketing Science Working Papers, Vol. 2, Iss. 1 [2002], Art. 1
http://services.bepress.com/roms/vol2/iss1/paper1

The impact of the frequent shopper program during Feb 8 - March 21, 1998can be assessed by comparing the household purchases during ham promo-tion period with those in a control condition, the pre-ham-promotion period,Jan 1- Feb 7, 1998.
To classify customers as best customers versus worst customers, we use thecut-offs in the ham promotion program to form natural categories. The hamprogram rewarded all those spending $475 or more during the promotionperiod with a coupon for a full ham, those spending between $325 and lessthan $475 with a coupon for half ham and, those spending less than $325were not rewarded. We therefore categorized all those who were expected tospend $475 or more as the best customers, all those who were expected tospend between $325 and less than $475 as better customers and the restwere classified as worst. We used spending levels (S1) in the pre-ham pro-motion period in 1998 (P1) to estimate the expected spending levels duringthe ham promotion period and classified consumers as best, better and worst.
We can now estimate the impact of the Ham promotion program by regressingthe dependent variable, spending level during the ham promotion period (P2)minus the spending level in the pre-ham promotion period (P1)(normalizedfor the same number of days), S2-S1, on the following 6 independent variableswith no constant term in the regression equation. The independent variablesin the regression equation are indicator variables for the following categories:
(a) Best customers who redeemed the reward(b) Best customers who did not redeem/get the reward(c) Better customers who redeemed the reward(d) Better customers who did not redeem/get the reward(e) Worst customers who redeemed the reward(f) Worst customers who did not redeem/get the reward
Null-Hypothesis: If the Ham Program does not have an impact on shop-ping behavior of those who redeemed the reward, there should be no differ-ence in the dependent variable between consumers who redeemed the rewardand those who did not redeem/get the reward, for any of the three groups ofcustomers (best, better and worst).
9
11
Bell and Lal: The Impact of Frequent Shopper Programs in Grocery Retailing
Published by Berkeley Electronic Press Services, 2002

The results of this regression analysis are presented in Table 2. These resultsindicate that while difference in spending between customers who redeemedthe reward and those who did not redeem the reward among the best cus-tomers was $98.02, the corresponding difference among the better and worstcustomers was much higher, $140.98 and $150.55, respectively. We thereforereject the null hypothesis and conclude that the frequent shopper programhad an impact on shopping behavior. Moreover, we observe that the impactof the program is not the highest among the best customers. It is the bet-ter customers and worst customers who seem to respond more to the Hampromotion as compared to the best customers. These differences across thebest, better and worst customers are even more salient when one takes intoaccount the fact that the expected average spending of the best customerswas $641 while the expected average spending for the better customers wasonly $387. With average expected spending for all others to be $172, wecan conclude that the Ham promotion had the biggest impact in percentageterms on the worst customers and the least impact on the best customers:contradicting the dictates of Woolf (1996).
We also observe that 5941 of the “best” customers redeemed the reward,yielding a redemption rate of 69.7 %. Redemption rates among the “better”and “worst” customers were significantly lower at 42.0% and 12.4%, respec-tively. Clearly, the “worst” customer group consists of consumers who werenot expected to qualify for the reward and therefore the low redemption ratesare not surprising. However, as also reported in Table 2, these differences inredemption rates continue to hold even when we reduce the sample to onlythose consumers who qualified to receive the reward due to their spendingin period 2. Thus we notice that while the impact of the Ham promotionprogram is the least among the best customers, the redemption rate is thehighest among this group.
We are informed by the grocery chain that the average cost of goods soldis about 75% and that the retail value of full ham and half ham was $25and $15, respectively. The data show that 5941 consumers increased theirspending by $98.02, 2454 consumers increased their spending by $140.98 and2170 consumers by $150.55. Moreover, while 4461 consumers redeemed halfa ham, 6104 consumers redeemed a full ham. Therefore we can calculate theprofitability of the program to be 5941*$98.02*0.25 + 2454*$140.98*0.25 +
10
12
Review of Marketing Science Working Papers, Vol. 2, Iss. 1 [2002], Art. 1
http://services.bepress.com/roms/vol2/iss1/paper1
2170*$150.55*0.25 - 4461*0.75*$15 - 6104*0.75*$25 = $149,111.90 from the31,789 consumers, before overhead costs.
To summarize, our analysis allows us to conclude that:
(i) The ham program had the least impact on the shopping behavior of thebest customers.(ii) The percentage of customers redeeming the reward is the highest amongthe best customers.(iii) The program was profitable not because of the impact on the shoppingbehavior of the best customers but instead most of the profitability was dueto the impact on the behavior of all but the best customers.
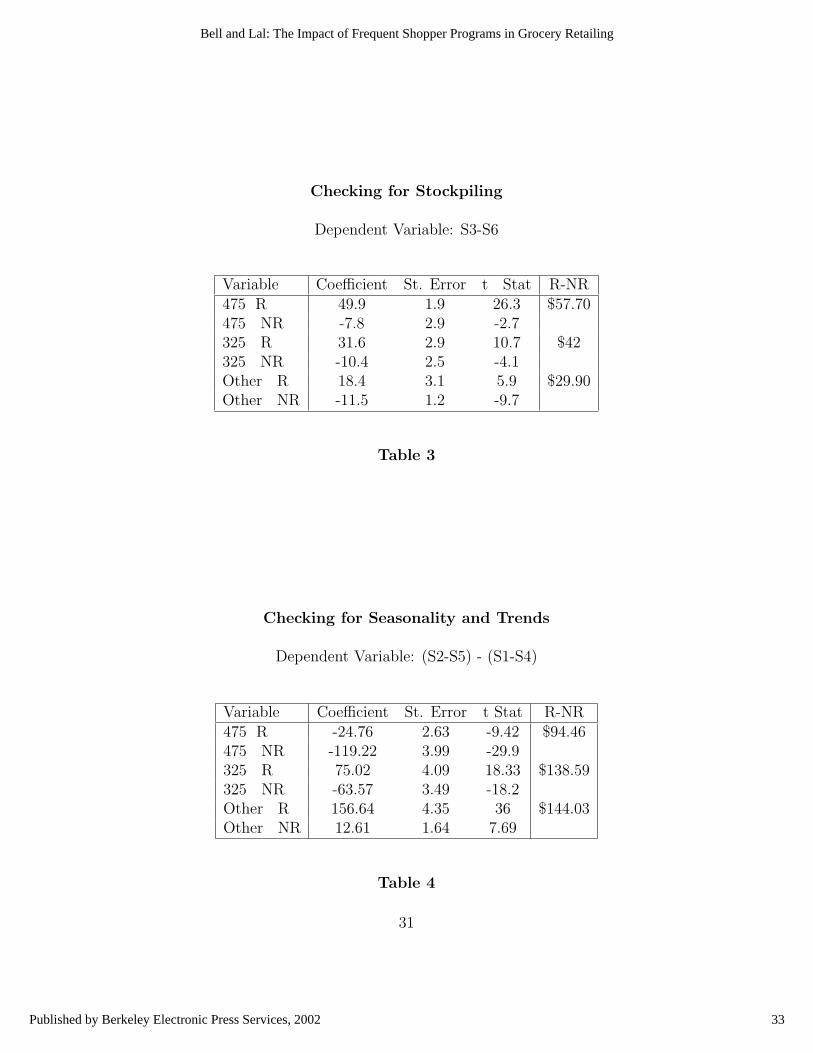
Before accepting these results at their face value we recognize that there maybe some concerns about our estimates. First we need to consider the pos-sibility of a stockpiling effect. It is well known that promotions often leadconsumers to buy more in the promotion period, only to purchase less infuture periods thereby creating the well known post-promotion dip. We needto look at sales in the redemption period and check if they were adverselyaffected by the purchasing behavior during the ham promotion period. Toinvestigate this issue, we use (S3- S6), sales in redemption period in 1998(P3) minus the sales in the corresponding period in 1999 (P6) (when noham promotion was offered). (S3-S6) should be negative in the presence ofa stockpiling effect. Therefore, the difference between the estimate of (S3-S6) for those who redeemed the coupon and those who did not redeem thecoupon should also be negative in presence of the stockpiling effect. Theresults of the regression analysis with (S3-S6) as the dependent variable andthe six indicator variables used before as the independent variables are pre-sented in Table 3. Consumers were classified as best, better and worst onthe basis of their spending levels (S1)in the pre-ham-promotion period (P1).The regression results show that the difference between those who redeemedthe coupon and those who did not redeem the coupon continues to remainpositive and significant. This implies that the ham promotion actually hada carry-over effect rather than suffering from a stockpiling effect. We alsoran a similar regression with (S2+S3) - (S5+S6) as the dependent variable.(S2+S3) are the purchases during and after the ham promotion period in1998 and (S5+S6) are purchases in the corresponding periods in 1999. If a
11
13
Bell and Lal: The Impact of Frequent Shopper Programs in Grocery Retailing
Published by Berkeley Electronic Press Services, 2002
stockpiling effect was present, we would expect the difference between thosewho redeemed the coupon and those who did not redeem the coupon to dis-appear. However, our results indicate that the difference for the three groupsremain significant and again are the lowest for the best customers as a per-cent of average expected spending.
A second concern relates to possible seasonality in the data, sales closer toEaster are generally higher than those at the beginning of the year, for ex-ample. We therefore re-analyze the data controlling for seasonality. We usedata in Feb 8 - March 21, 1999 as the control condition because the hamprogram was not offered in 1999. While the comparison between purchasesduring Feb 8 - March 21, 1998 (Ham Promotion) and Feb 8 - March 21,1999 (No Ham Promotion) controls for seasonality, these differences may beaffected by year-to-year trends due to inflation or natural changes in familyconsumption patterns. To control for possible year-to-year trends, we usethe difference in sales in Periods 1 (Jan 1-Feb 7, 1998) and 4 (Jan 1-Feb 7,1999) identified in Table 1. Therefore the impact of the Ham Program canbe measured as (S2-S5) - (S1-S4). We use spending levels in the pre-hampromotion period in 1998 (P1) to estimate the expected spending levels andclassify consumers as best, better and worst. Using the same independentvariables as used before, the regression analysis yielded the results presentedin Table 4. The results of this regression show that among consumers whowere expected to spend $475 or more (best customers), the difference in con-sumer spending between those who redeemed the coupon and those who didnot was $94.46, during the ham promotion period. Similarly, among con-sumers who were expected to spend between $325 and less than $475 (bettercustomers), the corresponding difference was $138.59; and finally for thoseexpected to spend less than $325 (worst), the difference was $144.03. Thusthe basic findings reported earlier remain unaffected by potential seasonalityand trends in the data.
A third concern relates to the possibility of mis-classification of a consumergiven our use of spending levels in the pre-ham promotion period in 1998.In other words, a consumer spending slightly more than $475 is classified asbeing among the best customers but could actually have been among thebetter consumers. The spending level used for classification is equal to atrue value plus an error term. Some consumers who are classified as the
12
14
Review of Marketing Science Working Papers, Vol. 2, Iss. 1 [2002], Art. 1
http://services.bepress.com/roms/vol2/iss1/paper1

best consumers may actually be among the better consumers, and some con-sumers who are classified as better consumers may actually be among thebest consumers. A similar possibility exists among the better and the worstconsumers. The question arises if this error in classification creates biasesthat do not allow us to conclude that the impact of the program is the leastfor the best customers and the most for the worst customers. To addressthis concern, we conducted a sensitivity analysis on the cut-off values usedto classify consumers to be among the best, better and worst. For example,when we used a cut-off of $500 and $350 in lieu of $475 and $325 to assignconsumers into the three groups: best, better and worst, the difference in thespending levels between consumers who redeemed the coupon and those whodid not, remain unchanged. Table 5a presents the results of this sensitivityanalysis using different cut-off values with the dependent variable as S2-S1.
We also addressed this issue by taking an extreme step of using only thoseconsumers who actually spent more than $325 during the ham promotionperiod and therefore qualified to receive a coupon for half or full ham. WithS2-S1 as the dependent variable, we find that among those who were expectedto spend more than $475 during the promotion period (best customers), thedifference in spending between those who redeemed and did not redeem was$46.64. The corresponding difference among the better and worst customerswas $59.85 and $71.20 respectively. Thus even among those who qualifiedand received the coupon, the program was the least effective among the bestcustomers.
We addressed the issue of mis-classification in two other ways. First we inves-tigated the impact of mis-classification on spending levels in 1999, when noham promotion was offered. If our results are effetced by mis-classification,these results should persist even when no ham promotion is offered. There-fore we use a dependent variable, S5-S4, spending in 1999 during the periodcorresponding to the ham promotion period in 1998 minus spending in 1999during the period corresponding to the pre-ham promotion period in 1998.The independent variables are the same as those in Table 2. To make a con-sistent comparison, we focused only on the qualifying households, i.e., thosespending more than $325 in P5. Each of these households was categorizedinto one of the six groups based on their spending levels in the pre-ham-promotion period in 1999 (P4), and assigned randomly to have redeemed
13
15
Bell and Lal: The Impact of Frequent Shopper Programs in Grocery Retailing
Published by Berkeley Electronic Press Services, 2002

the reward according to the probabilities observed in 1998. So, for exmaple,all households that were expected to spend $475 or more in P5 (based ontheir spending in P4) were randomly assigned to redeem the reward with aprobability of 0.742, as reported in Table 2. Similarly, all households thatwere expected to spend more than $325 but less than $475 in P5 (based ontheir spending in P4) were randomly assigned to redeem the reward with aprobability of 0.593, as reported in Table 2. in In effect, we have tried torepeat the statistical procedure that was used to analyze the 1998 data, onthe 1999 data (when no ham promotion was offered). Table 5b presents theresults of this regression and shows that, there is no statistical differencebetween the spending levels of redeemers and non-redeemers forany of the three customer groups. We therefore reject the hypothesisthat our results in 1998 are due to classification biases induced by our sta-tistical analysis. Second, we ran a regression on change in spending leveldue to the ham promotion period, as measured by S2-S5, on spending inP1, whether a household redeemed a reward and the interaction between thetwo aforementioned variables. The regression results as shown in Table 5cindicate significant affects for each of the three independent variables and inparticular have a negative sign for the interaction variable; again confirmingthe finding that the impact of the program is higher at lower levels of spend-ing.
In summary, after checking for potential stockpiling effects, seasonality andtrends, and the possibility of mis-classification of customers, we concludethat(i) the best consumers responded the least to the ham promotion(ii) the best customers are most likely to redeem the reward(iii) overall the ham program was profitable (before overheads).
2.2 Analysis of the Discount and Turkey Program
In analyzing the impact of the 5/10/15% discount program in 1998, and the10/15/20% program in 1999, we again used the spending in the discount pro-gram period minus the spending in the previous period, in the same year, asthe dependent variable. However, since there are more categories of spend-ing levels than in the ham program, the dependent variable was regressed
14
16
Review of Marketing Science Working Papers, Vol. 2, Iss. 1 [2002], Art. 1
http://services.bepress.com/roms/vol2/iss1/paper1

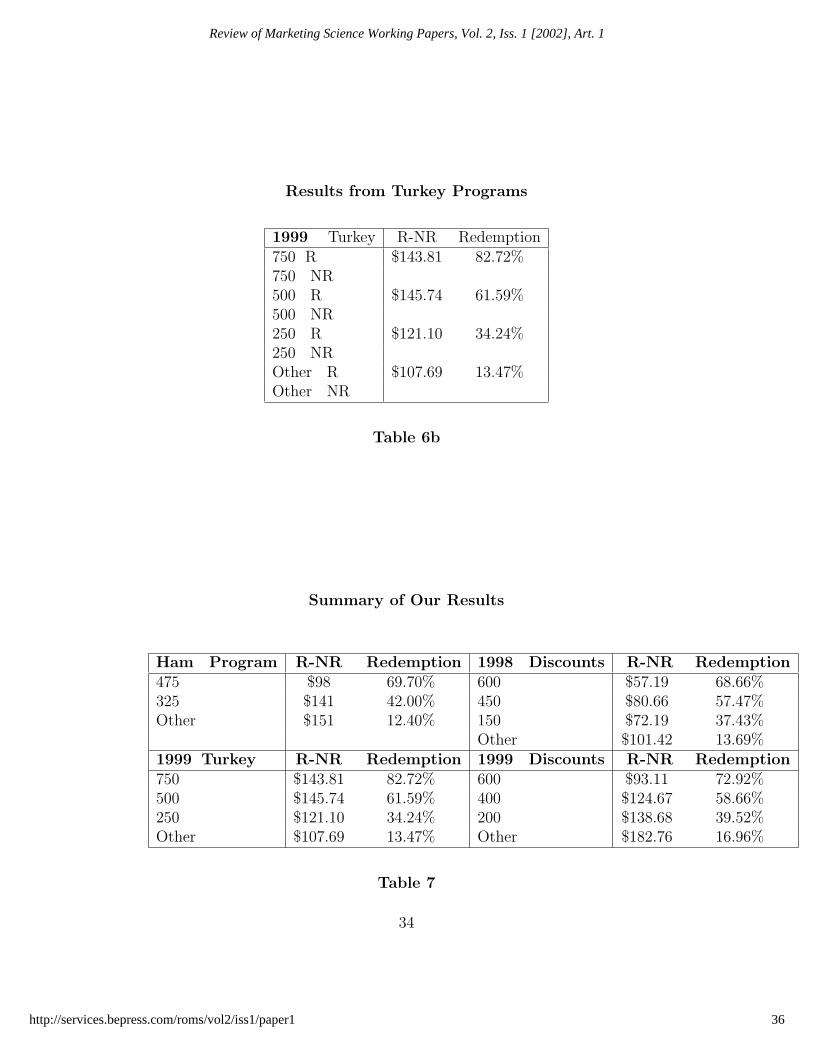
on eight indicator variables as identified in Table 6a. Table 6a also presentsthe differences in spending levels of the redeemers and non-redeemers amongthe different categories for both 1998 and 1999. Table 6a also presents theredemption rates, defined by the number of redeemers divided by the numberof households in the category. We see that the basic pattern in these resultsis exactly as observed in the ham program. The best customers are leastresponsive to the program, as a percentage of their spending levels, but havethe highest redemption rates. Finally, using an analysis similar to that re-ported for the discount programs, the turkey promotion yielded results thatare reported in Table 6b; again reconfirming the pattern of effects seen inthe other programs.
A summary of the effects of these programs is available in Table 7. Theyshow three systematic effects:
(a) These programs have the greatest impact on the behavior of the lowerdecile customers rather than the best customers.
(b) The percentage of customers redeeming the reward is highest amongthose consumers whose behavior is changing the least.
(c) The chain loses money on the best customers because a higher frac-tion redeem the reward without changing their buying behavior significantly.However, a lower redemption rate among the worst consumers along with amuch higher increase in spending leads to higher profitability for the chain.These frequent shopper programs are profitable in the aggregate.
3 An Explanation
Our empirical research suggests that supermarket frequent shopper pro-grams, as currently implemented, are an attempt to get customers to spendmore at a store in exchange for a discount - be it a ham, turkey or a discount.In this section we seek to offer an explanation for the impact of such pro-grams; where it is profitable to offer a frequent shopper program if only oneof the competing firms offers the program and that such programs influence
15
17
Bell and Lal: The Impact of Frequent Shopper Programs in Grocery Retailing
Published by Berkeley Electronic Press Services, 2002

the behavior of the worst customers (defined by their spending level at thestore) more than that of the best customers. Our modeling effort builds onthe work of Lal and Matutes (1994) and Lal and Rao (1997) that modelscompetition between two stores where consumers shop for a basket of goods.Our analysis assumes that two supermarkets, A and B, located at the endof a line of unit length, carry the same assortment of products as reflectedin a typical basket of goods purchased by shoppers, but perhaps at differentprices. For the sake of expositional simplicity, the marginal costs of the goodsto the stores are assumed to be zero.
Consumers are located uniformly along the line connecting the two storesand incur a shopping cost c, to and fro, per unit distance. This parameteris often interpreted as the travel cost to a store but more generally as theparameter that captures the degree of differentiation between stores. Thelatter interpretation involves c as the cost associated with the distance be-tween the consumer’s ideal point and the location of the store in a perceptualspace, where the line connecting the two stores is a vector along dimensionsdifferentiating the two stores. Each consumer is assumed to buy the sameassortment of goods on a regular basis and the store choice decision is deter-mined by the prices of the products and the relative convenience of the twostores. Consumers have a reservation price v for each good, and choose notto buy if the item is not available at a price below the reservation price. Allprices are known to consumers before making the store choice decision.
As mentioned above, stores carry the same assortment of goods but may priceindividual items differently. As a practical matter it is difficult to implementa pricing strategy in which there are no cherry picking opportunities for thededicated shopper. With thousands of items in the grocery store there willalways be some items that are attractive to cherry pickers. The set of allitems in each store can be divided into two baskets: one that consists ofitems that are relatively cheaper in the store and the other of those itemsthat are relatively cheaper in the other store. The price of the basket that ischeaper in store A is assumed to be Pa−d and the price of the basket of goodsthat is more expensive in store A is assumed to be Pa; similarly, the pricesat store B are Pb − d and Pb for these two baskets respectively. We furtherassume that the discount d on the cheaper items in the store is exogenouslydetermined by factors beyond the control of the store and therefore, stores set
16
18
Review of Marketing Science Working Papers, Vol. 2, Iss. 1 [2002], Art. 1
http://services.bepress.com/roms/vol2/iss1/paper1

prices of the items in the grocery basket so as to communicate a price imagecaptured by the decision variables Pa and Pb respectively. Since, all pricesare known to the consumers, the cherry picker therefore can pay 2Pa − d byshopping for all items at store A or pay Pa + Pb − 2d by cherry picking. Ourmodel therefore has two key parameters that capture the trade off faced bythe cherry picker: c, the opportunity cost of shopping around, and d, thesavings potential.
3.1 Analysis of The Pure Price Game
For benchmark purposes, we begin by ignoring discounts and setting d = 0.In this case there is no incentive for any customer to cherry pick and everyconsumer shops either at store A, or store B, but not both. The marginalcustomer is located at a distance x from store A where
2Pa + 2cx = 2Pb + 2c(1− x)
that is x =c + Pb − Pa
2c.
Assuming that the reservation price is sufficiently high to cover the price ofthe goods and the shopping costs, store A’s profits are
2Pax = Pa
{c + Pb − Pa
2c
},
and are maximized when Pa = 0.5(c+Pb). By optimizing 2Pb(1−x) or simplyby recognizing the symmetry between A and B we deduce that P ∗
a = P ∗b = c.
Total profits to store A are 2xPa = c. Note that the profits to the stores arerelated to travel costs rather than the value added of the items.
These results are well established but serve as a benchmark for our lateranalyses.
17
19
Bell and Lal: The Impact of Frequent Shopper Programs in Grocery Retailing
Published by Berkeley Electronic Press Services, 2002

3.2 The Case of Promotional Pricing
If d > 0, consumers that are located closer to store A are likely to purchasethe basket at store A and this fraction is
xa =
{2c + Pb − d− Pa
2c
}.
Similarly all consumers located at a distance greater than xb from store A,where xb =
{Pb−Pa+d
2c
}buy the complete assortment from store B. All con-
sumers located between xa and xb cherry pick and buy the lower priced goodat each store. Such cherry pickers exist only if xb > xa, i.e., d > c, thatis the discounts have to be large enough (compared to the shopping costs)to make cherry picking worthwhile. If the discounts are too large, everyonecherry picks; i.e., xa < 0 and xb > 1. In equilibrium this happens if d = 2c,and discounts are large enough to cover the total costs of shopping aroundfor all consumers.We conclude that promotions d induce(i) no cherry picking if d ≤ c,(ii) some cherry picking if 2c ≥ d ≥ c.
We know that store profitability is equal to c in case (i). What about theother case ? In case (ii), store A will wish to maximize
(2Pa−d)xa+(Pa−d)(xb−xa) = (2Pa−d)2c + Pb − d− Pa
2c+(Pa−d){d/c−1}.
Differentiating with respect to Pa yields
2 +1
c{Pb − Pa − d− Pa + 0.5d + d} − 1 = 1 +
Pb
c− 2Pa
c+
d
2c.
Knowing that a symmetric equilibrium dictates P ∗a = P ∗
b we see that theoptimal solution is given by
1 + P ∗a /c− 2P ∗
a /c + d/2c = 0; i.e. P ∗a = P ∗
b = c + 0.5d.
The equilibrium profits therefore are c − 0.5d(d/c − 1) which is less than cfor all d > c, and are zero when d = 2c.
18
20
Review of Marketing Science Working Papers, Vol. 2, Iss. 1 [2002], Art. 1
http://services.bepress.com/roms/vol2/iss1/paper1

3.3 Introducing Loyalty Programs
As the results in Section 2 are for a mid-west supermarket chain that is theonly competitor in its trading area to offer a frequent shopper program, webegin by assuming that only one store, store A, offers a loyalty program. Thisstore offers a discount of L to all consumers who buy both goods at storeA, otherwise, the regular price at store A is Pa and the discounted price isPa − d. The profits to store A, if some consumers continue to cherry pick,which requires c + 0.5L < d < 2c, are:
Πa = (2Pa − d− L)
{Pb − Pa − d + L + 2c
2c
}+ (Pa − d)
{2d− 2c− L
2c
}.
Differentiating with respect to L and Pa respectively, we get
∂Πa
∂L=
2Pa − 2L− 2c− Pb + d
2c,
and∂Πa
∂Pa
=−4Pa + 2L + 2c + 2Pb + d
2c.
Setting the first order conditions to zero and solving, we get
Pa = d + 0.5Pb, and L = 1.5d− c.
At the optimal value of L there is no cherry picking because 2d− 2c−L < 0when L = 1.5d−c, and d < 2c. The profits to the stores are c, and are higherthan in the case where no store offers a frequent shopper program.2 Theseresults are consistent with the empirical results presented in Section 2 wherefrequent shopper programs are observed to have increased profitability. Ourmodel suggests that the increase in profitability results from the reduction inthe welfare loss incurred due to cherry picking. This welfare loss is recoveredthrough the frequent shopper program and part of it goes to the store inthe form of increased profitability. Moreover, since the fraction of consumersshopping for a single item is reduced from 2d−2c
2cto 2d−2c−L
2c, it is easily seen
2In case of no cherry picking, the market share of store A is x where x is such that2Pa−d−L+2cx = 2Pb−d+2c(1−x). The profits to store A therefore are (2Pa−d−L)∗xand those to store B are (2Pb−d)(1−x). Let 2Pa−d−L = Ya and 2Pb−d = Yb. The profitsto store A can rewritten as Ya ∗ x and those to store B as Yb ∗ (1− x) and x = 2c−Ya+Yb
4c .Now it easily seen that in equilibrium Ya = Yb and the profits to the two stores are c.
19
21
Bell and Lal: The Impact of Frequent Shopper Programs in Grocery Retailing
Published by Berkeley Electronic Press Services, 2002

that cherry pickers are spending more at store A by buying the complete bas-ket at the store. This contrasts with the behavior of loyal customers whichremains unaffected.
To summarize, we conclude from our model that:
(a) the frequent shopper programs are profitable even when only one retaileroffers such a program;
(b) they are profitable because they help reduce cherry picking and the re-duction in systemwide shopping costs show up in the form of higher profits,and
(c) the frequent shopper programs impact the behavior of the cherry pickersmore than that of the loyal customers.
3.4 Empirical Validity of our Model
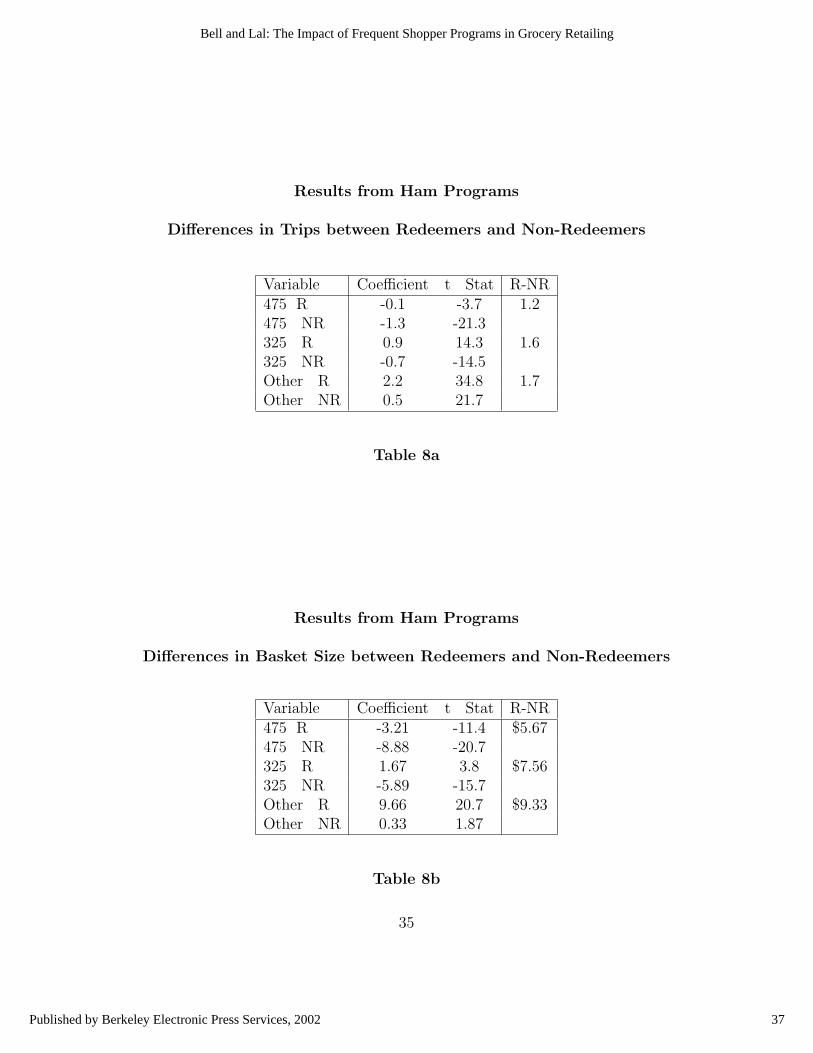
Assuming that frequent shopper programs do not affect the total number oftrips made by a households to grocery stores, we are able to empirically testthe conclusions of our model by estimating the difference in the number oftrips for the redeemers and non-redeemers across the three customer groups.Given our contention that frequent shopper programs impact the behaviorof cherry pickers more than that of the loyal customers by inducing themto shop more at the store, we expect to observe the impact of the programto be the highest for the worst customers. Table 8a presents the results ofa regression analysis where the dependent variable, T2-T1, is the differencein the number of trips during the ham promotion period and the pre-hampromotion period. As expected, the difference between the redeemers andnon-redeemers is the highest among the worst customers; during the hampromotion period, among the worst customers, the redeemers made 1.7 tripsmore than the non-redeemers (compared to an average of 5.8 trips for theworst customers during the ham promotion period). Similarly, among thebest customers, the redeemers made 1.2 trips more than the non-redeemersbut the average number of trips for the best customers was approximately10 trips during this period. The average number of trips for the better cus-
20
22
Review of Marketing Science Working Papers, Vol. 2, Iss. 1 [2002], Art. 1
http://services.bepress.com/roms/vol2/iss1/paper1
tomers was 7.8.
Another test of our model could be with respect to the basket size measuredas the spending per trip. Our model predicts that the introduction of thefrequent shopper program would lead to more consumers buying the basketrather than the single item. We should therefore expect the difference inbasket size for the redeemers and non-redeemers to be higher for the worstcustomers. Table 8b presents the results of such an analysis and shows thatwhile the difference between the redeemers and non-redeemers in the averagebasket size for the best customers was $5.67, the corresponding difference forthe better and worst customers was $7.56 and $9.33, respectively. Hencethe model predictions are again supported by our data. These results findfurther support in the analysis of the discount program, see Table 8c, wherethe impact of the program on trip frequency and basket size for the worstcustomers is again more than it is for the best customers.
While our theoretical model therefore provides an explanation for the em-pirical results presented in Section 2, our experience from talking to retailersthat have implemented frequent shopper programs suggests that few thinkthey have enhanced profitability: some customers may indeed be more loyalin the sense of buying a greater percentage of their food items at a singlestore; but the fruits of this loyalty have yet to find their way to the bottomline. Retailers we have talked to that have so far resisted the introduction ofloyalty programs, express satisfaction at this mixed bag performance, since itrelieves them of the burden - and potential distraction - of introducing theirown loyalty/frequent shopper program.
As we contrast our empirical findings that paint a positive picture on thesuccess of frequent shopper programs with the anecdotal evidence suggestingthe lack of enthusiasm for these programs among leading retailers, we notetwo differences between the circumstances for our mid-western chain andthese leading retailers. First, as mentioned earlier, the mid-western chain,unlike many supermarket chains, does not face competing loyalty programs.Second, while our model assumes homogeneity (every customer has the sametravel costs), supermarkets attract consumers with different shopping costs.In the next section we therefore extend our analysis to investigate the impactof these factors on our theoretical results. These extensions will allow us to
21
23
Bell and Lal: The Impact of Frequent Shopper Programs in Grocery Retailing
Published by Berkeley Electronic Press Services, 2002

formulate hypotheses that could be tested in future.
4 Extending the Model
4.1 Competing Loyalty Programs
We now extend our analysis to the case where both stores offer a frequentshopper program. Suppose stores A and B offer loyalty payments of La andLb to customers who buy both baskets at their store. Cherry pickers don’treceive this payment of course. All consumers located to the left of ya buythe complete assortment from store A where ya is such that
2Pa−d−La+2cya = Pa−d+Pb−d+2c, or ya =
{2c + Pb − d− Pa + La
2c
}.
Similarly, all consumers located to the right of yb buy the complete assortmentat store B where yb is such that
2Pb−d−Lb+2c(1−yb) = Pa−d+Pb−d+2c, or yb =
{Pb + d− Pa − Lb
2c
}.
Assuming that some consumers continue to cherry pick, store A would max-imize (2Pa − d − La)ya + (Pa − d)(yb − ya). Optimizing with respect to Pa
and La yields P ∗a = 2c/3 + d and L∗
a = d− 2c/3 and similarly for P ∗b and L∗
b .These values lead to y∗a = 2/3 and y∗b = 1/3. Since y∗a > y∗b , we conclude thatoffering these loyalty programs eliminates all cherry picking. Any solutionwith the property P ∗
a − L∗a = c + d/2 and L∗
a ≥ d is therefore optimal. Withthe elimination of cherry picking, store A′s profits are as before. The solutionP ∗
a = c + d, L∗a = d means that the two baskets are priced at c + d and c
respectively with a loyalty payment of d, for a total payment of 2c and profitsof c. Thus we find that if loyalty programs are offered by both stores they donot enhance the profitability of the stores compared to the case when onlyone store offers a loyalty program.
4.2 The Case of Two Customer Segments
We will now repeat the analysis of Section 4 assuming that there are twokinds of customers, with shopping costs c1 and c2 respectively where c2 < c1.
22
24
Review of Marketing Science Working Papers, Vol. 2, Iss. 1 [2002], Art. 1
http://services.bepress.com/roms/vol2/iss1/paper1
For the sake of expositional simplicity, we assume that there are equal num-bers of each type, each distributed uniformly between the stores. To keepthe profitability figures comparable with our earlier results, we assume thatthe total number of customers is unchanged. As in the previous section, wehave a number of cases to consider to determine the equilibrium prices andprofitability to the stores.
First consider the case d < c2. In this case no cherry picking takes place andthere are two breakeven distances to calculate, x1 and x2 where, for example,2Pa + 2c1x1 = 2Pb + 2c1(1 − x1), and store A will pick Pa to maximize2Pa(x1 + x2)/2, the divisor reflecting the density of customers. The optimalsolution is
P ∗a = 2c1c2/(c1 + c2)
with a profit of 2c1c2/(c1 + c2).
Next consider the case c2 < d < 2c2 < c1. If d is in this range, some of thec2 customers cherry pick but none of the c1 customers do. We find that theequilibrium prices are
P ∗a = P ∗
b = 2c1c2/(c1 + c2) + d/2
with store profits of 2c1c2/(c1 + c2)− d(d/c2 − 1)/4.
If 2c2 < d < c1, all of the c2 customers cherry pick, but none of the c1 cus-tomers do so. The profits to store A are (2Pa−d)(c1 +Pb−Pa)/2c1 +(Pa−d)and the equilibrium prices are P ∗
a = P ∗b = 2c1 + d/2 with store profits of
2c1 − d/4.
Finally, when c1 < d < 2c1, even some of the c1 customers cherry pick. Theoptimal price remains P ∗
a = P ∗b = 2c1 +d/2 but store profits are 2c1−d2/4c1.
Figure 1 shows a graph of store profits as a function of d. The highest storeprofits occur when d = 2c2. In other words, store profits are maximized whenone segment of consumers cherry picks between the two stores.
The intuition for this graph is as follows. So long as d < c2, no customercherry picks therefore profits are constant for all d ≤ c2. When d exceedsc2, some customers with lower shopping cost begin to cherry pick resulting
23
25
Bell and Lal: The Impact of Frequent Shopper Programs in Grocery Retailing
Published by Berkeley Electronic Press Services, 2002

in lower profits for the stores. This continues until d = 2c2 at which pointall customers with lower shopping costs are cherry picking. When d > 2c2,profits increase substantially but then decline for the same reason as before(losses from cherry picking). The key question that remains to be answeredis why profits increase so substantially when d > 2c2. The answer is that withd ≤ 2c2, some cherry pickers remain in play as potential full basket shoppersand hence influence full basket prices. However, when d > 2c2, all consumerswith shopping costs equal to c2 will never buy both baskets at either store;as a result the full basket prices are influenced only by the price sensitivityof the remaining high shopping cost customers.
We now consider the impact of competing loyalty programs on the shop-ping behavior of the two segments of customers in our model. As before, wecan show that optimal loyalty programs eliminate cherry picking by settingthe reward for buying both baskets at the same store to be at or above d.When 2c2 > d > c2, these optimal loyalty programs increase profits to thestores because eliminating cherry picking restores profits to the same level aswhen d = 0 (see Figure 1). However, when d > 2c2, these loyalty programsdecrease profits because profits when d = 0 are lower. Thus we see thatintroducing competing loyalty programs do not always result in higher profits.
The latest evidence to support the lack of performance comes from the UKwith the scrapping of the pilot program by Asda in August 1999 and thatby Safeway in May 2000. The experience at Safeway is summarized by itscommunications director, “Loyalty is not synonymous with having a loyaltycard. Since we scrapped our ABC card we have gone on gaining customers-one million more have come to us the past year. You can give them a pointfor every penny spent, but it doesn’t buy you loyalty.” Similarly, the Asdaspokesman said that given the high costs of implementing these programs,“we decided we didn’t have to invest in points and plastic to make our cus-tomers loyal.” Our results are also consistent with the sentiments expressedby Kramer (2000), where he concludes that “ ... most frequent shopper pro-grams are really frequency programs that use discounts to sway consumerloyalty. This short term approach eventually becomes just a sophisticatedform of matchable price competition....”
24
26
Review of Marketing Science Working Papers, Vol. 2, Iss. 1 [2002], Art. 1
http://services.bepress.com/roms/vol2/iss1/paper1

5 Summary and Discussion
The current thinking on frequent shopper programs is that they should bedesigned to dig deeper into the pockets of the best customers. Our data froma supermarket chain tells a different story. The frequent shopper programsimplemented by the supermarket chain we studied affected the behavior oflower spending customers more than that of its best customers. Moreover,these programs were profitable despite the fact that the best customers weremore likely to redeem the reward without significant change in their behavior.
These empirical results are not surprising considering that cherry picking is,on the face of it, a bad thing. Customers travel more than is strictly nec-essary; stores sell only low margin items to these customers. It would seemthat a loyalty program that encourages shoppers to buy all of their goods ata single store can be beneficial to all.
We construct a model of competition among stores that highlights the roleof the cherry picker. We capture the essence of their behavior through twoparameters: shopping costs (c) and the potential savings from cherry picking(d). The analysis of our model makes predictions that are consistent with ourempirical findings. Furthermore, we provide empirical support for our modelby developing and testing two new hypotheses with respect to trip frequencyand basket size. Extending the model to allow for the existence of customerswith varying shopping costs shows that frequent shopper programs reducecherry picking may actually reduce profitability. This is because price pro-motions add value by providing a way for supermarkets to price segment themarket - low prices to the price sensitive, high (not so low) prices to the priceinsensitive. The problem with discount-based frequent shopper programs isthat they are fairly costly and offer the same deals to all, thus removing thehidden benefit of price segmentation. This may explain why grocery retailersseem largely dissatisfied with frequent shopper programs.
How can frequent shopper programs be successful in the grocery industry?First of all a frequent shopper program cannot be offered indiscriminately.It makes little sense to provide the person who lives next to the supermarketwith a discount for loyalty. Yet it would be a pity to lose any of one’s 100best customers for the sake of a few dollars - companies often give discounts
25
27
Bell and Lal: The Impact of Frequent Shopper Programs in Grocery Retailing
Published by Berkeley Electronic Press Services, 2002
to their best customers. Our analysis, throughout, assumed undifferentiatedstores. The secret seems to be to continue to offer promotions for the pricesensitive cherry picker and value added services for the full basket, less pricesensitive shopper. Retailers can also draw a lesson from the success of loy-alty programs in the airline industry. Airlines reward their best customersthrough improved perks and services rather than better prices and discountseven when the cost of offering a free trip is very low.
Supermarkets need to find ways to reward desirable customers with non-pricebenefits. The loyalty card data should be used to identify the best customers,learn what they like and dislike so that the store can do more of what theywant. An enthusiastic store manager may merchandise the store in responseto remarks and desires of the average customer or worse - the cherry pickerwith time on his/her hands to converse with the store manager. Albert Lee ofLees Supermarket reports being shocked when his loyalty data revealed whowere his 10 best customers. “I could have named only three of them,” he said.
A final word needs to be added about the ability of such programs to mod-ify consumer behavior. These awards should be targeted towards consumerswho have the potential to modify their behavior in a way that is desirableto the franchise. In different industries, different type of customers mayhave the flexibility to change their behavior in response to frequent shopperprograms. For example, in the airline industry, it is the frequent traveller,business customer, who might have the possibility to increase its patronageof one airline over the other. The infrequent traveller who often takes onlytwo family vacations a year may not have much flexibility in choice of airlinesand may take a long time to accumulate the miles for free trips. Hence, itis easier to induce behavior modification among the more frequent travellerthan the infrequent traveller. Frequent reward programs should therefore bedirected towards the business customers and rewards have to be designedso as to encourage such customers to modify their behavior such that theyare beneficial to the airline. In contrast, in the grocery industry, the bestcustomer may already be patronizing the store to a degree that it is difficultto increase the store’s share of wallet. It may therefore be difficult to signifi-cantly change his/her behavior through a frequent shopper program. Hencerewards to frequent shoppers have to be either lucrative enough to changethe behavior of such customers or need to be targeted at a different customer
26
28
Review of Marketing Science Working Papers, Vol. 2, Iss. 1 [2002], Art. 1
http://services.bepress.com/roms/vol2/iss1/paper1

segment.
27
29
Bell and Lal: The Impact of Frequent Shopper Programs in Grocery Retailing
Published by Berkeley Electronic Press Services, 2002
References
Caminal, Ramon and Carmen Matutes (1990), “Enogenous Switching Costsin a Duopoly Model,” International Journal of Industrial Organization, 8,353-373.
Curtis James (1999),“Cards versus Cuts in the Loyalty Wars,” Marketing,London.
Dowling, Grahame R. and Mark Uncles (1997), “Do Customer Loyalty Pro-grams Really Work?”, Sloan Management Review, Summer, 71-82.
Dreze, Xavier, and Stephen Hoch (1998), “Exploiting the Installed Base Us-ing Cross-merchandising and Category Destination Programs,” InternationalJournal of Research in Marketing, 15, 459-471.
East, Robert, Annik Hogg and Wendy Lomax (1998),“The Future of LoyaltySchemes,” Journal of Trgeting, Measurement and Analysis for Marketing, 7,No. 1, 11-21.
Heskett, James L., W. Earl Sasser, Jr., and Leonard A. Schlesinger (1997),“The Service Profit Chain,” Simon and Schuster, New York.
Kim, Byung-Do, Mengze Shi and Kannan Srinivasan (2001), “Reward Pro-grams and Tacit collusion,” Marketing Science, Vol 20, No.2, 99-120.
Kim, Byung-Do, Mengze Shi and Kannan Srinivasan (2001), “Managing Ca-pacity through Rewards Programs,” working paper, Carnegie Mellon Univer-sity.
Klemperer, Paul (1987), “The Competitveness of Markets with SwitchingCosts,” Rand Journal of Economics, 18, No.1 (Spring), 138-150.
Kopalle, Praveen, et. al. (1999), “The Economic Viability of FrequencyReward Programs in a Strategic Competitive Environment,” working paper,Amos Tuck School of Business Administration, Dartmouth College, Hanover,NH.
28
30
Review of Marketing Science Working Papers, Vol. 2, Iss. 1 [2002], Art. 1
http://services.bepress.com/roms/vol2/iss1/paper1

Kramer, Jon (2000),“Fool’s Gold,” Supermarket Business, New York.
Sharp, Byron and Anne Sharp (1997), “Loyalty Programs and their Impacton Repeat-purchase Loyalty Patterns,” International Journal of Research inMarketing, 14, 473-486.
Shepherdson, Nancy (2000), “Holding all the Cards,” American Demograph-ics, Vol 22, Issue 2, 35-37.
Woolf, Brian P. (1996), “Customer Specific Marketing,” Teal Books, Greenville,SC, USA.
29
31
Bell and Lal: The Impact of Frequent Shopper Programs in Grocery Retailing
Published by Berkeley Electronic Press Services, 2002

Available Data for Ham Program
Jan 1 - Feb 7 Feb 8 - March 21 March 22 - April 181998 P1-control P2-Ham Promotion P3-redemption
1999 P4-control P5-control P6-control
Table 1
The Ham Program in 1998
Dependent Variable: S2-S1
Variable Coefficient St. Error t Stat R-NR Redemption Redemption(among qualified)
475 R -35.9 1.78 -20.2 $98 69.7% 74.2%475 NR -133.9 2.7 -49.7325 R 75.9 2.77 27.4 $141 42.0% 59.3%325 NR -65.1 2.36 -27.6Other R 172.6 2.94 58.7 $150.5 12.4% 49.4%Other NR 22.1 1.11 19.9
Table 2
30
32
Review of Marketing Science Working Papers, Vol. 2, Iss. 1 [2002], Art. 1
http://services.bepress.com/roms/vol2/iss1/paper1
Checking for Stockpiling
Dependent Variable: S3-S6
Variable Coefficient St. Error t Stat R-NR475 R 49.9 1.9 26.3 $57.70475 NR -7.8 2.9 -2.7325 R 31.6 2.9 10.7 $42325 NR -10.4 2.5 -4.1Other R 18.4 3.1 5.9 $29.90Other NR -11.5 1.2 -9.7
Table 3
Checking for Seasonality and Trends
Dependent Variable: (S2-S5) - (S1-S4)
Variable Coefficient St. Error t Stat R-NR475 R -24.76 2.63 -9.42 $94.46475 NR -119.22 3.99 -29.9325 R 75.02 4.09 18.33 $138.59325 NR -63.57 3.49 -18.2Other R 156.64 4.35 36 $144.03Other NR 12.61 1.64 7.69
Table 4
31
33
Bell and Lal: The Impact of Frequent Shopper Programs in Grocery Retailing
Published by Berkeley Electronic Press Services, 2002

Checking for Misclassification
Dependent Variable: S2-S1
Difference in Spending Levels of Redeemers and Non-Redeemers
Cut-off Cut-off Cut-off Cut-off Actually Spent500 and 350 475 and 325 450 and 300 425 and 275 325 or more
Best $96.34 $98.02 $98.49 $98.35 $46.64Better $139.85 $140.98 $144.01 $148.27 $59.85Worst $145.50 $150.55 $155.54 $157.51 $71.20
Table 5a
Checking for Misclassification
Dependent Variable: S5-S4
Variable Coefficient St. Error t Stat R-NR475 R -42.32 2.19 -19.3 $3.0475 NR -39.32 3.5 -11.2325 R 83.12 3.65 22.8 -$1.94325 NR 85.06 4.26 20Other R 208.4 4.33 48.1 -$5.03Other NR 213.43 4.32 49.4
Table 5b
32
34
Review of Marketing Science Working Papers, Vol. 2, Iss. 1 [2002], Art. 1
http://services.bepress.com/roms/vol2/iss1/paper1

Checking for Misclassification
Dependent Variable: S2-S5
Variable Coefficient St. Error t Statintercept -37.11 2.07 -17.9Redeem indicator 83.03 4.59 18.08Spend in P1 0.037 0.007 5.25Interaction -0.06 0.01 -5.78
Table 5c
Results from Discount Programs
1998 Discounts R-NR Redemption 1999 Discounts R-NR Redemption600 R $57.19 68.66% 600 R $93.11 72.92%600 NR 600 NR450 R $80.66 57.47% 400 R $124.67 58.66%450 NR 400 NR150 R $72.19 37.42% 200 R $138.68 39.52%150 NR 200 NROther R $101.42 13.69% Other R $182.76 16.96%Other NR Other NR
Table 6a
33
35
Bell and Lal: The Impact of Frequent Shopper Programs in Grocery Retailing
Published by Berkeley Electronic Press Services, 2002
Results from Turkey Programs
1999 Turkey R-NR Redemption750 R $143.81 82.72%750 NR500 R $145.74 61.59%500 NR250 R $121.10 34.24%250 NROther R $107.69 13.47%Other NR
Table 6b
Summary of Our Results
Ham Program R-NR Redemption 1998 Discounts R-NR Redemption475 $98 69.70% 600 $57.19 68.66%325 $141 42.00% 450 $80.66 57.47%Other $151 12.40% 150 $72.19 37.43%
Other $101.42 13.69%1999 Turkey R-NR Redemption 1999 Discounts R-NR Redemption750 $143.81 82.72% 600 $93.11 72.92%500 $145.74 61.59% 400 $124.67 58.66%250 $121.10 34.24% 200 $138.68 39.52%Other $107.69 13.47% Other $182.76 16.96%
Table 7
34
36
Review of Marketing Science Working Papers, Vol. 2, Iss. 1 [2002], Art. 1
http://services.bepress.com/roms/vol2/iss1/paper1
Results from Ham Programs
Differences in Trips between Redeemers and Non-Redeemers
Variable Coefficient t Stat R-NR475 R -0.1 -3.7 1.2475 NR -1.3 -21.3325 R 0.9 14.3 1.6325 NR -0.7 -14.5Other R 2.2 34.8 1.7Other NR 0.5 21.7
Table 8a
Results from Ham Programs
Differences in Basket Size between Redeemers and Non-Redeemers
Variable Coefficient t Stat R-NR475 R -3.21 -11.4 $5.67475 NR -8.88 -20.7325 R 1.67 3.8 $7.56325 NR -5.89 -15.7Other R 9.66 20.7 $9.33Other NR 0.33 1.87
Table 8b
35
37
Bell and Lal: The Impact of Frequent Shopper Programs in Grocery Retailing
Published by Berkeley Electronic Press Services, 2002

Results from Discount Programs
Differences in Trips and Basket Size between Redeemers and Non-Redeemers
1998 Discounts R-NR 1999 Discounts R-NRTrips Basket Size Trips Basket Size
600 0.88 $0.66 600 1.08 $5.14450 0.95 $3.15 400 1.51 $8.42150 1.22 $3.71 200 1.84 $7.45Other 1.4 $9.21 Other 2.18 $15.56
Table 8c
36
38
Review of Marketing Science Working Papers, Vol. 2, Iss. 1 [2002], Art. 1
http://services.bepress.com/roms/vol2/iss1/paper1