Embed Size (px)
Citation preview
1 International Journal of Applied Business and Economic Research
The Impact of Economic Conditions on Bank Profitability of Regional Development Bank in Indonesia
International Journal of Applied Business and Economic Research
ISSN : 0972-7302
available at http: www.serialsjournal.com
© Serials Publications Pvt. Ltd.
Volume 15 • Number 19 • 2017
The Impact of Economic Conditions on Bank Profitability of RegionalDevelopment Bank in Indonesia
Rizky Yudaruddin1
1Lecturer at Faculty of Economics and Business Mulawarman University
Abstract: RDB is a bank with the main working area on a regional level. It makes RDB has a unique positionbecause of its area of operations at regional level resulted in the bank’s profitability is not only influenced bythe economic conditions at the regional level but also at national and international level. Using RDB datapanels during the period 2001-2015, this study examines whether local, national and international economicconditions affect the profitability of RDB in Indonesia. Furthermore, this study also examines industry specificand bank-specific affect the profitability bank. Due to autocorrelation and endogeneity issues, this study employsthe GMM regression analysis. The results show that crisis, GDP, national inflation rate and regional inflationrate are line with expected effect. Meanwhile, the coefficient of GDRP is significant and negative on ROA andROE. Since there is a negative impact of GDRP on profitability, therefore RDB should increase the demandon financial services from consumers when regional economic activity increases to encourage increased bankprofits.
Keywords: Economic Condition, Profitability and Regional Development Banks
I. INTRODUCTION
1.1. Background
Over the last decade, the profitability of Regional Development Bank (RDB) in Indonesia as measured byReturn on Assets (ROA) were above the average of other public banks such as Foreign Exchange CommercialBank, Non Foreign Exchange Commercial Bank Joint Venture Bank, and Foreign Bank. This means RDBmade a great contribution in terms of the overall performance of the bank in terms of profitability.According to the statistics of the annual report from Bank Indonesia (BI), at the end of 2015, ROA RDBreached 2.40 percent higher than Foreign Exchange Commercial Bank, Foreign Exchange CommercialCommercial Bank Joint Venture Bank, and Foreign Bank 1.75 percent, 1.65 percent, 1.01 percent and 1.68percent, respectively.
International Journal of Applied Business and Economic Research 2
Rizky Yudaruddin
This study focuses on the analysis of bank profitability of RDB in Indonesia due to the fact that RDBis a local government-owned bank. The profit generated by RDB is income for local governments that willbe used to finance regional development. The study of the determinants of bank profitability has beenassessed share of researchers involving internal factors and external factors. Internal factors regardinginternal conditions in the bank, such as the size of the bank, risk, and capital. External factors related tomacro-economic conditions such as the level of productivity of the population (GDP) and inflation and asin Greece (Alexiou and Sofoklis: 2009), Malaysia (Sufian: 2009), Sub Sahara (Flamini, et al: 2009) SouthAsia (Sufian: 2012), Europe (Petria et al: 2015) and Indonesia (Agustini and Viverita, 2014).
Using RDB data panels during the period 2001-2015, this study examines whether local, national andinternational economic conditions affect the profitability of RDB in Indonesia. Economic conditions hasseen on the three main variables, namely the international economic condition (measures of the globalfinancial crisis periode 2008-2009), national and regional economic conditions that measures of productivityof the economy (Gross Domestic Product and Gross Regional Domestic Product) and inflation rate(Inflation rate at national and regional levels). I also use control variables that are industry specific(competition) and bank-specific (loan, credit risk, asset, non-interest income and capital).
1.2. Outcomes & Contributions
The contribution of this paper are as follow: first, it is the first paper among empirical banking studies to usemacroeconomic variables measured Gross Regional Domestic Product (GRDP) and inflation rate at regionallevels while the previous research involving macroeconomic variables measured the national level (Athanasoglou,et al 2008; Sufian, 2009; Flamini, et al, 2009; Sufian, 2012; Agustini and Viverita, 2014 and Petria et al, 2015).Second, this study extends the literature by documenting some of the economic factors that impact theperformance of regional development banks. Previous studies on the determinants of bank profitability inIndonesia only focus on banks listed on the Indonesia Stock Exchange (Agustini and Viverita, 2014).
II. STUDY REFERENCES
2.1. Profitability
Profitability of banks became the object of interest to a wide range of researchers in particular regardingthe determinants of bank profitability. Based on Athanasoglou, et al (2008), Ben Naceur and Goaiedm(2008), Sufian (2009), Sufian and Habibullah (2009), Sufian (2012), and Pattitoni, et al (2014) profitabilitymeasured by ROA. ROA reflects the bank’s ability to generate profits. Sufian (2009) explains the increase inROA depends on policy bank (internal factors), economic conditions and government policies (externalfactors). In addition, profitability can also be measured by ROE (Return on Equty), although Athanasoglou,et al (2008) argued that the analysis is based on ROE ignoring the risks associated with leverage.
2.2. Economic Conditions Determinants
Economic conditions are the external factors that determine the performance of economic activity that isdifficult to control. GDP and inflation are used to measure economic conditions. GDP is used to measurethe economic condition of a country. GDP will affect the banks’ intermediation function even thoughSufian (2009) describes the impact on profitability can be positive or negative.
3 International Journal of Applied Business and Economic Research
The Impact of Economic Conditions on Bank Profitability of Regional Development Bank in Indonesia
Research results from Athanasoglou, et al (2008), Ana, et al (2011), Ben Khediri, and Ben-Khedhiri(2009), Ćurak et al (2012), Dietrich and Wanzenried. (2010), Flamini, et al (2009), Karimzadeh et al (2013),Lin and Rowe (2006), Pattitoni, et al (2014), Petria et al (2015), Sufian (2012), Sufian and Habibullah (2009)found that GDP is positive and significant impact on the profitability of banks. Different results are foundin Sufian (2009) and Dietrich and Wanzenried (2010a) with the results PDB significant negative effect onprofitability. For inflation, the relationship between inflation and profitability ambiguous (Petria et al: 2015).Roman and Dãnuleþiu (2013) explain the implications of inflation depends on the ability of banks toanticipate the impact of inflation. When there is inflation and the bank anticipates undertaking adjustmentsin interest rates, the increase in inflation is positively associated with profitability. A significant positiveimpact on profitability inflation found in the study Ana, et al (2011), Flamini, et al, 2009), Karimzadeh et al(2013), while Pattitoni, et al (2014) with significant negative results.
The financial crisis has an impact on bank profitability. Notta and Vlachvei (2014) find a significantdifference in the company’s performance in Greece before and during the financial crisis Raz, et al. (2012)find the impact of the crisis on the Economic of East Asian region, both East Asian financial crisis in 1997and the global financial crisis of 2008. But there is a different between the two crises, in which the EastAsian financial crisis in 1997 has provided knowledge for each country to be better prepared so when the2008 global financial crisis hits, compared with crisis in 1997. Agustini and Viverita (2014), argue that crisishas reduced overall profitability of Indonesian Commercial banks.
2.3. Industry Specific Determinant
Structure Performance Hypothesis is based on Structure, Conduct, and Performance approaches (SCP).To examine the SCP hypothesis, I use the Herfindahl-Hirschman (HHI) Index (Athanasoglou, et al 2008).This approach considers that the banks’ level of profits is affected by their market structure and degree ofcompetition. A decrease in the level of competition and an increase concentration in an industry will leadto increased profits of that industry. This is because the concentrated market structure tends to lead tocollusive behavior for the purpose of maximizing profit.
Samad (2008) explains that collusive behavior increases as market share is concentrated in the handsof a few firms. The higher the concentration ratio in a market, the higher the profitability performance ofthe firms. Thus, according to the SCP hypothesis, there is a positive correlation between the degree ofmarket share concentration and the firm’s performance.
Ye, et al. (2012) find that neither the SCP nor the efficient structure (ES) hypotheses hold in China,and this accords with the results of previous studies of the banking sectors in developing and transitioneconomies. There is some support for the ‘quiet life’ hypothesis that suggests a lack of a relationshipbetween Market structure and bank performance. But the strongest support is for the relative Marketpower (RMP) hypothesis that sug- gests that firms with differentiated services and products are those withhigher market share, and that they are able exercise their. Meanwhile, Hoxha (2013) documented thatsupports the view that market power is good for the access to financing and that banking competition isharmful to the output of the Industries dependent on external financing. Maniatis (2006) found that therelationship between market concentration and performance in the Greek banking is weak effect on bankprofitability. Low degree of performance and competitiveness as it is indicated by the extra-ordinary highdegree of concentration.

International Journal of Applied Business and Economic Research 4
Rizky Yudaruddin
2.3. Bank Specific Determinants
Internal conditions also affect the profitability of banks. Internal conditions can be seen from the outstandingloans, risk credit, efficiency, non-interest income of the bank, and the bank’s capital.
The ratio of loans to total assets (LOAN/TA) is a variable that measures how much banks in lendingas one of the sources of bank revenue. Sufian (2009) describes the relationship between credit and profitabilitydepends on economic conditions. If economic conditions stabilized, the loans will not get jammed therebyincreasing the profitability of banks. On the contrary, if economic conditions worsened and bad loansincreased then channeled kerdit will lower the profitability of banks. Results of research Bektas and Kaymak(2009), Karimzadeh et al (2013) and Sufian (2012) show an increase LOAN/TA significantly improveprofitability, otherwise Sufian (2009), Hoffmann (2011), and Ben Khediri and Ben-Khedhiri (2009) findsignificant negative effect.
The size of the company can be seen from the total assets owned by the bank. Athanasoglou, et al(2008), Alexiou and Sofoklis (2009), Sufian (2009) and Petria et al (2015) describe the relationship betweenthe size of the bank to profitability in some of the literature shows the inverted U pattern. Increasing thesize of the bank on one side will increase economies of scale thereby increasing profitability, but on theother hand the bigger banks can make a bank becomes inflexible resulting in lower performance. Size canbe proxied by bank with total assets of natural logarithm (LnAsset). Alexiou and Sofoklis (2009), Ayadiand Boujelbene (2012), Flamini, et al, 2009), Masood and Ashraf (2012), Petria et al (2015), Roman andDãnuleþiu (2013), Scott and Arias (2011) and Sufian (2012) find that total asset gives positive effect onprofitability, while Ben Naceur and Goaiedm (2008), Hoffmann (2011), Pattitoni, et al (2014), Sufian andHabibullah (2009) find a significant negative effect total asset.
The ratio of loan loss provision to total assets (LLP/TA) is a proxy of the credit risk. Relations LLP/TA to profitability is negative due to bad credit will reduce the profitability of banks. Alexiou and Sofoklis(2009), Ana, et al (2011), Athanasoglou, et al (2008), Aydana et al (2013), Dietrich and Wanzenried (2010a),Petria et al (2015) and Sufian (2009) find that increased LLP/TA will reduce profitability and significant.
The bank’s main income comes from the difference in fund-raising with the distribution of funds inthe form of lending (conventional banks). But the bank also has a non-interest income (fee base income)as a form of diversification of the business conducted by the bank. The bank’s business diversification ismeasured from the ratio of non-interest income to total assets (NII/TA). Relations NII/TA to profitabilityis positive. Research conducted Ana, et al (2011), Sufian (2009), Sufian (2012) and Sufian and Habibullah(2009) find a significant positive effect NII/TA to profitability.
The ratio of other operating expenses to total assets (NIE/TA) provides information on the variableoperating costs. The relationship between NIE/TA to profitability is negative because banks are moreproductive and efficient will lower operational costs. The increase in NIE/TA will decrease the profitabilityof banks. Sufian (2012) and Sufian and Habibullah (2009) find that the NIE/TA significantly lower theprofitability of banks.
Support on strong capital structure for banks may be additional strength to withstand the financialcrisis and improve security for depositors during unstable economic conditions. Capital strength can bemeasured by the ratio of capital to total assets (EQ/ TA). Relations EQ/TA to profitability is positive.

5 International Journal of Applied Business and Economic Research
The Impact of Economic Conditions on Bank Profitability of Regional Development Bank in Indonesia
Decrease EQ/TA will imply leverage and increased risk and therefore the cost of borrowing becomeslarge so that the lower profitability of banks. Alexiou and Sofoklis (2009), Ana, et al (2011), Athanasoglou,et al (2008), Ayadi and Boujelbene (2012), Ben Khediri, and Ben-Khedhiri (2009), Dietrich and Wanzenried.(2010b), Flamini, et al, 2009), Petria et al (2015), Roman and Dãnuleþiu (2013), Stanèiæ, et al (2014), Sufian(2009), Sufian (2012), Sufian and Habibullah (2009) find significant positive impact EQ/TA on bankprofitability.
III. RESEARCH METHODS
3.1. Emperical Model
The model in this study adapts the research by Sufian (2009) and Athanasoglou, et al (2008), which examinethe impact of economic conditions, industry specific and bank specific on profitability RDB. This studyspecifically examined the impact of economic conditions, especially in the RDB for the period 2001-2015as many as 26 banks are operationally presented in Table 1. The research model is divided into four models:model 1 and 2 that examine the impact of national economic conditions, while model 3 and 4 specificallyexamine the impact of regional economic conditions in accordance with the operational areas of the RDBwith the research model as follow:
ROAi,t
= � + �1ROA
,t-1 + β
2Crisis
,t + β
3GDP
i,t + β
4INF
i,t + β
5HHI
i,t + β
6Loan/TA
i,t + β
7SIZE
i,t +
β8LLP/TA
i,t + β
9NII/TA
i,t + β
10NIE/TA
i,t + β
11EQ/TA
i,t + �
i,t..........model I
ROEi,t
= � + β1ROE
,t-1 + β
2Crisis
,t + β
3GDP
i,t + β
4INF
i,t + β
5HHI
i,t + β
6Loan/TA
i,t + β
7SIZE
i,t +
β8LLP/TA
i,t + β
9NII/TA
i,t + β
10NIE/TA
i,t + β
11EQ/TA
i,t + �
i,t.......... model II
ROAi,t
= � + β1ROA
,t-1 + β
2Crisis
,t + β
3GDRP
i,t + β
4INFReg
i,t + β
5HHI
i,t + β
6Loan/TA
i,t + β
7SIZE
i,t +
β8LLP/TA
i,t + β
9NII/TA
i,t + β
10NIE/TA
i,t + β
11EQ/TA
i,t + �
i,t..............model III
ROEi,t
= � + β1ROE
,t-1 + β
2Crisis
,t + β
3GDRP
i,t + β
4INFReg
i,t + β
5HHI
i,t + β
6Loan/TA
i,t + β
7SIZE
i,t +
β8LLP/TA
i,t + β
9NII/TA
i,t + β
10NIE/TA
i,t + β
11EQ/TA
i,t + �
i,t....................model IV
3.2. Variable Selection
The dependent variables in this paper are ROA and ROE, which refer to the individual bank and t refers tothe time of the year. Variable economic conditions are divided into three variables that cover international,national and regional economic conditions measured international economic condition (dummy variablecrisis), national economic condition (GDP and INF) and regional economic condition (GDRP and INFreg).Operationally the variables in Table 1.
3.3. Data and Tool
The data used are secondary data in the form of banks financial statements that published by Bank Indonesia.While the macroeconomic data used in this study is the annual report data released by Indonesia’s CentralStatistics Agency (BPS). The analysis tools used in this study is dynamic panel (GMM method). I estimateall our models using the system GMM estimator to control for possible simultaneity and endogeneityproblems in our model (Arellano and Bond, 1991).
International Journal of Applied Business and Economic Research 6
Rizky Yudaruddin
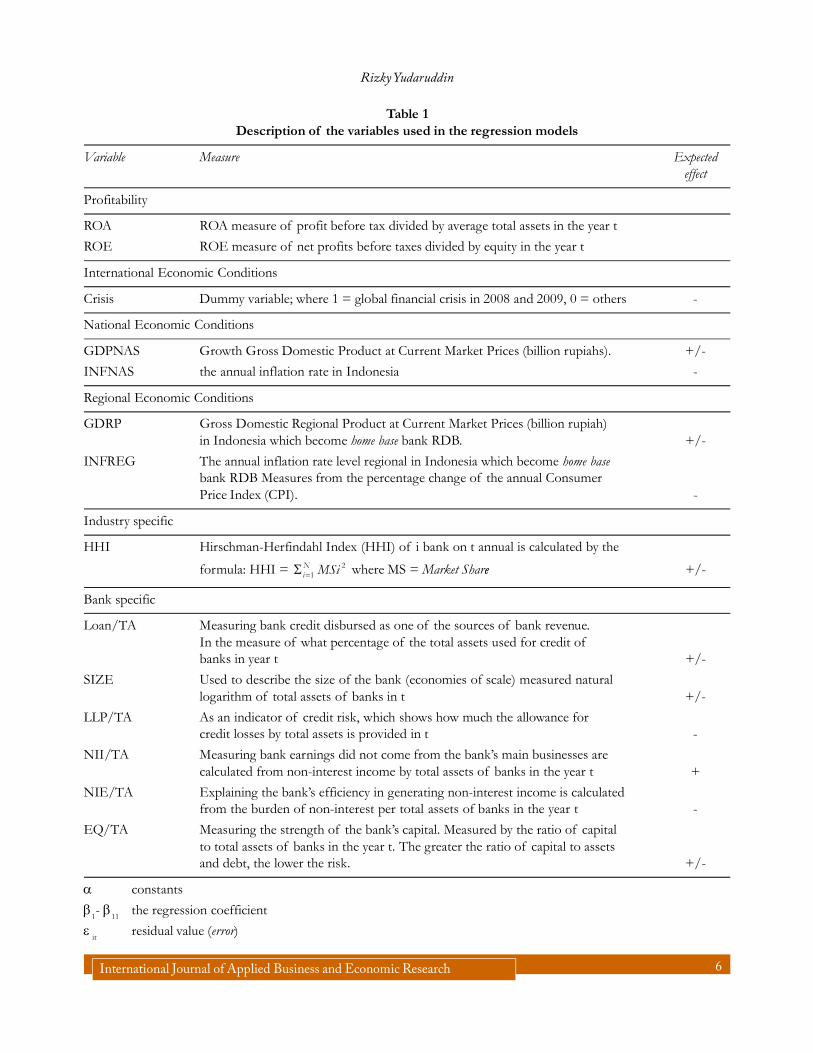
Table 1Description of the variables used in the regression models
Variable Measure Expectedeffect
Profitability
ROA ROA measure of profit before tax divided by average total assets in the year t
ROE ROE measure of net profits before taxes divided by equity in the year t
International Economic Conditions
Crisis Dummy variable; where 1 = global financial crisis in 2008 and 2009, 0 = others -
National Economic Conditions
GDPNAS Growth Gross Domestic Product at Current Market Prices (billion rupiahs). +/-
INFNAS the annual inflation rate in Indonesia -
Regional Economic Conditions
GDRP Gross Domestic Regional Product at Current Market Prices (billion rupiah)in Indonesia which become home base bank RDB. +/-
INFREG The annual inflation rate level regional in Indonesia which become home basebank RDB Measures from the percentage change of the annual ConsumerPrice Index (CPI). -
Industry specific
HHI Hirschman-Herfindahl Index (HHI) of i bank on t annual is calculated by the
formula: HHI = 21
Ni MSi�� where MS = Market Sharee +/-
Bank specific
Loan/TA Measuring bank credit disbursed as one of the sources of bank revenue.In the measure of what percentage of the total assets used for credit ofbanks in year t +/-
SIZE Used to describe the size of the bank (economies of scale) measured naturallogarithm of total assets of banks in t +/-
LLP/TA As an indicator of credit risk, which shows how much the allowance forcredit losses by total assets is provided in t -
NII/TA Measuring bank earnings did not come from the bank’s main businesses arecalculated from non-interest income by total assets of banks in the year t +
NIE/TA Explaining the bank’s efficiency in generating non-interest income is calculatedfrom the burden of non-interest per total assets of banks in the year t -
EQ/TA Measuring the strength of the bank’s capital. Measured by the ratio of capitalto total assets of banks in the year t. The greater the ratio of capital to assetsand debt, the lower the risk. +/-
� constants
�1- �
11the regression coefficient
� it
residual value (error)
7 International Journal of Applied Business and Economic Research
The Impact of Economic Conditions on Bank Profitability of Regional Development Bank in Indonesia
IV. RESEARCH RESULTS
4.1. Result and Discussions
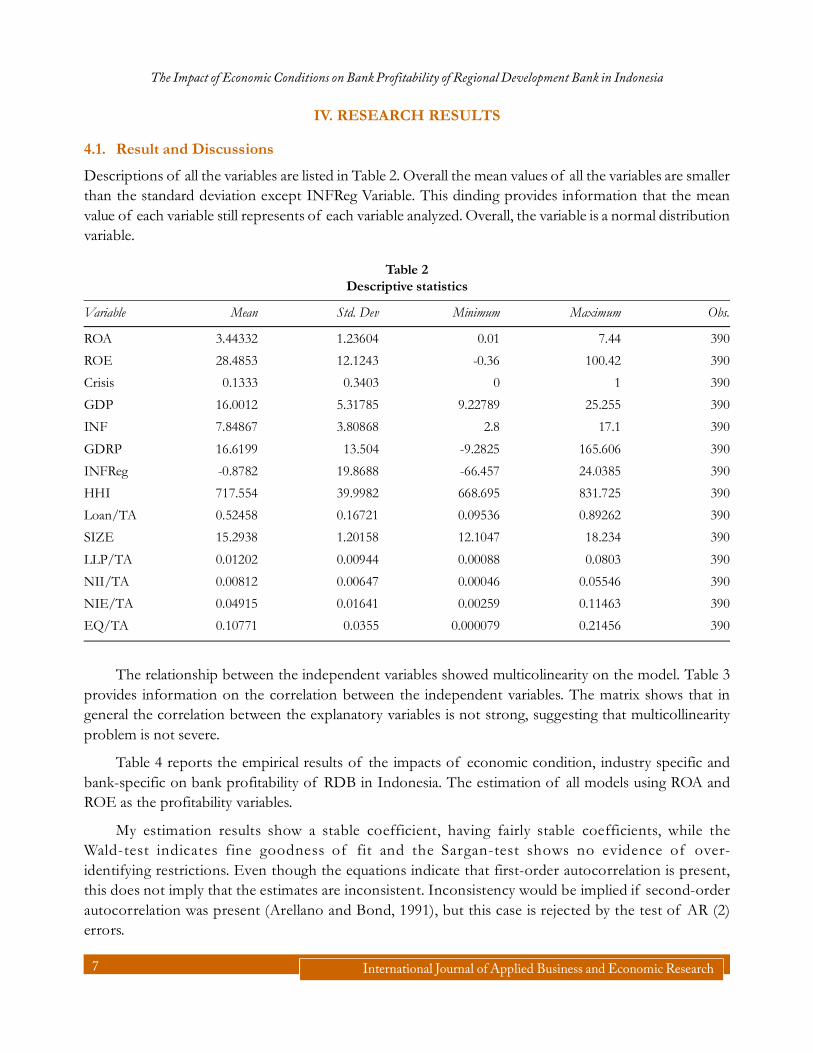
Descriptions of all the variables are listed in Table 2. Overall the mean values of all the variables are smallerthan the standard deviation except INFReg Variable. This dinding provides information that the meanvalue of each variable still represents of each variable analyzed. Overall, the variable is a normal distributionvariable.
Table 2Descriptive statistics
Variable Mean Std. Dev Minimum Maximum Obs.
ROA 3.44332 1.23604 0.01 7.44 390
ROE 28.4853 12.1243 -0.36 100.42 390
Crisis 0.1333 0.3403 0 1 390
GDP 16.0012 5.31785 9.22789 25.255 390
INF 7.84867 3.80868 2.8 17.1 390
GDRP 16.6199 13.504 -9.2825 165.606 390
INFReg -0.8782 19.8688 -66.457 24.0385 390
HHI 717.554 39.9982 668.695 831.725 390
Loan/TA 0.52458 0.16721 0.09536 0.89262 390
SIZE 15.2938 1.20158 12.1047 18.234 390
LLP/TA 0.01202 0.00944 0.00088 0.0803 390
NII/TA 0.00812 0.00647 0.00046 0.05546 390
NIE/TA 0.04915 0.01641 0.00259 0.11463 390
EQ/TA 0.10771 0.0355 0.000079 0.21456 390
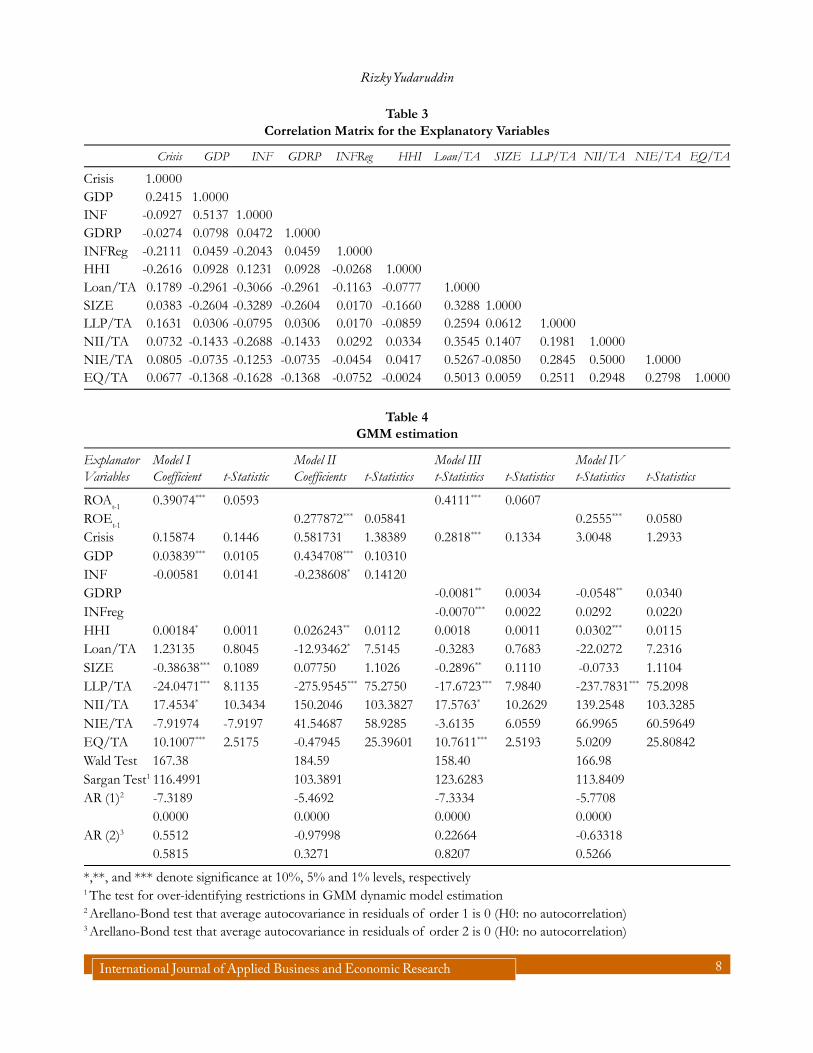
The relationship between the independent variables showed multicolinearity on the model. Table 3provides information on the correlation between the independent variables. The matrix shows that ingeneral the correlation between the explanatory variables is not strong, suggesting that multicollinearityproblem is not severe.
Table 4 reports the empirical results of the impacts of economic condition, industry specific andbank-specific on bank profitability of RDB in Indonesia. The estimation of all models using ROA andROE as the profitability variables.
My estimation results show a stable coefficient, having fairly stable coefficients, while theWald-test indicates fine goodness of fit and the Sargan-test shows no evidence of over-identifying restrictions. Even though the equations indicate that first-order autocorrelation is present,this does not imply that the estimates are inconsistent. Inconsistency would be implied if second-orderautocorrelation was present (Arellano and Bond, 1991), but this case is rejected by the test of AR (2)errors.
International Journal of Applied Business and Economic Research 8
Rizky Yudaruddin
Table 3Correlation Matrix for the Explanatory Variables
Crisis GDP INF GDRP INFReg HHI Loan/TA SIZE LLP/TA NII/TA NIE/TA EQ/TA
Crisis 1.0000GDP 0.2415 1.0000INF -0.0927 0.5137 1.0000GDRP -0.0274 0.0798 0.0472 1.0000INFReg -0.2111 0.0459 -0.2043 0.0459 1.0000HHI -0.2616 0.0928 0.1231 0.0928 -0.0268 1.0000Loan/TA 0.1789 -0.2961 -0.3066 -0.2961 -0.1163 -0.0777 1.0000SIZE 0.0383 -0.2604 -0.3289 -0.2604 0.0170 -0.1660 0.3288 1.0000LLP/TA 0.1631 0.0306 -0.0795 0.0306 0.0170 -0.0859 0.2594 0.0612 1.0000NII/TA 0.0732 -0.1433 -0.2688 -0.1433 0.0292 0.0334 0.3545 0.1407 0.1981 1.0000NIE/TA 0.0805 -0.0735 -0.1253 -0.0735 -0.0454 0.0417 0.5267-0.0850 0.2845 0.5000 1.0000EQ/TA 0.0677 -0.1368 -0.1628 -0.1368 -0.0752 -0.0024 0.5013 0.0059 0.2511 0.2948 0.2798 1.0000
Table 4GMM estimation
Explanator Model I Model II Model III Model IVVariables Coefficient t-Statistic Coefficients t-Statistics t-Statistics t-Statistics t-Statistics t-Statistics
ROAt-1
0.39074*** 0.0593 0.4111*** 0.0607ROE
t-10.277872*** 0.05841 0.2555*** 0.0580
Crisis 0.15874 0.1446 0.581731 1.38389 0.2818*** 0.1334 3.0048 1.2933GDP 0.03839*** 0.0105 0.434708*** 0.10310INF -0.00581 0.0141 -0.238608* 0.14120GDRP -0.0081** 0.0034 -0.0548** 0.0340INFreg -0.0070*** 0.0022 0.0292 0.0220HHI 0.00184* 0.0011 0.026243** 0.0112 0.0018 0.0011 0.0302*** 0.0115Loan/TA 1.23135 0.8045 -12.93462* 7.5145 -0.3283 0.7683 -22.0272 7.2316SIZE -0.38638*** 0.1089 0.07750 1.1026 -0.2896** 0.1110 -0.0733 1.1104LLP/TA -24.0471*** 8.1135 -275.9545*** 75.2750 -17.6723*** 7.9840 -237.7831*** 75.2098NII/TA 17.4534* 10.3434 150.2046 103.3827 17.5763* 10.2629 139.2548 103.3285NIE/TA -7.91974 -7.9197 41.54687 58.9285 -3.6135 6.0559 66.9965 60.59649EQ/TA 10.1007*** 2.5175 -0.47945 25.39601 10.7611*** 2.5193 5.0209 25.80842Wald Test 167.38 184.59 158.40 166.98Sargan Test1 116.4991 103.3891 123.6283 113.8409AR (1)2 -7.3189 -5.4692 -7.3334 -5.7708
0.0000 0.0000 0.0000 0.0000AR (2)3 0.5512 -0.97998 0.22664 -0.63318
0.5815 0.3271 0.8207 0.5266
*,**, and *** denote significance at 10%, 5% and 1% levels, respectively1 The test for over-identifying restrictions in GMM dynamic model estimation2 Arellano-Bond test that average autocovariance in residuals of order 1 is 0 (H0: no autocorrelation)3 Arellano-Bond test that average autocovariance in residuals of order 2 is 0 (H0: no autocorrelation)

9 International Journal of Applied Business and Economic Research
The Impact of Economic Conditions on Bank Profitability of Regional Development Bank in Indonesia
Our lagged dependent variable, which measures the degree of persistence of ROA and ROE, isstatistically significant across all models, indicating the dynamic character of model specification of bankprofitability. In other words, profitability of RDB are a high degree of persistence of bank profitability andjustifying the use of a dynamic model.
The impact of economic conditions on profitability is divided into three as follows, the first economicconditions at the international level using financial crisis variables of 2008-2009, as measured by dummyvariables. The coefficient of crisis is positive and significant (model III). Contrast with expected effect, thisresult indicates profitability of RDB is not affected by the crisis.
Secondly, economic conditions at national level use GDP and national inflation rate variables. Thestudy found that GDP has a positive impact and significant. These results support previous research(Athanasoglou, et al, 2008; Ana, et al, 2011; Ben Khediri, and Ben-Khedhiri 2009; Æurak et al., 2012; Dietrichand Wanzenried, 2010; Flamini, et al, 2009; Karimzadeh et al, 2013; Lin and Rowe, 2006; Pattitoni, et al.,2014; Petria et al., 2015; Sufian, 2012; and Sufian and Habibullah, 2009). National inflation rate has asignificant and negative impact on bank profitability (model II). This is in line with expected effect.
Third, the regional economic condition that becomes the home base of RDB uses GDRP and regionalinflation rate. I found that GDRP has negative impact and significant. This indicates that an increase ineconomic activity in the regions is not followed by an increase in demand for public financial services tothe RDB community. Consumers prefer other banks compared to RDB. This result is in line with Ayadiand Boujelbene (2012) and Sufian (2009) studies. Meanwhile, the regional variable inflation rate has thesame effect as national inflation rate that is negative and significant (Model III).
Turning to other explanatory variables, the impact of the market structure, approximated by theHerfindahl index seems to have a significant and positive effect on bank profitability. This result supportfor the structure-conduct-performance hypothesis and line with Samad (2008).
Bank-specific also affects the profitability of banks. In accordance with expectations, LOAN/TA havean ambiguous sign. The study finds that LOAN/TA significant negative impact (Model II). This shows thatthe increase in lending by banks will decrease the profitability of banks due to the increase in bad debtsexperienced by RDB. These results are consistent with research Sufian (2009), Hoffmann (2011), and BenKhediri and Ben-Khedhiri (2009) which find a negative and significant sign LOAN/TA to profitability.
The size of the bank can be seen from the total assets owned by the bank. In accordance withexpectations, SIZE has an ambiguous impact on profitability. The results of the models I - IV showed anegative impact, but only a significant model I and III. The findings support research conducted BenNaceur and Goaiedm (2008), Hoffmann (2011), Pattitoni, et al (2014), Sufian and Habibullah (2009). Theirnegative and significant results indicating the bigger banks can make a bank becomes flexible so that thelower profitability performance of banks in particular.
LLP/TA is a proxy of the credit risk. In accordance with expectations, the increase in credit risk willdecrease the profitability of banks. However, the results find support signs are negatif and significant.Previous studies conducted Alexiou and Sofoklis (2009), Ana, et al (2011), Athanasoglou, et al (2008),Aydana et al (2013), Dietrich and Wanzenried (2010), Petria et al (2015) and Sufian (2009) found thatincreased LLP/TA will reduce profitability and significant.
International Journal of Applied Business and Economic Research 10
Rizky Yudaruddin
Variable NII/TA had a positive and significant correlation direction in accordance with expectations.Previous research (Ana, et al, 2011; Sufian, 2009; Sufian, Sufian and Habibullah, 2012 and 2009) foundsignificant positive effect NII/TA to profitability. This indicates that the bank’s business diversification canincrease the profitability of banks. Although different results are found in the variables NIE/TA. NIE/TAhad a negative impact and insignificant.
The relation EQ/TA with profitability is expected positive. Decrease EQ/TA will imply the increaseof leverage and risk and therefore the cost of borrowing becomes large so that the lower profitability ofbanks. This study found a significant and positive sign of the EQ/TA to profitability. Moreover theseresults are also consistent with research by Alexiou and Sofoklis (2009), Ana, et al (2011), Athanasoglou, etal (2008), Ayadi and Boujelbene (2012), Ben Khediri, and Ben-Khedhiri (2009) Dietrich and Wanzenried.(2010), Flamini, et al, 2009), Petria et al (2015), Roman and Dãnuleþiu (2013), Stanèiæ, et al (2014), Sufian(2009), Sufian (2012), Sufian and Habibullah (2009). This means that the capital strength of banks makesthe bank is able to obtain business opportunities more effectively, have more time and flexibility of indealing with losses incurred thereby increasing the profitability of banks, although the capital strengthRDB majority depends on the ability of the budget (Budget Revenue and Expenditure).
V. CONCLUSIONS AND RECOMMENDATIONS
5.1. Conclusion
Unique position of the RDB leads investigators to examine the impact of economic conditions not onlyof the regional but also national side. This is because the working area of the dominant RDB only at theregional level. Therefore, this study aims to assess the economic impact at the international level, nationallevel and regional level to the profitability of banks.
The coefficient of crisis, GDP, national inflation rate and regional inflation rate are line with expectedeffect. Different things happen to the variabel GDRP, this paper found that GDRP has negative impactand significant.
Industry specific is measured by HHI. The empirical results show that HHI affects bank profitabilityand support SCP. Meanwhile, Bank-specific show that the effect of LOAN/TA, size, LLP/TA, NII/TA,EQ/TA on profitability in line with expected effect and significant. Only NIE / TA variables for allmodels are not significant.
5.2. Recomendation
The study found that the impact of economic conditions on the profitability of banks at every level ofinternational, national and regional. The results suggest that RDB increases the demand for financial servicesfrom consumers when regional economic activity increases to encourage increased bank profits.
BIBLIOGRAPHY
Alexiou, Constantinos and Sofoklis, Voyazas. (2009). Determinants of Bank Profitability: Evidence from the GreekBanking Sector. Conomic Annals, LIV (182): 93-118.
Agustini, M. (2011). Factors Infiuencing The Profitability of Listed Indonesian Commercial Banks Before and DuringFinancial Global Crisis. Indonesian Capital Market Review, 4(1), 29-40.
11 International Journal of Applied Business and Economic Research
The Impact of Economic Conditions on Bank Profitability of Regional Development Bank in Indonesia
Ana, Kundid., Blanka, Škrabić., and Roberto, Ercegovac. (2011). Determinants of Bank Profitability in Croatia. CroatianOperational Research Review (CRORR), Vol. 2: 168-182.
Arellano, M., Bond, S.R., (1991), Some tests of specification for panel data: Monte Carlo evidence and an application toemployment equations. Review of Economic Studies 58, 277–297.
Athanasoglou, P.P., Brissimis, S.N. and Delis, M.D. (2008), Bank-Specific. Industry-Specific and MacroeconomicDeterminants of Bank Profitability, Int. Fin. Markets, Inst. and Money, 18(2): 121–136.
Ayadi, Nesrine,. and Boujelbene, Younès. (2012), The Determinants of the Profitability of the Tunisian Deposit Banks.IBIMA Business Review. Article ID 165418, : 1-21.
Ayanda, Aremu Mukaila., Christopher, Imoh,. and Mudashiru, Mustapha Adeniyi. (2013), Determinants of Banks’Profitability in a Developing Economyevidence from Nigerian Banking Industry. Interdisciplinary Journal ofContemporary Research in Business. 4 (9): 155-181.
Bektas, Eralp., and Kaymak, Turhan. (2009), Governance Mechanisms and Ownership in an Emerging Market: The Caseof Turkish Banks. Emerging Markets Finance & Trade, 45(6): 20–32.
Ben Khediri, Karim., and Ben-Khedhiri, Hichem. (2009), Determinants of Islamic Bank Profitability in the MENARegion. Int. J. Monetary Economics and Finance, 2, (3/4): 409-426.
Ben Naceur, Samy., and Goaiedm, Mohamed. (2008), The Determinants of Commercial Bank Interest Margin andProfitability: Evidence from Tunisia. Working paper 856365.
Ćurak, Marijana., Poposki, Klime., and Pepur, Sandra. (2012). Profitability Determinants of the Macedonian BankingSector in Changing Environment. Procedia - Social and Behavioral Sciences 44 (2012): 406 – 416.
Dietrich, A., and G. Wanzenried. (2010a), Determinants of bank profitability before and during the crisis: Evidence fromSwitzerland. Int. Fin. Markets, Inst. and Money, 21(3): 307–327.
_____, A., and G. Wanzenried. (2010b), The Determinants of Commercial Banking Profitability in Low-, Middle-, andHigh-Income Countries. The Quarterly Review of Economics and Finance, 54(3): 337-354.
Flamini, Valentina., McDonald, Calvin., and Schumacher, Liliana. (2009), The Determinants of Commercial BankProfitability in Sub-Saharan Africa. IMF Working Paper, WP/09/15.
Hoxha, Indrit. (2013), The Market Structure of The Banking Sector And Financially Dependen Manufacturing Sectors.Inter- national Review of Economics and Finance 27: 432–444.
Hoffmann, Paolo Saona. (2011), Determinants of the Profitability of the US Banking Industry. International Journal ofBusiness and Social Science. 2(22): 225-269.
Karimzadeh, Majid., Karimzadeh, Behzad., and Akhtar, S. M. Jawed. (2013), Determinants of Profitability of BankingSector in India. Transit Stud Rev, 20 (1): 211–219.
Lin, Shuanglin., and Rowe, Wei. (2006), Determinants of the profitability of China’s regional SOEs. China Economic Review17(1): 120–141.
Maniatis, Paraschos. (2006), Market Concentration and Industry Profitability: The Case of Greek Banking (1997-2004).International Business & Economics Research Journal. 5(10): 39-48.
Masood, Omar., and Ashraf, Muhammad. (2012), Bank-specific and macroeconomic profitability determinants of Islamicbanks; The case of different Countries. Qualitative Research in Financial Market,s 4 (2): 255-268.
Notta, Ourania and Vlachvei, Aspasia. (2014), The impact of Financial Crisis on firm performance in case of Greek foodmanufacturing firms. Procedia Economics and Finance, 14( 2014): 454 – 460.
Pattitoni, Pierpaolo., Petracci, Barbara., and Spisni, Massimo. (2014), Determinants of profitability in the EU-15 area.Applied Financial Economics, Vol. 24, No. 11, pp 763–775.
Petria, Nicolae., Capraru, Bogdan., and Ihnatov, Iulian. (2015), Determinants of banks’ profitability: evidence from EU27 banking systems. Procedia Economics and Finance, 20 : 518 – 524.

International Journal of Applied Business and Economic Research 12
Rizky Yudaruddin
Raz, Arisyi F. Indra, Tamarind P. K. Artikasih, Dea K. dan Citra, Syalinda. (2012), Crisis Keuangan Global dan PertumbuhanEkonomi: Analisa Dari Perekonomian Asia Timur. Buletin Ekonomi Moneter dan Perbankan, 14 (2): 37-58.
Roman, Angela., and Dãnuleþiu, Adina Elena. (2013), An Empirical Analysis Of The Determinants Of Bank ProfitabilityIn Romania. Annales Universitatis Apulensis Series Oeconomica, 15 (1): 580-593.
Samad, A. (2008), Market Structure, Conduct and Performance: Evidence From the Bangladesh Banking Industry. Journalof Asian Economics 19(2): 181-193.
Scott, James W., and Arias, José Carlos. (2011), Banking Profitability Determinants, Business Intelligence Journal. 4(2):209-230.
Stanèić, Predrag., Čupić, Milan., and Obradoviæ, Vladimir. (2014), Influence of Board and Ownership Structure on BankProfitability: Evidence From South East Europe. Economic Research-Ekonomska Istraživanja, 27 (1): 573–589.
Sufian, Fadzlan. (2009), Factors Influencing Bank Profitability in a Developing Economy: Empirical Evidence fromMalaysia. Global Business Review, 10(1): 225–241.
_____ Fadzlan. (2012), Determinants of Bank Profitability in Developing Economies: Empirical Evidence from theSouth Asian Banking Sectors. Contemporary South Asia. 20 (3): 375–399.
_____, Fadzlan., and Habibullah, Muzafar Shah. (2009), Bank Specific and Macroeconomic Determinants of BankProfitability: Empirical Evidence From The China Banking Sector. Front. Econ. China, 4 (2): 274–291.
Ye, Qichang. Xu, Zongling. and Fang, (2012), Market Structure, Performance, And Efficiency of The Chinese BankingSector. Econ Change Restruct 45: 337–358.


![Rizky amalia [140641156]](https://img.dokumen.tips/doc/110x75/55c13009bb61ebb44e8b475e/rizky-amalia-140641156.jpg)

