Embed Size (px)
Citation preview

The Impact of Drug Benefit Design on The Impact of Drug Benefit Design on
Medication Adherence and OutcomesMedication Adherence and Outcomes
The Impact of Drug Benefit Design on The Impact of Drug Benefit Design on
Medication Adherence and OutcomesMedication Adherence and Outcomes
Michael C. Sokol, MD, MSMedical Director
Health Management Innovations
(c) 2008 The GlaxoSmithKline Group of Companies. All Rights Reserved

AgendaAgenda AgendaAgenda
Factors affecting medication adherenceFactors affecting medication adherence
Review of the literature: benefit design, Review of the literature: benefit design, medication adherence, outcomesmedication adherence, outcomes
Employer examplesEmployer examples
Factors affecting medication adherenceFactors affecting medication adherence
Review of the literature: benefit design, Review of the literature: benefit design, medication adherence, outcomesmedication adherence, outcomes
Employer examplesEmployer examples

World Health Organization World Health Organization World Health Organization World Health Organization
The consequences of poor adherence to long- The consequences of poor adherence to long- term therapies are term therapies are poor health outcomes and poor health outcomes and increased healthcare costsincreased healthcare costs
The consequences of poor adherence to long- The consequences of poor adherence to long- term therapies are term therapies are poor health outcomes and poor health outcomes and increased healthcare costsincreased healthcare costs
World Health Organization. Adherence to Long-Term Therapies: Evidence for Action. [World Health Organization Web site]. 2003. Available at: http://www.who.int/chronic_conditions/en/adherence_report.pdf.
Accessed May 20, 2005
Adherence to long-term therapy for chronic Adherence to long-term therapy for chronic diseases in developed countries averages diseases in developed countries averages 50%50%
Adherence to long-term therapy for chronic Adherence to long-term therapy for chronic diseases in developed countries averages diseases in developed countries averages 50%50%

But what happens to But what happens to those prescriptions?those prescriptions?
But what happens to But what happens to those prescriptions?those prescriptions?
1 Hing E. Cherry DK Woodwell DA,. National Ambulatory Medical Care Survey: 2003 Summary October 4th, 2005 #365 National
Center for Health Statistics- CDC- http://www.cdc.gov/nchs/data/ad/ad365.pdf. Advance data from vital and health statistics; no 365. Hyattsville, Maryland; National Center for Health Statistics. 2005. 2 The Hidden Epidemic: Finding a Cure for Unfilled Prescriptions and Missed Doses. December, 2003. The Boston Consulting Group and Harris Interactive. Available at http://www.bcg.com/publications/files/TheHiddenEpidemic_Rpt_HCDec03.pdf. Accessed August 16, 2004.
What happens to prescriptions?What happens to prescriptions?What happens to prescriptions?What happens to prescriptions?
Non-Compliant Non-Compliant BehaviorsBehaviors22
Non-Compliant Non-Compliant BehaviorsBehaviors22
65.7%65.7% of physician of physician office visits generate office visits generate a prescription a prescription medicine, with medicine, with multiple drugs multiple drugs prescribed 39.5% of prescribed 39.5% of the timethe time11
65.7%65.7% of physician of physician office visits generate office visits generate a prescription a prescription medicine, with medicine, with multiple drugs multiple drugs prescribed 39.5% of prescribed 39.5% of the timethe time11
14%14%14%14%
30%30%30%30%26%26%26%26%
21%21%21%21%
18%18%18%18%
0%0%0%0%
5%5%5%5%
10%10%10%10%
15%15%15%15%
20%20%20%20%
25%25%25%25%
30%30%30%30%
35%35%35%35%
took less oftentook less often delayed filldelayed fillstopped soonerstopped sooner failed to fillfailed to fillsmaller dosessmaller doses

Why didn’t they take their medication(s)?Why didn’t they take their medication(s)?Why didn’t they take their medication(s)?Why didn’t they take their medication(s)?
The Hidden Epidemic: Finding a Cure for Unfilled Prescriptions and Missed Doses, December, 2003. The Boston Consulting Group and Harris Interactive. Available at http://www.bcg.com/publications/files/TheHiddenEpidemic_Rpt_HCDec03.pdf. Accessed August 16, 2004.
10%10% difficulties in getting the prescription filled difficulties in getting the prescription filled
14%14% decided they didn't need the drug decided they didn't need the drug
17%17% medication was too costly medication was too costly
20%20% undesirable or debilitating side effects undesirable or debilitating side effects
24%24% forgetfulness forgetfulness

Unintended consequencesUnintended consequencesUnintended consequencesUnintended consequences
47%47% that postponed care stated that it caused a that postponed care stated that it caused a significant loss of time at work or other important significant loss of time at work or other important life activitieslife activities
53%53% said the problem caused a significant said the problem caused a significant temporary disability that resulted in significant temporary disability that resulted in significant pain or sufferingpain or suffering
1 in 6 (1 in 6 (17%17%) said the unmet need resulted in a ) said the unmet need resulted in a long-term disabilitylong-term disability
Kaiser Commission on Medicaid and the Uninsured- Medical Debt and Access to Health Care: Executive Summary – September 2005 http://www.kff.org/uninsured/upload/7403ES.pdf

Kaiser Family Foundation, Health Research and Educational Trust. Employer health benefits: 2005 Annual Survey. Available at: http://www.kff.org/insurance/7315/index.cfm
Cost sharing is increasingCost sharing is increasingCost sharing is increasingCost sharing is increasingAverage co-pays 2000-2005Average co-pays 2000-2005
Generic drugs, preferred drugs Generic drugs, preferred drugs and non-preferred drugsand non-preferred drugs
Average co-pays 2000-2005Average co-pays 2000-2005
Generic drugs, preferred drugs Generic drugs, preferred drugs and non-preferred drugsand non-preferred drugs
$7$7$7$7 $8$8$8$8 $9$9$9$9 $9$9$9$9 $10$10$10$10 $10$10$10$10$13$13$13$13 $15$15$15$15 $17$17$17$17 $19$19$19$19 $21$21$21$21 $22$22$22$22$17$17$17$17 $20$20$20$20
$25$25$25$25 $29$29$29$29$33$33$33$33 $34$34$34$34
$48$48$48$48
$74$74$74$74
$ 0$ 0$ 0$ 0
$10$10$10$10
$20$20$20$20
$30$30$30$30
$40$40$40$40
$50$50$50$50
$60$60$60$60
$70$70$70$70
$80$80$80$80
20002000 20012001 20022002 20032003 20042004 20052005
Generic Preferred drugs Non-preferred drugs 4th Tier

1 Joyce GF, Escarce JJ, Solomon MD et al. Employer drug benefit plans and spending on prescription drugs. JAMA. 2002;288(14):1733-1739. 2. Fairman KA, Motheral BR, Henderson RR. Retrospective, long-term follow-up study of the effect of a three-tier prescription drug copayment system on pharmaceutical and other medical utilization and costs. Clinical Therapeutics. 2003;25(12):3147-3161.
Lowers drug expensesLowers drug expenses– Co-payment doubling reduced drug spending by Co-payment doubling reduced drug spending by 19-33%19-33% across across
different therapeutic classesdifferent therapeutic classes11
Decreases prescription utilizationDecreases prescription utilization– Utilization declines Utilization declines 10-12%10-12% as co-payment increases to as co-payment increases to $5$5
22
Effects are more pronounced as rate of cost sharing Effects are more pronounced as rate of cost sharing increasesincreases
– Prescription caps > coinsurance > copaymentPrescription caps > coinsurance > copayment
Cost sharing saves Rx drug spend Cost sharing saves Rx drug spend for payorsfor payorsCost sharing saves Rx drug spend Cost sharing saves Rx drug spend for payorsfor payors

But does cost sharing reduce overall But does cost sharing reduce overall healthcare costs?healthcare costs?But does cost sharing reduce overall But does cost sharing reduce overall healthcare costs?healthcare costs?
Are patients making the “right” choices on Are patients making the “right” choices on prescription drug spending for essential prescription drug spending for essential medications (diabetes, heart disease, medications (diabetes, heart disease, asthma)?asthma)?
Are patients making the “right” choices on Are patients making the “right” choices on prescription drug spending for essential prescription drug spending for essential medications (diabetes, heart disease, medications (diabetes, heart disease, asthma)?asthma)?
What do the statistics and literature show?What do the statistics and literature show?What do the statistics and literature show?What do the statistics and literature show?

Impact of benefit design in a broad population of 30 large employers
Retrospective analysis of utilization for entire population vs. those with chronic conditions
8 chronic conditions (10 treatment classes) accounting for 51% of prescription drug spend
Chronic condition = 2 or more Medical Claims plus at least one prescription in the defined treatment class
Goldman DP, Joyce GF, Escarce JJ, Pace JE, Solomon MD, Laouri M, Landsman PB, Teutsch SM. Pharmacy Benefits and the Use of Drugs by the Chronically Ill. JAMA. 2004;291:2344-2350. Goldman DP, Joyce GF, Escarce JJ, Pace JE, Solomon MD, Laouri M, Landsman PB, Teutsch SM. Pharmacy Benefits and the Use of Drugs by the Chronically Ill. JAMA. 2004;291:2344-2350.
Chronic medications (Goldman)Chronic medications (Goldman)Chronic medications (Goldman)Chronic medications (Goldman)

When out-of-pocket When out-of-pocket payments doubled, drug payments doubled, drug utilization was significantly utilization was significantly reducedreduced
When out-of-pocket When out-of-pocket payments doubled, drug payments doubled, drug utilization was significantly utilization was significantly reducedreduced
Change in Co-pays:Change in Co-pays: 1st tier: $6.31 to $12.62 1st tier: $6.31 to $12.62 2nd tier: $12.85 to $25.702nd tier: $12.85 to $25.70
Change in Co-pays:Change in Co-pays: 1st tier: $6.31 to $12.62 1st tier: $6.31 to $12.62 2nd tier: $12.85 to $25.702nd tier: $12.85 to $25.70
% Reduction % Reduction in-class drug utilizationin-class drug utilization
% Reduction % Reduction in-class drug utilizationin-class drug utilization
Goldman DP, Joyce GF, Escarce JJ, Pace JE, Solomon MD, Laouri M, Landsman PB, Teutsch SM. Pharmacy Benefits and the Use of Drugs by the Chronically Ill. JAMA. 2004;291:2344-2350.
-23%-23% inin
diabeticsdiabetics
-23%-23% inin
diabeticsdiabetics
Chronic medications (Goldman) cont.Chronic medications (Goldman) cont.Chronic medications (Goldman) cont.Chronic medications (Goldman) cont.
Anti-Anti-Asthmatic Asthmatic
Drugs Drugs
Anti-Anti-Diabetic Diabetic Drugs Drugs
-30%-30%-30%-30%
-25%-25%-25%-25%
-20%-20%-20%-20%
-15%-15%-15%-15%
-10%-10%-10%-10%
-5%-5%-5%-5%
0%0%0%0%
5%5%5%5%
10%10%10%10%
15%15%15%15%
20%20%20%20%
-22%22% inin
asthmaticsasthmatics
-22%22% inin
asthmaticsasthmatics

Among patients with asthma Among patients with asthma and diabetes and other and diabetes and other disease states . . .disease states . . .
Among patients with asthma Among patients with asthma and diabetes and other and diabetes and other disease states . . .disease states . . .
Hospital stays
ER visits
% Increased % Increased utilizationutilization
% Increased % Increased utilizationutilization
Goldman DP, Joyce GF, Escarce JJ, Pace JE, Solomon MD, Laouri M, Landsman PB, Teutsch SM. Pharmacy Benefits and the Use of Drugs by the Chronically Ill. JAMA. 2004;291:2344-2350.
10%10%
17%17%
Chronic medications (Goldman) cont.Chronic medications (Goldman) cont.Chronic medications (Goldman) cont.Chronic medications (Goldman) cont.
. . . as the use of prescription drugs dropped, utilization of other services increased
. . . as the use of prescription drugs dropped, utilization of other services increased
0%0%
10%10%
20%20%

Diabetes medications (Dor)Diabetes medications (Dor)Diabetes medications (Dor)Diabetes medications (Dor)
He found that increasing He found that increasing cost-sharing levels cost-sharing levels decreased full compliancedecreased full compliance.
He found that increasing He found that increasing cost-sharing levels cost-sharing levels decreased full compliancedecreased full compliance.
% Reduction in % Reduction in full compliance*full compliance*% Reduction in % Reduction in full compliance*full compliance*
Dor A, Encinosa WE. Does Cost Sharing Affect Compliance? The Case of Prescription Drugs. National Bureau of Economic Research. NBER Working Paper Series. No. 10738. August 2004.JEL No I11,L11
*Patients taking oral anti-diabetic drugs*Patients taking oral anti-diabetic drugs
Impact of benefit design on a population of 27,000 diabetic patients from a large multi-employer databaseImpact of benefit design on a population of 27,000 diabetic patients from a large multi-employer database
-30%-30%
-25%-25%
-20%-20%
-15%-15%
-10%-10%
-5%-5%
0%0%
5%5%
10%10%
15%15%
20%20%
9%9%
25%25%
Co-pay increase Co-pay increase Co-pay increase Co-pay increase
$6 to $10$6 to $10$6 to $10$6 to $10Co-insurance increase Co-insurance increase Co-insurance increase Co-insurance increase
20% to 25%20% to 25%20% to 25%20% to 25%

Based on the database, his model shows that if co-pays for 10 million diabetics (in the US) were increased from $6 to $10:
– RX spend would decrease by $125M per year
– DIRECT medical costs would increase by $320M per year
Based on the database, his model shows that if co-pays for 10 million diabetics (in the US) were increased from $6 to $10:
– RX spend would decrease by $125M per year
– DIRECT medical costs would increase by $320M per year
$320M$320M $320M$320M
This yields an annual net direct This yields an annual net direct cost of $195M -- not including cost of $195M -- not including
absenteeism or disabilityabsenteeism or disability
This yields an annual net direct This yields an annual net direct cost of $195M -- not including cost of $195M -- not including
absenteeism or disabilityabsenteeism or disability -$125M-$125M-$125M-$125M
Dor A, Encinosa WE. Does Cost Sharing Affect Compliance? The Case of Prescription Drugs. National Bureau of Economic Research. NBER Working Paper Series. No. 10738. August 2004.JEL No I11,L11
-$150-$150-$150-$150
-$50-$50-$50-$50
$50$50$50$50
$150$150$150$150
$250$250$250$250
$350$350$350$350
$195M increased
overall spend
Diabetes medications (Dor) cont.Diabetes medications (Dor) cont.Diabetes medications (Dor) cont.Diabetes medications (Dor) cont.

Diabetes Medications (Kessler)
Figure 4. Projected cumulative probability of medication termination over the study period among patients with diabetes who differed in size of baseline copayment but did not experience any change in copayment
0
0.1
0.2
0.3
0.4
0.5
0.6
0.7
0.8
0.9
1
0 5 10 15 20 25 30
Number of months
Cu
mu
lati
ve p
erc
en
t
$0
$1-15
$16-30
$31+
Kessler, R.C., Cantrell, C.R., Berglund, P., Sokol, M.C. (2007). The effects of copayments on medication adherence during the first two years of prescription drug treatment. Journal of Occupational and Environmental Medicine 49(6), 597-609.

After analyzing adherence in a non-Medicaid MCO population of adults taking 2 or more statin prescriptions, Ellis found that . . .
. . . patients with co-pays of $20 or more were over 4 times more likely to stop taking their medication as patients with co-pays of less than $10
After analyzing adherence in a non-Medicaid MCO population of adults taking 2 or more statin prescriptions, Ellis found that . . .
. . . patients with co-pays of $20 or more were over 4 times more likely to stop taking their medication as patients with co-pays of less than $10
Ellis JJ, Fendrick M, et al. Suboptimal Statin Adherence and Discontinuation in Primary and Secondary Prevention Populations. Should We Target Patients with the Most to Gain? J Gen Intern Med 2004;19:638-645.
Survival curves for Survival curves for discontinuation by co-pay rangediscontinuation by co-pay range
100% Compliant100% Compliant100% Compliant100% Compliant <$10<$10
<$10<$10
$20+$20+
Cholesterol medications (Ellis)Cholesterol medications (Ellis)Cholesterol medications (Ellis)Cholesterol medications (Ellis)
Years

Pitney BowesPitney Bowes
80-plus year legacy80-plus year legacy
Fortune 500 companyFortune 500 company
$5.6 billion global provider of integrated mail $5.6 billion global provider of integrated mail and document management solutionsand document management solutions
Global team of more than 35,000 employeesGlobal team of more than 35,000 employees
Presence in more than 130 countries worldwidePresence in more than 130 countries worldwide
More than 2 million customersMore than 2 million customers
Source- David Hom, Vice President, HR Initiatives Department, Pitney Bowes.

The “Business Case” or a “Leap of Faith”The “Business Case” or a “Leap of Faith” DriversDrivers
– Predictive modeling resultsPredictive modeling results Illness burden and costs driven by lack of Illness burden and costs driven by lack of
preventive services and pharmaceutical compliancepreventive services and pharmaceutical compliance
– Analysis indicating 50% population had a chronic Analysis indicating 50% population had a chronic illnessillness
ChallengesChallenges– Assume increased cost sharingAssume increased cost sharing– Forgo some rebatesForgo some rebates– Senior management imperative to manage healthcare Senior management imperative to manage healthcare
budgetbudget
Source- David Hom, Vice President, HR Initiatives Department, Pitney Bowes.

Pharmacy planPharmacy plan
Moved diabetes, asthma and hypertension Moved diabetes, asthma and hypertension medications from 2medications from 2ndnd tier (30% co-insurance) tier (30% co-insurance) and 3and 3rdrd tier (50% co-insurance) to 1 tier (50% co-insurance) to 1stst tier (10% tier (10% co-insurance)co-insurance)
DesignDesign
– No mandatory genericNo mandatory generic
– No step therapyNo step therapy
– No therapeutic substitutionNo therapeutic substitution
– Limited prior authorizationLimited prior authorization
Source- David Hom, Vice President, HR Initiatives Department, Pitney Bowes.

Preliminary findingsPreliminary findings
Annual cost of care decreased for both conditions Annual cost of care decreased for both conditions (asthma and diabetes)(asthma and diabetes)
Pharmacy costs Pharmacy costs decreaseddecreased
Hospital admissions Hospital admissions declineddeclined for people with asthma for people with asthma
– Hospital admissions Hospital admissions increasedincreased for people with for people with diabetes (still below benchmark)diabetes (still below benchmark)
ER visits ER visits declineddeclined for people with diabetes for people with diabetes– ER visits unchanged for people with asthmaER visits unchanged for people with asthma
Source- David Hom, Vice President, HR Initiatives Department, Pitney Bowes.

Preliminary findings Preliminary findings (Cont’d)(Cont’d)
50%50% reduction in short term disability reduction in short term disability
Changes in medication/possession rates for both groupsChanges in medication/possession rates for both groups
– Improved adherenceImproved adherence– Types of medications (more controllers, less rescue)Types of medications (more controllers, less rescue)
Savings of Savings of $1 million$1 million in first year; savings of in first year; savings of $2.5 million$2.5 million in third yearin third year
Source- David Hom, Vice President, HR Initiatives Department, Pitney Bowes.
Asheville Project Asheville Project Diabetes Patient Incentives and Care ModelDiabetes Patient Incentives and Care Model
Community-based programCommunity-based program
Funded by employer (City of Asheville, NC)Funded by employer (City of Asheville, NC)
Coordinated by Mission St. Joseph Hospital and APhACoordinated by Mission St. Joseph Hospital and APhA
Focus on patient education and supportFocus on patient education and support
Waived co-pays, waived formularyWaived co-pays, waived formulary
Utilized RPh to provide ongoing support and monitoringUtilized RPh to provide ongoing support and monitoring
Cranor CW, Bunting BA, Christensen DB. The Asheville Project: Long-term clinical and economic outcomes of a community Cranor CW, Bunting BA, Christensen DB. The Asheville Project: Long-term clinical and economic outcomes of a community pharmacy diabetes care program. pharmacy diabetes care program. J Am Pharm Assoc.J Am Pharm Assoc. 2003;43:173-84. 2003;43:173-84.

Asheville ProjectAsheville Project
N=164N=164 N=155N=155 N=116N=116 N=74N=74 N=43N=43 N=28N=28
Cranor CW, Bunting BA, Christensen DB. The Asheville Project: Long-term clinical and economic outcomes of a community Cranor CW, Bunting BA, Christensen DB. The Asheville Project: Long-term clinical and economic outcomes of a community pharmacy diabetes care program. pharmacy diabetes care program. J Am Pharm Assoc.J Am Pharm Assoc. 2003;43:173-84. 2003;43:173-84.
Healthcare costsHealthcare costs
$0$0
$2,000$2,000
$4,000$4,000
$6,000$6,000
$8,000$8,000
BaselineBaseline 1 yr1 yr 2 yrs2 yrs 3 yrs3 yrs 4 yrs4 yrs 5 yrs5 yrs
Diabetes RxDiabetes Rx Other RxOther Rx Medical ClaimMedical Claim
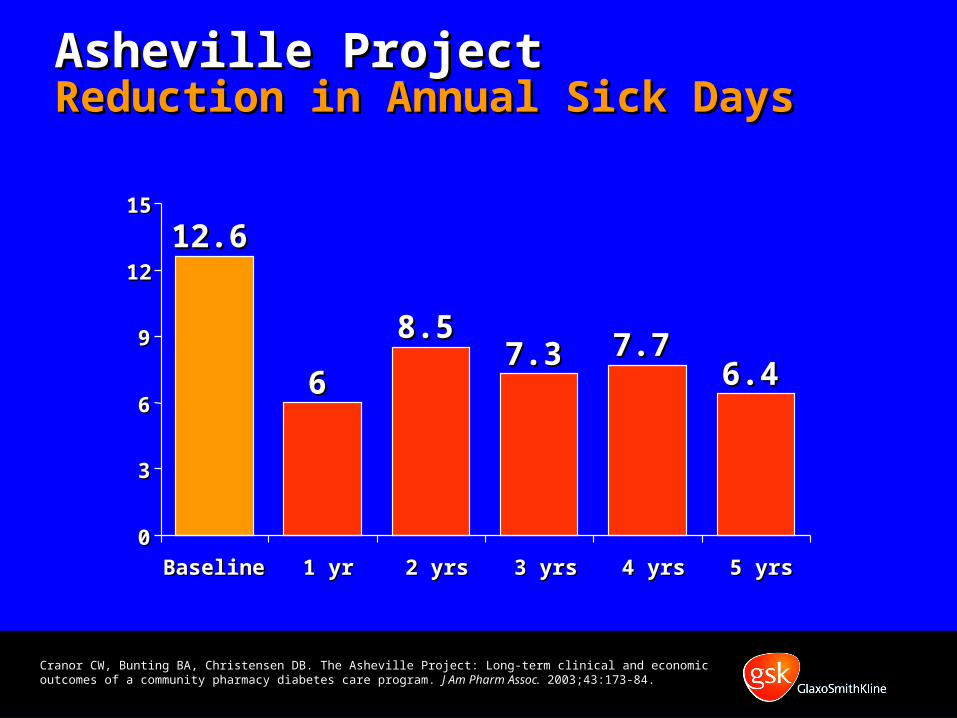
Asheville Project Asheville Project Reduction in Annual Sick DaysReduction in Annual Sick Days
Cranor CW, Bunting BA, Christensen DB. The Asheville Project: Long-term clinical and economic outcomes of a community Cranor CW, Bunting BA, Christensen DB. The Asheville Project: Long-term clinical and economic outcomes of a community pharmacy diabetes care program. pharmacy diabetes care program. J Am Pharm Assoc.J Am Pharm Assoc. 2003;43:173-84. 2003;43:173-84.
12.612.6
66
8.58.57.37.3 7.77.7
6.46.4
00
33
66
99
1212
1515
Baseline Baseline 1 yr1 yr 2 yrs2 yrs 3 yrs3 yrs 4 yrs4 yrs 5 yrs5 yrs

Asheville ProjectAsheville ProjectAsthma resultsAsthma results
Asheville ProjectAsheville ProjectAsthma resultsAsthma results
Bunting BA and Cranor CW. The Asheville Project: Long-Term Clinical, Humanistic, and Economic Outcomes of a Community-Based Medication Therapy Management Program for Asthma. J Am Pharm Assoc. 2006;46:133-147.
9.99.99.99.9
1.31.31.31.3
0000
2222
4444
6666
8888
10101010
Baseline Baseline Follow-upFollow-up
% ER visits% ER visits% ER visits% ER visits
4.04.04.04.0
1.31.31.31.3
0000
2222
4444
6666
8888
10101010
Baseline Baseline Follow-upFollow-up
% Hospitalizations% Hospitalizations% Hospitalizations% Hospitalizations

Spending on asthma medications increasedSpending on asthma medications increased
ButBut
Medical claims decreased, and total asthma-Medical claims decreased, and total asthma-related costs decreasedrelated costs decreased
– Direct cost savings averaged Direct cost savings averaged $725/pt/yr$725/pt/yr
– Indirect costs savings estimated at Indirect costs savings estimated at $1,230/pt/yr$1,230/pt/yr
– Indirect costs due to missed/non-productive Indirect costs due to missed/non-productive workdays decreased from workdays decreased from 10.8 to 2.6 days/yr10.8 to 2.6 days/yr
Asheville ProjectAsheville ProjectAsthma results Asthma results (Cont’d)
Asheville ProjectAsheville ProjectAsthma results Asthma results (Cont’d)
Bunting BA and Cranor CW. The Asheville Project: Long-Term Clinical, Humanistic, and Economic Outcomes of a Community-Based Medication Therapy Management Program for Asthma. J Am Pharm Assoc. 2006;46:133-147.

Employer Example- Service Industry
Purpose of study: Examine the impact of lowering Rx co-pays on medication adherence
5 drug classes studied: ACE/ARBs, beta blockers, diabetes medications, statins, inhaled steroids
Prospective, pre/post study with control group
Time period: 2004 (pre) and 2005 (post)
Both intervention and control groups used same disease management programs
Chernew et al. Impact of Decreasing Copayments on Medication Adherence within a Disease Management Environment. Health Affairs. Volume 27, Number 1. January/February 2008.

Diabetes Results
Chernew et al. Impact of Decreasing Copayments on Medication Adherence within a Disease Management Environment. Health Affairs. Volume 27, Number 1. January/February 2008.

Employer Example- Large Manufacturer
Purpose of study: Examine the impact of medication adherence on hospitalization risk and health care cost
4 disease states studied- diabetes, high blood pressure, high cholesterol, heart failure
Retrospective, observational study Time period: 1997-1999 Diabetes
– 3,260 patients in cohort– Average age was 54 years old– 45% female
Sokol M et al. Impact of Medication Adherence on Hospitalization Risk and Healthcare Cost. Medical Care. Volume 43, Number 6, June 2005

18
Diabetes ResultsDiabetes Results
Adherence level (% Days supplyAdherence level (% Days supply // 1 year)1 year)
Ave
rag
e ex
pen
dit
ure
sA
vera
ge
exp
end
itu
res
per
pat
ien
t p
er y
ear
($)
per
pat
ien
t p
er y
ear
($)
Ave
rag
e ex
pen
dit
ure
sA
vera
ge
exp
end
itu
res
per
pat
ien
t p
er y
ear
($)
per
pat
ien
t p
er y
ear
($) P< 0.05P< 0.05P< 0.05P< 0.05
Sokol M et al. Impact of Medication Adherence on Hospitalization Risk and Healthcare Cost. Medical Care. Volume 43, Number 6, June 2005
$8,812$8,812$8,812$8,812 $6,959$6,959 $6,237$6,237 $5,887$5,887 $3,808$3,808
$55$55
$165$165$285$285 $404$404
$763$763
0000
1000100010001000
2000200020002000
3000300030003000
4000400040004000
5000500050005000
6000600060006000
7000700070007000
8000800080008000
9000900090009000
10000100001000010000
1-19% 20-39% 40-59% 60-79% 80-100%
Rx $Rx $
Medical $Medical $
Costs Costs

Diabetes ResultsDiabetes Results
30*30*26*26* 25*25*
20*20*
1313
00
55
1010
1515
2020
2525
3030
3535
1-191-19 20-3920-39 40-59 60-79 80-10080-100
Adherence level (%)Adherence level (%)
Ris
k (%
)R
isk
(%)
Sokol MC, McGuigan KA, Verbrugge RR, Epstein RS. Impact of medication adherence on hospitalization risk and healthcare cost. Medical Care. 2005;43:521-530.
*Indicates that outcome is significantly higher than outcome for 80-100% adherence group (P<0.05). Differences were tested for medical cost and hospitalization risk.
Hospitalization Risk

Employer Example- Bank
Large financial services corporation
HQ in Midwest with employees in 25 states
At time of study, about 100,000 employees (72,000 continuously employed from 2000-2004)
70% female
Average age 38 years old
87% reported Caucasian ethnicity
Burton et al. The Association of Antidepressant Medication Adherence With Employee Disability Absences. Am J Manag Care. 2007;13:105-112.

Employer Example- Bank
Purpose of study to determine association of antidepressant medication adherence with employee disability absences
Retrospective, observational study
Time period: 2000-2004
2,112 employees in study cohort
Burton et al. The Association of Antidepressant Medication Adherence With Employee Disability Absences. Am J Manag Care. 2007;13:105-112.

Employer Example- Bank (RESULTS)
62% adhered to acute phase treatment (3 months of antidepressant treatment)
46% adhered to continuation phase treatment (6 months of antidepressant treatment)
Employees nonadherent with acute treatment were 39% more likely to have STD claims
Employees nonadherent with continuation treatment were 46% more likely to have STD claims
About $400,000 in lost STD workdays could have been saved had the employees maintained adherence
Burton et al. The Association of Antidepressant Medication Adherence With Employee Disability Absences. Am J Manag Care. 2007;13:105-112.

“Drugs don’t work in patients that don’t take them.”
- C. Everett Koop, M.D.
“Drugs don’t work in patients that don’t take them.”
- C. Everett Koop, M.D.
Osterberg, L., MD, and Blaschke T. MD, Adherence to Medication, NEJM August 4, 2005

1. Haynes RB et al. Interventions for helping patients follow prescriptions for medications. Cochrane Database of Systematic Reviews, 2001. 2. World Health Organization. Adherence to Long-Term Therapies: Evidence for Action. [World Health Organization Web site]. 2003. Available at: http://www.who.int/chronic_conditions/en/adherence_report.pdf. Accessed May 20, 2005
- World Health Organization- World Health Organization
“Increasing the effectiveness of adherence interventions may have a far greater impact on the health of the population than any improvement in specific medical treatments.”1,2
“Increasing the effectiveness of adherence interventions may have a far greater impact on the health of the population than any improvement in specific medical treatments.”1,2
(c) 2008 The GlaxoSmithKline Group of Companies. All Rights Reserved