Embed Size (px)
Citation preview

The impact of dementia on the health and aged care
systems

The Australian Institute of Health and Welfare is Australia’s national health and welfare statistics and information agency. The Institute’s mission is better health and wellbeing for Australians through better health and welfare statistics and information.

The impact of dementia
on the health and aged care
systems
June 2004
Australian Institute of Health and Welfare Canberra
AIHW Cat. No. AGE 37

© Australian Institute of Health and Welfare 2004 This work is copyright. Apart from any use as permitted under the Copyright Act 1968, no part may be reproduced without prior written permission from the Australian Institute of Health and Welfare. Requests and enquiries concerning reproduction and rights should be directed to the Head, Media and Publishing, Australian Institute of Health and Welfare, GPO Box 570, Canberra ACT 2601. A complete list of the Institute’s publications is available from the Publications Unit, Australian Institute of Health and Welfare, GPO Box 570, Canberra ACT 2601, or via the Institute’s web site at <http://www.aihw.gov.au>. ISBN 1 74024 385 4
Suggested citation
Australian Institute of Health and Welfare 2004. The impact of dementia on the health and aged care systems. AIHW Cat. No. AGE 37. Canberra: AIHW.
Australian Institute of Health and Welfare
Board Chair Dr Sandra Hacker Director Dr Richard Madden Any enquiries about or comments on this publication should be directed to: Ageing and Aged Care Unit Australian Institute of Health and Welfare GPO Box 570 Canberra ACT 2601 Phone: (02) 6244 1000 Published by the Australian Institute of Health and Welfare Printed by Elect Printing

v
Contents
List of tables ........................................................................................................................................ vi
Acknowledgements............................................................................................................................ ix
Abbreviations........................................................................................................................................x
Summary .............................................................................................................................................. xi
Background................................................................................................................................... xi
Prevalence of dementia............................................................................................................... xi
Service impact ............................................................................................................................. xii
Burden of disease....................................................................................................................... xiii
Expenditures by the health and aged care systems .............................................................. xiv
1 Introduction ...................................................................................................................................1
1.1 Background.............................................................................................................................1
1.2 Dementia as a contributor to demand for services............................................................1
1.3 Definition and identification of dementia ..........................................................................2
1.4 Scope of the report .................................................................................................................3
2 Prevalence and incidence of dementia in the population.....................................................5
2.1 Prevalence ...............................................................................................................................5
2.2 Incidence ...............................................................................................................................14
3 Service impact .............................................................................................................................15
3.1 General practice....................................................................................................................15
3.2 Hospitals................................................................................................................................19
3.3 Aged Care Assessment Teams ...........................................................................................26
3.4 Community care...................................................................................................................26
3.5 Residential aged care ...........................................................................................................40
3.6 Movement between services ..............................................................................................53
3.7 Summary ...............................................................................................................................57
4 Costs of dementia .......................................................................................................................59
4.1 Burden of disease .................................................................................................................59
4.2 System expenditures............................................................................................................69
Appendix: Data on general practice................................................................................................77
References............................................................................................................................................79

vi
List of tables
Table 2.1: Prevalence rates for dementia estimated from three different meta-analyses (per cent of age group) ..................................................................................................5
Table 2.2: Prevalence of dementia estimated using meta-analysis by Jorm et al. (1987), 2002...................................................................................................................................6
Table 2.3: Estimated number of people with dementia, by age and sex, 1998 ........................8
Table 2.4: People with dementia: core activity restriction by age, 1998 (number and age-specific rates) ...........................................................................................................9
Table 2.5: People with dementia and Australian population, by age and place of residence, 1998 ..............................................................................................................10
Table 2.6: Prevalence of dementia estimated using survey-based age–sex specific rates, by age and sex, 30 June 2002.......................................................................................11
Table 2.7: People with dementia with a severe or profound core activity restriction (projected), by age and sex, 30 June 2002..................................................................13
Table 2.8: People with dementia with a severe or profound core activity restriction (projected), by age and sex, 30 June 2020..................................................................13
Table 3.1: Characteristics of the patients at dementia encounters, by year of survey..........17
Table 3.2: Most commonly prescribed medications classified by Anatomical Therapeutic Chemical (ATC) group, in order of prescription rate, 2001–02 .......18
Table 3.3a: Separations with principal diagnosis of dementia (F00, F01, F02, F03, F051 and G30), by age group and sex, 1998–99 to 2001–02..............................................20
Table 3.3b: Age-specific rates of hospital separation with a principal diagnosis of dementia (F00, F01, F02, F03, F051 and G30) per 1,000 persons, by sex, 1998–99 to 2001–02 .......................................................................................................21
Table 3.4a: Separations with principal or additional diagnosis of dementia (F00, F01, F02, F03, F051, G30), by age group and sex, 1998–99 to 2001–02...........................23
Table 3.4b: Age-specific rates of hospital separation with a principal or additional diagnosis of dementia (F00, F01, F02, F03, F051 and G30) per 1,000 persons, by sex, 1998–99 to 2001–02 ..........................................................................................24
Table 3.5: Length of hospital stay by dementia diagnosis (excluding same-day separations), 2001–02 ...................................................................................................25
Table 3.6: CACP and EACH recipients with and without dementia, census periods, 2002.................................................................................................................................28
Table 3.7: CACP care recipients with and without dementia, by age and sex, census week 2002 ......................................................................................................................30

vii
Table 3.8: CACP care recipients with and without dementia, by age, census week 2002 ...30
Table 3.9: CACP care recipients, by dementia status, carer availability and sex, census week 2002 ......................................................................................................................31
Table 3.10: CACP care recipients with and without dementia, by carer availability and age, census week 2002 .................................................................................................31
Table 3.11: CACP care recipients with and without dementia, core activity in which assistance was needed, census week 2002 ................................................................32
Table 3.12: Hours or number of each assistance type provided to CACP care recipients with and without dementia, census week 2002 .......................................................32
Table 3.13: CACP care recipients with and without dementia, types of assistance, by carer status, census week 2002 ...................................................................................33
Table 3.14: Amount of assistance for CACP recipients with and without dementia, types of assistance, by carer status, census week 2002 ......................................................33
Table 3.15: EACH care recipients with and without dementia, by age and sex, census week May 2002 .............................................................................................................36
Table 3.16: EACH care recipients with and without dementia, by age, census week May 2002........................................................................................................................36
Table 3.17: EACH care recipients with and without dementia, by carer availability and sex, census week May 2002 .........................................................................................37
Table 3.18: EACH care recipients with and without dementia, by carer availability and age, census week May 2002.........................................................................................37
Table 3.19: EACH care recipients with and without dementia, core activity in which assistance was needed, by age, census week May 2002..........................................38
Table 3.20: Hours or number of each assistance type provided to EACH care recipients with and without dementia, census week May 2002 ..............................................38
Table 3.21: EACH care recipients with and without dementia, types of therapies and ancillary services provided, by carer status, census week May 2002 ...................39
Table 3.22: Amount of assistance for EACH care recipients with and without dementia, area in which assistance was needed, by carer status, census week May 2002...40
Table 3.23: Dementia proxy index for permanent aged care residents ....................................43
Table 3.24: Permanent residents, RCS and dementia status, 31 December 1998 ....................44
Table 3.25: Permanent residents, by dementia status, 2002 .......................................................45
Table 3.26: Permanent residents, by dementia status, sex and age at separation, for last separation of separating permanent residents, 2002 ...............................................46
Table 3.27: Permanent residents, by RCS and dementia status, 31 December 2002 ...............47

viii
Table 3.28: Average length of stay by dementia status, by sex and age at separation, for last separation of separating permanent residents, 2002........................................48
Table 3.29: Average length of stay by dementia status and RCS level, for last separation of separating permanent residents, 2000–02 ............................................................49
Table 3.30: Total number of occupied bed days by last RCS level classification before separation, for all permanent residents separating in 2002....................................50
Table 3.31: Occupied bed days over a year for permanent residents, by RCS level and dementia status, 1998–99 to 2001–02 .........................................................................51
Table 3.32: Permanent aged care residents admitted between 1 October 2002 and 31 December 2002 by use of HACC or CACP between 1 July and 30 September 2002, by dementia status.....................................................................54
Table 3.33: Permanent aged care residents separating between 1 January 2002 and 30 June 2002 by subsequent use of HACC or CACP and dementia status ..........55
Table 3.34: Average length of stay for permanent separations, by separation reason, sex and dementia status, 2002 ...........................................................................................56
Table 4.1: Number of deaths with an underlying cause of dementia, by age and sex, 1997 to 2001 ...................................................................................................................61
Table 4.2: Death rates for the underlying cause of dementia, by age and sex, 1997 to 2001 (per 100,000 population) .......................................................................62
Table 4.3: Number of deaths where dementia was a contributing cause, by age and sex, 1997 to 2001 ...................................................................................................................64
Table 4.4: Death rates for the contributing cause of dementia, by age and sex, 1997 to 2001 (per 100,000 population).....................................................................................65
Table 4.5: Burden of disease for dementia, by age and sex, 1996 (years of life lost) ............68
Table 4.6: Burden of disease for dementia, by age and sex, 1996 (years of life lost per 1,000 population) ..........................................................................................................69
Table 4.7: Direct health system expenditure for dementia by government and individuals, by health sector, 1993–94 and 2000–01 ($ million).............................70
Table 4.8: Australian Government residential aged care subsidies for permanent residents with dementia as main condition, 2000–01..............................................74
Table 4.9: Direct health and aged care system expenditure for dementia by government and individuals, by sector, 2000–01 ...........................................................................75

ix
Acknowledgements This report was prepared by Anne Jenkins, John Goss, Cathy Hales and Rosemary Karmel. However, the contributions of people from a number of units within the Australian Institute of Health and Welfare were essential to the completion of this project. In particular, Peter Braun of the Ageing and Aged Care Unit provided data relating to residential aged care use, and Ben Nelson and Evon Bowler analysed data from the aged care censuses. Data on hospital use were derived by Ian Titulaer, Stephen Halpin and Ruth Penm of the Hospitals and Mental Health Services Unit, and staff of the General Practice Statistics and Classification Unit provided data and comment on the use of general practice services. Robert Van der Hoek of the Population Health Unit compiled the relevant mortality data, and, lastly, Nick Mann of the Summary Measures Unit derived the information on health system costs. In addition, valuable comments on drafts of this report were provided by a number of people, including David Cullen of the Department of Health and Ageing and Glenn Rees of Alzheimer’s Australia.

x
Abbreviations ABS Australian Bureau of Statistics
ACAP Aged Care Assessment Program
ACAT Aged Care Assessment Team
ACCMIS Aged and Community Care Management Information System
AIHW Australian Institute of Health and Welfare
AMTS Australian Morbidity and Treatment Survey
BEACH Bettering the Evaluation of Care of Health survey
CACP Community Aged Care Package
CI Confidence interval
DALY Disability-adjusted life year
DoHA Australian Government Department of Health and Ageing
EACH Extended Aged Care at Home
GP General practitioner
ICD–10–AM The international statistical classification of diseases and related health problems, 10th revision, Australian modification
ICD–9–CM The international classification of diseases, 9th revision, clinical modification
LCL Lower confidence limit
MMHA Mini Mental Health Assessment
OECD Organisation for Economic Co-operation and Development
RACS Residential aged care service
RCS Resident Classification Scale
RFE Patient Reasons for Encounter
SAND Supplementary Analysis of Nominated Data (part of the BEACH program)
UCL Upper confidence limit
YLD Years of life lost due to disability
YLL Years of life lost due to premature death

xi
Summary
Background In the 2002–03 budget, the Australian Government announced funding for a review of pricing arrangements in residential aged care. The review, conducted by Professor Warren Hogan, examined long-term financing options for the aged care sector with consideration of the level and quality of care required by older Australians into the future and taking into account issues of equity of access. It considered the improved care outcomes required from providers under accreditation and the underlying cost pressures faced by the industry, including movements in nurses’ and other wages, and increases in workers’ compensation and other insurance premiums. The approach taken by Hogan in addressing the aims of the review was to discuss aged care service provision in terms of demand for aged care, the cost of aged care and the supply of aged care services, recognising that these overlap and interact. The prevalence of disability provides an indicator of the potential demand for residential aged care; and dementia has been found to be the greatest single contributor to burden of disease due to disability at older ages, as well as the greatest single contributor to the cost of care in residential aged care. Therefore, to inform the review by Professor Hogan, the Department of Health and Ageing commissioned the Australian Institute of Health and Welfare in mid-2003 to investigate the extent to which health and aged care service use can be associated with dementia. This report presents the findings of these investigations, examining the prevalence of dementia in the Australian population, the current patterns of service use by people with dementia and the costs associated with this use.
Prevalence of dementia Dementia describes a syndrome associated with a range of diseases which are characterised by the progressive impairment of brain functions, including language, memory, perception, personality and cognitive skills. These declines in mental function may manifest themselves through different symptoms at various times. Alzheimer’s disease is the most common form of dementia, estimated to be responsible for 70% of dementia cases. The prevalence of dementia has been estimated to double every 5.1 years of age after the age of 65, affecting 24% of those aged 85 and over. To date there has been little progress in preventing or delaying the onset of dementia. Alzheimer’s disease shortens total life expectancy and men and women with the disease spend a greater proportion of their remaining life with more impairments than their unaffected age peers. Because of difficulties in identifying people with mild or moderate dementia no definitive estimates of the number of people with dementia in Australia are available. Using results from a meta-analysis of international studies, it is estimated that in 2002 around 167,000 Australians were affected by dementia, with almost two-thirds of these aged 80 years and over. Among people aged 65 and over, 6.5% are estimated to have dementia. The care needs experienced by someone with dementia vary greatly as the severity of the cognitive impairment progresses. Using 1998 survey-based age–sex prevalence rates, for

xii
2002 it is estimated that the number of people with dementia always or sometimes needing assistance with either self-care, mobility or communication—that is, with a severe or profound core activity restriction—was 113,000, constituting 1.1% of the population aged 35 years and over; the majority were in cared accommodation, such as residential aged care. Also in 2002, 70% of older people with dementia and a severe or profound core activity restriction are estimated to have been 80 years and over, with around half aged 85 years or more. The number of women with dementia and a severe or profound core activity restriction was about double the number of men in that position. It is estimated that 34,000 people acquired dementia in 2002. Unless there are significant breakthroughs in the treatment and/or prevention of dementia, the prevalence of dementia is expected to continue to increase in line with Australia’s ageing population. The number of people with a severe or profound core activity restriction with dementia is projected to rise from 113,000 in 2002 to 179,000 in 2020—an increase of 60%. Over half of this increase will be among those aged 85 and over, mostly due to the ageing of the older population: the number aged 85 and over with dementia and a severe or profound core activity restriction is estimated to increase from 59,000 in the year 2002 to 98,000 in 2020.
Service impact The impact of dementia varies from service to service. In this report a number of national services are considered: general practice, hospital services, home-based community care and residential aged care. There is a variety of other national and state-specific services—both mainstream and targeted at people with dementia and their carers—which it has not been possible to include. For 2001–02 it is estimated that around 5% of general practitioner adult patients (aged 18 and over) had either diagnosed or suspected dementia. However, dementia was managed in relatively few general practitioner (GP) encounters: in 2001–02, dementia was managed at a rate of 6 per 1,000 GP encounters with adults. Overall, dementia was managed in approximately 505,000 adult encounters, with about one quarter of these involving Alzheimer’s disease. In addition, medication was prescribed in the management of dementia at a rate of 29.4 per 100 dementia contacts. Given that only a small proportion of people with dementia are aged under 65, this can be compared with a general prescription rate of between 110 and 120 per 100 encounters for people aged 65 and over. As would be expected from the prevalence of dementia in the population, an overwhelming majority (86%) of encounters in which dementia was managed were for people aged 75 and over. The impact of dementia on hospital services appears to be relatively greater than that on general practice. In 2001–02, 1.2% of all hospital separations (or 79,000 separations) involved people with either a principal or additional diagnosis of dementia (where additional diagnoses are recorded if they contribute to the consumption of hospital resources). For around one in eight of these separations, dementia was the principal diagnosis. If same-day separations are excluded, people with any diagnosis of dementia accounted for 2.3% of hospital separations. However, people with dementia tend to stay longer than others in hospital. Consequently, nearly 7% of bed days for separations lasting at least one night were for people with any diagnosis of dementia. If the prevalence rate of dementia increases with the ageing of the population as expected, a greater proportion of hospital bed days can be expected to involve people with a diagnosis of dementia.

xiii
The care needs of people with dementia grow as the disease progresses. As a consequence, the prevalence of dementia among people using aged care services increases with the level of care being provided by the program. For 2002 it is estimated that 6% to 7% of people aged 65 and over had dementia and 4% had both dementia and a severe or profound disability. However, among people screened for aged care programs by Aged Care Assessment Teams (ACATs), around 20% have a primary diagnosis of dementia. Reflecting the level of care available through the various programs, 18% of Community Aged Care Packages (CACP) recipients have diagnosed dementia compared with 32% of Extended Aged Care at Home (EACH) place recipients. Not surprisingly, dementia has the greatest prevalence in residential aged care services. Precision is not possible, but applying an indicator based on a measure of cognitive impairment developed by consultants for the 1998 review of the Resident Classification Scale (RCS) results in an estimate of 52% of people admitted into permanent residential aged care in 2002 who possibly had dementia and a further 26% who probably had dementia. At the end of 2002, using the same indicator gives estimates of 50% and 31%, respectively, of permanent residents either possibly or probably with dementia. In general, people with care needs similar to those met by residential aged care have difficulty staying in the community without a carer. However, EACH and CACP recipients with dementia are more likely than other recipients to have a carer, suggesting that people with dementia have even greater difficulty staying at home without a carer. This is particularly true as the disease progresses and care needs become greater: in 2002 nearly all EACH recipients with dementia had a carer (97% compared with 88% of recipients without dementia). A change in the availability of carers would therefore impact on the ability of people with dementia to remain in their homes. Within a service program, people with dementia generally have greater care needs than those without. This particularly affects residential aged care: at 31 December 2002, around 86% of permanent residents with probable dementia were in the highest two RCS care need categories, compared with 34% of residents with possible dementia and 8% of those without dementia. In addition, in 2002 two-thirds of occupied bed days for people in the two highest RCS care need categories were used by people who probably had dementia. This rises to 97% if people with possible dementia are also included. Although people with diagnosed dementia have a shorter remainder of life expectancy than others, the length of stay in residential aged care by people with dementia is, on average, longer than stays by other residents. As a consequence, in 2001–02 people with either possible or probable dementia accounted for 80% of occupied bed days by permanent residents. Over the last 4 years this relative use has been increasing—up from 73% of occupied bed days in 1998–99. The rise in use by people with dementia has been driven by growth in bed days for people with possible dementia, with the proportion of bed days for people with probable dementia falling over the period—from 37% of bed days in 1998–99 to 33% in 2001–02.
Burden of disease Death rates from dementia (age-standardised) have been stable, or declining, over the period 1997 to 2001. However, diseases and disorders can have a range of effects on both quality and length of life. Because of its disabling rather than fatal nature, dementia has a much greater effect on years of healthy life lost than it has on years of life lost due to mortality.
xiv
The combined effect of premature mortality and burden of disease due to disability is gauged using disability-adjusted life years (DALYs). One DALY is a lost year of ‘healthy’ life, and is the sum of years of life lost due to premature mortality and years of healthy life lost due to disability. In 1996, the only year for which data are available, disability accounted for around three-quarters of the total burden due to dementia for people aged 55 and over. Death, however, accounted for a greater proportion of the burden for older than younger people; premature death caused about one-third of the burden for people aged 75 and over, but less than 15% for people aged 55 to 74. For all other causes combined, premature death was the greater source of disease burden, contributing 70% of the burden among people aged 55 and over. Overall, in 1996, dementia-related disability and death resulted in a loss of 19 DALYs (out of a total of 417 DALYs) per 1,000 men aged 55 and over; for women the corresponding figure was 27 DALYs per 1,000 population (out of a total of 342 DALYs for all causes). Reflecting the increasing burden with age observed for both death and disability, the total burden of dementia increases with age. Among people aged 75 and over dementia accounted for 54 DALYs per 1,000 men (or 7%) and 65 DALYs per 1,000 women (or 11%).
Expenditures by the health and aged care systems For 2000–01 it is estimated that expenditures for dementia by the health and aged care systems combined were just over $2.5 billion. An overwhelming proportion of this expenditure was for residential aged care ($2.1 billion), with this accounting for 84% of total expenditure. It is estimated—somewhat roughly—that in 2000–01, the cost to government of dementia to the main community care programs totalled around $100 million. In contrast, for the same year the cost of dementia to residential aged care is estimated to have been nearly $1.8 billion in government funding. An overwhelming majority of this expenditure was for residents requiring high-level care, with 99% ($1.5 billion) of Australian Government subsidies for residents with dementia as their main disabling condition being for those with high care needs. The cost of aged care services to users is generally not available; however, a crude estimate attributes to dementia around $360 million of user payments for residential aged care in 2000–01. Expenditure for dementia by the health system (excluding health expenditure in residential aged care) was $307 million in 2000–01. Over half of this expenditure was by hospitals ($160 million), and nearly 9% was for pharmaceuticals ($27 million). As well as the programs considered above, there are a number of others which deliver services to people with dementia. For example, due to lack of relevant data, it has not been possible to consider the cost of dementia with respect to carers—either in terms of costs to individuals or in government expenditure on programs that support carers (such as the Carers Allowance and the National Respite for Carers Program). In 2000–01, the programs included in the above costing together accounted for 93% of government funding on national aged care programs. In addition, there are several state-specific aged care services—both mainstream and targeted at people with dementia and their carers—which it has not been possible to include. Consequently, the above estimates of financial cost to the aged care system understate the total cost.

xv

1
1 Introduction
1.1 Background In the 2002–03 budget, the Australian Government announced funding for a review of pricing arrangements in residential aged care. The review, conducted by Professor Warren Hogan, examined long-term financing options for the aged care sector with consideration of the level and quality of care required by older Australians into the future and taking into account issues of equity of access. It considered the improved care outcomes required from providers under accreditation and the underlying cost pressures faced by the industry, including movements in nurses’ and other wages, and increases in workers’ compensation and other insurance premiums. The review reported to the government early in 2004, making recommendations on: • the appropriate future public and private funding arrangements, including future
indexation arrangements for the industry; • performance improvement in the industry, including the appropriate use of performance
indicators; and • long-term financing of the aged care industry. The approach taken by Hogan in addressing the aims of the review was to discuss aged care service provision in terms of demand for aged care, the cost of aged care and the supply of aged care services, recognising that these overlap and interact. The prevalence of disability provides an indicator of the potential demand for residential aged care. The prevalence of disability increases with age; therefore, as the population experiences structural ageing, the proportion of the population affected by disability grows. Thus likely demand for aged care services increases over time.
1.2 Dementia as a contributor to demand for services
A key contributor to the increase in severe disability experienced by those over 80 is neurological conditions which result in disorders of memory, cognition, behaviour, motor and sensory functioning, mobility and balance. The most significant among the neurological disorders is the symptom of dementia, which has been found to be the greatest single contributor to burden of disease due to disability at older ages as well as the greatest single contributor to the cost of care in nursing homes. The prevalence of dementia has been estimated to double every 5.1 years of age after the age of 65, affecting 24% of those aged 85 and over (Henderson & Jorm 1998:12). To date there has been little progress in preventing or delaying the onset of dementia. Consequently, as people live longer the prevalence of dementia rises. In addition, neurodegenerative diseases such as Alzheimer’s disease, rarely lead directly to death. Rather, these diseases are generally slowly progressive with death more likely to be the result of co-morbidity. However, studies have shown that Alzheimer’s disease greatly shortens total life expectancy, and that the

2
magnitude of this effect is greater at younger ages of diagnosis (Brookmeyer et al. 2002; Dodge et al. 2003). For example, in an American study, women diagnosed at age 70 had an estimated median remaining life span of 7 years compared with an estimated median of 19 years for study participants both with and without dementia. For those diagnosed at age 90, the corresponding figures were 3 and 5 years (Brookmeyer et al. 2002). Furthermore, men and women with Alzheimer’s disease spend a greater proportion of their remaining life with more IADL1 impairments than their non-demented age peers (Dodge et al. 2003). The care needs experienced by someone with dementia may vary greatly as the severity of the cognitive impairments progresses. The associated demand for residential services will depend on a range of factors such as the availability of care alternatives including care by family and friends. This report examines the extent to which key health and aged care services are utilised by people affected by dementia. An examination of current patterns of service provision and service use provides information on the cost pressures currently experienced by the industry. The services considered are not only confined to residential care but include the range of health care, community care and other aged care services and the interaction between these services that may be considered to more broadly define the aged care system.
1.3 Definition and identification of dementia Dementia describes a syndrome associated with a range of diseases which are characterised by the progressive impairment of brain functions, including language, memory, perception, personality and cognitive skills. These declines in mental function may manifest themselves through different symptoms at various times. In the early stages of dementia, difficulty may be experienced with familiar tasks such as shopping, driving or handling money. As dementia progresses, more basic or core activities of daily living are affected which include communication and self-care (e.g. eating, bathing, dressing). More specifically, the cognitive, psychiatric and behavioural manifestations of dementia may include: • memory problems, especially for recent events (long-term memory usually remains in
the early stages); • communication difficulties through problems with speech or understanding language; • confusion, wandering, getting lost; • personality changes and behaviour changes such as agitation, repetition, following; and • depression, delusions, apathy and withdrawal. There are a variety of types of dementia. The most common are: • Alzheimer’s disease, the most common form of dementia, estimated to be responsible for
over 70% of dementia disorders (Ojeda et al. 1986, cited in Henderson & Jorm 1998). • Vascular dementia, where damage is believed to develop as a result of narrowing of the
arteries supplying the brain. Onset may be sudden, following a stroke, or gradual, following a number of ‘mini-strokes’.
• Dementia with Lewy bodies, in which abnormal brain cells (Lewy bodies) form in all parts of the brain. Progress of the disease is more rapid than for Alzheimer’s disease.
1 IADL = Instrumental activities of daily living.

3
• Pick’s disease and frontal lobe dementia, in which damage starts in the front part of the brain, with personality and behavioural symptoms more common early on.
• Parkinson’s disease, resulting from the loss of the neurotransmitter, dopamine, in the brain. Dopamine is implicated in the control of voluntary movements. Dementia is more common in people with Parkinson’s but not everyone with Parkinson’s develops dementia.
• Alcohol- and drug- related dementia, in which brain function deterioration is caused by excess alcohol consumption, particularly in conjunction with a poor diet low in vitamin B1 (thiamine).
• Huntington’s disease, an inherited disorder of the central nervous system in which cell death occurs. It is characterised by jerking or twisting movements of the body and is usually accompanied by dementia.
• Creutzfeldt-Jakob disease, in which nerve cells swell, increasing in size and number, and are lost, producing a spongy change throughout the brain. Until recently the disease typically appeared without apparent cause; however, the transfer of Bovine Spongiform Encephalopathy (‘Mad Cow Disease’) has been identified as the cause of an increase in the incidence of this disease, particularly among people under 30.
Definitive diagnosis of the type of disease that brings about the manifestation of dementia is often only possible after death, through a post-mortem analysis. The syndrome of dementia is, however, more amenable to diagnosis and a number of tools are available for its diagnosis and classification. In the services data that is presented in this report the means used to identify and classify dementia are discussed.
1.4 Scope of the report Data on key health and aged care services that provide care to people affected by dementia are examined in the following chapters. Analysis is only possible where data exist to identify service users with dementia or where a reasonable proxy can be made for the identification of dementia among service users. The focus of this report is on current service use patterns, with some historical trends where the data allow. While this may point to likely future service needs, future demand that occurs as a result of dementia could vary for any number of reasons. For example, technological change and medical advances could bring about a cure or effective ameliorating treatment for dementia which would have implications for services required. The next chapter of this report presents estimates of the prevalence of dementia using international meta-data analyses and data from the Australian Bureau of Statistics 1998 Disability, Ageing and Carers Survey. The ABS survey enables national estimates of the prevalence of dementia, with an analysis of the disability levels associated with it. The proportion of dementia sufferers in the general category of cared accommodation is also available from this collection. Chapter 3 examines the impact of dementia on health services and community and residential aged care. The analyses for health and community care services use data from collections in which clients with dementia are specifically identified. The prevalence of dementia in residential aged care is estimated using an index based on the Resident Classification Scale, and the characteristics and service use patterns of residents with dementia are then explored.

4
Chapter 4 presents an epidemiological analysis of dementia using burden of disease techniques. Analysis of the cost of dementia to the health and aged care systems for 2000–01 is also presented.

5
2 Prevalence and incidence of dementia in the population
2.1 Prevalence Prevalence refers to the number of people in the population affected by a disease at a particular time. There are two key sources of estimates for the prevalence of dementia in Australia: the Australian Bureau of Statistics (ABS) Disability, Ageing and Carers Survey and meta-analyses undertaken by researchers such as Jorm et al. (1987), Hofman et al. (1991) and Ritchie et al. (1992). The results, relative merits and limitations of these sources of estimates are discussed.
Prevalence estimates from meta-analyses Meta-analyses pool data from a group of studies with the aim of producing better estimates. Those undertaken on the prevalence of dementia by a number of researchers report prevalence rates for specific age groups. The meta-analysis by Jorm and his colleagues (Jorm et al. 1987) used data from 22 studies across the world. From these studies Jorm, Korten and Henderson calculated average age-specific prevalence rates (see Table 2.1). The results are very similar to those obtained in Hofman et al.’s 1991 meta-analysis of 12 European studies (Hofman et al. 1991). A meta-analysis of just three studies which used the DSM-III diagnostic criteria2 for dementia produced lower prevalence rates among those aged 75 years and over relative to the first two meta-analyses (Ritchie et al. 1992).
Table 2.1: Prevalence rates for dementia estimated from three different meta-analyses (per cent of age group)
Age Jorm et al. (1987) Hofman et al. (1991) Ritchie et al. (1992)
60–64 0.7 1.0 0.9
65–69 1.4 1.4 1.6
70–74 2.8 4.1 2.8
75–79 5.6 5.7 4.9
80–84 11.1 13.0 8.7
85+ 23.6 24.5 16.4
Source: Reproduced from Henderson & Jorm 1998:12.
Henderson & Jorm (1998) noted that prevalence rates differed greatly from study to study within the meta-analysis and that this was affected by the methodology used in each case, in particular by ‘where the boundary between dementia and normal ageing is placed’
2 Diagnostic and Statistical Manual of Mental Disorders III, published by the American Psychiatric Association.

6
(Henderson & Jorm 1998:11). It is also possible that differences occur in the true prevalence of dementia from country to country or sample group to sample group. At present there is insufficient data to test this hypothesis since a comprehensive cross-national study on dementia using a consistent method has not been conducted. Preliminary results of a review by the Organisation for Economic Co-operation and Development (OECD) of the comparability across countries of prevalence estimates for dementia conclude that there is currently no means of disentangling differences in dementia prevalence across countries from methodological differences since methodology is still not reproducible from one study to another. Henderson & Jorm (1998) concluded that while it is not possible to derive a ‘true’ prevalence rate from meta-analyses, a consistent finding was that there is a trend for prevalence to increase exponentially with age. The prevalence of dementia (all types combined) was found to double with every 5.1 years of age. To get an indication of the number of people currently affected by dementia in Australia, prevalence rates from the meta-analysis by Jorm et al (1987) have been applied to the estimated resident population at 30 June 2002 (Table 2.2). Using this method, it is estimated that in 2002 around 167,000 people were affected by dementia, with almost two-thirds of these (62%) aged 80 and over.
Table 2.2: Prevalence of dementia estimated using meta-analysis by Jorm et al. (1987), 2002
Age Males Females Persons Males Females Persons
Number Per cent
60–64 3,000 2,900 5,900 4.6 2.9 3.5
65–69 4,800 5,000 9,800 7.4 4.9 5.9
70–74 8,500 9,300 17,800 13.1 9.1 10.7
75–79 13,100 16,500 29,600 20.1 16.1 17.7
80–84 15,200 23,500 38,700 23.4 23.0 23.1
85+ 20,400 45,000 65,300 31.3 44.0 39.1
Total 65,000 102,200 167,200 100.0 100.0 100.0
Prevalence rate 60+ (%) 4.2 5.7 5.0 . . . . . .
Prevalence rate 65+ (%) 5.6 7.2 6.5 . . . . . .
Sources: Table 2.1; ABS 2003.
Prevalence estimates from the Disability, Ageing and Carers Survey National data on the prevalence of disability and the conditions, such as dementia, that give rise to it are available through the ABS Disability, Ageing and Carers Survey. Last conducted in 1998, this five-yearly survey provides information on people with disabilities, older people and people who provide assistance to others because of their disabilities. This survey was conducted using two collection instruments: an interviewer-based computer-assisted collection for all usual members of selected households; and mail-back forms completed by a staff member for residents of cared accommodation facilities. Families with a member (such as parent or child) with a disability were identified, together with families in which a member was a primary carer. The cared accommodation component covered residents of hospitals, residential aged care, and other homes such as children’s homes, who had been, or were expected to be, living there for at least 3 months.

7
Through a series of questions to a household representative or staff member, the severity of the disability and the main disabling condition were identified. In the survey, a person was considered to have a disability if he or she had a limitation, restriction or impairment, which had lasted, or was likely to last, for at least 6 months and restricted everyday activities. Four levels of core activity restriction were determined, based on whether a person needed help with, had difficulty with, or used aids or equipment for any of self-care, mobility and communication activities. The highest level of restriction the person experienced in any of the core activity areas determined a person’s overall level of core activity restriction. The four levels are as follows: 1. Profound core activity restriction, indicating the person is unable to do, or always needs
help with, a core activity. 2. Severe core activity restriction, indicating the person sometimes needs help with a core
activity, or has difficulty understanding or being understood by family or friends, or can communicate more easily using sign language or other non-spoken forms of communication.
3. Moderate core activity restriction, indicating the person needs no help but has difficulty with a core activity task.
4. Mild core activity restriction, indicating the person meets one or more of the following criteria:
• needs no help and has no difficulty with any of the core activity tasks, but uses aids and equipment
• cannot easily walk 200 metres • cannot walk up and down stairs without a handrail • cannot easily bend to pick up an object from the floor • cannot use public transport • can use public transport but needs help or supervision • needs no help or supervision but has difficulty using public transport.
Further background information about the ABS 1998 survey can be found in the publication Disability, Ageing and Carers: Summary of Findings (ABS 1999).
Dementia prevalence results based on the survey The following tables present data on people with dementia by age and sex, by severity of core activity restriction, and by place of residence (household or cared accommodation). The estimates were derived using the 1998 ABS Survey of Disability, Ageing and Carers confidentialised unit record file. The survey reported no people aged under 35 years with dementia. These tables therefore focus on people aged 35 years and over as that segment of the population at risk of the condition. In 1998, there were 101,800 people with reported dementia (Table 2.3). Of these, 66,400 were females and 35,400 were males. The number of people reporting dementia increased with age. Because of their small numbers, estimates of the number of people with dementia in age groups 35–59 years and 60–64 years and 65–69 years are subject to moderately high to very high sampling variability. The estimates and prevalence rates of the population aged 65 years or more are more reliable. There were 97,800 people aged 65 years and over who were reported as having dementia, accounting for 4% of all people in the Australian population of

8
that age. Of all Australians who were 85 years or more, just over one in five, or 22%, were reported to have dementia. In age groups 80–84 years and 85 years and over, the prevalence of dementia appears to be higher for females than for males. However, the female population in these age groups, especially the latter, has an older age structure. For example, results of the 2001 ABS Census of Population and Housing show that females aged 90 years and over accounted for 39% of all females aged 85 years or over. The corresponding proportion for males in 2001 was 32% (AIHW analysis of ABS 2001 Census of Population and Housing expanded community profiles). Moreover, females considerably outnumber males at older ages: the 2001 census enumerated 81,849 males and 180,840 females aged 85 years and over. As the Survey of Disability, Ageing and Carers is a population-based survey, the detection of diseases and conditions with low to moderate prevalence is more efficient in larger populations. These factors could account for much of the difference in reported prevalence of dementia among males and females in the older age groups. Dementia prevalence by single year ages is not available from the 1998 survey data, which reports conditions by 5-year age groups and an open-ended age group for 85 years and over.
Table 2.3: Estimated number of people with dementia, by age and sex, 1998
Number with dementia Age specific rates (%)
Age Males Females Persons Males Females Persons
35–59 **800 **800 **1,700 — — —
60–64 **1,700 **600 *2,300 **0.5 **0.2 *0.3
65–69 *2,500 **1,100 *3,600 *0.8 **0.3 *0.5
70–74 6,300 *4,100 10,400 2.2 *1.3 1.7
75–79 6,300 8,400 14,800 3.2 3.2 3.2
80–84 6,400 13,300 19,800 5.8 7.4 6.8
85+ 11,300 37,900 49,200 16.4 24.3 21.9
Total 65+ 32,800 64,900 97,800 3.3 5.1 4.3
Total 35+ 35,400 66,400 101,800 0.8 1.4 1.1
Notes
1. The survey reported no people aged under 35 years with dementia.
2. Estimates marked with ** have an associated relative standard error (RSE) of 50% or more. Estimates marked with * have an associated RSE of between 25% and 50%. These estimates should be interpreted accordingly.
3. Estimates are based on all people reporting dementia as a long-term condition in the ABS Survey of Disability, Ageing and Carers.
— Nil or rounded to zero.
Source: AIHW analysis of ABS 1998 Survey of Disability, Ageing and Carers confidentialised unit record file.
Disability levels among people with dementia Using the 1998 ABS survey, estimates of the prevalence of reported dementia together with the prevalence and severity of disability can be derived. Having a disability does not imply a need for assistance. Core activity restriction, as described above, provides a more useful indicator of level of difficulty experienced or help needed in performing activities basic to living than does the overall disability measure. The group most likely to be in need of assistance from aged care programs providing higher levels of care are those with a severe or profound core activity restriction.

9
People who experience disability may have multiple conditions that give rise to this disability. It can be difficult to medically determine accurately the extent to which one condition among others results in the overall level of disability. The ABS Disability, Ageing and Carers Survey does not have access to such medical determinations, but rather asks the individual or carer to identify what they believe to be the main condition that gives rise to the disability. Among people with a severe or profound restriction who were reported to have dementia, the dementia was implicated as the main disabling condition in 67% of cases. This figure includes reports of Alzheimer’s disease and non-specific dementia as the main cause of severe or profound restriction. It does not include instances where an underlying cause of dementia other than Alzheimer’s disease, such as Parkinson’s disease, was indicated as the main cause of severe or profound restriction even if the dementia manifestation of the disease was, in fact, the main disabling condition. Table 2.4 shows the level of disability experienced by people who reported dementia. It captures cases where dementia was both the main condition that gave rise to the disability and cases where dementia was present along with another long-term condition(s) and may have contributed to a lesser degree to the overall disability experienced by an individual. Most people with dementia had a disability (100,000 or approximately 98%), with almost as many having severe or profound core activity restriction (95,200, or approximately 94% of dementia sufferers). The proportion of people with dementia having severe or profound core activity restriction increases from around 80% in the 65–69 age group to 99% in the 85 and over age group. Overall, 96% of the Australian population aged 65 years or more who reported dementia also had a severe or profound core activity restriction.
Table 2.4: People with dementia: core activity restriction by age, 1998 (number and age-specific rates)
Number with dementia Age specific rates (%)
Age
With severe or profound core
activity restriction
With moderate or mild core
activity restriction
Without core activity
restriction, or with no
disability
With severe or profound core
activity restriction
With moderate or mild core
activity restriction
Without core activity
restriction, or with no
disability
35–59 **1,100 **600 — — — —
60–64 **800 **1,400 **200 **0.1 **0.2 —
65–69 3,000 **600 — 0.4 **0.1 —
70–74 8,600 *1,400 **500 1.4 *0.2 **0.1
75–79 14,400 — **300 3.1 — **0.1
80–84 19,400 **200 **100 6.7 **0.1 —
85+ 48,100 **500 **700 21.4 **0.2 **0.3
Total 65+ 93,400 **2,700 **1,600 . . . . . .
Total 35+ 95,200 *4,800 **1,800 . . . . . .
Notes
1. Estimates marked with ** have an associated relative standard error (RSE) of 50% or more. Estimates marked with * have an associated RSE of between 25% and 50%. These estimates should be interpreted accordingly.
2. Estimates are based on all people reporting dementia as a long-term condition in the Australian Bureau of Statistics Survey of Disability, Ageing and Carers.
— Nil or rounded to zero.
Source: AIHW analysis of ABS 1998 Survey of Disability, Ageing and Carers confidentialised record file.

10
Place of residence The severity of the disability experienced by people with dementia means that many of those with the condition are eligible for care in residential aged care services. In 1998, 73,300 people reported to have dementia had been, or were expected to be, living in cared accommodation such as residential aged care services or hospitals for 3 months or more (Table 2.5). This equates to 72% of all those reporting dementia. For those aged 65 or more, 43% of those in cared accommodation reported dementia, compared with around 1% of those living in households. For those aged 85 years or more, the corresponding figures were 47% and 8%.
Table 2.5: People with dementia and Australian population, by age and place of residence, 1998
People with dementia Population
Age-specific rates within accommodation type
Age HouseholdsCared
accommodation HouseholdsCared
accommodation Households Cared
accommodation
Number Per cent
35–59 **1,300 *400 6,185,800 12,800 — 3.5
60–64 **1,700 *600 731,600 3,900 0.2 16.1
65–69 **1,800 1,800 670,800 7,500 0.3 24.8
70–74 *5,400 5,000 596,100 14,900 0.9 33.9
75–79 *5,400 9,300 442,400 22,500 1.2 41.5
80–84 **2,300 17,500 249,600 40,100 0.9 43.7
85+ 10,700 38,500 142,800 81,900 7.5 47.0
Total 65+ 25,500 72,200 2,101,800 166,800 1.2 43.3
Total 35+ 28,500 73,300 9,019,200 183,600 0.3 39.9
Notes
1. Estimates marked with ** have an associated relative standard error (RSE) of 50% or more. Estimates marked with * have an associated RSE of between 25% and 50%. These estimates should be interpreted accordingly.
2. Estimates are based on all people reporting dementia as a long-term condition in the Australian Bureau of Statistics Survey of Disability, Ageing and Carers.
3. Age-specific rates relate to population in households and cared accommodation, respectively.
— Nil or rounded to zero.
Source: AIHW analysis of ABS 1998 Survey of Disability, Ageing and Carers confidentialised record file.
Comparison of estimates For all ages the estimates of prevalence rates for dementia derived from the ABS 1998 Disability, Ageing and Carers Survey are lower than those obtained using the meta-analysis by Jorm et al. in 1987 (comparing Table 2.2 with Table 2.3). As a consequence, the survey-based estimates of numbers of people with dementia are considerably lower: the survey-based projection of the number of people with dementia in 2002 is 30% smaller than that derived using the meta-data analysis (118,300 people aged 60 and over with dementia versus 167,200; Table 2.2 and Table 2.6).

11
Table 2.6: Prevalence of dementia estimated using survey-based age–sex specific rates, by age and sex, 30 June 2002
Age Males Females Persons
35–59 900 900 1,800
60–64 2,000 700 2,700
65–69 2,600 1,100 3,800
70–74 6,800 4,200 10,900
75–79 7,400 9,400 16,800
80–84 8,000 15,700 23,700
85+ 14,200 46,300 60,500
Total 41,900 78,300 120,200
Sources: AIHW analysis of ABS 1998 Disability, Ageing and Carers Survey unit record file; ABS 2003.
The main reason for the above difference appears to be methodological. The 1998 ABS survey relied on the self-report of people or their carers to identify the conditions that resulted in their disability where present. Where dementia was reported it was overwhelmingly associated with the experience of severe or profound disability. This suggests that the identification of dementia in population surveys in the absence of clinical assessment or other more rigorous methods of diagnosis results in the under-reporting of dementia and that this under-reporting may be particularly pronounced for mild and moderate cases. Corrada et al. (1995) reviewed the sources of variability in prevalence rates for Alzheimer’s disease and concluded that the exclusion of mild cases significantly reduces the estimates of the prevalence of dementia. Comparison of Australian dementia prevalence rates as measured by the Disability, Ageing and Carers Survey with dementia prevalence in other OECD countries participating in the 2002 OECD Case Study on Dementia revealed that estimated Australian prevalence rates were substantially lower than for most of the other countries. As the only study in the group to have based prevalence on self-report rather than a clinical or other diagnostic tool, the most parsimonious explanation for the low prevalence rates in Australia relative to other OECD countries is the methodological difference. There are several possible explanations for the low rate of self- or carer-identification of mild and moderate dementia cases in the ABS Disability, Ageing and Carers Survey. People with mild or even moderate dementia might have little contact with health or aged care services that would result in a diagnosis. Health professionals could, themselves, be unlikely to consider the diagnosis of dementia as a priority. The diagnosis of other conditions or diseases may be seen as more relevant to treatment than making a clinical assessment of dementia. In addition, it has been proposed that among general practitioners there has previously existed a pessimistic view of dementia detection and intervention based on the belief that little or nothing could be done (Yeoh quoted in DoHA 2003). This issue considered, the ABS 1998 Disability, Ageing and Carers Survey has other strengths which provide support for its results at least in terms of the prevalence rates for those with severe and profound disability. As a population survey, it takes a structured approach to the sampling of population sub-groups. It includes representative samples of groups considered to be important for establishing accurate dementia prevalence estimates (Corrada et al. 1995), in particular rural and urban populations and individuals living both in the community and in cared accommodation settings (with over-sampling among this latter group to ensure reliability of results). The survey does not, however, over-sample for individuals in the very old age groups where the prevalence of dementia is highest. It is

12
necessary therefore to present results with an oldest age category covering all those aged 85 and over. The ABS 1998 Disability, Ageing and Carers Survey does not provide definitive estimates of dementia prevalence. In particular, reliance on self-reporting appears to have resulted in under-reporting of dementia and this is most likely to have occurred in the early stages of the condition. According to the definitions used in the ABS survey, those with mild or moderate core activity restriction do not require assistance. Consequently, the group most likely to be in need of assistance from aged care and health services are those who are more likely to have been identified as having dementia in the survey. On the other hand, the survey has perhaps been less successful in identifying those individuals whose need for assistance will emerge over time.
Estimates of current and future prevalence The focus of this report is on estimating the impact of dementia on health and aged care services. Information about the prevalence of dementia where it is associated with severe or profound disability and leaves the sufferer unable to carry out core activities of daily living without assistance, is preferable for this purpose since it is in this group that demand for services will most likely arise. Estimates of the current and future prevalence of dementia presented in this section are therefore derived using the ABS 1998 Disability, Ageing and Carers Survey age/sex-specific rates for those with dementia experiencing a severe or profound core activity restriction. Using 1998 rates, the number of people with dementia experiencing a severe or profound core activity restriction in 2002 is estimated to have been 112,800, constituting just over 1% of the population aged 35 years and over (Table 2.7). Seventy per cent of older people with dementia and severe or profound core activity restrictions are estimated to have been 80 years and over, with around half aged 85 years and over. It is also estimated for 2002 that many more women than men had dementia and severe or profound core activity restriction (74,900 compared with 37,900). Assuming that, within age and sex groups, both dementia prevalence rates and the associated level of disability remain at 1998 levels for the next 20 years, the prevalence of dementia is expected to continue to increase in line with Australia’s ageing population. Under this assumption, the number of people with a severe or profound core activity restriction with dementia is projected to rise by about almost 60%—or 66,000—by 2020 to reach 179,000 (Table 2.8). The most significant increase will be among those aged 85 and over, mostly due to the ageing of the older population: over half of the increase (39,000) will be in this oldest age group, with the number aged 85 and over estimated to increase from 59,000 in the year 2002 to 98,000 in 2020. However, it should be noted that a recent review of the literature has outlined possibilities, such as pharmaceuticals and changing lifestyle factors, for the prevention or postponement of dementia, suggesting that prevalence may not increase as rapidly as it has previously (Jorm 2002).

13
Table 2.7: People with dementia with a severe or profound core activity restriction (projected), by age and sex, 30 June 2002
Age Males Females Persons Males Females Persons
Number Per cent
35–59 600 600 1,200 1.5 0.8 1.0
60–64 600 200 900 1.7 0.3 0.8
65–69 2,200 900 3,100 5.8 1.2 2.7
70–74 5,500 3,400 9,000 14.6 4.6 8.0
75–79 7,200 9,100 16,300 19.1 12.1 14.5
80–84 7,900 15,400 23,300 20.8 20.6 20.6
85+ 13,900 45,200 59,100 36.5 60.4 52.4
Total 37,900 74,900 112,800 100.0 100.0 100.0
Prevalence rate 65+ (%) 3.3 5.4 4.4 . . . . . .
Prevalence rate 35+ (%) 0.8 1.4 1.1 . . . . . .
Note: Estimates derived assuming 1998 age/sex-specific rates of dementia among the 2002 population, and 1998 age-specific rates of severe or profound core activity restriction among people with dementia.
Sources: AIHW analysis of ABS 1998 Disability, Ageing and Carers Survey unit record file; ABS 2003.
Table 2.8: People with dementia with a severe or profound core activity restriction (projected), by age and sex, 30 June 2020
Age Males Females Persons Males Females Persons
Number Per cent 35–59 700 700 1,300 1.0 0.6 0.7
60–64 1,100 400 1,500 1.6 0.3 0.8
65–69 3,900 1,700 5,600 5.9 1.5 3.1
70–74 9,800 5,800 15,600 14.6 5.2 8.7
75–79 11,100 12,400 23,500 16.6 11.1 13.1
80–84 12,700 20,200 33,000 19.0 18.1 18.4
85+ 27,900 70,500 98,300 41.5 63.1 55.0
Total 67,200 111,600 178,800 100.0 100.0 100.0
Prevalence rate 65+ (%) 3.4 5.1 4.3 . . . . . .
Note: Estimates derived assuming 1998 age/sex-specific rates of dementia among the 2020 population, and 1998 age-specific rates of severe or profound core activity restriction among people with dementia.
Sources: AIHW analysis of ABS 1998 Disability, Ageing and Carers Survey unit record file; ABS 2000.

14
2.2 Incidence The methodological difficulties associated with determining estimates of dementia incidence—that is, the number of new cases in a specified period—limits the data available in this area. As indicated by the discussion of the results of the ABS 1998 Disability, Ageing and Carers Survey, dementia is likely to be under-reported when symptoms are mild. Clinical assessment is also more difficult for mild cases, and this factor has been surmised to be the reason for discrepancies in estimates obtained across studies (Jorm & Jolley 1998). The number of new dementia cases per year is low and the costs associated with undertaking longitudinal studies in susceptible groups is therefore prohibitive. No incidence studies have been undertaken in Australia, but estimates of incidence for Australia have been made using information from overseas epidemiological studies. If we have accurate information on prevalence, duration of illness and mortality over and above background mortality, then the incidence can be calculated. Using these methods, the Australian Institute of Health and Welfare estimated a prevalence of dementia in 1996 of 124,000 (prevalence estimate included mild cases) and an incidence of 24,000 (AIHW: Mathers et al. 1999:208). The incidence in 2002 is estimated to have been 34,000. Not all of these 34,000 people will be initially visible as people with dementia, as onset usually occurs with mild symptoms. However, as dementia is not reversible, they will over time become part of the visible prevalent population or they will die of other causes.

15
3 Service impact This chapter reviews the use of services that are among the key points of contact, care and support for people affected by dementia or their carers. Data that indicate the extent of service use by people with dementia, and characteristics of their treatment and care, are reported over a time series, where available. Health care services examined here include general practitioners and hospitals. Identification of dementia among aged care clients is sometimes problematic in aged care data collections. However, data are presented for the Aged Care Assessment Program, Community Aged Care Packages, the Extended Aged Care at Home program and residential aged care. Data allowing the identification of clients with dementia are not currently available for the Home and Community Care Program. There is a variety of other national and state-specific health and aged care services—both mainstream and targeted at people with dementia and their carers—which it has not been possible to include.
3.1 General practice Consulting a doctor is the second most common health-related action taken by Australians, after the use of medications (ABS 1997). The clinical activities of general practitioners (GPs) are the subject of an ongoing national survey known as BEACH (Bettering the Evaluation and Care of Health), and this survey is used in conjunction with earlier work undertaken in 1990–91 to examine the use of GP services by people with dementia.
The data The BEACH survey is conducted by the AIHW General Practice Statistics and Classification Unit within the Family Medicine Research Centre, University of Sydney. BEACH began in April 1998 and involves a random sample of approximately 1,000 GPs per year. Each participating doctor records details of about 100 doctor–patient encounters of all types. A summary of the data and methods used in the BEACH survey and in the earlier 1990–91 study are contained in the Appendix. In BEACH, the content of a doctor–patient encounter is described in terms of the problems managed and the management techniques applied to each of these problems. Up to three patient reasons for encounter (RFEs) and up to four diagnoses or problems may be recorded for a single encounter. In analysis of the BEACH database, the encounter is the primary unit of analysis. Proportions (%) are only used when describing the distribution of an event that can arise only once at a consultation (e.g. age, sex or item numbers) or to describe the distribution of events within a class of events (e.g. problem A as a per cent of total problems). Rates per 100 encounters are used when an event can occur more than once at the consultation (e.g. patient reasons for encounter, problems managed or medications). Rates per 100 problems are also sometimes used when a management event can occur more than once per problem managed. In general, the following results present the number of observations (n), the rate per 100 encounters and the 95% confidence intervals (CIs).

16
Results
Encounters 1998–2002 Using all of the data collected through the BEACH survey over the first 4 years from 1998, dementia was managed at a rate of 0.43 per 100 encounters (95% CI: 0.3–0.6). The problem labelled Alzheimer’s disease was managed in about one-quarter of these encounters, that is at a rate of 0.1 per 100 encounters (95% CI: 0.0–0.6).
Changes over time Change in the number of encounters in which dementia was managed can be observed by comparing data for 1998–99 with that for 2001–02. In 1998–99, the unweighted number of encounters sampled was 98,400 from 984 GPs. Among these, dementia was managed at a rate of 0.42 per 100 encounters. Within the dementia group, the problem labelled Alzheimer’s disease was managed at a rate of 0.08 per 100 encounters. The 2001–02 data suggest an increase in the rates at which dementia and Alzheimer’s disease were managed. The unweighted number of encounters in the 2001–02 survey was 98,300 from 983 GPs. Among these, dementia was managed at a rate of 0.50 per 100 GP–patient encounters—0.08 more per 100 encounters than in 1998–99, or a 20% increase. Within the dementia group, the problem labelled Alzheimer’s disease was managed at a rate of 0.13 per 100 encounters, 0.05 more per 100 encounters than in 1998–99 (or 60% higher). Restricting rates to include only encounters with adult patients, in 2001–02 the management rate of dementia was 0.58 per 100 encounters for adults aged 18 and over (95% CI: 0.16–1.00). The rate increased with patient age, from 0.02 per 100 encounters for people aged 18–64, to 0.48 per 100 encounters for people aged 65–74 and up to 3.11 per 100 encounters for people aged 75 and over. By applying these age-specific rates to the total annual GP–adult patient encounters across Australia, it is estimated that there were approximately 505,000 adult encounters in 2001–02 which included the management of dementia.3 Of these, about one-quarter involved the management of Alzheimer’s disease. As would be expected from the prevalence of dementia in the population, an overwhelming majority of the encounters involving the management of dementia were for people aged 75 and over (435,000, or 86%), with around 12% (60,000) being for people aged 65 to 74. Just 2% (10,000) were for people aged from 18 to 64.
Patient characteristics Table 3.1 shows the age and sex of patients for whom dementia was managed in each of the 3 years 1990–91, 1998–99, and 2001–02. Patients managed for dementia were more likely to be aged 75 years and over and were more likely to be females than males. The increase in the proportion of patients with dementia who were aged 75 and over was not statistically significant.
3 Derived using age-specific rates of dementia from BEACH, extrapolated to A1 Medicare claims data for each age group, with an additional adjustment for non-Medicare paid encounters by their age distribution.

17
Table 3.1: Characteristics of the patients at dementia encounters, by year of survey
1990–91 1998–99 2001–02
Per cent of patients at
dementia encounters
(n=384) 95% LCL
95%UCL
Per cent of patients at
dementia encounters
(n=412) 95%LCL
95%UCL
Per cent of patients at
dementia encounters
(n=490) 95%LCL
95%UCL
Sex
Males 34.3 28.7 39.9 34.5 27.9 41.1 31.8 25.4 38.2
Females 65.7 60.1 71.3 65.5 60.5 70.6 68.3 63.8 72.6
Missing sex (no.) . . . . . . . . . . . . . . . . . .
Age group
<64 years 4.4 1.8 7.0 3.4 0.0 28.3 2.0 0.0 35.2
65–74 years 15.9 11.5 20.3 15.2 5.0 25.4 12.1 1.6 22.6
75+ years 79.7 74.8 84.5 81.4 77.9 84.8 86.1 82.6 89.5
Missing age (no.) . . . . . . 4 . . . . 10 . . . .
Notes
1. Missing data removed in calculation of rates.
2. LCL = Lower confidence limit, UCL = Upper confidence limit.
Source: AIHW collaborating unit GPSCU analysis of AMTS and BEACH data.
Management Management of a problem during an encounter may involve a number of strategies. In BEACH, management data for each problem include medications prescribed, over-the-counter medications advised and other medications supplied by the GP. Details for each medication comprise brand name, form (where required), strength, regimen, status (if new medication for this problem for this patient) and number of repeats. Non-pharmacological management of each problem includes counselling and procedures, new referrals, and pathology and imaging ordered. Medications were prescribed in the management of dementia at a rate of: • 23.4 per 100 contacts with dementia in 1990–91 • 32.0 per 100 contacts with dementia in 1998–99 • 29.4 per 100 contacts with dementia in 2001–02. In recent years there has been an increase in the prescription of anti-dementia medications in the management of dementia (Table 3.2). Over the same period, there has been a decrease in the prescription of other drugs such as anti-psychotics, anxiolytics and anti-depressants.

18
Table 3.2: Most commonly prescribed medications classified by Anatomical Therapeutic Chemical (ATC) group, in order of prescription rate, 2001–02
1998–99 2001–02
Medication
Per 100 contacts with
dementia(n=412)
Per cent of medications for
dementia(n=132)
Per 100 contacts with
dementia (n=490)
Per cent of medications
for dementia(n=144)
Anti-dementia drugs — — 10.8 36.8
Anti-psychotics 13.1 40.9 9.0 30.6
Anxiolytics 4.4 13.6 2.9 9.7
Anti-depressants 2.4 7.6 1.4 4.9
Sedatives and hypnotics 3.4 10.6 1.2 4.2
Other analgesics and antipyretics 1.7 5.3 1.0 3.5
Other medications 7.0 22.0 3.1 10.4
— Nil or rounded to zero.
Sources: AIHW collaborating unit GPSCU analysis of BEACH data; WHO 1997.
Dementia prevalence among general practice patients Even if a patient has dementia, the condition may not be managed in every (or any) of their GP–patient encounters. Estimates of the prevalence of dementia among GP patients are drawn from a single sub-study in BEACH, conducted as one part of the Supplementary Analysis of Nominated Data (SAND) program. In SAND, a section on the bottom of each recording form investigates aspects of patient health or health-care delivery in general practice not covered by the consultation-based information. Different questions are asked of the patient in each sample period. Specific investigations have been conducted under this program to investigate the prevalence of Alzheimer’s disease and other dementia in adult general practice patients—that is, among people aged 18 and over—and to measure the proportion of general practice patients not diagnosed with Alzheimer’s or other dementia who (in the GP’s opinion) were likely to have dementia or the early signs of Alzheimer’s. The proportion of the undiagnosed patients who had taken a Mini Mental Health Assessment (MMHA) was also explored (AIHW: GPSCU 2002). This study used a sample of 2,194 encounters with adults from 88 GPs collected in August 2001. The prevalence of diagnosed Alzheimer’s disease in this adult general practice patient population was 1.6% (95% CI: 0.0–4.4), and the prevalence of diagnosed dementia was 2.4% (95% CI: 0.0–5.4). Of adult patients not diagnosed with dementia, 4.2% displayed cognitive impairment, 4.9% encountered difficulties with daily living and 5.6% experienced behavioural changes. All three of the above symptoms were displayed by 1.4% of patients, 2.7% had two of the three symptoms, and 5.0% displayed one symptom. A MMHA had been used for 2.4% of the 2,046 adult patients without dementia, including Alzheimer’s, for whom a response to this question was provided. Use of a MMHA was rare (0.9% assessed) for patients with no symptoms of dementia, but more common (51.7% assessed) with patients who had all three dementia symptoms. GPs were asked whether it was likely that patients without diagnosed dementia actually had signs of dementia or early Alzheimer’s. GPs indicated that 59 patients (2.9%) were likely to have dementia not yet diagnosed, and 20 patients (1.0%) were likely to have early

19
Alzheimer’s not yet diagnosed. Combined, GPs indicated that 63 patients (3.1%) were likely to have undiagnosed dementia or early Alzheimer’s. Overall, of the 2,098 adult patients with data available, 52 (2.5%) had diagnosed dementia, and a further 59 (2.8%, 95% CI: 0.0–6.5) were thought likely to have undiagnosed dementia. More than half of these patients were aged 75 years or more. By far the majority of these expressed opinions were based on clinical opinion rather than on results of a MMHA. These results appear consistent with those derived using meta-analysis (Table 2.2).
3.2 Hospitals
Hospital separations Data relating to hospital use in Australia are available from the National Hospital Morbidity Database. The database provides information on the characteristics of patients, including diagnosis and procedures, for each separation from hospital by financial year of separation. A record is included for each separation, not for each patient, thus patients who separated more than once in the year have more than one record in the database.
Dementia—principal diagnosis The definition of the principal diagnosis is that diagnosis established, after study, to be chiefly responsible for bringing about the patient’s episode of care in hospital. In 2001–02, dementia was reported as the principal diagnosis for 10,060 hospital separations, or 0.16% of total hospital separations (Table 3.3a). This represents an increase of 606 hospital separations (or 6%) over the 9,454 separations recorded for 1998–99. However, the number of separations with a principal diagnosis of dementia in 2001–02 was down on the number in 2000–01 (10,583). This drop could reflect the increasing availability of community-based sub-acute services in the states and territories for people with dementia. For all years examined, the number of separations for patients with a principal diagnosis of dementia peak in the 80–84 and 85–89 age groups. There were approximately 10 times as many dementia patient separations for patients aged 85 and over as there were for those under 60 years of age. Overall, there were more separations for women with a principal diagnosis of dementia than men (55% of separations for patients with a principal diagnosis of dementia were for women in 2001–02). There were almost twice as many separations for female patients with a principal diagnosis of dementia aged 85 and over as there were for males. The greater number of separations for female than male patients with a principal diagnosis of dementia is due to the higher number of females among older patients (75 years and over)—at all ages men have higher age-specific rates of hospital separation with a principal diagnosis of dementia than women (Table 3.3b). Age-specific rates of hospital separation with a principal diagnosis of dementia were highest at ages 85–89 and 90–94 for both men and women in 2001–02. Age-standardised rates adjust crude rates of hospital separations to take account of different age structures, both between the sexes and over time. Crude separation rates are similar for men and women; however, the age-standardised rate for women (2.7 separations per 1,000 women aged 60 years or over in 2001–02) is lower than that for men (3.4 separations per 1,000 men aged 60 years or over). The age-standardised rate of hospital separation with a

20
principal diagnosis of dementia has remained stable at around 3 separations per 1,000 persons aged 60 years and over for the last 4 years.
Table 3.3a: Separations with principal diagnosis of dementia (F00, F01, F02, F03, F051 and G30), by age group and sex, 1998–99 to 2001–02
Sex/age 1998–99(a) 1999–00 2000–01 2001–02
Males
0–59 118 124 126 102
60–64 132 128 107 113
65–69 309 262 265 261
70–74 573 577 595 561
75–79 1,040 1,034 1,063 927
80–84 1,034 1,155 1,257 1,237
85–89 799 955 968 871
90–94 231 244 312 364
95+ 43 42 54 66
Total 4,279 4,521 4,747 4,502
Females
0–59 80 93 96 94
60–64 92 108 101 66
65–69 185 192 200 163
70–74 546 472 499 515
75–79 1,014 1,044 1,106 1,051
80–84 1,312 1,448 1,519 1,429
85–89 1,358 1,545 1,468 1,398
90–94 480 511 699 677
95+ 108 102 148 165
Total 5,175 5,515 5,836 5,558
Persons
0–59 198 217 222 196
60–64 224 236 208 179
65–69 494 454 465 424
70–74 1,119 1,049 1,094 1,076
75–79 2,054 2,078 2,169 1,978
80–84 2,346 2,603 2,776 2,666
85–89 2,157 2,500 2,436 2,269
90–94 711 755 1,011 1,041
95+ 151 144 202 231
Total 9,454 10,036 10,583 10,060
(a) ICD–9–CM data reported by Queensland, Western Australia, South Australia and Tasmania have been mapped to ICD–10–AM.
Note: Separations with missing data on patient age and/or sex are included in the relevant totals.
Source: AIHW analysis of National Hospital Morbidity Database.

21
Table 3.3b: Age-specific rates of hospital separation with a principal diagnosis of dementia (F00, F01, F02, F03, F051 and G30) per 1,000 persons, by sex, 1998–99 to 2001–02
Sex/age 1998–99(a) 1999–2000 2000–01 2001–02
Males
60–64 0.3 0.3 0.3 0.3
65–69 0.9 0.8 0.8 0.8
70–74 2.0 1.9 2.0 1.9
75–79 5.0 4.8 4.8 4.0
80–84 9.3 10.0 10.2 9.3
85–89 15.4 17.3 16.7 14.3
90–94 15.5 15.1 18.0 19.3
95+ 12.5 11.0 12.7 13.5
Crude rate 60+ 3.0 3.1 3.1 2.9
Age-standardised rate 60+(b) 3.6 3.7 3.8 3.4
Females
60–64 0.2 0.3 0.3 0.2
65–69 0.5 0.6 0.6 0.5
70–74 1.6 1.4 1.5 1.5
75–79 3.7 3.7 3.8 3.6
80–84 7.2 7.8 7.8 6.9
85–89 12.5 13.6 12.4 11.4
90–94 11.8 11.7 14.9 13.4
95+ 9.2 8.2 11.1 11.2
Crude rate 60+ 3.0 3.2 3.3 3.1
Age-standardised rate 60+(b) 2.8 2.9 2.9 2.7
Persons
60–64 0.3 0.3 0.3 0.2
65–69 0.7 0.7 0.7 0.6
70–74 1.8 1.7 1.7 1.7
75–79 4.3 4.2 4.2 3.8
80–84 8.0 8.6 8.7 7.9
85–89 13.4 14.8 13.8 12.4
90–94 12.8 12.6 15.8 15.0
95+ 10.0 8.8 11.5 11.8
Crude rate 60+ 3.0 3.1 3.2 3.0
Age-standardised rate 60+(b) 3.1 3.2 3.3 3.0
(a) ICD–9–CM data reported by Queensland, Western Australia, South Australia and Tasmania have been mapped to ICD–10–AM.
(b) Direct standardisation using a standard population of the Australian population at 30 June 2001.
Note: Age–sex specific rates are based on ABS population estimates for 31 December of each year.
Sources: Table 3.3a; ABS 2003.

22
Dementia—any diagnosis Patients admitted to hospital are assigned a principal diagnosis and can also be assigned additional diagnoses. Additional diagnoses are conditions or complaints either coexisting with the principal diagnosis or arising during the episode of care. Usual practice is to assign additional diagnoses for conditions that are found to contribute to the resource consumption of the hospital episode of care. Therefore, counts of separations with any given additional diagnosis do not necessarily measure the number of separations for hospital patients who have that condition. Particularly in the case of separations with admission on the same day, hospital separations with an additional diagnosis of dementia might not accurately reflect the number of separations for patients where dementia was present. They do, however, provide a measure of the number of separations for which dementia was thought to contribute significantly to the cost of care. In 2001–02, dementia was reported either as a principal or additional diagnosis for 79,405 hospital separations, or 1.2% of total hospital separations (Table 3.4a). This represents a rise of 17,857 hospital separations over the 4 year period from 1998–99. Most of the increase occurred between 1998–99 and 1999–00. This one-off increase could be the result of changing practice in clinical coding brought about by several jurisdictions having migrated to a new diagnosis related groups system in 1999–00 (others had changed over in 1998–99). The new system incorporated a more sophisticated algorithm for measuring severity of illness using additional diagnosis codes and provided greater incentive for accurate coding of all serious co-morbid conditions. In all 4 years, the number of separations for patients with dementia either as a principal or additional diagnosis increased with age and peaked in the 80–84 and 85–89 age groups. Overall, there were more separations for women with dementia either as a principal or additional diagnosis (61% of all separations for patients with dementia in the year 2001–02) than men. Below the age of 75 there were more hospital separations reported for men with dementia than women. For patients 75 years and over, however, women reported with this condition outnumbered men and this difference was more pronounced with increasing age. Crude rates of hospital separation with a diagnosis of dementia for the population aged 60 years and over suggest that the separation rate is higher for women (26.8 per 1,000 women aged 60 and over in 2001–02) than men (20.3 per 1,000 men in 2001–02) (Table 3.4b). To a large extent this is because the female population is considerably older than the male population. To take account of different age structures in the male and female populations, the crude rate of hospital separations with a dementia diagnosis—principal or additional—were age-standardised to the national population as at 30 June 2001. The results show that rates of hospital separation with a diagnosis of dementia are similar for men and women, with men having slightly higher rates than women at all ages (age-standardised rates of 24.4 and 22.9 per 1,000 men and women aged 60 or over, respectively, in 2001–02). The overall age-standardised rate of hospital separation recorded with a dementia diagnosis decreased slightly between 1999–00 and 2000–01 and then remained steady to 2001–02 (23.6 per 1,000 persons aged 60 or over in 2001–02).

23
Table 3.4a: Separations with principal or additional diagnosis of dementia(a) (F00, F01, F02, F03, F051, G30), by age group and sex, 1998–99 to 2001–02
Sex/age 1998–99(b) 1999–00 2000–01 2001–02Males
0–59 681 700 657 602
60–64 592 651 643 567
65–69 1,413 1,506 1,240 1,328
70–74 3,130 3,799 3,492 3,451
75–79 5,319 6,778 6,672 6,370
80–84 6,135 7,814 7,972 8,451
85–89 5,230 7,349 6,741 6,969
90–94 1,640 2,209 2,620 2,918
95+ 246 418 480 564
Total 24,386 31,224 30,517 31,221
Females
0–59 386 524 415 444
60–64 378 529 450 422
65–69 951 1,095 1,002 1,009
70–74 2,959 3,333 3,110 3,006
75–79 6,545 8,054 7,415 7,672
80–84 9,585 12,321 11,700 12,457
85–89 10,821 15,200 13,183 13,801
90–94 4,383 5,851 6,902 7,379
95+ 1,154 1,416 1,802 1,994
Total 37,162 48,323 45,979 48,184
Persons
0–59 1,067 1,224 1,072 1,046
60–64 970 1,180 1,093 989
65–69 2,364 2,601 2,242 2,337
70–74 6,089 7,132 6,602 6,457
75–79 11,864 14,832 14,087 14,042
80–84 15,720 20,135 19,672 20,908
85–89 16,051 22,549 19,924 20,770
90–94 6,023 8,060 9,522 10,297
95+ 1,400 1,834 2,282 2,558
Total 61,548 79,547 76,496 79,405(a) In the rare case of a separation having both a principal and an additional diagnosis of dementia, it is counted twice.
(b) ICD–9–CM data reported by Queensland, Western Australia, South Australia and Tasmania have been mapped to ICD–10–AM.
Note: Separations with missing data on patient age and/or sex are included in the relevant totals.
Source: AIHW analysis of National Hospital Morbidity Database.

24
Table 3.4b: Age-specific rates of hospital separation with a principal or additional diagnosis of dementia(a) (F00, F01, F02, F03, F051 and G30) per 1,000 persons, by sex, 1998–99 to 2001–02
Sex/age 1998–99(b) 1999–00 2000–01 2001–02
Males
60–64 1.6 1.7 1.6 1.3
65–69 4.2 4.5 3.7 3.9
70–74 10.7 12.8 11.6 11.4
75–79 25.8 31.4 29.9 27.7
80–84 55.1 67.6 64.6 63.7
85–89 100.5 133.4 116.2 114.2
90–94 110.3 137.1 151.6 154.9
95+ 71.2 109.6 112.7 115.2
Crude rate 60+ 17.0 21.4 20.3 20.3
Age-standardised rate 60+(c) 21.3 26.5 24.9 24.4
Females
60–64 1.0 1.4 1.1 1.0
65–69 2.7 3.2 2.9 2.9
70–74 8.9 10.0 9.3 9.0
75–79 23.8 28.4 25.6 26.2
80–84 52.7 66.2 59.8 60.4
85–89 99.6 133.4 111.4 112.7
90–94 107.4 133.7 147.4 146.6
95+ 98.8 113.2 135.0 135.6
Crude rate 60+ 21.9 28.0 26.1 26.8
Age-standardised rate 60+(c) 20.0 24.9 22.8 22.9
Persons
60–64 1.3 1.5 1.3 1.2
65–69 3.5 3.8 3.3 3.4
70–74 9.8 11.3 10.4 10.1
75–79 24.7 29.7 27.5 26.9
80–84 53.6 66.7 61.7 61.7
85–89 99.9 133.4 112.9 113.2
90–94 108.2 134.6 148.5 148.9
95+ 92.5 112.3 129.6 130.5
Crude rate 60+ 19.7 25.0 23.5 23.8 Age-standardised rate 60+(c) 20.6 25.7 23.7 23.6 (a) In the rare case of a separation having both a principal and an additional diagnosis of dementia, it is counted twice.
(b) ICD–9–CM data reported by Queensland, Western Australia, South Australia and Tasmania have been mapped to ICD–10–AM.
(c) Direct standardisation using a standard population of the Australian population at 30 June 2001.
Note: Age–sex specific rates are based on ABS population estimates for 31 December of each year.
Source: Table 3.4a; ABS 2003.

25
Length of stay In the hospital morbidity data set, patient days provide information on the length of stay of patients and are calculated as the difference between the separation date and admission date, less any leave days. Same-day patients are allocated a length of stay of one day. As the database contains records for patients separating from hospital during the year, this definition means that not all patient days reported will have occurred in the reporting period (1 July to 30 June) and, therefore, cannot be used to calculate accurate financial year-based activity estimates based on patient days. It is expected, however, that for relatively short stay conditions, patient days for patients who separated during the financial year, but who were admitted in the previous financial year, would be counterbalanced by the patient days for patients in hospital at the end of the financial year who will separate in the following reporting period, and for whom data will be reported in the data collection for the next financial year.
Dementia—principal diagnosis The 10,060 separations with a principal diagnosis of dementia in 2001–02 accounted for 309,789 patient days (1.3% of all patient days). Just 564 patients with a principal diagnosis of dementia were admitted and separated from hospital on the same day. When patients with same-day separations are excluded, patients admitted to hospital with a principal diagnosis of dementia stayed in hospital for an average of just over a month (32.6 days) (Table 3.5). This is considerably higher than the average length of stay for all patients: excluding same-day separations, the average length of stay for all patients in all Australian hospitals in 2001–02 was 6.5 days. The median length of stay for patients admitted for at least an overnight hospital stay with a principal diagnosis of dementia was 14 days (50th percentile). The discrepancy between the mean and median can be explained by a small group of patients with dementia who remained in hospital for extended periods, in some cases, in excess of 3 months. Again excluding same-day separations, 75% of separations for patients with a principal diagnosis of dementia involved stays in hospital for a period of 30 days or less. For 5% of separations, patients with a principal diagnosis of dementia stayed 3 months or longer (91 days or more). Taking into account all separations, including same-day separations, there were 0.5 hospital separations per 1,000 persons in 2001–02 for patients whose admission was chiefly attributed to dementia (principal diagnosis), with an average of 31.0 patient days per episode.
Table 3.5: Length of hospital stay by dementia diagnosis (excluding same-day separations), 2001–02
Percentile
Separations
Total patient
days
Mean length of
stay 5th 25th 50th 75th 95th
Number Days Days Days
Principal diagnosis of dementia 9,496 309,225 32.6 1 7 14 30 91
Any diagnosis of dementia, including principal diagnosis 70,706 1,328,302 18.8 1 4 9 19 54
All separations (excluding same-day) 3,053,160 19,882,424 6.5 1 1 3 6 21
Source: AIHW analysis of National Hospital Morbidity Database.

26
Dementia–any diagnosis There were many more separations for patients with an additional diagnosis of dementia than there were for patients with a principal diagnosis of dementia (Tables 3.3a and 3.4a). Overall, patients with either a principal or additional diagnosis of dementia accounted for a total of 1,334,296 patient days—or 5.7% of all patient days—in 2001–02. There were 5,994 separations for patients with dementia as either the principal or additional diagnosis who were admitted and separated from hospital on the same day in 2001–02. When same-day separations are excluded, patients admitted to hospital with any diagnosis of dementia stayed in hospital for an average of 18.8 days per separation, approximately 14 days less than the average for patients with a principal diagnosis of dementia (Table 3.5). For patients admitted to hospital with any diagnosis of dementia the median length of stay was 9 days, with 75% of separations for patients with a diagnosis of dementia (either principal or additional) being for a period of 19 days or less. Patient stays were 54 days or more for 5% of separations patients with a diagnosis of dementia. Taking into account all separations, including same-day separations, there were 4.1 hospital separations per 1,000 persons in the Australian population in 2001–02 for patients where dementia occasioned admission to hospital or contributed to the cost of treatment (any diagnosis), with an average of 16.8 patient days per episode.
3.3 Aged Care Assessment Teams Aged Care Assessment Teams (ACATs) are multi-disciplinary teams responsible for determining eligibility for admission into residential aged care and for Community Aged Care Packages (CACPs) and Extended Aged Care at Home (EACH) places. They may also recommend a range of Home and Community Care services, although they do not determine eligibility for these services. The clients seen by these teams thus include people requiring general advice, referral or some form of assistance in managing their ongoing care in the community. In 2000–01, 34,700 ACAT clients across Australia (excluding Western Australia where a different method for recording diagnoses is used) had a primary diagnosis of dementia, representing 20% of all ACAT clients, or 21% of all clients with a primary diagnosis recorded at the time of assessment (a primary diagnosis was not recorded for 3.5% of assessments performed in 2000–01). This proportion has increased gradually from 18% in 1994–95 to around 20% between 1997–98 and 2000–01. Dementia was the most common primary diagnosis among all ACAT clients in 2000–01, followed by arthritis and cardiovascular diseases (LGC 2002).
3.4 Community care There are three national programs providing community-based care to older people: Home and Community Care, Community Aged Care Packages and the Extended Aged Care at Home program. Where data are available, the use of these by people with dementia is discussed below.

27
Home and Community Care The Home and Community Care (HACC) program provides a range of community-based care services to people in their homes, and remains the main provider of home-based care services in Australia. Some examples of types of assistance provided through the HACC program include assessment, management and planning of requirements, transport, nursing, home maintenance, counselling and personal care. There is no indicator for dementia in the HACC Minimum Data Set.
Community care census data In 2002, the Department of Health and Ageing, in conjunction with the Australian Institute of Health and Welfare, conducted census collections of the Community Aged Care Packages program and Extended Aged Care at Home program. Each of the surveys for these programs contained a question on whether the care recipient had been formally diagnosed with dementia.
Collection methodology
Community Aged Care Packages census collection Community Aged Care Packages provide an alternative to low-level residential aged care, and deliver home-based care to frail or disabled older people living in the community. A wide range of assistance types is provided, from personal care and domestic assistance to delivered meals and transport. At the time of the census, conducted over 1 week between mid-September and mid-October 2002, there were 904 service outlets on the administrative database with approximately 26,500 CACP recipients (see Section 2 of the publication Community Aged Care Packages Census 2002 (AIHW 2004a) for a discussion of service outlets). Approximately 94%of these service outlets responded, with services being delivered from 759 locations, and data was obtained for 25,439 care recipients (approximately 96% of estimated recipients) (AIHW 2004a). Providers completed two types of forms—one collecting information about the provider’s characteristics and the other collecting data about individual care recipients and the services delivered to them.
Extended Aged Care at Home census collection The Extended Aged Care at Home program is designed to deliver nursing and personal care to home-based care recipients that is equivalent to high-level residential care. At the time of the census (1 week in May 2002) there were 10 providers, located in five jurisdictions, with 288 EACH recipients. As for the CACP providers, EACH providers completed two types of forms—one collecting information about the provider’s characteristics and the other collecting data about individual care recipients and the services delivered to them. The response rate by providers was 100% (AIHW 2004b).
Census results Almost one in five Community Aged Care Package recipients were reported as diagnosed with dementia. Also, one-third of all EACH care recipients had been diagnosed with dementia (Table 3.6). Details on the characteristics and care needs of recipients of the CACP and EACH programs, with and without dementia, are provided in the following sections.

28
Table 3.6: CACP and EACH recipients with and without dementia, census periods, 2002
With dementia Without dementia Total
Program Number Per cent Number Per cent Number Per cent
EACH 90 32.1 190 67.9 280 100.0
CACP 4,646 18.4 20,597 81.6 25,243 100.0
Note: Dementia status was not stated for eight (3%) of EACH care recipients and 196 (1%) of CACP care recipients.
Source: AIHW analysis of CACP and EACH 2002 census.
Community Aged Care Packages
Age and sex of recipients Among all CACP recipients, 93% were aged 65 and over and 36% were aged 85 and over (Table 3.8). Just over 18% of CACP recipients reported having a diagnosis of dementia (4,646 recipients). The prevalence of dementia among CACP recipients increased with age, rising from 8% in the under 65 age group to 20% in the 75–84 and 85–94 age groups. The proportion with dementia declined to 16% in the 95 and over age group (Table 3.7). CACP recipients with dementia showed an older age profile compared with those without dementia (Table 3.8). Less than 15% of care recipients with dementia were aged under 75 years compared with 24% in this age group for those without dementia. Equivalent proportions of CACP recipients with and without dementia (2%) were in the 95 years and over age group. For all CACP recipients, women outnumbered men by a factor of more than two to one (70% were women). There was little difference between men and women for dementia status, with 18% of men and 19% of women diagnosed with dementia (Table 3.7).
Presence of a carer Of all CACP care recipients, 57% reported having a carer (Table 3.9). However, CACP care recipients diagnosed with dementia were more likely to have a carer than those without dementia (74% reported having a carer, compared with 53% of care recipients without a dementia diagnosis having a carer). There were no substantial differences between male and female CACP recipients for carer availability by dementia status (Table 3.9). For both men and women, approximately three-quarters of those with dementia had a carer and approximately one half of those without dementia had a carer. For all age categories, CACP recipients with dementia were more likely to have a carer than those without dementia (Table 3.10). For all recipients, carer availability was lowest for those under 65 years (64% of those with dementia in this age group had a carer and 46% of those without dementia had a carer) and highest for those aged 95 years and over (76% of those with dementia in this age group had a carer and 56% of those without dementia had a carer).
Dependency of recipients For CACP recipients without dementia the proportion requiring self-care assistance was 59%; this is lower than the proportion of recipients with dementia requiring such assistance (79%) (Table 3.11). The proportions of recipients with and without dementia requiring assistance with mobility were similar—66% and 69%, respectively. Relatively few CACP care recipients required assistance with communication; however, more care recipients with dementia required this type of assistance compared with care recipients without dementia (36% versus 10%).

29
Assistance provided CACP recipients may receive a range of different services appropriate to their low care needs. In general, there are only small differences between those with dementia and those without dementia when the median hours or number of deliveries or trips are compared (Table 3.12). However, the mean and median number of hours of respite in the census week was higher for recipients with dementia than those without dementia. Median hours of respite care for those with dementia was 3.0, compared with 2.0 hours for those without dementia (means of 4.0 and 3.0 hours, respectively). Recipients with dementia received somewhat more hours of social support (a median of 2 hours compared with 1.5 hours for those without dementia) and other food services (a median of 1.5 hours compared with 1.3 hours). Recipients with dementia received slightly fewer hours of home maintenance (a median of 0.8 hour in the census week compared with 1 hour for those without dementia) but more linen deliveries (a median of two deliveries compared with one delivery for those without dementia), although this last comparison was based on only 43 recipients with dementia and 193 without. When the number of hours of service provided is added over all applicable service types, CACP recipients with dementia received a median of 6.0 hours in the week (mean of 6.9 hours). This was just half an hour more than the median number of hours in the week for recipients without dementia (median of 5.5 and mean of 5.9). CACP recipients with dementia and with a carer were more likely than others to receive respite (12% of recipients with dementia and a carer received this service compared with 6% of those without dementia with a carer; Table 3.13). Whether or not carers were available, for the majority services—but not all—there were proportionally more care recipients with dementia than without dementia receiving a particular service. The availability of a carer did not greatly affect the total number of hours of service received (Table 3.14). Recipients with dementia who had a carer received slightly fewer hours of assistance than those without a carer (median of 6.0 hours compared a median of 6.3 hours). For recipients without dementia the reverse was true, with recipients with a carer getting slightly more hours of assistance than those without (median hours of assistance 5.5 hours and 5.3 hours, respectively). For recipients both with and without dementia, those with a carer received fewer delivered meals on average than those without a carer.

30
Table 3.7: CACP care recipients with and without dementia, by age and sex, census week 2002
With dementia Without dementia Total Not stated
Sex/age Number Per cent Number Per cent Number Per cent Number
Males
Under 65 73 9.4 701 90.6 774 100.0 5
65–74 190 14.0 1,167 86.0 1,357 100.0 6
75–84 573 20.3 2,252 79.7 2,825 100.0 17
85–94 425 19.5 1,750 80.5 2,175 100.0 28
95+ 23 14.5 136 85.5 159 100.0 1
Total 1,284 17.6 6,006 82.4 7,290 100.0 57
Females
Under 65 71 7.5 882 92.5 953 100.0 6
65–74 350 14.0 2,146 86.0 2,496 100.0 13
75–84 1,534 20.3 6,006 79.7 7,540 100.0 62
85–94 1,280 20.5 4,957 79.5 6,237 100.0 42
95+ 65 16.0 340 84.0 405 100.0 10
Total 3,300 18.7 14,331 81.3 17,631 100.0 133
Persons
Under 65 145 8.4 1,587 91.6 1,732 100.0 11
65–74 544 14.0 3,332 86.0 3,876 100.0 20
75–84 2,118 20.3 8,294 79.7 10,412 100.0 81
85–94 1,715 20.3 6,754 79.7 8,469 100.0 70
95+ 90 15.9 477 84.1 567 100.0 11
Total 4,612 18.4 20,444 81.6 25,056 100.0 193
Note: The table excludes 190 cases with missing age. Cases with known age but missing sex are included in the persons data.
Source: AIHW analysis of CACP 2002 census.
Table 3.8: CACP care recipients with and without dementia, by age, census week 2002
With dementia Without dementia Total
Age Number Per cent Number Per cent Number Per cent
Under 65 145 3.1 1,587 7.8 1,732 6.9
65–74 544 11.8 3,332 16.3 3,876 15.5
75–84 2,118 45.9 8,294 40.6 10,412 41.6
85–94 1,715 37.2 6,754 33.0 8,469 33.8
95+ 90 2.0 477 2.3 567 2.3
Total 4,612 100.0 20,444 100.0 25,056 100.0
Note: The table excludes 383 cases with missing age or dementia status.
Source: AIHW analysis of CACP 2002 census.

31
Table 3.9: CACP care recipients, by dementia status, carer availability and sex, census week 2002
With dementia Without dementia Total Sex/carer availability Number Per cent Number Per cent Number Per cent
Males
Has a carer 935 72.6 3,213 53.5 4,148 56.9
No carer 353 27.4 2,789 46.5 3,142 43.1
Total males 1,288 100.0 6,002 100.0 7,290 100.0
Females
Has a carer 2,449 74.4 7,457 52.2 9,906 56.4
No carer 844 25.6 6,828 47.8 7,672 43.6
Total females 3,293 100.0 14,285 100.0 17,578 100.0
Persons
Has a carer 3,404 73.8 10,727 52.6 14,131 56.5
No carer 1,207 26.2 9,673 47.4 10,880 43.5
Total persons 4,611 100.0 20,400 100.0 25,011 100.0
Note: The table excludes 428 cases with either carer availability or dementia status missing. Cases with missing sex are included in the persons data.
Source: AIHW analysis of CACP 2002 census.
Table 3.10: CACP care recipients with and without dementia, by carer availability and age, census week 2002
With a carer Without a carer Total Dementia status/age Number Per cent Number Per cent Number Per cent
With dementia
Under 65 92 64.3 51 35.7 143 100.0
65–74 395 73.0 146 27.0 541 100.0
75–84 1,552 73.8 550 26.2 2,102 100.0
85–94 1,270 74.7 431 25.3 1,701 100.0
95+ 68 75.6 22 24.4 90 100.0
Total with dementia 3,377 73.8 1,200 26.2 4,577 100.0
Without dementia
Under 65 721 46.1 844 53.9 1,565 100.0
65–74 1,618 49.0 1,681 51.0 3,299 100.0
75–84 4,338 52.8 3,884 47.2 8,222 100.0
85–94 3,702 55.3 2,989 44.7 6,691 100.0
95+ 263 55.5 211 44.5 474 100.0
Total without dementia 10,642 52.6 9,609 47.4 20,251 100.0
Total persons 14,019 56.5 10,809 43.5 24,828 100.0
Note: The table excludes 611 cases with either age, carer availability or dementia status missing.
Source: AIHW analysis of CACP 2002 census.

32
Table 3.11: CACP care recipients with and without dementia, core activity in which assistance was needed, census week 2002
With dementia Without dementia Total
Core activity No. % No. % No. %
Self-care 3,665 78.9 12,161 59.0 15,826 62.7
Mobility 3,057 65.8 14,156 68.7 17,213 68.2
Communication 1,689 36.4 2,102 10.2 3,791 15.0
None 386 8.3 3,448 16.7 3,834 15.2
Total persons 4,646 . . 20,597 . . 25,243 . .
Notes
1. The table excludes 196 care recipients where dementia status was not reported.
2. Recipients may need more than one type of assistance, and so percentages do not sum to 100.
3. Self-care, mobility and communication are considered to be the three core activities of daily living. Where it is reported that someone sometimes or always needs assistance with these activities they are considered to have a severe or profound core activity limitation.
Source: AIHW analysis of CACP 2002 census.
Table 3.12: Hours or number of each assistance type provided to CACP care recipients with and without dementia, census week 2002
With dementia Without dementia
Mean Median Mean Median
Type of assistance Hours
Personal care 2.4 2.0 2.3 2.0
Domestic assistance 2.0 2.0 2.3 2.0
Social support 2.6 2.0 2.1 1.5
Other food services 1.8 1.5 1.7 1.3
Respite care 4.0 3.0 3.0 2.0
Rehabilitation 1.4 1.0 1.4 1.0
Home maintenance 0.9 0.8 1.1 1.0
Case management 1.0 0.8 0.9 0.8
Total hours 6.9 6.0 5.9 5.5
Ancillary services Number
Delivered meals 5.7 5.0 6.2 5.0
Linen deliveries 2.1 2.0 1.9 1.0
Transport one-way trips 3.0 2.0 2.9 2.0
Notes
1. The table excludes 196 care recipients where dementia status was not reported.
2. Amounts of type of assistance relate only to those receiving that assistance. Consequently, the sum of the mean number of hours of assistance received across types does not equal the total number of hours of assistance received.
Source: AIHW analysis of CACP 2002 census.

33
Table 3.13: CACP care recipients with and without dementia, types of assistance, by carer status, census week 2002
With dementia Without dementia With a carer Without a carer With a carer Without a carer Type of assistance No. % No. % No. % No. %
Personal care 2,192 66.7 795 67.4 5,983 57.4 4,396 46.6
Domestic assistance 2,489 75.8 1,019 86.4 8,669 83.1 8,482 89.9
Social support 1,985 60.4 846 71.8 5,853 56.1 6,225 66.0
Other food services 1,112 33.9 505 42.8 2,912 27.9 2,679 28.4
Respite care 393 12.0 11 0.9 623 6.0 100 1.1
Rehabilitation 70 2.1 19 1.6 312 3.0 182 1.9
Home maintenance 339 10.3 179 15.2 1,606 15.4 1,857 19.7
Case management 2,609 79.4 959 81.3 7,892 75.7 6,812 72.2
Ancillary services
Delivered meals 673 20.5 361 30.6 1,921 18.4 2,296 24.3
Linen deliveries 30 0.9 13 1.1 80 0.8 112 1.2
Transport one-way trips 1,058 32.2 530 45.0 3,288 31.5 4,067 43.1
Total CACP recipients 3,284 . . 1,179 . . 10,429 . . 9,437 . .
Note: The table excludes 1,110 cases. These include both recipients with either carer availability or dementia status missing, as well as those who received no services during census week.
Source: AIHW analysis of CACP 2002 census.
Table 3.14: Amount of assistance for CACP recipients with and without dementia, types of assistance, by carer status, census week 2002
With dementia Without dementia With carer Without carer With carer Without carer Type of assistance Mean Median Mean Median Mean Median Mean Median Hours
Personal care 2.5 2.0 2.3 1.8 2.4 2.0 2.1 1.8
Domestic assistance 2.0 2.0 2.1 2.0 2.3 2.0 2.3 2.0
Social support 2.7 2.0 2.4 2.0 2.0 1.5 2.1 1.8
Other food services 1.8 1.5 1.8 1.5 1.7 1.3 1.6 1.0
Respite care 3.9 3.0 5.2 2.5 3.1 2.0 2.3 2.0
Rehabilitation 1.5 1.0 1.0 0.8 1.4 1.0 1.3 1.0
Home maintenance 0.9 0.8 0.9 0.5 1.1 1.0 1.1 1.0
Case management 1.0 0.8 1.1 0.8 0.9 0.5 1.0 0.8
Total hours 6.8 6.0 7.0 6.3 6.0 5.5 5.9 5.3
Ancillary services Number
Delivered meals 5.4 5.0 6.2 6.0 5.8 5.0 6.5 6.0
Linen deliveries 2.0 2.0 2.2 2.0 2.1 1.0 1.8 1.0
Transport trips 2.9 2.0 3.3 2.0 2.8 2.0 3.0 2.0
Note: The table excludes 1,110 cases. These include both recipients with either carer availability or dementia status missing, as well as those who received no services during census week.
Source: AIHW analysis of CACP 2002 census.

34
Extended Aged Care at Home EACH was only established as a program in 2001, and the numbers of people receiving services through this program were still very small (288) at the time of the 2002 EACH census. Consequently the recipient profile may change as the program matures.
Age and sex of recipients Among all EACH recipients, 89% were aged 65 and over and 34% were aged 85 and over (Table 3.16). The prevalence of dementia among EACH recipients increased with age (Table 3.15). While 15% of recipients aged 65–69 had been diagnosed with dementia, this increased to almost one half for recipients aged 85 and over (46% of recipients aged 85–94 and 46% of recipients aged 95 and over). EACH recipients with dementia showed an older age profile compared with those without dementia (Table 3.16). Around 43% of care recipients with dementia were aged 85–94 and 6% were aged 95 and over, compared with 24% aged 85–94 and 3% aged 95 and over for those not diagnosed with dementia. EACH recipients with dementia were more likely to be in the oldest age groups than CACP recipients with dementia. For EACH recipients, 49% of recipients with dementia were 85 years and over. The equivalent proportion for CACP recipients was 39%. Considering all EACH recipients, women outnumbered men by a factor of almost two to one (64% were women). Of the EACH care recipients diagnosed with dementia, 69% were women. This is higher than the proportion of care recipients without dementia who were women (63%). Although the total number of care recipients was small in this census, Table 3.15 suggests that a higher (or at least equal) proportion of female than male EACH recipients had dementia at all ages except in the under 65 age group.
Presence of a carer The high dependency needs of people eligible for the EACH program requires that they receive a high level of support to remain in their homes. This support most commonly includes the assistance of family and unpaid carers. EACH recipients were more likely to have a carer than Community Aged Care Package recipients. Of all EACH care recipients, 91% reported having a carer (Table 3.17). Also, like CACP recipients, EACH recipients diagnosed with dementia were more likely than others to have a carer. Of care recipients diagnosed with dementia, 97% reported having a carer; this compares to 88% of care recipients without a dementia diagnosis having a carer. For all EACH recipients, men were more likely to have a carer (97% compared with 86% for women). However for EACH recipients with dementia, carer availability was equally high for both men and women (96% and 97%, respectively). Table 3.18 shows that it was only among the very oldest EACH recipients with dementia—aged 85 and over—that recipients without a carer are evident. For recipients without dementia, carer availability varied across age groups, averaging 88% across all groups.
Dependency of recipients Because of targeting, EACH recipients have high care needs. All EACH care recipients, whether with or without dementia, required assistance with self-care tasks, and almost all required assistance with mobility (99% of recipients with dementia and 98% of recipients without dementia). EACH care recipients were less likely to require assistance with communication; however, more care recipients with dementia required this type of assistance (76%), compared with care recipients without dementia (46%) (Table 3.19).

35
Assistance provided EACH recipients may receive a range of different services in different portions according to their level of need. Most of these services are measured according to the number of hours provided during the census week. However, meals, linen deliveries and transport trips are counted according to number of service events. Comparison of the weekly median hours or number of service events shows little difference between those with dementia and those without dementia (Table 3.20). The mean figures differ somewhat from the median figures, indicating that some individuals received substantially more or less of a service type than most, thus skewing the mean away from the median. Comparisons show that recipients with dementia on average received somewhat fewer meals (mean of 4.6 compared with 5.7 meals) and slightly less hours of personal care, allied health care and other food services compared with recipients without dementia. On the other hand, according to mean hours over a week, recipients with dementia received slightly more case management, respite and home maintenance services. When the number of hours of service provided is added over all service types, recipients with dementia received a median of 17.9 hours in the week (mean of 17.6 hours). This was just half an hour less than the median number of hours of assistance in the week for recipients without dementia (median of 18.4 and mean of 17.8). These results reflect the high care needs of all recipients in the EACH program. Family and other carers also contribute to the care and support of EACH recipients in the home. There were insufficient cases to enable a comparison of amount of services provided to recipients with dementia who do not have a carer, a result which is itself indicative of the difficulty of providing services in the home to dementia sufferers without informal support. In most areas of assistance, similar proportions of care recipients with or without dementia who had a carer received assistance (Table 3.21). However, recipients with dementia were more likely to use the respite service (53% for those with dementia and with a carer) compared with the proportion without dementia receiving this service (37% of those without dementia and with a carer). On average, among recipients with a carer, those with and without dementia received a similar number of hours assistance during census week. However, those without dementia on average received about one more delivered meal during the census week per person than those with dementia (mean of 5.8 compared with 4.7 meals). EACH care recipients without dementia and without a carer, received slightly more domestic assistance and other food services, and slightly less social support, delivered meals, rehabilitation and nursing care, compared with those with a carer (Table 3.22).

36
Table 3.15: EACH care recipients with and without dementia, by age and sex, census week May 2002
With dementia Without dementia Total
Sex/age Number Per cent Number Per cent Number Per cent
Males
Under 65 3 42.9 4 57.1 7 100.0
65–74 4 13.8 25 86.2 29 100.0
75–84 9 25.7 26 74.3 35 100.0
85–94 11 45.8 13 54.2 24 100.0
95+ 0 — 1 100.0 1 100.0
Total 27 28.1 69 71.9 96 100.0
Females
Under 65 5 20.8 19 79.2 24 100.0
65–74 5 16.1 26 83.9 31 100.0
75–84 19 33.9 37 66.1 56 100.0
85–94 26 44.8 32 55.2 58 100.0
95+ 5 50.0 5 50.0 10 100.0
Total 60 33.5 119 66.5 179 100.0
Persons
Under 65 8 25.8 23 74.2 31 100.0
65–74 9 14.8 52 85.2 61 100.0
75–84 28 30.8 63 69.2 91 100.0
85–94 38 45.8 45 54.2 83 100.0
95+ 5 45.5 6 54.5 11 100.0
Total 88 31.8 189 68.2 277 100.0
Note: The table excludes 11 cases with either age or dementia status missing. Cases with missing sex are included in the persons data. — Nil or rounded to zero.
Source: AIHW analysis of EACH 2002 census.
Table 3.16: EACH care recipients with and without dementia, by age, census week May 2002
With dementia Without dementia Total
Age Number Per cent Number Per cent Number Per cent
Under 65 8 9.1 23 12.2 31 11.2
65–74 9 10.2 52 27.5 61 22.0
75–84 28 31.8 63 33.3 91 32.9
85–94 38 43.2 45 23.8 83 30.0
95+ 5 5.7 6 3.2 11 4.0
Total 88 100.0 189 100.0 277 100.0
Note: The table excludes 11 cases with either age or dementia status missing.
Source: AIHW analysis of EACH 2002 census.

37
Table 3.17: EACH care recipients with and without dementia, by carer availability and sex, census week May 2002
With dementia Without dementia Total Sex/carer availability Number Per cent Number Per cent Number Per cent
Males
Has a carer 26 96.3 67 97.1 93 96.9
No carer 1 3.7 2 2.9 3 3.1
Total males 27 100.0 69 100.0 96 100.0
Females
Has a carer 60 96.8 99 82.5 159 85.9
No carer 2 3.2 21 17.5 23 12.4
Total females 62 100.0 120 100.0 185 100.0
Persons
Has a carer 87 96.7 167 87.9 254 90.7
No carer 3 3.3 23 12.1 26 9.3
Total persons 90 100.0 190 100.0 280 100.0
Note: The table excludes eight cases with either carer availability or dementia status missing. Cases with missing sex are included in the persons data.
Source: AIHW analysis of EACH 2002 census.
Table 3.18: EACH care recipients with and without dementia, by carer availability and age, census week May 2002
With a carer Without a carer Total Dementia status/age Number Per cent Number Per cent Number Per cent
With dementia
Under 65 8 100.0 0 0.0 8 100.0
65–74 9 100.0 0 0.0 9 100.0
75–84 28 100.0 0 0.0 28 100.0
85–94 36 94.7 2 5.3 38 100.0
95+ 4 80.0 1 20.0 5 100.0
Total with dementia 85 96.9 3 3.4 88 100.0
Without dementia
Under 65 21 91.3 2 8.7 23 100.0
65–74 44 84.6 8 15.4 52 100.0
75–84 55 87.3 8 12.7 63 100.0
85–94 41 91.1 4 8.9 45 100.0
95+ 5 83.3 1 16.7 6 100.0
Total without dementia 166 87.8 23 12.2 189 100.0
Total persons 251 90.6 26 9.4 277 100.0
Note: The table excludes 11 cases with either age or dementia status missing.
Source: AIHW analysis of EACH 2002 census.

38
Table 3.19: EACH care recipients with and without dementia, core activity in which assistance was needed, by age, census week May 2002
With dementia Without dementia Total
Core activity Number Per cent Number Per cent Number Per cent
Self-care 90 100.0 190 100.0 288 100.0
Mobility 89 98.9 187 98.4 283 98.3
Communication 68 75.5 88 46.3 157 54.5
None 0 — 0 — 0 —
Total persons 90 . . 190 . . 288 . .
Note: Dementia status not stated for eight recipients. These were included in totals.
— Nil or rounded to zero.
Source: AIHW analysis of EACH 2002 census.
Table 3.20: Hours or number of each assistance type provided to EACH care recipients with and without dementia, census week May 2002
With dementia Without dementia
Mean Median Mean Median
Type of assistance Hours
Personal care 8.8 9.0 9.5 9.0
Domestic assistance 2.2 2.0 2.4 2.0
Social support 2.5 2.0 2.9 2.0
Other food services 3.0 2.5 3.7 3.5
Respite care 5.0 4.0 4.6 4.0
Rehabilitation 1.8 1.8 2.1 1.8
Home maintenance 1.3 1.3 1.2 1.0
Case management 1.8 1.5 1.5 1.5
Allied health 0.9 0.8 1.4 1.0
Nursing 1.9 1.0 2.1 1.3
Total hours 17.6 17.9 17.8 18.4
Ancillary services for EACH Number
Delivered meals 4.6 5.0 5.7 7.0
Linen deliveries 1.3 1.0 1.1 1.0
Transport one-way trips 3.2 4.0 2.9 2.0
Notes
1. The table excludes eight cases with dementia status missing and six cases where care recipients were on leave and so did not receive any services during census week.
2. Amounts of type of assistance relate only to those receiving that assistance. Consequently, the sum of the mean number of hours of assistance received across types does not equal the total number of hours of assistance received.
Source: AIHW analysis of EACH 2002 census.

39
Table 3.21: EACH care recipients with and without dementia, types of therapies and ancillary services provided, by carer status, census week May 2002
With dementia(a) Without dementia
With a carer With a carer Without a carer
Type of assistance Number Per cent Number Per cent Number Per cent
Personal care 79 92.9 146 89.6 22 95.7
Domestic assistance 51 60.0 108 66.3 22 95.7
Social support 43 50.6 84 51.5 5 21.7
Other food services 32 37.6 53 32.5 13 56.5
Respite care 45 52.9 61 37.4 † †
Rehabilitation 16 18.8 41 25.2 3 13.0
Home maintenance 6 7.1 19 11.7 — —
Case management 73 85.9 148 90.8 22 95.7
Allied health 7 8.2 22 13.5 7 30.4
Nursing 47 55.3 88 54.0 14 60.9
Ancillary services
Delivered meals 7 8.2 12 7.4 8 34.8
Linen deliveries 7 8.2 9 5.5 3 13.0
Transport one-way trips 6 7.1 16 9.8 † †
Total EACH recipients(a) 85 . . 163 . . 23 . .
(a) Three EACH recipients with dementia did not have a carer. These have been excluded from the table as they do not allow accurate comparisons to be made.
Notes
1. The table excludes eight cases with dementia status missing and six cases where care recipients were on leave and so did not receive any services during census week.
2. Recipients may receive more than one type of assistance, and so percentages do not sum to 100.
† Fewer than three people received this service.
— Nil or rounded to zero.
Source: AIHW analysis of EACH 2002 census.

40
Table 3.22: Amount of assistance for EACH care recipients with and without dementia, area in which assistance was needed, by carer status, census week May 2002
With dementia(a) Without dementia
With carer With carer Without carer
Type of assistance Mean Median Mean Median Mean Median
Hours
Personal care 8.5 8.5 9.4 8.9 10.0 9.9
Domestic assistance 2.2 2.0 2.3 2.0 2.7 2.6
Social support 2.5 2.0 3.0 2.3 1.3 1.5
Other food services 2.5 2.3 3.4 3.0 4.8 5.0
Respite care 5.0 4.0 4.6 4.0 † †
Rehabilitation 1.8 1.8 2.1 1.8 1.3 1.5
Home maintenance 1.3 1.3 1.2 1.0 — —
Case management 1.8 2.0 1.5 1.3 1.8 1.6
Allied Health 1.0 0.8 1.3 1.0 1.5 1.5
Nursing 1.9 1.0 2.2 1.5 1.4 1.0
Total hours 17.3 18.0 17.7 18.0 18.6 19.5
Ancillary services Number
Delivered meals 4.7 5.0 5.8 7.0 5.5 7.0
Linen deliveries 1.3 1.0 1.0 1.0 1.0 1.0
Transport one-way trips 3.2 4.0 2.2 2.0 † †
Total EACH recipients(a) (number) 85 . . 163 . . 23 . .
(a) Three EACH recipients with dementia did not have a carer. These have been excluded from the table as they do not allow accurate comparisons to be made.
Note: The table excludes eight cases with dementia status missing and six cases where care recipients were on leave and so did not receive any services during census week.
† Fewer than three people received this service.
— Nil or rounded to zero.
Source: AIHW analysis of EACH 2002 census.
3.5 Residential aged care National data regarding the characteristics of residents of residential aged care do not contain reliable information on the existence of diagnosed dementia among residents. Information collected by the Aged Care Assessment Teams is included in the national payments database. A dementia indicator is included in this data; however, it is not sufficiently complete for this analysis. For example, for all permanent residents at 30 June 2002, ACAT data indicated that 4% of residents had dementia at the time of their assessment, 53% did not; for the remainder either dementia status was unknown (14%) or data on this variable was missing (29%). With a total of 43% of residents without a clear response on this variable, and with the available ACAT data being out of date for long-term residents, it is necessary to use data from other sources to obtain data on the prevalence of dementia in residential care and the characteristics and service use patterns of this group. Since data on the diagnosis of dementia is not available for residents of aged care, in this section an index is used to identify probable and possible dementia sufferers. The index is

41
based on data collected for the Resident Classification Scale (RCS). Using this proxy indicator, the dependency characteristics and service use patterns are examined by dementia status. Detailed assessment of the care needs of residents are only available for permanent aged care residents, consequently the analysis is restricted to this group.
The dementia index The proxy dementia index used in the following analysis is based on a scale developed for the 1998 Review of the Resident Classification Scale by Cuthbertson, Lindsay-Smith and Rosewarne (1998). The following discussion describes the data available for use in the index via the RCS, the derivation and form of the index, and its validity for measuring the impact of dementia on residential aged care. Although originally developed to investigate the adequacy of the RCS funding for residents with cognitive impairment and/or dementia needs, the index is commonly used by the Department of Health and Ageing for planning and reporting purposes. The RCS—derived from assessment against 20 items—is used to determine the relative care needs of each resident and hence the amount of subsidy they attract. When residents are assessed for the RCS they receive a score of A (no difficulty), B (some difficulty), C (major difficulty) or D (extensive difficulty) against each item. Each item and score has a weighting that reflects the level of nursing or personal care required, and the weighted scores are combined to obtain a measure of the overall relative level of care required. Total RCS scores are divided into eight broad categories, with people in RCS 1 having the highest care needs and those in RCS 8 the lowest care needs. Each permanent resident’s RCS is revised annually. Although the RCS does not contain a question that explicitly relates to dementia, it does provide a record of care needs that has been used to indicate the presence of dementia. In particular, one question specifically provides data on the level of assistance the resident requires in relation to understanding and undertaking living activities, an area in which people affected by dementia all have difficulties. In addition, dementia sufferers frequently experience some degree of difficulty with communication; the first question of the RCS scale deals with need for assistance in this area. Other behavioural care needs are also identified, including problem wandering or intrusive behaviour, verbally disruptive or noisy behaviour and physically aggressive behaviour. These needs may or may not be evident in a dementia sufferer and/or could be associated with other common neurological and emotional disorders. The dementia index uses questions 1 and 8 of the RCS. A description of the development of the scale by Cuthbertson, Lindsay-Smith and Rosewarne for use in the 1998 review of the Resident Classification Scale is given in Box 3.1. Question 1 of the RCS refers to the ‘degree of assistance that the care recipient needs in communicating with staff, relatives and friends, and other care recipients for whatever reason’. Question 8 refers to the ‘care recipient’s ability to remember, understand, plan for, initiate and perform general living activities and to react appropriately to information provided’. The index uses combinations of scores on these questions to allocate residents to the following categories: • no dementia • possible dementia • probable dementia.

42
Box 3.1: Development of the dementia index 1996–97 Resident Profile Survey: While data on dementia diagnosis is not generally available for aged care residents, in 1996–97 such data were collected in a survey on residents of nursing homes and hostels—the two tiers of residential aged care then provided. The survey was carried out as part of a consultancy funded by the Department of Health and Family Services investigating dementia and challenging behaviour in residential facilities (Rosewarne et al. 1997). The resident profile data were used to investigate relationships between various conditions and the information available through the assessment instruments—the Personal Care Assessment Instrument (PCAI) for hostel residents, and the Resident Classification Instrument (RCI) for nursing home residents. Because of the different assessment instruments being used by the two types of facilities at the time, analyses were necessarily carried our separately for hostel and nursing home residents. For both groups, two and three-level dementia models were developed for identifying residents with a range of impairments and dependencies, including dementia and cognitive impairment (noting that it is possible to have cognitive impairment without dementia) (Rosewarne 1999 unpublished). For hostel residents, the key indicator for the presence of dementia was the need for at least daily attention or assistance due to behavioural and/or cognition difficulties (PCAI question 12). For people in nursing homes, a key indicator for the presence of dementia was the need for assistance or attention with regard to speech and comprehension for the majority of activities, excluding difficulties caused by vision or hearing difficulties (RCI question 9). Other factors found to help predict the presence of dementia among nursing home residents included age, continence management, lack of independent eating, physical aggression and difficult behaviour. The full models developed by Rosewarne were between 70% and 80% correct in predicting cases/non-cases of dementia. Similar factors were found to be associated with the presence of moderate to severe cognitive impairment (compared with no to mild impairment, with around 80% correct identification using the full models). 1997 aged care reforms: In 1997 nursing homes and hostels were combined into a single system. At this time a revised Resident Classification Scale was introduced to be used by both former hostels and nursing homes. 1998 review of the Resident Classification Scale: In 1998 the Department of Health and Family Services commissioned a review of the Resident Classification Scale to determine, among other things, the extent to which the RCS adequately described residents’ care needs, with particular reference to dementia care needs (Cuthbertson et al. 1998:131). Review scales: Using diagnosis data available for a subset of aged care residents in conjunction with RCS data, Cuthbertson, Lindsay-Smith and Rosewarne constructed five nursing care needs indicator scales ‘based on standard statistical procedures, including the use of correlations and factor analysis’ (Cuthbertson et al. 1998:46). One of these was a scale of cognitive impairment (rather than an index specifically for dementia) which used two questions in its construction: communication (question 1); and comprehension/awareness (question 8). These questions were similar to those found to be important when modeling the presence of dementia using the 1996–97 nursing home and hostel data. 1998 revision of the Resident Classification Scale: Following the review, in November 1998 the RCS was revised, with questions 1 and 8 having minor revisions to better capture resident needs in these areas. As the revisions were only minor, the cognitive impairment scale using the revised questions (question 1 on communication and question 8 now called understanding and undertaking living activities) still provides a valid indicator of the extent of cognitive impairment among aged care residents. Since dementia is a major cause of cognitive impairment, and since the questions used in the index are also those found to be important in the dementia models developed earlier by Rosewarne, this scale can also be used as an indicator of the extent of dementia in residential aged care. The scaled index resulting from combining responses to these two questions is detailed in Table 3.23.

43
Residents with extensive difficulty in either communication or understanding and undertaking living activities and with at least major difficulty in the other question are identified as probably having dementia. Residents with extensive difficulty in either communication or in understanding and undertaking living activities, or with some or major difficulty in both questions are identified as possibly having dementia. Table 3.23 shows the scores used to determine these groups.
Table 3.23: Dementia proxy index for permanent aged care residents
Points Question 1 result (communication)
Question 8 result (understanding) Dementia group
2 A A No dementia
3 A B No dementia
3 B A No dementia
4 A C No dementia
4 B B No dementia
4 C A No dementia
5 A D Possible dementia
5 B C Possible dementia
5 C B Possible dementia
5 D A Possible dementia
6 B D Possible dementia
6 C C Possible dementia
6 D B Possible dementia
7 C D Probable dementia
7 D C Probable dementia
8 D D Probable dementia
Note: A = no difficulty (1 point), B = some difficulty (2 points), C = major difficulty (3 points), D = extensive difficulty (4 points).
Sources: Cuthbertson et al. 1998; Dr Rosewarne April 2004 (private communication).
Validation Without data on diagnosis, the use of the index for identifying people with dementia in residential aged care cannot be validated directly. However, broad comparisons can be made between results from the analysis of resident profiles in 1996–97, the prevalence of dementia as estimated from the 1998 ABS Survey of Disability, Ageing and Carers and the dementia status of permanent aged care residents in 1998 derived using the above index. At the end of 1998, among permanent aged care residents 27% were identified by the index as not being affected by dementia, 35% were considered to be possible dementia sufferers and a further 38% were estimated to fall into the probable dementia group (Table 3.24). Noting that diagnosis information may not have been available to survey respondents, and that mild to moderate dementia can be difficult to recognise, these results are consistent with the findings of the ABS 1998 survey, which found that, among people aged 65 or more, 43%

44
of those in cared accommodation (who had been there or were likely to be there for at least 3 months) reported dementia (42% among all residents of aged care homes). Looking at the results for residents with high care needs (care similar to that provided by nursing homes before the 1997 reforms), using the dementia index, 32% of high care needs residents possibly had dementia, and 59% probably had dementia. This compares with 22% of nursing home residents in 1996–97 having mild cognitive impairment, 27% having moderate cognitive impairment and 41% having severe cognitive impairment, so that overall, 88% of residents had some cognitive impairment. Sixty per cent of high care needs residents overall had diagnosed dementia (Rosewarne et al. 1997: 31–3). For low care needs residents in 1998 (roughly equivalent to hostel residents before the reforms), the index estimates that 40% possibly had dementia and only 7% probably had dementia; in 1996–97 among hostel residents, 28% had diagnosed dementia, with 55% having some cognitive impairment (35%, 17% and 3% having mild, moderate or severe cognitive impairment, respectively).
Table 3.24: Permanent residents, RCS and dementia status, 31 December 1998
No
dementia Possible
dementia Probable dementia Total
No dementia
Possible dementia
Probable dementia Total
High care needs Number Per cent
RCS 1 134 1,284 10,673 12,091 1.1 10.6 88.3 100.0
RCS 2 1,681 8,667 23,473 33,821 5.0 25.6 69.4 100.0
RCS 3 4,158 11,283 9,285 24,726 16.8 45.6 37.6 100.0
RCS 4 1,518 3,133 1,695 6,346 23.9 49.4 26.7 100.0
Total 7,491 24,367 45,126 76,984 9.7 31.7 58.6 100.0
Low care needs
RCS 5 2,779 6,074 1,934 10,787 25.8 56.3 17.9 100.0
RCS 6 4,835 6,639 1,089 12,563 38.5 52.8 8.7 100.0
RCS 7 15,439 7,844 454 23,737 65.0 33.0 1.9 100.0
RCS 8 4,439 263 6 4,708 94.3 5.6 0.1 100.0
Total 27,492 20,820 3,483 51,795 53.1 40.2 6.7 100.0
Total 34,983 45,187 48,609 128,779 27.2 35.1 37.7 100.0
Note: Numbers relate to residents where an RCS score is available.
Source: AIHW analysis of DoHA ACCMIS database.
The above results indicate that the dementia index can be used to provide a broad indication of the prevalence of people with dementia with varying care needs in residential aged care. Among people with high care needs, the probable dementia category appears to identify well people with dementia; however, among people with low care needs the index seems to underestimate the prevalence of dementia. Taken together, the possible and probable dementia categories appear to provide a good indication of the prevalence of cognitive impairment in residential aged care, among both high and low care residents. Since, as stated by Rosewarne and his colleagues, ‘estimates of the level of cognitive impairment are a more reliable indicator of cognitive deficits and subsequent care needs, than a reported diagnosis of dementia’ (Rosewarne et al. 1997:33), the scale of impairment included in the index provides a useful tool for examining the impact of dementia on residential aged care. Overall, inaccuracies in identification, due both to the simple nature of the scale and to errors

45
in identification that occur in any modelling process, mean that the index can be considered a robust basis on which to examine patterns and trends, but should be interpreted with caution as an estimate of the number of people in residential aged care that suffer from dementia.
Characteristics of residents Of the 136,535 people in permanent residential aged care at 31 December 2002, 20% were determined not to be affected by dementia (Table 3.25). A total of 50% were considered to be possible dementia sufferers and a further 31% were estimated to fall into the probable dementia group. A smaller proportion of new admissions during 2002 were in the probable dementia group compared with all permanent residents at the end of the year (26% versus 31%).
Table 3.25: Permanent residents, by dementia status, 2002
Permanent admissions, 2002 Permanent residents, 31 December 2002
Number Per cent Number Per cent
No dementia 10,057 21.6 26,679 19.5
Possible dementia 24,200 52.1 67,755 49.6
Probable dementia 12,228 26.3 42,101 30.8
Total 46,485 100.0 136,535 100.0
Note: Numbers relate to residents where an RCS score is available.
Source: AIHW analysis of DoHA ACCMIS database.
In 2002, as the age of separating permanent residents increases, the proportion without dementia decreases, declining from 18% among those leaving aged under 65, down to 8% among residents aged 95 or more. However, there was no substantial difference between males and females in the proportions identified with possible or probable dementia according to the dementia index (Table 3.26). The RCS categories 1 to 8 indicate the level of care needs a resident has, where a category of RCS 1 means that the resident has very high care needs. Those with probable dementia showed the highest level of care need with 86% of this group falling into RCS categories 1 and 2 on 31 December 2002 (Table 3.27). On the other hand, those with no dementia had the highest proportion (47%) in RCS categories 7 and 8. Of all permanent residents at the end of 2002, 64% were classified as having high care needs (RCS 1–4); a total of 31% of these were residents with probable dementia and a further 50% with possible dementia. Of those residents in the lowest care need category (RCS 8) only 0.1% were probable dementia sufferers, 11% possibly had dementia, and 89% were estimated not to be affected by dementia.

46
Table 3.26: Permanent residents, by dementia status, sex and age at separation, for last separation of separating permanent residents(a), 2002
Sex/age No dementia Possible
dementia Probable dementia Total Total
Males Per cent Number
Under 65 17.7 37.8 44.5 100.0 717
65–74 14.6 39.0 46.4 100.0 1,985
75–84 12.1 41.9 46.0 100.0 6,339
85–94 10.4 45.3 44.2 100.0 6,486
95+ 8.0 50.9 41.1 100.0 820
Total 11.8 43.2 45.0 100.0 16,347
Females
Under 65 18.0 36.0 46.0 100.0 533
65–74 17.8 38.8 43.4 100.0 1,676
75–84 14.4 41.1 44.5 100.0 8,443
85–94 11.5 42.7 45.8 100.0 15,009
95+ 7.9 41.9 50.2 100.0 3,437
Total 12.4 41.8 45.8 100.0 29,098
Persons
Under 65 17.8 37.0 45.1 100.0 1,250
65–74 16.1 38.9 45.0 100.0 3,661
75–84 13.4 41.4 45.1 100.0 14,782
85–94 11.2 43.5 45.3 100.0 21,495
95+ 8.0 43.6 48.4 100.0 4,257
Total 12.2 42.3 45.5 100.0 45,445
(a) In 6% of separations during 2001–02 the separating resident went to hospital (AIHW 2003b:56).
Note: Numbers relate to residents where an RCS score is available.
Source: AIHW analysis of DoHA ACCMIS database.

47
Table 3.27: Permanent residents, by RCS and dementia status, 31 December 2002
High care needs Low care needs
RCS 1 RCS 2 RCS 3 RCS 4 RCS 5 RCS 6 RCS 7 RCS 8 Total
Number
No dementia 254 1,783 2,361 1,037 3,335 5,347 11,072 1,490 26,679
Possible dementia 6,607 16,127 13,369 4,717 10,650 9,145 6,958 182 67,755
Probable dementia 20,180 16,014 4,090 634 782 315 85 1 42,101
Total 27,041 33,924 19,820 6,388 14,767 14,807 18,115 1,673 136,535
Per cent (column)
No dementia 0.9 5.3 11.9 16.2 22.6 36.1 61.1 89.1 19.5
Possible dementia 24.4 47.5 67.5 73.8 72.1 61.8 38.4 10.9 49.6
Probable dementia 74.6 47.2 20.6 9.9 5.3 2.1 0.5 0.1 30.8
Total 100.0 100.0 100.0 100.0 100.0 100.0 100.0 100.0 100.0
Per cent (row)
No dementia 1.0 6.7 8.8 3.9 12.5 20.0 41.5 5.6 100.0
Possible dementia 9.8 23.8 19.7 7.0 15.7 13.5 10.3 0.3 100.0
Probable dementia 47.9 38.0 9.7 1.5 1.9 0.7 0.2 — 100.0
Total 19.8 24.8 14.5 4.7 10.8 10.8 13.3 1.2 100.0
Note: Numbers relate to residents where an RCS score is available.
— Nil or rounded to zero.
Source: AIHW analysis of DoHA ACCMIS database.
Length of stay Average length of stay in residential care varies markedly with dementia status (Table 3.28). Among residents separating in 2002, those in the probable dementia group had an average length of stay of 169 weeks compared with 119 weeks for those without dementia. Residents with possible dementia fell between these two groups with an average length of stay of 131 weeks. Women generally have longer lengths of stay in residential aged care than men (165 weeks compared with 116 weeks for all separations), but for women with probable dementia the difference is even more pronounced (194 weeks compared with 125 weeks for men with probable dementia, or 56% longer).

48
Table 3.28: Average length of stay by dementia status, by sex and age at separation, for last separation of separating permanent residents(a), 2002
Average length of stay Permanent residents
Males Females Persons Males Females Persons
No dementia Weeks Number
Under 65 80.0 83.6 81.6 127 96 223
65-74 91.0 81.2 86.0 290 298 588
75-84 92.8 102.1 98.5 769 1,216 1,985
85-94 116.7 144.6 136.8 676 1,729 2,405
95+ 140.0 217.0 202.0 66 273 339
Total 101.7 128.9 119.4 1,928 3,612 5,540
Possible dementia
Under 65 105.2 106.1 105.6 271 192 463
65-74 105.7 111.9 108.5 774 650 1,424
75-84 102.5 113.3 108.6 2,655 3,469 6,124
85-94 111.7 148.5 136.9 2,940 6,412 9,352
95+ 161.3 214.8 202.8 417 1,440 1,857
Total 110.3 143.7 131.4 7,057 12,163 19,220
Probable dementia
Under 65 139.5 163.7 150.0 319 245 564
65-74 121.6 150.2 134.3 921 728 1,649
75-84 113.7 159.9 139.7 2,915 3,758 6,673
85-94 129.5 200.4 179.5 2,870 6,868 9,738
95+ 170.3 264.9 249.4 337 1,724 2,061
Total 124.6 193.9 169.2 7,362 13,323 20,685
All persons Under 65 116.0 128.5 121.4 717 533 1,250
65-74 111.0 123.1 116.5 1,985 1,676 3,661
75-84 106.5 132.4 121.3 6,339 8,443 14,782
85-94 120.1 171.8 156.2 6,486 15,009 21,495
95+ 163.3 240.1 225.3 820 3,437 4,257
Total 115.7 164.9 147.2 16,347 29,098 45,445(a) Some residents may be readmitted at a later date. In 2001–02, 83% of separations were the result of the death of the resident and in
6% of separations the resident went to hospital (AIHW 2003b:56).
Note: Numbers relate to residents where an RCS score is available.
Source: AIHW analysis of DoHA ACCMIS database.
Substantial differences in length of stay between those with dementia and those without are also evident by age. In 2002, length of stay for people without dementia separating when they were under 65 years was 82 weeks; this rose sharply to 137 weeks for those leaving aged 85–94, and to 202 weeks for those aged 95 and over. For people with probable dementia leaving before they were 65, length of stay averaged 150 weeks. The average length of stay was shorter among those leaving between the ages of 65 and 84, with averages of 134 weeks and 140 weeks for those aged 65–74 and 75–84, respectively, most likely because of the increased presence of co-morbidities which result in death. Length of stay then continues to increase with increasing age at separation so that for those residents with dementia who survived to 95 years or more, an average of 249 weeks was spent in residential care.

49
Over the 3 year period 2000 to 2002, the overall average length of stay for all separated residents increased from 143 weeks to 147 weeks (Table 3.29). However, within dementia status, only the probable dementia group showed a consistent increase in length of stay over the period, rising from 161 to 166 and 169 weeks over the 3 years. In both the possible dementia and no dementia groups there was a rise in length of stay between 2000 and 2001 which was then followed by a decline the following year.
Table 3.29: Average length of stay by dementia status and RCS level, for last separation of separating permanent residents(a), 2000–02
High care needs Low care needs
Year/dementia group RCS1 RCS2 RCS3 RCS4 RCS5 RCS6 RCS7 RCS8 All
2000 Weeks
No dementia 101.7 95.7 100.7 120.6 117.2 126.1 131.1 148.4 118.9
Possible dementia 124.3 126.4 126.9 140.4 137.0 141.5 137.9 152.6 130.5
Probable dementia 160.4 166.3 149.7 135.5 139.5 132.2 130.5 — 161.1
Total 153.6 149.1 130.1 135.2 132.0 134.9 133.5 148.7 143.2
2001
No dementia 94.8 109.0 100.6 107.3 130.0 128.2 131.5 154.8 121.6
Possible dementia 128.1 126.7 138.2 142.9 136.3 139.4 146.2 173.0 134.0
Probable dementia 165.4 170.8 151.5 125.6 138.6 133.2 150.9 — 165.5
Total 157.6 150.7 136.6 133.8 134.8 134.8 137.3 157.2 146.9
2002
No dementia 87.9 100.2 100.4 105.1 115.9 128.6 134.5 171.0 119.4
Possible dementia 125.4 125.5 133.4 149.7 137.9 133.8 140.7 152.4 131.4
Probable dementia 168.3 174.9 156.5 134.1 129.8 116.5 137.1 — 169.2
Total 158.4 150.7 134.4 139.7 131.9 131.4 136.9 169.5 147.2
(a) Some residents may be readmitted at a later date. In 2001–02, 83% of separations were the result of the death of the resident and in 6% of separations the resident went to hospital (AIHW 2003b:56).
Note: Numbers relate to residents where an RCS score is available.
— Nil or rounded to zero.
Source: AIHW analysis of DoHA ACCMIS database.
Separated residents with probable dementia have longer lengths of stay than residents without dementia (Table 3.28). Also, there are greater numbers of separations for those with probable and possible dementia than for those with no dementia reflecting the high prevalence of dementia among residents. By multiplying the average lengths of stay by the number of residents in each dementia group it is possible to see the relative bed occupancy of the dementia groups (Table 3.30). The total number of bed days occupied by residents who probably had dementia by the time they separated in 2002 was greater than the number of bed days for residents in the possible and no dementia groups combined (24.5 million days compared with 17.7 million and 4.6 million days). Furthermore, residents in the probable dementia category whose last RCS classification was at the highest level of care need (RCS 1) had the largest number of occupied bed days—12.3 million, or over one quarter of all occupied bed days. Their number of bed days exceeded all of the bed days of the separated residents in the no dementia group,

50
and was higher than the number of bed days for any other RCS level for either the possible or probable dementia groups.
Table 3.30: Total number of occupied bed days by last RCS level classification before separation, for all permanent residents separating in 2002
Last RCS level No dementia Possible dementia Probable dementia Total
High care needs
1 84,289 2,496,350 12,260,220 14,840,861
2 499,903 5,682,566 10,068,653 16,251,116
3 647,074 3,947,324 1,777,952 6,372,350
4 220,726 1,191,660 174,560 1,586,946
Low care needs
5 627,265 2,029,843 166,250 2,823,358
6 869,917 1,370,227 39,953 2,280,097
7 1,430,981 945,271 16,313 2,392,565
8 251,310 19,199 — 270,509
Total 4,631,465 17,682,441 24,503,899 46,817,799
Total residents 5,540 19,220 20,685 45,445
Note: Numbers relate to residents where an RCS score is available.
— Nil or rounded to zero.
Source: AIHW analysis of DoHA ACCMIS database.
The above comparison shows the total number of bed days used by people by the time they separate, according to their final dementia status. As people may develop dementia during their stay in residential aged care, the picture changes if annual use by people in the three dementia categories is considered (Table 3.31). In 2001–02, people with possible dementia accounted for the greatest number of occupied bed days (47%, compared with 38% of bed days for people separating in 2002). In addition, people without dementia occupied one-fifth of bed days (20%) during 2002 while separating clients without dementia on separation contributed only 10% of occupied bed days for separating clients. These results reflect the change of people’s dementia status during their time in residential aged care: whereas 26% of people admitted for permanent care in 2002 probably had dementia, 31% of residents at the end of that year were in this situation, and 46% of those separating during 2002 probably had dementia on separation (Table 3.25 and Table 3.26). Although the total number of annual occupied bed days has been increasing, across the period 1998–99 to 2001–02 the number of bed days occupied by those with probable dementia has decreased, from 17.9 million bed days in 1998–99 to 16.2 million bed days in 2001–02 (Table 3.31). This decrease in bed days occupied by those with probable dementia was observed within all RCS care need categories except the highest (RCS 1); within this group, occupied bed days increased from 4 million in 1998–99 to 7 million in 2001–02. Since 1998–99, both the numbers and proportions of annual occupied bed days used by people either without dementia or with probable dementia have been falling, so that the proportion of annual occupied bed days used by people with possible dementia has risen, from 35% in 1998–99 to 47% in 2001–02. By 2001–02, only 20% of annual occupied bed days were for people without dementia, compared with 27% in 1998–99.

51
Table 3.31: Occupied bed days over a year for permanent residents, by RCS level and dementia status, 1998–99 to 2001–02
No dementia Possible
dementiaProbable dementia Total
No dementia
Possible dementia
Probable dementia Total
No dementia
Possible dementia
Probable dementia Total
1998–99 Number Column per cent Row per cent
High care needs
RCS1 50,153 491,372 4,016,693 4,558,219 0.4 2.9 22.5 9.5 1.1 10.8 88.1 100.0
RCS2 615,953 3,210,420 8,534,825 12,361,198 4.7 18.9 47.8 25.8 5.0 26.0 69.0 100.0
RCS3 1,510,231 4,158,531 3,392,728 9,061,490 11.5 24.5 19.0 18.9 16.7 45.9 37.4 100.0
RCS4 560,989 1,176,029 609,420 2,346,437 4.3 6.9 3.4 4.9 23.9 50.1 26.0 100.0
Low care needs
RCS5 1,026,385 2,253,643 722,187 4,002,215 7.8 13.3 4.0 8.3 25.6 56.3 18.0 100.0
RCS6 1,850,072 2,543,888 416,313 4,810,273 14.0 15.0 2.3 10.0 38.5 52.9 8.7 100.0
RCS7 5,908,325 3,014,880 166,578 9,089,783 44.9 17.8 0.9 18.9 65.0 33.2 1.8 100.0
RCS8 1,650,563 116,202 2,143 1,768,908 12.5 0.7 — 3.7 93.3 6.6 0.1 100.0
Total 13,172,670 16,964,966 17,860,887 47,998,523 100.0 100.0 100.0 100.0 27.4 35.3 37.2 100.0
1999–00
High care needs
RCS1 72,015 961,436 5,550,083 6,583,534 0.6 4.8 32.9 13.7 1.1 14.6 84.3 100.0
RCS2 607,738 4,158,081 7,640,041 12,405,861 5.3 21.0 45.3 25.8 4.9 33.5 61.6 100.0
RCS3 1,192,545 4,536,992 2,538,471 8,268,008 10.4 22.9 15.0 17.2 14.4 54.9 30.7 100.0
RCS4 447,912 1,395,053 384,827 2,227,793 3.9 7.0 2.3 4.6 20.1 62.6 17.3 100.0
Low care needs
RCS5 1,007,079 2,741,451 442,457 4,190,987 8.8 13.8 2.6 8.7 24.0 65.4 10.6 100.0
RCS6 1,819,076 2,866,339 234,914 4,920,329 15.9 14.5 1.4 10.2 37.0 58.3 4.8 100.0
RCS7 5,180,373 3,045,565 81,033 8,306,971 45.2 15.4 0.5 17.3 62.4 36.7 1.0 100.0
RCS8 1,125,408 126,008 921 1,252,337 9.8 0.6 — 2.6 89.9 10.1 0.1 100.0
Total 11,452,148 19,830,925 16,872,747 48,155,820 100.0 100.0 100.0 100.0 23.8 41.2 35.0 100.0
(continued)

52
Table 3.31 (continued): Occupied bed days over a year for permanent residents, by RCS level and dementia status, 1998–99 to 2001–02
No dementia Possible
dementiaProbable dementia Total
No dementia
Possible dementia
Probable dementia Total
No dementia
Possible dementia
Probable dementia Total
2000–01 Number Column per cent Row per cent
High care needs
RCS1 79,645 1,392,744 6,289,267 7,761,656 0.7 6.5 38.5 15.9 1.0 17.9 81.0 100.0
RCS2 621,573 4,812,767 7,085,206 12,519,546 5.8 22.3 43.3 25.7 5.0 38.4 56.6 100.0
RCS3 1,082,695 4,671,796 2,066,657 7,821,148 10.1 21.7 12.6 16.1 13.8 59.7 26.4 100.0
RCS4 409,846 1,516,151 318,856 2,244,853 3.8 7.0 1.9 4.6 18.3 67.5 14.2 100.0
Low care needs
RCS5 1,065,094 3,108,948 361,979 4,536,021 9.9 14.4 2.2 9.3 23.5 68.5 8.0 100.0
RCS6 1,866,936 3,054,430 181,836 5,103,202 17.3 14.2 1.1 10.5 36.6 59.9 3.6 100.0
RCS7 4,758,874 2,886,137 49,368 7,694,379 44.2 13.4 0.3 15.8 61.8 37.5 0.6 100.0
RCS8 876,312 104,965 497 981,774 8.1 0.5 — 2.0 89.3 10.7 0.1 100.0
Total 10,760,974 21,547,938 16,353,666 48,662,578 100.0 100.0 100.0 100.0 22.1 44.3 33.6 100.0
2001–02
High care needs
RCS1 81,991 1,815,502 7,048,454 8,945,947 0.8 7.9 43.5 18.1 0.9 20.3 78.8 100.0
RCS2 610,522 5,309,508 6,604,171 12,524,200 6.1 23.0 40.7 25.4 4.9 42.4 52.7 100.0
RCS3 927,965 4,798,110 1,759,970 7,486,045 9.3 20.8 10.9 15.2 12.4 64.1 23.5 100.0
RCS4 385,832 1,612,274 289,392 2,287,497 3.8 7.0 1.8 4.6 16.9 70.5 12.7 100.0
Low care needs
RCS5 1,163,686 3,549,552 333,264 5,046,502 11.6 15.4 2.1 10.2 23.1 70.3 6.6 100.0
RCS6 1,900,924 3,253,816 143,028 5,297,768 19.0 14.1 0.9 10.7 35.9 61.4 2.7 100.0
RCS7 4,295,964 2,688,286 39,079 7,023,329 42.9 11.6 0.2 14.2 61.2 38.3 0.6 100.0
RCS8 657,620 77,182 260 735,062 6.6 0.3 — 1.5 89.5 10.5 — 100.0
Total 10,024,503 23,104,229 16,217,618 49,346,351 100.0 100.0 100.0 100.0 20.3 46.8 32.9 100.0
Note: Numbers relate to residents where an RCS score is available.
— Nil or rounded to zero.
Source: AIHW analysis of DoHA ACCMIS database.

53
3.6 Movement between services
Residential care and community care linkage analysis With the development of the Home and Community Care (HACC) quarterly collections, which include a capacity to construct a linkage key, it has become possible to develop a more sophisticated and complete picture of movement between community and residential aged care services. This section examines movements that occurred between HACC, residential aged care services (RACS) and Community Aged Care Packages.
Data reliability and validity The combination of data sets by the use of a linkage key creates greater opportunities to understand the interface between services. This purpose does not require that individual client or resident records be matched with 100% accuracy. Rather, statistical record linkage need only be sufficiently accurate to enable statistically valid conclusions to be drawn. Thus, while the aim is to obtain a linkage key that is unique to each individual, it is recognised that for some small percentage of cases some individuals may have more than one linkage key or more than one person may have the same linkage key. Analysis revealed that within each data set, at least 99% of records had unique linkage keys. Without undertaking further deterministic or probabilistic record matching, it was not possible to distinguish between the duplicate records identified by the HACC linkage key. Protocols for dealing with duplicate records are the subject of current work at the AIHW. It was determined that for the purpose of this analysis that all occurrences of a linkage key that appeared more than once would be removed. The percentage of data lost as a result of the elimination of these records was considered acceptable with respect to the linked databases. With the HACC Minimum Data Set collection still in its infancy, only one full year of data was available for this analysis. Data quality problems were particularly evident in the early quarterly collections and while improvements have occurred over time, some problems persist in more recent quarters. The analysis presented here uses the most recent quarters available that match available residential and CACP data. A further limitation of the HACC data is that it does not contain service start or end dates. A client present in a quarter may have used a service at any point during the quarter and for an unknown interval of time. It is not possible, therefore, to determine an exact interval between HACC use and subsequent or previous use of another service. For this reason subsequent quarters are used to examine movement between services in order to establish order of use. Neither the HACC nor the CACP database available for this analysis contained a dementia indicator or feasible proxy. Consequently, analysis is limited to dementia status as measured by the proxy dementia indicator derived from the Resident Classification Scale.
Results The types of movement examined are: • movement between HACC and permanent residential care in either direction; and • movement between Community Aged Care Packages and permanent residential care
in either direction.

54
There are a number of ways in which movement between service sectors can be quantified. The approach taken here is to examine a cohort of residents or clients who are present in a service at a particular time and trace their subsequent service use. People present in one service over a period of fixed length are compared with those present in another service in a subsequent period.
Residential aged care residents’ prior use of community care In the October–December quarter 2002 there were 12,321 permanent admissions to residential aged care (Table 3.32). Of these, the majority were categorised as possible dementia cases (53%), one quarter were probable dementia cases (25%) and the remainder were classified as not having dementia.
Table 3.32: Permanent aged care residents admitted between 1 October 2002 and 31 December 2002 by use of HACC or CACP between 1 July and 30 September 2002, by dementia status
RACS admissions Prior use of HACC Prior use of CACP
Dementia status Number Per cent HACC
clients
Proportion of RACS admissions
within dementia status (%)
CACP recipients
Proportion of RACS admissions
within dementia status (%)
No dementia 2,771 22.5 1,215 43.8 281 10.1
Possible dementia 6,475 52.6 2,638 40.7 714 11.0
Probable dementia 3,075 25.0 1,081 35.2 266 8.7
Total 12,321 100.0 4,934 40.0 1,261 10.2
Note: Numbers relate to residents where an RCS score is available.
Source: AIHW analysis of DoHA ACCMIS database and HACC MDS.
Of the admissions to residential aged care in the October 2002 quarter, 40% had been receiving HACC services in the previous quarter and a further 10% had been a CACP recipient. In all dementia groups the proportion who had been receiving a CACP in the previous quarter was similar. However, a greater proportion of residents admitted with no dementia had previously been receiving HACC services (44% of admissions in the no dementia group were from HACC) than those with probable dementia (35% of admissions in the probable dementia group were from HACC). As for all admissions, the majority of admissions to residential aged care from HACC and CACP were possible dementia cases (53% of those from HACC and 57% of those from CACP) with the remainder split fairly evenly between no dementia and probable dementia. The 4,934 HACC recipients who were subsequently admitted to residential care in the time period under examination represented just 1% of all HACC clients. In contrast, the 1,261 CACP recipients who were later admitted to residential care accounted for approximately 5% of all CACP recipients.
Residential aged care residents’ subsequent use of community care Table 3.33 examines the subsequent use of HACC and CACP services by permanent residents of residential aged care who separated between 1 January 2002 and 30 June 2002. Of the 21,132 separations from permanent residential care in the 6 month period, just 2% were present in HACC in either of the two subsequent quarters beginning July 2002 and October 2002 (436 and 378 people for each quarter, respectively). When these groups are broken down into dementia groups, as few as 92 are available for comparison. Bearing in

55
mind that these small samples may produce unreliable results, the two quarters examined nevertheless show a consistent pattern. The greatest numbers of separations from permanent residential care were people with probable dementia. This group was least likely to take up HACC services in a subsequent quarter. While 4% of departing residents without dementia were found to be using HACC after their separation, only 1% of those with dementia were doing the same. Very few permanent residents subsequently used a CACP. Less than 1% of permanent residents who separated between January and June 2002 were receiving a Community Aged Care Package in the July–September 2002 quarter and fewer still in the October–December 2002 quarter. The small numbers for subsequent use of both HACC and CACP reflect the fact that the vast majority of separations are due to the death of the resident. This is discussed further below.
Table 3.33: Permanent aged care residents separating between 1 January 2002 and 30 June 2002 by subsequent use of HACC or CACP and dementia status
Subsequent use of HACC Subsequent use of CACP
RACS
separations HACC
clients
Proportion of RACS separations
within dementia status (%)
CACP recipients
Proportion of RACS separations within
dementia status (%)
July–September 2002
Probable dementia 9,640 126 1.31 1 0.01
Possible dementia 8,818 200 2.27 6 0.07
No dementia 2,674 110 4.11 9 0.34
Total 21,132 436 2.06 16 0.08
October–December 2002
Probable dementia 9,640 92 0.95 3 0.03
Possible dementia 8,818 178 2.02 0 —
No dementia 2,674 108 4.04 1 0.04
Total 21,132 378 1.79 4 0.02
Note: Numbers relate to residents where an RCS score is available.
— Nil or rounded to zero.
Source: AIHW analysis of DoHA ACCMIS database and HACC MDS.
Destination on separation from residential care The residential care payments database contains data on the reason for separation. This field indicates whether death has occurred or whether the resident returned to the community, went to hospital or transferred to another residential care service. While the separation destination recorded on this system may not accurately reflect actual destination for a number of reasons, the data does provide one source of information which, taken together with other analyses, builds a picture of possible movements patterns between services.
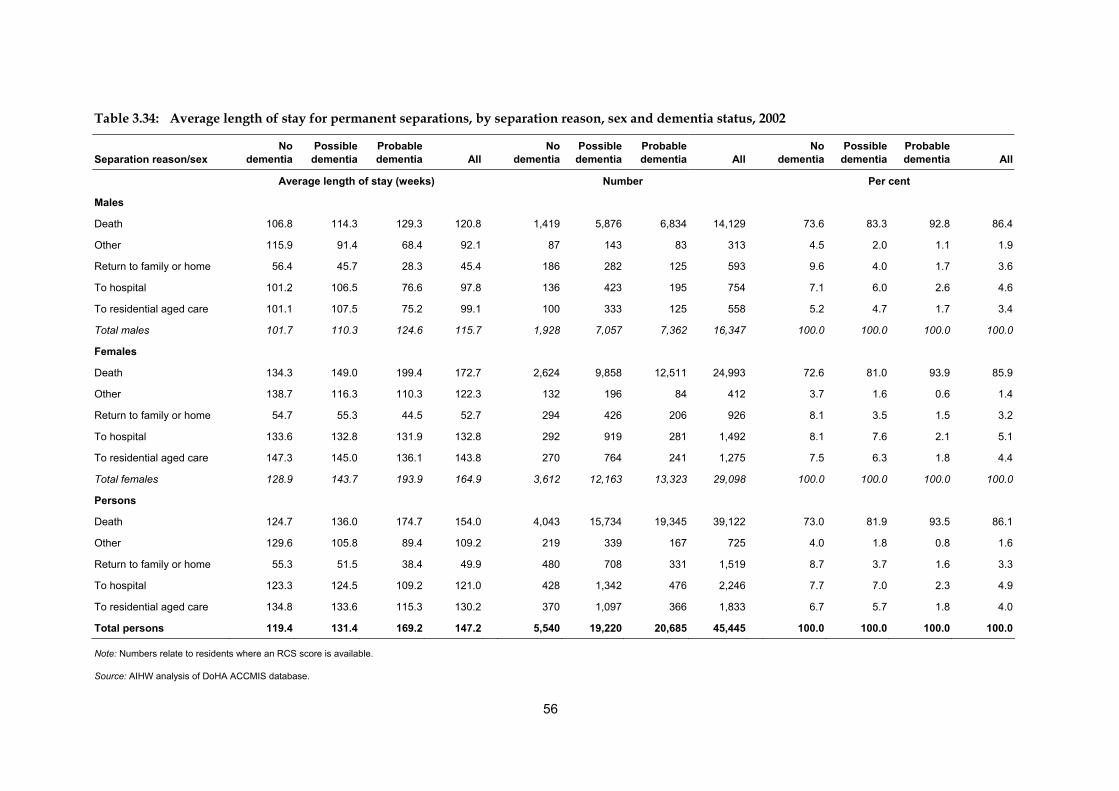
56
Table 3.34: Average length of stay for permanent separations, by separation reason, sex and dementia status, 2002
Separation reason/sex No
dementia Possible
dementiaProbable dementia All
No dementia
Possible dementia
Probable dementia All
No dementia
Possible dementia
Probable dementia All
Average length of stay (weeks) Number Per cent
Males
Death 106.8 114.3 129.3 120.8 1,419 5,876 6,834 14,129 73.6 83.3 92.8 86.4
Other 115.9 91.4 68.4 92.1 87 143 83 313 4.5 2.0 1.1 1.9
Return to family or home 56.4 45.7 28.3 45.4 186 282 125 593 9.6 4.0 1.7 3.6
To hospital 101.2 106.5 76.6 97.8 136 423 195 754 7.1 6.0 2.6 4.6
To residential aged care 101.1 107.5 75.2 99.1 100 333 125 558 5.2 4.7 1.7 3.4
Total males 101.7 110.3 124.6 115.7 1,928 7,057 7,362 16,347 100.0 100.0 100.0 100.0
Females
Death 134.3 149.0 199.4 172.7 2,624 9,858 12,511 24,993 72.6 81.0 93.9 85.9
Other 138.7 116.3 110.3 122.3 132 196 84 412 3.7 1.6 0.6 1.4
Return to family or home 54.7 55.3 44.5 52.7 294 426 206 926 8.1 3.5 1.5 3.2
To hospital 133.6 132.8 131.9 132.8 292 919 281 1,492 8.1 7.6 2.1 5.1
To residential aged care 147.3 145.0 136.1 143.8 270 764 241 1,275 7.5 6.3 1.8 4.4
Total females 128.9 143.7 193.9 164.9 3,612 12,163 13,323 29,098 100.0 100.0 100.0 100.0
Persons
Death 124.7 136.0 174.7 154.0 4,043 15,734 19,345 39,122 73.0 81.9 93.5 86.1
Other 129.6 105.8 89.4 109.2 219 339 167 725 4.0 1.8 0.8 1.6
Return to family or home 55.3 51.5 38.4 49.9 480 708 331 1,519 8.7 3.7 1.6 3.3
To hospital 123.3 124.5 109.2 121.0 428 1,342 476 2,246 7.7 7.0 2.3 4.9
To residential aged care 134.8 133.6 115.3 130.2 370 1,097 366 1,833 6.7 5.7 1.8 4.0
Total persons 119.4 131.4 169.2 147.2 5,540 19,220 20,685 45,445 100.0 100.0 100.0 100.0
Note: Numbers relate to residents where an RCS score is available.
Source: AIHW analysis of DoHA ACCMIS database.

57
For the majority of residents (86%) separation came about as a result of death (Table 3.34). Residents with dementia were more likely to separate for this reason than those without dementia (94% of those with probable dementia separated for this reason compared with 73% of those without dementia). Those with probable dementia were least likely to return to the community (2% of those with probable dementia separated to return home or to family compared with 9% of those without dementia). They were also least likely to separate to go to hospital (2% of those with probable dementia separated to go hospital compared with 8% of those without dementia), or to transfer to another residential care service (2% of those with probable dementia separated for this reason compared with 7% of those without dementia). Length of stay for those with probable dementia was substantially longer than for those with no dementia where the reason for separation was death (175 weeks compared with 125 weeks). Average length of stay was shorter for the probable dementia group compared with the no dementia group for all other separation destinations.
3.7 Summary The impact of dementia varies from service to service. In 2001–02, dementia was managed at a rate of 5 per 1,000 patient encounters with general practitioners, or 6 per 1,000 adult patient encounters. It is also estimated for 2001–02 that around 5% of GP patients aged 18 and over had either diagnosed or suspected dementia. These figures suggest that dementia is managed in relatively few GP encounters with people with dementia. In addition, medication was prescribed in the management of dementia at a rate of 29.4 per 100 dementia encounters. Given that only a small proportion of people with dementia are aged under 65, this can be compared with a general prescription rate of between 110 and 120 per 100 encounters for people aged 65 and over (AIHW: GPSCU 2002:49). The dementia management rate increases with patient age, with dementia being managed in 31 per 1,000 encounters for people aged 75 and over in 2001–02. It is estimated that dementia was managed in around 505,000 GP encounters in 2001–02, with about one quarter of these involving Alzheimer’s disease. The impact of dementia on hospital services appears to be relatively greater than that on general practice. In 2001–02, 1.2% of all hospital separations (or 79,000 separations) involved people with a diagnosis of dementia. For around one in eight of these separations, dementia was the principal diagnosis. If same-day separations are excluded, people with any diagnosis of dementia accounted for 2.3% of hospital separations. However, people with dementia tend to stay longer than others in hospital. Consequently, nearly 7% of bed days for separations lasting at least one night were for people with any diagnosis of dementia. If the prevalence rate of dementia increases with the ageing of the population as expected, a greater proportion of hospital bed days can be expected to involve people with a diagnosis of dementia. The care needs of people with dementia grow as the disease progresses. As a consequence, the prevalence of dementia among people using aged care services increases with the level of care being provided by the program. For 2002, it is estimated that 6% to 7% of people aged 65 and over had dementia and 4% had both dementia and a severe or profound disability (Tables 2.2 and 2.7). However, among people screened for aged care programs by Aged Care Assessment Teams, around 20% have a primary diagnosis of dementia. Reflecting the level of care available through the various programs, 18% of CACP recipients have diagnosed dementia compared with 32% of EACH place recipients. Not surprisingly, dementia has the

58
greatest prevalence in residential aged care services. Precision is not possible, but applying an indicator based on a measure of cognitive impairment developed by consultants for the 1998 review of the Resident Classification Scale (RCS) results in an estimate of 52% of people admitted into permanent residential aged care in 2002 who possibly had dementia and a further 26% who probably had dementia; at the end of the year, using the same indicator gives estimates of 50% and 31%, respectively, of permanent residents either possibly or probably with dementia. In general, people with care needs similar to those met in residential aged care have difficulty staying in the community without a carer. EACH and CACP recipients with dementia are more likely than other recipients to have a carer, suggesting that people with dementia have even greater difficulty staying at home without a carer. This is particularly true as the disease progresses and care needs become greater: in 2002 nearly all EACH recipients with dementia had a carer (97% compared with 88% for recipients without dementia). A change in the availability of carers would therefore have an impact on the ability of people with dementia to remain in their homes. Within a service program, people with dementia generally have greater care needs than those without. This particularly affects residential aged care. Using the RCS-based dementia indicator, it is estimated that on 31 December 2002, around 86% of permanent residents with probable dementia were in the highest two RCS care need categories, compared with 34% of residents with possible dementia and 8% of those without dementia. In addition, in 2002 two-thirds of occupied bed days for people in the two highest RCS care need categories were used by people who probably had dementia. This rises to 97% if people with possible dementia are also included. Although people with diagnosed dementia have a shorter remainder of life expectancy than others, the length of stay in residential aged care by people with dementia is, on average, longer than stays by other residents. As a consequence, in 2001–02 people with either possible or probable dementia accounted for 80% of occupied bed days by permanent residents. Over the last 4 years this relative use has been increasing—up from 73% of occupied bed days in 1998–99. The rise in use by people with dementia has been driven by growth in bed days for people with possible dementia, with the proportion of bed days for people with probable dementia falling over the period—from 37% of bed days in 1998–99 to 33% in 2001–02. From the above it can be seen that changes in either the prevalence of dementia, the availability of carers or the treatment of dementia would impact on the need for and provision of health and aged care services.

59
4 Costs of dementia Dementia is a very costly disorder—both in terms of its emotional and social costs on individuals and their families and in terms of the financial costs borne by individuals and government in caring for people with dementia. The cost of dementia to the community can be measured in a number of ways. In the following discussion the disease burden on sufferers caused by dementia and the financial cost to the health and aged care systems are discussed.
4.1 Burden of disease
Mortality Dementia as a cause of death is known to be understated on death certificates. Nevertheless, this information can provide valuable information, including insight into the increasing recognition of dementia as a cause of death. The primary source of information regarding deaths due to dementia is the state and territory Registrars of Births, Deaths and Marriages. The Australian Bureau of Statistics is a secondary source and is responsible for coding cause of death. Variations have occurred over time in the collection and coding of causes of death. The mortality data reported here are analysed based on the year in which they were registered. Use of mortality data in understanding disease processes has been limited until recently by having information on only a single underlying cause of death. However, since 1997 the ABS has been coding multiple causes of death information from death certificates. In 1998, two or more causes of death were listed on 71.5% of death certificates. In more than half of these deaths, at least three causes of death were listed. The multiple causes of death recorded on death certificates are sorted into two categories—underlying causes and contributing causes of death—by the ABS as follows: • An underlying cause of death is a disease or injury which initiated the train of morbid
events leading directly to death, or the circumstances of the accident or violence which produced the fatal injury.
• Contributing causes of death are all causes and conditions reported on a death certificate. One of these will become the underlying cause of death.
Statistics relating to deaths can be presented simply as crude death rates; that is, the number of deaths in a year divided by the number of individuals in the corresponding population. However, since the risk of dying varies with age and sex, even minor variations in the age and sex structure of a population may affect crude death rates. This makes comparison between different populations and analysis of time trends in the same population problematic. One way around this difficulty is to compare age-specific death rates; that is, mortality at particular ages for each sex, but this entails a separate comparison or analysis for each age group. Alternatively, variations in age structure can be allowed for by using age standardisation.

60
Age-standardised rates facilitate comparison between populations with different age structures. Age standardisation involves applying age-specific rates to a standard population, so that the age-standardised rates reflect the mortality that would have been expected if the populations being compared had an identical age structure. The age structure of the standard population can influence conclusions drawn from age-adjusted rates. The total estimated resident population of Australia on 30 June 2001 is the population standard used for comparing Australian rates over time.
Dementia as an underlying cause of death (ICD–10–AM codes F00–F03, G30) Over the 5 years from 1997, the total number of deaths attributed to dementia has increased from 3,294 in 1997 to 3,740 in 2001 (Table 4.1). However, death rates from dementia (age-standardised) have been stable over the period (Table 4.2). In each year approximately twice as many women as men died under circumstances in which dementia was the main cause of death. In 2001, the age-standardised mortality rate with dementia as the underlying cause was 19.4 per 100,000 population. Mortality rates of dementia were low among people aged less than 65 years but they increased rapidly from that age. In 2001 the age-specific death rate more than doubled for each progressive 5 year age category, increasing from 9.4 deaths per 100,000 population at 65–69 to 31.8 at 70–74 years, 229.1 at 80 to 84 years, 590.9 at 85–89, 1,261.3 at 90–94 and 2,043.1 at 95 years and over. For all 5 years examined, comparison of the death rates for males and females shows that among people aged under 80 the occurrence of death from the underlying cause of dementia was more common among men than women, while for older people the reverse was true. Death rates due to dementia for both males and females was greatest in the 95 and over age group (1,342.7 and 2,272.7 per 100,000 among very old men and women, respectively, in 2001). The age-standardised death rate for women in 2001 was 20.4 per 100,000 population compared with 16.9 per 100,000 for men.

61
Table 4.1: Number of deaths with an underlying cause of dementia, by age and sex, 1997 to 2001
Sex/age 1997 1998 1999 2000 2001
Males
0–59 9 11 7 7 14
60–64 14 15 9 20 17
65–69 40 36 42 25 33
70–74 112 82 121 100 95
75–79 181 190 179 211 195
80–84 247 277 244 265 277
85–89 272 288 298 282 307
90–94 144 149 175 172 178
95+ 40 41 50 39 61
Total 1,059 1,089 1,125 1,121 1,177
Females
0–59 10 13 9 12 11
60–64 27 14 19 14 11
65–69 29 33 34 40 29
70–74 95 88 92 85 103
75–79 194 234 211 235 227
80–84 458 427 440 463 448
85–89 654 640 708 781 759
90–94 511 475 549 596 660
95+ 257 231 240 308 315
Total 2,235 2,155 2,302 2,534 2,563
Persons
0–59 19 24 16 19 25
60–64 41 29 28 34 28
65–69 69 69 76 65 62
70–74 207 170 213 185 198
75–79 375 424 390 446 422
80–84 705 704 684 728 725
85–89 926 928 1,006 1,063 1,066
90–94 655 624 724 768 838
95+ 297 272 290 347 376
Total 3,294 3,244 3,427 3,655 3,740
Source: AIHW National Mortality Database.

62
Table 4.2: Death rates for the underlying cause of dementia, by age and sex, 1997 to 2001 (per 100,000 population)
Sex/age 1997 1998 1999 2000 2001 Males 35–39 — — — — —
40–44 — 0.1 0.3 — —
45–49 — 0.2 0.3 — 0.1 50–54 0.4 0.3 — 0.6 0.2 55–59 1.6 1.6 0.6 0.6 2.4 60–64 3.9 4.0 2.3 5.0 4.2 65–69 11.9 10.7 12.6 7.5 10.2 70–74 39.7 28.4 41.1 33.4 32.4 75–79 95.3 94.7 84.4 96.1 88.7 80–84 227.2 250.0 216.7 222.7 227.2 85–89 573.5 569.7 554.8 496.5 516.4 90–94 1,071.7 1,037.0 1,130.8 1,028.0 992.7 95+ 1,314.1 1,244.3 1,384.3 976.2 1,342.7 Crude rate 11.5 11.7 12.0 11.8 12.3 Age-standardised rate (Australia 2001) 17.6 17.4 17.2 16.2 16.9 Females 35–39 0.3 — — — —
40–44 — — — — —
45–49 0.2 0.3 0.2 — 0.3 50–54 0.6 0.7 0.5 0.6 0.2 55–59 0.9 1.6 1.1 1.7 1.6 60–64 7.4 3.8 4.9 3.5 2.8 65–69 8.2 9.5 9.8 11.6 8.6 70–74 28.9 26.6 27.6 25.5 31.3 75–79 75.6 87.1 75.1 81.7 79.7 80–84 254.6 234.5 240.3 243.7 230.2 85–89 650.6 605.6 632.9 669.3 627.6 90–94 1,351.7 1,197.2 1,301.8 1,310.4 1,360.5 95+ 2,329.4 2,028.5 1,989.7 2,373.2 2,272.7 Crude rate 24.0 22.9 24.2 26.3 26.4 Age-standardised rate (Australia 2001) 20.4 19.0 19.4 20.4 20.4 Persons 35–39 0.1 — — — —
40–44 — 0.1 0.1 — —
45–49 0.1 0.2 0.2 — 0.2
50–54 0.5 0.5 0.2 0.6 0.2
55–59 1.3 1.6 0.9 1.1 2.0
60–64 5.7 3.9 3.6 4.3 3.5
65–69 10.0 10.1 11.2 9.6 9.4
70–74 33.9 27.4 33.9 29.2 31.8
75–79 84.0 90.3 79.1 87.9 83.6
80–84 244.3 240.4 231.3 235.6 229.1
85–89 625.9 594.0 607.5 612.7 590.9
90–94 1,278.3 1,154.6 1,255.9 1,234.4 1,261.3
95+ 2,109.8 1,852.5 1,850.2 2,044.4 2,043.1
Crude rate 17.8 17.3 18.1 19.1 19.4 Age-standardised rate (Australia 2001) 19.6 18.6 18.8 19.1 19.4 — Nil or rounded to zero.
Sources: Table 4.1; ABS 2002.

63
Dementia as a contributing cause of death (ICD–10–AM codes F00–F03, G30) Dementia is more frequently reported to be a contributing than underlying cause of death among older people (Table 4.3). Between 1997 and 2001 there were three deaths below the age of 35 for which dementia was a contributing cause. The greatest number of deaths in which dementia was a contributing cause occurred for people aged 85 to 89. Over the 5 years examined, the number of deaths for which dementia was a contributing cause varied between a low of 9,007 in 2000 and a high of 11,072 in 1999. Approximately twice as many women as men died under circumstances in which dementia was a contributing cause of death (3,208 men compared with 6,061 women in 2001). There were 9,269 registered deaths in the year 2001 in which dementia was a contributing cause, which equates to an age-standardised mortality rate of 49.5 per 100,000 population (Table 4.4). Age-specific mortality rates of dementia as a contributing cause were more than twice as great as the age-specific mortality rates for dementia as the underlying cause. Again, very old women (85+) were more likely to be reported as having dementia as a contributing cause of death than men. However, overall the difference was small, and from 1997 to 1999 the age-standardised rate for men was equal to or slightly higher than that for women. In 2001, the age-standardised rate for women was 49.9 per 100,000 population compared with 47.8 per 100,000 for men. Age-standardised rates were relatively stable between 1997 and 1999 but declined markedly in 2000 and remained low in 2001. In 2001 the rate was 49.5 per 100,000 population compared with 62.5 per 100,000 for 1999.

64
Table 4.3: Number of deaths where dementia was a contributing cause, by age and sex, 1997 to 2001
Sex/age 1997 1998 1999 2000 2001
Males
0–59 25 27 29 20 26
60–64 41 49 41 33 39
65–69 146 117 140 64 69
70–74 349 305 385 250 230
75–79 673 664 671 562 525
80–84 994 998 977 769 802
85–89 932 999 1,111 800 875
90–94 448 479 556 457 498
95+ 96 111 127 95 144
Total 3,704 3,749 4,037 3,050 3,208
Females
0–59 28 27 19 30 22
60–64 40 29 38 26 25
65–69 94 87 91 66 62
70–74 288 290 268 214 217
75–79 643 717 708 598 570
80–84 1,466 1,392 1,425 1,129 1,162
85–89 1,981 1,920 2,244 1,867 1,853
90–94 1,509 1,451 1,584 1,402 1,473
95+ 639 652 658 625 677
Total 6,688 6,565 7,035 5,957 6,061
Persons
0–59 53 54 48 50 48
60–64 81 78 79 59 64
65–69 240 204 231 130 131
70–74 637 595 653 464 447
75–79 1,316 1,381 1,379 1,160 1,095
80–84 2,460 2,390 2,402 1,898 1,964
85–89 2,913 2,919 3,355 2,667 2,728
90–94 1,957 1,930 2,140 1,859 1,971
95+ 735 763 785 720 821
Total 10,392 10,314 11,072 9,007 9,269
Source: AIHW National Mortality Database.

65
Table 4.4: Death rates for the contributing cause of dementia, by age and sex, 1997 to 2001 (per 100,000 population)
Sex/age 1997 1998 1999 2000 2001 Males 35–39 0.1 — 0.1 — 0.1 40–44 — 0.1 0.4 0.1 0.1 45–49 0.2 0.5 0.8 — 0.3 50–54 1.6 1.4 1.0 1.3 0.6 55–59 3.2 3.1 2.8 2.2 3.5 60–64 11.3 13.2 10.7 8.2 9.6 65–69 43.3 34.9 41.9 19.3 21.4 70–74 123.8 105.8 130.7 83.4 78.5 75–79 354.2 330.8 316.2 255.9 238.7 80–84 914.2 900.9 867.5 646.4 657.9 85–89 1,965.2 1,976.1 2,068.4 1,408.6 1,471.9 90–94 3,334.3 3,333.6 3,592.7 2,731.5 2,777.3 95+ 3,153.7 3,368.7 3,516.1 2,378.0 3,169.7 Crude rate 40.2 40.3 43.0 32.1 33.4 Age-standardised rate (Australia 2001) 62.9 61.6 63.4 45.6 47.8 Females 35–39 0.3 0.1 — — 0.1 40–44 — 0.1 0.1 0.1 0.4 45–49 0.5 0.3 0.3 0.1 0.4 50–54 2.0 1.4 0.8 1.3 0.5 55–59 2.6 3.5 2.4 4.2 2.4 60–64 11.0 7.8 9.9 6.6 6.3 65–69 26.7 24.9 26.3 19.1 18.4 70–74 87.6 87.6 80.4 64.1 65.8 75–79 250.7 266.7 252.1 207.8 200.1 80–84 815.1 764.6 778.4 594.2 597.1 85–89 1,970.7 1,816.7 2,005.9 1,600.0 1,532.1 90–94 3,991.7 3,657.2 3,756.0 3,082.5 3,036.4 95+ 5,791.7 5,725.3 5,455.1 4,815.8 4,884.6 Crude rate 71.8 69.7 73.8 61.7 62.5 Age-standardised rate (Australia 2001) 63.0 59.6 61.1 49.4 49.9 Persons 35–39 0.2 0.1 0.1 — 0.1 40–44 — 0.1 0.3 0.1 0.3 45–49 0.3 0.4 0.5 0.1 0.4 50–54 1.8 1.4 0.9 1.3 0.5 55–59 2.9 3.3 2.6 3.2 3.0 60–64 11.2 10.5 10.3 7.4 7.9 65–69 34.8 29.8 34.0 19.2 19.8 70–74 104.3 96.1 104.0 73.3 71.8 75–79 294.7 294.1 279.7 228.6 217.0 80–84 852.4 816.2 812.4 614.3 620.5 85–89 1,968.9 1,868.3 2,026.2 1,537.3 1,512.3 90–94 3,819.4 3,571.2 3,712.1 2,988.1 2,966.5 95+ 5,221.3 5,196.5 5,008.3 4,242.0 4,461.2 Crude rate 56.1 55.1 58.5 47.0 48.0 Age-standardised rate (Australia 2001) 63.7 60.8 62.5 48.6 49.5
— Nil or rounded to zero. Sources: Table 4.3; ABS 2002.

66
Years of life lost due to disability and premature death Diseases and disorders can have a range of effects on both quality and length of life. Some may affect only the expected length of life, others only the quality of life, while still others may impact on both the quality and quantity of years of life lived. In Chapter 2 the prevalence of dementia in conjunction with a severe or profound restriction was discussed, and in the above section deaths attributable to dementia were examined. While these figures show some of the effects of the disease, they do not take into account the extent to which dementia affects people’s lives.
Years of life lost due to premature death The burden of mortality can be investigated according to whether the condition results in premature mortality. The measure years of life lost due to premature death (YLL)—based on numbers of deaths attributed to each cause at each age—provides one way to measure the extent to which a disease causes premature death. The most recent data available on the burden of premature death in Australia relate to 1996, and measure years of life lost due to a death at any given age using the life expectancy at that age (Table 4.5) (see AIHW: Mathers et al. 1999:15–16 for details on method). In 1996, dementia accounted for 5% or less of YLL, depending on the age and sex of the group being considered. In the two age groups examined, women lost relatively more years of life due to dementia than men. Also, a greater proportion of lost years of life were caused by dementia in the older age group (75+) than in the younger age group (55–74). Among the age/sex groups examined, dementia had the greatest relative effect on women aged 75 and over, with 5% of YLL being due to dementia. Less than 1% of YLL were attributed to dementia for men aged 55 to 74. The patterns are similar when looking at years of life lost per 1,000 population, with rates ranging from 1.4 YLL per 1,000 men aged 55 to 74, to 24 years of life lost per 1,000 women aged 75 and over (Table 4.6). It is likely that these differences in rates by age and sex are due to the older age profile of women (especially in the older age group) in conjunction with the increasing prevalence of dementia with age.
Years of healthy life lost due to disability The burden of disease in terms of the disability experienced by sufferers can be measured by estimating the number of healthy years of life lost due to the disability associated with a disease. This burden is captured by the measure years of life lost due to disability (YLD) which takes into account both the incidence of illness and the severity or level of impact on life and functioning due to that illness (see AIHW: Mathers et al. 1999:17–22 for details on method). Because of its disabling rather than fatal nature, dementia has a much greater effect on years of healthy life lost than it has on years of life lost due to premature mortality. In 1996, dementia accounted for 10% of years of healthy life lost by men and 17% of years of healthy life lost by women (Table 4.5). As with premature mortality, a greater proportion of YLD are due to dementia for women than men and for older people compared with younger people. Accordingly, the greatest proportion of YLD due to dementia is observed among women aged 75 and over: in 1996 24% of years of healthy life lost by this group were due to dementia. In terms of healthy life lost per 1,000 population, the disability burden of dementia was 14 YLD per 1,000 men aged 55 and over, and 19 YLD per 1,000 women aged 55 and over (Table 4.6). These figures are greatly influenced by the relatively low burden among those

67
under 75: for women aged 75 and over the disability burden caused by dementia was considerably higher at 42 YLD per 1,000 women.
Disability-adjusted life years The combined effect of premature mortality and burden of disease due to disability can be gauged using disability-adjusted life years (DALYs). One DALY is a lost year of ‘healthy’ life, and is the sum of years of life lost due to premature mortality and years of healthy life lost due to disability. The majority of the burden of disease caused by dementia is due to disability rather than death, with disability accounting for around three-quarters of the total burden for people aged 55 and over in 1996 (Table 4.5). Death, however, accounts for a greater proportion of the burden of disease due to dementia for older than younger people; premature death caused about one-third of the burden for people aged 75 and over, but less than 15% for people aged 55 to 74. For all other causes combined, premature death was the greater source of disease burden, contributing 70% of the burden among people aged 55 and over. Overall, in 1996, dementia-related disability and death resulted in a loss of 19 DALYs per 1,000 men aged 55 and over; for women the corresponding figure was 27 DALYs per 1,000 population (Table 4.6). Reflecting the increasing burden with age observed for both death and disability, the total burden of dementia increases with age. Among people aged 75 and over dementia accounted for 54 DALYs per 1,000 men and 65 DALYs per 1,000 women.

68
Table 4.5: Burden of disease for dementia, by age and sex, 1996 (years of life lost)
Males Females
Years of life lost due to premature
mortality (YLL)
Years of healthy life lost due to
disability (YLD)
Disability-adjusted life years (DALYs)
Years of life lost due to premature
mortality (YLL)
Years of healthy life lost due to
disability (YLD)
Disability-adjusted life years (DALYs)
55–74 Years Years Dementia 1,932 11,523 13,454 2,111 15,261 17,371 Other causes 300,799 154,462 454,119 203,896 120,099 323,421
All causes 302,731 165,985 467,573 206,007 135,360 340,792 75+ Dementia 5,948 12,712 18,660 13,230 23,470 36,700 Other causes 180,808 55,372 235,765 235,533 73,861 309,114 All causes 186,756 68,084 254,425 248,763 97,331 345,814 Total 55+ Dementia 7,880 24,235 32,114 15,341 38,731 54,071 Other causes 481,607 209,834 689,884 439,429 193,960 632,535 All causes 489,487 234,069 721,998 454,770 232,691 686,606 55–74 Column per cent Column per cent Dementia 0.6 6.9 2.9 1.0 11.3 5.1 Other causes 99.4 93.1 97.1 99.0 88.7 94.9 All causes 100.0 100.0 100.0 100.0 100.0 100.0 75+
Dementia 3.2 18.7 7.3 5.3 24.1 10.6 Other causes 96.8 81.3 92.7 94.7 75.9 89.4 All causes 100.0 100.0 100.0 100.0 100.0 100.0
Total 55+ Dementia 1.6 10.4 4.4 3.4 16.6 7.9 Other causes 98.4 89.6 95.6 96.6 83.4 92.1 All causes 100.0 100.0 100.0 100.0 100.0 100.0 55–74 Row per cent Row per cent Dementia 14.4 85.6 100.0 12.2 87.9 100.0 Other causes 66.2 34.0 100.0 63.0 37.1 100.0 All causes 64.7 35.5 100.0 60.4 39.7 100.0 75+ Dementia 31.9 68.1 100.0 36.0 64.0 100.0 Other causes 76.7 23.5 100.0 76.2 23.9 100.0 All causes 73.4 26.8 100.0 71.9 28.1 100.0 Total 55+ Dementia 24.5 75.5 100.0 28.4 71.6 100.0 Other causes 69.8 30.4 100.0 69.5 30.7 100.0 All causes 67.8 32.4 100.0 66.2 33.9 100.0
Note: Constituent components may not add to the total due to rounding in the source publication.
Source: AIHW: Mathers et al. 1999 Annex tables F, G and H.

69
Table 4.6: Burden of disease for dementia, by age and sex, 1996 (years of life lost per 1,000 population)
Males Females
Years of life lost due to premature
mortality (YLL)
Years of healthy life lost due to
disability (YLD)
Disability-adjusted life years (DALYs)
Years of life lost due to premature
mortality (YLL)
Years of healthy life lost due to
disability (YLD)
Disability-adjusted life years (DALYs)
55–74 Years per 1,000 population Years per 1,000 population
Dementia 1.4 8.3 9.7 1.5 10.6 12.0
Other causes 216.9 111.4 327.4 141.0 83.1 223.7
All causes 218.3 119.7 337.1 142.5 93.6 235.7
75+
Dementia 17.2 36.7 53.9 23.5 41.8 65.3
Other causes 522.6 160.0 681.4 419.1 131.4 550.0
All causes 539.8 196.8 735.3 442.6 173.2 615.3
Total 55+
Dementia 4.5 14.0 18.5 7.6 19.3 26.9
Other causes 277.9 121.1 398.1 218.8 96.6 315.0
All causes 282.5 135.1 416.6 226.5 115.9 341.9
Note: Constituent components may not add to the total due to rounding in the source publication.
Source: AIHW: Mathers et al. 1999 Annex tables F, G and H.
4.2 System expenditures
Direct health system expenditure Data on the cost of dementia to the health system are available for 1993–94 and 2000–01 (Table 4.7). The vast majority of health system dementia costs are those borne by high care needs residents in aged care homes. In 1997 the existing two tiers of residential aged care—nursing homes and hostels—were combined into a single system and the Resident Classification Scale was introduced. Nursing homes provided a high level of care, generally equating to that given to residents in RCS categories 1–4 in the new system. Hostels, on the other hand, provided a lower level of care, equivalent to that required by residents in RSC categories 5–8. When deriving disease cost estimates, expenditures relating to high-level care in residential aged care are included as part of the health system. Costs relating to low-level care are included as part of the welfare services system. In 1993–94, 80% of dementia health system costs were incurred by nursing homes ($647 million out of a total $814 million spent on dementia, in 2000–01 prices) (Table 4.7). By 2000–01 this had risen to 86% ($1,902 million out of a total of $2,209 million). The other major cost was to hospitals. However, the relative increase in this expenditure between the two years was less than that observed for residential aged care (21% increase compared with 194%). Consequently, by 2000–01 hospital treatment accounted for 7% ($160 million) of total

70
dementia-related health expenditures, down from 16% in 1993–94. Although pharmaceuticals contribute only a small percentage to the total cost of dementia to direct health system costs, there has been a large increase in the amounts involved. The cost of dementia to pharmaceuticals increased by nearly 1,000% over the 7 years, from $2 million in 1993–94 to $27 million in 2000–01 (2000–01 prices). This may reflect the increased availability and prescription of anti-dementia medications over the period (see Section 3.1).
Table 4.7: Direct health system expenditure for dementia by government and individuals, by health sector, 1993–94 and 2000–01 ($ million)
Hospital(a) Pharmaceuticals(b) Aged care
homes(c) Other total(d) All sectors
1993–94 $ million (1993–94 prices) 110 2 539 27 678
$ million (2000–01 prices)(e) 132 2 647 32 814
Per cent 16.3 0.3 79.5 3.9 100.0
2000–01
$ million 160 27 1,902 120 2,209
Per cent 7.3 1.2 86.1 5.4 100.0
7-year increase in 2000–01 prices (per cent) 21 995 194 275 171
(a) Includes admitted and non-admitted patient services in public and private acute hospitals and psychiatric hospitals, and a preliminary estimate of private medical services provided in hospital.
(b) Includes all pharmaceuticals for which a prescription is needed, including private prescriptions and under-co-payment prescriptions, and includes over-the-counter medicaments such as vitamins and minerals, patent medicines, first aid and wound care products, analgesics, feminine hygiene products, cold sore preparations, and a number of complementary health products that are sold in both pharmacies and other retail outlets.
(c) Aged care homes expenditure includes nursing homes in 1993–94 (hostels not included) and high care needs residential aged care in 2000–01 (low care RCS levels 5–8 not included).
(d) Includes out-of hospital medical services, other health professional services, dental services and research.
(e) 1993–94 expenditure converted to 2000–01 prices by applying the health prices deflator (1.20) for the period 1993–94 to 2000–01.
Note: Not all expenditure is allocated when deriving disease expenditure estimates. The total expenditure not allocated by disease includes capital expenditure, community health services, public health programs, patient transport and health administration and health aids and appliances. Disease expenditure estimates allocate around 86% of the total recurrent health expenditure in 2000-01, or just over $49.1 billion in total.
Sources: Analysis of AIHW: Mathers et al. 1999; AIHW 2004c.
Aged care system expenditure In the following analysis, the cost of dementia to a number of national programs delivering community care and residential aged care is discussed. In 2000–01 these programs together accounted for 93% of government funding on national aged care programs (AIHW 2003a:317). In addition, there are several state-specific aged care services—both mainstream and targeted at people with dementia and their carers—which it has not been possible to include. Consequently, the following estimates of financial cost to the aged care system understate the total cost. In 2000–01, residential aged care accounted for 75% of the $5,303.8 million of government funding on aged care services; Community Aged Care Packages accounted for 4% and Home and Community Care for people aged 65 and over absorbed 14% (AIHW 2003a:317). Assessment received 0.8% of government funding, and the EACH program 0.2%. The cost of dementia to these services is discussed below. Due to lack of relevant data, the cost of dementia with respect to carers, either in terms of costs to individuals or government

71
expenditure on programs that support carers (such as the Carers Allowance and the National Respite for Carers Program), is not discussed.
Community care Detailed analysis of the cost of dementia on community care programs has yet to be carried out. However, using a number of broad assumptions an indication of the costs involved can be obtained.
Assessment As stated earlier, around 20% of ACAT clients have a primary diagnosis of dementia. Using this proportion to estimate the cost of dementia to assessment for aged care services, around $8 million (0.2 x $41.7 million) of funding for the Aged Care Assessment Program in 2000–01 can be attributed to dementia.
Home and Community Care HACC is the largest of the community care programs, with government spending $725.1 million on people aged 65 and over via the program in 2000–01 (AIHW 2003a:317). No data is currently available on the dementia status of HACC clients. However, taking people who need assistance with core activities as the people who are most likely to need HACC services—that is, those with a severe or profound core activity restriction according to the definition used by the ABS for the 1998 survey—a rough indication of the cost of dementia to the HACC program can be obtained. For 2001 it is estimated that 7% (28,000) of people aged 65 and over living in the community with a severe or profound core activity restriction had dementia.4 Applying this percentage to HACC expenditure suggests that the cost of dementia to the HACC program in 2000–01 was around $50 million of government funding. As this figure is not based on observed prevalence of dementia within the program, and does not consider the main cause of disability, it is very crude. Furthermore, it assumes that the average cost of HACC services provided to people with dementia is similar to the average cost of HACC services provided to all other people. Given that people with dementia tend to have relatively high care needs this assumption will probably lead to an underestimate of the costs. In addition, the estimate does not include user contributions.
CACP and EACH programs While the CACP and EACH 2002 censuses collected information on dementia status, they did not collect unit level costs for particular services, nor did they record the cost of providing a package to a particular client. Consequently, the cost of dementia to these programs must also be estimated. However, data on the amount of particular services provided to clients were collected. Using these it is possible to get an indication of the cost of dementia to these programs.
4 This estimate was derived assuming 1998 age-specific population rates for people with dementia living in households, and 1998 age-specific splits between severe or profound restrictions and other levels of restriction. Because people with greater levels of disability are more likely to be in residential care, the latter assumption is likely to lead to an overestimate of the number of people with a severe or profound restriction living in households. The estimated number of people with a severe or profound restriction living in households was estimated by deducting the number of permanent aged care residents as at 30 June 2001 from the estimated number of people with a severe or profound restriction in Australia in June 2001.

72
From census data, it is estimated that 18% of CACP recipients had dementia and that these people received 22% of the total hours of service provided under Community Aged Care Packages. For EACH, recipients with dementia accounted for 32% of both recipients and hours of service provided (see Section 3.4). Using the percentage of hours of service used by people with dementia to estimate the cost of dementia to the two programs, the cost of dementia to government in 2000–01 was approximately $3 million for EACH and $43 million for CACP. While these estimates take into account the different total hours of service provided to people with and without dementia, they do not allow for differential mix of service types by people with and without the disorder, nor are costs to users included. They also assume that dementia is the main reason for the need of the services.
Residential aged care The cost of dementia to high-level residential aged care has already been discussed when looking at health care costs; however, around two-fifths of bed days used by permanent residents involve low-level care (38% in 2000–01) (Table 3.29). The cost of dementia for all levels of care in residential aged care in 2000–01 is examined below. The estimates are based on expenditure on residential subsidies for permanent residents.
Method for allocating residential aged care subsidies by disease In the 1998 ABS Survey of Disability, Ageing and Carers, the ABS surveyed both households and health establishments and made particular effort to survey the latter thoroughly. They surveyed 800 health establishments and gathered detailed information about 5,716 people resident in these establishments. This sample represented 3% of those in cared accommodation. The health establishment questionnaire was filled in by an employee of the establishment. Thus, the questionnaire does not provide the resident’s view of their condition, but gives the perspective of the health establishment. This has disadvantages in that it does not necessarily find out which issues are of most concern to the resident, but it is advantageous for disease costing as it gives a good idea of which conditions cause problems that require assistance from residential aged care staff. The analysis here uses information on the long-term health conditions that caused the resident the most problems. Frequently residents will have several long-term conditions, and the care needed will depend on the impact of all of these conditions. However, to make the analysis manageable, all of the costs of caring for a resident are allocated to the long-term condition causing the most problems. The ABS survey estimates that 30% of residents of aged care homes in 1998 had dementia (including Alzheimer’s disease) as their main long-term health condition. This proportion was higher for those aged 80 to 84 years (32%) and 85 years and over (35%). As most of those with dementia are high dependency residents and require more intensive and expensive care (see Section 3.5), 30% of residential aged care costs cannot simply be allocated to dementia. The allocation of residents with dementia across the RCS categories was therefore done using data on the dementia indicator discussed in Chapter 3. The RCS distribution of the probable and possible dementia residents was applied to the ABS data on the number of residents within age groups with dementia to estimate the number of residents with dementia in each age–sex–RCS category. Similarly, the RCS distribution for permanent residents without dementia was applied to the ABS data on the number of people in residential aged care without dementia. The subsidies and total costs for each age–sex–RCS category from the residential aged care database ACCMIS were then applied to the resulting numbers of residents to estimate the cost of dementia. Estimates for 2000–01 were made by

73
assuming constancy since 1998–99 in the proportion of each age–sex–RCS cell that is for residents with dementia. The above method does not assume that the probable/possible dementia indicator used in Chapter 3 can provide an accurate estimate of the total number or residents in aged care homes with dementia contributing significantly to their care needs. The proportion of residents with dementia (30%) comes from the ABS survey, and the probable/possible dementia indicator is only used to allocate these residents across the RCS care need categories.
Results Reflecting the higher care needs of people with dementia seen in Section 3.5, and the consequent higher than average subsidy per bed day, the 30% of permanent aged care residents with dementia as the condition causing them the most problems accounted for 44% of Australian Government subsidies for permanent aged care residents in 2000–01 (Table 4.8). Residents with dementia accounted for a much higher proportion of the subsidies for the high dependency categories: 72% of the RCS 1 category subsidies, 51% of the RCS 2 category subsidies, and 51% of the subsidies for RCS categories 1–4 combined. For residents needing low-level care, dementia accounted for only 4% of subsidies. In 2000–01, residential care subsidies for permanent residents with dementia as the main disabling condition were estimated at slightly under $1.6 billion. Only 1% of these subsidies were for people requiring low-level care, leaving over $1.5 billion for residents with high care needs. Because RCS data is not available for aged care residents receiving respite care, it has not been possible to derive an estimate of the cost of dementia among aged care respite residents. However, the costs will be relatively low for a number of reasons: only 2% of occupied bed days were used for respite in 2000–01 (AIHW 2002:24); respite residents are more likely than permanent residents to require low-level care and so, on average, receive lower subsidies; and the prevalence of dementia is likely to be lower among respite residents compared with permanent residents. The above amounts relate to Australian Government subsidies to permanent residents only, and do not include other federal funding, funding from state and territory governments, or payments by residents. Consequently, the amount derived here for the cost of dementia to high care residential care is less than the amount estimated for the cost of dementia to the health system (Table 4.7). In 2000–01, Australian Government subsidies for permanent residents accounted for 88% of the total federal and state government recurrent funding for residential aged care ($3,491.5 million out of $3,955.6 million) (AIHW 2003a:317). If it is assumed that the percentage of subsidies to permanent residents that can be attributed to dementia (i.e. 44.4%) applied to all funding, then overall the cost of dementia to government in residential aged care was in the vicinity of $1.8 billion.

74
Table 4.8: Australian Government residential aged care subsidies for permanent residents with dementia as main condition, 2000–01
RCS category DementiaOther
conditions Total DementiaOther
conditions Total
High care needs $ million Per cent
RCS 1 759 291 1,050 72.3 27.7 100.0
RCS 2 614 594 1,208 50.8 49.2 100.0
RCS 3 142 453 595 23.8 76.2 100.0
RCS 4 17 118 135 12.7 87.3 100.0
RCS 1–4 1,532 1,456 2,989 51.3 48.7 100.0
Low care needs
RCS 5 14 175 188 7.2 92.8 100.0
RCS 6 5 152 157 3.2 96.8 100.0
RCS 7 1 155 156 0.5 99.5 100.0
RCS 8 –- 1 1 –- 100.0 100.0
RCS 5–8 19 484 503 3.9 96.1 100.0
RCS 1–8 1,552 1,940 3,492 44.4 55.6 100.0
— Nil or rounded to zero.
Sources: AIHW analysis of ABS 1998 Disability, Ageing and Carers Survey unit record file; AIHW analysis of ACCMIS database.
User contributions The above estimates do not include user contributions to residential aged care. For full-pensioner residents and all respite residents, the daily care fee is set at 85% of the Age Pension. For part-pensioner and non-pensioner residents who are on higher incomes, income-tested fees are charged at the rate of 25 cents for every additional dollar of income up to a maximum level of three times the pensioner rate or the cost of care, whichever is the lower. In 2000–01, the basic daily care fee yielded just over $1.1 billion ($1,102.6 million) in user payments and the income-tested component an additional $54.5 million (AIHW 2003a:319). Since user contributions do not vary according to the level of care provided, an estimate of these payments for residents with dementia can be obtained by applying the percentage of residents that have dementia. At the time of the 1998 ABS survey, 30% of residents of aged care homes had dementia as their main disabling condition. However, the proportion of residents who possibly or probably have dementia has been growing. Allowing for this increase, for 2000–01 it is estimated that 31% of residents had dementia as their main disabling condition, and that the cost of dementia to users of residential aged care was around $360 million.
Changes since 1993–94 Comprehensive disease costing estimates were last made in Australia for the financial year 1993–94. The estimates for nursing home expenditure by disease were made using a combination of data from the ABS 1993 Survey of Disability, Ageing and Carers and from data on discharge to nursing homes from hospitals. There was no data on the dependency levels for each disease, so it was assumed that each condition cost the same per bed day. Also, it is unknown what proportion of hostel costs in 1993–94 were for residents with dementia. It may have been considerable as a number of hostels operating at the time

75
specialised in dementia care. However, hostels accounted for only a small percentage of total nursing home and hostel expenditure. As noted earlier, dementia-related expenditure in nursing homes is estimated to be $539 million in 1993–94. This was only 17% of the total cost of nursing home care in that year. If an allowance had been made for the higher cost per bed day of residents with dementia it would have accounted for about 19% of nursing home costs. The increase in the cost of dementia from 19% of nursing home costs in 1993–94 to 41% of the cost of residential aged care (including both government expenditure and user payments) in 2000–01 is very significant. Furthermore, it could be argued that the more appropriate comparison would be the proportion of expenditure in RCS categories 1 to 4 that is due to dementia, as the RCS categories 1 to 4 more accurately reflect what nursing homes were in 1993–94. This would lead to a larger difference between the 2 years because of the greater concentration of people with dementia in the high care needs categories, resulting in 51% of Australian Government subsidies for high care in 2000–01 being attributed to dementia, compared with 44% across all RCS categories. It is always difficult to compare estimates when different methods have been used, so the actual magnitude of the change from 1993–94 to 2000–01 is uncertain. But over the period there certainly was a substantial increase in the proportion of expenditures on residential aged care that was devoted to caring for residents with dementia.
Summary For 2000–01 it is estimated that expenditures for dementia by the health and aged care systems combined were just over $2.5 billion (Table 4.9). An overwhelming proportion of this expenditure was for residential aged care ($2.1 billion), with this accounting for 84% of total expenditure.
Table 4.9: Direct health and aged care system expenditure for dementia by government and individuals, by sector, 2000–01
Sector $ million Per cent
Residential aged care (high and low care needs)
Government 1,756 69.5
Individuals 360 14.2
Total 2,116 83.7
Community care programs(a)
ACAP 8 0.3
HACC 50 2.0
CACP 43 1.7
EACH 3 0.1
Total 104 4.1
Health, other than high care in residential aged care(b)
Hospital 160 6.3
Pharmaceuticals 27 1.1
Other 120 4.7
Total 307 12.1
Total 2,527 100.0 (a) Includes government expenditure only.
(b) Includes expenditure by government and individuals.

76
It is estimated—somewhat roughly—that in 2000–01, the cost to government of dementia to the main community care programs totalled around $100 million. In contrast, for the same year the cost of dementia to residential aged care is estimated to have been nearly $1.8 billion in government funding. An overwhelming majority of this expenditure was for residents requiring high-level care, with 99% ($1.5 billion) of Australian Government subsidies for residents with dementia as their main disabling condition being for those with high care needs. The cost of aged care services to users is generally not available; however, a crude estimate attributes to dementia around $360 million of user payments for residential aged care in 2000–01. Expenditure for dementia by the health system (excluding health expenditure in residential aged care) was $307 million in 2000–01. Over half of this expenditure was by hospitals ($160 million), and nearly 9% was for pharmaceuticals ($27 million). As well as the aged care programs considered above, there are a number of others which deliver services to people with dementia which it has not been possible to consider. In 2000–01, the aged care programs included in the above costing together accounted for 93% of government funding of national aged care programs. In addition, there are several state-specific aged care services—both mainstream and targeted at people with dementia and their carers—which it has not been possible to include. Consequently, the above estimates of financial cost to the aged care system understate the total cost.

77
Appendix: Data on general practice The clinical activities of general practitioners are the subject of an ongoing national survey known as BEACH (Bettering the Evaluation and Care of Health). The study is conducted by the General Practice Statistics and Classification Unit (an AIHW collaborating unit) within the Family Medicine Research Centre, University of Sydney. BEACH began in April 1998 and involves a random sample of approximately 1,000 general practitioners (GPs) per year. Data in Section 3.1 are derived from the BEACH survey, and an earlier survey undertaken in 1990–91. A brief description of the data and methods used in these collections is given below.
1990–91 data These data are drawn from the Australian Morbidity and Treatment Survey 1990–91 (AMTS). This one-year paper-based survey of doctor–patient encounters was the culmination of a number of studies undertaken by a group of researchers from the University of Sydney which explored and tested the methodology of research into general practice. These same methods have formed the basis of the BEACH survey. In the AMTS, a stratified (by state) random sample of 495 general practitioners recorded all consultations that took place in the surgery or in the patient’s home for two periods of 1 week, 6 months apart. The total data set contained 113,467 encounters, which were analysed in terms of type of consultation, patient reasons for encounter, problems managed and their treatments, tests, referrals and follow-up. A total of 167,002 problems were managed and 112,377 medications were prescribed or provided (Bridges-Webb et al. 1992).
Data for 1998–99 to 2001–02 These data are from the BEACH program, a continuous national study of general practice activity since 1998. The methods adopted in the BEACH program have been described in detail elsewhere (AIHW: Britt et al. 2002). In summary, each of the recognised GPs in an annual random sample of approximately 1,000 records details about 100 doctor–patient encounters of all types (for a detailed description of GPs ‘recognised’ by the Health Insurance Commission see AIHW: Britt et al. 1999: xxxvi.). The information is recorded on a structured encounter form (on paper). It is a rolling sample, being recruited approximately 3 weeks ahead. Approximately 20 GPs participate each week, 50 weeks a year. The source population includes all GPs who claimed a minimum of 375 general practice A1 Medicare items (items 1–51, 601, 602) in the most recently available three-month HIC data period. This equates with 1,500 Medicare claims a year and ensures inclusion of the majority of part-time GPs whilst excluding those who are not in private practice but claim for a few consultations a year. The General Practice Branch of the Australian Government Department of Health and Ageing (DoHA) draws the sample on a regular basis. The randomly selected GPs are approached initially by letter, then by telephone follow-up. GPs who agree to participate are set an agreed recording date approximately 3 to 4 weeks ahead. A research pack is sent to each participant about 10 days before their planned recording date. A telephone reminder is made to each participating GP in the first days of the agreed recording period. Non-returns are followed up by regular telephone calls.

78
Statistical methods In the analysis of the BEACH database the encounter is the primary unit of analysis. Proportions (%) are only used when describing the distribution of an event that can arise only once at a consultation (e.g. age, sex or item numbers) or to describe the distribution of events within a class of events (e.g. problem A as a per cent of total problems). Rates per 100 encounters are used when an event can occur more than once at the consultation (e.g. patient reasons for encounter, problems managed or medications). Rates per 100 problems are also sometimes used when a management event can occur more than once per problem managed. In general, results present the number of observations (n), rate per 100 encounters and the 95% confidence intervals (CIs). The BEACH study is essentially a random sample of GPs, each providing data about a cluster of encounters, rather than a simple random sample of encounters. When a study design other than simple random sample is used, analytical techniques that consider the study design should be employed (Sayer 1999). In reporting BEACH results annually, the standard error calculations used in the 95% confidence intervals accommodate both the single-stage clustered study design and sample weighting according to Kish’s description of the formulae (Kish 1965). In annual analyses of results, post-stratification weighting is applied to the raw data before each year’s analysis to account for under representation of GPs in any particular group such as age, sex or activity level (AIHW: Britt et al. 2000:16).
Data elements in BEACH Information about the patient includes date of birth, sex, postcode of residence. Tick boxes are provided for health care card holder, Veterans’ Affairs white card holder, Veterans’ Affairs gold card holder, non-English speaking background, an Aboriginal person (self-identification) and Torres Strait Islander (self-identification). Space is provided for up to three patient reasons for encounter (RFEs). The content of the encounter is described in terms of the problems managed and the management techniques applied to each of these problems. Data elements include up to four diagnoses/problems. Tick boxes are provided to denote the status of each problem as new to the patient (if applicable) and if it was thought to be work-related. Management data for each problem include medications prescribed, over-the-counter medications advised and other medications supplied by the GP. Details for each medication comprise brand name, form (where required), strength, regimen, status (if new medication for this problem for this patient) and number of repeats. Non-pharmacological management of each problem includes counselling and procedures, new referrals, and pathology and imaging ordered.

79
References
ABS (Australian Bureau of Statistics) 1997. National Health Survey: summary of results. Cat. no. 4364.0. Canberra: ABS.
ABS 1999. Disability, ageing and carers: summary of findings Australia, 1998. Cat. no. 4430.0. Canberra: ABS.
ABS 2000. Population projections, Australia: 1999 to 2101. Cat. no. 3222.0. Canberra: ABS.
ABS 2002. Australian demographic statistics. Cat. no. 3101.0. Canberra: ABS.
ABS 2003. Australian demographic statistics. Cat. no. 3101.0. Canberra: ABS.
AIHW (Australian Institute of Health and Welfare) 2002. Residential aged care in Australia 2000–01: a statistical overview. AIHW Cat. no. AGE 22. Canberra: AIHW.
AIHW 2003a. Australia’s Welfare 2003. Canberra: AIHW.
AIHW 2003b. Residential aged care in Australia 2001–02: a statistical overview. AIHW Cat. no. AGE 29. Canberra: AIHW.
AIHW 2004a. Community Aged Care Packages census 2002. AIHW Cat. no. AGE 35. (Aged Care Statistics Series no. 17). Canberra: AIHW.
AIHW 2004b. Extended Aged Care at Home Census 2002: A report on the results of the census conducted in May 2002. AIHW Cat. no. AGE 33. (Aged Care Statistics Series no. 15). Canberra: AIHW.
AIHW 2004c. Health system expenditure on disease and injury in Australia 2000–01. AIHW Cat. no. HWE 26. Canberra: AIHW (Health and Welfare Expenditure Series no.19).
AIHW: Britt H, Miller G, Charles J, Knox S, Sayer GP, Valenti L, et al. 2000. General practice activity in Australia 1999–2000. AIHW Cat. no. GEP 5. Canberra: AIHW.
AIHW: Britt H, Sayer G, Miller G, Charles J, Scahill S, Horn F, et al. 1999. General practice activity in Australia 1998–1999. AIHW Cat No. GEP 2. Canberra: AIHW.
AIHW: Britt H, Miller G, Knox S, Charles J, Valenti L, Henderson J, et al. 2002. General practice activity in Australia 2001–02. AIHW Cat. no.GEP 10. Canberra: AIHW.
AIHW: GPSCU (General Practice Statistics and Classification Unit) 2002. SAND abstract no. 28 from the BEACH program: Alzheimer’s disease and dementia. Viewed 2 March 2004, <http://www.fmrc.org.au/beach.htm>.
AIHW: Mathers C, Vos T & Stevenson C 1999. The burden of disease and injury in Australia. AIHW Cat. no. PHE 17. Canberra: AIHW.
Bridges-Webb C, Britt H, Miles D, Neary S, Charles J & Traynor V 1992. Morbidity and treatment in general practice in Australia 1990–1991. Medical Journal of Australia 157 (19 October Spec Sup):S1–S56.
Brookmeyer R, Corrada M, Curriero F & Kawas C 2002. Survival following a diagnosis of Alzheimer disease. Archives of Neurology 59 (11):1764–7.
Corrada M, Brookmeyer T & Kawas C 1995. Sources of variability in prevalence rates of Alzheimer’s disease. International Journal of Epidemiology 24:1000–5.

80
Cuthbertson S, Lindsay-Smith E & Rosewarne R 1998. Review of the Resident Classification Scale. Aged and Community Care Evaluation Reports no. 36. Canberra: Department of Health and Family Services.
Dodge H, Shen C, Pandav R, DeKosky S & Ganguli M 2003. Functional transitions and active life expectancy associated with Alzheimer disease. Archives of neurology 60 (2):253–9.
DoHA (Department of Health and Ageing) 2003. Dementia–early diagnosis and the role of the GP. Health in-house (1 August 2003).
Henderson A & Jorm A 1998. Dementia in Australia. Aged and Community Care Service Development and Evaluation Report No. 35. Canberra: AGPS.
Hofman A, Rocca W, Brayne C, Breteler M, Clarke M, Cooper B, et al. 1991. The prevalence of dementia in Europe: a collaborative study of 1980–1990 findings. International Journal of Epidemiology 20:736–48.
Jorm A & Jolley D 1998. The incidence of dementia: a meta–analysis. Neurology 51:728–33.
Jorm A 2002. Prospects for the prevention of dementia. Australasian Journal on Ageing 21 (1):9–13.
Jorm A, Korten A & Henderson A 1987. The prevalence of dementia: a quantitative integration of the literature. Acta Psychiatrica Scandinavica 76:465–9.
Kish L 1965. Survey Sampling. New York: John Wiley & Sons.
LGC (Lincoln Gerontology Centre) 2002. Aged care assessment program national minimum data set report July 2000–June 2001. Melbourne: LGC.
Ojeda V, Mastaglia F & Kakulas B 1986. Causes of organic dementia: a necropsy survey of 60 cases. Medical Journal of Australia 145:69–71.
Ritchie K, Kildea D & Robine J 1992. The relationship between age and prevalence of senile dementia: a meta–analysis of recent data. International Journal of Epidemiology 21:763–9.
Rosewarne R 1999 unpublished. Profiling resident characteristics: consultancy technical final report. Canberra: Department of Health and Aged Care.
Rosewarne R, Opie J, Bruce A, Doyle C, Ward S & Sach J 1997. Care needs of people with dementia and challenging behaviour living in residential facilities: main report. Aged and Community Care Service Development and Evaluation Reports no. 30. Canberra: AGPS.
Sayer G 1999. Estimating and generalising with clustered sampling in general practice. Australian Family Physician 28:S32–S4.
WHO (World Health Organization Collaborating Centre for Drug Statistics Methodology) 1997. Anatomical Therapeutic Chemical (ATC) classification index with defined Daily Doses (DDDs) 1998 edn. Oslo: WHO.