Embed Size (px)
Citation preview

THE IMPACT OF COLLABORATION: THE VALUE OF UK MEDICAL RESEARCH TOEU SCIENCE AND HEALTH
Study co-funded by The Academy of Medical Sciences (AMS), Arthritis Research UK, the Association of Medical Research Charities (AMRC), the British Heart Foundation (BHF), Cancer Research UK (CRUK), the Medical Research Council (MRC), MQ: Transforming Mental Health and Wellcome.
Research byPeter Varnai, Maike Rentel, Anoushka Davé, Marika De Scalzi, Wia Timmerman, Cristina Rosemberg-Montes, Paul SimmondsTechnopolis Group (May 2017)
APPENDICES

2
CONTENTS
APPENDIX A METHODOLOGY 3
APPENDIX B LIST OF INTERVIEWEES 9
APPENDIX C RESEARCH INFRASTRUCTURE SUPPLEMENTARY DATA 12
APPENDIX D SUPPLEMENTARY CLINICAL TRIALS DATA 17
APPENDIX E BIBLIOMETRIC ANALYSIS OF CITATION IMPACT 20
APPENDIX F SUPPLEMENTARY eCORDA DATA 22
APPENDIX G HESA SUPPLEMENTARY DATA 24
APPENDIX H RESEARCHFISH® SUPPLEMENTARY DATA 33
APPENDIX K EUROPEAN RESEARCH COUNCIL GRANTS 39
APPENDIX L BIBLIOMETRIC ANALYSIS OF EU NATIONAL HEALTH ADVISORY COMMITTEE MEMBERS 44
ENDNOTES 48
The report together with the appendices, case studies and executive summary are available at cruk.org/UKandEUresearch

3
APPENDIX A METHODOLOGY
A.1 Desk researchDesk research included firstly a review of existing literature (both peer reviewed and grey literature) demonstrating the contribution of UK medical research to the EU member states and secondly identifying suitable data sources for original analyses to address the research questions set out for this study. Desk research was also conducted to inform the interviews and case studies.
A.2 Interviews
A.2.1 Scoping interviews
We conducted scoping interviews with representatives of UK medical research funders (eg MRC and Wellcome Trust) as well as key researcher leaders in specific disease types (both in the UK and in EU). This allowed us to obtain additional context on the UK’s role and contribution in EU member states. We also enquired about data sources to address the research questions (including internally-held data), suggestions for case studies illustrating the UK’s contribution to the EU research community and patients.
A.2.2 Stakeholder interviews
Primary data was collected through 28 semi-structured interviews. The qualitative interviews were carried out in order to test emerging insights from the desk research, as well as to gather existing perceptions from a diverse set of high-level, senior stakeholders regarding the value of UK medical research for the EU. We focused on five EU member states (Germany, France, Italy, Netherlands and Poland), as well as key individuals linked to medical research in pan-European organisations. Interviewees were selected by a) the type of stakeholder, b) the disease area or country where relevant, and c) gaps in the information needed to answer the evaluation questions. The interviews were conducted by phone and permission was obtained from interviewees prior to including attributable quotes in the report.
A.3 Case studiesIn order to illustrate the UK’s contribution to EU science and policy, we developed a set of eight short case studies. These were chosen to highlight different aspects of this study, with the aim of covering each broad area: education, expertise and research facilities, EU national health and benefit to patients, and pan-EU trials. In addition, four case studies concentrated on unique UK contribution in the fields of cancer, cardiovascular diseases, mental health and musculoskeletal conditions.
The cases studies were predominantly based on desk research, with some additional input from focussed interviews with key stakeholders with in-depth knowledge of the impact of the research in EU member states.
A.4 Data analysis Data were obtained from online databases or individual institutions, and analysed with a focus on EU member states, particularly France, Germany, Italy, the Netherlands and Poland, and on four disease areas, namely cancer, cardiovascular diseases, mental health and musculoskeletal
4
conditions. Data concerning REF impact case studies and EU clinical trials were obtained from the relevant online databases. Case studies and clinical trials relevant to specific disease areas were identified using keywords. The package “ctrdata” was used with the R system to download and analyse trials from the European Union Clinical Trials Register. To aid analysis, the downloaded trial data was converted to a Microsoft Excel compatible format with the use of the MongoDB data programme and Python coding.
User and trainee data were obtained directly from UK research facilities either in aggregated form for EU member states minus the UK or disaggregated by country and year. Average yearly data were presented as proportion of total users or trainees from all EU member states excluding those from the UK.
A.5 Bibliometric analysis: definition of medical research
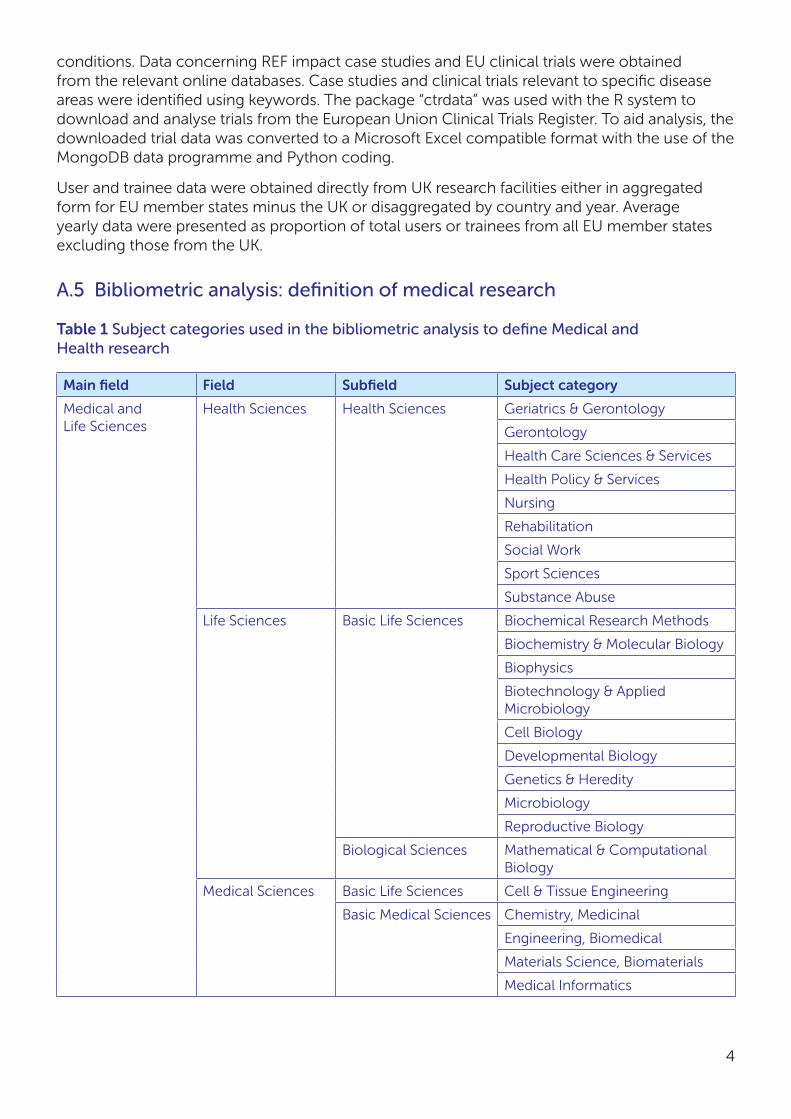
Table 1 Subject categories used in the bibliometric analysis to define Medical and Health research
Main field Field Subfield Subject category
Medical and Life Sciences
Health Sciences Health Sciences Geriatrics & Gerontology
Gerontology
Health Care Sciences & Services
Health Policy & Services
Nursing
Rehabilitation
Social Work
Sport Sciences
Substance Abuse
Life Sciences Basic Life Sciences Biochemical Research Methods
Biochemistry & Molecular Biology
Biophysics
Biotechnology & Applied Microbiology
Cell Biology
Developmental Biology
Genetics & Heredity
Microbiology
Reproductive Biology
Biological Sciences Mathematical & Computational Biology
Medical Sciences Basic Life Sciences Cell & Tissue Engineering
Basic Medical Sciences Chemistry, Medicinal
Engineering, Biomedical
Materials Science, Biomaterials
Medical Informatics

5
Main field Field Subfield Subject category
Medical and Life Sciences
Medical Sciences Biomedical Sciences Anatomy & Morphology
Immunology
Integrative & Complementary Medicine
Medical Laboratory Technology
Medicine, Research & Experimental
Neuroimaging
Neurosciences
Pharmacology & Pharmacy
Physiology
Radiology, Nuclear Medicine & Medical Imaging
Toxicology
Virology
Clinical Medicine Allergy
Andrology
Anesthesiology
Audiology & Speech-Language Pathology
Cardiac & Cardiovascular Systems
Clinical Neurology
Critical Care Medicine
Dentistry/Oral Surgery & Medicine
Dermatology
Emergency Medicine
Endocrinology & Metabolism
Gastroenterology & Hepatology
Hematology
Infectious Diseases
Medicine, General & Internal
Obstetrics & Gynecology
Oncology
Ophthalmology
Orthopedics
Otorhinolaryngology
Parasitology
Pathology
Pediatrics
Peripheral Vascular Disease

6
Main field Field Subfield Subject category
Medical and Life Sciences
Medical Sciences Clinical Medicine Primary Health Care
Psychiatry
Public, Environmental & Occupational Health
Respiratory System
Rheumatology
Surgery
Transplantation
Tropical Medicine
Urology & Nephrology
Multidisciplinary Journals
Multidisciplinary Journals
Multidisciplinary Journals
Multidisciplinary Sciences
Social and Behavioral Sciences
Social Sciences Psychology Psychology, Applied
Psychology, Biological
Psychology, Clinical
Psychology, Developmental
Psychology, Experimental
Psychology, Mathematical
Psychology, Multidisciplinary
Psychology, Psychoanalysis
Psychology, Social
Social and Behavioral Sciences, Interdisciplinary
Social Sciences, Biomedical
Source: Technopolis and CWTS, Leiden University; data source: Web of Science core collection Clarivate Analytics

7
APPENDIX B LIST OF INTERVIEWEES
Name Affiliation Country
Professor Celso Arango President of The European College of Neuropsychopharmacology (ECNP); Hospital General Universitario Gregorio Marañón, Universidad Complutense, CIBERSAM, Madrid
Spain
Dr Edvard Beem Co-Director, The Netherlands Organisation for Health Research and Development (ZonMW)
The Netherlands
Professor Francis Berenbaum
Chair of Rheumatology, Faculty of Medicine, University Pierre and Marie Curie Paris
France
Professor Johannes Bijlsma
President-Elect of the European League Against Rheumatism (EULAR); Professor of Rheumatology and Clinical Immunology, University Medical Center Utrecht
The Netherlands
Professor Jean-Pierre Bourguignon
President of the European Research Council (ERC)
European organisation
Professor Leena Bruckner-Tuderman
Vice President of the Deutsche Forschungsgemeinschaft (DFG); Professor of Dermatology, Albert-Ludwigs-University of Freiburg
Germany
Dr Virginie Bros-Facer Research Infrastructure Project Manager, EURORDIS – Rare Diseases Europe
European organisation
Dr Erika Buitenhuis Teammanager Research, Dutch Heart Foundation
The Netherlands
Professor Bernard Charpentier
President of the Federation of European Academies of Medicine (FEAM); Emeritus Professor of Medicine, University of Paris Sud
European organisation
Magda Chlebus Director of Science Policy at the European Federation of Pharmaceutical Industries and Associations (EFPIA)
European organisation
Professor Detlev Ganten German National Academy of Sciences Leopoldina; President, World Health Summit; Charité – Universitätsmedizin Berlin
Germany
Professor Bill Hansson Vice President, Biology and Medicine Section, Max Planck Society
Germany
Professor Liselotte Højgaard
Chair of the Advisory Group on Health for H2020; Former Chair of the European Medical Research Council; Professor in Medicine and Technology, University of Copenhagen
Denmark

8
Name Affiliation Country
Dr Frank Hulstaert Senior Researcher, Belgian Health Care Knowledge Centre (KCE), Brussels
Belgium
Professor Dipak Kalra President of the European Institute for Health Records (EuroRec)
European organisation
Dr Giovanni Leonardi Director General of Research and Innovation in Healthcare, Ministry of Health
Italy
Professor Adriana Maggi Department of Pharmacological and Biomolecular Sciences, University of Milan
Italy
Professor Iain Mattaj Director General, European Molecular Biology Laboratory (EMBL) Heidelberg
Germany
Dr Pierre Meulien Executive Director, Innovative Medicines Initiative (IMI)
European organisation
Professor Andreas Meyer-Lindenberg
Director of the Central Institute of Mental Health, University of Mannheim
Germany
Dr Hubert Misslisch Coordinator ‘International Cooperations’, DLR Project Management Agency, Health Research, on behalf of the Federal Ministry of Education and Research
Germany
Professor Peter Naredi President of the European Cancer Organisation (ECCO); Professor of Surgery, University of Gothenburg
Sweden
Professor Piotr Rutkowski Professor of Surgical Oncology, Maria Skłodowska-Curie Memorial Cancer Center and Institute of Oncology, Warsaw
Poland
Professor Jos van den Meer
Professor of Medicine, Radboud University Medical Center, Nijmegen
The Netherlands
Professor Wiek van Gilst Head of Experimental Cardiology, University Medical Center Groningen
The Netherlands
Dr Bonnie Wolff-Boenisch Head of Research Affairs, Science Europe European organisation
Programme Officer Non-governmental organisation Poland
Senior representative Pharmaceutical industry Poland

9
APPENDIX C RESEARCH INFRASTRUCTURE SUPPLEMENTARY DATA
C.1 Health Protection Agency Culture CollectionsTable 2 National Collection of Type Cultures (requests in 2016)
Number of ampoules sold
Country Direct sales
Argenta Star Ecotronics
Medisell Normax Dicoex ProMedia
Australia 4
Austria 10
Belgium 10
Canada 2
Chile 6
China 14
Croatia 13
Cyprus 0 8
Czech Republic 3
Denmark 42
Finland 7
France 11
Germany 57
Hungary 3
India 7
Iran, Islamic Republic of 2
Iraq 1
Ireland 88
Israel 17
Italy 11 5
Japan 48
Jordan 1
Kenya 11
Korea, Republic of 8
Lebanon 4
Netherlands 6
New Zealand 2
Pakistan 1
Peru 1
Philippines 1
Poland 1 11
Romania 1

10
Number of ampoules sold
Country Direct sales
Argenta Star Ecotronics
Medisell Normax Dicoex ProMedia
Russian Federation 16
Rwanda 1
Slovenia 3
Spain 8 1
Sweden 3
Switzerland 38
Taiwan 11
United Arab Emirates 23
United Kingdom 1,136
United States 115
Figure 1: European Collection of Authenticated Cell Cultures sales
Nu
mb
er o
f S
igm
a sa
les
1,528
0
100
200
300
400
500
600
700
UKCHSEESPTNONLLUITIEISGRDEFRFIDKBEAT
2015 2016
Country
Table 2 (cont)

11
C.2 Cohort user statisticsFigure 2: 1958 cohort data downloads by EU country and year, 2009-2016 (excl UK)
Table 3 National Survey of Health and Development enquiries by country and year
Country 2012 2013 2014 2015 2016 Total
Denmark 0 3 1 1 0 5
Finland 1 1 0 0 0 2
France 0 4 0 0 0 4
Germany 0 1 0 0 0 1
Ireland 1 0 0 0 0 1
the Netherlands 0 1 0 2 1 4
Norway 0 0 0 0 0 0
Poland 0 0 0 0 0 0
Sweden 0 0 1 0 1 2
UK 56 58 48 43 49 254
Rest of the World 15 9 13 5 11 53
Total 73 77 63 51 62 326
(Country of enquiry was not collected in data sharing database until 2012)
0
100
200
300
400
500
600
Nu
mb
er o
f d
ow
nlo
ads
2011 2012
Country
SEESROPTPLNONLITIEHUDEFIDKCZHRBGBEAT FR CH
2009 2010 2014 20162013 2015

12
Table 4 UK Biobank user data by country and year
Year of project approval
Country 2012 2013 2014 2015 2016 Total
Belgium 0 0 0 0 1 1
Denmark 0 0 0 0 1 1
Estonia 0 0 0 1 1 2
France 0 0 1 0 1 2
Germany 0 0 0 0 1 1
Greece 0 0 0 0 1 1
Ireland 0 0 0 0 1 1
Italy 0 0 0 0 0 0
Netherlands 3 1 0 2 2 8
Norway 0 0 0 0 1 1
Poland 0 0 0 0 0 0
Spain 0 0 0 1 1 2
Sweden 0 1 1 2 3 7
Switzerland 0 0 0 0 1 1
UK 8 23 26 58 61 176
Rest of world 0 2 3 19 39 63
Total 11 27 31 83 115 267

13
Tab
le 5
Cry
o c
ou
rse
atte
nd
ees
by
cou
ntr
y an
d y
ear
Co
un
try
20
04
20
05
20
06
20
07
20
08
20
09
20
102
011
20
122
013
20
142
015
20
16To
tal
Au
stri
a0
00
00
00
00
00
01
1
Bel
giu
m0
00
00
00
00
00
01
1
Cze
ch R
epu
blic
00
00
02
00
10
00
14
Den
mar
k0
00
11
00
00
00
00
2
Fin
lan
d0
00
00
30
10
00
00
4
Fran
ce0
01
00
00
00
00
01
2
Ger
man
y1
10
02
00
10
00
13
9
Irel
and
00
00
00
10
10
00
02
Ital
y0
00
10
00
00
01
00
2
Net
her
lan
ds
00
00
10
20
11
10
06
Po
lan
d0
00
00
01
00
00
00
1
Po
rtu
gal
00
00
00
00
00
00
11
Slo
ven
ia0
01
00
00
00
00
00
1
Spai
n0
20
00
00
00
00
00
2
Swed
en0
01
01
00
10
00
00
3
Swit
zerl
and
00
10
00
00
41
00
06
Un
ited
Kin
gd
om
43
58
712
47
59
33
979
Res
t o
f th
e W
orl
d
00
11
10
00
00
12
28
Tota
l5
610
1113
178
1012
116
619
134
C.3 Mary Lyon Centre user data
14
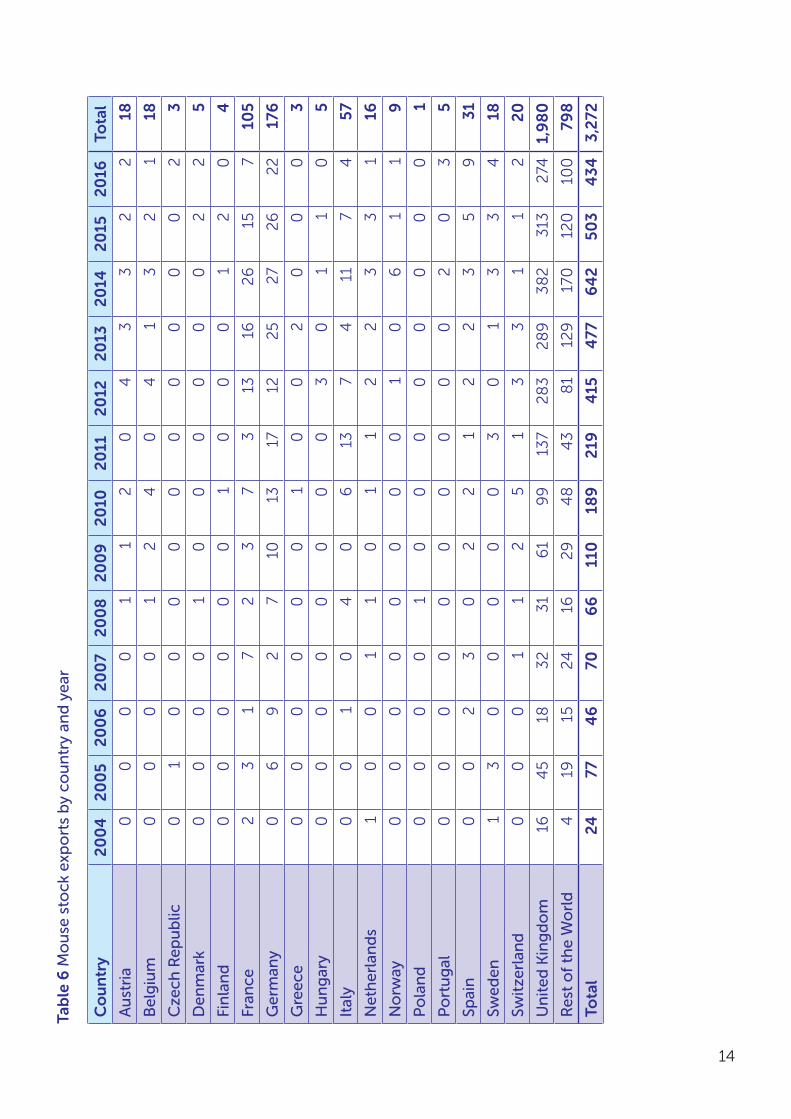
Tab
le 6
Mo
use
sto
ck e
xpo
rts
by
cou
ntr
y an
d y
ear
Co
un
try
20
04
20
05
20
06
20
07
20
08
20
09
20
102
011
20
122
013
20
142
015
20
16To
tal
Au
stri
a0
00
01
12
04
33
22
18
Bel
giu
m0
00
01
24
04
13
21
18
Cze
ch R
epu
blic
01
00
00
00
00
00
23
Den
mar
k0
00
01
00
00
00
22
5
Fin
lan
d0
00
00
01
00
01
20
4
Fran
ce2
31
72
37
313
162
615
710
5
Ger
man
y0
69
27
1013
1712
25
27
26
22
176
Gre
ece
00
00
00
10
02
00
03
Hu
ng
ary
00
00
00
00
30
11
05
Ital
y0
01
04
06
137
411
74
57
Net
her
lan
ds
10
01
10
11
22
33
116
No
rway
00
00
00
00
10
61
19
Po
lan
d0
00
01
00
00
00
00
1
Po
rtu
gal
00
00
00
00
00
20
35
Spai
n0
02
30
22
12
23
59
31
Swed
en1
30
00
00
30
13
34
18
Swit
zerl
and
00
01
12
51
33
11
22
0
Un
ited
Kin
gd
om
164
518
32
31
61
99
137
28
32
89
38
23
132
741,
98
0
Res
t o
f th
e W
orl
d
419
1524
162
94
84
38
112
917
012
010
079
8
Tota
l24
774
670
66
110
189
219
415
477
64
250
34
343,
272

15
C.4 Wellcome Trust Sanger InstituteFigure 3: Advanced courses attendees (EU = EU27)
Per
cen
tag
e (%
)
570 685
595 610 670
185 160 155
0
10
20
30
40
50
60
70
80
90
100
2016/2015/2014/2013/2012/2011/2010/2009/2008/2007/
UK delegates EU delegates International
739
542
637
1,020
560
716
1,115
649
713
1,197
764
801
1,476
669
925
1,133
586
535
1,348
657
746
1,783
824
908
1,528
709
724
1,465
783
819
16
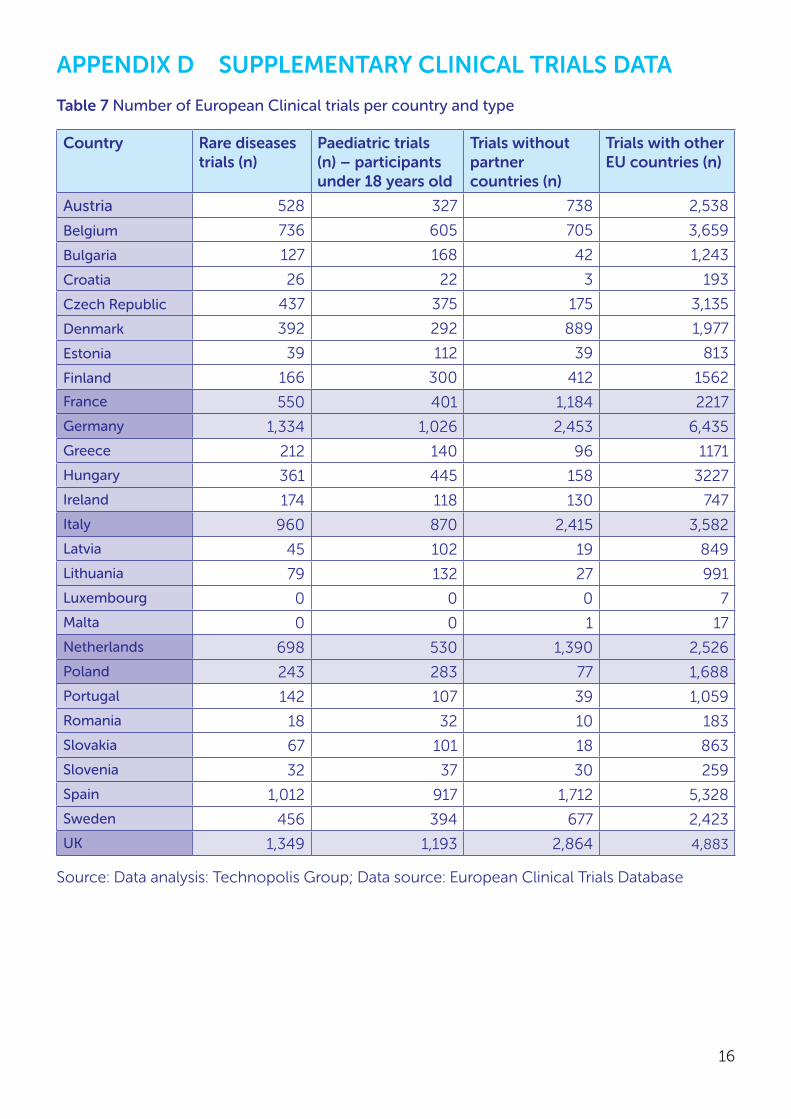
APPENDIX D SUPPLEMENTARY CLINICAL TRIALS DATA
Table 7 Number of European Clinical trials per country and type
Country Rare diseases trials (n)
Paediatric trials (n) – participants under 18 years old
Trials without partner countries (n)
Trials with other EU countries (n)
Austria 528 327 738 2,538
Belgium 736 605 705 3,659
Bulgaria 127 168 42 1,243
Croatia 26 22 3 193
Czech Republic 437 375 175 3,135
Denmark 392 292 889 1,977
Estonia 39 112 39 813
Finland 166 300 412 1562
France 550 401 1,184 2217
Germany 1,334 1,026 2,453 6,435
Greece 212 140 96 1171
Hungary 361 445 158 3227
Ireland 174 118 130 747
Italy 960 870 2,415 3,582
Latvia 45 102 19 849
Lithuania 79 132 27 991
Luxembourg 0 0 0 7
Malta 0 0 1 17
Netherlands 698 530 1,390 2,526
Poland 243 283 77 1,688
Portugal 142 107 39 1,059
Romania 18 32 10 183
Slovakia 67 101 18 863
Slovenia 32 37 30 259
Spain 1,012 917 1,712 5,328
Sweden 456 394 677 2,423
UK 1,349 1,193 2,864 4,883
Source: Data analysis: Technopolis Group; Data source: European Clinical Trials Database
17
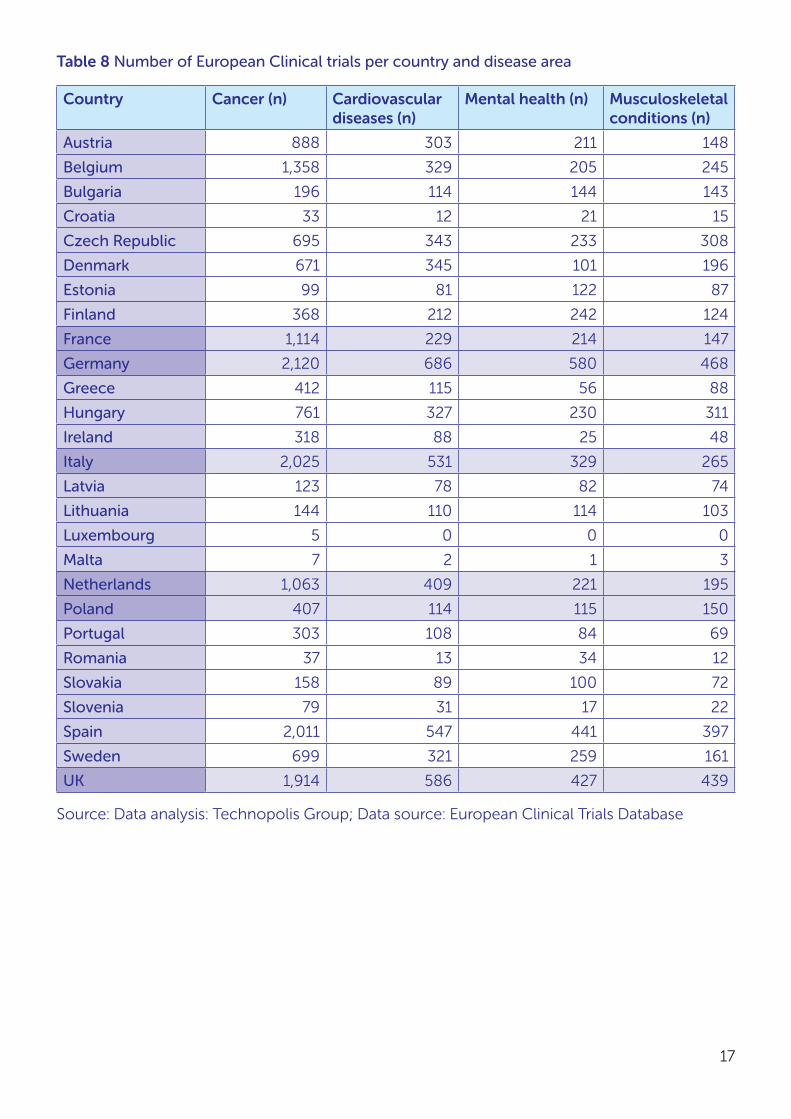
Table 8 Number of European Clinical trials per country and disease area
Country Cancer (n) Cardiovascular diseases (n)
Mental health (n) Musculoskeletal conditions (n)
Austria 888 303 211 148
Belgium 1,358 329 205 245
Bulgaria 196 114 144 143
Croatia 33 12 21 15
Czech Republic 695 343 233 308
Denmark 671 345 101 196
Estonia 99 81 122 87
Finland 368 212 242 124
France 1,114 229 214 147
Germany 2,120 686 580 468
Greece 412 115 56 88
Hungary 761 327 230 311
Ireland 318 88 25 48
Italy 2,025 531 329 265
Latvia 123 78 82 74
Lithuania 144 110 114 103
Luxembourg 5 0 0 0
Malta 7 2 1 3
Netherlands 1,063 409 221 195
Poland 407 114 115 150
Portugal 303 108 84 69
Romania 37 13 34 12
Slovakia 158 89 100 72
Slovenia 79 31 17 22
Spain 2,011 547 441 397
Sweden 699 321 259 161
UK 1,914 586 427 439
Source: Data analysis: Technopolis Group; Data source: European Clinical Trials Database

18
APPENDIX E BIBLIOMETRIC ANALYSIS OF CITATION IMPACT
Citation analysis was conducted by CWTS, Leiden University, using the Web of Science core collection Clarivate Analytics for publication data in the ‘Medical and Health’ research fields between 2005 and 2014.
Table 9 The effect of collaboration between UK and EU26 countries or five individual EU member states on the citation impact of medical and health research publications (2005-2014)
Country Collaboration type
Number of publications
Mean Normalised Citation Score
Proportion of the top 10% most cited publications in the area
EU26 EU26 - UK 486,105 1.37 0.15
UK - EU26 104,648 1.6 0.18
UK + EU 122,995 1.98 0.22
France FR - UK 93,645.5 1.49 0.17
UK - FR 203,052 1.69 0.19
UK + FR 24,591.5 2.78 0.31
Germany DE - UK 150,650 1.45 0.16
UK - DE 191,137 1.69 0.19
UK + DE 36,506.8 2.43 0.27
Italy IT - UK 79,540.3 1.47 0.17
UK - IT 203,109 1.72 0.2
UK + IT 24,534.8 2.5 0.28
Netherlands NL - UK 67,783.3 1.6 0.19
UK - NL 203,393 1.71 0.2
UK + NL 24,250.5 2.58 0.29
Poland PL - UK 16,136.5 1.2 0.12
UK - PL 223,108 1.78 0.2
UK + PL 4,535 2.84 0.29
Source: Data analysis conducted by CWTS, Leiden University, Data source: Web of Science core collection Clairvate Analytics

19
Table 10 The effect of collaboration between UK and EU26 countries on the citation impact of publications (2005-2014) in medical and health research or in four individual disease/research area
Disease/ research area
Collaboration type
Number of publications
Mean Normalised Citation Score
Proportion of the top 10% most cited publications in the area
All medical and health research
EU26 - UK 486,105 1.37 0.15
UK - EU26 104,648 1.6 0.18
UK + EU 122,995 1.98 0.22
Cancer EU26 - UK 34,593.5 1.58 0.18
UK - EU26 5,303.5 1.81 0.22
UK + EU 8,666.25 2.25 0.26
Cardiovascular diseases
EU26 - UK 18,919.3 1.59 0.2
UK - EU26 2,716.75 1.6 0.19
UK + EU 5,488.25 2.14 0.27
Musculoskeletal conditions
EU26 - UK 9,171.5 1.29 0.14
UK - EU26 1,928.5 1.39 0.16
UK + EU 2,787.5 2.13 0.23
Public, environmental and occupational health
EU26 - UK 18,570 1.13 0.11
UK - EU26 7,974.5 1.44 0.15
UK + EU 6,097.25 1.62 0.18
Source: Data analysis conducted by CWTS, Leiden University, Data source: Web of Science core collection Clairvate Analytics

20
APPENDIX F SUPPLEMENTARY eCORDA DATA
Data analysis conducted by the MRC Information and Analysis Team and Technopolis Group.
Table 11 Participation in health-related projects in Framework Programme 7 (FP7) and Horizon 2020
FP7 Horizon 2020
Projects Participations EU Contribution (in EUR million)
Projects Participations EU Contribution (in EUR million)
UK 755 1708 808.8 280 600 416.3
Germany 719 1735 779.2 256 508 279.8
France 553 1079 486.9 191 354 186.7
Italy 473 941 351.1 206 365 135.7
Netherlands 512 907 478.4 208 406 244.2
Poland 102 119 24.4 46 49 13.3
Grand Total (all countries)
1,006 11,528 4,785.8 633 4,270 2,035.6
Source: eCORDA iSearch (March 2017). Note that projects for individual countries are defined as the number of signed grant agreements with at least one participant from that country. The grand total represents all health-related projects funded in the respective programmes; projects are assigned to multiple countries and hence project numbers do not add up to the grant total.
Table 12 Percentage participation in health-related projects in Framework Programme 7 (FP7) and Horizon 2020
FP7 Horizon 2020
Percentage of all projects
Percentage of all participations
Percentage of EU Contribution (%)
Percentage of all projects
Percentage of all participations
Percentage of EU Contribution (%)
UK 75% 15% 17% 44% 14% 20%
Germany 71% 15% 16% 40% 12% 14%
France 55% 9% 10% 30% 8% 9%
Italy 47% 8% 7% 33% 9% 7%
Netherlands 51% 8% 10% 33% 10% 12%
Poland 10% 1% 1% 7% 1% 1%
Source: eCORDA iSearch (March 2017). Note that percentage of projects for individual countries are defined as the number of signed grant agreements with at least one participant from that country, out of the grand total of all health-related projects in the respective programmes; projects are assigned to multiple countries and hence percentage of projects do not add up to 100%.

21
Table 13 EU contribution to health-related projects relative to overall research base [FTE, full time equivalent]
EU Contribution to Framework Programme 7 & Horizon 2020 (in EUR million)
Researchers (FTE) (average for the period 2007-2014)
EU Contribution per 1000 researchers (EUR million)
UK 1,225.1 256,072 4.8
Germany 1,059.0 326,338 3.2
France 673.6 243,116 2.8
Italy 486.8 103,863 4.7
Netherlands 722.6 59,098 12.2
Poland 37.7 64,489 0.6
Source: Data analysis by MRC Information and Analysis Team and Technopolis Group; data source: eCORDA iSearch (March 2017) and Eurostat (total number or researchers FTE, [rd_p_persocc])

22
APPENDIX G HESA SUPPLEMENTARY DATA
Higher education data in the UK is collected by the Higher Education Statistics Agency (HESA). HESA student data was accessed and analysed via the HEIDI portal by the MRC Information and Analysis team.
Full person equivalent (FPE) counts were chosen for all data extracted. Figures are rounded by each UK institution and so aggregates will be over-stated. ‘Other EU’ refers to all EU member states except the UK.
A description of the data captured by HESA, definition of FPE, nationality and domicile can be found at https://www.hesa.ac.uk/support/definitions/students.
Table 14 Total population of students (‘stock’), broken down by domicile (residence immediately before taking up study)
UK % Other EU
% Non-EU % Not known
% Total
2012/13 1,915,015 82% 125,290 5% 299,970 13% 2,340,275
2013/14 1,863,860 81% 125,300 5% 310,195 13% 2,299,355
2014/15 1,829,195 81% 124,575 5% 312,010 14% 295 0% 2,266,075
Table 15 Total number/proportion of qualifiers, by domicile
UK % Other EU
% Non-EU % Not known
% Total
2012/13 593,640 75% 50,330 6% 143,930 18% 787,900
2013/14 580,895 75% 49,055 6% 147,850 19% 777,800
2014/15 544,665 73% 47,250 6% 152,975 21% 115 0% 744,890

23
G.1 Students in the UK, subjects relevant to biomedicineHESA uses the Joint Academic Coding System (JACS) system to classify academic subjects. A JACS code for a single subject consists of a letter and three numbers; there are 164 codes. 24 JACS principal subject codes were selected as relevant to biomedical research:
(A0) Broadly-based programmes within medicine & dentistry
(A1) Pre-clinical medicine
(A2) Pre-clinical dentistry
(A3) Clinical medicine
(A4) Clinical dentistry
(A9) Others in medicine & dentistry
(B0) Broadly-based programmes within subjects allied to medicine
(B1) Anatomy, physiology & pathology
(B2) Pharmacology, toxicology & pharmacy
(B3) Complementary medicines, therapies & well-being
(B4) Nutrition
(B5) Ophthalmics
(B6) Aural & oral sciences
(B8) Medical technology
(B9) Others in subjects allied to medicine
(C0) Broadly-based programmes within biological sciences
(C4) Genetics
(C5) Microbiology
(C7) Molecular biology, biophysics & biochemistry
(C8) Psychology
(C9) Others in biological sciences
(D1) Pre-clinical veterinary medicine
(D2) Clinical veterinary medicine & dentistry
(I5) Health informatics
Students enrolled at UK institutions (all years)
Table 16 Total stock (students in any year of their course) with studies relevant to biomedicine, by domicile
UK % Other EU
% Non-EU % Not known
% Total
2012/13 281,705 87% 15,415 5% 25,675 8% 0% 322,795
2013/14 281,720 87% 15,690 5% 27,010 8% 0% 324,420
2014/15 281,365 87% 16,005 5% 27,765 9% 10 0% 325,145

24
Table 17 Stock biomedical postgraduate students, by domicile
UK % Other EU
% Non-EU % Not known
Total Population
2012/13 65,730 78% 6,275 7% 11,905 14% - 83,910
2013/14 65,230 77% 6,495 8% 12,575 15% - 84,300
2014/15 65,885 77% 6,590 8% 13,030 15% 5 85,510
Figure 4 Stock biomedical postgraduate students, by domicile
Nu
mb
er o
f st
ud
ents
Figure 22
0
10,000
20,000
30,000
40,000
50,000
60,000
70,000
80,000
90,000
2014/152013/142012/13
65,730 65,230 65,885
6,275 6,495 6,590
11,905 12,575 13,030
Non-EU
Other EU
UK

25
Table 18 Stock biomedical undergraduate students, by domicile
UK % Other EU
% Non-EU % Total Population
2012/13 215,955 90% 9,125 4% 13,775 6% 238,855
2013/14 216,455 90% 9,210 4% 14,450 6% 240,115
2014/15 215,470 90% 9,410 4% 14,725 6% 239,605
Figure 5 Stock biomedical undergraduate students, by domicile
0
50,000
100,000
150,000
200,000
250,000
2014/152013/142012/13
Nu
mb
er o
f st
ud
ents
215,955 216,455 215,470
9,125 9,210 9,41013,775 14,450 14,725
Non-EU
Other EU
UK
26
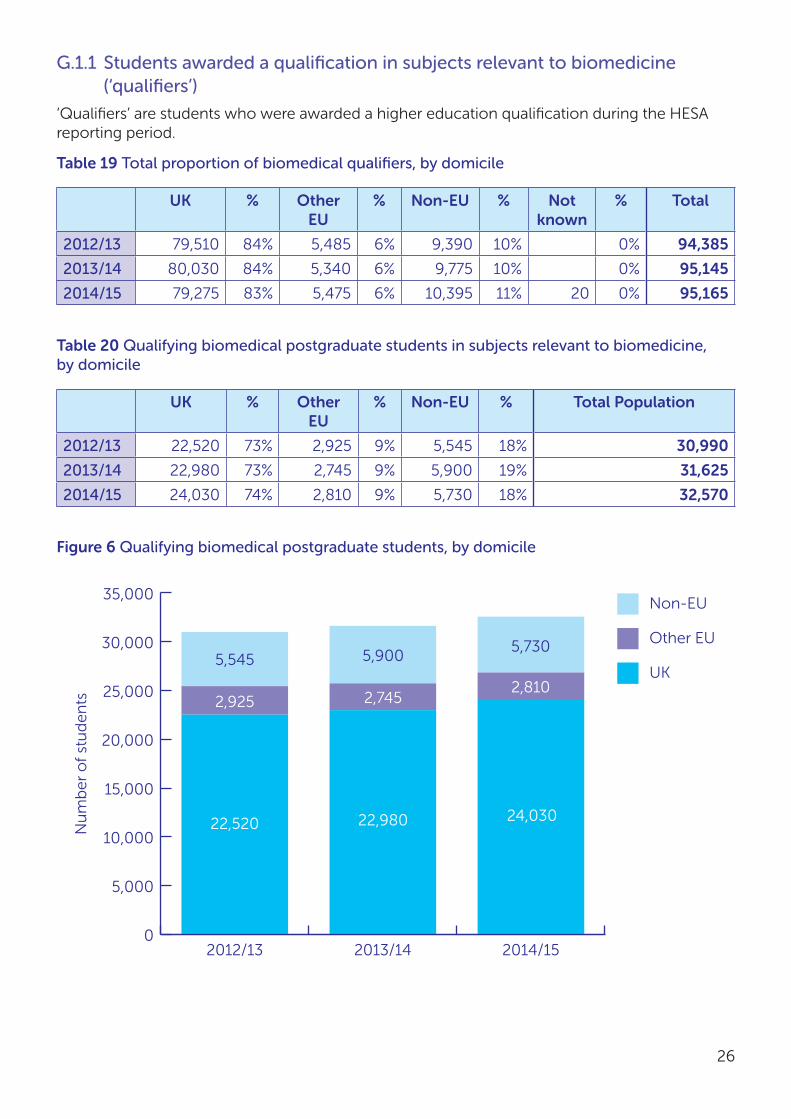
G.1.1 Students awarded a qualification in subjects relevant to biomedicine (‘qualifiers’)
‘Qualifiers’ are students who were awarded a higher education qualification during the HESA reporting period.
Table 19 Total proportion of biomedical qualifiers, by domicile
UK % Other EU
% Non-EU % Not known
% Total
2012/13 79,510 84% 5,485 6% 9,390 10% 0% 94,385
2013/14 80,030 84% 5,340 6% 9,775 10% 0% 95,145
2014/15 79,275 83% 5,475 6% 10,395 11% 20 0% 95,165
Table 20 Qualifying biomedical postgraduate students in subjects relevant to biomedicine, by domicile
UK % Other EU
% Non-EU % Total Population
2012/13 22,520 73% 2,925 9% 5,545 18% 30,990
2013/14 22,980 73% 2,745 9% 5,900 19% 31,625
2014/15 24,030 74% 2,810 9% 5,730 18% 32,570
Figure 6 Qualifying biomedical postgraduate students, by domicile
0
5,000
10,000
15,000
20,000
25,000
30,000
35,000
2014/152013/142012/13
Nu
mb
er o
f st
ud
ents
Non-EU
Other EU
UK
22,520 22,980 24,030
2,925 2,7452,810
5,545 5,9005,730

27
Table 21 Qualifying biomedical undergraduate students, by domicile
UK % of total in this table
Other EU % of total in this table
Non-EU % of total in this table
Total
2012/13 57010 90% 2550 4% 3455 5% 63015
2013/14 57040 90% 2570 4% 3875 6% 63485
2014/15 55260 89% 2655 4% 3890 6% 61805
Figure 7 Qualifying biomedical undergraduate students, by domicile
50,000
52,000
54,000
56,000
58,000
60,000
62,000
64,000
2014/152013/142012/13
Nu
mb
er o
f st
ud
ents
57,010 57,04055,260
2,550 2,570
2,655
3,455 3,875
3,890
Non-EU
Other EU
UK

28
G.1.2 Destinations of Leavers from Higher Education (DLHE) survey
HESA carries out the Destinations of Leavers from Higher Education (DLHE) survey, which collects information on what all ‘leavers’ from higher education (HE) programmes are doing six months after qualifying from their course. The number of qualifiers contacted by HESA is lower than the total number of qualifiers (76% in 2014/15). This is referred to as the “target” population.
The approach of the DHLE survey is explained further, with results from 2012/13, at https://www.hesa.ac.uk/data-and-analysis/publications/destinations-2012-13/introduction.
Target population
77% of the target population provided responses, which represents approximately 60% of all qualifiers in subjects relevant to biomedicine (“respondents”).
Table 22 Total (target) population for subject codes relevant to biomedicine, by domicile
UK % of total Other EU % of total Total % of all qualifiers
2012/13 68,480 93% 4,825 7% 73,305 78%
2013/14 69,375 94% 4,735 6% 74,110 78%
2014/15 67,885 93% 4,905 7% 72,790 76%
Table 23 Respondents for subject codes relevant to biomedicine, by domicile
UK % of total Other EU % of total Total % of total target
population
2012/13 53,205 95% 3,000 5% 56,205 77%
2013/14 54,125 95% 2,915 5% 57,040 77%
2014/15 52,930 94% 3,125 6% 56,055 77%
Table 24 Postgraduate, undergraduate (first degree) and other undergraduates in respondents relevant to biomedicine
Postgraduate First degree Other undergraduate
Total
2012/13 13,740 37,005 5,465 56,205
2013/14 14,005 38,610 4,415 57,040
2014/15 14,730 36,975 4,355 56,055

29
Postgraduate respondents
Table 25 Locations of employment for postgraduate students relevant to biomedicine with previous other EU-domicile
UK % of total
Other EU
% of total
non-EU
% of total
not employed
% of total
not known
Total
2012/13 510 35% 455 31% 75 5% 415 28% 5 1,460
2013/14 505 37% 415 30% 70 5% 375 27% 5 1,370
2014/15 595 40% 415 28% 55 4% 420 28% 15 1,500
Figure 8 Locations of employment for postgraduate students relevant to biomedicine with previous other EU-domicile
0
10
20
30
40
50
60
70
80
90
100
2014/152013/142012/13
Per
cen
tag
e (%
)
Not known
Not employed
Non-EU
Other EU
UK
Figure 20
510 505 595
415 375 420
455 415 415
75 70 55

30
Figure 9 Destinations of postgraduate students relevant to biomedicine with previous other EU-domicile (2014/15)
Undergraduate respondents
Table 26 Locations of employment for undergraduate students relevant to biomedicine with previous other EU-domicile
UK % of total
Other EU
% of total
non-EU
% of total
not employed
% of total
not known
Total
2012/13 615 43% 185 13% 10 1% 595 42% 15 1,420
2013/14 570 42% 160 12% 15 1% 610 45% 5 1,360
2014/15 685 45% 155 10% 10 1% 670 44% 0 1,520
28%
40%
28%
UK
Other EU
Non-EU
Not employed
4%

31
Figure 10 Locations of employment for undergraduate students relevant to biomedicine with previous other EU-domicile
Figure 11 Destinations of undergraduate students relevant to biomedicine with previous other EU-domicile (2014/15)
0
10
20
30
40
50
60
70
80
90
100
2014/152013/142012/13
Per
cen
tag
e (%
)
Not known
Not employed
Non-EU
Other EU
UK
Figure 20
Figure 22
615 570 685
595 610 670
185 160 155
10%
45%44%
UK
Other EU
Non-EU
Not employed
4%

32
Table 27 Flow of biomedical students, leavers survey 2013/14
Graduates in employment in other EU countries (after qualifying in the UK)
Total EU-domiciled leavers in employment
Net flow of students from other EU countries
EU-domiciled 958
UK-domiciled 433
Total 1,391 2,892 -1,500
Source: Data analysis by MRC Information and Analysis Team and Technopolis; data source: HESA

33
APPENDIX H RESEARCHFISH® SUPPLEMENTARY DATAResearch council data on next destinations collected via Researchfish®
In 2014 the research councils adopted a harmonised method for the collection of research outputs and outcomes data via Researchfish®i,ii. Researchfish® is an online system for capturing structured information about research progress used by multiple funding agencies. Researchers can, alongside information about a wide range of output types, provide brief feedback on staff that have ceased to be funded by the awards they hold. Funders aim to gather high level information on the next destinations of staff, where this is known. While working on projects staff gain experience and may transfer these skills to other sectors and job roles. Approximately 40% of those that have received MRC awards responded.
Table 28 Summary of moves to specific EU-28 member statesiii
Research Council
DE FR IT NL PO UK Other EU27
Non-EU
Unknown Grand Total
AHRC 19 3 4 2 491 42 64 4 629
BBSRC 87 69 14 25 7 2,083 161 432 50 2,928
EPSRC 296 262 78 92 42 7,273 567 1747 372 10,729
ESRC 18 8 6 15 635 26 141 9 858
MRC 279 225 80 58 18 7,352 562 1,683 525 10,782
NERC 28 30 2 11 3 730 73 212 14 1103
STFC 51 35 16 17 2 462 77 201 57 918
Grand Total 778 632 200 220 72 19,026 1508 4,480 1,031 27,947
Data analysis by MRC Information and Analysis Team and Technopolis; data source: Researchfish® MRC data
The Researchfish data provides evidence, over ten years (2006-2016) for the support of almost 28,000 people at some point in their career.
i Research Councils UK. About Researchfish® available from www.researchfish.com [Accessed 8 Feb 2017]
ii Research Councils UK. Research Outcomes available from http://www.rcuk.ac.uk/research/researchoutcomes/ [Accessed 8 Feb 2017]
iii Where a year of the move is reported, and is between 2006 and 2016 inclusive. Results from Researchfish are first de-duplicated, by funder, using an ID for the reported output (as outputs can be attributed to multiple awards)

34
Table 29 All data for moves to EU-28 member states
AHRC BBSRC EPSRC ESRC MRC NERC STFC Grand Total
Austria, Republic of 5 11 44 2 43 2 107
Belgium, Kingdom of 3 8 43 3 26 2 4 89
Bulgaria, Republic of 2 4 1 7
Croatia, Republic of 1 2 3
Cyprus, Republic of 1 11 7 1 20
Czech Republic 4 19 1 11 3 38
Denmark, Kingdom of 3 8 27 31 9 3 81
Estonia, Republic of 1 2 1 1 5
European Union (EU)iv 10 33 105 5 91 17 39 300
Finland, Republic of 7 14 3 11 4 8 47
France, French Republic 3 69 262 8 225 30 35 632
Germany, Federal Republic of 19 87 296 18 279 28 51 778
Greece, Hellenic Republic 1 6 39 25 3 74
Hungary, Republic of 2 4 9 11 1 1 28
Ireland, Republic of 8 14 54 3 48 8 2 137
Italy, Italian Republic 4 14 78 6 80 2 16 200
Latvia, Republic of 1 1
Lithuania, Republic of 1 1 3 1 6
Luxembourg, Grand Duchy of 4 4
Malta, Republic of 1 6 1 4 12
Netherlands, Kingdom of the 2 25 92 15 58 11 17 219
Poland, Republic of 7 42 18 3 2 72
Portugal, Portuguese Republic 1 10 22 31 4 4 72
Romania 8 2 10
Slovakia (Slovak Republic) 1 1 2 1 5
Slovenia, Republic of 2 1 2 10 1 16
Spain, Kingdom of 6 35 107 4 140 9 9 310
Sweden, Kingdom of 14 43 4 62 12 1 136
Subtotal for EU-27 70 349 1,294 69 1,160 135 197 3,274
United Kingdom of Great Britain & Northern Ireland (UK)
491 2,083 7,273 635 7,352 730 462 19,026
Grand Total 561 2,446 8,610 708 8,574 877 660 22,436
Data analysis by MRC Information and Analysis Team and Technopolis; data source: Researchfish® MRC data iv
iv European Union is a less-specific location chosen by some respondents, the assumption is that the move is somewhere in the EU-27

35
Table 30 Role in MRC-funded group and next destination country
UK DE FR IT NL PO other EU
Non-EU
Unknown Total
Post Doctoral Researcher
2,463 120 121 31 33 5 276 652 154 3,855
Research Fellow 1,109 40 59 20 5 2 108 258 78 1,679
Research Project Leader
197 6 9 2 1 11 52 14 292
Research Student 1,283 77 26 15 8 3 82 424 101 2,019
Researcher (No PhD)
1809 33 10 10 10 7 71 249 144 2,343
Management/Admin/Policy
384 2 2 1 6 32 29 456
Engineer 4 1 1 1 7
Technician 103 1 1 7 15 4 131
Total 7,352 279 225 80 58 18 562 1,683 525 10,782
Data analysis by MRC Information and Analysis Team and Technopolis; data source: Researchfish® MRC data
Table 31 Role after leaving MRC-funded group, and next destination country
UK DE FR IT NL PO other EU
Non-EU
Unknown Total
Post Doctoral Researcher
2489 120 110 36 33 4 246 777 140 3955
Research Fellow (individual fellowship)
290 6 14 6 1 31 97 11 456
Research Project Leader (with budgetary responsibility)
458 37 46 9 4 95 220 21 890
Full-time lecturer/teacher
303 8 7 1 1 19 69 3 411
Research Student
432 30 8 6 5 2 25 76 23 607
Researcher (No PhD)
740 19 4 3 2 4 29 104 46 951
Engaged in study 149 5 2 2 4 8 19 2 191
Full-Time Study 64 1 7 1 73
Health care/Medical Staff
628 9 4 2 4 22 71 27 767
Management/Admin/Policy
330 7 6 2 2 18 38 19 422

36
UK DE FR IT NL PO other EU
Non-EU
Unknown Total
Management/Admin/Policy for a research organisation
142 1 1 18 6 168
Not employed/on career break/maternity/paternity leave
263 13 8 5 1 3 21 47 34 395
Other Research Occupation
442 14 7 4 3 26 69 31 596
Unknown/Other 464 11 8 4 1 21 65 148 722
Retired 148 1 5 9 163
Deceased 10 4 14
Total 7,352 279 225 80 58 18 562 1,682 525 10,781
Data analysis by MRC Information and Analysis Team and Technopolis; data source: Researchfish® MRC data
Table 32 Sector of employment and destination, after leaving MRC-funded group
UK DE FR IT NL PO other EU
Non-EU
Unknown Total
Academic (e.g. university based)
4,266 184 156 52 36 14 398 1,222 222 6,550
Charitable (non profit making)
151 1 3 5 31 3 194
Health/health care (e.g. hospital based; NHS or private)
873 9 6 4 4 30 79 35 1,040
Not Applicable/Unknown
770 17 14 9 1 4 32 105 180 1,132
Other Public Sector (e.g. research agency/government)
241 11 17 2 1 16 74 13 375
Other Research Council (e.g. research unit/institute/head office)
272 9 10 6 1 16 34 21 369
Private (profit making e.g. industry, commerce)
779 48 19 7 15 65 138 51 1,122
Total 7,352 279 225 80 58 18 562 1,683 525 10,782
Data analysis by MRC Information and Analysis Team and Technopolis; data source: Researchfish® MRC data
Table 31 (cont)

37
Table 33: Role and destination country of MRC-funded postdoctoral researchers
UK DE FR IT NL PO other EU
Non-EU
Unknown Total
Full-time lecturer/teacher
165 5 4 15 42 2 233
Health care/Medical Staff
67 5 2 1 5 11 6 97
Research Project Leader (with budgetary responsibility)
197 21 25 3 3 49 122 6 426
Research Fellow (individual fellowship)
143 5 9 4 1 22 51 3 238
Total 2463 120 121 31 33 5 276 652 154 3855
Table 34: Next role and destination country of MRC-funded research fellows
UK DE FR IT NL PO other EU
Non-EU
Unknown Total
Full-time lecturer/teacher
77 2 3 1 1 2 12 1 99
Health care/Medical Staff
207 3 1 1 1 8 15 4 240
Research Project Leader (with budgetary responsibility)
118 14 17 5 1 35 51 7 248
Research Fellow (individual fellowship)
99 1 4 2 6 19 4 135
Total 1109 40 59 20 5 2 108 258 78 1679
Data analysis by MRC Information and Analysis Team and Technopolis; data source: Researchfish® MRC data

38
APPENDIX K EUROPEAN RESEARCH COUNCIL GRANTSAll data was provided by the European Research Council (ERC) Office. Data as of 14/12/2016, includes: Starting Grants 2007-2016, Consolidator Grants 2013-2016, Advanced Grants 2008-2015. Current signatories of the grant agreement have been taken into account.
Table 35 Location and nationality of ERC grant holders
Country of host institution
Number of all grants
Number of grantees already resident in the country Number of grantees moving to the country
All grantees staying in the country
Staying (own nationals)
Staying (other EU/Associated-country nationals)
Staying (non-EU/AC nationals)
UK 1,488 1,348 736 428 184 140
DE 1,031 912 687 166 59 119
FR 888 815 610 154 51 73
NL 593 535 394 107 34 58
ES 384 353 276 64 13 31
IT 380 340 319 18 3 40
BE 240 220 197 20 3 20
SE 232 218 144 64 10 14
AT 180 143 50 83 10 37
DK 139 120 87 21 12 19
FI 108 101 86 14 1 7
PT 68 63 55 5 3 5
IE 66 57 41 15 1 9
NO 66 58 37 11 10 8
HU 54 48 43 5 0 6
CH 468 386 120 223 43 82
IL 372 360 351 7 2 12
Other 150 131 117 12 2 19
Total 6,907 6,208 4,350 1,417 441 699
Source: European Research Council (ERC) Office

39
Table 36 Top institutions and research organisations hosting ERC grant holders
Country Higher-Education Institution
Starting Grants
Consolidator Grants
Advanced Grants
Total LS PE SH
UK University of Oxford 78 36 75 189 52 76 61
UK University of Cambridge 83 34 71 188 66 88 34
UK University College London
65 27 41 133 53 39 41
CH Swiss Federal Institute of Technology Lausanne (EPFL)
53 15 48 116 33 81 2
CH Swiss Federal Institute of Technology Zurich (ETH Zurich)
45 7 58 110 34 72 4
IL Weizmann Institute 55 23 32 110 64 44 2
IL Hebrew University of Jerusalem
55 15 34 104 45 42 17
UK Imperial College 49 14 23 86 30 54 2
UK University of Edinburgh 34 14 35 83 28 32 23
NL University of Amsterdam 38 14 19 71 7 24 40
DK University of Copenhagen
32 21 16 69 29 24 16
IL Tel Aviv University 40 10 16 66 29 31 6
BE University of Leuven 34 11 20 65 18 33 14
DE University of Munich (LMU)
28 4 29 61 25 21 15
NL Radboud University Nijmegen
32 10 14 56 21 12 23
NL Delft University of Technology
27 14 15 56 6 44 6
NL Utrecht University 26 17 13 56 10 25 21
UK University of Bristol 22 7 26 55 9 36 10
CH University of Zurich 22 9 20 51 31 9 11
NL Leiden University 25 9 16 50 21 29
FI University of Helsinki 25 8 15 48 32 11 5
IL Technion – Israel Institute of Technology
32 6 10 48 16 31 1
FR National Centre for Scientific Research (CNRS)
186 83 83 352 103 210 39
DE Max Planck Society 86 24 68 178 95 72 11
DE Helmholtz Association of German Research Centres
50 28 20 98 58 39 1

40
Country Higher-Education Institution
Starting Grants
Consolidator Grants
Advanced Grants
Total LS PE SH
FR National Institute of Health and Medical Research (INSERM)
43 23 23 89 83 3 3
FR French Alternative Energies and Atomic Energy Commission
40 5 16 61 9 50 2
ES Spanish National Research Council (CSIC)
27 18 16 61 19 36 6
FR INRIA 29 4 14 47 47
LS = Life Sciences; PE = Physical and Engineering Sciences; SH = Social Sciences and Humanities
Source: European Research Council (ERC) Office
Table 37 Top Host Institutions – Life Sciences domain only
Starting Grants
Consolidator Grants
Advanced Grants
Total
University of Cambridge 29 11 26 66
Weizmann Institute 33 17 14 64
University College London 29 8 16 53
University of Oxford 17 11 24 52
Hebrew University of Jerusalem 24 8 13 45
Karolinska Institute 20 6 16 42
Swiss Federal Institute of Technology Zurich (ETH Zurich)
16 1 17 34
Swiss Federal Institute of Technology Lausanne (EPFL)
12 4 17 33
Flanders Institute for Biotechnology (VIB) 14 12 6 32
University of Helsinki 17 6 9 32
University of Zurich 14 3 14 31
Imperial College 21 2 7 30
University of Copenhagen 13 10 6 29
Tel Aviv University 19 6 4 29
University of Edinburgh 12 3 13 28
Uppsala University 16 4 6 26
University of Munich (LMU) 10 2 13 25
Curie Institute 12 4 9 25
Source: European Research Council (ERC) Office
Table 36 (cont)

41
Table 38 Top host institutions located in EU28 – Life Science domain only
Starting Grants
Consolidator Grants
Advanced Grants
Total
University of Cambridge 29 11 26 66
University College London 29 8 16 53
University of Oxford 17 11 24 52
Karolinska Institute 20 6 16 42
Flanders Institute for Biotechnology 14 12 6 32
University of Helsinki 17 6 9 32
Imperial College 21 2 7 30
University of Copenhagen 13 10 6 29
University of Edinburgh 12 3 13 28
Uppsala University 16 4 6 26
Source: European Research Council (ERC) Office

42
APPENDIX L BIBLIOMETRIC ANALYSIS OF REFERENCES IN EU CLINICAL GUIDELINES AND PUBLICATIONS BY EU NATIONAL HEALTH ADVISORY COMMITTEE MEMBERS
L.1 Background to clinical guidelines“Clinical practice guidelines are systematically developed statements to assist practitioner and patient decisions about appropriate health care for specific clinical circumstances.”
(Field and Lohr, 1990. p:38){1}
Clinical guidelines are being used increasingly to inform medical practice. They normally provide recommendations based on a careful review of the available evidence, much of which is in the form of papers in the peer-reviewed serial literature. Conversely, an examination of the papers that are so cited can be used to show the practical value of medical research. The first such study was on a very small scale{15} but was extended the following year to a larger sample and this paper attracted much more attention{16}. The procedure was extended again{17} and showed that many of the papers cited on UK guidelines had been funded by industry, but very few by the Wellcome Trust, probably because they tended to be clinical rather than basic research. A more detailed examination of UK cancer clinical guidelines{18} revealed the important contributions of Edinburgh and Glasgow, especially to the guidelines published in Scotland by the Scottish Intercollegiate Guidelines Network (SIGN), and confirmed the over-citation of UK research on these 43 guidelines.
More recent work both in the UK{19},{20} and in Chile{21} has confirmed that the citations of papers on clinical guidelines form a useful means to evaluate medical research. The preferential citation of clinical, as opposed to basic, papers is a welcome counter-balance to their under-citation in the academic literature. Although national guidelines do tend to over-cite their own country’s research, this is something that occurs in the serial literature, with smaller countries over-citing their fellow-countrymen much more than larger countries do{22}.
The results presented here were taken from a major mapping exercise carried out by King’s College London and supported by the European Commission. This examined, inter alia, the impacts of European research in five non-communicable diseases (NCDs) including cancer, cardiovascular disease and stroke, and mental disorders. The first set of impacts, those of UK research on members of national health advisory committees from other Member States, has been provided previously. This report describes the extent to which UK research is cited on European Clinical Guidelines (ECGs) published by five target European Union Member States (EU MSs) namely France, Germany, Italy, the Netherlands and Poland, and the other EU Member States.
L.2 Five target Member State Countries NCD mortality and clinical guidelines’ profiles
Non-communicable diseases (NCDs) are the leading cause of death in Europe and worldwide. The five target EU MSs give specific emphasis on clinical guidelines’ development, quality assurance and adherence on chronic conditions like cancer, cardiovascular diseases (CVD) and mental health disorders. France, Germany, the Netherlands and England are recognised as “leading” countries in the development of clinical practice guidelines{2}. The profile of each country around CGs development and patterns of NCD mortality is as follows, for:

43
L.2.1 The United Kingdom (UK)
In the UK, there is the National Institute for Health and Care Excellence (NICE) for England and the Scottish Intercollegiate Guidelines Network (SIGN) for Scotland responsible for the development of evidence based clinical practice guidelines. In the UK, 89% of 557,000 deaths in 2014 were due to NCDs, with cardiovascular diseases as the leading cause (31%), followed by cancers (29%) and other NCDs (29%){9}.
In England, through funding from NICE, the National Collaborating Centre for Chronic Conditions (NCCCC) is responsible for the development of clinical guidelines on chronic conditions, based at the Royal College of Physicians (RCP){2}. The National Clinical Guideline Centre (NGC) is commissioned to develop NICE clinical practice guidelines on chronic conditions{12}. The SIGN guidelines are developed through a systematic literature review process working in partnership with several organisations through Europe on clinical guidelines{13}.
L.2.2 Germany (DE)
In Germany, the Association of the Scientific Medical Societies (AWMF) coordinates the development of voluntary clinical guidelines{2}. There are also the Federal Joint Committee (GBA), the Institute for Quality and Efficiency in Health Care (IQWiG), the National Association of Statutory Health Insurance Physicians (KBV), the National disease management guidelines (NVL) and the Agency for Quality in Medicine (ÄZQ) focusing on chronic conditions. The NVL ensures the implementation and adherence to the clinical guidelines, while the National Academy of Family Physicians ensures their evaluation{2}.
In 2014, there were 866,000 deaths in Germany, with 91% due to NCDs. CVDs accounted for 40% of all deaths, followed by cancer (26%) and other NCDs (25%){9}.
L.2.3 France (FR)
In France, the French National Authority for Health (Haute Autorité de Santé, HAS) is responsible for the development and dissemination of centralised clinical guidelines, sometimes in collaboration with professional associations and medical societies{2}.
In 2014, there were 87% of 554,000 deaths due to NCDs with the leading cause of deaths in France being cancer (31%), followed by CVD (28%) and other NCDs (28%){9}.
L.2.4 Italy (IT)
In Italy, there is the National Guideline System (SNLG) and the Centre for the Evaluation of the Effectiveness of Health Care (CeVeAs) responsible for the quality control of the production of clinical guidelines{2}. There is also the National Agency for Regional Healthcare Systems (AGENAS) responsible for the adherence to the guidelines{2}. Like France, the development of centralised clinical guidelines is the responsibility of the SNLG, which is part of the National Institute of Health (ISS) (under the Ministry of Health) with medical societies and regional agencies involved in the process of development and implementation of CGs{2}.
In Italy, over 92% of 573,000 deaths in 2014 were due to NCDs with CVDs as the leading cause of death (37%), then cancer (29%) and other NCDs (26%){9}.

44
L.2.5 The Netherlands (NL)
Similar to Germany, there are various organisations involved in the development of clinical guidelines around the prevention and treatment of NCDs in the Netherlands. In contrast to Germany though, these organisations, like the National Institute for Public Health and the Environment (RIVM), the Dutch Institute for Healthcare Improvement (CBO), the Dutch Council for Quality of Care and the Dutch College of General Practitioners (NHG) operate without central co-ordination. In addition, these organisations follow different methods on evidence-base synthesis and there is no official regulation on clinical guidelines evaluation of quality control{2}.
In the Netherlands, 89% of 140,000 deaths were due to NCDs with over a third from cancer (33%), 29% from CVDs and 28% from other NCDs{9}.
L.2.6 Poland (PL)
In Poland, there is no legal basis for the development of clinical guidelines, and this process is decentralised with the work mainly carried out by professional organisations, specialists, medical societies, the National Centre for Quality Assessment in Healthcare and the College of Family Physicians (CoPFiP). There is no standardised guidance, no quality control, and no incentive on adherence to guidelines, CGs evaluation or implementation.
In 2014, 90% of 374,000 deaths were attributed to NCDs, with 49% of all deaths due to cardiovascular diseases followed by cancer (26%) and other NCDs (16%){9}.
L.3 Analysis of publications by National Health Advisory Committee members
Most EU member states have sets of committees that provide advice to their ministries of health. These usually consist of experts in the relevant subject area, many of them active researchers and clinicians. It was hypothesised that some of them would have carried out their research, in collaboration with scientists from other MS, and that this would demonstrate the utility of European research activitiesv. By the same token, some of the members‘ research would have been done in partnership with the UK, and this would provide a route by which UK medical researchers could influence health policy in other member states.
During 2014-15, King’s College London contributed to an EU-funded project on the mapping of research on five non-communicable diseases (NCDs) in Europe. As part of the project, health advisory committees in 21 member states were identified, including the UK, with a total membership of 1,431, during the five years 2009-13. Table 1 lists the member states with the numbers of advisory group members for the country, and the numbers of biomedical research papers that they collectively published. The bibliographic details of the 12,854 papers published by the committee members were extracted from the Web of Science Thomson Reuters database and analysed.
The table shows that the numbers of advisers was very uneven, with some countries having large numbers (notably Hungary, and also Germany, Italy and Estonia) but others having very few. There was also a big variation in the amount of research being conducted by members. It averaged over 20 papers per member in the Netherlands and Spain, and was more than 10 in the Czech Republic, Germany, Poland and the UK, but was less than unity in Luxembourg, Ireland and Bulgaria.
v Pallari E & Lewison G. The research publications of members of European national noncommunicable disease health advisory committees. Journal of Scientometric Research. 2015 Sep 1;4(3):124.

45
The main analyses were of the contribution of the UK to committee members’ papers: (1) from each of the five selected (target) members states, namely France, Germany, Italy, the Netherlands and Poland; (2) from the other European countries. Comparisons were made with the contributions of (1) the other four target MS, or for the other 25 countries, all five; (2) the USA; (3) the other European countries; and (4) the rest of the world. These comparisons were designed to show the contribution of the UK in context. The analyses were carried out on the basis of both fractional and integer contributions. For example, a paper with two French addresses and one German one would be counted 1 each for FR and DE on integer counting, but 0.67 and 0.33 respectively on fractional counting. The latter gives a fairer representation of the contribution of each country, but the former allows a country’s contribution to be compared with its presence in the relevant field of science. For these advisory committees, with a very wide range of interests, we took all biomedical research as the relevant field, and determined individual country presence in this field in WoS papers by means of a special filter based on address words and contractions
Table 39 Membership of national health advisory committees in EU MS in 2009-13, and the number of biomedical papers in the Web of Science that they wrote.
Member state ISO2 code No. of committees
No. of members No. of papers
Austria AT 4 189 1,384
Bulgaria BG 1 9 7
Croatia HR 1 19 39
Cyprus CY 3 26 36
Czech Republic CZ 4 51 969
Denmark DK 2 42 111
Estonia EE 2 106 347
Finland FI 1 16 100
France FR 3 46 294
Germany DE 5 125 2,010
Hungary HU 5 247 1,311
Ireland IE 2 49 10
Italy IT 4 107 965
Lithuania LT 9 89 145
Luxembourg LU 1 31 4
Netherlands NL 5 83 2,554
Poland PL 3 60 794
Portugal PT 1 16 51
Spain ES 1 46 1,179
Switzerland CH 3 39 141
United Kingdom UK 2 35 403
Total 62 1,431 12,854

46
Table 40 Contributions (percentages of foreign contributions to papers, fractional counts) from target MS, the UK, the USA, the other 25 European countries and the Rest of the World to the committee members’ papers from the target MS and the other 25 countries (data available only for 15).
Cttees Other 4 UK US EUR 25 RoW
DE 21.4 8.7 21.8 28.1 19.4
FR 14.0 15.8 12.1 33.0 21.4
IT 27.4 11.5 26.9 21.2 12.2
NL 17.5 17.3 21.3 27.3 12.5
PL 27.1 7.7 24.9 23.0 16.1
EUR 15 45.0 10.9 26.4 15.9
Table 41 Contributions (percentages of integer counts of foreign contributions to papers) from target MS, the UK, the USA, the other 25 European countries and the Rest of the World to the committee members’ papers from the target MS and the other 25 countries (data available only for 15).
Cttees Other 4 UK US EUR 25 RoW
DE 60.7 22.0 34.5 90.2 50.0
FR 76.6 42.1 29.9 133.6 129.0
IT 70.9 25.9 43.1 72.5 36.4
NL 57.6 38.3 37.7 118.4 46.7
PL 100.0 28.6 48.0 140.3 107.7
EUR 15 107.3 27.0 37.6 57.7
Table 42 Percentages of internationally co-authored papers in biomedical research from target MS, the UK, the USA, the other 25 European countries and the Rest of the World co-authored with the countries and groups in column 1, 2009-13.
Countries Other 4 UK US EUR 25 RoW
DE 29.3 20.8 33.7 69.4 52.8
FR 34.4 23.0 31.6 74.4 72.0
IT 37.4 25.3 38.0 80.7 57.5
NL 38.6 27.9 32.9 76.2 55.7
PL 48.3 25.7 35.6 134.7 112.4
EUR 25 47.7 23.2 33.8 52.5

47
Table 43 Percentage presence of papers in biomedical research from target MS, the UK, the USA, the other 25 European countries and the Rest of the World that are NOT co-authored with the countries and groups in column 1, 2009-13. Note: for EUR25, “Other 4” presence is actually “Other 5”.
Countries Other 4 UK US EUR 25 RoW
DE 14.7 9.7 36.2 20.7 53.0
FR 17.1 9.4 35.0 20.0 51.3
IT 16.9 9.4 35.1 20.0 51.4
NL 18.1 9.3 34.6 19.8 50.7
PL 19.2 9.1 33.8 19.3 49.6
EUR 25 24.1 10.7 39.8 22.8 58.4

48
ENDNOTES
1 {} Field MJ, Lohr KN, editors. (1990) Clinical practice guidelines: directions for a new program. National Academies Press; p:38.
2 {} Legido-Quigley H, Panteli D, Car J, McKee M, Busse R. (2013) Clinical guidelines for chronic conditions in the European Union. European Observatory on Health Systems and Policies.
3 {} Nolte E, Knai C, Saltman RB. (2014) Assessing chronic disease management in European health systems. Concepts and Approaches. Copenhagen: European Observatory of Health Systems and Policies.
4 {} European Commission. Public health- major and chronic diseases. Available online: http://ec.europa.eu/health/major_chronic_diseases/diseases/cancer_en [Accessed 20th December 2016]
5 {} European Commission. Eurostat: Statistics explained. Cancer statistics. 2016. Available online: http://ec.europa.eu/eurostat/statistics-explained/index.php/Cancer_statistics#Deaths_from_cancer [Accessed 20th December 2016]
6 {} European Commission. Eurostat: Statistics explained. Cancer statistics – specific cancers. (2015) Available online: http://ec.europa.eu/eurostat/statistics-explained/index.php/Cancer_statistics_-_specific_cancers [Accessed 20th December 2016]
7 {} European Commission. Eurostat: Statistics explained. Cardiovascular diseases statistics. (2016) Available online: http://ec.europa.eu/eurostat/statistics-explained/index.php/Cardiovascular_diseases_statistics#Healthcare_resources_and_activities [Accessed 20th December 2016]
8 {} Løgstrup S, O’Kelly S. European cardiovascular disease statistics: 2012 edition. Brussels, Belgium: European Heart Network. (2012) Available online: https://www.escardio.org/static_file/Escardio/Press-media/press-releases/2013/EU-cardiovascular-disease-statistics-2012.pdf [Accessed 20th December 2016]
9 {} Riley L, Cowan M. (2014) Noncommunicable diseases country profiles 2014. Geneva: World Health Organization.
10 {} WHO. Available online: http://www.euro.who.int/en/health-topics/noncommunicable-diseases/cardiovascular-diseases/data-and-statistics [Accessed 20th December 2016]
11 {} Nichols M, Townsend N, Scarborough P, Rayner M. (2014) Cardiovascular disease in Europe 2014: epidemiological update. European heart journal. Aug 12:ehu299.
12 {} NCGC. About NGC. (2010) Available online: http://www.ngc.ac.uk/about/ [Accessed 20th December 2016]
13 {} SIGN. Current collaborations. Available online: http://www.sign.ac.uk/about/collaborations.html [Accessed 20th December 2016]
14 {} Ferlay J, Steliarova-Foucher E, Lortet-Tieulent J, Rosso S, Coebergh JW, Comber H, Forman D, Bray F. (2013) Cancer incidence and mortality patterns in Europe: estimates for 40 countries in 2012. European journal of cancer. Apr 30;49(6):1374-403.
15 {} Grant J. (1999) Evaluating the outcomes of biomedical research on healthcare. Research Evaluation, vol 8 (1), pp 33-38.
16 {} Grant J, Cottrell R, Cluzeau F and Fawcett G. (2000) Evaluating “payback” on biomedical research from papers cited in clinical guidelines: applied bibliometric study. BMJ, vol 320 (7242) pp 1107-1111. DOI: 10.1136/bmj.320.7242.1107.
17 {} Lewison G and Wilcox-Jay K. (2003) Getting biomedical research into practice – the citations from UK clinical guidelines. Proceedings of the 9th International Conference on Scientometrics and Informetrics, Beijing, China, pp 152-160.
18 {} Lewison G and Sullivan R. (2008) The impact of cancer research: how publications influence UK cancer clinical guidelines. British Journal of Cancer, vol 98 (12), pp 1944-1950. DOI: 10.1038/sj.bjc.6604405.
19 {} Kryl D, Allen L, Dolby K, Sherbon B and Viney I. (2012) BMJ OPEN, vol 2 (2), e000897. DOI: 10 1136/bmjopen-2012-000897.

49
20 {} Turner S, Bhurke S and Cook A. (2015) Impact of NIHR HTA programme funded research on NICE clinical guidelines: a retrospective cohort. Health Research Policy and Systems, vol 13, article 37. DOI: 10.1186/s12961-015-0025-8.
21 {} Nunez FP, Torres CA and Armas MR (2014) Contribution of Chilean research to the formulation of national clinical guidelines. Revista Medica de Chile, vol 142 (12), pp 1540-1546.
22 {} Lewison G and Roe P. (2012) The evaluation of Indian cancer research, 1990-2010. Scientometrics, vol 93 (1), pp 167-181. DOI: 10.1007/s11192-012-0633-9
23 {} Lung Cancer Europe (LuCE). (2015). Position paper 2015. Available online: http://www.lungcancereurope.eu/wp-content/uploads/2015/11/LuCE-EU-Policy-Position-Paper-2015-IMPAGINATO.pdf [Accessed 20th December 2016]
24 {} EU Commission. (2004) The State of Mental Health in the European Union. Available online: http://ec.europa.eu/health/ph_projects/2001/monitoring/fp_monitoring_2001_frep_06_en.pdf [Accessed 20th December 2016]
25 {} EMCDDA. European Monitoring Centre for Drugs and Drug Addiction. Available online: http://www.emcdda.europa.eu/about [Accessed 20th December 2016]
26 {} World Health Organization. Available online: http://www.who.int/substance_abuse/facts/global_burden/en/ [Accessed 20th December 2016]
27 {} WHO World Health Organization. 2012. Health statistics and information systems- Estimates for 2000-2012. Available at: http://www.who.int/healthinfo/global_burden_disease/estimates/en/index2.html [Accessed 4th January 2016]

50
bhf.org.uk wellcome.ac.uk
acmedsci.ac.uk cruk.org
amrc.org.uk mqmentalhealth.org
Study co-funded by:
arthritisresearchuk.org mrc.ac.uk