Embed Size (px)
Citation preview

Abstract—Nowadays, huge amounts of data are exchanged
and collected in the business world every day. For e-commerce
firms, data from different sources (e.g. online transactions,
search history and social media) can be analysed and provide
insights to business managers. As many e-commerce companies
claimed, Big Data Analytics (BDA) is the most efficient way to
dig out the insights and to develop specific strategy for the
company so far. Therefore, this project aims at exploring the
effects of BDA brought on customers’ online behaviour to
examine whether the BDA is as successful as firms stated.
Index Terms—Big data analytics, customer behaviour, online
purchase, e-commerce
I. INTRODUCTION
he world is changing so does the customer‟s
purchase behaviour. It is widely acknowledged that
today‟s consumer purchase decision process flows through
significantly different stages compared to purchase decision
process of consumers before in the decades ago. [1] stated
that the main change itself is observed not in the shift in
consumer preferences, but rather in a way each of us gets
hands on the product desired. The recent trend showed the
rapidly increasing share of online consumers as well as the
share of consumers settling the bills by the means other than
cash even if they shop at the physical store. This new fashion
of shopping brings up challenges as well as opportunities to
improve customer service and boost the sales. Every single
consumer who shops online or transacts via online payments
leaves so-called digital footprint, a trail of data one creates
when performing actions online [2]. New way of customer
behaviour can easily confuse the merchants who are not
equipped to deal with a new trend, at the same time,
information collected from this footprint, given proper
analysis, can tell the merchant unique hints on particular
consumer‟s behaviour and even habits. Big Data Analysis is a
powerful tool to tackle these challenges and utilize the
opportunities [3]. This paper will investigate what impact
Manuscript received January 1, 2017; revised February 1, 2017. This
work was supported in part by Xi‟an Jiaotong-Liverpool University under
SURF project no. 201619.
Q. Li is with the International Business School Suzhou, Xi‟an
Jiaotong-Liverpool University, Suzhou, China. (e-mail:
J. Xing is with the University of Liverpool, Liverpool, UK. (e-mail:
* O. Liu is with the International Business School Suzhou, Xi‟an
Jiaotong-Liverpool University, Suzhou, China. (corresponding author,
phone: +86(0)512 8188 3264; e-mail: [email protected]).
W. Chong is with the International Business School Suzhou, Xi‟an
Jiaotong-Liverpool University, Suzhou, China. (e-mail:
does Big Data Analysis has on the current operations and to
what extent it is utilized by the modern merchants as well as
what exact benefits it can provide for the user.
The remaining parts of this paper are organized in the
following way. In Section two, existing literatures and
researches related to customer behaviour both offline and
online are identified, and the process of BDA is summarized.
The third section introduced the methodology. Next section
analyzed the data generated from online survey. Through
MATLAB we examined the relationship between frequently
browsing items and finally purchasing items on the
e-commerce websites. Furthermore, a flow chart about BDA
operated in the field of capturing customers has been
developed based on the most popular Chinese e-commerce
websites Taobao.com. Finally, Section five indicates that this
paper has answered three major questions related to BDA,
which provide a relatively clear pattern of BDA in relation to
more strategic marketing decision making.
II. LITERATURE REVIEW
In this section, we will review existing literatures related to
both offline and online customer behaviour, and summarise
the process of BDA.
The traditional offline customers‟ behaviour follows the
first flow chart shown on the Fig 1. Above all, customers
realize their needs and wants. And then customers start to
search as much information about products as they can, such
as price, functions, from different sources (e.g. friends,
Internet). After that, customers would evaluate the
alternatives based on their preference. Finally, the purchasing
decision is made.
The customers‟ online behaviour is transformed from
physical to the screen, it can be seen from the Fig 1.
Nowadays, [4] stated that online shopping is speedily moving
toward mobile devices, 54.8% online customers shop on the
mobile in China among 410 million online customers by the
end of 2015. Online customers complete the whole process
on the Internet, searching, questioning, purchasing, making
payment and tracking the delivery, etc. Also, the number
group of customers who pay online and shop offline is
gradually becoming bigger, such as Alipay and WeChat Pay.
Once customers make the payment online through scanning
the QR code, the relevant official accounts are automatically
followed. All these online performances are conducted
through exchanging information between both customers and
firms [5].
The Impact of Big Data Analytics on
Customers‟ Online Behaviour
Qiuchen Li, Jinkun Xing, Ou Liu, and Woonkian Chong
T
Proceedings of the International MultiConference of Engineers and Computer Scientists 2017 Vol II, IMECS 2017, March 15 - 17, 2017, Hong Kong
ISBN: 978-988-14047-7-0 ISSN: 2078-0958 (Print); ISSN: 2078-0966 (Online)
IMECS 2017

Offline Online Integrated
Fig 1. Offline and Online Customer Purchasing Process
Nowadays, it has become a data-driven business world.
The use of big data is not only restricted with the field of IT,
but also the whole value chain of an industry [6]. Acquiring
data is the first step, which means the use of all kind of
intelligent networking terminal toward users‟ information
carries out a full range of data collection in order to achieve
B2C customized [7]. Next could be further separated into two
stages: back stage and front stage. And the next step of back
stage is data mining to extract important information from the
mass data and keep data in the data warehousing system with
collected offline data [7]. For the front stage, digitalized
marketing would allow personalization in terms of the online
services to achieve the best shopping experience [7]. Then,
distribution system allows firms to control the supply and
provide customers with the accurate information. Digital
logistics allows both firms and customers track the real-time
logistics based on the online and offline data docking, which
can achieve the efficient and transparent logistics system [8].
In the process of the data-driven marketing, offline and
online data exchanging is involved through the system and
process, which strengthen the relationship between
customers and firms [8].
III. METHODOLOGY
The research aims to examine the effect of BDA on
customers‟ online behaviour, finding out what BDA used for
customers and marketing activities is the first step. Thus the
first step is Secondary Research. Secondary data were
collected and relevant literatures were referred for
developing the insight related to the online shopping and
BDA. Once gaining the knowledge related to BDA and its
impact on customers‟ online bebaviour, the second step is to
conduct the survey by online questionnaire in order to
examine the efficiency of using BDA on marketing.
Approximate 450 individuals filled in the questionnaire. The
data were analyzed by SPSS and MATLAB and
corresponding graphs were plotted in the MATLAB. Also, in
order to generate strong insight from the industrial
perspective, the third step, an in-depth interview to the
marketing manager of Alibaba was conducted orally with
regard to the impact of big data analytics on Alibaba, while the
paper version of the interview questions was provided.
IV. DATA ANALYSIS AND FINDINGS
Based on the analysis of the aforementioned online survey,
we get Fig 2, which predicts the impact of browsing different
items on purchasing product from these items (larger than 0.7
stands for strong correlation, lower than 0.3 stands for weak
correlation). It demonstrates that the browsing and
purchasing in each item show strong correlation, that is the
higher the browsing frequency means the greater chances to
purchase satisfied product from this item. This is extremely
obvious for Guess you like and Related product.
Fig 2. The effect of browsing frequency on purchasing
It can be acknowledged from the Fig 2:
1. The coefficient of correlation between the browsing
and purchasing of time and amount limited buying is
approximately 0.83
2. The coefficient of correlation between the browsing
and purchasing of daily specials is approximately 0.84
3. The coefficient of correlation between the browsing
and purchasing of guess you like is approximately 0.89
4. The coefficient of correlation between the browsing
and purchasing of related product is approximately
0.95
5. The coefficient of correlation between the browsing
and purchasing of hot sales is approximately 0.85
Therefore, the browsing of all these contents could
promote decision making when purchasing product, which
means customers are very likely to purchase products in these
items after browsing. This confirms that related
recommendation provided by big data analytics could indeed
improve purchasing power. Pay attention to guess you like
and related product: big data analytics could precisely
capture the intention and preference of consumers, offer
Awareness
Knowledge
Attitude
Purchase Intent
Purchase
Postpurchase
Loyalty
Search & Shopping
Purchase
Postpurchase
Loyalty
Attrition
Awareness
Knowledge
Attitude
Purchase Intent
Search & Shopping
Purchase
Postpurchase
Loyalty
Attrition
00.10.20.30.40.50.60.70.80.9
1
Time and amount limited buying
Daily specials
Guess you like
Related product
Hot sales
Historical evaluationTime and amount limited buyingDaily specialsGuess you like
The Effect of Browsing Frequency on Purchasing
Proceedings of the International MultiConference of Engineers and Computer Scientists 2017 Vol II, IMECS 2017, March 15 - 17, 2017, Hong Kong
ISBN: 978-988-14047-7-0 ISSN: 2078-0958 (Print); ISSN: 2078-0966 (Online)
IMECS 2017

recommendations fitting the demand of consumers and thus
improving purchasing power.
Fig 3 (MATLAB calculation flow chart) demonstrates the
rank of PC1 (the first principal component). The first column
corresponds to the option number, the second relates to the
principal component score and the third stands for the rank.
It can be acknowledged from the Fig 3 that the PC1 of the
fourth (related product), the third (guess you like) and the
fifth (hot sales) rank the top three, and thus these three items
have the greatest impact on consumption level.
y1 = zscore( A) * d( :, 6)
y1 =
-2.2286
-2.1398
1.2767
2.1325
0.9592
[f1, i1]= sort( y1) ;
[f2, i2]= sort( i1) ;
[flipud( i1) ,flipud( f1) , f2]
ans =
4.0000 2.1325 1.0000
3.0000 1.2767 2.0000
5.0000 0.9592 3.0000
2.0000 -2.1398 4.0000
1.0000 -2.2286 5.0000 Fig 3. The rank of the first principal component
Fig 4 (MATLAB calculation flow chart) presents the rank
of PC2 (the second principal component). It can be
Acknowledged from Fig 4 that the PC2 of the first (time and
amount limited buying), the fifth (hot sale) and the fourth
(related product) rank the top three, and thus these three items
have the greatest impact on consumption level.
y2 = zscore( A) * d( :, 5)
y2 =
1.5768
-1.5619
-1.1000
0.4565
0.6285
[f1, i1]= sort( y2) ;
[f2, i2]= sort( i1) ;
[flipud( i1) ,flipud( f1) , f2]
ans =
1.0000 1.5768 1.0000
5.0000 0.6285 2.0000
4.0000 0.4565 3.0000
3.0000 -1.1000 4.0000
2.0000 -1.5619 5.0000 Fig 4. The rank of the second principal component
Fig 5 (MATLAB calculation flow chart) illustrates the
main component scores ranking. (The third column
corresponds to the score descending, the first two columns
related to the score of different options in PC1 and PC2, and
the fourth column stands for the serial number of the options).
All principal components analysis:
>> result_report
result_report =
2.1325 0.4565 2.5890 4.0000
0.9592 0.6285 1.5877 5.0000
1.2767 -1.1000 0.1767 3.0000
-2.2286 1.5768 -0.6518 1.0000
-2.1398 -1.5619 -3.7017 2.0000 Fig 5. The main component scores ranking
The result report demonstrates that the fourth option
(related product), the fifth option (hot sales) and the third
option (guess you like) rank top three (achieving 2.5890,
1.5877 and 0.1767 relatively). Therefore, these three items
have the most comprehensive influence on levels of
consumption. The more purchase from these three items
leads to higher average consumption. Simultaneously, related
product, hot sales and guess you like reflect the consumer
recommendation offered by big data analytics. In sum, big
data analytics could largely promote online consumption.
Finally, in order to generate strong insight from the
industrial perspective, an in-depth interview to the marketing
manager of Alibaba was conducted with regard to the impact
of big data analytics on Alibaba. The BDA process of
E-commerce website, Taobao.com, used for marketing is a
closed loop. It includes information collection, big data
analytics, individualized marketing strategy, personalized
shopping experience and order making. It can be seen from
the Fig 6.
Fig 6. The BDA process of Taobao.com for marketing
Each stage in the process has different IT system and
knowledge involved in.
1. Information Collection: Transaction information is the
most important information to collect (Alipay is one of
the significant method for collecting information that
allows to collect information transacted on
Taobao.com and off Taobao.com). Also, personal
information from the Taobao account, such as
shopping cart, devices, searching history, visiting
records demographic information, etc.
Information Collection
BDA
Individualized Marketing Strategy
Personalized Shopping
Experience
Order Making
Proceedings of the International MultiConference of Engineers and Computer Scientists 2017 Vol II, IMECS 2017, March 15 - 17, 2017, Hong Kong
ISBN: 978-988-14047-7-0 ISSN: 2078-0958 (Print); ISSN: 2078-0966 (Online)
IMECS 2017
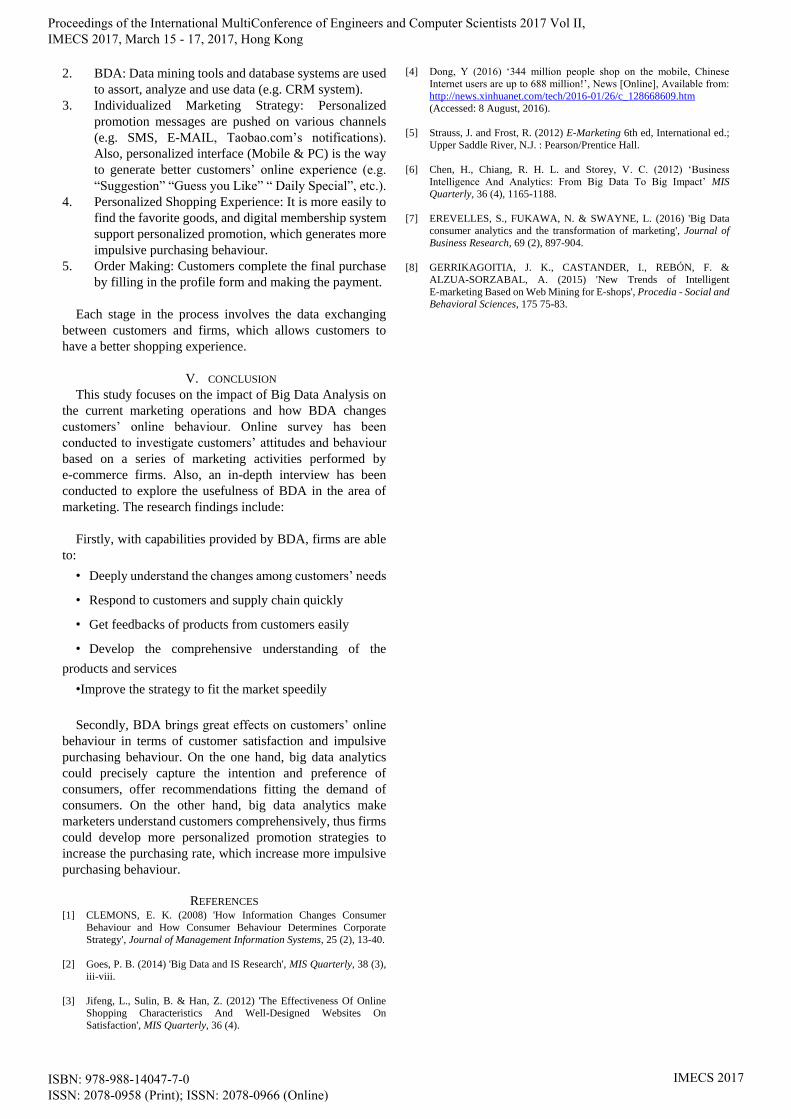
2. BDA: Data mining tools and database systems are used
to assort, analyze and use data (e.g. CRM system).
3. Individualized Marketing Strategy: Personalized
promotion messages are pushed on various channels
(e.g. SMS, E-MAIL, Taobao.com‟s notifications).
Also, personalized interface (Mobile & PC) is the way
to generate better customers‟ online experience (e.g.
“Suggestion” “Guess you Like” “ Daily Special”, etc.).
4. Personalized Shopping Experience: It is more easily to
find the favorite goods, and digital membership system
support personalized promotion, which generates more
impulsive purchasing behaviour.
5. Order Making: Customers complete the final purchase
by filling in the profile form and making the payment.
Each stage in the process involves the data exchanging
between customers and firms, which allows customers to
have a better shopping experience.
V. CONCLUSION
This study focuses on the impact of Big Data Analysis on
the current marketing operations and how BDA changes
customers‟ online behaviour. Online survey has been
conducted to investigate customers‟ attitudes and behaviour
based on a series of marketing activities performed by
e-commerce firms. Also, an in-depth interview has been
conducted to explore the usefulness of BDA in the area of
marketing. The research findings include:
Firstly, with capabilities provided by BDA, firms are able
to:
• Deeply understand the changes among customers‟ needs
• Respond to customers and supply chain quickly
• Get feedbacks of products from customers easily
• Develop the comprehensive understanding of the
products and services
•Improve the strategy to fit the market speedily
Secondly, BDA brings great effects on customers‟ online
behaviour in terms of customer satisfaction and impulsive
purchasing behaviour. On the one hand, big data analytics
could precisely capture the intention and preference of
consumers, offer recommendations fitting the demand of
consumers. On the other hand, big data analytics make
marketers understand customers comprehensively, thus firms
could develop more personalized promotion strategies to
increase the purchasing rate, which increase more impulsive
purchasing behaviour.
REFERENCES [1] CLEMONS, E. K. (2008) 'How Information Changes Consumer
Behaviour and How Consumer Behaviour Determines Corporate
Strategy', Journal of Management Information Systems, 25 (2), 13-40.
[2] Goes, P. B. (2014) 'Big Data and IS Research', MIS Quarterly, 38 (3),
iii-viii.
[3] Jifeng, L., Sulin, B. & Han, Z. (2012) 'The Effectiveness Of Online
Shopping Characteristics And Well-Designed Websites On
Satisfaction', MIS Quarterly, 36 (4).
[4] Dong, Y (2016) „344 million people shop on the mobile, Chinese
Internet users are up to 688 million!‟, News [Online], Available from:
http://news.xinhuanet.com/tech/2016-01/26/c_128668609.htm
(Accessed: 8 August, 2016).
[5] Strauss, J. and Frost, R. (2012) E-Marketing 6th ed, International ed.;
Upper Saddle River, N.J. : Pearson/Prentice Hall.
[6] Chen, H., Chiang, R. H. L. and Storey, V. C. (2012) „Business
Intelligence And Analytics: From Big Data To Big Impact‟ MIS
Quarterly, 36 (4), 1165-1188.
[7] EREVELLES, S., FUKAWA, N. & SWAYNE, L. (2016) 'Big Data
consumer analytics and the transformation of marketing', Journal of
Business Research, 69 (2), 897-904.
[8] GERRIKAGOITIA, J. K., CASTANDER, I., REBÓN, F. &
ALZUA-SORZABAL, A. (2015) 'New Trends of Intelligent
E-marketing Based on Web Mining for E-shops', Procedia - Social and
Behavioral Sciences, 175 75-83.
Proceedings of the International MultiConference of Engineers and Computer Scientists 2017 Vol II, IMECS 2017, March 15 - 17, 2017, Hong Kong
ISBN: 978-988-14047-7-0 ISSN: 2078-0958 (Print); ISSN: 2078-0966 (Online)
IMECS 2017