Embed Size (px)
Citation preview

73
The Impact of Asset Quality on Profitability: A Panel Data Analysis of Domestic Commercial Banks in Sri Lanka
P. D. M. Sanathanee1
Abstract
This research attempts to determine the effects of asset quality on the banking profitability of commercial banks in Sri Lanka. This study is based on secondary data for the period 2008 to 2016, which are obtained from annual reports published by 9 commercial banks in Sri Lanka. The analysis based on panel fixed effect regression indicates that asset quality factors had a negative impact on the bank’s profitability at a statistically insignificant level. This was mainly because asset quality does not solely determine the profitability of banks. Other factors such as capital adequacy, management efficiency, earnings performance and liquidity may also contribute to profitability. Based on the findings, this study recommends that improved investment assets levels and the low rate of non-performing assets needs to be realized through credit risk identification, measurement, monitoring and controlling, in order to achieve high asset quality levels. Accordingly, this study recommends that banks improve credit policy by obtaining collateral and adhering to strong credit risk assessment indicators by following post sanction risk monitoring mechanism.
Keywords: Licensed Commercial Banks, Licensed Specialised Banks, Non-Performing Loans, Gross Domestic Product
1 The auditor is currently serving as Senior Assistant Director of The Department of Bank Supervision. Corresponding email: [email protected]. The views presented in the paper are those of the author and do not necessarily indicate the views of the Central Bank of Sri Lanka.
DOI: http://doi.org/10.4038/ss.v50i1.4722

Central Bank of Sri Lanka – Staff Studies – Volume 50 Number I - 2020
74
74
1. Introduction
Banks engage in financial intermediation by efficiently mobilizing public funds and disbursing to different sets of economic agents in the forms of loans and advances. This intermediation role of banks supports to carry their financial and economic activities effectively. Hence, a bank’s stability in a developing economy is noteworthy as any distress could affect the development plan of the public sector as well as profit and growth motives of private sector (Rajaraman & vasishtha, 2002).
According to Ombaba (2013), the stability of banking is a pre-requisite for economic development and resilience against financial crisis. Further, like any other business, the success of a banking business is mainly assessed based on financial performance, profitability and the quality of assets it possesses.
Assets quality refers to loan quality which associates low default risk. Nagle (1991) states that the problem of assets quality may become the future time bomb for banks. This was proved by Khalid (2012) in an empirical study based on Indian private banks. Yin (1999) referred that the deterioration of assets quality from the ignorance of loan quality by banks is one of the main causes behind the Asian Finance crisis in the early 1990s. Adhikary (2006) mentioned that lower assets quality/ non-performing loans (NPAs) reaching substantial amount may lead to bankruptcies and economic slowdowns as evidenced by the 2008 global crisis.
Considering the importance of managing the quality of assets in banks, “The Standards for Safety and Soundness” were brought in to force by the United States Federal Reserve Board in 1995, stipulating regular reporting obligation on assets quality for Board of Directors of banks in order to evaluate risk on the deformation of assets quality and to form assets quality supervision mechanism by banks to define problems that may arise on assets quality (Eze & Ogbulu, 2016). Further, 7 of the 25 fundamental principles determined by the Basel Committee on Banking Supervision (BCBS) for effective supervision of the banking system are related to assets quality of banks and loan risk management, thereby indicating that assets quality becomes an important aspect of supervision authorities.
Due to the above aspects, it is apparent that better asset quality fosters higher profitability and reduces the cost of failure. From an economic perspective, bad quality of assets leads banks to bankruptcy, damaging the smooth functioning of the economy. This has a contagious effect when it comes to financial assets, intermediary process and financial markets due to inter-linkages.
This research will assess the nature and the level of the inter-relationships between the asset quality of banks and the motive of profitability.

75
The Impact of Asset Quality on Profitability: A Panel Data Analysis of Domestic Commercial Banks in Sri Lanka
75
Accordingly, this study focuses on the impact of asset quality factors on the profitability of commercial banks in Sri Lanka and contributes to growing literature on bank asset quality management while suggesting measures for the policy development process.
Overview of the Banking Industry in Sri Lanka
The banking sector in Sri Lanka comprises of 26 Licensed Commercial Banks (LCBs) and 6 Licensed Specialised Banks (LSBs). Both LCBs and LSBs dominate the financial market by holding 62.1% of the total assets of the financial system out of which LCBs are the major category by holding 54.3%. Further, the importance of LCBs is significant when considering the magnitude of services they provide to the economy. There are 6 large domestic banks which are systematically important, representing a market share of 74% in terms of LCBs sector’s assets out of the 26 LCBs.
According to the Central Bank of Sri Lanka’s Annual Report 2019, the asset portfolio of the banking sector was reported at Rs. 12.5 trillion by end of 2019 and loan portfolio (65%) represented the major component amounting to Rs. 8.1 trillion (Figure 1). Therefore, a bank’s core business is built on loans that are disbursed to different segments in the economy. Hence, it is observed that the loan portfolio of banks is a significant component in the earning structure of banks which mainly accelerate the profit of banks (Figure 2).
Figure 1: Asset structure of Banks Figure 2: Income structure of Banks
Source: Industry data (CEOs’ presentation 2019Q4) Source: Industry data (CEOs’ presentation 2019Q4)

Central Bank of Sri Lanka – Staff Studies – Volume 50 Number I - 2020
76
76
Figure 3: Trend in profitability and loans
Figure 4: Trend in NPAs and profitability
Source: Industry data (CEOs’ presentation 2019Q4) Source: Industry data (CEOs’ presentation 2019Q4)
However, as depicted in Figure 3, even though the loan portfolio of banks mainly accelerates its profits, simultaneous change in profit (profit after tax) had not taken place over the period compared to the change reported in the loan portfolio. Further, an increase in bank profitability shown in Figure 4 is comparatively low when compared with the decrease reported in NPAs.
Significance of the Study
The findings of this study will enable bank managers to formulate strategies in order to enhance better management of their loans/assets portfolio in line with their investment and growth strategies and maximization of wealth goals.
From the perspective of regulators, this study will be useful in policymaking relating to the commercial banks’ asset quality management which will result in further protecting of depositors’ funds while enhancing the bank’s financial performance and economic stability.
Further, this research will contribute to the existing finance related literature and further studies in the field of credit and finance.
2. Literature Review Bank asset quality is a significant factor in banking research as high NPAs leads banks to bankruptcy. However, asset quality and bank efficiency are non-related because operating personnel are not normally involved in the selection and supervision of borrowers. Banks on

77
The Impact of Asset Quality on Profitability: A Panel Data Analysis of Domestic Commercial Banks in Sri Lanka
77
the edge of bankruptcy appear to have a high NPA ratio as well as low cost efficiency. Some studies show that the level of liquidated banks is high due to inefficient credit risk management Khalid (2012), Michael et al (2006), Ombaba (2013).
Streeter (2000) reports that asset quality management was considered one of the major management problems in banks in 2001 based on the self-administrated questionnaires served to the members of American Bankers Association Board which consists of one third of bank officials from all US Banks; the result of the above survey sufficiently proves that asset quality management is a common issue for bankers in practice. Similarly, G Miller (CEO of America Corp.) considered asset quality to be the second most important management issue and formed a task force specifically to handle rising bad assets.
De Yong (1997) observes that a bank’s ranking is significantly affected by asset quality. Bank asset quality is always an important element for the evaluations of bank rating and management. Marshall (1999) also found that one of the main features the best community banks hold is good quality assets. Given that bad quality assets can prompt to downgrade a bank’s rating, it becomes more difficult to earn depositors’ trust, and such banks can therefore only attract deposits by offering a higher deposit rate.
According to Achou and Tenguh (2008), NPAs have an inverse relationship with bank profits. Hence, they suggest prudential credit risk management and safeguarding the assets of banks to protect investor’s interest.
Kosmidou (2008) applied a linear regression model on 23 Greek commercial banks for the period of 1990 to 2002, using Return on Assets (ROA) and the ratio of loan loss reserve to gross loans to proxy profitability and asset quality respectively. The results showed a negative significant impact of asset quality to bank profitability. This was in line with the theory that increased exposure to credit risk is normally associated with decreased firm profitability.
Rajaraman, Bhaumik and Bhatia (1999) have explained the variations in NPAs across Indian banks through differences in operating efficiency, solvency and regional concentration. Rajaraman and Vasishstha (2002) in their empirical study have shown that a significant bivariate relationship exists between NPAs of public sector banks and inefficiency problems. Khalid (2012) examines the relationship between assets quality and operating performance of Indian private commercial banking industry. The analytical model showed that when a bank’s assets quality become worse, it takes more resources for a bank to conduct non-value added credit receiving activities, which leads to poor performance. Using actual data of sample banks from 2006 to 2011, the bank’s operating efficiency scores were obtained through regression which showed that assets quality and profitability were negatively related. He also explains that due to the large number of banks in India which resulted in dropping profit level, rising risk appetite and assets quality deterioration caused by pernicious competition, it led to bank runs.

Central Bank of Sri Lanka – Staff Studies – Volume 50 Number I - 2020
78
78
Not only does a bank’s assets quality affect its financial condition and operating results, but it also affects the soundness of the entire banking system.
Kwan and Eisenbis (1997) examined the relationship between problem loans and bank efficiency by employing the Granger Causality Technique and found that a high level of problem loans causes banks to increase spending on monitoring. Similar results were observed by Abata (2014) by studying the relationship among loan loss ratio, investments to assets ratio and return on assets of banks based on the financial information of the six largest banks in Nigeria. The research found a significant positive relationship between loans to asset ratio and bank profit.
Hempel et al (1994) observed that banks with high loan growth often assume more risk as credit analysis and review procedures are less rigorous. However, returns are high in such loans indicating a risk and return trade-off.
Sensitivity of bank profitability to macroeconomic variables has assumed greater importance in the wake of financial crisis. In general, increased economic growth leads to an increased demand for credit which allows them to increase their charges thereby increasing profitability. Demirguc-Kunt et al (2001) and Biker et al (2002) found a correlation between economic business cycle and credit growth. Demirguc-Kunt and Huizinga (2000) and Athanasoglou et al (2008) point towards a positive relationship between GDP growth and bank profit.
The effect of inflation can be substantial on the solvency of banks. If inflation is fully anticipated and interest rates are adjusted accordingly, then a positive impact on profitability will result. Alternatively, unexpected rises in inflation cause cash flow difficulties for borrowers, which can lead to premature termination of loan arrangement and precipitate loan losses. Guru et al. (2002) and Jiang et al. (2003) found that a high inflation rate leads to higher bank profitability. The study of Abreu and Mendes (2000) presented a negative coefficient for the inflation variable in European countries. Further, Demirguc-Kunt and Huizinga (2000) note that banks in developing countries tend to be less profitable in inflationary environments.
Research Problem
As per the recent financial data of LCBs highlighted in the paragraph on overview of the banking sector in Sri Lanka, less fluctuation in profitability was identified when compared to the high volatility in NPAs.
These results slightly deviate from the established findings of the empirical researches by Kosmidou (2008), Achous & Tenguh (2008), Rajaraman & vasishstha (2002) and Klein (2013) that present a significant strong negative relationship between the lower assets quality and bank profitability. Therefore, the relationship between the assets quality and profitability is worth being studied.

79
The Impact of Asset Quality on Profitability: A Panel Data Analysis of Domestic Commercial Banks in Sri Lanka
79
Based on the literature review, it is clear that only a few studies have been conducted to measure the impact of asset quality on banking profitability using both bank internal factors and macroeconomic factors particularly in the context of developing countries. Similarly, there are very few studies published about the Sri Lankan context due to data unavailability. This is perhaps due to the lack of sufficient published, disaggregated information on the micro management of NPAs and the nature of default.
Considering the gaps highlighted above, this paper derives the following research question:
What is the impact of assets quality factors on bank’s profitability in the commercial banks of Sri Lanka?
Based on the literature review of this study, the null-hypotheses formulated are as follows:
H0: Gross NPA to Gross Advances ratio, Net NPA to Net Advances ratio, Loans to Total Assets Ratio, Provision Coverage Ratio, GDP rate and Inflation rate do not have relationships with bank profitability.
H1: Gross NPA to Gross Advances ratio, Net NPA to Net Advances ratio, Loans to Total Assets Ratio, Provision Coverage Ratio, GDP rate and Inflation rate have relationships with bank profitability.
3. Data, Model and Methodology
3.1 Data
Business models of banks are different in LCBs and LSBs in terms of the ownership structure; e.g., some government-owned banks mainly focus on housing financing, and some are fully dependent on SME financing. Therefore, these specialized banks were excluded from the sample in order to eliminate sample bias and inconsistencies.
Accordingly, this study is limited to include the largest domestic commercial banks that have similar business models. Those are namely, Hatton National Bank, Commercial Bank, Sampath Bank, Seylan Bank, Nations Trust Bank, National Development Bank, Pan Asia Banking Corporation, DFCC Vardhana Bank and Union Bank. State banks and small private banks were excluded from the sample since data of these banks may generate spurious results due to their exceptional business models.
Considering difficulty in accessing and obtaining information for a long period of time, this study considers financial information for the period 2008Q1 to 2016Q4 in order to derive a best-fitted estimation using 320 observations.

Central Bank of Sri Lanka – Staff Studies – Volume 50 Number I - 2020
80
80
Data Sources
Data of banks were mainly obtained from publications such as their annual reports and websites. Macroeconomic variables are retrieved from annual reports published by the Central Bank of Sri Lanka and the publications of the Census and Statistics Department.
3.2 Variables
The literature review on banks’ profitability studies suggests that bank profitability is determined by internal and external factors. Hence, this study considers profitability as the dependent variable, and asset quality variables as independent variables. Independent variables are divided into two sub categories such as bank internal asset quality factors and external macro-economic factors.
Dependent Variables
In this study, bank profitability is measured by Return on Assets (ROA)1 and Return on Equity (ROE)
ROA: This ratio measures the percentage of profits earned per rupee of assets and thus is a measure of the efficiency of the company in generating profits on its assets (ROA =Net Profit/ Total Assets).
ROE: This ratio is defined as net profits expressed as a percentage of shareholder equity and reserves (ROE = Net Profit/ Shareholders’ Fund). Accordingly, the mean of ROA and ROE has been taken as the dependent variable.
Independent Variables
Internal assets quality factors: As the bank internal asset quality factors, Gross NPA to Gross Advances (GNGA), Net NPA to Net Advances (NNNA), Net NPA to Total Assets (NNTA), Loans to total Assets (LTA) and Provision Coverage Ratio (PCR) will be presumed.
GNGA2 : This ratio measures the quality of assets in a situation, where the management has not provided for loss on NPA. Gross NPA is measured as a percentage of Gross Advances (GNGA=Gross NPA/ Gross Advances).
NNNA3 : This ratio is the most standard measure of asset quality and measures the Net NPA as a percentage of Net Advances (NNNA = Net NPA/ Net Advances).
1 Kosmidou (2008), Abata (2014) considered ROA and ROE as key ratios for measuring profitability of banks. 2 Khalid (2012), Rajaraman and Vasishsta (2002) in their empirical studies have shown a negative significant
relationship between NPA and efficiency parameters. 3 Rajaraman and Vasishsta (2002) used this proxy to determine efficiency of assets quality and negative relationship
found.

81
The Impact of Asset Quality on Profitability: A Panel Data Analysis of Domestic Commercial Banks in Sri Lanka
81
NNTA4 : This ratio indicates the efficiency of the bank in assessing credit risk and to an extent recovering the debts (NNTA = Net NPA/ Total Assets).
LTA5 : This ratio explains a bank’s primary objective of lending. A high ratio indicates a bank’s willingness to interest bearing income sources. Loans to Assets ratio is measured as total Loans as a percentage of total Assets of the bank (LTA= Total Loans/ Total Assets).
PCR6 : Provision coverage ratio is an indication of bank credit risk management and is measured by the provisions made by banks as a percentage of total NPA (PCR=provision made/ Total NPA).
External Assets Quality Factors: GDP growth rate (GDP) and Inflation rate (IR) are used as macroeconomic factors which are presumed to have an impact on bank profitability.
GDP7 : GDP indicates overall growth in economy and it is expected to have a positive relationship with a bank’s profits since economic growth would increase bank activity such as increase in a bank’s funding sources and loan growth.
IR8 : This illustrates overall percentage increase in the Colombo Consumer Price Index for goods and services of the economy. The relationship between a bank’s profits and inflation is ambiguous since an increase in inflation would increase loan interest rates and enhance profits as well as increase the financing cost and reduce bank loan recoveries.
Description of variables and its relationships are elaborated in Table 1.
4 Rajaraman and Vasishsta (2002). 5 Abata (2014) studied the relationship between loans to assets ratio and bank profitability. A positive relationship
found. 6 Christos K. Staikouras (1998) used provision coverage ratio as an independent variable and found a negative
relationship on bank performace. 7 Demirguc Kunt et al (2001), Biker et al (2002) introduced economic variables such as GDP and Inflation to their
studies to find out the sensitivity of bank profit for economic changes and found high positive correlations. 8 Refer above 7.

Central Bank of Sri Lanka – Staff Studies – Volume 50 Number I - 2020
82
82
Table 1: Description of Variables
Variables Notation Description Previous studies findings
Expected Relationship
Dependent (Profitability)
ROA ROE
Return on average total assets (ROA =Net Profit/ Total Assets) Return on shareholders’ funds (ROE = Net Profit/ Shareholders’ Fund).
Independent (Assets Quality) Internal Factors: Gross NPA to Gross Advance (GNGA=Gross NPA/ Gross Advances)
GNGA Lower ratio indicates better quality of assets. Low GNGA of banks increases interest income and decrease customer default cost. Hence a negative relationship is expected between profit and GNGA.
Negative significant relationship2
-
Net NPA to Net Advances (NNNA = Net NPA/ Net Advances)
NNNA Net NPAs are gross NPAs net of provision and interest in suspense. Lower ratio indicates better quality of assets and contributes to enhance bank earnings while reducing customer default cost. Inverse relationship is expected.
Negative relationship3
-
Net NPA to Total Assets (NNTA = Net NPA/ Total Assets)
NNTA Net NPAs are calculated by adjusting provisions against Gross NPAs. Lower ratio indicates the better performance of banks.
Negative relationship4
-
Loans to total Assets (LTA= Total Loans/ Total Assets).
LTA Higher the loans increase assets portfolio of banks and accordingly improve bank earnings and profit. A positive relationship is expected.
Positive relationship5
+
Provision Coverage ratio. (PCR=provision made/ Total NPA)
PCR Higher ratio indicates high level of bad assets of the bank and impact to reduce profit of the bank. An inverse relationship is expected.
Negative relationship6
-
External Factors: GDP Growth Rate
GDP GDP is a general index for economic development. High GDP implies economic growth, business expansion and better quality of assets increasing bank profits. A positive relationship is expected.
Significant positive relationship7
+
Inflation Rate IR Inflation is associated with higher costs and reduces profits. Low inflation stabilizes the economy and improves the profit.
Some found positive relationship and some negative8
-/+

83
The Impact of Asset Quality on Profitability: A Panel Data Analysis of Domestic Commercial Banks in Sri Lanka
83
3.3 Model and Methodology
The existing literature and empirical findings suggest a linear form general model as similar studies conducted by Abata (2014), Khalid (2012), Swamy (2015) and many other researches used panel data to measure the relationship between the dependent variable and independent variable.
The primer model that was estimated by Abata (2014), Khalid (2012) and Swamy (2015) using panel techniques is;
α δ + γ ƐWhere Yit is the dependent variable and Xit is a 𝒌𝒌-vector of regressors, and Ɛit is the error terms for i = 1, 2, ………, M cross-sectional units observed for dated periods t = 1, 2, …, T. The α Parameter represents the overall constant in the model, while the δi and γt represent cross-sectional effects and period specific effects (random or fixed) respectively.
Based on the above, the following specification is designed for a panel regression method of this study to analyse the determinants of profitability
α + β +β + β + β + ββ + β δ γ + Ɛ
Where,
Yit = Profitability (Mean of ROA and ROE) i for banks in year t
α = constant. β1, β2, β3, β4, β5, β6 and β7 are regression coefficients.
GNGA = Gross NPA to Gross Advance
NNNA = Net NPA to Net Advances
NNTA = Net NPA to Total Assets
LTA = Loans to Total Assets
PCR = Provision Coverage Ratio
GDP = GDP Rate
IR = Inflation Rate
δi = Cross sectional effect
γt = Time period effect
Ɛit = Error term
i = 10 banks, t = 2008Q1-2016Q4

Central Bank of Sri Lanka – Staff Studies – Volume 50 Number I - 2020
84
84
As per similar studies of existing research literature, a Multiple Regression Model has been adopted for this study using panel data to measure the relationship among the independent and dependent variables. E-views will be used for the econometrics analysis.
3.4 Data and Assumptions
Panel data9 has been used for this multiple regression model as it has the advantage of providing more informative data consisting of both the cross sectional information, which captures individual variability as well as the time series information that captures dynamic adjustment.
This study estimated a Hausman’s specification test as per Greene, 2003 to select whether the best model is a fixed or random effect model to estimate the multiple regression of this study (Table 2).
Accordingly; H0: individual effects are not uncorrelated with other variables.
H1: Ho is not true.
Table :2 Correlated Random Effects - Hausman Test
Test cross-section and period random effects Test Summary Chi-Sq. Statistic Chi-Sq. d.f. Prob. Cross-section random 0.971058 7 0.9953
Period random 8.506501 5 0.1304
Cross-section and period random 8.464509 5 0.1324 Decision: if 0.05>Probability; Null is accepted.
As per the test values, probability values are higher than 0.05. Therefore, the null hypothesis is rejected indicating that individual effects of the regressors of this study are uncorrelated with other variables and a Fixed Effect Model is preferred over a Random Effect Model. Hence, a fixed effect model10 is used and it is assumed that bank specific effects do not significantly vary.
9 The combination of time series with cross sections can enhance the quality and quantity of data in ways that would
be impossible using only one of these two dimensions (Gujarati, 638). 10 “The slope coefficient on independent variable is the same from one entity to the next entity (Cross sections).
Stock and Watson, 2003, p.289-290).

85
The Impact of Asset Quality on Profitability: A Panel Data Analysis of Domestic Commercial Banks in Sri Lanka
85
4. Data Analysis, Estimation and Empirical Results
4.1 General Behaviour of variables
As data represent time series, the general behaviour of independent and dependent variables was tested through descriptive statistics before running the regression model. Descriptive statistics explain the central tendency of variables (Table 3). Since the sample is greater than the 30 observations, two tail tests were carried out at 5 percent significant level (Appendices).
As per Table 3 below, mean ratios of the dependent variable (Y) and other independent variables (GNGA, NNNA, NNTA, PCR, GDP and IR) considered for this study were positive at 5% and 1% significant level respectively. However, the probability value of LTA (0.47) is identified at an insignificant level. Further, the low standard deviation value of independent variables, such as GNGA, NNNA, NNTA, LTA, PCR, and IR reflected that data points of them are extremely close to the mean.
Table 3: Descriptive Statistics
Profitability (Y)
GNGA
NNNA
NNTA
LTA
PCR
GDP
IR
Mean 8.554 6.103 3.144 2.459 64.314 47.526 11165.03 5.334
Median 8.557 5.982 2.856 2.046 65.114 43.662 -2856.00 5.600
Maximum 15.326 14.30 8.929 8.580 79.662 145.67 75916.00 9.300
Minimum 2.423 1.323 -1.261 -0.806 49.161 8.553 28117.00 0.100
Std. Div. 2.736 2.756 2.241 1.691 6.055 22.836 32210.46 2.835
Skewness 0.109 0.519 0.644 0.944 -0.155 1.745 0.66083 -0.443
Kurtosis 2.328 2.796 3.226 3.796 2.872 7.364 2.05152 2.123
Probability 0.0358 0.0005 0.0000 0.0000 0.4741 0.0000 0.0000 0.0000
4.2 Multicolinearity
Correlation among variables was performed to identify multicolinearity. If a correlation coefficient matrix demonstrates correlation of 0.75 or higher among the variables, there may be multicollinearity. Other statisticians suggest that correlations of 0.90 or greater may indicate multicollinearity.11
11 Wooldridge, J M., Introductory Econometrics, 4th Edition, Chapter15.

Central Bank of Sri Lanka – Staff Studies – Volume 50 Number I - 2020
86
86
Accordingly, the correlations among independent variables of this study have been tested through a correlation matrix. Summarized results are given in Table 4 below. As per the results of the correlation matrix, correlations of all variables reported below the level of 0.75 representing a weak correlation position. Therefore, it can be concluded that proposed model does not suffer from any multicolinearity problem.
Table 4 exhibits correlation among the independent variables. Accordingly, strong negative correlation of GNGA is found between LTA, PCR and IR. Also, a weak positive relationship of GNGA is found between NNNA and NNTA, as well as NNTA over NNNA. Further, a weak negative correlation of PCR found with NNNA and NNTA.
Table 4: Correlation Matrix
GNGA NNNA NNTA LTA PCR GDP IR
GNGA 1.00000 NNNA 0.710841 1.00000 NNTA 0.632195 0.701184 1.00000 LTA -0.254711 -0.140006 0.059984 1.00000 PCR -0.496437 -0.647691 -0.640728 0.007225 1.00000 GDP 0.002897 0.012786 0.008301 -0.002238 -0.010083 1.00000 IR -0.039283 0.034701 0.011478 0.055684 0.039021 -0.050197 1.00000
4.3 Testing for stationarity
Stationarity has been tested to see whether the variables are mean reverting or not. According to Mahadeva and Robinson 2004, running an OLS on non-stationary data gives spurious regression results. However, a similar research conducted by Levin, Lin and Chu (2002) and Pesaran and shin (2003) tested the stationarity over the estimation period using LM unit root tests for balanced panels’ series.
Accordingly, this research conducted an LM test and as per the summarized results exhibited in Table 5, independent and dependent variables of this study do not suffer any unit root problems at levels I (0) since null hypothesis of the variables named, Y, GNGA, NNNA, NNTA, LTA and PCR had been rejected at 5% significant level and the null hypothesis of GDP and IR had been rejected at 1% significant level. Hence, in general all variables are considered as mean reverting.

87
The Impact of Asset Quality on Profitability: A Panel Data Analysis of Domestic Commercial Banks in Sri Lanka
87
Table 5: Summary Results of Unit Root Tests
Variable Levin, Lin, Chu Test Pesaran, Shin Test I(o) or I (I) Profitability (Y)
0.0479*
0.0014*
I(o)
GNGA 0.0181* 0.0099* I(o)
NNNA 0.0592* 0.0210* I(o)
NNTA 0.0085* 0.0085* I(o)
LTA 0.0510* 0.0012* I(o)
PCR 0.0058* 0.0000** I(o)
GDP 0.0000** 0.0000** I(o)
IR 0.0000** 0.0000** I(o)
*Stationary at 5% significant level ** Stationary at 1% significant level
4.4 Multiple regression estimation results
This section shows the regression analysis of domestic bank’s profitability and asset quality factors including some macro variables. Using a fixed affect random model, the regression model has been run using E-views 9 application (Table 6).
Table 6: Summary Results of Model I
Variable Coefficient Std. Error Probability
GNGA -0.170118 0.079038 0.0322 NNNA -0.201021 0.109761 0.0680 NNTA -0.228048 0.134262 0.0904 LTA -0.018371 0.025105 0.4649 PCR 0.008508 0.008773 0.3329 GDP 2.95E-06 4.35E-06 0.4983 IR -0.003765 0.049520 0.9394
R-squared 0.215776 Adjusted R-squared 0.197599 Durbin-Watson stat 0.536702
R-squared value12 is the statistical measure to find out how close the data are to the fitted regression line. It is also known as the coefficient of multiple determinations for multiple regression. In general, the higher the R-squared (R2), the better the model fits for data.
12 The coefficient of determination is denoted R2. It must be between 0 and 1, and it measures the proportion of the
total variation in y that is accounted for by variation in the regressors.

Central Bank of Sri Lanka – Staff Studies – Volume 50 Number I - 2020
88
88
From an empirical researcher’s viewpoint, high R2 values arise in the case of a spurious regression (Granger and Newbold, 1974). However, in the summary results of the regression model depicted in Table 6, R2 stood at the level of 0.215776 which is at Moderate level and accepted for this study.
According to Greene (2002), R2 will never decrease when another variable is added to a regression equation. Therefore, a solution is given by this for panel data regressions which have low R2, to establish this result by adding lag dependent variables.
Hence, this study used lag dependent variables for the regression model to determine the movements in the dependent variable.
4.5 Testing for the Classical Assumptions (Robustness) of the Model
Hetroscedasticity
The scatter graph of the residuals does not show any fanning out of errors when the value of x is increasing (Figure 5).
Figure 5: Scatter Plot of errors
-6
-4
-2
0
2
4
6
8
1 - 0
8Q1
1 - 1
0Q3
1 - 1
3Q1
1 - 1
5Q3
2 - 1
0Q1
2 - 1
2Q3
2 - 1
5Q1
3 - 0
9Q3
3 - 1
2Q1
3 - 1
4Q3
4 - 0
9Q1
4 - 1
1Q3
4 - 1
4Q1
5 - 0
8Q3
5 - 1
1Q1
5 - 1
3Q3
6 - 0
8Q1
6 - 1
0Q3
6 - 1
3Q1
6 - 1
5Q3
7 - 1
0Q1
7 - 1
2Q3
7 - 1
5Q1
8 - 0
9Q3
8 - 1
2Q1
8 - 1
4Q3
9 - 0
9Q1
9 - 1
1Q3
9 - 1
4Q1
10 -
08Q3
10 -
11Q1
10 -
13Q3
RESID
However, since it is unable to conclude whether the Var (Ɛ) = σ2 condition is satisfied, the Breusch-Pagan LM test for Heteroscedasticity was performed using the following hypothesis (Greene, (2002).
H0 = Model is homoscedastic
H1= H0 is not true

89
The Impact of Asset Quality on Profitability: A Panel Data Analysis of Domestic Commercial Banks in Sri Lanka
89
Table 7: Results of Breusch-Pagan LM test
Null hypothesis is rejected at 1% significant level and therefore, it is concluded that none of specification suffers from either Heteroscedasticity of the model (Table 7).
Serial-correlation
The Durbin Watson13 statistical test has been used to measure the autocorrelation in the residuals. The Durbin-Watson statistic always remains between 0 and 4. Durbin-Watson statistic of 2 means that there is no autocorrelation in the sample. Further, Greene (2002), mentions that the Durbin-Watson ratio is a clue to detect a nonsense regression where its value is low. As per Table 6 above, the Durbin-Watson value reported at a level of 0.536702 which is lower than the threshold around 2. Therefore, it can be concluded that the proposed model is suffering from an autocorrelation problem.
Balestra and Nerlove (1966), Fomby, Hill and Johnson (1984), Judge et al. (1985), Hsiao (1986), Anderson and Hsiao (1982), Nerlove (1971, 2003), and Baltagi (1995) also faced a similar kind of autocorrelation problem and by adding a lagged dependent variable to the model, the aforesaid studies overcome the autocorrelation.
Further, a solution was suggested by Wooldridge (2002) and Greene (2002) to overcome the autocorrelation of the problematic time series panel data, by running a Dynamic Panel Data Regression Model including the lag-dependent variables as the independent variable until the errors are minimised.
Based on the above literature and empirical studies, the panel regression model of this study was formulated as follows incorporating the lag dependent variable.
+ α + β +β + β + ββ + β + β δ γ Ɛ
13 Durbin’s Test FD = the F statistic for the joint significance of P lags of the residuals in the regression of the least
squares residuals on [xt , yt−1, . . . yt−R, et−1, . . . et−P]. Reject H0 if FD> F[P, T − K− P]. This test examines the partial correlations between the residuals and the lagged residuals, controlling for the intervening effect of the independent variables and the lagged dependent variable (Greene, 2002).
Test Statistic d.f. Prob. Breusch-Pagan LM 124.1971 45 0.0000
Pesaran scaled LM 8.348104 0.0000
Pesaran CD -1.351489 0.1765
Central Bank of Sri Lanka – Staff Studies – Volume 50 Number I - 2020
90
90
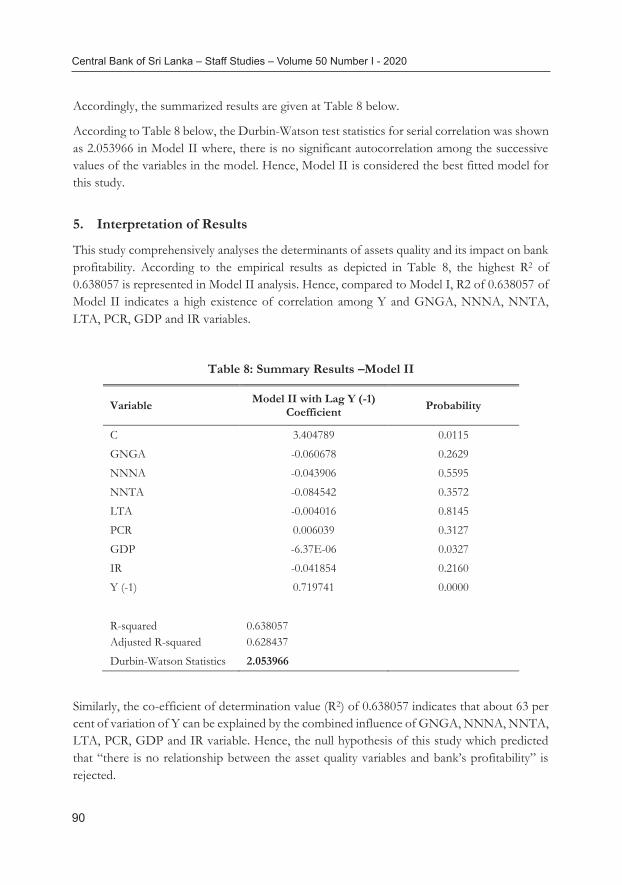
Accordingly, the summarized results are given at Table 8 below.
According to Table 8 below, the Durbin-Watson test statistics for serial correlation was shown as 2.053966 in Model II where, there is no significant autocorrelation among the successive values of the variables in the model. Hence, Model II is considered the best fitted model for this study.
5. Interpretation of Results
This study comprehensively analyses the determinants of assets quality and its impact on bank profitability. According to the empirical results as depicted in Table 8, the highest R2 of 0.638057 is represented in Model II analysis. Hence, compared to Model I, R2 of 0.638057 of Model II indicates a high existence of correlation among Y and GNGA, NNNA, NNTA, LTA, PCR, GDP and IR variables.
Table 8: Summary Results –Model II
Variable Model II with Lag Y (-1) Coefficient Probability
C 3.404789 0.0115 GNGA -0.060678 0.2629 NNNA -0.043906 0.5595 NNTA -0.084542 0.3572 LTA -0.004016 0.8145 PCR 0.006039 0.3127 GDP -6.37E-06 0.0327 IR -0.041854 0.2160 Y (-1) 0.719741 0.0000
R-squared 0.638057
Adjusted R-squared 0.628437 Durbin-Watson Statistics 2.053966
Similarly, the co-efficient of determination value (R2) of 0.638057 indicates that about 63 per cent of variation of Y can be explained by the combined influence of GNGA, NNNA, NNTA, LTA, PCR, GDP and IR variable. Hence, the null hypothesis of this study which predicted that “there is no relationship between the asset quality variables and bank’s profitability” is rejected.

91
The Impact of Asset Quality on Profitability: A Panel Data Analysis of Domestic Commercial Banks in Sri Lanka
91
The Table 2 depicts the five internal determinants of a bank’s assets quality that have been used in this study. However, the results show that three determinants, GNGA, NNNA and NNTA are negatively related to a bank’s profitability at an insignificant level that contradicts the literature. According to the coefficients of GNGA, NNNA and NNTA, at 1% change in these variables, a bank’s profitability may be affected by 0.06%, 0.04% and 0.08% respectively. Khalid (2012), Kosmidou (2008) and Festus Nzoka (2015) also found the same relationship for banks in India, Greece and Kenya respectively at different significant levels.
GNGA indicates a bank’s aggressiveness in lending and the credit risk of the bank. NNNA and NNTA show the same trend as well as GNGA. Achou and Tenguh (2008) in their study found that the lower the ratio the better and these variables are important in determining the profitability of banks because if banks do not effectively manage these risk factors, such profits would be unstable. According to the empirical results of this study, the same negative relationships of GNGA, NNNA and NNTA are found and it suggests that high assets quality/effective credit risk management results in lower cost of recovery, low NPA provisioning, which is less threatening to liquidity and high profitability. These results are consistent with previous findings by Kosmidou (2008) and Festus Nzoka (2014).
The literature identifies that high loan growth often assumes lower profit due to high credit risk, but there is also a high return as the loans have a greater expected return than other assets, such as government securities (Hempel et al., 1994). This statement is further supported by Abata (2014), where his study showed a significant positive relationship between loans to asset ratio and bank profit. However, the empirical results of this study show a 0.004% negative impact on bank profitability at a 1% change in LTA at an insignificant level. This may be due to banks rapidly increasing their loan portfolio and having to pay a higher cost of funding and thereby, showing an inconsistency with the empirical findings of this study and the findings by Abata (2014).
Inflation is associated with higher costs and it could affect in two ways (Guru et al (2002), Jiang et al (2003) and Abreu and Mendes (2000). One would be to expect a negative relationship between inflation and bank profits since low inflation stabilizes the economy and it could improve the bank’s profit due to low NPAs. Other would be to expect a positive relationship since in a high inflation scenario, banks might be encouraged to finance in property markets as an investment strategy that may lead to market losses.
Angela Roman (2003) and Abreu and Mendes (2000) found a strong negative relationship in Romania between IR and bank profit. Even though the said research showed a substantial effect on inflation in solvency of banks, a negative relationship between IR and a bank’s profit was also evident at an insignificant level where 1% change in IR affects the bank’s profit by only 0.04%.

Central Bank of Sri Lanka – Staff Studies – Volume 50 Number I - 2020
92
92
In the Sri Lankan context, fluctuations in inflation affect the change in the bank’s interest rates as well as profit margins. In such a situation, monetary policy involves stabilizing the economy that may result in a weak negative relationship between the variables.
Further, the empirical results illustrate that only one macroeconomic variable is significant in illuminating the bank profitability in Sri Lanka at 5% significant level. However, this study suggests a significant negative relationship between GDP and bank profitability where a 1% change in GDP has a 6.37E06% impact on profitability. The results differ from the similar researches conducted by, Demirguc-Kunt and Huizinga (2000), Michael et at (2006), Athanasoglou et al (2008) and Khalid (2012) that point out a positive relationship between GDP growth and bank profitability, as a general increase in economic growth leads to an increased demand for credit allowing banks to increase their charges thereby increasing profitability.
However, the coefficient may also be negative as countries with higher GDP are assumed to have a banking system that operates in a mature environment resulting in with a more competitive interest and profit margins (Goldberg and Rai, 1996). These data have been obtained from national statistics published in the IMF’s International Financial Statistics.
Further, the Growth rate of GDP affects the supply and demand for loans and deposits of the banks. A bank’s profitability may be driven by real GDP for a number of reasons. First, a bank’s assets quality will depend on the position of economic cycles. In economic upturns, low NPAs and high bank profits can be expected than in economic downturns. Therefore, a bank’s profitability will be positively correlated with GDP growth. Secondly, GDP can affect the market size. In an upturn, there will be a higher demand for bank loans than in a downturn. Hence, higher demand for loans will result in higher profits for banks.
However, as in the case of this study, the coefficient of GDP may also be negative in some situations due to less demand for loans even in an economic upturn where high interest cost is charged by the banks that may lead to high profits margins.
6. Conclusion
This paper attempts to estimate the impact of asset quality factors on bank profitability using two macroeconomic variables. A multiple regression model was used in estimating the coefficient of the model. Based on the results of estimations and robustness tests carried out, it can be concluded that there is a positive relationship between assets quality and a bank’s profitability. Even though previous literature has showed a strong relationship between the assets quality variables and a bank’s profitability, this research confirms that the relationship between assets quality and bank profitability is at an insignificant level. Limitation on sample and data mainly affected to weaken the significance level of the repressors of this study.

93
The Impact of Asset Quality on Profitability: A Panel Data Analysis of Domestic Commercial Banks in Sri Lanka
93
7. Policy Implications, Limitations and Future Research
From the policy maker’s point of view, the regulator’s recommendation to banks is to maintain quality assets in the bank balance sheet in order to ensure the operational efficiency of the bank in the short-term and enhance sustainability in long-run. Hence, findings of this study do not boost the outcome of other similar research findings conducted by Demirguc- Kunt and Huizinga (2000), Michael et at (2006), Athanasoglou et al (2008) and Khalid (2012).
Improper assets quality reduces bank profitability by increasing non-performing loans which may eventually lead to financial distress. As a result, banks need to make efforts to improve their financial soundness by following policy decisions;
a) Use collateral as security when granting loans to reduce further incidence of bad debts.
b) Implement better credit risk assessment indicators to overcome high credit risk that is involved in lending.
c) Ensure continuous post sanction risk monitoring over doubtful debts.
The scope of this study limited to 9 commercial banks and financial information only of 9 years due to the non availability of data. Therefore, further improvement can be made to this research by increasing the sample size, number of observations and incorporating macroeconomic variables such as interest rate and exchange rate fluctuations, thereby opening up avenues for future research in Sri Lanka for a better explanation for proxies in estimating the impact of assets quality.

Central Bank of Sri Lanka – Staff Studies – Volume 50 Number I - 2020
94
94
References
Abata, M. A., “Assets Quality and Bank Performance”, Research Journal of Finance and Accounting, Volume 5, 2014
Abreu, M., and Mendes, V., “Commercial Bank Interest Margins and Profitability”, Evidence for some EU Countries- Preliminary Draft, 2000
Achou, F. T., and Tegnuh, N. C., “Bank Performance and Credit Risk Management”, University of Skovde Press, 2008
Adhikary, B. K., “Nonperforming loans in the banking sector of Bangladesh: Realities and challenges”, Bangladesh Institute of Bank Management, 2006
Albertazzi, U., and Gambacarta, L., “Bank Profitability and Business Cycle”, Journal of Financial Stability, 2009
Athansasoglou, P., Brissimis, S. & Delis, M., “Bank Specific, Industry Specific and Macroeconomic Determinants of Bank Profitability”, Journal of International Financial Markets, Institutions and Money, 2008
Basle Committee on Banking Supervision, “Core Principles to Effective Banking Supervision”, 1997
Bikker, J. A., and Hu, H., “Cyclical Patterns in Profits Provisioning and Lending of Banks”, GNB Staff Report 86/2002, 2002
Eze, G. P., & Ogbulu, O. M., “Asset Quality Management and the Performance of Deposit Money Banks in Nigeria: A Co-integration and Variance Decomposition Analysis”, International Journal of Economics and Financial Research, 2016
Festus K., Nzoka., “The Effect of Assets Quality on the Financial Performance of Commercial Banks in Kenya”, 2014
Greene, Models for panel data, E book, 2002
Gujarati, Basic Econometrics, Fifth Edition, 2004
Guru, B. J., Staunton and B. Balashanmugam., “Determinants of Commercial Bank profitability in Malaysia”, University Multimedia Working Paper, 2002
Hempel, G., H., Simonson, D. G., & Coleman, Bank Management. 4th edition, New York, 1994
Jiang, G. N., Tang, E. Law and A. Sze., “Determinants of Bank Profitability in Hong Kong”, Hong Kong Monetary Authority Research Memorandum, 2003

95
The Impact of Asset Quality on Profitability: A Panel Data Analysis of Domestic Commercial Banks in Sri Lanka
95
Khalid, A. C., “The Impact of Assets Quality on Profitability of Private Banks in India”, Journal of African Macroeconomics Review Vol 2, 2012
Kosmidou, K., Pasiouras, F. & Floropoulos, J., “Linking profits to asset-liability management of domestic and foreign Banks in the UK”, Applied Financial Economics, 2004.
Kunt, A. D., and Huizinga, H., “Financial Structure and Bank Profitability”, Research Articles World Bank, 2000
Mahadeva, L., and Robinson, P., Hand book in Central Banking unit root test to help model building, Bank of England, 2004
Nagle R., “Bank consolidation in to the twenty first century”, Bankers magazine, 1991.
Ombaba, k. B., Mwengei., “Assessing the factors contributing to non-performing loans”, Journal of Business & Management, 2013
Rajaraman, B., and Bhatia, N., “NPA Variation across Indian Commercial Banks”, Economic and Political weekly, 1999
Rajaraman, I., and Vasishstha, G. “Non-Performing Loans of Public Sector Banks”, Economic and Political Weekly, 2002
Ranjan, R., and Sarath C,. “Non-Performing Loan and Terms of Credit of Public Sector Banks in India”, Reserve Bank India, 2003
Sinha, P. and Sharma, S., “Determinants of Bank Profits and its Persistence in Indian Banks”, Retrieved from http://mpra.ub.uni-muenchen.de/61378/, 2014
Streeter, W., “Top Issues & Trends”, ABA Banking Journal, 2000
Vighneswara, Swamy., “Modeling Bank Assets Quality and Profitability”, E-Journal, 2015
Wasiuzzaman, S., and Ahmed T., “Profitability of Islamic Banks in Malaysia”, Journal of Islamic economics, 2010
Whalen, G., “A Proportional Hazards Model of Bank Failure”, Economic Review, Federal Reserve Bank of Cleveland, 1991
Yin, N. P., “Look at Taiwan’s Banking Problems from Asian Finance Crisis”, Banking Finance Magazine, 1999

Central Bank of Sri Lanka – Staff Studies – Volume 50 Number I - 2020
96
96
Appendices
A.1
Figure A1: Behaviour of Data
-2
0
2
4
6
8
10
1 -
08Q
1 1
- 12
Q1
2 -
08Q
1 2
- 12
Q1
3 -
08Q
1 3
- 12
Q1
4 -
08Q
1 4
- 12
Q1
5 -
08Q
1 5
- 12
Q1
6 -
08Q
1 6
- 12
Q1
7 -
08Q
1 7
- 12
Q1
8 -
08Q
1 8
- 12
Q1
9 -
08Q
1 9
- 12
Q1
10
- 08Q
1 1
0 - 1
2Q1
NNNA
48
52
56
60
64
68
72
76
80
1 -
08Q
1 1
- 12
Q1
2 -
08Q
1 2
- 12
Q1
3 -
08Q
1 3
- 12
Q1
4 -
08Q
1 4
- 12
Q1
5 -
08Q
1 5
- 12
Q1
6 -
08Q
1 6
- 12
Q1
7 -
08Q
1 7
- 12
Q1
8 -
08Q
1 8
- 12
Q1
9 -
08Q
1 9
- 12
Q1
10
- 08Q
1 1
0 - 1
2Q1
LTA
0
2
4
6
8
10
12
14
16
1 -
08Q
1 1
- 12
Q1
2 -
08Q
1 2
- 12
Q1
3 -
08Q
1 3
- 12
Q1
4 -
08Q
1 4
- 12
Q1
5 -
08Q
1 5
- 12
Q1
6 -
08Q
1 6
- 12
Q1
7 -
08Q
1 7
- 12
Q1
8 -
08Q
1 8
- 12
Q1
9 -
08Q
1 9
- 12
Q1
10
- 08Q
1 1
0 - 1
2Q1
GNGA
-2
0
2
4
6
8
10
1 -
08Q
1 1
- 12
Q1
2 -
08Q
1 2
- 12
Q1
3 -
08Q
1 3
- 12
Q1
4 -
08Q
1 4
- 12
Q1
5 -
08Q
1 5
- 12
Q1
6 -
08Q
1 6
- 12
Q1
7 -
08Q
1 7
- 12
Q1
8 -
08Q
1 8
- 12
Q1
9 -
08Q
1 9
- 12
Q1
10
- 08Q
1 1
0 - 1
2Q1
NNNA

97
The Impact of Asset Quality on Profitability: A Panel Data Analysis of Domestic Commercial Banks in Sri Lanka
97
0
2
4
6
8
10
1 - 0
8Q1
1 - 1
2Q1
2 - 0
8Q1
2 - 1
2Q1
3 - 0
8Q1
3 - 1
2Q1
4 - 0
8Q1
4 - 1
2Q1
5 - 0
8Q1
5 - 1
2Q1
6 - 0
8Q1
6 - 1
2Q1
7 - 0
8Q1
7 - 1
2Q1
8 - 0
8Q1
8 - 1
2Q1
9 - 0
8Q1
9 - 1
2Q1
10 -
08Q1
10 -
12Q1
IR
0
20
40
60
80
100
120
140
160
1 -
08Q1
1 -
12Q1
2 -
08Q1
2 -
12Q1
3 -
08Q1
3 -
12Q1
4 -
08Q1
4 -
12Q1
5 -
08Q1
5 -
12Q1
6 -
08Q1
6 -
12Q1
7 -
08Q1
7 -
12Q1
8 -
08Q1
8 -
12Q1
9 -
08Q1
9 -
12Q1
10
- 08Q
1 1
0 - 1
2Q1
PCR
-40,000
-20,000
0
20,000
40,000
60,000
80,000
1 -
08Q
1 1
- 12
Q1
2 -
08Q
1 2
- 12
Q1
3 -
08Q
1 3
- 12
Q1
4 -
08Q
1 4
- 12
Q1
5 -
08Q
1 5
- 12
Q1
6 -
08Q
1 6
- 12
Q1
7 -
08Q
1 7
- 12
Q1
8 -
08Q
1 8
- 12
Q1
9 -
08Q
1 9
- 12
Q1
10
- 08Q
1 1
0 - 1
2Q1
DGDP