Embed Size (px)
Citation preview
International Journal of
Environmental Research
and Public Health
Article
The Immediate and Long-Term Impact of Military AircraftNoise on Hearing: A Cross-Sectional Comparison of FighterPilots and Ground Staff
Chao-Yin Kuo 1,2, Chia-Lien Hung 3, Hsin-Chien Chen 1 , Cheng-Ping Shih 1 , Rou-Huei Lu 1, Chen-Wai Chen 4,Li-Wen Hung 1, Yi-Chun Lin 5, Hang-Kang Chen 1,3 , Da-Ming Chu 4 , Yuan-Yung Lin 1,5, Yueh-Chun Chen 4,*and Chih-Hung Wang 1,3,5,*
�����������������
Citation: Kuo, C.-Y.; Hung, C.-L.;
Chen, H.-C.; Shih, C.-P.; Lu, R.-H.;
Chen, C.-W.; Hung, L.-W.; Lin, Y.-C.;
Chen, H.-K.; Chu, D.-M.; et al. The
Immediate and Long-Term Impact of
Military Aircraft Noise on Hearing: A
Cross-Sectional Comparison of
Fighter Pilots and Ground Staff. Int. J.
Environ. Res. Public Health 2021, 18,
2982. https://doi.org/10.3390/
ijerph18062982
Academic Editor: Yvonne De
Kluizenaar
Received: 6 February 2021
Accepted: 9 March 2021
Published: 14 March 2021
Publisher’s Note: MDPI stays neutral
with regard to jurisdictional claims in
published maps and institutional affil-
iations.
Copyright: © 2021 by the authors.
Licensee MDPI, Basel, Switzerland.
This article is an open access article
distributed under the terms and
conditions of the Creative Commons
Attribution (CC BY) license (https://
creativecommons.org/licenses/by/
4.0/).
1 Department of Otolaryngology-Head and Neck Surgery, Tri-Service General Hospital,National Defense Medical Center, Taipei 11490, Taiwan; [email protected] (C.-Y.K.);[email protected] (H.-C.C.); [email protected] (C.-P.S.); [email protected] (R.-H.L.);[email protected] (L.-W.H.); [email protected] (H.-K.C.); [email protected] (Y.-Y.L.)
2 Institute of Cognitive Neuroscience, National Central University, Taoyuan 32001, Taiwan3 Taichung Armed Forces General Hospital, Taichung 41168, Taiwan; [email protected] School of Public Health, National Defense Medical Center, Taipei 11490, Taiwan;
[email protected] (C.-W.C.); [email protected] (D.-M.C.)5 Graduate Institute of Medical Sciences, National Defense Medical Center, Taipei 11490, Taiwan;
[email protected]* Correspondence: [email protected] (Y.-C.C.); [email protected] (C.-H.W.);
Tel.: +886-2-27303742 (Y.-C.C.); +886-2-87927192 (C.-H.W.);Fax: +886-2-27303742 (Y.-C.C.); +886-2-87927193 (C.-H.W.)
Abstract: We examined the immediate and long-term impacts of military aircraft noise exposureon noise-induced hearing loss (NIHL) in fighter pilots and ground staff. We recruited 40 pilots,40 ground staff, and 136 age-matched controls; all participants underwent hearing tests, includingconventional pure-tone audiometry (PTA) (0.25–8.0 kHz), extended high-frequency (EHF) audiom-etry (9.0–18.0 kHz), and distortion-product otoacoustic emission (DPOAE) as a recent reference.A subsequent hearing test immediately after flight-mission noise exposure was requested. The resultsrevealed higher recent hearing thresholds in pilots and ground staff than in controls. Thresholdshifts at many octave band frequencies were also significantly elevated in ground staff. The groupedfrequency threshold was significantly elevated in the 4–8 kHz high-frequency range. After a singleflight-mission noise exposure, both ground staff and pilots showed decreased signal-to-noise ratiosfor DPOAE (1–8 kHz), whereas only ground staff showed significantly elevated left-ear hearingthresholds at 3, 11.2, and 12.5 kHz by conventional and EHF PTA. Fighter pilots and ground staffserve in hazardous noise-exposed environments that cause hearing damage and subsequent NIHL,but ground staff may be more vulnerable. A comprehensive hearing conservation program should beimplemented to protect high-risk service members, and especially ground staff, from high-intensitynoise exposure.
Keywords: military noise; noise-induced hearing loss (NIHL); fighter aircraft; pilot; ground staff;pure-tone audiometry (PTA); extended high-frequency (EHF) audiometry; distortion-product otoa-coustic emissions (DPOAEs); signal-to-noise ratio (SNR)
1. Introduction
The adverse impact of noise from military operations on hearing among militaryservice members has long been considered an important global health issue. The resultinghearing impairment can also further interfere with the effective execution of militaryoperations. Hearing loss is one of the most common occupational health hazards, andtinnitus and hearing impairment are the most common disabilities among veterans of theUnited States military forces [1,2].
Int. J. Environ. Res. Public Health 2021, 18, 2982. https://doi.org/10.3390/ijerph18062982 https://www.mdpi.com/journal/ijerph

Int. J. Environ. Res. Public Health 2021, 18, 2982 2 of 13
Noise can be classified into different types, including continuous, variable, intermit-tent, or impulsive, depending on how the noise changes over time. Continuous noise maycause greater cochlear damage and a permanent hearing threshold shift compared to inter-mittent noise [3]. Impulse noise, which is characterized by less than 1 s of high-intensitysound with sharp rise and decay, is even more pernicious in its damage compared withcontinuous sound with the same acoustic power spectrum [4]. With compulsory militaryservice gradually shifting to a volunteer force, the risk of occupational noise-inducedhearing loss (NIHL) in people serving in the military workplaces should be recognizedand prevented.
Several clinical auditory functional tests are used currently, but pure-tone audiometry(PTA) has long been a useful and widely used tool for assessing auditory function forhearing screening in both the clinical and on-site workplace settings. However, otoacousticemissions (OAEs) have subsequently been introduced for research and clinical applica-tions [5,6]. The OAEs represent the amplifications of sounds originating from the outerhair cells (OHC) in the cochlea and can be measured in the external auditory canal [6,7].Clinical applications of OAEs therefore mainly focus on the identification of sensory hear-ing loss due to outer hair cell damage. The OHCs are the first and the most affected cells inNIHL [8], so an OAE examination provides a quick and easy way to monitoring hearingstatus in settings like the military [9] or industry [10,11]. Furthermore, the decrease in theamplitude of the distortion product otoacoustic emissions (DPOAEs) is also well correlatedwith OHC loss [12]. Compared to other types of OAEs, the DPOAEs seem to be superiorfor predicting the development of NIHL [13,14].
Another hearing test, extended high-frequency (EHF) audiometry, is now drawingmuch interest for early detection of sensorineural hearing loss. EHF audiometry is definedas a threshold measurement above the frequency of 8 kHz and is especially useful fordetecting damage at the basal turn of the hair cells. Several studies have suggested thatEHF audiometry is particular useful for assessing ototoxic drug-induced and noise-inducedhearing loss, as well as age-related hearing loss (presbycusis) associated with sub-clinicalhearing difficulties [15–18].
The aim of the present study was to use these audiometric examination tools to surveythe hearing status of young military personnel serving at an air force base as a way toestablish the best diagnostic tool for NIHL detection. A secondary aim was to identify theimmediate noise impact of a single flight mission on the hearing of fighter pilots and airforce ground staff.
2. Materials and Methods2.1. Study Design and Recruitment of Participants
This cross-sectional study evaluated the hearing condition of military personnelbefore and after a one-time noise exposure during flight missions. We recruited militarymembers who served at a military air base, enrolling ground staff, fighter aircraft pilots,and age-matched control subjects whose duties did not involve fighter aircraft operation.Participants with a history of ear trauma, any previous ear surgery, or otitis media wereexcluded. All participants completed a questionnaire regarding their daily work, hearingcondition, and whether they routinely wore a hearing protection device (HPD) in or overthe ears while exposed to hazardous noise levels exceeding 85 dB within the workplace.Before performing the hearing tests, all participants underwent otoscopic examinationsby an otologist to ensure the patency of the external auditory canal and to exclude anyotological diseases. The recent hearing conditions of personnel in each group, reflectingthe long term impact of military noise on hearing, were determined by conventional PTA,EHF audiometry, and DPOAE tests. Pilots and ground staff who were exposed to a singleflight task-related noise were requested to undergo another hearing test battery as abovewithin 2–4 h after the exposure.

Int. J. Environ. Res. Public Health 2021, 18, 2982 3 of 13
2.2. Ethical Considerations
The Tri-Service General Hospital Institutional Review Board approved the researchproject with ethical approval code: TSGHIRB 2-105-05-107.
2.3. Conventional Pure-Tone and Extended High-Frequency Audiometry
Participants were tested in a sound-attenuating test booth established in a van equippedwith a mobile audiologic unit that conformed to ANSI/ASA S3.1-1999 (R2018) specifica-tions for audiometric test rooms. We obtained conventional PTA of all subjects at octavefrequencies from 0.25 to 8 kHz for each ear using a Grason-Stadler GSI 61 clinical audiome-ter (Nicolet Biomedical, Madison, WI, USA) with TDH-50P headphones (Telephonics Corp.,Farmingdale, NY, USA). Frequencies over 8 kHz are termed extended high-frequencies(EHFs). Pure-tone hearing thresholds in the EHF range (9, 10, 11.2, 12.5, 14, 16, and 18 kHz)were determined using a GSI 61 clinical audiometer with Sennheiser HDA 200 circumau-ral earphones (Sennheiser Co, Germany). A descending⁄ascending method in 5 dB stepsrevealed hearing threshold levels. Responses were considered reliable if the differencebetween the test and retest thresholds was no more than 5 dB. If thresholds exceeded theequipment’s maximum output level, a “X” symbol was indicated.
We calculated the arithmetic mean of the grouped-frequencies threshold as pure-toneaverages (PTAs) of three-frequency (0.5, 1, and 2 kHz; 3FPTA), four-frequency (0.5, 1, 2,and 4 kHz; 4FPTA), high-frequency (4, 6, and 8 kHz; HFPTA), overall-frequency (0.25, 0.5,1, 2, 3, 4, and 8 KHz; OFPTA), and extended high-frequency (9, 10, 11.2, 12.5, 14, 16, and18 kHz; EHFPTA) PTAs.
2.4. Otoacoustic Emissions
Participants were tested in a sound-attenuating test booth, as described previouslyfor obtaining the PTA. The distortion product otoacoustic emissions (DPOAEs) wererecorded for both ears of all participants using the Bio-Logic Scout Sport System (v. 3.02,model 3.33.00, Natus Medical Inc., Schaumburg, IL, USA). The DPOAE test consisted ofpresenting two primary tones at frequencies f1 and f2 and levels L1 and L2. The frequencyratio f2/f1 was fixed at 1.22. The stimulus sound pressure levels were set at L1 = 65 dB andL2 = 55 dB. These parameters are expected to elicit optimal DPOAE magnitudes [19,20].Insert transducers were placed in each participant’s ear canal, where the paired primarytones were delivered. Distortion product OAEs corresponding to the frequency 2f1-f2were recorded and plotted as a function of f2 frequency (DP-grams). The DPOAE levelwas compared against the noise floor estimate for the corresponding center frequency todetermine the signal-to-noise ratio (SNR). For all f2 frequencies, only SNR > 6 dB wasregarded as a presented DP that could be included for comparing the change between tests.
2.5. Noise Measurement and Analysis
The noise level was measured and recorded from within the hardened aircraft shelter,where the fighter aircraft is protected and the ground staff can perform necessary main-tenance and prepare the aircraft for flight. For acoustic measurements, the equipmentincluded an acoustic fixture (GRAS 45CB; Sound & Vibration AS, Denmark) and a blastprobe microphone (GRAS 67SB) operated with power support modules (GRAS 12AA2-Channel Power Module, SysCheck generator and GRAS 12AQ 2-Channel UniversalPower Module). This equipment was placed 7 m from the aircraft, as this setting simulatedthe real working distance between the ground staff and aircraft and met ANSI S12.42standards. Computers (Lenovo Ideapad 700 15ISK) equipped with SpectraPlus-DT andSpectraPlus-DT9837A software (Pioneer Hill Software LLC. Poulsbo, WA, USA) were usedfor data collection and analysis. All equipment was calibrated using the GRAS Type 42APIntelligent Pistonphone. Application of fast Fourier transform gave a noise spectrum andspectrogram that showed the distribution of noise intensities as a function of frequencyover time.
Int. J. Environ. Res. Public Health 2021, 18, 2982 4 of 13
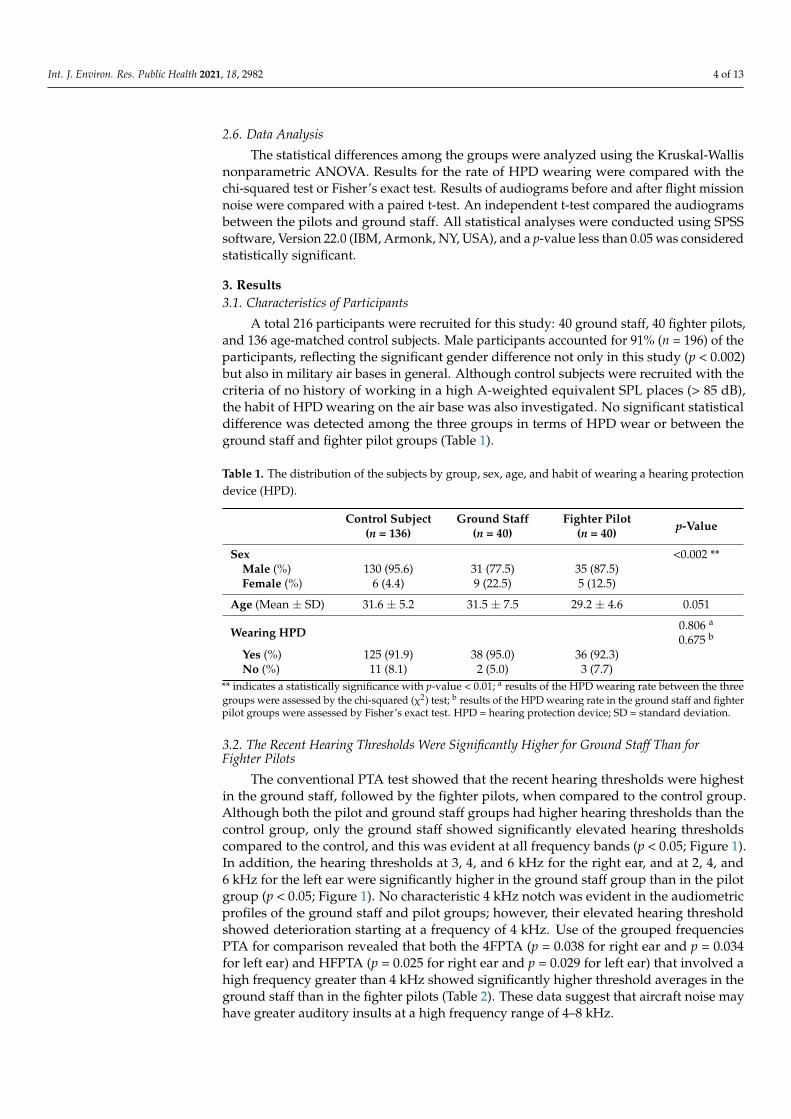
2.6. Data Analysis
The statistical differences among the groups were analyzed using the Kruskal-Wallisnonparametric ANOVA. Results for the rate of HPD wearing were compared with thechi-squared test or Fisher’s exact test. Results of audiograms before and after flight missionnoise were compared with a paired t-test. An independent t-test compared the audiogramsbetween the pilots and ground staff. All statistical analyses were conducted using SPSSsoftware, Version 22.0 (IBM, Armonk, NY, USA), and a p-value less than 0.05 was consideredstatistically significant.
3. Results3.1. Characteristics of Participants
A total 216 participants were recruited for this study: 40 ground staff, 40 fighter pilots,and 136 age-matched control subjects. Male participants accounted for 91% (n = 196) of theparticipants, reflecting the significant gender difference not only in this study (p < 0.002)but also in military air bases in general. Although control subjects were recruited with thecriteria of no history of working in a high A-weighted equivalent SPL places (> 85 dB),the habit of HPD wearing on the air base was also investigated. No significant statisticaldifference was detected among the three groups in terms of HPD wear or between theground staff and fighter pilot groups (Table 1).
Table 1. The distribution of the subjects by group, sex, age, and habit of wearing a hearing protectiondevice (HPD).
Control Subject(n = 136)
Ground Staff(n = 40)
Fighter Pilot(n = 40) p-Value
Sex <0.002 **Male (%) 130 (95.6) 31 (77.5) 35 (87.5)Female (%) 6 (4.4) 9 (22.5) 5 (12.5)
Age (Mean ± SD) 31.6 ± 5.2 31.5 ± 7.5 29.2 ± 4.6 0.051
Wearing HPD 0.806 a
0.675 b
Yes (%) 125 (91.9) 38 (95.0) 36 (92.3)No (%) 11 (8.1) 2 (5.0) 3 (7.7)
** indicates a statistically significance with p-value < 0.01; a results of the HPD wearing rate between the threegroups were assessed by the chi-squared (χ2) test; b results of the HPD wearing rate in the ground staff and fighterpilot groups were assessed by Fisher’s exact test. HPD = hearing protection device; SD = standard deviation.
3.2. The Recent Hearing Thresholds Were Significantly Higher for Ground Staff Than forFighter Pilots
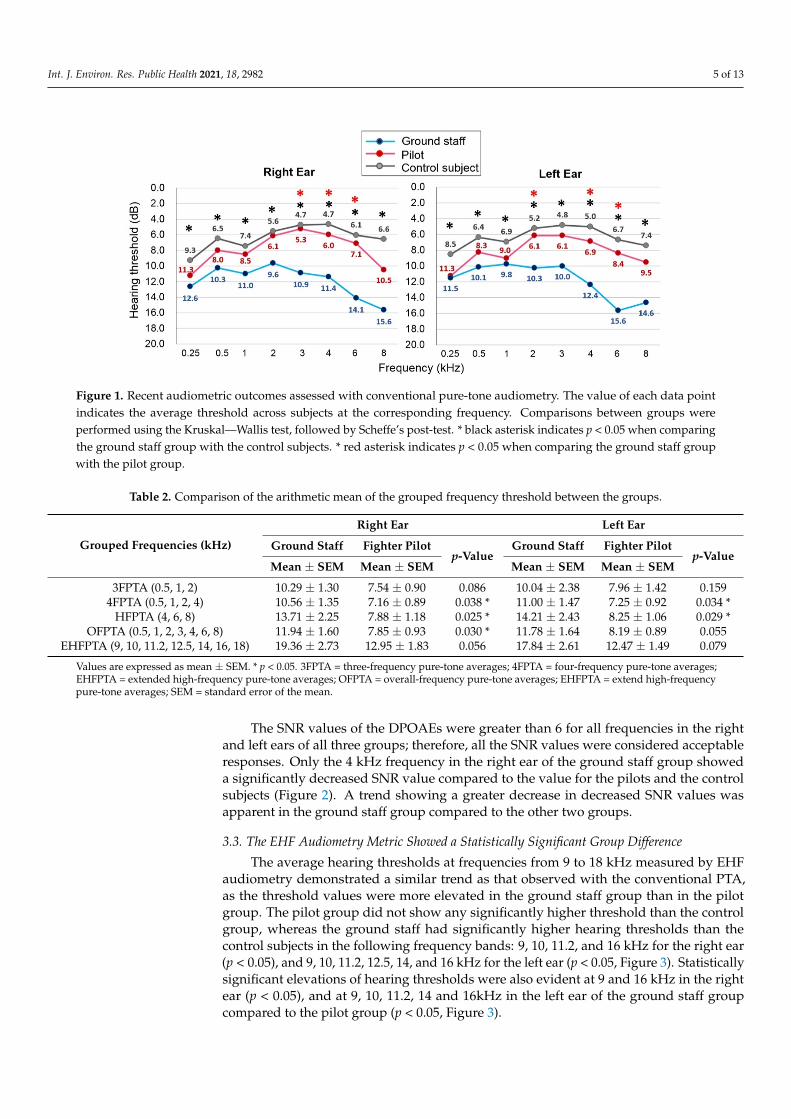
The conventional PTA test showed that the recent hearing thresholds were highestin the ground staff, followed by the fighter pilots, when compared to the control group.Although both the pilot and ground staff groups had higher hearing thresholds than thecontrol group, only the ground staff showed significantly elevated hearing thresholdscompared to the control, and this was evident at all frequency bands (p < 0.05; Figure 1).In addition, the hearing thresholds at 3, 4, and 6 kHz for the right ear, and at 2, 4, and6 kHz for the left ear were significantly higher in the ground staff group than in the pilotgroup (p < 0.05; Figure 1). No characteristic 4 kHz notch was evident in the audiometricprofiles of the ground staff and pilot groups; however, their elevated hearing thresholdshowed deterioration starting at a frequency of 4 kHz. Use of the grouped frequenciesPTA for comparison revealed that both the 4FPTA (p = 0.038 for right ear and p = 0.034for left ear) and HFPTA (p = 0.025 for right ear and p = 0.029 for left ear) that involved ahigh frequency greater than 4 kHz showed significantly higher threshold averages in theground staff than in the fighter pilots (Table 2). These data suggest that aircraft noise mayhave greater auditory insults at a high frequency range of 4–8 kHz.
Int. J. Environ. Res. Public Health 2021, 18, 2982 5 of 13
Int. J. Environ. Res. Public Health 2021, 18, x 5 of 13
Although both the pilot and ground staff groups had higher hearing thresholds than the control group, only the ground staff showed significantly elevated hearing thresholds compared to the control, and this was evident at all frequency bands (p < 0.05; Figure 1). In addition, the hearing thresholds at 3, 4, and 6 kHz for the right ear, and at 2, 4, and 6 kHz for the left ear were significantly higher in the ground staff group than in the pilot group (p < 0.05; Figure 1). No characteristic 4 kHz notch was evident in the audiometric profiles of the ground staff and pilot groups; however, their elevated hearing threshold showed deterioration starting at a frequency of 4 kHz. Use of the grouped frequencies PTA for comparison revealed that both the 4FPTA (p = 0.038 for right ear and p = 0.034 for left ear) and HFPTA (p = 0.025 for right ear and p = 0.029 for left ear) that involved a high frequency greater than 4 kHz showed significantly higher threshold averages in the ground staff than in the fighter pilots (Table 2). These data suggest that aircraft noise may have greater auditory insults at a high frequency range of 4–8 kHz.
Figure 1. Recent audiometric outcomes assessed with conventional pure-tone audiometry. The value of each data point indicates the average threshold across subjects at the corresponding frequency. Comparisons between groups were per-formed using the Kruskal—Wallis test, followed by Scheffe’s post-test. * black asterisk indicates p < 0.05 when comparing the ground staff group with the control subjects. * red asterisk indicates p < 0.05 when comparing the ground staff group with the pilot group.
Table 2. Comparison of the arithmetic mean of the grouped frequency threshold between the groups.
Right Ear Left Ear Ground Staff Fighter Pilot
p-Value Ground Staff Fighter Pilot
p-Value Grouped Frequencies (kHz) Mean ± SEM Mean ± SEM Mean ± SEM Mean ± SEM
3FPTA (0.5, 1, 2) 10.29 ± 1.30 7.54 ± 0.90 0.086 10.04 ± 2.38 7.96 ± 1.42 0.159 4FPTA (0.5, 1, 2, 4) 10.56 ± 1.35 7.16 ± 0.89 0.038 * 11.00 ± 1.47 7.25 ± 0.92 0.034 *
HFPTA (4, 6, 8) 13.71 ± 2.25 7.88 ± 1.18 0.025 * 14.21 ± 2.43 8.25 ± 1.06 0.029 * OFPTA (0.5, 1, 2, 3, 4, 6, 8) 11.94 ± 1.60 7.85 ± 0.93 0.030 * 11.78 ± 1.64 8.19 ± 0.89 0.055
EHFPTA (9, 10, 11.2, 12.5, 14, 16, 18) 19.36 ± 2.73 12.95 ± 1.83 0.056 17.84 ± 2.61 12.47 ± 1.49 0.079 Values are expressed as mean ± SEM. * p < 0.05. 3FPTA = three-frequency pure-tone averages; 4FPTA = four-frequency pure-tone averages; EHFPTA = extended high-frequency pure-tone averages; OFPTA = overall-frequency pure-tone aver-ages; EHFPTA = extend high-frequency pure-tone averages; SEM = standard error of the mean.
The SNR values of the DPOAEs were greater than 6 for all frequencies in the right and left ears of all three groups; therefore, all the SNR values were considered acceptable responses. Only the 4 kHz frequency in the right ear of the ground staff group showed a significantly decreased SNR value compared to the value for the pilots and the control
Figure 1. Recent audiometric outcomes assessed with conventional pure-tone audiometry. The value of each data pointindicates the average threshold across subjects at the corresponding frequency. Comparisons between groups wereperformed using the Kruskal—Wallis test, followed by Scheffe’s post-test. * black asterisk indicates p < 0.05 when comparingthe ground staff group with the control subjects. * red asterisk indicates p < 0.05 when comparing the ground staff groupwith the pilot group.
Table 2. Comparison of the arithmetic mean of the grouped frequency threshold between the groups.
Grouped Frequencies (kHz)
Right Ear Left Ear
Ground Staff Fighter Pilotp-Value
Ground Staff Fighter Pilotp-Value
Mean ± SEM Mean ± SEM Mean ± SEM Mean ± SEM
3FPTA (0.5, 1, 2) 10.29 ± 1.30 7.54 ± 0.90 0.086 10.04 ± 2.38 7.96 ± 1.42 0.1594FPTA (0.5, 1, 2, 4) 10.56 ± 1.35 7.16 ± 0.89 0.038 * 11.00 ± 1.47 7.25 ± 0.92 0.034 *
HFPTA (4, 6, 8) 13.71 ± 2.25 7.88 ± 1.18 0.025 * 14.21 ± 2.43 8.25 ± 1.06 0.029 *OFPTA (0.5, 1, 2, 3, 4, 6, 8) 11.94 ± 1.60 7.85 ± 0.93 0.030 * 11.78 ± 1.64 8.19 ± 0.89 0.055
EHFPTA (9, 10, 11.2, 12.5, 14, 16, 18) 19.36 ± 2.73 12.95 ± 1.83 0.056 17.84 ± 2.61 12.47 ± 1.49 0.079
Values are expressed as mean ± SEM. * p < 0.05. 3FPTA = three-frequency pure-tone averages; 4FPTA = four-frequency pure-tone averages;EHFPTA = extended high-frequency pure-tone averages; OFPTA = overall-frequency pure-tone averages; EHFPTA = extend high-frequencypure-tone averages; SEM = standard error of the mean.
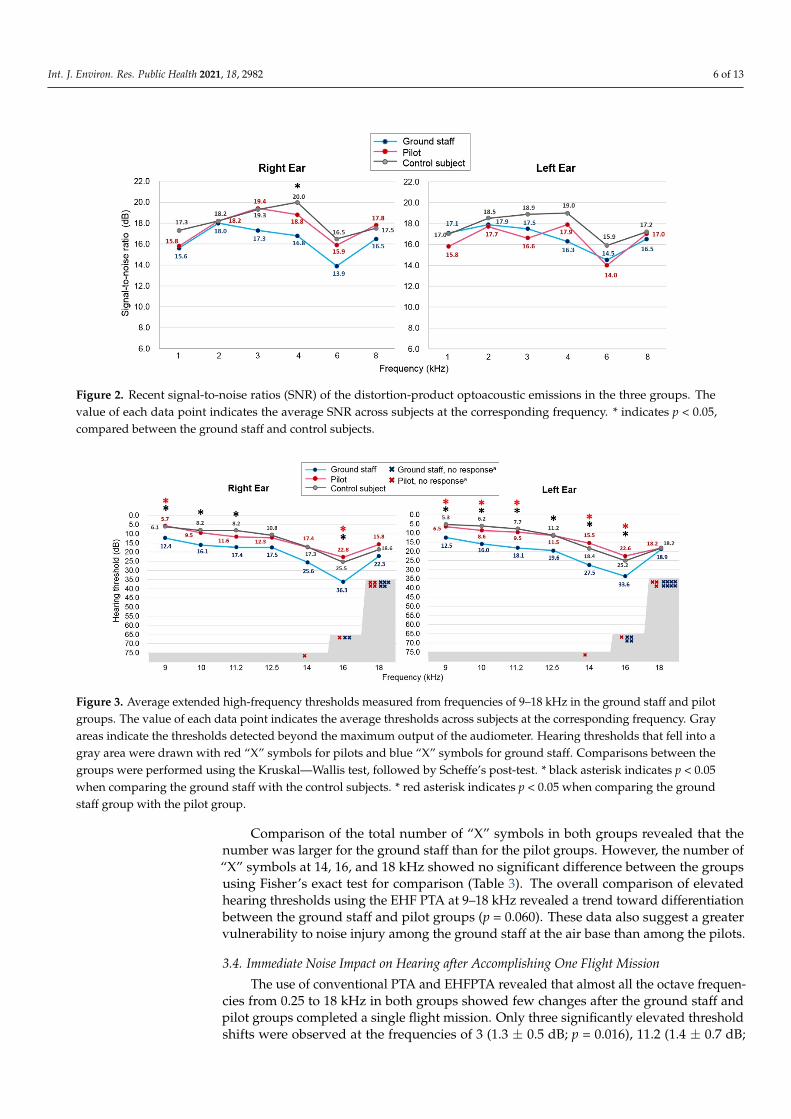
The SNR values of the DPOAEs were greater than 6 for all frequencies in the rightand left ears of all three groups; therefore, all the SNR values were considered acceptableresponses. Only the 4 kHz frequency in the right ear of the ground staff group showeda significantly decreased SNR value compared to the value for the pilots and the controlsubjects (Figure 2). A trend showing a greater decrease in decreased SNR values wasapparent in the ground staff group compared to the other two groups.
3.3. The EHF Audiometry Metric Showed a Statistically Significant Group Difference
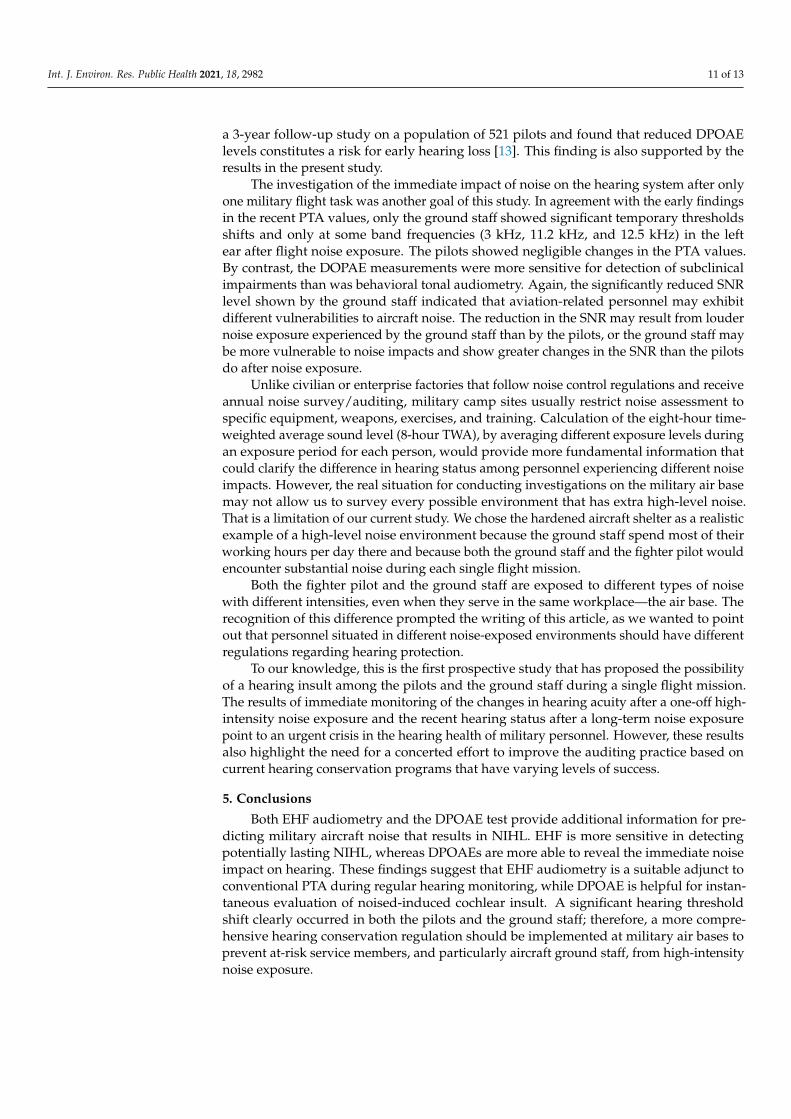
The average hearing thresholds at frequencies from 9 to 18 kHz measured by EHFaudiometry demonstrated a similar trend as that observed with the conventional PTA,as the threshold values were more elevated in the ground staff group than in the pilotgroup. The pilot group did not show any significantly higher threshold than the controlgroup, whereas the ground staff had significantly higher hearing thresholds than thecontrol subjects in the following frequency bands: 9, 10, 11.2, and 16 kHz for the right ear(p < 0.05), and 9, 10, 11.2, 12.5, 14, and 16 kHz for the left ear (p < 0.05, Figure 3). Statisticallysignificant elevations of hearing thresholds were also evident at 9 and 16 kHz in the rightear (p < 0.05), and at 9, 10, 11.2, 14 and 16kHz in the left ear of the ground staff groupcompared to the pilot group (p < 0.05, Figure 3).
Int. J. Environ. Res. Public Health 2021, 18, 2982 6 of 13
Int. J. Environ. Res. Public Health 2021, 18, x 6 of 13
subjects (Figure 2). A trend showing a greater decrease in decreased SNR values was ap-parent in the ground staff group compared to the other two groups.
Figure 2. Recent signal-to-noise ratios (SNR) of the distortion-product optoacoustic emissions in the three groups. The value of each data point indicates the average SNR across subjects at the corresponding frequency. * indicates p < 0.05, compared between the ground staff and control subjects.
3.3. The EHF Audiometry Metric Showed a Statistically Significant Group Difference The average hearing thresholds at frequencies from 9 to 18 kHz measured by EHF
audiometry demonstrated a similar trend as that observed with the conventional PTA, as the threshold values were more elevated in the ground staff group than in the pilot group. The pilot group did not show any significantly higher threshold than the control group, whereas the ground staff had significantly higher hearing thresholds than the control sub-jects in the following frequency bands: 9, 10, 11.2, and 16 kHz for the right ear (p < 0.05), and 9, 10, 11.2, 12.5, 14, and 16 kHz for the left ear (p < 0.05, Figure 3). Statistically signifi-cant elevations of hearing thresholds were also evident at 9 and 16 kHz in the right ear (p < 0.05), and at 9, 10, 11.2, 14 and 16kHz in the left ear of the ground staff group compared to the pilot group (p < 0.05, Figure 3).
Figure 3. Average extended high-frequency thresholds measured from frequencies of 9–18 kHz in the ground staff and pilot groups. The value of each data point indicates the average thresholds across subjects at the corresponding frequency. Gray areas indicate the thresholds detected beyond the maximum output of the audiometer. Hearing thresholds that fell into a gray area were drawn with red “X” symbols for pilots and blue “X” symbols for ground staff. Comparisons between the groups were performed using the Kruskal—Wallis test, followed by Scheffe’s post-test. * black asterisk indicates p < 0.05 when comparing the ground staff with the control subjects. * red asterisk indicates p < 0.05 when comparing the ground staff group with the pilot group.
Figure 2. Recent signal-to-noise ratios (SNR) of the distortion-product optoacoustic emissions in the three groups. Thevalue of each data point indicates the average SNR across subjects at the corresponding frequency. * indicates p < 0.05,compared between the ground staff and control subjects.
Int. J. Environ. Res. Public Health 2021, 18, x 6 of 13
subjects (Figure 2). A trend showing a greater decrease in decreased SNR values was ap-parent in the ground staff group compared to the other two groups.
Figure 2. Recent signal-to-noise ratios (SNR) of the distortion-product optoacoustic emissions in the three groups. The value of each data point indicates the average SNR across subjects at the corresponding frequency. * indicates p < 0.05, compared between the ground staff and control subjects.
3.3. The EHF Audiometry Metric Showed a Statistically Significant Group Difference The average hearing thresholds at frequencies from 9 to 18 kHz measured by EHF
audiometry demonstrated a similar trend as that observed with the conventional PTA, as the threshold values were more elevated in the ground staff group than in the pilot group. The pilot group did not show any significantly higher threshold than the control group, whereas the ground staff had significantly higher hearing thresholds than the control sub-jects in the following frequency bands: 9, 10, 11.2, and 16 kHz for the right ear (p < 0.05), and 9, 10, 11.2, 12.5, 14, and 16 kHz for the left ear (p < 0.05, Figure 3). Statistically signifi-cant elevations of hearing thresholds were also evident at 9 and 16 kHz in the right ear (p < 0.05), and at 9, 10, 11.2, 14 and 16kHz in the left ear of the ground staff group compared to the pilot group (p < 0.05, Figure 3).
Figure 3. Average extended high-frequency thresholds measured from frequencies of 9–18 kHz in the ground staff and pilot groups. The value of each data point indicates the average thresholds across subjects at the corresponding frequency. Gray areas indicate the thresholds detected beyond the maximum output of the audiometer. Hearing thresholds that fell into a gray area were drawn with red “X” symbols for pilots and blue “X” symbols for ground staff. Comparisons between the groups were performed using the Kruskal—Wallis test, followed by Scheffe’s post-test. * black asterisk indicates p < 0.05 when comparing the ground staff with the control subjects. * red asterisk indicates p < 0.05 when comparing the ground staff group with the pilot group.
Figure 3. Average extended high-frequency thresholds measured from frequencies of 9–18 kHz in the ground staff and pilotgroups. The value of each data point indicates the average thresholds across subjects at the corresponding frequency. Grayareas indicate the thresholds detected beyond the maximum output of the audiometer. Hearing thresholds that fell into agray area were drawn with red “X” symbols for pilots and blue “X” symbols for ground staff. Comparisons between thegroups were performed using the Kruskal—Wallis test, followed by Scheffe’s post-test. * black asterisk indicates p < 0.05when comparing the ground staff with the control subjects. * red asterisk indicates p < 0.05 when comparing the groundstaff group with the pilot group.
Comparison of the total number of “X” symbols in both groups revealed that thenumber was larger for the ground staff than for the pilot groups. However, the number of“X” symbols at 14, 16, and 18 kHz showed no significant difference between the groupsusing Fisher’s exact test for comparison (Table 3). The overall comparison of elevatedhearing thresholds using the EHF PTA at 9–18 kHz revealed a trend toward differentiationbetween the ground staff and pilot groups (p = 0.060). These data also suggest a greatervulnerability to noise injury among the ground staff at the air base than among the pilots.
3.4. Immediate Noise Impact on Hearing after Accomplishing One Flight Mission
The use of conventional PTA and EHFPTA revealed that almost all the octave frequen-cies from 0.25 to 18 kHz in both groups showed few changes after the ground staff andpilot groups completed a single flight mission. Only three significantly elevated thresholdshifts were observed at the frequencies of 3 (1.3 ± 0.5 dB; p = 0.016), 11.2 (1.4 ± 0.7 dB;

Int. J. Environ. Res. Public Health 2021, 18, 2982 7 of 13
p = 0.047), and 12.5 kHz in the left ears (1.1 ± 0.5 dB; p = 0.018) of the ground staff group(Figure 4). No significantly elevated threshold changes were observed in the pilot groupafter noise exposure from the flight mission.
Table 3. Comparison of the rates of output levels beyond the equipment maximum in measuring hearing thresholds usingEHFPTA in the ground staff and fighter pilot groups.
Frequency(kHz)
Right Ear Left Ear
Ground Staff Fighter Pilotp-Value
Ground Staff Fighter Pilotp-Value
n (%) n (%) n (%) n (%)
14 0 (0.0) 1 (2.5) 1.000 a 0 (0.0) 1 (2.5) 1.000 a
16 2 (5.0) 1 (2.5) 1.000 a 4 (10.0) 1 (2.5) 0.359 a
18 5 (12.5) 4 (10.0) 1.000 a 8 (20.0) 3 (7.5) 0.1059–18 5 (12.5) 4 (10.0) 1.000 a 9 (22.5) 3 (7.5) 0.060
a Fisher’s exact test. EHFPTA = extended high-frequency pure-tone averages.
Int. J. Environ. Res. Public Health 2021, 18, x 7 of 13
Comparison of the total number of “X” symbols in both groups revealed that the number was larger for the ground staff than for the pilot groups. However, the number of “X” symbols at 14, 16, and 18 kHz showed no significant difference between the groups using Fisher’s exact test for comparison (Table 3). The overall comparison of elevated hearing thresholds using the EHF PTA at 9–18 kHz revealed a trend toward differentia-tion between the ground staff and pilot groups (p = 0.060). These data also suggest a greater vulnerability to noise injury among the ground staff at the air base than among the pilots.
Table 3. Comparison of the rates of output levels beyond the equipment maximum in measuring hearing thresholds using EHFPTA in the ground staff and fighter pilot groups.
Right Ear Left Ear Ground Staff Fighter Pilot p-Value Ground Staff Fighter Pilot p-Value
Frequency (kHz) n (%) n (%) n (%) n (%) 14 0 (0.0) 1 (2.5) 1.000 a 0 (0.0) 1 (2.5) 1.000 a 16 2 (5.0) 1 (2.5) 1.000 a 4 (10.0) 1 (2.5) 0.359 a 18 5 (12.5) 4 (10.0) 1.000 a 8 (20.0) 3 (7.5) 0.105
9–18 5 (12.5) 4 (10.0) 1.000 a 9 (22.5) 3 (7.5) 0.060 a Fisher’s exact test. EHFPTA = extended high-frequency pure-tone averages.
3.4. Immediate Noise Impact on Hearing after Accomplishing One Flight Mission The use of conventional PTA and EHFPTA revealed that almost all the octave fre-
quencies from 0.25 to 18 kHz in both groups showed few changes after the ground staff and pilot groups completed a single flight mission. Only three significantly elevated threshold shifts were observed at the frequencies of 3 (1.3 ± 0.5 dB; p = 0.016), 11.2 (1.4 ± 0.7 dB; p = 0.047), and 12.5 kHz in the left ears (1.1 ± 0.5 dB; p = 0.018) of the ground staff group (Figure 4). No significantly elevated threshold changes were observed in the pilot group after noise exposure from the flight mission.
Figure 4. Mean of the conventional and EHF pure-tone audiometric hearing thresholds for both ears for the ground staff and pilot groups before and after flight mission execution. * p < 0.05 when comparing the mean hearing thresholds before
Figure 4. Mean of the conventional and EHF pure-tone audiometric hearing thresholds for bothears for the ground staff and pilot groups before and after flight mission execution. * p < 0.05 whencomparing the mean hearing thresholds before and immediately after the flight mission in the groundstaff using an independent t-test. PTA = pure-tone audiometry; EHF = extended high-frequency.
The use of DPOAEs revealed that the average SNR values of the DPOAEs in bothgroups decreased at nearly all frequencies from 1–8 kHz after noise exposure. The SNRafter flight mission was significantly lower in ground staff group at frequencies of 4 kHz(−1.5 ± 0.7 dB; p = 0.03) and 6 kHz (−1.5 ± 0.6 dB; p = 0.01) in the right ear and at 3 kHz(−1.7 ± 0.6 dB; p = 0.01) and 6 kHz (−1.8 ± 0.6 dB; p = 0.009) in the left ear (Figure 5). Onthe contrary, the pilot group showed no significant changes in the SNR level after the flightmission. These data indicated that DPOAEs are more sensitive to subtle cochlear insultsthan are the conventional PTA readings.

Int. J. Environ. Res. Public Health 2021, 18, 2982 8 of 13
Int. J. Environ. Res. Public Health 2021, 18, x 8 of 13
and immediately after the flight mission in the ground staff using an independent t-test. PTA = pure-tone audiometry; EHF = extended high-frequency.
The use of DPOAEs revealed that the average SNR values of the DPOAEs in both groups decreased at nearly all frequencies from 1–8 kHz after noise exposure. The SNR after flight mission was significantly lower in ground staff group at frequencies of 4 kHz (−1.5 ± 0.7 dB; p = 0.03) and 6 kHz (−1.5 ± 0.6 dB; p = 0.01) in the right ear and at 3 kHz (−1.7 ± 0.6 dB; p = 0.01) and 6 kHz (−1.8 ± 0.6 dB; p = 0.009) in the left ear (Figure 5). On the contrary, the pilot group showed no significant changes in the SNR level after the flight mission. These data indicated that DPOAEs are more sensitive to subtle cochlear insults than are the conventional PTA readings.
Figure 5. Mean of the signal-to-noise ratio of distortion-product otoacoustic emissions (DPOAEs) for both ears between the ground staff and pilot groups before and after a flight mission execution. * indicates p < 0.05, comparing the ground staff group before and after the flight mission noise exposure.
3.5. Analysis of the Noise Level in in the Hardened Aircraft Shelter The hardened aircraft shelter is one of the noisiest work sites on the military air base,
and is where the ground staff spent most of their working hours per day. We were there-fore interested in using the blast probe microphone and the acoustic test fixture to inves-tigate the physical characteristics of the noise. The blast probe microphone collected the original signals in the sound field, which represents the original physical characteristics of the noise. By contrast, the acoustic test fixture simulates the presence of a person with the physical characteristics of the human auditory system, head, torso, and pinna to pro-vide the head-related transfer function (HRTF); therefore, it could contribute a further acoustic gain and present a relatively realistic recapitulation of the noise impact on an individual’s hearing system.
During a one-hour recording and measurement by the blast probe microphone, the measured equivalent SPL was 85.3 dB. The sound levels that exceeded 90% (LA90), 50% (LA50), and 10% (LA10) of the measurement period were 93.2, 123.4, and 124.1 dB, respec-tively. Conversely, the use of the acoustic test fixture for recording gave a measured equiv-alent SPL of 115.3 dB, and the LA90, LA50, and LA10 of the measurement period were 123.0, 156.6, and 157.4 dB, respectively. These data indicated that the hardened aircraft shelter is a hazardous and noisy work environment and that the ground staff require HPD appropriate to their practical needs.
Figure 6A shows the spectrogram and power spectrum of the noise measured within a duration of 32 s by the blast probe microphone; the continuous and steady characteristics of this noise is indicated by the perfectly straight lines of noise energy distributed in the frequency domain. Loud noises over 100 dB were largely located across the range of fre-quencies from 2–5 kHz. Figure 6B shows the spectrogram and power spectrum of the
Figure 5. Mean of the signal-to-noise ratio of distortion-product otoacoustic emissions (DPOAEs) for both ears between theground staff and pilot groups before and after a flight mission execution. * indicates p < 0.05, comparing the ground staffgroup before and after the flight mission noise exposure.
3.5. Analysis of the Noise Level in in the Hardened Aircraft Shelter
The hardened aircraft shelter is one of the noisiest work sites on the military air base,and is where the ground staff spent most of their working hours per day. We were thereforeinterested in using the blast probe microphone and the acoustic test fixture to investigatethe physical characteristics of the noise. The blast probe microphone collected the originalsignals in the sound field, which represents the original physical characteristics of thenoise. By contrast, the acoustic test fixture simulates the presence of a person with thephysical characteristics of the human auditory system, head, torso, and pinna to providethe head-related transfer function (HRTF); therefore, it could contribute a further acousticgain and present a relatively realistic recapitulation of the noise impact on an individual’shearing system.
During a one-hour recording and measurement by the blast probe microphone, themeasured equivalent SPL was 85.3 dB. The sound levels that exceeded 90% (LA90), 50%(LA50), and 10% (LA10) of the measurement period were 93.2, 123.4, and 124.1 dB, re-spectively. Conversely, the use of the acoustic test fixture for recording gave a measuredequivalent SPL of 115.3 dB, and the LA90, LA50, and LA10 of the measurement periodwere 123.0, 156.6, and 157.4 dB, respectively. These data indicated that the hardened aircraftshelter is a hazardous and noisy work environment and that the ground staff require HPDappropriate to their practical needs.
Figure 6A shows the spectrogram and power spectrum of the noise measured withina duration of 32 s by the blast probe microphone; the continuous and steady characteristicsof this noise is indicated by the perfectly straight lines of noise energy distributed in thefrequency domain. Loud noises over 100 dB were largely located across the range offrequencies from 2–5 kHz. Figure 6B shows the spectrogram and power spectrum of thenoise measured by the acoustic test fixture within the same time frame. The measuredsound pressure level across 2–5 kHz can exceed 130 dB. The power spectrum revealed twofurther peaks: the first one (150.3 dB) appeared at 2716 Hz and the second one (142.5 dB) at4275 Hz (Figure 6B). These data indicated that the frequency involved in this high-intensitynoise within the hardened aircraft shelter tended to cross over the range of 2.5 to 4.5 kHz.The transfer function of the acoustic test fixture that mimics the human pinna and theexternal auditory canal could provide a further mean acoustic gain of 26.8 dB (13.0–44.4 dB)(Figure 7).

Int. J. Environ. Res. Public Health 2021, 18, 2982 9 of 13
Int. J. Environ. Res. Public Health 2021, 18, x 9 of 13
noise measured by the acoustic test fixture within the same time frame. The measured sound pressure level across 2–5 kHz can exceed 130 dB. The power spectrum revealed two further peaks: the first one (150.3 dB) appeared at 2716 Hz and the second one (142.5 dB) at 4275 Hz (Figure 6B). These data indicated that the frequency involved in this high-intensity noise within the hardened aircraft shelter tended to cross over the range of 2.5 to 4.5 kHz. The transfer function of the acoustic test fixture that mimics the human pinna and the external auditory canal could provide a further mean acoustic gain of 26.8 dB (13.0–44.4 dB) (Figure 7).
Figure 6. Spectrogram and power spectrum of the noise inside the hardened aircraft shelter for 32 s, collected by (A) the blast probe microphone (GRAS 67SB) and (B) the acoustic test fixture (GRAS 45CB). SPL = sound pressure level.
Figure 7. Transfer function of the acoustic test fixture shows the gain estimated from the data col-lected by the blast probe microphone.
4. Discussion One of the main goals of this research was to examine the prevalence and severity of
hearing loss in military personnel serving on an air force base. Surprisingly, the mean pure-tone averages from 0.25–8 kHz in each group were within normal limits (<20 dB), not to mention the characteristic noise notch at 4 kHz demonstrated in the audiogram. A focus on the overall trend of the age distribution of recruited participants revealed that 77.5% of the ground staff and 90% of the pilots were approximately 35 years old, whereas
Figure 6. Spectrogram and power spectrum of the noise inside the hardened aircraft shelter for 32 s, collected by (A) theblast probe microphone (GRAS 67SB) and (B) the acoustic test fixture (GRAS 45CB). SPL = sound pressure level.
Int. J. Environ. Res. Public Health 2021, 18, x 9 of 13
noise measured by the acoustic test fixture within the same time frame. The measured sound pressure level across 2–5 kHz can exceed 130 dB. The power spectrum revealed two further peaks: the first one (150.3 dB) appeared at 2716 Hz and the second one (142.5 dB) at 4275 Hz (Figure 6B). These data indicated that the frequency involved in this high-intensity noise within the hardened aircraft shelter tended to cross over the range of 2.5 to 4.5 kHz. The transfer function of the acoustic test fixture that mimics the human pinna and the external auditory canal could provide a further mean acoustic gain of 26.8 dB (13.0–44.4 dB) (Figure 7).
Figure 6. Spectrogram and power spectrum of the noise inside the hardened aircraft shelter for 32 s, collected by (A) the blast probe microphone (GRAS 67SB) and (B) the acoustic test fixture (GRAS 45CB). SPL = sound pressure level.
Figure 7. Transfer function of the acoustic test fixture shows the gain estimated from the data col-lected by the blast probe microphone.
4. Discussion One of the main goals of this research was to examine the prevalence and severity of
hearing loss in military personnel serving on an air force base. Surprisingly, the mean pure-tone averages from 0.25–8 kHz in each group were within normal limits (<20 dB), not to mention the characteristic noise notch at 4 kHz demonstrated in the audiogram. A focus on the overall trend of the age distribution of recruited participants revealed that 77.5% of the ground staff and 90% of the pilots were approximately 35 years old, whereas
Figure 7. Transfer function of the acoustic test fixture shows the gain estimated from the datacollected by the blast probe microphone.
4. Discussion
One of the main goals of this research was to examine the prevalence and severityof hearing loss in military personnel serving on an air force base. Surprisingly, the meanpure-tone averages from 0.25–8 kHz in each group were within normal limits (<20 dB), notto mention the characteristic noise notch at 4 kHz demonstrated in the audiogram. A focuson the overall trend of the age distribution of recruited participants revealed that 77.5% ofthe ground staff and 90% of the pilots were approximately 35 years old, whereas 92.5% ofthe ground staff and 97.5% of the pilots were under 40 years old. In other words, the vastmajority of the participants in this study might have had a relatively shorter duration ofnoise exposure than had occurred in the other studies that recruited members who had over20 years of military service [21,22]. The recent PTA results in our study were compatiblewith those from a previous large scale investigation in U.S. Air Force aviation-relatedpersonnel by demonstrating that changes in the hearing threshold was small during thefirst 20 years of an individual’s career and before age 50 [22]. The proportion of permanentthreshold shift would increase with increasing age [23].

Int. J. Environ. Res. Public Health 2021, 18, 2982 10 of 13
However, comparison of the pure-tone audiograms from the two aircraft groups andthe control group still revealed a clear threshold elevation in the pilots and a statisticallysignificant threshold shift (STS) in the ground staff group. Interestingly, both the groundstaff and pilot groups showed increases in their hearing thresholds starting at 3 kHz,suggesting that aircraft noise exposure had affected the personnel’s hearing even thoughthe exposure duration was shorter than 20 years. The SNR of DPOAEs of the three groupsalso revealed a similar trend by showing relatively low SNR values for the ground staff,followed by the pilot values. The EHF audiometry metric may provide more robustevidence to complement the observations obtained with conventional PTA. The higherrate of measurements that were out of the maximum output level of the equipment shownin the recent EHF audiometry of the ground staff, and particularly for the left ear, wasconsistent with the results obtained using conventional PTA and DPOAEs.
The conventional PTA and DPOAEs are the most common audiometry methods usedfor screening and monitoring personnel under the regulations of occupational hearingconservation programs. Both hearing tests are also applied to investigate hearing inmilitary service members who participate in gunfire practice or artillery exercises involvinghigh-intensity impulse noise. Recently, EHF audiometry was reported to provide moreinformation regarding the hearing status covering the high-frequency range from 9 kHz to20 kHz; therefore, EHF may be able to detect deficits that might be overlooked in noise-exposed populations assessed by conventional PTA [24,25]. The elevated threshold in EHFaudiometry and low-level OAEs can both appear before behavioral audiograms presentobvious changes; therefore, they may predict susceptibility and sensitive in early diagnosisof NIHL [14,26–28], as shown in our study.
Only limited reports have described the different impacts of aircraft noise on pilotsand ground staff. The previous literature mentions a higher-than-limit noise exposure andthe vulnerability of ground staff working in civilian airports [29,30], but the hazards toground staff at military air force bases have not yet been evaluated. One retrospectivestudy that recruited 76 participants (34 helicopter pilots and 42 aircraft mechanics) fromthe Thai Army also reported that aircraft mechanics suffered from damage to the hearingfrequencies involved in speech and high frequencies and a greater decibel loss than theaviators [31]. The difference of noise impact on hearing between ground staff and pilotsmay reflect several factors, such as the use of hearing protection [31,32], the participant’ssmoking status [31,33], the duration of occupational noise exposure, and co-exposuresto non-occupational noise or specific chemicals such as organic solvents, welding fumes,carbon monoxide, and hydrogen sulfide [34–36]. We also speculate that sonic booms (thesound associated with the shock waves) usually lag behind the aircraft; therefore, themost unbearably loud noise would be encountered by the ground staff, who may spend afurther consecutive hour working in the hardened aircraft shelter, either close to or 7 maway from the aircraft, as they conduct the outside inspection and checks before the fighteraircraft leaves the shelter for the runway. The engine is kept running to the whole timeand produces significant loud jet noise. By contrast, the pilots are relatively well protectedfrom this noise by the windshield and their helmets and earplugs. A cohort analysis ofaudiogram records from Air Force aviation-related personnel conducted by Greenwell et al.reported that the age and elapsed time since the baseline audiogram were associated withdecreased hearing sensitivity [22]. However, we adequately controlled both age and serviceduration in our study; therefore, further investigation is needed to identify the cause of thisdiscrepancy and the risk factors that deteriorate hearing in the ground staff specifically.
Conventional PTA and EHF audiometry revealed statistically significant differences inSTS in the ground staff across a wide range of frequencies. By contrast, the recent DPOAEsrecords showed only one significant decrease in the SNR level at frequency of 4 kHz in theright ears of the ground staff group. Much of the literature has documented that DPOAEamplitudes are poorly correlated with PTA thresholds [35,37]. Interestingly, the tendencyfor the lowest SNR level to occur in the ground staff, followed by the pilots, seems to beconsistent with the comparison of the recent PTA between the groups. Job et al. conducted
Int. J. Environ. Res. Public Health 2021, 18, 2982 11 of 13
a 3-year follow-up study on a population of 521 pilots and found that reduced DPOAElevels constitutes a risk for early hearing loss [13]. This finding is also supported by theresults in the present study.
The investigation of the immediate impact of noise on the hearing system after onlyone military flight task was another goal of this study. In agreement with the early findingsin the recent PTA values, only the ground staff showed significant temporary thresholdsshifts and only at some band frequencies (3 kHz, 11.2 kHz, and 12.5 kHz) in the leftear after flight noise exposure. The pilots showed negligible changes in the PTA values.By contrast, the DOPAE measurements were more sensitive for detection of subclinicalimpairments than was behavioral tonal audiometry. Again, the significantly reduced SNRlevel shown by the ground staff indicated that aviation-related personnel may exhibitdifferent vulnerabilities to aircraft noise. The reduction in the SNR may result from loudernoise exposure experienced by the ground staff than by the pilots, or the ground staff maybe more vulnerable to noise impacts and show greater changes in the SNR than the pilotsdo after noise exposure.
Unlike civilian or enterprise factories that follow noise control regulations and receiveannual noise survey/auditing, military camp sites usually restrict noise assessment tospecific equipment, weapons, exercises, and training. Calculation of the eight-hour time-weighted average sound level (8-hour TWA), by averaging different exposure levels duringan exposure period for each person, would provide more fundamental information thatcould clarify the difference in hearing status among personnel experiencing different noiseimpacts. However, the real situation for conducting investigations on the military air basemay not allow us to survey every possible environment that has extra high-level noise.That is a limitation of our current study. We chose the hardened aircraft shelter as a realisticexample of a high-level noise environment because the ground staff spend most of theirworking hours per day there and because both the ground staff and the fighter pilot wouldencounter substantial noise during each single flight mission.
Both the fighter pilot and the ground staff are exposed to different types of noisewith different intensities, even when they serve in the same workplace—the air base. Therecognition of this difference prompted the writing of this article, as we wanted to pointout that personnel situated in different noise-exposed environments should have differentregulations regarding hearing protection.
To our knowledge, this is the first prospective study that has proposed the possibilityof a hearing insult among the pilots and the ground staff during a single flight mission.The results of immediate monitoring of the changes in hearing acuity after a one-off high-intensity noise exposure and the recent hearing status after a long-term noise exposurepoint to an urgent crisis in the hearing health of military personnel. However, these resultsalso highlight the need for a concerted effort to improve the auditing practice based oncurrent hearing conservation programs that have varying levels of success.
5. Conclusions
Both EHF audiometry and the DPOAE test provide additional information for pre-dicting military aircraft noise that results in NIHL. EHF is more sensitive in detectingpotentially lasting NIHL, whereas DPOAEs are more able to reveal the immediate noiseimpact on hearing. These findings suggest that EHF audiometry is a suitable adjunct toconventional PTA during regular hearing monitoring, while DPOAE is helpful for instan-taneous evaluation of noised-induced cochlear insult. A significant hearing thresholdshift clearly occurred in both the pilots and the ground staff; therefore, a more compre-hensive hearing conservation regulation should be implemented at military air bases toprevent at-risk service members, and particularly aircraft ground staff, from high-intensitynoise exposure.

Int. J. Environ. Res. Public Health 2021, 18, 2982 12 of 13
Author Contributions: C.-Y.K. wrote the original draft; C.-L.H. analyzed and curated the data; C.-P.S.interpreted the data, R.-H.L., H.-C.C., L.-W.H., Y.-C.L., C.-W.C., H.-K.C., D.-M.C., and Y.-Y.L. collectedthe data; Y.-C.C. and C.-H.W. conceptualized and designed the study; C.-H.W. reviewed and editedthe final version of the manuscript. All authors have read and agreed to the published version ofthe manuscript.
Funding: This work was supported in part by grants from the National Defense Industrial Develop-ment Foundation, Taipei, Taiwan, the Tri-Service General Hospital (TSGH-D-109057 to C.Y.K.), theTaichung Armed Forces General Hospital (TCAFGH-D-109025 to C.H.W.), and the Teh-Tzer StudyGroup for Human Medical Research Foundation (A1071025 to H.C.C. and A1061019 to C.H.W.).The funders had no role in the study design, data collection and analysis, decision to publish, orpreparation of the manuscript.
Institutional Review Board Statement: The study was conducted according to the guidelines of theDeclaration of Helsinki, and approved by the Institutional Review Board of the Tri-Service GeneralHospital (approval code: TSGHIRB 2-105-05-107).
Informed Consent Statement: Informed consent was obtained from all subjects involved in the study.
Data Availability Statement: The data presented in this study are available on request from thecorresponding author.
Acknowledgments: We are grateful to the IEA Electro-Acoustic Technology Co., Ltd., Taipei, Taiwanfor support in determining noise levels and acoustic measurements. The authors thank the MedicalAffairs Bureau, Ministry of National Defense, Taiwan, ROC for providing administration support.
Conflicts of Interest: The authors declare no conflict of interest.
References1. Yankaskas, K. Prelude: Noise-induced tinnitus and hearing loss in the military. Hear. Res. 2013, 295, 3–8. [CrossRef] [PubMed]2. Gordon, J.S.; Griest, S.E.; Thielman, E.J.; Carlson, K.F.; Helt, W.J.; Lewis, M.S.; Blankenship, C.; Austin, D.; Theodoroff, S.M.; Henry,
J.A. Audiologic characteristics in a sample of recently-separated military Veterans: The Noise Outcomes in ServicemembersEpidemiology Study (NOISE Study). Hear. Res. 2017, 349, 21–30. [CrossRef]
3. Pourbakht, A.; Yamasoba, T. Cochlear damage caused by continuous and intermittent noise exposure. Hear. Res. 2003, 178, 70–78.[CrossRef]
4. Dunn, D.E.; Davis, R.R.; Merry, C.J.; Franks, J.R. Hearing loss in the chinchilla from impact and continuous noise exposure. J.Acoust. Soc. Am. 1991, 90, 1979–1985. [CrossRef] [PubMed]
5. Kemp, D.T. Stimulated acoustic emissions from within the human auditory system. J. Acoust. Soc. Am. 1978, 64, 1386–1391.[CrossRef]
6. Kemp, D.T. Otoacoustic emissions, their origin in cochlear function, and use. Br. Med. Bull. 2002, 63, 223–241. [CrossRef]7. Kemp, D.T. Evidence of Mechanical Nonlinearity and frequency selective wave amplification in the cochlea. Arch. Otorhinolaryngol.
1979, 224, 37–45. [CrossRef]8. McGill, T.J.I.; Schuknecht, H.F. Human cochlear changes in noise induced hearing loss. Laryngoscope 1976, 86, 1293–1302.
[CrossRef]9. Kapoor, N.; Mani, K.V.; Shukla, M. Distortion product oto-acoustic emission: A superior tool for hearing assessment than pure
tone audiometry. Noise Health 2019, 21, 164–168.10. Sliwinska-Kowalska, M.; Kotylo, P. Otoacoustic emissions in industrial hearing loss assessment. Noise Health 2001, 3, 75–84.11. Baradarnfar, M.H.; Karamifar, K.; Mehrparvar, A.H.; Mollasadeghi, A.; Gharavi, M.; Karimi, G.; Vahidy, M.R.; Baradarnfar, A.;
Mostaghaci, M. Amplitude changes in otoacoustic emissions after exposure to industrial noise. Noise Health 2012, 14, 28–31.12. Hofstetter, P.; Ding, D.; Powers, N.; Salvi, R.J. Quantitative relationship of carboplatin dose to magnitude of inner and outer hair
cell loss and the reduction in distortion product otoacoustic emission amplitude in chinchillas. Hear. Res. 1997, 112, 199–215.[CrossRef]
13. Job, A.; Raynal, M.; Kossowski, M.; Studler, M.; Ghernaouti, C.; Baffioni-Venturi, A.; Roux, A.; Darolles, C.; Guelorget, A.Otoacoustic detection of risk of early hearing loss in ears with normal audiograms: A 3-year follow-up study. Hear. Res. 2009, 251,10–16. [CrossRef]
14. Lapsley Miller, J.A.; Marshall, L.; Heller, L.M.; Hughes, L.M. Low-level otoacoustic emissions may predict susceptibility tonoise-induced hearing loss. J. Acoust. Soc. Am. 2006, 120, 280–296. [CrossRef]
15. Korres, G.S.; Balatsouras, D.G.; Tzagaroulakis, A.; Kandiloros, D.; Ferekidis, E. Extended high-frequency audiometry in subjectsexposed to occupational noise. B-ENT 2008, 4, 147–155.
16. Valiente, A.R.; Fidalgo, A.R.; Villarreal, I.M.; Berrocal, J.G. Extended high-frequency audiometry (9000-20000 Hz). Usefulness inaudiological diagnosis. Acta Otorrhinolaryngol. Esp. 2016, 67, 40–44.
Int. J. Environ. Res. Public Health 2021, 18, 2982 13 of 13
17. Prendergast, G.; Hymers, M.; Lee, A. A quick and reliable estimate of extended high frequency hearing. Int. J. Audiol. 2020, 59,823–827. [CrossRef]
18. Somma, G.; Pietroiusti, A.; Magrini, A.; Coppeta, L.; Ancona, C.; Gardi, S.; Messina, M.; Bergamaschi, A. Extended high-frequencyaudiometry and noise induced hearing loss in cement workers. Am. J. Ind. Med. 2008, 51, 452–462. [CrossRef]
19. Fitzgerald, T.S.; Prieve, B.A. Detection of hearing loss using 2f2-f1 and 2f1-f2 distortion-product otoacoustic emissions. J. SpeechLang. Hear. Res. 2005, 48, 1165–1186. [CrossRef]
20. Gorga, M.P.; Neely, S.T.; Ohlrich, B.; Hoover, B.; Redner, J.; Peters, J. From laboratory to clinic: A large scale study of distortionproduct otoacoustic emissions in ears with normal hearing and ears with hearing loss. Ear Hear. 1997, 18, 440–455. [CrossRef]
21. Kampel-Furman, L.; Joachims, Z.; Bar-Cohen, H.; Grossman, A.; Frenkel-Nir, Y.; Shapira, Y.; Alon, E.; Carmon, E.; Gordon,B. Hearing threshold shifts among military pilots of the Israeli Air Force. J. R. Army Med. Corps 2018, 164, 46–51. [CrossRef][PubMed]
22. Greenwell, B.M.; Tvaryanas, A.P.; Maupin, G.M. Risk Factors for Hearing Decrement Among U.S. Air Force Aviation-RelatedPersonnel. Aerosp. Med. Hum. Perform. 2018, 89, 80–86. [CrossRef] [PubMed]
23. Cason, E.M. Air Force Hearing Conservation Program data 1998-2008: A cross-sectional analysis of positive threshold shifts. Mil.Med. 2012, 177, 589–593. [CrossRef] [PubMed]
24. Le Prell, C.G.; Spankovich, C.; Lobariñas, E.; Griffiths, S.K. Extended high-frequency thresholds in college students: Effects ofmusic player use and other recreational noise. J. Am. Acad. Audiol. 2013, 24, 725–739. [CrossRef]
25. Ahmed, H.O.; Dennis, J.H.; Badran, O.; Ismail, M.; Ballal, S.G.; Ashoor, A.; Jerwood, D. High-frequency (10–18 kHz) hearingthresholds: Reliability, and effects of age and occupational noise exposure. Occup. Med. 2001, 51, 245–258. [CrossRef]
26. Marshall, L.; Miller, J.A.L.; Heller, L.M.; Wolgemuth, K.S.; Hughes, L.M.; Smith, S.D.; Kopke, R.D. Detecting incipient inner-eardamage from impulse noise with otoacoustic emissions. J. Acoust. Soc. Am. 2008, 125, 995–1013. [CrossRef]
27. Konopka, W.; Pawlaczyk-Luszczynska, M.; Sliwinska-Kowalska, M.; Grzanka, A.; Zalewski, P. Effects of impulse noise ontransiently evoked. Int. J. Audiol. 2005, 44, 3–7. [CrossRef]
28. Mehrparvar, A.H.; Mirmohammadi, S.J.; Davari, M.H.; Mostaghaci, M.; Mollasadeghi, A.; Bahaloo, M.; Hashemi, S.H. Conven-tional Audiometry, Extended High-Frequency Audiometry, and DPOAE for Early Diagnosis of NIHL. Iran. Red Crescent Med. J.2014, 16, e9628. [CrossRef]
29. Anino, J.O.; Afullo, A.; Otieno, F. Occupational noise-induced hearing loss among workers at Jomo Kenyatta Internation airport,Nairobi. East Afr. Med. J. 2010, 87, 49–57. [CrossRef]
30. Mostafaee, M.; Nassiri, P.; Behzadi, M.H. Investigation of noise pollution in ground safety section of Mehrabad airport and itsrelation with employees hearing loss. Saf. Health Work 2015, 5, 23–34.
31. Jaruchinda, P.; Thongdeetae, T.; Panichkul, S.; Hanchumpol, P. Prevalence and an analysis of noise–induced hearing loss in armyhelicopter pilots and aircraft mechanics. J. Med. Assoc. Thai. 2005, 88 (Suppl. 3), S232–S239. [PubMed]
32. Rovig, G.W.; Bohnker, B.K.; Page, J.C. Hearing health risk in a population of aircraft carrier flight deck personnel. Mil. Med. 2004,169, 429–432. [CrossRef]
33. Li, X.; Rong, X.; Wang, Z.; Lin, A. Association between Smoking and Noise-Induced Hearing Loss: A Meta-Analysis ofObservational Studies. Int. J. Environ. Res. Public Health 2020, 17, 1201. [CrossRef] [PubMed]
34. Zhou, J.; Shi, Z.; Zhou, L.; Hu, Y.; Zhang, M. Occupational noise-induced hearing loss in China: A systematic review andmeta-analysis. BMJ Open 2020, 10, e039576. [CrossRef] [PubMed]
35. Baker, S.R.; Lilly, D.J. Hearing loss from acute carbon monoxide intoxication. Ann. Otol. Rhinol. Laryngol. 1977, 86, 323–328.[CrossRef]
36. Shahbaz Hassan, M.; Ray, J.; Wilson, F. Carbon monoxide poisoning and sensorineural hearing loss. J. Laryngol. Otol. 2003, 117,134–137. [CrossRef]
37. Shupak, A.; Tal, D.; Sharoni, Z.; Oren, M.; Ravid, A.; Pratt, H. Otoacoustic emissions in early noise-induced hearing loss. Otol.Neurotol. 2007, 28, 745–752. [CrossRef]