Embed Size (px)
Citation preview

The IASI instrument
D. Blumstein1, E.Péquignot1, L.Buffet1, C.Buil1, P.Hébert1, C.Larigauderie1, T.Phulpin1, C.Camy-Peyret2 and D.Siméoni3
1. CNES - 18 avenue Edouard Belin – 31401 Toulouse Cedex 9 – France, 2.LPMAA, France
3. ALCATEL SPACE -10 Bd du Midi BP99-06156 Cannes La Bocca Cedex – France [email protected]
Abstract: This paper gives the status of the IASI instrument after more than two years and half in orbit. It details aspects like stability of the instrument, decontaminations and anomalies caused by radiative environment. A short overview of the IASI data processing (on-board and on ground) is provided to make the paper as self-contained as possible.
1. Introduction The Infrared Atmospheric Sounding Interferometer (IASI), is a key element of the MetOp payload. It has been designed to provide very accurate data about the atmosphere, land and oceans for application to weather predictions, climate studies and atmospheric chemistry [1,2]. IASI measurements allow retrieval of temperature and humidity profiles at a 1 km vertical resolution with an accuracy of respectively 1K and 10 %. Trace gases column amount (CO, CH4, N2O) are retrieved with an accuracy greater than 10 % and 5 % for Ozone. Figure 1 shows a typical atmospheric spectrum measured by the IASI instrument.
The IASI program is led by the French National Space Agency CNES in cooperation with the European Meteorological Satellite Organization EUMETSAT. Under this cooperation agreement, CNES leads the development of the instruments, is in charge of the level 1 processing and operates the IASI Technical Expertise Center (TEC). EUMETSAT is responsible for development of level 2 processing, operations and data distribution. The instrument development was carried out by THALES ALENIA SPACE as industrial Prime Contractor. Three IASI flight models have been manufactured and delivered for an expected mission duration of more than 15 years.
First IASI Level 1C Spectra29/11/2006, 13:42:11 UTC
Temp (CO2)
Surface, Clouds
O3
Surface, Clouds
H2O, CH4, N2O
CO
N2O,Temp (CO2)
Temp (CO2)
Surface, Clouds
Figure 1: Typical atmospheric spectra measured by IASI
The first flight model was launched on board the MetOp-A satellite from Baïkonour on the 19th of October 2006. Following a successful in-orbit commissioning phase, which included in-orbit functional validation (2 months) and calibration/validation (6 months), the first IASI instrument was declared operational in July 2007 and is in
ECMWF/EUMETSAT NWP-SAF Workshop on the assimilation of IASI in NWP, 6 – 8 May 2009 1

BLUMSTEIN, D. ET AL.: THE IASI INSTRUMENT
routine operation phase since then [3]. IASI measurements were assimilated operationally as early as June 2007 by some Numerical Weather Prediction centers [4-6].
This paper gives a status of the instrument and presents some lessons learned after more than 2.5 years in orbit. As the first European infrared sounder, the IASI instrument has demonstrated its operational capability and its adequacy to user needs, with highly meaningful contributions to meteorology, climate and atmospheric chemistry. The in-flight performance of IASI is fully satisfactory (instrument and processing). In particular, the instrument shows a stable behavior. However the sensitivity to space radiative environment seems to be higher than expected : several SEU related anomalies were recorded, without any consequence on the health of the instrument. The contamination by water ice is well under control. The first decontamination was successfully performed in march 2008 after 16 months in orbit. More details on the in-flight performance of IASI can be found in reference [3].
2. Instrument and processing overview The IASI measurement technique is based on passive IR remote sensing. The instrument is composed of a precisely calibrated Fourier Transform Spectrometer operating in the 3.7 – 15.5 µm region associated with an infrared imager operating in the 10.3-12.5 µm region. The Fourier Transform Spectrometer is based on a Michelson interferometer, focal planes and cold optics are passively cooled to 91,7 K. On board digital processing includes inverse Fourier Transform and radiometric calibration. The integrated infrared imager allows the co registration of the IASI sounder with MetOp AVHRR (Advanced Very High Resolution Radiometer). The main characteristics of the instrument are
• Spectral bands: 3.62 μm to 15.5μm
o B1 : 8.26 - 15.5 microns
o B2 : 5.0 - 8.26 microns
o B3 : 3.62 - 5.0 microns
• 4 off-axis pixels
• Field of view: -48°20’ / +48°20’
• Spatial resolution : diameter of 12Km
• Scanning of swath period : 8 seconds
• Spectral resolution : 0.5 cm-1 (apodized spectra)
• Radiometric resolution : 0.2 to 0.4 K (apodized spectra)
• Data flow: 1.5 Mb/sec (average)
• Dimensions of sounder : 1.1 x 1.1 x 1.2 m3
• Mass sounder < 200 Kg
• Power consumption < 240 Watt (worst case EoL)
• Reliability > 0.8 & availability > 97.5% over 5 years
More details about the specifications and design of the IASI instrument can be found in references [2,7].
The IASI instrument can be operated in two different modes. In the Normal Operation Mode the swath is sampled regularly 30 times every 8 seconds. This is the nominal mode that is used most of the time for the mission (see section 3). When used in External Calibration Mode the direction of sight is fixed for 8 seconds. In this mode spectra of the calibration targets (black body, cold space target 1 or 2, rear of the scanning mirror) can be measured as well as atmospheric spectra. This mode is used regularly but very infrequently (once a month) to perform data acquisitions dedicated to the monitoring and the maintenance of the instrument performance.
2 ECMWF/EUMETSAT NWP-SAF Workshop on the assimilation of IASI in NWP, 6 – 8 May 2009

BLUMSTEIN, D. ET AL.: THE IASI INSTRUMENT
Figure 2: Normal Operation Mode
Fig. 2b External Calibration Mode
In both modes one raw interferogram is available in the scientific telemetry every 8 seconds. Other ancillary data available in the scientific telemetry are used to monitor the correct behaviour of the on-board processing.
The following figure shows the decomposition of the IASI processing between Near Real Time (NRT) processing, on-board IASI and in the EUMETSAT EPS ground segment, and off-line processing, in the IASI TEC ground segment. A major function of the on-board processing is to reduce the data rate from about 45 Mbits/second at the output of the interferometer to about 1.5 Mbits/second (constraint imposed by the MetOp telemetry data rate).
TEC processing(CNES Toulouse)
DPS Processing(on-board IASI)
Interferograms45 Mbits / sec
408 interfs / 8 sec Pre-calibrated Spectra +
On-ground Processing
(Eumetsat EPS/CGS)
1.5 Mbits / sec1.2 million /
day
Calibrated Spectra + IIS images+ Auxiliary data
B1B2
B3
QA
QAdata for Quality Assessment
Parameters+ monitoring limits
Figure 3. Overview of the IASI processing
3. Instrument status, functional behaviour and observed availability The IASI instrument FM2 onboard MetOp-A is fully operational. Its in flight performances entirely meet expectations of users and designers.
The instrument configuration is the nominal one. No change was made in on-board software configuration after the calibration/validation phase. At the end of this calibration/validation phase, it was decided not to release the Locking and Filtering Devices (LFD) which are the mechanical interface designed to decouple IASI sensor and MetOp platform in order to minimise micro-vibrations. However the possibility to release them on the other two models is available if found necessary during the commissioning phase.
ECMWF/EUMETSAT NWP-SAF Workshop on the assimilation of IASI in NWP, 6 – 8 May 2009 3

BLUMSTEIN, D. ET AL.: THE IASI INSTRUMENT
Figure 4 below shows that the percentage time spent by the instrument in Normal Operation Mode has been around 95.7 % for the first 2.5 years in orbit.
The main events that can be noted are the ice decontamination phase that was successfully performed in March 2008 (see section 4) and the IASI internal anomalies due to radiation effects (below). Otherwise, the instrument behaviour has been found very stable.
2007-06-13-10:23SEU DMC memory
2007-07-20-04:31SEU DPC 3A
2007-11-01-13:35SEU DPC 4A
2007-11-08-11:03SEU DMC memory
2007-11-18-01:31SET DPS DMC Converter
2007-05-15-13:18SEU laser
2008-02-04-12:46SEU CCM ALU
2008-02-09-10:37SEU DPC 3B
2008-07-21-23:44SEU DPC 1A
2008-12-09-20:28SET DPS Main
2008-12-29-22:50EQSOL
Figure 4: Mode Budget Figure 5: Location of the SEU events
SEU anomalies are the consequence of charged particles impact that can cause a bit corruption on memory areas used by onboard software. Since the beginning of its in-orbit life IASI has experienced an unexpectedly high number of SEU anomalies. Between January 2007 and March 2009, eleven SEU-related anomalies were recorded, eight of them concerning the Data Processing Subsystem (DPS).
The DPS is the most demanding subsystem in terms of memory resources. It processes raw interferograms to obtain pre-calibrated spectra that are encoded and transmitted to the ground. The DPS contains four processing chains associated to the four pixels of the sounder. The processing is finely optimised in term of time sequencing and uses a large amount of memory space (126 chips of 1 Mb, without taking into account redundancies). During the development phase of IASI, it was decided to use radiation-hardened memory chips for the DPS RAM. The predicted rate of SEU anomaly was one in four year. The anomalies occur over the South Atlantic Anomaly and in polar regions (see figure 5). These locations tend to show that these memories are sensitive to protons as well as heavy ions. At the time of IASI design choices, no proton sensitivity was known for this kind of memory chips.
This kind of anomaly does not have any functional impact on the instrument but causes unwanted mission outages. They have induced approximately 1 % of unavailability of IASI instrument between January 2007 and September 2008. Thanks to joint efforts from EUMETSAT, CNES and THALES ALENIA SPACE teams to reduce both investigation and recovery time after anomaly, the cumulative interruption time has been minimised. Specific signatures associated with the SEU anomalies were identified and a quick recovery procedure was implemented at EUMETSAT. The mission outage duration is now very short (less than 5 hours).
A second action was initiated to find solutions to avoid triggering anomalies at instrument level in case of SEU hits. The preferred solution was the autonomous onboard re-initialisation, which is currently under development by THALES ALENIA SPACE. This solution will be implemented on the two other models of IASI.
4 ECMWF/EUMETSAT NWP-SAF Workshop on the assimilation of IASI in NWP, 6 – 8 May 2009

BLUMSTEIN, D. ET AL.: THE IASI INSTRUMENT
Instrument stability
The health of IASI is monitored via on-board and on-ground parameters. After more than 2.5 years in operation, IASI shows a stable behaviour, regarding temperatures, power consumption of the subsystems, interferometer alignment and motion of the mechanisms. Some examples representative of the instrument good health are presented below.
4. Evolution of radiometric noise and ice decontamination The IASI interferometer and optical bench are precisely regulated at 20°C temperature, while the cold box containing cold optics and detection subsystem is cooled at 91.7 K. Water desorption from the hot parts of the instrument leads to ice formation on the field lens at the entrance of the cold box. This desorption phenomenon is particularly important at the beginning of the in-orbit phase. Therefore the commissioning began by an outgassing phase that consists in maintaining the cold box at a 300 K temperature during 20 days. This operation allows to remove most of the initial contaminants coming from IASI itself and of the other instruments or MetOp.
A routine outgassing which consists in heating the cold box up to 200 K only [8], is then needed from time to time to remove ice contamination. The first one needed for performance reasons, was performed in March 2008.
Indeed, the figure 6a below shows the evolution of the IASI transmission between December 2006 and March 2008. The spectral signature of these curves is characteristic of water ice absorption. The loss of transmission is maximum in band B1 around 850 cm-1 : it reached slightly more than 17 % in March 2008 while the maximum acceptable degradation of transmission was decided to be 20 % at 850 cm-1. The decontamination took place at this date in conjunction with a MetOp anomaly that allowed to minimise the overall mission interruption.
Smoothed and debiased ratios
0.81
0.83
0.85
0.87
0.89
0.91
0.93
0.95
0.97
0.99
1.01
1.03
645 1145 1645 2145 2645Wave number (cm-1)
Rat
io o
f cal
ibra
tion
coef
ficie
nts
850 cm-1
Instrument transmission lossSmoothed and debiased ratios
0.81
0.83
0.85
0.87
0.89
0.91
0.93
0.95
0.97
0.99
1.01
1.03
645 1145 1645 2145 2645Wave number (cm-1)
Rat
io o
f cal
ibra
tion
coef
ficie
nts
850 cm-1
Instrument transmission loss Evolution of the transmission at 850 cm-1
0.830.840.850.860.870.880.89
0.90.910.920.930.940.950.960.970.980.99
11.011.02
0 50 100 150 200 250 300 350 400 450 500
Date (in days relative to the reference)
Rat
io o
f cal
ibra
tion
coef
ficie
nt s
lope
s
Post-decontamination(ref : 2008/03/27)
Pre-decontamination(ref : 2006/12/15)
Figure 6a. Transmission evolution (December 2006 – March 2008)
Fig. 6b Transmission loss (850 cm-1) before / after decontamination
After this decontamination, the sounder radiometric noise was back to the level measured in December 2006, (see fig. 7) showing that all the ice was removed and that the instrument has been stable during that period. The contamination rate is lower now than at the beginning of life as expected (see figure 6b). The current estimation is that the next decontamination will not be needed before 2010. By now the decontaminations on IASI are less frequent than predicted before launch based on the results of the optical vacuum test and mathematical models.
ECMWF/EUMETSAT NWP-SAF Workshop on the assimilation of IASI in NWP, 6 – 8 May 2009 5

BLUMSTEIN, D. ET AL.: THE IASI INSTRUMENT
Figure 7: IASI instrument noise evolution after the decontamination
The focal plane temperature is the main parameter that controls the radiometric noise of the sounder for the long wave range (from 8 to 15.5 µm). The temperature of the subsystems is regulated via 14 active control lines. One of these regulation lines controls the temperature of the detectors inside the cold box, compensating for environmental thermal variations. The power used for this regulation is very low and provides a measurement of the cooling margin that is available. The figure 8 shows the evolution of the margin over more than 2.5 years. A small seasonal effect can be seen, but no trend towards zero could be detected. This is a good indication that there is no need to increase the focal plane temperature in the near future.
CBS power regulation (mW) observation of 2 orbits every 2 months
0
1
2
3
4
5
6
7
8
9
10
oct-06 déc-06 févr-07 avr-07 juin-07 août-07 oct-07 déc-07 févr-08 avr-08 juin-08 août-08 oct-08 déc-08 févr-09
pow
er (m
W)
Mar
gin
CBS power regulation (mW) observation of 2 orbits every 2 months
0
1
2
3
4
5
6
7
8
9
10
oct-06 déc-06 févr-07 avr-07 juin-07 août-07 oct-07 déc-07 févr-08 avr-08 juin-08 août-08 oct-08 déc-08 févr-09
pow
er (m
W)
Mar
gin
Figure 8: Cooling power margin evolution
This shows also that the ageing effect and contamination of the sun shield is very low.
5. Radiometric calibration The radiometric calibration of the instrument also evolves slightly with time. This is caused by the variation of the reflectivity of the scanning mirror.
6 ECMWF/EUMETSAT NWP-SAF Workshop on the assimilation of IASI in NWP, 6 – 8 May 2009
BLUMSTEIN, D. ET AL.: THE IASI INSTRUMENT
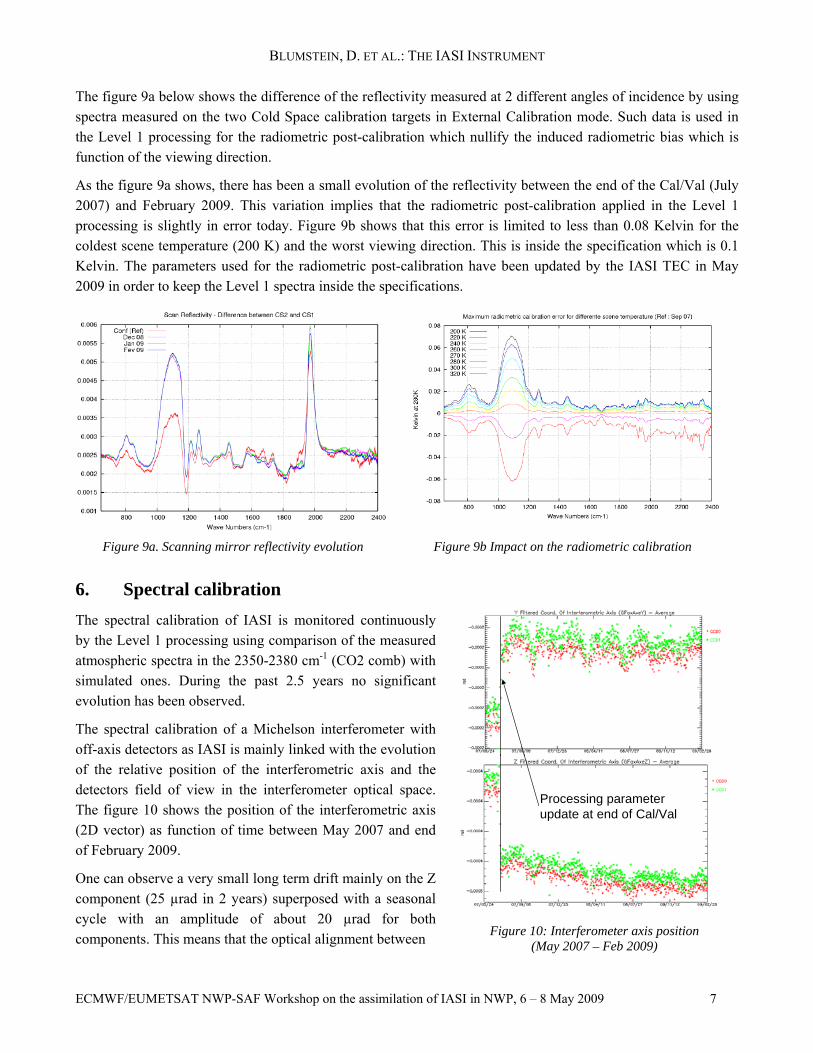
The figure 9a below shows the difference of the reflectivity measured at 2 different angles of incidence by using spectra measured on the two Cold Space calibration targets in External Calibration mode. Such data is used in the Level 1 processing for the radiometric post-calibration which nullify the induced radiometric bias which is function of the viewing direction.
As the figure 9a shows, there has been a small evolution of the reflectivity between the end of the Cal/Val (July 2007) and February 2009. This variation implies that the radiometric post-calibration applied in the Level 1 processing is slightly in error today. Figure 9b shows that this error is limited to less than 0.08 Kelvin for the coldest scene temperature (200 K) and the worst viewing direction. This is inside the specification which is 0.1 Kelvin. The parameters used for the radiometric post-calibration have been updated by the IASI TEC in May 2009 in order to keep the Level 1 spectra inside the specifications.
Figure 9a. Scanning mirror reflectivity evolution Figure 9b Impact on the radiometric calibration
6. Spectral calibration The spectral calibration of IASI is monitored continuously by the Level 1 processing using comparison of the measured atmospheric spectra in the 2350-2380 cm-1 (CO2 comb) with simulated ones. During the past 2.5 years no significant evolution has been observed.
The spectral calibration of a Michelson interferometer with off-axis detectors as IASI is mainly linked with the evolution of the relative position of the interferometric axis and the detectors field of view in the interferometer optical space. The figure 10 shows the position of the interferometric axis (2D vector) as function of time between May 2007 and end of February 2009.
One can observe a very small long term drift mainly on the Z component (25 µrad in 2 years) superposed with a seasonal cycle with an amplitude of about 20 µrad for both components. This means that the optical alignment between
Processing parameterupdate at end of Cal/ValProcessing parameterupdate at end of Cal/Val
Figure 10: Interferometer axis position (May 2007 – Feb 2009)
ECMWF/EUMETSAT NWP-SAF Workshop on the assimilation of IASI in NWP, 6 – 8 May 2009 7

BLUMSTEIN, D. ET AL.: THE IASI INSTRUMENT
the cold box subsystem and the hot interferometer has been very stable for these past two years. Note : the larger step (still very small) that is apparent on the curves at the end of the Cal/Val is not caused by a change of the geometry of the instrument but by a refinement of the Level 1 processing parameters for the beginning of the routine operations phase.
Figure 11 below shows the evolution of the interferometer shear as measured in-flight by the IASI TEC every month. This parameter provides the relative position between the fixed cube corner and the trajectory of the mobile one. A very small drift (less than 1.5 µm in 2.5 year) can be observed. It has no impact on the performances. Should this drift reach 4 µm, a modification of the spectral database used in the Level 1 processing would be required in order to maintain the accurate model of the IASI spectral response function. The other important characteristic that governs the knowledge of the spectral response function is the stability of the cube corner velocity and the micro vibrations. These parameters are monitored regularly by the IASI TEC and show no significant evolution since the end of the Cal/Val.
Figure 11. Evolution of interferometer shear (Dec 2006 – Feb 2009)
Figure 12: Spectral calibration: evolution measured at the end of Cal/Val
Finally the spectral calibration over the entire spectrum is checked every month by the IASI TEC with the same methods that have been used during the Cal/Val. The figure 12 above shows the result of such analysis for December 2008 and January 2009 (before and after MetOp switched off the IASI instrument) and comparison with the measurements at the end of Cal/Val. The dispersion of the measurements shows the difficulty of this measurement but it can be seen that no significant evolution has occurred since the end of the Cal/Val phase.
7. Geometry The main requirement concerning the geometry of the IASI instrument is relative to the MetOp AVHRR imager: IASI soundings must be collocated with AVHRR images with an accuracy better than 0.3 AVHRR pixels. This accuracy is achieved by performing a co-registration between the images provided by the IASI integrated imager (IIS) and the AVHRR ones.
The radiometric noise of the IIS is the main contributor to the accuracy of this method; it is shown by figure 13 below. Figure 13a provides histograms of the noise for the 4096 pixels of the IIS for September 2007, December 2009, January and February 2009. As it can be seen most of the pixels have NeDT between 0.5 and 0.65 Kelvin (for a requirement of 0.8 Kelvin). The figure 13b shows the average (over all the pixels) measured every months over a period of one year. It can be seen that this average is also very stable (around 0.57 Kelvin).
8 ECMWF/EUMETSAT NWP-SAF Workshop on the assimilation of IASI in NWP, 6 – 8 May 2009

BLUMSTEIN, D. ET AL.: THE IASI INSTRUMENT
Figure 13a. IIS NeDT histograms Figure 13b. IIS NeDT average evolution
Results of the co-registration between IIS and AVHRR images is presented by figure 14 below for the 30 viewing directions of IASI and different orbits of February 2009 as well as the offsets measured at the end of the Cal/Val. The evolution over almost two years has been very small (0.04 AVHRR pixels across-track and 0.1 along track). This is the significant parameter because the absolute offset is corrected by the Level 1 processing. This means that the localization of the IASI soundings inside the AVHRR raster is achieved with an accuracy of about 100 meters.
It has to be noted that this very good long term stability of IASI relative to MetOp and AVHRR is achieved because the Locking devices have not been released (see section 3).
0.04
Across-track offset:residual after correction
0.04
Across-track offset:residual after correction
Along-track offset : residual after correction
0.1
Along-track offset : residual after correction
0.1
Figure 14a. Across Track offset IIS/AVHRR Figure 14b. Along Track offset IIS/AVHRR
8. On-board and on-ground Processing and data quality A synthetic presentation of the IASI processing can be found in [2] and a more detailed description is provided in [14]. They will not be repeated here.
Many controls are done at different steps of this processing chain whose results leads to some spectra being flagged as bad (or at least doubtful). Users are advised to ignore these measurements which are a small fraction of the available data. Indeed figures 15 below show that more than 99 % of the measurements acquired in
ECMWF/EUMETSAT NWP-SAF Workshop on the assimilation of IASI in NWP, 6 – 8 May 2009 9

BLUMSTEIN, D. ET AL.: THE IASI INSTRUMENT
Normal Operation mode are flagged as good quality data. This percentage has remained almost constant since the end of the Cal/Val.
% of rejected spectra by L0 processing
End of Cal/Val
1%
% of rejected spectra by L0 processing
End of Cal/Val
1%
% of rejected spectra by (L0+L1) processing
End of Cal/Val
1%
% of rejected spectra by (L0+L1) processing
End of Cal/Val
1%
Figure 15a. % of data rejected on-board Figure 15b. % of data rejected globally
In addition, it can be seen that very few measurements are flagged by the Level 1 processing which is very reliable. Table 1 below shows this fact more evidently. It also gives more details about the four pixels. In particular, the pixel 2 can be seen to provide about 20 % more of rejected data than pixels 1 and 3. On the opposite, pixel 4 is the one that has the least number of rejected spectra. This will be explained below when the reasons for data rejection will be further investigated (see table 2).
PN 1 PN 2 PN 3 PN 4 Total % of rejected spectra 0.83 1.01 0.88 0.77
% of rejected spectra by L0 processing (on board) 0.81 0.99 0.86 0.75
Table 1: Percentage of spectra rejected by processing
Pixel 1 Pixel 2 Pixel 3 Pixel 4 ON-BOARD % spikes (mainly in B3) 0.55* 0.55* 0.55* 0.55*
% NZPD calculation failure 0.15 0.29 0.24 0.15
%radiometric calibration failure 0.02 0.02 0.02 0.02
GROUND % Over/Underflows 0.02 0.02 0.02 0.02
TOTAL 0.74 0.88 0.83 0.74
All other parameters 0.09 0.13 0.05 0.03
Table 2. Percentage of rejected spectra detailed by cause of rejection
The most frequent cause of spectra rejection is the occurrence of a spike in the interferograms (see figure 16). This perturbation of the interferogram is caused by a proton or a heavy ion reaching a detector. These events appear mainly over the South Atlantic Anomaly (see figure 17a) and affect mostly the band 3 detectors. This leads to reject spectra for which band 1 and band 2 parts are perfect and could be used for temperature and water
10 ECMWF/EUMETSAT NWP-SAF Workshop on the assimilation of IASI in NWP, 6 – 8 May 2009
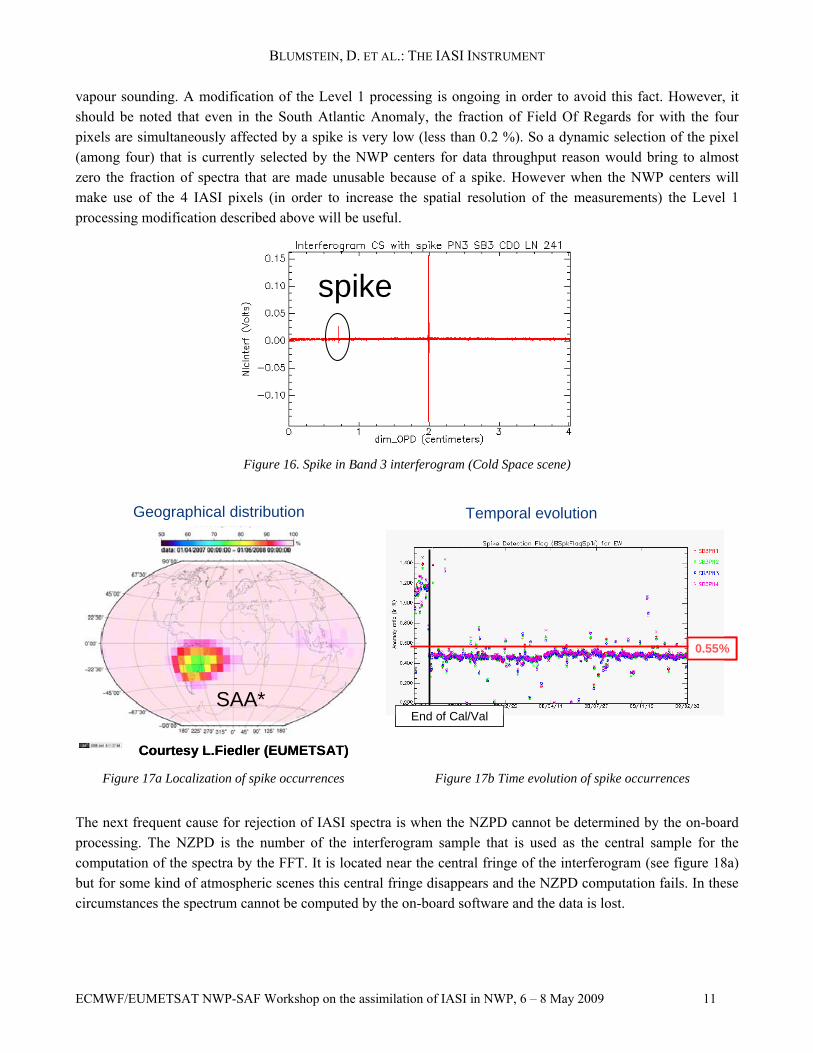
BLUMSTEIN, D. ET AL.: THE IASI INSTRUMENT
vapour sounding. A modification of the Level 1 processing is ongoing in order to avoid this fact. However, it should be noted that even in the South Atlantic Anomaly, the fraction of Field Of Regards for with the four pixels are simultaneously affected by a spike is very low (less than 0.2 %). So a dynamic selection of the pixel (among four) that is currently selected by the NWP centers for data throughput reason would bring to almost zero the fraction of spectra that are made unusable because of a spike. However when the NWP centers will make use of the 4 IASI pixels (in order to increase the spatial resolution of the measurements) the Level 1 processing modification described above will be useful.
spikespike
Figure 16. Spike in Band 3 interferogram (Cold Space scene)
Geographical distribution
SAA*
Courtesy L.Fiedler (EUMETSAT)
Geographical distribution
SAA*
Geographical distribution
SAA*
Courtesy L.Fiedler (EUMETSAT)
Temporal evolution
0.55%
End of Cal/Val
Temporal evolution
0.55%
End of Cal/Val
Figure 17a Localization of spike occurrences Figure 17b Time evolution of spike occurrences
The next frequent cause for rejection of IASI spectra is when the NZPD cannot be determined by the on-board processing. The NZPD is the number of the interferogram sample that is used as the central sample for the computation of the spectra by the FFT. It is located near the central fringe of the interferogram (see figure 18a) but for some kind of atmospheric scenes this central fringe disappears and the NZPD computation fails. In these circumstances the spectrum cannot be computed by the on-board software and the data is lost.
ECMWF/EUMETSAT NWP-SAF Workshop on the assimilation of IASI in NWP, 6 – 8 May 2009 11

BLUMSTEIN, D. ET AL.: THE IASI INSTRUMENT
ZPD
IASI Interferogram
Temporal evolution of NZPD detection failure
0.3%
End of Cal/Val
Temporal evolution of NZPD detection failure
0.3%
End of Cal/Val
Figure 18a ZPD definition: central fringe of interferogram Figure 18b Time evolution of ZPD error occurrences
Figure 18b shows that the frequency of NZPD computation failure has remained stable since the end of the Cal/Val except for a small seasonal variation (about 0.1 %).
Finally figure 19 below shows one of the most important monitoring that is performed in the IASI TEC: it ensures that radiometric calibration of IASI spectra remains good after a re-initialization of on-board configuration (typically after a mode transition between Normal Operation and External Calibration. When the quality index reaches a certain limit a parameter table which is called the Reduced Spectra must be reloaded. As the figure 19 shows, the frequency of these operations is lowered when time increases. This is due to the fact that the instrument dimension evolution is progressively lowered as the structure desorbs (mainly water molecules).
Figure 19. Reduced Spectra Quality Index monitoring
In addition, the motion of the mechanisms (Cube Corner and Scanning Mirror) is regularly recorded via the Position Data Diagnostic (PDD). This shows that the two mechanisms are in a very good health after more than two years in orbit.
12 ECMWF/EUMETSAT NWP-SAF Workshop on the assimilation of IASI in NWP, 6 – 8 May 2009
BLUMSTEIN, D. ET AL.: THE IASI INSTRUMENT
ECMWF/EUMETSAT NWP-SAF Workshop on the assimilation of IASI in NWP, 6 – 8 May 2009 13
9. Conclusions Since the beginning, the scientific users have given a very positive feedback on the instrument performances. IASI data are now operationally assimilated by meteorological agencies (e.g. METEO FRANCE, ECMWF, UK MetOffice) and are used as reference for intercalibration with other sensors (in the frame of the GSICS initiative). The instrument shows a very good health after more than two years of exploitation. Maintaining a high level of user’s satisfaction also means according a high priority to the operational constraints in order to maximise the instrument availability, including efficient management of occasional anomalies and necessary interruptions like external calibrations and decontaminations.
10. References [1] Chalon G., Cayla F.R., Diebel D., “IASI: An advanced sounder for operational meteorology”, IAF 2001 conference proceedings, 2001
[2] Blumstein D et al, “IASI instrument: technical overview and measured performances”, Proc of SPIE, Vol. 5543, August 2004
[3] Blumstein D et al, “In flight performance of IASI on MetOp-A, Proc of SPIE, Vol. 6684, 2007
[4] Collard A et al., “Monitoring and Assimilation of IASI Radiances at ECMWF”, ITWG Conference XVI, May 2008
[5] Hilton F et al., “Assimilation of IASI Radiances at the Met Office”, ITWG Conference XVI, May 2008
[6] Guidard et al., “Monitoring and assimilation of IASI data in Météo-France NWP system”, First IASI Conference, Anglet 2008
[7] Siméoni, D et al, “Design and development of IASI instrument”, Proc of SPIE, Vol. 5543, August 2004
[8] Buffet et al, “IASI instrument onboard MetOp-A: lessons learned after almost two years in orbit”, ICSO, Toulouse 2008
[9] Ph. Hébert, & al “IASI instrument: technical description and measured performances”, ICSO 2004
[10] G. Bonnetto, C. Alis “IASI instrument thermal control”, 32nd ICES, San Antonio 2002
[11] B. Bailly & al “The IASI cold box subsystem, a passive cryocooler for cryogenic detectors and optics” ICSO 2000
[12] P. Nicol, J. Fleury, C. Le Naour, F. Bernard, The IASI Detection Chain , ICSO 2004
[13] D. Miras & al “IASI signal processing on PFM model” 17th workshop on Infrared Measurement by FTIR Québec 2004
[14] B. Tournier & al “IASI level 0 and 1 processing algorithm description” International TOVS Science Conf XII, 2002

ECMWF/EUMETSAT NWP-SAF Workshop on the assimilation of IASI in NWP, 6 – 8 May 2009 14