Embed Size (px)
Citation preview

The Future of Energy
Editors: Sunjoy Joshi and Vivan Sharan

© 2015 BY OBSERVER RESEARCH FOUNDATION
Editors:
Sunjoy Joshi Vivan Sharan
Authors:
Manisha GulatiAshish GuptaRajan GuptaIgor MakarovInaiê Takaes SantosAkhilesh SatiThomas Elmar SchuppeLouise ScholtzVivan SharanZhongyi Yin
With Contributions by:
Hubertus BardtHeribert DieterAlexandre GrossRovshan IbrahimovVikrom MathurShingirirai MutangaMaurício Canedo PinheiroMohan PolamarLydia PowellDemétrio ToledoMarkus Zimmer
All rights reserved. No part of this publication may be reproduced or transmitted in any form or by any means without permission in writing from Observer Research Foundation.
iii
List of Measurement Units ............................................................................................................. v
Editors’ Note .................................................................................................................................. vii
Chapter 1: The Future of Global Energy Systems
Introduction ......................................................................................................................................... 3
Overview of Current Energy Resources and Systems ............................................................................ 5
The Future of Energy in Different Regions of the World ....................................................................... 16
Examples of Technology Breakthroughs that would Change the Energy and Emissions Landscape ...... 33
Conclusions ........................................................................................................................................ 37
Endnotes ......................................................................................................................................... 39
Chapter 2: Supply Side Economics and the Need for Energy Diversification
Introduction ......................................................................................................................................... 45
Global Demand and Supply ................................................................................................................... 46
Low-Carbon Options for Baseload Power Generation ........................................................................... 49
Diversification/Growth of Fuel Supply .................................................................................................. 51
Conclusions ......................................................................................................................................... 80
Endnotes ......................................................................................................................................... 83
Contents

iv
Chapter 3: Enterprise Efficiency: Experiences of Brazil, Russia, India and South Africa
Introduction ......................................................................................................................................... 87
Country Backgrounds ............................................................................................................................ 88
Energy Consumption and Efficiency ...................................................................................................... 89
Identifying Energy-Intensive Industries ................................................................................................. 96
Assessing Efficiency Metrics of Indian Manufacturing Sector ............................................................... 102
Policy Drivers of Energy Efficiency ......................................................................................................... 106
Shared Experiences in Industrial Efficiency ........................................................................................... 111
Endnotes ......................................................................................................................................... 114
Chapter 4: Energy Access: Country Perspectives
Introduction ......................................................................................................................................... 119
Global Energy Access Status ................................................................................................................. 119
Energy Access in India ........................................................................................................................... 120
Energy Access in South Africa ............................................................................................................... 127
Rural Access to Electricity in China ....................................................................................................... 129
Energy Access in Russia ........................................................................................................................ 132
Endnotes ......................................................................................................................................... 135

v
GT gigatonne 106 kilogram
W watt 1 joule per second
KW kilowatt 1 watt x 103
GW gigawatt 1 watt x 106
MW megawatt 1 watt x 109
TW terawatt 1 watt x 1012
kgoe kilograms of oil equivalent
toe tonnes of oil equivalent
mtoe million tonnes of oil equivalent
tCO2e tonne of carbon dioxide equivalent
ktCO2e thousand tonne of carbon dioxide equivalent
GtCO2e 106 tonne of carbon dioxide equivalent
kWh kilowatt-hour
MWh megawatt-hour
TWh terawatt-hour
GWh gigawatt-hour
bbl billion barrels
mmboe million barrels of oil equivalent
bcf billion cubic feet
bcm billion cubic metre
tcm trillion cubic metre
mmbtu million British thermal units
List of Measurement Units


vii
2014 re-taught the world an important lesson. Just when $100 seemed to have become accepted by the world as the new base price for a barrel of crude oil, the fracking industry emerged as the new challenger to OPEC’s clout. With Saudi Arabia keen to maintain its market share in an oversupplied market, not only did the price of Brent crash below $50, oil and gas producers were forced back to the drawing board to rework the economics and in some instances, even scrap what had till recently been seen as prized investments across the world. However, well before the fracking industry upset the best calculations of oil traders and hedge funds, its impact had already turned the coal industry upside down the world over. Coal prices had slid under the weight of all the outbound coal pushed out of the US, where power plants were substituting coal with shale gas. 2014 was thus an important reminder to the world of the essential interconnections between different forms of energy and their inherent inter-relatedness in global markets. It also taught us yet again the folly of long-term projections and energy models. There is precious little computer models can do to account for the power of innovation and human ingenuity, or indeed to deliver all possible scenarios that could arise in complex economic and political systems at the global level affecting the demand and supply of commodities. For all the current predisposition to macro quantitative modelling, there can no escape from bottom-up empirical analysis.
This publication is the consequence of deliberations at the Economic Policy Forum that is coordinated by the Deutsche Gesellschaft für Internationale Zusammenarbeit (GIZ) and comprises prestigious research institutions across the world. Under the aegis of this forum, the Observer Research Foundation led the Resource Policy Platform. It convened annual meetings and coordinated joint research work among member institutions. In doing so, it brought together leading think tanks and practitioners from around twenty emerging and developed countries to discuss and debate some of the priority issues concerning energy and environment policy. The objective was to inform policy discourse from an empirical, stakeholder-driven perspective.
This ambitious report focuses on the future of global energy systems, supply-side economics and the pressures for energy diversification, energy efficiency and energy access at the country and sub-national level. The expansive scope of the study is based on the assumption that the reader is familiar with contemporary conversations on energy; it seeks to inform the reader of analyses and perspectives from Economic Policy Forum member countries by synthesising the deliberations in the meetings thus far and building upon the substantive research work conducted through the platform.
The focus of research in the Economic Policy Forum follows from the relevance of emerging countries such as BRICS in energy policy debates. One of the paradoxes in such debates, as is pointed out in the report, is the fact that the countries which face the largest energy challenges, or the most important energy policy-related questions, are also countries where policymaking variables are in constant flux. Conversely, in the case of developed countries, a number of fundamental assumptions are well known, which include expectations about consumer demand and industrial consumption extrapolated on the basis of demographic as well as socio-economic trends.
The global energy system two decades from now will still be largely reliant on fossil fuels. Indeed, oil, coal and gas are expected to contribute up to 81 percent of primary energy consumption in 2035. Following
Editors’ Note
viii
industrialisation and population stabilisation, developed countries have largely fulfilled energy access requirements for future generations. However, this is far from the case across much of the emerging and developing world. This has obvious implications for the domestic policies large emerging countries such as India, yet in the throes of creating sufficient generation capacities to ensure ‘energy access for all,’ will adopt during this time frame.
The year 2015 is going to be pivotal for the energy and environment story that unfolds over the next decades. The United Nations Framework Convention on Climate Change-led process for establishing a successor to the Kyoto Protocol will in many ways attempt to set the future course for the energy sector. The Sustainable Development Goals adopted by the United Nations General Assembly by September 2015 will add another layer of and goal setting and therefore policy complexity.
Despite these, this report suggests that national level decision-making will depend upon a number of factors that will be context specific. For instance, fuel switching from dirty fuels like coal will be determined by availability of alternative fuels such as natural gas, and energy efficiency improvements will be determined by economies of scale as well as trends in energy-intensive sectors such as cement and steel. This report also highlights the complexities of energy pricing. India’s energy sector development is a case in point. A country with 800 million people living at less than two dollars a day is bound to be extremely sensitive to output prices. However, even in the case of developed countries, price movements must inevitably be factored into decision-making. The implications of increases in electricity costs as a result of renewable energy inputs into the power grid are profound. For example, adding the costs of backup and distribution, and the profit share of distribution companies, retail consumers in the US need to pay nearly three to four times the grid costs for solar power. At the same time, the pace at which innovative technologies are pushing the costs of renewables downward is paradoxically forcing many to delay large-scale commitments which will lock investments into existing technologies.
As the fracking revolution reminds us, technologies at the edge of innovation will be the ones that will lead to a paradigm shift in the way the world produces and consumes energy in the future. But these remain largely unknown variables, near impossible to account for. The report therefore confines itself to the current state of play and the many technologies that are already within reach, such as nuclear fission. Nuclear power can provide base load capacity for a number of countries which will need to scale up power generation. Nuclear energy also complements the development of renewable energy systems in a carbon-constrained world. But as the Fukushima incident has shown, public opinion and politics will continue to limit and circumscribe technological pathways and have a commensurate impact on long-term decision-making.
A key takeaway from the discussions and joint research that culminated in this report is that the global energy community must learn from shared experiences. Ultimately, decision-making cannot function in isolation of global and local political and economic trends. It is precisely towards the goal of providing a baseline for understanding the policy context that this report makes a significant contribution. We commend the experts for their valuable inputs and hope that the report serves as a benchmark for similar reports on this extremely rich and relevant theme.
Sunjoy Joshi and Vivan Sharan

1The Future of Energy
The Future of Global Energy Systems
Rajan Gupta, Theoretical Division, Los Alamos National Laboratory, USA
Thomas Elmar Schuppe, Senior Fellow, Observer Research Foundation, India


The FuTure oF Global enerGy SySTemS
3The Future of Energy
In this paper, the authors present an overview of the opportunities and challenges in energy resources, exploration, production and infrastructure in various regions of the world.
To assess the requirements for future energy resources and systems and their environmental impacts, a number of parameters need to be defined by each nation and/or region. These will create an impact on the amount and kind of energy systems that will be needed and developed. Key questions include:v At what number and date will the population
stabilise?v What will be/what are the economic
development goals of a country? For example, what is the timeline of the average per capita electric energy desired?
v What energy resources exist locally and on what time scales can they be exploited?
v What will be the nature of the public-private partnership that will be effective in raising the capital required to build the needed infrastructure and meet the energy demand?
v Governance, policies, regulations and investment scenarios?
v Economic and environmental stewardship and advocacy by civil society and non-government institutions and impacts of their pressure on the government?
v Regulations on greenhouse gas emissions and their implementation?
v Impacts of climate change and of international climate change policies?
The answers to these questions have large variations within and between countries and for many countries they have yet to be defined. Developing countries with growing populations, inadequate infrastructure and limited resources consider it their priority to increase capacity in the cheapest and fastest possible way.
IntroductionMost developed countries, meanwhile, have a clearer grasp of the answers for the following reasons:v Their populations have stabilised and they have
a much better characterisation of the demand. Consumption in OECD countries is projected to stay almost flat out to 2035.
v They are installing 2nd and 3rd generation systems and have sufficient experience to incorporate the latest efficient technologies.
v The energy consumption per capita is decreasing because of improvements in efficiency and because their economy is less dependent on manufacturing.
v They have overbuilt capacity for generating electric power and are able to switch fuels quickly to optimise the system with respect to regulations, efficiency, emissions and costs.
v Their control systems are better implemented and they have a more extensive and robust transmission grid that facilitates the integration of wind and solar systems.
The global energy system is enormous, complex and far from transparent. Even when sufficient resources (fossil fuels, wind and solar potential) have been identified to meet demand, there is considerable uncertainty in prices and how the energy systems will evolve. Some of the important reasons are the following:v Fluctuations in economic growth create
uncertainty in demand. Uncertainty in demand impacts the investment into exploration, production and installation of new systems. As a result, the time scale on which new resources are brought online becomes uncertain to a significant degree.
v New regulations in response to public opposition, accidents, environmental concerns, climate change and government fiscal policies can have a large impact on production and demand.

The FuTure oF Global enerGy SySTemS
4 The Future of Energy
v Uncertainty in the timeline and performance of new technologies, their adoption by the public and unintended environmental consequences that result in new regulations.
v Political turmoil in countries that are large producers and/or consumers.
v Geopolitics, sanctions, and the use of commodities as bargaining chips by countries.
v Breakthroughs in technology and novel opportunities can happen unexpectedly and over a short period of time. They can significantly alter the energy landscape. A recent example is the coming together of deep horizontal drilling and hydraulic fracturing that opened up the extraction of oil and natural gas from tight/shale formations.
Faced with fundamental limitations in adequate real-time information, analysts create scenarios using reasonable ranges for the many variables such as economic growth, energy demand and supply, cost and impacts of greenhouse gas emissions and correlations between them. In this study we do not propose a new model but extract and integrate common plausible trends from existing studies to build a high-level picture.
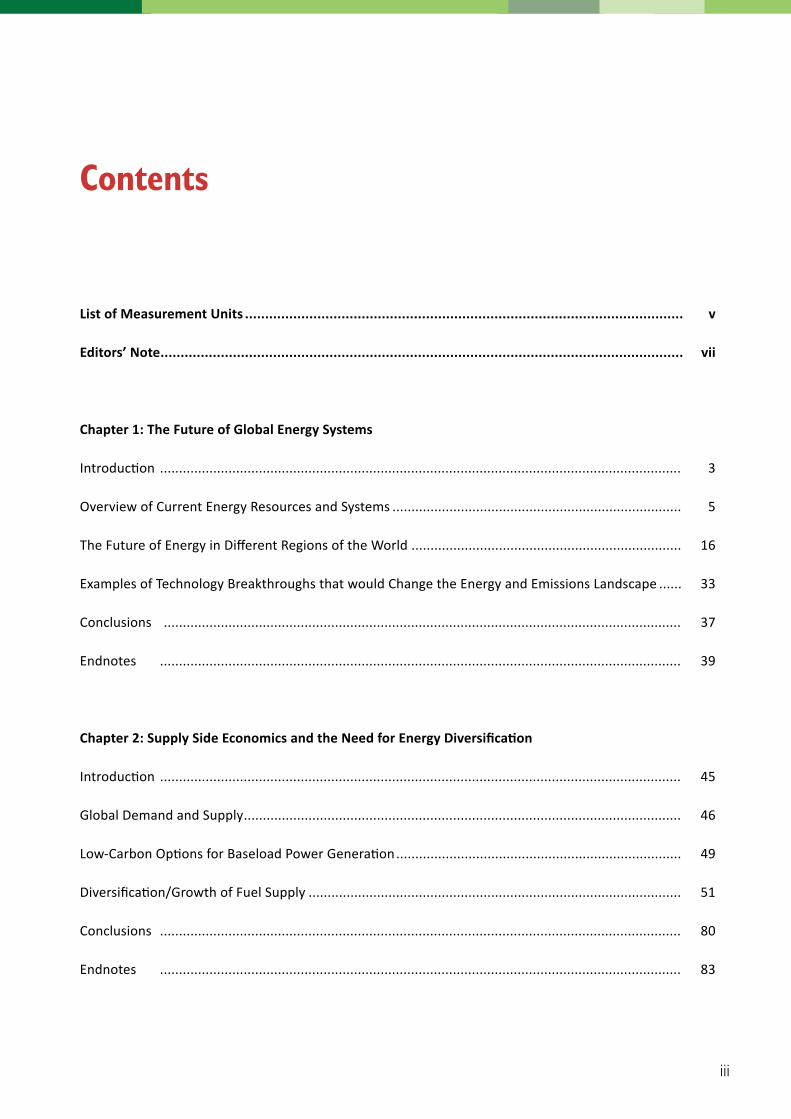
Energy experts agree that, worldwide, there is enough accessible fossil fuel to power the world through the 21st century even though there are large variations in distribution of these fuels between countries and regions. Overall, based on known reserves, humankind has at least 50-100 years to transition from a fossil-fuel-based economy to a zero-carbon one. On the other hand, the rising concentrations of CO2 in the atmosphere (already at 400 ppm compared to about 275 ppm in the preindustrial era) could have consequences for the climate on the order of 100,000 years,1 and any future accumulation is cause for further concern. The annual total and per capita historic and projected CO2 emissions, as reported in the BP Energy Outlook 2035,2 are shown in Figure 1 by region. While emissions from OECD countries will continue to decrease, albeit slowly, large increase is projected to come from non-OECD countries,
in particular from China and India. While the annual world per capita emissions will grow only slightly to about five tonnes, the total emissions will increase by about 30 percent as many more people are expected to share in 21st century opportunities and contribute to GDP. To cap CO2 concentrations at 450 ppm (IEA 450 scenario shown in Figure 1 that would result in about 2oC rise in global mean temperature) requires dramatic reductions starting today: a very sharp departure from business-as-usual behaviour.
Rising global temperatures and ensuing climate change require humankind to move away from burning fossil fuels as soon as possible; or if fossil fuels are combusted, then the CO2 emitted must be captured and sequestered. This dilemma poses a challenge unprecedented in human history. Humankind will have to resist using readily available, low-cost, high-density and easy to use fossil fuels; instead it must rapidly transition to “zero-emission” technologies. The most promising in terms of both scale and low climate impacts are nuclear, solar and wind for power generation and electric vehicles for transport. Solar and wind systems are still maturing and face operational and technical challenges (intermittency, fluctuations and low density); electric vehicles need breakthroughs in battery technology; and nuclear energy has remained controversial. Even with the noblest of intentions, the current fossil fuel-based global system is so large and well-entrenched that it will take decades of concerted effort to change it. The goal of any study, such as this, is to find options to accelerate the transition.
In this paper, the authors focus on the high-level picture coloured by the need of all countries for energy security and examine the options for meeting energy needs in different regions of the world. Three time frames have been considered:
v Near-term, up to 2025 v Medium-term, from 2025 to 2040; and v Long-term, beyond 2040 and up to 2050.
The FuTure oF Global enerGy SySTemS
5The Future of Energy
The paper is organised as follows:
Second section: Summarises the current status of energy systems and resources.
Third section: Examines the opportunities, options and hurdles for building and sustaining energy security in different regions of the world.
Fourth section: Presents examples of break-throughs that would accelerate the transition to renewable systems.
Fifth section: Conclusions.
Overview of Current Energy Resources and Systems
Fossil fuels (coal, oil and natural gas) have been the dominant sources of energy that drove unprecedented development in large parts of the world in the 20th century. Four figures, shown in Figures 2 and 3 and taken from BP Energy Outlook 2035,2 capture the historical data and
Figure 1: Historic and Projected CO2 Emissions by (left) Region and (right) per capita. The IEA 450 Scenario is Based on the Requirement that CO2 Concentration in the Atmosphere Peaks at 450 ppm. To Achieve it Requires Dramatic Reductions in Emissions, Starting Today!
Source: BP Energy Outlook 2035, slide 34
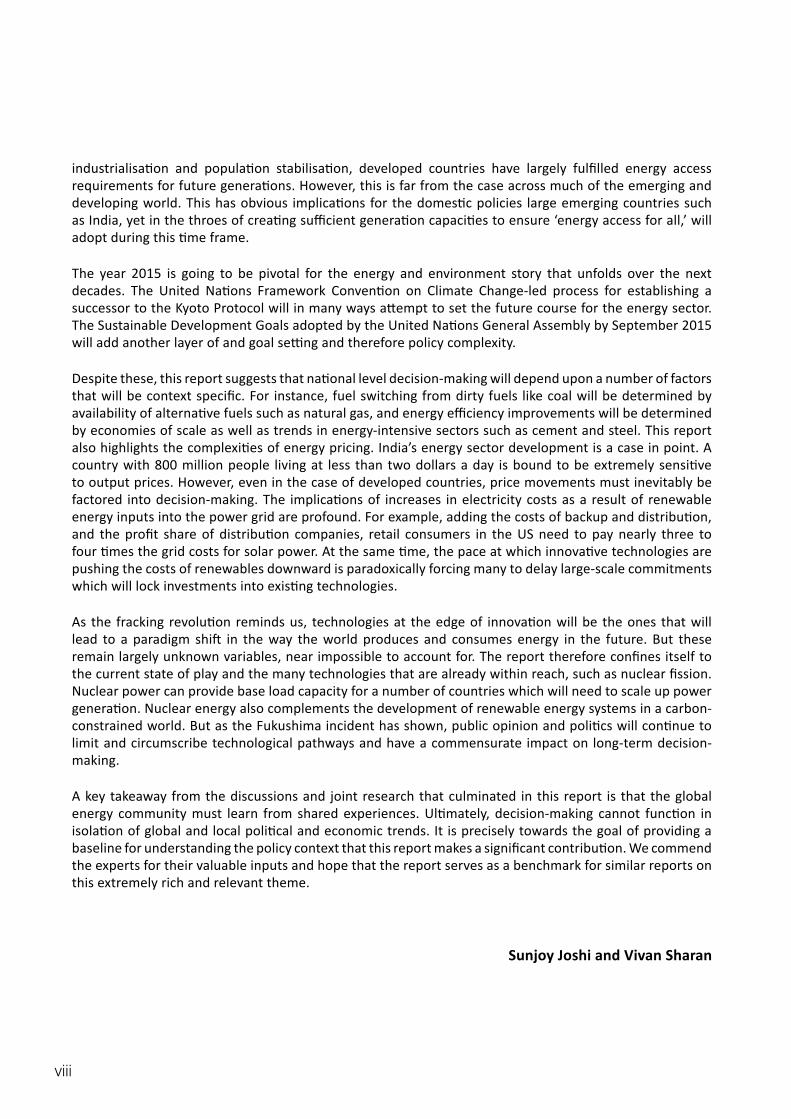
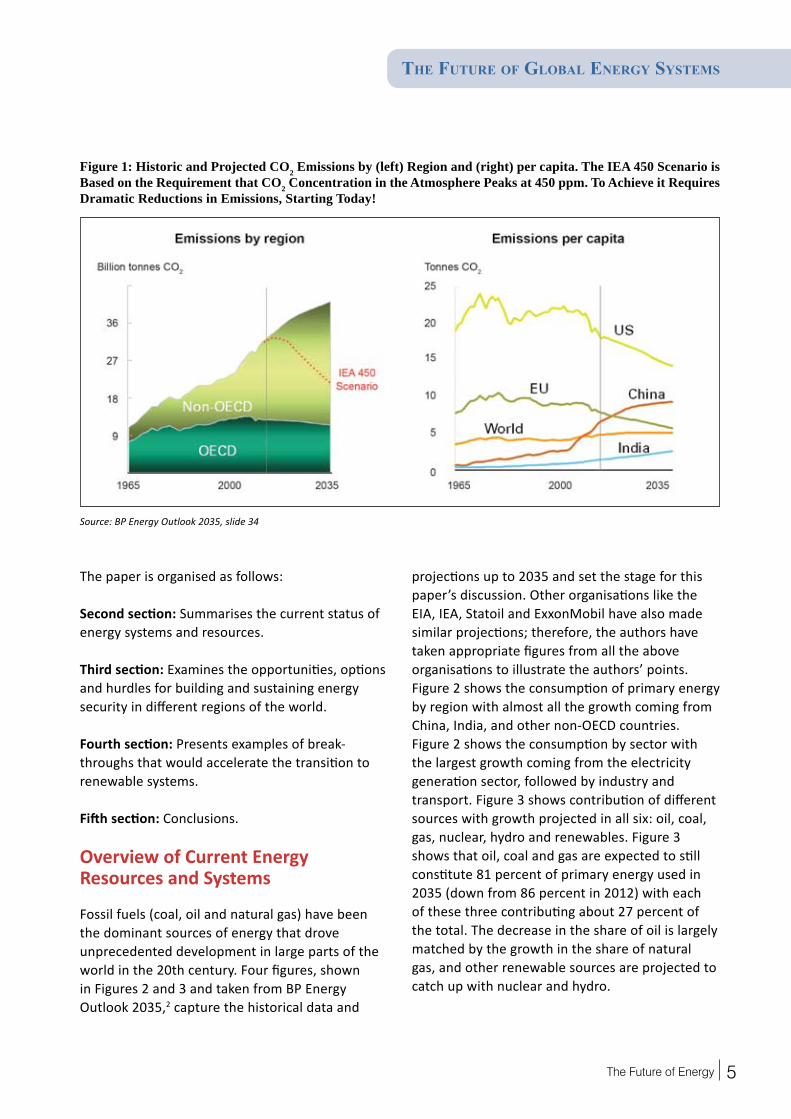
projections up to 2035 and set the stage for this paper’s discussion. Other organisations like the EIA, IEA, Statoil and ExxonMobil have also made similar projections; therefore, the authors have taken appropriate figures from all the above organisations to illustrate the authors’ points. Figure 2 shows the consumption of primary energy by region with almost all the growth coming from China, India, and other non-OECD countries. Figure 2 shows the consumption by sector with the largest growth coming from the electricity generation sector, followed by industry and transport. Figure 3 shows contribution of different sources with growth projected in all six: oil, coal, gas, nuclear, hydro and renewables. Figure 3 shows that oil, coal and gas are expected to still constitute 81 percent of primary energy used in 2035 (down from 86 percent in 2012) with each of these three contributing about 27 percent of the total. The decrease in the share of oil is largely matched by the growth in the share of natural gas, and other renewable sources are projected to catch up with nuclear and hydro.
The FuTure oF Global enerGy SySTemS
6 The Future of Energy
Figure 2: Historic and Projected Global Consumption of Primary Energy by Region (left) and Sector (right) (toe = tons oil equivalent). (1965-2035)
Source: BP Energy Outlook 2035, slides 4 and5.
Figure 3: Historic and Projected Share of Global Primary Energy Consumed by Source (left). Total in Billion toe and as a Percentage of the Total (right). (1965-2035)
Source: BP Energy Outlook 2035, slides7 and 8.
The consensus of all studies is that there are no impending shortages of fossil fuels globally, at least for the next 50 years, and their consumption is projected to continue growing. Even by 2035, they are projected to provide about 81 percent of the primary energy, only a small decrease in relative
share compared to 86 percent in 2013. Recognising their dominant position (safe, high energy and power density, vast accumulated investment and long experience in exploiting them for power generation, transportation and heat), the authors consider it appropriate to examine them first.

The FuTure oF Global enerGy SySTemS
7The Future of Energy
gasoline for at least the next decade and most new models are only incrementally more efficient versions. Concomitantly, global usage of oil will continue to grow, with the Middle East, India, China, and South-East Asia accounting for most of the growth as shown in Figures 4 and 5.3
There are significant variations in the pattern of use of oil in different countries of the world; these
Oil and TransportationFossil oil will dominant fuel for transportation in the short- and mid-term. With a growing global population and more people wanting the convenience of individual transport and being able to afford it, the total number of personal light duty vehicles is projected to grow as shown in Figure 4. The almost one billion cars and small trucks on the roads today will continue to need diesel and
Figure 4: Historical (1965-2035) and Projected (200-2035) Increase in Fuel for Transportation (left) [BP Energy Outlook 2035, Slide 19] and Personal Light Duty Vehicles (right)
Source: IEA WEO 2013 New Policies Scenario
Figure 5: Projected Increase in Global Oil Demand in the IEA New Policies Scenario in WEO 2014. (2013, 240)
Source IEA WEO (2014) p. 100

The FuTure oF Global enerGy SySTemS
8 The Future of Energy
Source: http://www.eia.gov/todayinenergy/detail.cfm?id=14451.
Figure 6: Comparison of Energy Density of Fuels used for Transportation by Both Weight and Volume.
include the fuel efficiency standards of vehicles, average miles driven per year and the price of gasoline. In developed countries with stabilised populations, the amount of oil being consumed is decreasing because of improvements in fuel efficiency, safe and effective public transport systems and reduced usage due to high price of gasoline as well as lifestyle changes. Growth in demand is coming mainly from the developing world.
Globally, there continue to be major opportunities for reducing oil consumption in the transport sector in the near- and medium-term through the following strategies: vEfficiency gains;vPenetration of cost-effective hybrids and CNG
vehicles;vMore effective public transport systems; andvBetter designed cities to reduce commute
distances and road congestion and to encourage people to walk and use bicycles.
These trends, leading to reduction in oil used by the transportation sector, are already visible in developed countries4 and can easily
be accelerated though government policy and incentives. Significant penetration of electric vehicles is, however, expected only in the long-term.
In the extraction of oil, technological innovations have allowed the exploitation of new resources, for example, tar sands in Canada, shale (tight) oil in the US, heavy oil in Venezuela and ultra-deep pre-salt oil in Brazil. In the production of oil there have been temporary ups and downs but no significant (physical) shortages in the last decade.5 For example, in 2012, production in the US (tight oil), Russia and Saudi Arabia recorded significant increases; Libya and Iraq recovered production; aging fields past their peak in the North Sea (Norway and UK) and Mexico (problems made worse by inadequate investment) continued their decline; and political factors led to decreased production in Syria (civil war) and Iran (sanctions). Consumption in the US and most European countries continued its decline but grew in other regions like the Middle East, South and East Asia. Overall, the significant reduction of oil used in the US and Europe has been offset by the increases in the Middle East and Asia-Pacific. Limited spare

The FuTure oF Global enerGy SySTemS
9The Future of Energy
production capacity, which allows even small cuts by OPEC members or any disruptions (for example, reduced production in Syria and Iran) to have large impacts, has contributed to high prices, which have remained, on average (nominally), above $100/barrel since 2011. Future demand and prices are uncertain since the price fell dramatically to below $50/barrel between June 2014 and January 2015 due to lower global demand expectations and higher supply.
To evaluate the potential for switching fuels, a comparison of energy densities of fuels, an important parameter in the transportation sector, is shown in Figure 6 with gasoline and diesel setting the standards. For example, a CNG-fueled car requires a tank with three times the volume compared to a gasoline-fueled one for storing the same energy. The only significant alternatives to oil for liquid fuel based technology today are bio-fuels and CNG. Bio-fuels are, however, limited in scope unless there are major breakthroughs in biomass production and conversion technologies, and society is convinced that environmental impacts of growing the bio-crops will not outweigh the benefits. In 2012, bio-fuels provided about 1.2 MMboe/day out of the 88 MMboe/day consumed6. Ethanol production (mostly from corn in the US and sugarcane in Brazil) is expected to saturate at about 25 billion gallons a year (about 2 MMboe/day versus the more than 100 MMboe/day oil usage that is projected post-2035). Fuel and power from bio-waste is also limited by the volume of bio-mass that can be collected at reasonable cost even if R&D breakthroughs leading to cost-effective conversion of cellulose to ethanol materialise. All bio-crops will also have to address the growing issue of “food versus fuel” as competition for access to arable land, water and fertilisers grows and the environmental impacts7 accumulate CNG/LNG are effective fuels for light vehicles and trucks; however, growth in their use has been limited by the lack of distribution infrastructure. Europe and particularly the US are currently evaluating the potential of CNG versus LNG for high-mileage heavy-duty trucks.8
On the new-technology front, the biggest hope for bio-fuels today is algae.9 It remains to be seen if the cost and water needs of algae production and harvesting will be brought down for algal oil (2013 production cost was about $8/litre) to compete with fossil fuels ($1/litre that includes an acceptable carbon tax on fossil fuels) over the next 30 years.10
Clouding the future of global oil trade is the important recent development – the unexpected collapse of the price of oil from $115 to $50/bbl between June and January 2015. It highlights the volatility of the system and the interplay between stagnant demand due to global financial downturns, increase in unconventional production by the US, power of the OPEC and geopolitics. It has given rise to many questions: Will the low price persist? Will it settle at a value that is high enough to allow production of unconventional oil, or will low prices drive out that nascent industry? What hardships will it inflict on countries that rely on oil for a majority of their revenues and are considered belligerent by the West such as Iran, Russia and Venezuela?
On the usage end, large-scale switch to cost-effective electric cars needs major advances in battery technology. Figure 6 highlights the current state of batteries – they sit at the very low end with respect to both energy per unit weight and volume. Based on current trends and the scale of R&D needed, and notwithstanding the large investments, such a transition to electric vehicles is unlikely to occur quickly or soon. As it occurs, it will shift the burden of greenhouse gas emissions from the transportation sector to the electricity generation sector. Meanwhile, the liquid-fuel based automobile industry is improving fuel efficiency by making improvements in engine technologies11 and incorporating novel materials to decrease vehicle weight. The result is that the cost-performance bar for electric cars is being raised steadily.
Given the current dominance of oil and the

The FuTure oF Global enerGy SySTemS
10 The Future of Energy
slow and uncertain growth of alternatives, it is unlikely that, by mid-term, there will be significant transition away from liquid fuels (oil) for individual transportation, or for powering ships and airplanes. Therefore, the global carbon footprint of the transportation sector, which is proportional to the amount of oil combusted, will also continue to grow since it is unlikely that practical methods for capturing greenhouse gas emissions from engines powering vehicles, pumps, ships or planes will emerge any time soon.
Coal and Electricity GenerationCoal is the dirtiest fossil fuel and used predominantly for electric power generation. Coal production and consumption has grown by over 50 percent between 2002-2012 worldwide driven by consumption in China (+235 percent) and India (+97 percent), and production in Indonesia (+375 percent).12 The global consumption of almost eight billon tons in 2012 accounted for about 45 percent of CO2 emissions from fossil fuels (oil contributed 35 percent and natural gas the remaining 20 percent).13 Emissions of greenhouse gases, in addition to environmental impacts and pollution, makes transitioning away from coal the top priority in the climate change mitigation agenda. While many countries are replacing their older coal-fired units by high-efficiency ones with emissions controls, few have reduced their dependence on coal. These few are developed countries with access to inexpensive natural gas; for example, the US, Canada, Denmark and Russia. The next section highlights the countries that are critically dependent on coal-fired generation, their options for the future and possible impacts of the mounting social pressure vis-à-vis climate change and environmental concerns to transition away from coal.
Analysing current reserves, production and consumption histories, an important pattern emerges. Somewhere around the year 2040, imports of coal will be dominated by China and India and only six countries – the US, Russia,
Australia, South Africa, Ukraine and Kazakhstan – will have sufficient reserves left to undertake exports in gigatons. In the absence of large-scale carbon capture and sequestration, any internationally binding agreement accepted by these six suppliers (or led by them) in response to the need to mitigate climate change would squeeze coal out as a fuel.
Fortunately, the generation of electricity has significant variations in different parts of the world and there are more options at scale to choose from. Regional variations and opportunities have been examined in more detail in Section III.
Natural Gas: Conventional and UnconventionalNatural gas is poised to become the dominant fossil fuel across the world for power generation and transport, and for domestic and industrial use. In addition to being a multi-purpose fuel, it is accepted socially because its end-use combustion produces only CO2 and H2O, which are non-toxic and odourless. It has relatively higher energy density by weight and can be transported effectively by pipelines. Its only disadvantages are fugitive emissions during extraction and transport and the added cost of intercontinental shipping as LNG, including the cost of cleaning the gas before liquefaction. Figure 7 shows the historical and projected continued growth in consumption of natural gas in all regions at an average rate of 1.9 percent until 2035.2 Shale gas is projected to contribute 22 percent of total consumption by 2035, with most of it in the developed countries in the near-and mid-term.
In 2014, the price of natural gas had large regional variations reflecting dependence of transport costs on the relative fraction supplied as LNG versus via pipelines. The three major price categories were: North America (about $4/MMBtu) and Europe (about $10/MMBtu) via pipelines, and Asia-Pacific as LNG (usually above $15/MMBtu in recent years). With new production capacity and

The FuTure oF Global enerGy SySTemS
11The Future of Energy
Source: BP Energy Outlook 2035 Slides 23 and 25
Figure 7: The Historical and Projected Growth in the Consumption of Natural Gas by Region. (Left) Total Global Consumption and (right) Contribution of Shale Gas to the Total. (1965-2030)
construction of export terminals, it is anticipated that the differences will decrease and the price will come closer to the cost of production. It remains to be seen whether Asia-Pacific LNG spot prices can come down to $10/MMBtu and stay there for a long period and whether a unified market for gas emerges.14
The gas turbine industry is reacting to today’s opportunity. Gas turbines are and will remain the best option in the short and medium-term in providing backup to intermittent solar and wind resources. Manufacturers are designing the new generations of high-efficiency gas turbines (flexefficient F and H class turbines and aero-derivative ones) for frequent (250+/year) cold starts and fast ramp up rates (less than 30 minutes to full power from a cold start) to provide both base load generation and backup intermittent to solar and wind.
Unconventional resources, such as tight oil and shale gas, are widely distributed across the world, but the development of these resources is, today, dominated by US and Canadian companies.
Complex and sophisticated analysis capabilities and extraction technologies (off-shore, deep and horizontal drilling; hydraulic fracturing; and 3-D reservoir modeling and simulations) are needed to efficiently develop and exploit unconventional resources locked in deep waters, deep underground, harsh arctic environments, shale and tight formations, or as coal-bed methane (CBM). Looking ahead, development of environmentally responsible in situ gasification technology would open up huge additional resources locked in deep, narrow or fragmented coal seams. Another large untapped resource is deposits of methane hydrates locked underwater on continental shelves. Japan is actively investing in developing the technology for mining these deposits.15 These unconventional resources are widely distributed around the world but even after technological breakthroughs have been established, other developed and developing countries will require very significant investments to exploit them and, at least initially, will need to foster collaborations with multi-national companies with the state-of-the-art technology and experience as the risk of large-scale fugitive emissions is high. Governments

The FuTure oF Global enerGy SySTemS
12 The Future of Energy
will, therefore, need to create the right incentives and policies for attracting investments; at the same time, they must convince their citizens that the development of resources will be carried out responsibly and in the nation’s interest. These are non-trivial hurdles, so it remains to be seen how fast these technologies mature and diffuse to other countries and what government policies, industrial partnerships and cooperatives are developed to facilitate timely, efficient and environmentally benign extraction and processing.
Installation and Integration of Solar and Wind FarmsAt the end of 2013, worldwide wind, solar and geothermal capacity was 318 GW16, 140 GW17 and 12 GW18, and annual capacity additions were about 35, 39, 0.6 GW, respectively. In principle, wind and solar power can meet global electricity needs with a small carbon footprint. However, large-scale deployment of wind and solar photovoltaic (PV) systems require solutions to the intermittency and rapid fluctuations during generation challenges. In the last four years (2010-2014) there has been a dramatic reduction in the cost of solar panels (cost came down to about $0.6 per peak watt at the end of 2014) to the point that installations in new homes with net-metering options and no other subsidies are cost-effective with a less than 20 year payback period. Utility scale installations are still driven by incentives and mandates. Experience with concentrating solar power plants (CSP) is coming mainly from installations in Spain and the US, and the price point at which they become competitive is 20-40 percemt higher than solar PV. Utility scale wind farms are a more mature option and have become competitive with fossil-fuel based generation on a simple $/KWh basis. However, on-shore capacity in most countries is limited; for example, the current estimated wind energy potential measured at 80m hub height for India is 102 GW. Fully exploited, 102 GW could contribute about 200 TWh per annum, i.e. about three percent of the total estimated 6000 TWh electricity demand in a developed
India by 2050.19 In the long-term the highest wind potential is from off-shore farms, which are primarily being developed in North-West European countries (UK, Denmark, Germany, etc.) and, more recently, in China.
Since wind and PV plants have no fuel costs, a simple calculation can be done to estimate the tariff at which they become economically viable without subsidy but under favourable regulatory conditions and a guaranteed tariff. If we assume an overnight capital cost of $2/Watt for a solar PV plant20; a 10-year mortgage at eight percent; allocate 2.5 percent of capital cost for annual operation and maintenance; and require 20 percent profit on the amount of electricity sold, then the capital cost of a 1 MW plant would be $2 million; the annual mortgage payment would be $291,000; O&M costs would be $50,000 and the expected annual profit would need to be $80,000 to achieve a rate of return on investment that investors typically expect. Such a plant in an area of high solar insulation could generate and export about 1.8 GWh per year. Assuming all the electric energy is sold at a guaranteed fixed rate, the tariff paid to the generator would have to be about $0.24/kWh to yield the desired total revenue of $421,000/year. Wind energy, on the other hand, would become economically viable at $0.12/kWh if one assumes a capital cost of $1/Watt, O&M cost at five percent, and all other factors the same. Note that good onshore and offshore wind sites typically produce 15-30 percent more electricity than good solar sites. The above numbers, summarized in Table 1, are, the authors believe, underestimates; however, they can easily be scaled as appropriate to obtain actual costs in different regions and countries.
The cost of electricity will, in practice, be higher if high-quality dispatchable power is required since then these systems need backup. Adding the cost of backup and distribution, and the profit expected by the distribution company (assuming a total of $0.1/kWh for these), a retail customer would need to pay over $0.33/kWh for solar energy

The FuTure oF Global enerGy SySTemS
13The Future of Energy
Table 1: Cost Analysis of Probable Tariff that a Generating Company would need to Charge for a 1-MW Solar PV Plant Versus Wind Turbine Power Plant to be Sustainable without any Subsidy other than Guaranteed Fixed Tariff.
Assumed Capital Cost
$/watt
OvernightCapital Cost 1 MW unit
YearlyMortgage payment at 8% for 10 years
Operation &Maintenance
Cost at 2.5% for PV
5.0% for wind
Energy Generated GWh/year
Profit at ~20% of
electricity sold
Price per kWh to recover cost and
profit
Solar PV $2 $2,000, 000 $291,000 $50,000 1.8 $80,000 $0.24/kWh
Wind $1 $1,000,000 $145,500 $50,000 2.0 $45,000 $0.12/kWh
and $0.22/kWh for wind. To put these numbers in perspective, today, the retail cost of electricity for a domestic customer in the US is between $0.09-$0.11/kWh, whereas in Europe it is between $0.3-$0.45/kWh.
To address the main challenges for wind and solar farms, intermittency and rapid fluctuations during productive hours, requires large-scale integrated storage and generation that can be brought online on the same timescale as the fluctuations. Today, such backup energy is provided in a cost-effective manner by reservoir-based and pumped storage hydroelectric plants or by combustion turbine power plants. To build a balanced integrated system comprising of solar, wind, hydro and gas turbine units requires cooperation between utility companies and an enabling regulatory environment that is still emerging even in the countries leading in the development of “smart grid” technologies.21 One can further combine these with nuclear power plants, which are cost-effective for base load power and have a low-carbon footprint, to build a highly optimised system. To facilitate the growth of such integrated (and more complex) systems, it is equally important to develop and train the human resource needed to operate and maintain them. Such a workforce is lacking in most developing countries. Large-scale use of solar and wind farms to charge batteries or generate hydrogen by electrolysis are unlikely in the short term as there is little demand for these today: there are very few
utility scale storage farms or electric vehicles and cost-effective utility scale electrolysis technology is still in the R&D phase.
As the capital costs come down and as experience with integrating them into the grid accumulates, solar and wind farms will continue to be installed but will not significantly displace fossil-fuel fired capacity (see Figure 4) unless the challenge of intermittency (storage) is overcome. An integrated system designed to reduce carbon emissions and provide high-quality power would need to maintain large excess capacity in fossil-fuel and hydro plants that operates in backup mode when enough wind is blowing and/or the sun is shining and meets full demand at other times. Similarly, the grid would need to be enlarged to wheel energy from areas of high wind (or high solar insulation) to demand centres. In practice, maintaining the full complement of fossil-fuel-fired capacity to act as backup and for use intermittently is expensive, and therefore the tariff will be higher.
Three scenarios would accelerate this transition:vThe capital cost of solar and wind units falls
significantly; vThe conversion efficiency of PV cells and
wind turbines is improved from the current 30 percent for typical wind turbines towards the Betz limit of 60 percent22 and for PV from about 17 percent to demonstrated efficiency of 45 percent for multiple junction cells.23 In the

The FuTure oF Global enerGy SySTemS
14 The Future of Energy
near-term, it is unlikely that the combination of overnight capital cost and conversion efficiency will go much below the equivalent of $1/watt with 20 percent conversion efficiency for either solar or wind.
A sufficiently high price is put on carbon, for example at the emission trading scheme ETS in the EU. The bottom line is that with current technology and costs a (20-40 percent) integration of wind and solar capacity is technically achievable provided the public is willing to pay a much higher price for electricity and allows the building of enabling infrastructure in addition to the power plants (for example, new transmission lines) and/or international agreements mandate it.24
Nuclear Power Issues of safety and security of nuclear reactors and disposition of spent fuel continue to cast a long shadow on the future of nuclear power. A summary of the timeline of nuclear capacity added by OECD and non-OECD regions is shown in Figure 8. As of December 2014, there were 438 nuclear reactors in operation in more than 32 countries and 71 under construction, mostly in China (26), Russia (10) and India (6).25 Also, there are five major companies that are developing and marketing nuclear power plants: Areva (France); KHNP/KEPCO (South Korea); Rosatom (Russia); GE-Hitachi and Toshiba-Westinghouse (US-Japan mergers). These are no longer integrated companies but obtain components from a range of international suppliers, and often bid for contracts as collaborations. Following the 2013 nuclear plant disaster in Fukushima in Japan, only five countries – France, Russia, China, South Korea and India – are promoting large-scale production facilities for enhancing domestic capacity and for export. Note that China and India have integrated capacity for manufacture and installation of the full plant, but this capacity has so far served mostly the domestic market. Moreover, they each have plans for installing over 500 GW of nuclear capacity, with mixed oxide and thorium-based
fast breeder reactors constituting most of India’s planned capacity additions.
For nuclear power to grow in even China and India, which are banking on it for a large fraction of the power needed to achieve the status of developed nations, it is imperative that no major new accidents occur anywhere in the world. The slowdown in the nuclear industry after the incidents in Three-mile Island, Chernobyl and Fukushima show that negative impacts of nuclear accidents are large, long-term and global. The trend of fragmentation of manufacturing and construction spread over many companies from many countries has exacerbated the problem of liability and responsibility in case of an accident. The public wants a guarantee from the companies who profit from the construction and operations that they will be responsible all the way from construction through the dismantling of the plant and for proper disposition of all the spent fuel. With each accident, the public and the governments are less willing to accept the possibility and consequences of accidents. Furthermore, unlike in other accidents involving other types of power plants, those that experience nuclear-related incidents shut down their entire fleet of reactors for evaluation that can last over many years. As a result, increasing regulations and multiple safety measures continue to give rise to cost escalation and delays in construction. The Olkiluoto-III (Finland) and Flamanville-III (France) EPR reactors being constructed by Areva are ongoing examples of cost increase and delays in construction. International standardisation of nuclear reactor designs might address some of these issues by reducing the overhead of oversight in design, quality control and construction.26
Replacing coal-fired plants by nuclear is a very effective option to reduce carbon emissions, particularly because most of the countries that have large coal-fired generation (for example, China, USA, Russia, India, Germany, South Korea, South Africa, Japan) also have long years of experience with nuclear power and have

The FuTure oF Global enerGy SySTemS
15The Future of Energy
Source: IEA, World Energy Outlook 2014, p. 349
Figure 8: A Summary of the Timeline of the Construction of Nuclear Power Reactors by OECD/non-OECD Countries (capacities, left scale) and the Share of Nuclear in Power Generation (percentages, right scale). (1950-2013)
operating nuclear power plants. Strong public opinion against nuclear power in some countries (for example, Germany) is, however, causing the opposite trend: nuclear capacity is being replaced by coal-fired or gas turbines in the near-term.
Transmission GridThe transmission grid in most countries is a patchwork of incremental development that has taken place since the first installations. Large investments are needed to modernise and automate it, and make it more resilient to provide reliable high-quality power to all customers—industry, commercial and residential. For example, the grid will need to be enlarged to wheel energy from areas of high wind and/or high solar insulation to demand centres. Opportunities for trade between countries to balance demand and supply in the larger system will need to be developed. These improvements are increasingly being recognised as necessary, especially in order to integrate intermittent renewable generation or the expansion of renewables.
EfficiencyLarge savings of energy are possible through efficiency measures and the development of new technologies. Examples include electricity savings in lighting as it evolves from incandescent bulbs to CFL to LEDs to buildings designed to allow in more natural lighting during the day, more efficient appliances, better-insulated homes and buildings, solar hot water systems; geothermal heat pumps, higher mileage cars and better planned cities. The technology and the knowledge base for realising these huge energy savings exist and, remarkably enough, they are also cost-effective.
Comparing the three scenarios developed for IEA – the ‘Efficient World Scenario’27, the ‘450 Scenario’28 and the ‘New Policies Scenario’29 – one finds that the ‘Efficient World Scenario’ is least dependent on new policies or new technology, leads to a more efficient allocation and use of resources and delivers economy-wide cost-effective benefits. Much can be done to implement these known higher efficiency options and further decrease their carbon intensity. The transition

The FuTure oF Global enerGy SySTemS
16 The Future of Energy
Source: BP Energy Outlook 2035, slide 10
Figure 9: The Amount of CO2 Emitted Per Unit of Energy Generated has been Decreasing Steadily. A Major Change is Expected Starting Around 2020 with Increasing Conversion Efficiency of Fossil-Fuel Fired Power Plants, Generation from Renewables and Fuel Switch from Coal to Gas. (1965-2035)
can be accelerated (faster and earlier) than the trend shown in Figure 9 through education, regulations and incentives. The authors do not discuss these opportunities in this paper, not because they are unimportant but because they are essential and require an independent detailed study. The authors also stress that inculcating and incentivising a culture of efficiency must be at the core of all discussions on energy and climate. Also, populations in parts of the world that are poor and do not have adequate energy resources and services need help to incorporate, adopt and benefit from efficiency measures (indigenous and those developed by industrialised countries) so that as they develop they can leap-frog many of the wasteful practices of developed nations.
The Future of Energy in Different Regions of the World
To understand how energy systems are evolving and what opportunities and challenges exist, we examine the energy needs of, and opportunities in, different regions of the world in this section.
South America Currently, five countries in this continent – Argentina, Brazil, Columbia, Chile and Venezuela – have large economies. Of these, Argentina, Brazil, Columbia and Venezuela generate most of their electric power from hydroelectric and combined cycle gas turbine (CCGT) power plants and are, on a regional scale, essentially self-sufficient in oil and natural gas.5 These four countries can, therefore, power their development and sustain growth based on domestic reserves of fossil fuels. Venezuela has the largest oil reserves in the world and is already a major exporter of oil; however, policies of the Chavez and successor Maduro-governments created a negative impact on exploration and production. The export of natural gas from Bolivia, Peru and Venezuela is growing. Inter- and intra-region trade in oil and gas can be enhanced and implemented efficiently through pipelines, if and when required by individual economies. Moreover, these countries can also promote growth of solar and wind farms using their gas turbine and large reservoir-based hydroelectric power generation capacity as backup.
Argentina and Brazil have strong demand growth that has recently led to growth in imports. Indigenous resources can meet their growing demand; for example, they have large reserves of shale gas in addition to those of conventional gas. Planned exploitation of new large finds of oil (pre-salt fields in the Santos basin) could make Brazil a net exporter of oil by 2020 and the development of gas fields in the Campos Basin and associated production from pre-salt fields could reduce the recent growth in imports from Bolivia

The FuTure oF Global enerGy SySTemS
17The Future of Energy
and Trinidad and Tobago.30 Similarly, Argentina has incentivised the development of new fields by offering higher tariff. Furthermore, both countries have over 25 years experience in operating nuclear power plants, are adding new capacity and have so far not met with any strong public opposition.31 In the transport sector, a significant fraction of their individual transport vehicles are fueled by CNG and ethanol. Based on current reserves and predicted growth in energy demand and population over the next 40 years, potentially Chile will remain as the only country in South America that would need to continue to import a significant fraction of the fossil fuels it will consume. It too can install about five GW of wind capacity backed by existing hydro and CCGT power plants, and thereby reduce imports of coal and gas.
These five countries have very low population growth and high literacy rates. According to the CIA country factsheets, the fertility rate per woman and the literacy rates, respectively, in these countries are:vArgentina (2.27/98%);vBrazil (1.8/89%);vChile (1.85/95%);vColombia (2.1/90%); andvVenezuela (2.37/93%).
With stabilising populations and an educated workforce, the biggest challenges these countries could face in the coming decades are poor governance, corruption and public outcry against inequitable distribution of resources and wealth. The investment and regulatory environment they create for attracting capital and multi-national oil and gas companies to help exploit conventional and unconventional (heavy oil, pre-salt oil and shale gas) reserves will impact development and the timely creation of state-of-the-art indigenous capability.
In other words, countries in South America have multiple options for their energy needs, and because of large existing renewable resources (hydro, wind and biofuels) they will continue
to have a smaller carbon footprint per capita compared to other regions of the world with similar levels of development. They can provide leadership by further reducing their carbon footprint by investing in improving efficiency – public transport systems, high mileage cars, smart homes, energy efficient cities, etc. – and improving the grid to integrate solar and wind generation.
North AmericaMexico, the US and Canada are all rich in natural resources. Canada, for example, is a net exporter of oil, gas and coal and gets about 60 percent of its electricity from hydroelectric power plants. Over the last decade it has significantly reduced its dependence on coal-fired generation by increasing the share of gas-fired CCGT, but the coal saved is increasingly being exported. Mexico has been an exporter of oil since 1975 and most of its gas and coal imports are from the US. These patterns will persist especially given the growth in unconventional oil and gas (shale gas, tar sands, tight oil) production in the US and Canada. Over the last decade Mexico’s oil production has declined due to insufficient investment in existing fields and in exploration. This could change rapidly with the recently approved reforms that allow foreign investment in the state monopoly PEMEX and nudge it to become more open.32
The only significant energy import into the region in 2013 was oil by the US. According to the latest projections by BP, IEA and EIA, by 2035 the region will not need to import even oil assuming the pattern of growth in exploitation of unconventional resources (tar sands and shale oil and gas, coal bed methane and tight gas) and reduced consumption of oil continues.33 In addition, Canada still has very significant untapped hydroelectric capacity and can further reduce its dependence on fossil fuels. Using their hydroelectric and CCGT resources as backup, both Canada and the US can continue to install utility scale wind and solar farms. Learning from the example of slow integration of wind farms in Texas
The FuTure oF Global enerGy SySTemS
18 The Future of Energy
due to limitations in the capacity and structure of the transmission grid, they are investing in modernising the grid to facilitate growth and integration of renewable generation.
All three countries have extensive experience with nuclear power. The US and Canada are leaders in its development. Over the last 35 years, however, since the accident at the Three Mile Island power plant, negative public opinion has stalled growth. If the need arises, they can, however, restart large-scale development of nuclear power plants on short notice. Meanwhile, the focus in the US is on research in the following areas:
vSmall modular reactors (SMR)34;vFourth-generation reactors that are economical,
proliferation resistant and have high fuel burn up rate with reduced waste production35; and
vLong-term management and disposition of spent fuel.
An important issue that SMRs are being designed to address is to reduce the high upfront capital cost due to the long construction time and changing regulations by standardising design and manufacturing. Also, capacity can be built up incrementally in sync with increase in demand. In short, SMRs are likely to be more acceptable in developed countries while large conventional reactors are favoured by developing countries with large unmet and growing demand.
The region has numerous options for meeting its energy needs from a resource perspective as well as for making very significant reductions in per-capita demand from gains in efficiency. Overall, one would characterise the US and Canada as post manufacturing economies. However, prospects of long-term low-cost energy are revitalising manufacturing. Otherwise, any growth in demand for energy will primarily come from the current rate of population growth of about one percent.36
Given its wealth of resources and many advanced technology options for energy systems, how
and when the US reduces its dependence on fossil fuels will depend on government policies and regulations driven by economics and public opinion. The public will have to increasingly weigh in on leading the world in mitigating climate change and environmental impacts of burning fossil fuels, for example, by providing the leadership needed for the revival of nuclear power industry and investment in renewables. Until the US and international policy imposes fair penalties on greenhouse gas emissions, the likely trend over the coming decades is increasing exploitation of unconventional oil and gas, increasing exports of coal and natural gas (LNG) from the region and shrinking imports of oil.
In the area of exploration and recovery of unconventional oil and gas, technology and experience are essential and US oil and gas companies currently stand as industry leaders. Thus, the US companies will continue to create and develop new opportunities for production, both domestic and international. Today, worldwide, national companies or governments control about 80 percent of conventional oil and gas reserves. Many of these assets have underperformed or have been damaged (reduced percentage of the resource is being recovered) due to poor management and/or inadequate investment in new technologies and analyses. One reason is that western multinational companies have been asked to leave prematurely before indigenous talent is fully trained. Today, many of these national companies are rebuilding relationships with American and European companies having realised the benefits of cooperation and the increasing need for state-of-the-art technology, especially for the exploitation of unconventional energy resources.
Looking ahead, significant investment is needed in the transmission grid, especially in order to integrate solar and wind generation. The electricity transmission networks of Canada and the US are integrated along the border, and the US will remain a net importer of electric energy, along

The FuTure oF Global enerGy SySTemS
19The Future of Energy
with oil and gas, from Canada.
Lastly, it is worth mentioning that Canada and Russia may see themselves as winners (or perhaps as the least-dramatic losers) in the climate-change game, because they are closest to the Arctic. Under warming scenarios, it will become easier to extract minerals and fossil fuels locked in the Arctic and, assuming soil quality is maintained, their agricultural sectors will become more important as crop zones move towards the poles. Lacking social pressure and possessing large resources, they may not have sufficient incentive to support international regulations on greenhouse gas emissions or trade in fossil fuels.
Russia Russia, rich in natural resources, plans to continue to exploit fossil fuels and remain a major supplier of fossil fuels and nuclear power reactors to the world. It holds the world’s largest reserves of conventional natural gas (about 50 trillion cubic meters), the second largest coal reserves (about 150 billion tons) and the eighth largest oil reserves (about 90 billion barrels).5 A very significant fraction of its export earnings (about 50 percent) have historically, and continue to, come from the export of all three fossil fuels. These exports constitute about 40-50 percent of the government revenue. Not surprisingly, there is no indication of introduction of policies to curb their use and export, especially since Japan and South Korea to its east, China to its south and Europe to its west have large unmet energy needs and can pay international prices for them. The major challenges being faced by Russia in enhancing supply include the geopolitics, modernisation of its existing assets (oil and gas fields and coal mines, oil and gas pipelines, and gas-and coal-fired heat and power plants) and the development of the technology to exploit unconventional oil and gas resources and off-shore fields in the Arctic.
Russian companies (both state and private) are undergoing modernisation and are creating global
alliances. These partnerships are exploring and developing new fields including offshore ones in the Arctic. Similarly, Russian President Vladimir Putin is campaigning to increase exports of natural gas to Western and Southern Europe (about 27 percent of EU gas currently comes from Russia) and new pipelines are being developed. In addition to the extensive gas pipeline infrastructure to Europe already developed during the Soviet era, the Blue Stream gas pipeline (16 bcm/a) to Turkey37 became operational in 2005 and the Nord Stream pipeline (55 bcm/a) to Germany38 in October 2012. Construction of the South Stream gas pipeline with design capacity of 63 bcm/a was started in December 201239 but was cancelled on December 1, 2014 by President Putin. Considering the uncertainty in growth in demand for gas if prices would stay high40, any justification for some of the recent capacity additions in Europe (pipelines, LNG terminals, CCGT power plants) may, however, lie in long-term strategic interests rather than as a response to growing demand. Unfortunately, the events of 2014 – economic sanctions and the plunge in oil prices – have put a question mark on the growth and modernisation of energy infrastructure that is dependent on international cooperation.
Russian strategic planning aims to significantly increase the use of nuclear power for co-generation of electricity and heat and for powering arctic ships. For example, it plans to increase the share of electricity produced by nuclear power from about 17 percent in 2012 to almost 50 percent by 2050.41 It is also marketing its nuclear reactors to ex-Soviet Eastern European and Central Asian countries, Iran, India, Turkey, Greece, Vietnam and China under highly favourable terms.42 Various issues need to be reassessed with more countries acquiring nuclear power, including: proliferation, safety, security and safeguards.
Some of the decisions that Russia will have to make in the future, from both economic perspective and that of mitigating climate change, are:

The FuTure oF Global enerGy SySTemS
20 The Future of Energy
vWhether to replace its aging coal-fired power plants with natural gas fired CCGT or reserve the natural gas for export;
vModernize its coal-fired power plants by manufacturing or importing supercritical coal-fired boilers and turbines;
vIncrease the share of nuclear power; andvDevelop the remaining 80 percent of its
hydropower potential, mostly in Siberia, and export excess power to China.
The efficiency and timeliness of these developments will most likely depend on whether its companies are controlled by the state or whether the government creates a favourable investment climate to encourage participation by international companies.
The situation in Russia and its relationship with the West changed dramatically in 2014 following its annexation of Crimea and military intervention in Ukraine. Isolation by Western countries and economic sanctions have replaced cooperation. The collapse of the price of oil has already impacted the economy significantly and the Rouble fell from about 25 to 60 per dollar in 2014. There are fears of very hard times ahead. It is, therefore, unlikely that Russia will have the resources to continue to modernise its energy infrastructure anytime soon.
Western Europe Europe, excluding Russia, will continue to depend on imports to meet its energy needs for both power generation and transportation. Barring Norway and Netherlands (and partially the UK), all European countries currently import almost all the oil and natural gas they consume. With their populations having stabilised and the history of the total oil consumed showing a rough plateau over the last 40 years, reflecting both improved efficiency in transportation sector and fuel substitution away from oil in power generation and heating sectors, the future burden of oil imports can be estimated to remain constant or,
if it decreases, only slightly.5 The share of natural gas, on the other hand, is expected to increase to a degree as gas turbines are being used to generate base load electric power and serve as backup to solar and wind.
Europe is geographically well situated to access natural gas reserves in Russia, Caspian Sea basin, North Africa and even Middle East via pipelines. To maintain a diversity of supply, it has also developed LNG ports and significant regasification capacity that would feed into the existing pipelines. Public support for natural gas is growing because it is cleaner and has a smaller end-use carbon footprint. The challenge being faced by individual countries is paying for imports of oil and gas if prices stay high. Two examples of the financial hardships imposed by mounting costs of energy imports are Spain and Italy: energy imports are highly significant contributors to their recent trade deficits. Overall, high prices of oil and gas during 2010-2014 contributed to the decline of oil and gas consumption in Europe.
The only large reserves of coal in Europe are in Germany (lignite) and Ukraine. So far Ukraine has not significantly exploited its reserves, as its consumption is modest. Germany’s coal consumption is about 50 percent lignite and it imports most of the remaining thermal (hard) coal it consumes. Other significant consumers such as Poland and the Czech Republic are self-sufficient. France, Italy, Spain and the UK import most of the coal they consume. From the climate perspective, the opportunity for countries that get a large fraction of electric power from coal-fired power plants is that they also have long experience with nuclear power (Germany, Ukraine, Czech Republic, Spain, the UK) and could, in principle, replace coal by nuclear. The growing public opinion in Western Europe, however, is to phase out both nuclear and coal and predominantly rely on natural gas and renewable resources. While natural gas presents an opportunity for fuel substitution leading to a smaller carbon footprint compared to coal-fired generation, it is more expensive and has to be
The FuTure oF Global enerGy SySTemS
21The Future of Energy
imported from some unstable areas. Currently, eliminating both nuclear and coal is posing economic challenges for many countries due to the high price of natural gas and low price of carbon allowances. For example, while phasing out nuclear power plants, Germany in the short-term is installing high-efficiency coal-fired units and a larger fraction of its electricity is coming from coal. Thus, it is not clear whether fuel-switch to gas and renewable technologies is realistic, economically and technically, to eliminate both nuclear and coal in the near-to-mid-term. On the other hand, recent legislative initiatives in Germany and at the European Union are aimed at putting the green energy turnaround back on track.
High-efficiency CCGTs are very efficient and effective for both base load power generation and as backup to solar and wind. To implement a fuel switch from nuclear and coal to natural gas, however, requires that each country export enough goods to pay for the gas in addition to what they are already paying for oil – irreplaceable for transportation. Spain is an example of a country that, today, could meet all its electricity needs from the recently installed high-efficiency CCGT power plants supplemented by renewable generation from hydro, wind and solar. The downside of switching to CCGT is that when one examines Spain’s trade balance, one finds that its growing deficit is almost totally accounted for by the cost of oil and gas it imports. This economic reality will most probably require it persist with either coal or nuclear or both for base load generation in the near-term unless the cost of gas comes down dramatically.
Germany is also increasing its coal and gas-fired generation capacity. Its first priority is to phase out nuclear by using existing excess coal and gas-fired capacity and increasing the share of renewables. So far, it exports enough goods to pay for the imported oil and natural gas to prevent accumulating a trade deficit. Nevertheless, the large differential in cost between coal and gas-fired generation has resulted in a larger use of
coal; some of the recently installed high-efficiency gas turbine capacity, for example at Irsching, is underutilised and operating as backup. These trends indicate that the new state-of-the-art coal plants coming on line will, in the near-term, replace most of the nuclear base load capacity as it is retired even though they have a larger environmental footprint compared to nuclear or even CCGT if market and/or legislative framework would remain unchanged.
France gets about 80 percent of its electric power from nuclear power plants. The combination of hydroelectric, CCGT, coal-fired and wind provide the rest and meet the peaking load. France is, however, driving forth an energy transition law that intends to reduce the fraction of nuclear to 50 percent by 2025 while increasing the share of renewable generation.43 It will be interesting to see the evolution of France’s policy on nuclear power, especially post-2030 when its current fleet of reactors would have turned 40–50 years old.23
Eastern Europe (without Russia) Soviet era power systems (coal and nuclear) still dominate the generation of electric power. EU mandates on emissions have resulted in the closing of old plants and installation of pollution control systems for sulphur and nitrogen oxides on the rest. Because of these mandates, the price of new build coal-fired plants has increased very significantly. In Eastern Europe, therefore, the large-scale development of coal-fired plants—which have lifetimes of over 40 years—will depend on foreign investments, carbon taxes and, once indigenous reserves run out, the long-term stability of coal imports, most likely from Kazakhstan and Russia. On the nuclear front, after an almost twenty-year hiatus, Ukraine, Belarus, Slovakia have new reactors under construction, and Poland, Romania and Bulgaria are in the advanced stages of planning.44
Most of the countries of Eastern Europe import

The FuTure oF Global enerGy SySTemS
22 The Future of Energy
the bulk of the oil and gas they consume. Installations of CCGT plants are increasing as a result of capital inflow from, and participation by, international power generating companies; they are, however, still dependent on Russia for the supply of natural gas. In fact, Russia maintains a strong economic hold on these countries by controlling their access to oil and natural gas (for example, the ongoing struggles with Ukraine on gas pricing and transit fees since 2005 and an increase of 80 percent in April 2014 due to the political tensions). Thus the technology selected for the power plants being installed since 2000 has depended strongly on the operating company and the financial institutions providing the capital, with Russian and Western-European companies competing for a market share.
Overall, there has been significant reduction in the carbon footprint since 1990 due to gains in efficiency, upgrade of Soviet era plants to modern technologies, fuel substitution and development of wind and solar farms.45 Demand has not increased significantly because of the economic crises and high cost of imported fuels since these countries are no longer subsidised by Russia but have to pay international prices for oil and gas. New fossil-fuel plants are mostly being built with international partnerships. Hydroelectric capacity in many countries is small so large-scale integration of wind or solar will require concomitant growth in CCGT. The good news is that the population in most countries in the region has stabilised (and in fact, decreasing), and any increase in greenhouse gas emissions in the near-term will be due to economic development which is highly welcome.
North Africa The five North African countries (Egypt, Libya, Tunisia, Algeria and Morocco) can power their development for the next 30 years through the use and sale of fossil fuels. Barring political instability, Libya and Algeria have sufficiently large reserves of oil and gas to meet growing domestic needs and export significant quantities. They are
currently exporting gas to Spain and Italy through the Maghreb-Europe (12 bcm/a), Medgaz (8 bcm/a), Trans-Mediterranean (30 bcm/a) and Greenstream (11 bcm/a) pipelines, and GALSI (10 bcm/a) being planned. Morocco and Tunisia are earning transit fees from the Maghreb-Europe and Trans-Mediterranean pipelines, respectively. These pipelines also provide a framework for access to gas supplies from Algeria by Morocco and Tunisia and, if necessary as needs grow, for new pipelines. Egypt, too, has significant production of natural gas. As a result it has mostly replaced its oil-fired power plants with CCGT and has developed the infrastructure to export natural gas to Israel (7 bcm/a capacity Arish-Ashkelon pipeline), to Jordan, Syria and Lebanon via the Arab gas pipeline (10.2 bcm/a), and to Europe as LNG. Rising domestic consumption, however, has led to oil imports and a decline in export of natural gas since 2009.46 Furthermore, repeated sabotage of pipelines has disrupted export of gas for long periods. Anticipated fuel shortages and trade deficits in the near-term could significantly worsen the ongoing political instability.
All five countries have large areas of cheap desert land with high solar insulation and excellent potential for both solar PV and CSP power plants that can be integrated with the CCGT and wind plants for providing high quality dispatchable power. Projects such as Desertec-Africa, albeit currently in limbo, are creating options for increasing capacity and training the human resource needed for sustainable development of CSPs.47
The key issues for future development in these countries and the transition to an increasing share of renewables in the energy portfolio and reduction of greenhouse gas emissions include the following:
vGovernance;vPopulation stabilisation;vInvestment in education; andvBroad-based economic growth.

The FuTure oF Global enerGy SySTemS
23The Future of Energy
The recent political and social upheavals, starting with the Arab Spring, have left behind lingering instabilities and restive populations. Throughout the region, there is pressing need for the development of infrastructure for manufacturing and service industries that would facilitate job creation and trade over and above that driven by the tourism and the oil and gas industry. The question following the social upheavals of 2011-2012 is whether stable political systems will emerge in the near-term and whether these countries will invest revenues from sale of oil and gas into relevant strategies like education and job creation.
Sub-Saharan AfricaMost of sub-Saharan Africa, excluding South Africa, has highly inadequate electric power generation capacity; the existing capacity consists mainly of hydro and diesel generators. Infrastructure development, in general, has been minimal due to lack of capital. Also, maintenance of many facilities and access to spare parts has been poor, resulting in power plants having short lives, underperforming or remaining under maintenance for extensive periods. Poor governance, civil wars and widespread corruption continue to stifle development throughout the continent. The primary need is stability and development.
Current consumption of oil and gas is very low. Only five countries have significant oil and/or gas reserves that are being exploited – Nigeria, Angola, Chad, Sudan and Mozambique – and oil exports constitute the majority of the government revenue in the first four countries. Nigeria also exports natural gas as LNG in the world market and via the West-Africa gas pipeline to Benin, Togo and Ghana48 that is used mainly for power generation. Mozambique exports most of the gas it produces to South Africa via the Sasol Petroleum International Gas Pipeline. New discoveries of large gas fields in Mozambique49 and Tanzania are being developed and LNG exports are expected to start rivaling those from
Qatar by 2020 and help reduce prices. Further discoveries in Uganda and Kenya and the creation of a regional gas distribution system could change the energy landscape in East Africa. At present, the dominant source of electricity for the rest of the countries is hydropower and most of the planned development is also hydro.
South Africa is the only country in sub-Saharan Africa with a significant economy and modern infrastructure. It imports about 70 percent of the oil and gas it consumes. Domestic oil production relies on coal to oil conversion by Sasol. It has large reserves of coal (about 30 billion tons with an R/P ratio of 116 years), which provide about 95 percent of the electricity generated. Along with Colombia, it is the fifth largest coal exporter (about 70 mt in 2013). Its exports are, however, unlikely to grow rapidly owing to domestic consumption, declining coal recovery grades, depleting mine reserves, increasing operating costs and a railway bottleneck to the export port of Richards Bay. It also faces water shortages in the coal belt (Mpumalanga province) that could limit its reliance on coal for power generation. Any significant shift away from coal-fired generation will, however, require exploitation of its shale gas resources or investment in nuclear power. While it has extensive experience operating two nuclear reactors that were commissioned at Koeberg in 1984, there are no new ones planned. Without strong economic incentives and international mandates, at present it has little motivation or social pressure to move away from its reliance on cheap coal for power generation and for conversion to liquid fuels.
Central Asia Of the countries of Central Asia (Uzbekistan, Tajikistan, Kyrgyzstan and those bordering the Caspian Sea), only Tajikistan and Kyrgyzstan are lacking in fossil fuels; they obtain most of their electric power from hydroelectric systems. Most of the other countries export commodities and could fuel their development through these sales and create a regional economy. The primary challenges

The FuTure oF Global enerGy SySTemS
24 The Future of Energy
for this region are governance, development and an educated workforce that can compete in the international market and grow a non-commodity-based economy to create jobs.
Competing for influence in this region are: China (pipelines and other infrastructure); Russia (thermal and hydro power plants) and the US (gas turbines and oil and gas exploration). China, with its large monetary reserves and energy needs, is helping build infrastructure in exchange for oil and gas. The development and operation of the Kazakhstan-China oil pipeline and the Central Asia-China gas pipeline (both became operational in 2009) have begun to connect the countries in this region in addition to exporting oil and gas to China. The Trans Adriatic Pipeline (TAP) from Shah Deniz gas fields in Azerbaijan would engage Europe and the TAPI gas pipeline from Turkmenistan, if built, would engage Pakistan and India.
TurkeyTurkey is strategically located at the crossroads between Europe and gas and oil-rich Russia, Central Asia and the Persian Gulf. It serves as an important transit country for both oil and gas.50 For domestic consumption, it gets natural gas from Russia via the Blue Stream gas pipeline; Caspian gas via the Bulgaria-Turkey Gas pipeline under construction; from Azerbaijan via the Baku-Tbilisi-Erzurum pipeline51; and from Iran via the Tabriz-Ankara Pipeline. (The latter two have recently been blown up repeatedly by Kurdish separatists). Against the backdrop of dropping the South Stream Pipeline project to Western Europe, Russia has recently reinforced the intention to enlarge its undersea pipeline connection to Turkey by an annual capacity of 63 bcm, more than four times Turkey’s annual purchases from Russia. The recent selection of the Trans-Adriatic Pipeline (TAP) by the Shah Deniz Consortium to connect with the Trans Anatolian Pipeline (TANAP) near the Turkish-Greek border at Kipoito and carry gas from the Shah Deniz II field in Azerbaijan via Turkey to Europe will open up a Southern Gas Corridor52.
In Turkey, gas is primarily used for power generation and industrial use. The importance of coal in electricity generation is also increasing and indigenous resources of lignite are already committed to supplying existing lignite-fired power plants. Over the last decade consumption of imported hard coal has grown and in 2013 it imported about 35 million tons, comparable to its consumption of indigenous lignite.
The eastern half of Turkey has large reservoir-based hydroelectric generation capacity (both installed and under construction and planning), which it can use to integrate significant generation from wind and solar. The challenge it faces, since its energy demand is projected to grow at 7-8 percent per year in the near-term (second only to China), is its ability to pay for importing oil, gas and coal if their prices stay high and if its economy continues to struggle. To reduce its dependence on growing imports of fossil-fuels, it views nuclear as a major part of its future power generation system and Russia is offering to finance and build its first four reactors.53
Middle East Most of the countries in the Middle East are rich in oil and natural gas and can power their development using revenues generated by exporting them. In the entire region, only Israel, Jordan, Lebanon and Palestine currently have significant imports. Their energy needs are, however, small compared to the export capacity of their Persian Gulf neighbours and can easily be met. In fact, there already exist oil and gas pipelines from Iraq, Saudi Arabia and Egypt to Syria that can be re-commissioned and/or upgraded to meet future demand. There also exist unused pipelines from Syria to supply Israel, Jordan, Lebanon and Palestine. The bottom line for sustained development in these four countries is not lack of easy access to energy but political stability, trade and good governance in the region.
The discoveries of gas fields in the Mediterranean
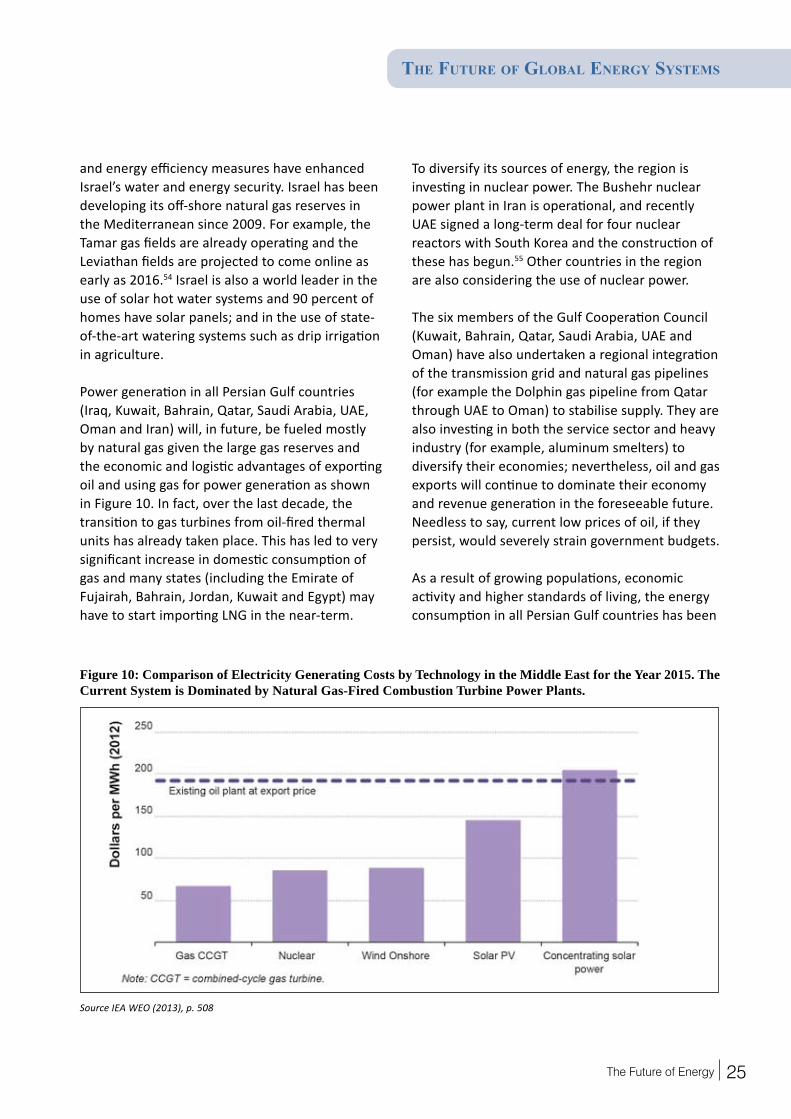
The FuTure oF Global enerGy SySTemS
25The Future of Energy
Source IEA WEO (2013), p. 508
Figure 10: Comparison of Electricity Generating Costs by Technology in the Middle East for the Year 2015. The Current System is Dominated by Natural Gas-Fired Combustion Turbine Power Plants.
and energy efficiency measures have enhanced Israel’s water and energy security. Israel has been developing its off-shore natural gas reserves in the Mediterranean since 2009. For example, the Tamar gas fields are already operating and the Leviathan fields are projected to come online as early as 2016.54 Israel is also a world leader in the use of solar hot water systems and 90 percent of homes have solar panels; and in the use of state-of-the-art watering systems such as drip irrigation in agriculture.
Power generation in all Persian Gulf countries (Iraq, Kuwait, Bahrain, Qatar, Saudi Arabia, UAE, Oman and Iran) will, in future, be fueled mostly by natural gas given the large gas reserves and the economic and logistic advantages of exporting oil and using gas for power generation as shown in Figure 10. In fact, over the last decade, the transition to gas turbines from oil-fired thermal units has already taken place. This has led to very significant increase in domestic consumption of gas and many states (including the Emirate of Fujairah, Bahrain, Jordan, Kuwait and Egypt) may have to start importing LNG in the near-term.
To diversify its sources of energy, the region is investing in nuclear power. The Bushehr nuclear power plant in Iran is operational, and recently UAE signed a long-term deal for four nuclear reactors with South Korea and the construction of these has begun.55 Other countries in the region are also considering the use of nuclear power.
The six members of the Gulf Cooperation Council (Kuwait, Bahrain, Qatar, Saudi Arabia, UAE and Oman) have also undertaken a regional integration of the transmission grid and natural gas pipelines (for example the Dolphin gas pipeline from Qatar through UAE to Oman) to stabilise supply. They are also investing in both the service sector and heavy industry (for example, aluminum smelters) to diversify their economies; nevertheless, oil and gas exports will continue to dominate their economy and revenue generation in the foreseeable future. Needless to say, current low prices of oil, if they persist, would severely strain government budgets.
As a result of growing populations, economic activity and higher standards of living, the energy consumption in all Persian Gulf countries has been

The FuTure oF Global enerGy SySTemS
26 The Future of Energy
growing rapidly. Since oil, gas and electric power are highly subsidised, the public has little incentive for improving efficiency in end use. As a result, indigenous consumption of oil and gas is growing and these countries have amongst the highest per capita emissions of greenhouse gases. With abundant cheap oil and gas, the biggest challenge these countries face is motivating, educating and training their national populations to create new business opportunities and developing the skilled workforce the private sector needs to diversify the economy beyond fossil fuels.
IndiaIndia continues to have a very large unmet need for electric power. Assuming a development goal of 0.5 kW/person (about 4000 kWh/person/year) and a projected population of over 1.5 billion by 2050, India will need about 6000 TWh of electric energy to attain – and sustain – the status of a developed nation. This is six times India’s 2012 electricity generation. For comparison, these target figures translate into an energy-per-person goal that is about half of what a person in Germany consumed in 2013. Also, China’s consumption of electricity in 2012 was about 4000 TWh for a population of 1.35 billion. As will be discussed below, attaining 6000 TWh/year is unlikely based on India’s history of development of energy systems, availability of capital for investment and current reserves of fossil fuels. The likely scenarios are: either the desired goal of 0.5 kW/person will need to be more than halved or 400-500 GW of nuclear capacity will need to be installed. A detailed discussion of India’s energy scenario, constraints and opportunities is given in in the publicatin Gupta et. al (2010).56
India’s population (1.25 billion in 2013) is still growing at about 1.5 percent p.a., i.e. by about 18 million people per year, and almost all the growth is amongst the poor. Around 2026, at 1.45 billion people, it is projected to overtake China’s population and continue growing until about 2050 to about 1.7 billion (Figure 11).
Also, India is just starting its phase of rapid urbanisation: in 2013, 30 percent of the population lived in urban areas. Its energy needs will, therefore, continue to grow all the way until 2050. Considering its size and population, India has limited reserves of fossil fuels to meet this demand, with coal being the most abundant (about 60 billion tons)5. This reserve can produce about 100,000 TWh of electric energy based on a conversion efficiency of 40 percent and a caloric value of approximately 3500 Kcal/kg (= 4 kWhthermal/kg = 1.6 kWhelectric/kg). This is the amount of energy that 400 GW of super-critical coal-fired capacity can produce in 30 years, i.e., an annual production of about 3200 TWh. In 2013, 150 GW of coal-fired captive and grid connected plants generated only about 700 TWh due to the low conversion efficiency of the older sub-critical units. To reach the 3200 TWh/year mark by 2025, India will have to build over 300 GW of supercritical units (to achieve 40 percent efficiency), increase investment in coal mining and transport infrastructure to provide one gigaton/year of indigenous coal for plants near the mines and in the interior of the country, import about 500 million tons/year for coastal plants, and develop in situ gasification technology as easy-to-access coal seams close to the surface (0-300 meters) get exhausted. This expansion is non-trivial and India will face increasing international pressure to reduce carbon emissions and domestic social resistance due to pollution, water rights and land acquisitions. If this mark is achieved, it will provide a window of opportunity of 3200 TWh/year until about 2050 when conventional and unconventional coal reserves will start becoming very expensive to mine.
The consumption of oil has been increasing at roughly 120,000 bbl/day each year since 1994, much faster than the total growth in domestic production of about 200,000 bbl/day over the same 19-year period from 1994 to 2013. Of the total oil consumption of about 3.7 Mbbl/day in 2013, imports constituted about 2.8 Mbbl/day and the demand is projected to continue growing:

The FuTure oF Global enerGy SySTemS
27The Future of Energy
Source: http://www.bbc.news.com
Figure 11: The historic and Projected Growth of Population in the Two most Populous Nations, China, and India. India is Projected to Overtake China’s Population by around 2026 at about 1.45 billion and Continue Growing until about 2050 to about 1.7 billion. The Bottom Figure Compares urbanisation in the Two Countries with India just Starting its Phase of Rapid Urbanisation.
for example, in the individual transport sector alone, approximately 2 million new cars (18 million total vehicles including commercial and 2 and 3 wheelers) were sold in 2012 and 2013.57
To keep up with the increase in demand for oil and electricity, the fraction of imported coal, gas and crude oil has also been increasing. In 2013, these fractions were about 30 percent, 34 percent and

The FuTure oF Global enerGy SySTemS
28 The Future of Energy
Source: BP Statistical data workbook 2014. Compiled by authors.
Figure 12: A Comparison of the Production (solid lines) and Consumption (dashed lines) of Coal, Oil and Gas by India and China. Note that the y-scale is larger by a Factor of 2 for China and that India has to Rely on Imports of all Three Fuels at a much Earlier Stage in its Development.
76 percent, respectively as shown in Figure 12.58 It is important to note that India is importing significant quantities of all three fuels at a much earlier stage in its development than China. As stated above, to support 300+ GW of coal-fired capacity beyond 2025, India’s coal imports would increase to over 50 percent of the consumption, i.e., about a billion tonnes per year. At this rate of growth in demand for coal, gas and oil, will India be able to continue to afford to import all the fossil fuels it needs? High prices of imported oil, gas and coal are already leading to an increasing annual trade deficit that has become a major national concern. Unless India’s manufacturing capacity, services and exports keep pace with the cost of importing fossil fuels, growing trade deficits may start to limit the capacity to import them and curtail overall development.
India’s industrial competitiveness is handicapped by, among many reasons, severe shortages in electric power supply and rolling blackouts due to inadequate generating capacity, aging grid and disruptions in supply of coal and gas to power producers. Also, utility companies that have gone
bankrupt prefer to cut off supply rather than buy power on the spot market that they then have to sell at a lower rate. The majority of 88.5 GW of capacity addition under construction and with anticipated completion date during India’s Twelfth Five-Year Plan, 2012-2017, is thermal (72.3 GW), Hydro (10.9 GW) and nuclear (3.9 GW).59 Most of the thermal addition is coal-fired, which requires the synchronised development of associated infrastructure (coal-ports, mines, railways, roads and transmission lines). Past experience shows, especially in the last decade, that growth in the needed associated infrastructure has not kept pace. Moreover, growth is likely to be limited by the growing social opposition to coal-fired power plants as a result of displacement of people due to land acquisition, dwindling water resources and growing pollution.
India’s hydroelectric and on-shore wind resources are also limited. Current estimates are about 120 GW of economically feasible hydroelectric potential (40 GW has been developed and is operating) and 102 GW of on-shore wind (about 20 GW is operating).60 The historic trend is that India has

The FuTure oF Global enerGy SySTemS
29The Future of Energy
been adding about 1 GW of hydro and about 2 GW of wind turbine capacity each year. Even when the current economically feasible potential has been fully developed, these hydro and wind resources would produce, per year, only about 440 and 200 TWh of electric energy, respectively. This, eventual, 200 TWh of wind generated energy could be integrated with reservoir based hydro and existing (plus anticipated) CCGT capacity to provide about 1000 TWh of dispatchable supply. Such integration will, however, require a highly instrumented and automated grid (smart grid) and unprecedented coordination between the producers, transmission and distribution companies and state and central governments.
The only known abundant sources of energy in India are solar and thorium. Today, most of the recently installed 2-GW solar capacity is the result of incentives and tax credits as part of the Jawaharlal Nehru National Solar Mission.61 Since utility scale plants have been operating starting only in 2011 as part of this initiative, it is not yet clear how much solar generation will be realised in the coming decades. But it is unlikely to be more than 100 TWh by 2050, a very optimistic number in fact, as it is more than fifty times the 2013 generation. Nevertheless the ministry of new and renewable energy (MNRE) recently announced big-ticket projects and set huge targets for solar power capacity additions, i.e. solar power in India is intended to see a massive scale-up of 100 GW by 2019.
Progress in the development of nuclear power has been slow; only 5.3 GW of nuclear capacity existed at the end of 2014 and six reactors with a total net capacity of 3.9 GW were under construction.62 Historically, international sanctions and shortage of indigenous uranium mining capacity limited growth. The US-India civilian nuclear deal63 has created a highly positive impact on India’s nuclear landscape by allowing it to buy reactors and fuel from the Nuclear Suppliers Group. For example, in an agreement signed in December 2014, Russia agreed to help India build at least 10 new reactors
over the next twenty years. Looking ahead, mixed oxide (uranium and plutonium oxides) and thorium-based breeder reactors – that are an essential part of India’s three stage nuclear plans64 – are still in the development phase. Given the investment cost, social opposition and history of very slow growth, it is unlikely that even 100 GW of nuclear power will be in operation by 2050.
To summarise, even a highly optimistic exploitation of coal, gas, hydroelectric and on-shore wind resources will provide about 4000 TWh/year, much less than the 6000 TWh development goal. Unless India can pay for importing huge quantities of additional coal and gas, its only option for achieving 0.5 kW/person is 400-500 GW of nuclear power. Various analyses, such as the one presented here, led India’s planners to promote, as early as the 1950s when the three stage nuclear plan was first proposed, the need for 500 GW of nuclear power as the only viable option. If India were to build 500 GW of nuclear capacity, it would need to address issues of quality, safety and security at all levels of the construction and operations chain at an unprecedented scale.
A workforce of over 20,000 people, steeped in a culture of safety and security, would be required to operate and maintain just these reactors; a nuclear capacity larger than the cumulative global capacity to date. Recruiting, training and maintaining such a workforce represents a challenge that is at least as daunting as the very building of these nuclear power plants. If, instead, India is to cover the shortfall using coal-fired generation, then it needs to import coal and develop CCS at an equally large scale to mitigate growth in emissions of greenhouse gases in a carbon-constrained world.
In an optimistic, business-as-usual scenario, short of technology miracles, India would achieve only about 0.25 kW/per person by 2050. Since this resource would not be equitably distributed, a large fraction of India’s population would remain under-developed.

The FuTure oF Global enerGy SySTemS
30 The Future of Energy
A detailed discussion of the opportunities for development and energy trade between countries of South Asia is given in the publication Options for Development and Meeting Electric Power Demand in South Asia.65 That analysis shows two things:vIn order to achieve development, India,
Bangladesh, Sri Lanka and Pakistan need to import fossil fuels in the short term. Nepal, Bhutan and Myanmar, meanwhile, can develop using indigenous hydroelectric resources; and
vPakistan can benefit economically by facilitating the transmission of natural gas from Iran and/or Turkmenistan to India via pipelines.
vIt is in India’s long-term interests to foster such cooperation as it would reduce tensions in the region and allow all five countries (including Afghanistan) to focus on trade and development.
ChinaChina’s economic growth since 2000 has been unprecedented; so has its use of fossil fuels. Its consumption of energy and its carbon-footprint doubled between 1990-2000 and have more than doubled again between 2000-2011 (Figure 12). During the period 2004-2011, China installed over 100 GW of new electricity generation capacity each year, most of it super-critical coal-fired. China paid for this growth by becoming the manufacturing centre of the world and creating an export driven economy, which by 2014 had generated about $-4 trillion in reserves in foreign exchange and gold. It has the largest installed capacity of coal-fired (over 700 GW), hydroelectric (about 250 GW) and wind turbine power plants (about 90 GW). It had 23 operating nuclear reactors and 26 are under construction. It continues to install more capacity of each technology with little evidence of a slowing down in the investment into, and growth of, its generation and transmission infrastructure. It has also become the largest manufacturer of thermal, hydro, solar PV and wind energy generation systems. So far this manufacturing capacity has
mostly been used to satisfy the domestic market.
China’s 2013 population of 1.36 billion is projected to peak around 2026 at about 1.45 billion; thereafter it is expected to decrease steadily. The Chinese government can therefore now start to concentrate on issues of economic development and equitable distribution of resources similar to those faced by other developed countries.
To maintain the overall growth of its economy and provide higher paying and better jobs to a larger population, which the current political leadership deems necessary to preserve the one-party system, China needs to continue economic growth at a high rate (about 10 percent) over the next two decades. This growth in manufacturing and infrastructure and job creation requires that it ensure a guaranteed long-term supply of all the raw materials it needs, including coal, oil and natural gas.
In mid 2014 China and Russia have sealed a $-400 bn gas deal for the supply of up to 38 bcm/a for 30 years, beginning in 2018. China is in a highly strategic geographical position to access the oil and gas reserves in Russia, Central Asia and even the Middle East through pipelines. The Kazakhstan-China oil pipeline has been operational since 2009, as has been the Central Asia-China gas pipeline (40 bcm/a, planned increase to 55 bcm/a by 2015) that brings gas from Turkmenistan and Kazakhstan. Most of its coal imports are by sea from Indonesia, Australia and recently from North America. To ensure long-term supply it has developed bilateral relations with exporting countries all over the world, is acquiring shares in mines, pipelines and ports, and is investing in all aspects of the infrastructure required for extracting the needed commodities and transporting them to China.
China has about 115 billion tons of coal reserves that can fuel the existing more than 700 GW of coal-fired plants for about 30 years. To supplement coal-fired generation, China is pursuing both

The FuTure oF Global enerGy SySTemS
31The Future of Energy
nuclear power and CCGT as the next phase of large-scale development. In December 2014, there were 23 operating reactors (the first nuclear reactor was commissioned in 1991), 26 under construction and many more under planning.66 In the near-term its development of nuclear capacity will be based on the almost fully indigenised manufacturing chain for the Chinese version of the Westinghouse AP1000 (CAP-1000) and Framatome M310 derived (ACPR-1000) reactors. It has installed and is also gaining experience and expertise with most other designs (for example EPR, VVER, Candu) and commercial fast breeder reactors starting with the Russian BN-800 technology.67
China surpassed the US as the largest car market in 2009; about 20 million new vehicles were sold in the country in 2012.68 It is the second largest consumer and importer of crude oil after the US and is projected to overtake the US in 2027 (and Russia in natural gas consumption in 2025).69 Over the last two decades China has demonstrated that, as long as its economy keeps growing, it will buy the fuels and other commodities it needs.
China has one of the world’s largest reserves of shale gas and oil and is starting on their development. Shale gas, combined with imported LNG, indigenous conventional and tight gas production and gas from Turkmenistan and Kazakhstan, etc., via pipelines, will facilitate a large increase in CCGT capacity and industrial use of natural gas. However, in spite of the growth in nuclear, hydroelectric and CCGT capacity, the bottom line is that, at least, over the next couple of decades the utilisation of coal-fired plants, which currently contribute 78 percent of the total electricity generated, will not diminish significantly because of easy availability of coal, lower cost and growing demand for electric power. With growing use of coal, oil and natural gas (see Figure 2), its carbon footprint is expected to continue to grow for at least the next two decades as shown in Figure 1.
Asian TigersJapan, Korea, Taiwan and Singapore have essentially no fossil fuels reserves and need to import all the coal, gas and oil they consume. They also do not have adequate hydroelectric or on-shore wind potential to meet a significant fraction of their needs, leaving solar, off-shore wind and nuclear as their main non-fossil options. Following the 2011 Fukushima incident, the future of nuclear power in Japan and Taiwan has become uncertain whereas South Korea plans to increase the share of electricity generated by nuclear power from the current 33 percent to 59 percent by 2030.70 Fossil-fuel based generation (coal and gas) will have to provide most of the rest in the near to mid-term.
Natural-gas-fired CCGT power plants are the main source of electric power in Singapore and have mostly replaced oil-fired plants for base load. Singapore will continue to depend on imported fossil fuels for its energy needs unless it transitions to nuclear power.
Southeast AsiaSoutheast Asia, along with China and India, is now the centre of growth of energy systems. This region has significant reserves of oil, gas and coal; in 2013 it was a net exporter of all three. Energy resources are also sufficiently well-distributed while development is highly variable and no single country (other than Singapore and the Philippines) has significant net fuel import costs.71 Domestic energy resources have allowed Indonesia, Malaysia, Thailand and Vietnam to grow economically and create a strong manufacturing economy that provides sufficient revenue to pay for the needed imports and to withstand fluctuations in the prices of fossil fuels. With continued economic development and growing demand for energy, this situation is, however, expected to change resulting in imports starting with oil, especially as domestic reserves are exhausted.
The authors expect a major shift in Indonesia’s coal exports in the near-term. Over the last

The FuTure oF Global enerGy SySTemS
32 The Future of Energy
decade the country expanded its coal production by 375 percent to become the largest exporter of thermal coal by 2005. Unless new reserves are discovered and developed, the current volume of export is not sustainable because the reserve-to-production ratio is low and domestic consumption continues to grow as more coal-fired power plants are being built. Its gas exports are also shrinking and it may become a net importer in the medium-term.
Australia Australia has large reserves of coal, oil, and conventional and unconventional gas (coal bed methane and shale gas). Its coal and LNG exports are growing and the revenues they bring more than compensate for the cost of oil imports. In the near- and mid-term, planned investment in gas exploration and production indicate it will continue to be a major exporter of coal and LNG.72 The volume and price will depend on how the global market responds to the 2014 plunge in crude oil and Asian LNG prices.
Historically, over 75 percent of its electricity has been generated by coal-fired power plants. With the discovery and growing exploitation of gas reserves there has been significant growth in gas-fired CCGT that are primarily being used for peak load. These gas-fired facilities are also enabling the growth of wind capacity; however, due to a growing demand for electricity, there has been no decrease in Australia’s coal-fired generation or its carbon footprint.
A major game changer, that will significantly reduce Australia’s carbon footprint, will be the switch from coal to natural gas for base load power generation. This will require overcoming the coal mining and coal-fired power plant lobby and require the construction of gas pipelines connecting gas production sites in the North-West Shelf and the Surat and Bowen basins in Queensland with economic activity centres (and power plants) in the South-East of the country.
Countries/Regions that will remain dependent on imports for meeting their energy needsHaving surveyed the use of fossil fuels and evolving trends in different regions of the world, it becomes clear that regions that will remain dependent on importing the majority of the primary energy they use, in particular fossil fuels, are the Asian Tigers (Japan, Korea, Taiwan, Singapore), South Asia, Europe and increasingly China. These regions fall roughly into three groups: the Asian Tigers, Western Europe and China have highly trained labour pools and a large export-oriented manufacturing capability and capacity with established global markets and revenue generation chain to pay for the fuel imports. Their populations and energy use are not growing in size (except China’s until about 2026); therefore they can better plan technology diversification and fuel substitution and move towards a stable sustainable supply that is increasingly carbon-neutral.
Forming the second group are four countries in South Asia (India, Pakistan, Bangladesh and Sri Lanka). They have large growing populations, the majority of which have yet to be empowered. These countries face social unrest, violence and civil wars, and there is a chronic shortage of resources and infrastructure. Their development continues to be hampered by poor governance and lack of capital and infrastructure, so their first priority has to be economic development using the cheapest, most readily available fuels. They need international assistance not just in installing a modern sustainable energy infrastructure but also in education, health care and job creation.
Only India has a significant manufacturing capacity and a sufficiently large technically trained population that is highly integrated globally. On the other hand, political, social, demographic and economic challenges cloud the horizon and it remains uncertain whether even India will be able to overcome poverty and provide 21st-century opportunities to the majority of its population
The FuTure oF Global enerGy SySTemS
33The Future of Energy
by 2050. It needs to enhance its manufacturing and service industry to generate more jobs and revenue and decrease the trade deficit that has grown significantly in the last four years due to high oil and gas prices. The fall in oil prices in 2014 will help provide very welcome relief, especially if they stabilise at below $60/barrel for a long period.
A third group consists of the energy deprived sub-Saharan African countries that have large and growing populations and continue to rely on grossly inadequate hydroelectric systems. Without assistance they will have to wait until they can develop large enough economies (over and beyond the sale of commodities) to pay for the infrastructure and fossil fuels or develop strategically placed renewable systems. Since 2000, China has been investing significantly in these countries to build infrastructure with a long-term view of building favourable relations to exploit reserves of commodities it needs and to create a market for its goods and services. According to BP Energy Outlook 2035: “Africa will experience the world’s fastest regional energy demand growth – driven by urbanisation, rising populations and strong GDP growth. Africa will remain a significant exporter of oil and gas.”73
Overall, the authors conclude that in both South Asia and Sub-Saharan countries poor governance and the possibility of conflict will continue to deter and undermine investment in development. Also, considering their long road to development and the many threats faced by them, it is not clear whether the much-needed access to energy will be secure or sustainable over the period up to 2050.
Having reviewed most regions of the world, the authors next summarise the situation and discuss some key societal changes and technological innovations that will significantly change the existing energy portfolio/landscape and reduce the emission of greenhouse gases.
Examples of Technology Breakthroughs that would Change the Energy and Emissions Landscape
The current analysis has so far viewed the global system as continuing to be dominated by fossil-fuels and evolving incrementally. The significant features and evolutionary changes worth summarising are the following: vFossil oil will remain essential in the
transportation and petrochemical industry. vCountries are maintaining a diverse portfolio
of coal and gas-based generation and tuning the relative usage of each depending on the relative cost of fuel. According to a 2010 study by EIA, almost 76 percent of the proposed coal-fired capacity addition was by China and India.74 While these two countries will be the primary determinants of long-term coal use, it is unlikely that coal usage in other countries not rich in natural gas or hydropower will reduce substantially unless there is fuel substitution to nuclear power or a storage solution to overcome the intermittency in solar and wind power is found.
vWind turbines are becoming a mature technology and wind energy is being successfully integrated into the grid at grid-parity in many countries that can use hydro and gas turbines as backup. Also, experience with offshore installations is growing.
vCost of Tier I solar PV panels continues to drop (about $0.60/Watt in 2014) and both utility scale and residential installations continue to grow.
vGrowth of nuclear power remains slow with three countries – China, India and Russia – accounting for the majority of the reactors under construction. A number of countries such as UAE, Turkey and Vietnam are starting investment in nuclear power raising new concerns regarding safety, security and proliferation.
vAnnual primary energy consumption and carbon emissions are projected to continue to grow at

The FuTure oF Global enerGy SySTemS
34 The Future of Energy
about 1.8 percent and 1.4 percent, respectively until 2025.5
vCarbon intensity is projected to decrease by about 0.3 percent between 2012 and 2035 and there remains very significant scope for improvements in energy efficiency globally.5
To accelerate the transition to low-carbon systems, breakthroughs in storage technology are essential for large-scale integration of wind and solar, i.e., to contribute more than 20-30 percent of total annual generation of electricity. Backup systems need to have fast ramp rates that match the timescale of the fluctuations. The best large-scale, low-carbon option for utility scale energy storage in the near- and medium-term is reservoir-based or pumped storage hydroelectric systems. The next best option, including the need to minimise greenhouse gas emissions, is gas turbines. Countries are, therefore, investing in increasing their pumped storage capacity and turbine manufacturers are developing combustion turbines with fast ramp rates and improving their durability under frequent (daily) cold starts.
Progress in the development and deployment of a number of potential game-changing technologies has been slow in spite of considerable investment and many ideas. These include batteries for cars and carbon capture and storage (CCS).75 A factor of 3-5 in battery performance that is a combination of cost, energy density (kWh/kg), power density, safety and lifetime would accelerate the growth of electric vehicles from the current boutique industry.76 The Tesla Roadster runs on a 53 kWh Lithium-ion battery (117 Wh/kg) with a range of 393 kilometres (244 miles) but costs over $100,000, most of which is the cost of the battery pack.77 The new BMW i3 car has an 18.8 KWh Lithium-ion battery with a range of 130-160 kilometres.78 A range extender model (240-300 km) is also available. It has a small 647 cc two-cylinder gasoline engine with a 9-litre fuel tank that acts as an electricity generator. The list prices for these cars start at $42,000- $46,000 respectively. The Chevrolet Volt, a plug-in hybrid
with a 16.5 kWh lithium-ion battery pack and an electric only range of 61 km (38 miles), lists starting at $39 k.79 With these and the many other hybrids such as Toyota Prius, Nissan Leaf, and Ford Fusion, mass-produced affordable hybrids and electric vehicles are getting closer to reality. 80 Needless to say, the payoffs of an affordable battery are so large that venture capital is supporting many start-ups with a whole range of technologies but the technological challenges remain equally large.81
Cost-effective carbon capture from large point sources (power plants, industry and petrochemical units) followed by permanent storage would extend the use of coal and gas-fired power plants in a carbon-constrained world. The scale of CCS required from just the power generation sector to stabilise CO2 concentrations in the atmosphere is enormous – about 15 gigatons of CO2 per year, whereas most demonstration projects sequester on the order of a million tons a year.
Areas of research include more cost-effective methods for separation of CO2 from pre and post-combustion gases and characterisation of storage reservoirs (capacity, risks of subterranean migration of stored CO2 and possible leakage back into the atmosphere). In addition, countries will need to build the pipeline infrastructure from power plants to storage sites that might be located thousands of miles away. Since CCS would add significant cost to the electricity generated, there has been little incentive for large-scale deployment in the absence of a price on carbon. Most projects have not progressed beyond the demonstration stage. The handful of plants that have operated for over five years sequestered a total of about 5 mtpa. The 2013 WEO by the IEA has made a projection that only one percent of global fossil-fuel fired power plants will be equipped with CCS by 2035.3
Prospects for conventional bio-fuels (ethanol from corn and sugarcane and bio-diesel) to exceed 2 Mbbl/day remain low. The promise for

The FuTure oF Global enerGy SySTemS
35The Future of Energy
future growth lies in cost-effective production of cellulosic ethanol82 and algal oil.83 If the world is successful in reducing their cost to make them competitive with fossil oil, industrial-scale production of cellulosic ethanol could begin by 2020 while that of algal oil is expected only around 2030. We contend that even when bio-fuels are price competitive, their production will face increasing public scrutiny regarding lifetime environmental impacts, water needs and competition with food supplies that may limit their growth.
There has been much speculation about a hydrogen economy. Today, most of the hydrogen produced is by steam reformatting of hydrocarbons. Such hydrogen, if used to replace gasoline, would have emitted more CO2 than the gasoline it would replace. Hydrogen from hydrocarbons is a more costly source of energy and of no help in reducing greenhouse gas emissions unless production from hydrocarbons is combined with carbon capture and sequestration.84 Alternately, production via electrolysis is expensive. Large-scale application would require:
vThe electricity used for electrolysis be generated using low-carbon options of which wind is considered the most cost-effective; and
vDevelopment of durable electrodes that have low over-potential for efficiency and are not made of rare metals such as platinum or palladium. The most seductive possibility, still in the early stages of research, is photocatalytic splitting of water to produce hydrogen or hydrocarbons, i.e., mimicking the process of photosynthesis carried out by plants.85
Lastly, based on current trends, it is unlikely that wave, tidal, geothermal and bio-mass fired power plant capacity will scale to the terawatt scale by 2050. These will continue to present a very important but a local and limited opportunity.
Converging interests: Energy Security and Climate Change MitigationThe countries for which energy security and climate change mitigation are synergistic goals are the countries without significant fossil fuel resources. Transitioning to nuclear, hydro, wind and solar power systems addresses both issues simultaneously. The questions on how the energy portfolio of any given country will evolve towards renewable generation are the following:vAbility to pay for the capital costs of building
these power plants;vSimultaneous development of supporting/
enabling infrastructure (for example, the transmission grid, pipelines, ports, etc.);
vThe human resource needed to operate and maintain these systems;
vExperience with operating nuclear reactors and a culture of safety and security to minimise risk of accidents to acceptable levels;
vLow-carbon backup systems to provide all the power needed that cannot be met with the sum total of nuclear, hydro and renewable generation. As discussed above, these countries form five regions: The Asian Tigers, China, South Asia, Europe and Sub-Saharan Africa excluding South Africa. Of these, Sub-Saharan countries are still too poor to make large investments in innovation, power infrastructure and subsequent fuel costs. As a result, they rely mostly on renewable sources of energy and foreign investments. It remains to be seen if the other four regions and the US continue to drive innovation and develop credible options, bring down the cost of renewable systems, become role models and influence the transition globally. Because countries in these regions will dominate imports and use of fossil fuels, they will drive the future evolution of supply and demand. Volatility of prices and constraints on supply will depend on how they manage their energy and development needs. Some of the other important variables that will influence their access to fossil fuels are political stability, environmental concerns and public opinion in exporting countries.
The FuTure oF Global enerGy SySTemS
36 The Future of Energy
Resource Curse?In four regions of the world, government revenues and the national economies are dominated by the sale of commodities. These are the Persian Gulf and Central Asian countries, Russia and Africa. Of these, only Russia has a long tradition of higher education and of innovation in science and technology; so far, however, its political system has inhibited the diversification of the economy from large state-controlled enterprises. The Persian Gulf countries are closed hereditary oligarchies. Exports of oil and gas sustain their economies and the government subsidises most of the services, including those in the energy sector. Work is predominately carried out by foreign guest workers. The majority of their nationals lack the education and technical skills the private sector needs for a diversification of the economy. There is now growing realisation that to diversify their economy and provide employment to their restive populations, they need to train indigenous talent. Qatar and Saudi Arabia, for example, have taken the lead by establishing world-class universities and are creating the infrastructure needed to advance economic and human resource development. Qatar and UAE have developed a strong banking and financial sector that serves the region. In spite of these developments, the employment rate amongst the youth remains low. Political and social instabilities are their biggest threats.
The development of a highly educated and trained workforce is essential for innovation and performance in technological societies. Planning, policy and execution depend not just on an elite at the top of the pyramid but require competency and shared responsibility at every level. Without good project management, the likelihood of poor execution increases, as do overruns and delays. Thus, any country not investing in the development of its human resource is handicapping itself for generations to come. For countries that can generate a significant fraction of their revenues by the sale of commodities, it is inexcusable to not invest in human capital and
promote a diverse portfolio of economic activity. The fact that most countries rich in resources are failing to do so is a tragedy: it is referred to as `the resource curse’.
The Central Asian and African countries are the most glaring and painful examples. They have low standards of health and education and the majority of their populations are poor. They have a unique opportunity to use revenues from export of commodities to implement broad-based development. Despotic governments, however, continue to impede development; as do violence and civil wars. Corruption is very high and a small sector of the society dominates economic activity. The rest of the world is unlikely, unable and not sufficiently motivated to help change the status quo. As a result, transition to a more educated and equitable society continues to be slow.
Growing Public Concerns and Social ActivismThe public is slowly beginning to realise that there is no free lunch with respect to energy and climate security. All energy sources have their advantages, disadvantages and limitations. For example, electricity from coal-fired power plants is inexpensive but the environmental and greenhouse gas footprint is large whereas solar PV is clean but intermittent and expensive. The public is also becoming increasingly aware of the need to assess relative lifecycle costs, environmental and climate impacts, air and water pollution and their health impacts, water scarcity, nuclear accidents and leakage of radiation; displacement of people from ancestral lands for mines, roads, railroads, water reservoirs and power plants, truck traffic for hydrofracturing operations and the infrastructure for electricity transmission and oil and gas pipelines. New projects face growing public scrutiny and any realistic or perceived environmental impact often invokes severe opposition. In China, India and many other industrialising countries, the air quality in major cities has degraded to far below limits specified

The FuTure oF Global enerGy SySTemS
37The Future of Energy
by WHO primarily due to emissions from coal-fired power plants and vehicles. The public is demanding action. Continued lack of oversight and adequate regulations has eroded public trust in the utility companies and the government. The growing social activism requires that planners make serious and transparent efforts to eliminate or minimise environmental impacts and risks of accidents and take into account public opinion to prevent the development of a hostile environment that can cause cancellations or long delays in the construction of projects.
Conclusions
The economic future of all countries that do not have adequate indigenous supplies of energy for power and transport will depend heavily on whether they can pay for imports of fuels and for the infrastructure needed to exploit indigenous resources and build the distribution system. To prevent large trade deficits resulting from fuel imports, it is imperative they examine what goods they can manufacture and export, and what services they can provide in the international arena to earn enough foreign exchange to pay for imports.
Fossil-fuel-based systems will not just go away. Fossil fuels are easy to use, readily available and dominate the current global energy system. They are relatively inexpensive as long as externalities such as environmental impacts and climate change are not factored in. Their disadvantages are that their extraction, refinement and combustion are the major sources of greenhouse gas emissions and they have large environmental impacts. The transition away from fossil fuels, especially in developing countries, will need cost-effective options that scale and provide a reliable roadmap to development similar to what fossil fuels have provided over the last hundred years.
Countries will continue to use their indigenous fossil-fuel resources (or import the fuels) to maintain energy security as long as necessary
while making the transition to renewable sources. Even in a carbon-constrained world their highest priority will be development.
The two regions of the world that lack sufficient indigenous energy resources and infrastructure for development – and have large and growing populations, political instability and widespread poverty – are sub-Saharan Africa and South Asia. Climate change, environmental degradation, water shortages and volatility in fuel prices could have severe impacts. In a recent analysis of 17 countries, the Earth Security Initiative found that Tanzania, Nigeria and India face multiple risks with respect to land, population, fiscal, energy, water, food, crops and climate.86 That study illustrates a worrisome possibility that the combined effects of the many challenges these countries face could create a so-called “perfect storm” that stalls, or even worse, reverses development in many regions.
The major advantages of renewable generation systems (such as hydro, wind, solar and geothermal) are the very small fuel costs and low emissions over the lifetime of the plant. The disadvantages are: hydro generation is seasonal; solar and wind generation is intermittent and has fluctuations at the scale of minutes; and geothermal is small in capacity and has a significant environmental footprint. They all require backup systems that need to be large enough to meet the entire demand when these intermittent resources are not available. The backup systems also need to have fast response times and their control systems need to be flexible and sophisticated enough to compensate for large fluctuations in wind and solar generation. This requires a well-instrumented grid and the system operated and maintained by a highly trained workforce.
There will continue to be developments in technology that will improve the ways in which we produce useful fuels and electricity but no fundamental transformations in the energy systems are anticipated over the next 20 years

The FuTure oF Global enerGy SySTemS
38 The Future of Energy
(near and mid-term). Highly significant savings in resources can be realised by incorporating the many known improvements in efficiency in manufacturing and use of energy. The world must, therefore, focus on both innovations and implementation of known improvements in energy efficiency.
Energy systems are large and complex. With the growing exploitation of unconventional resources and integration of intermittent solar and wind systems into the grid the complexity is expected to increase significantly. To exploit new opportunities, build and maintain state-of-the-art systems, each country needs to continually educate and train the necessary workforce, i.e., for exploration and production of fuels, management of integrated power systems and the grid and their evolution towards a smart grid. It is important to bear in mind that any investment in technology, capacity development and grid integration of renewables,
control systems and improvements in efficiency will bear fruit as long as the sun shines.
The long-term goal of all countries should be to create an educated population that is able to use emerging technologies to produce goods cost-effectively and with minimal environmental impacts. People want jobs that provide a decent standard of living and opportunities for growth. The challenges we face are broad and complex – one of sustainable development. It remains to be determined how this will be achieved with the many changes anticipated over the next four decades, including: growing populations in poor countries; aging populations in developed countries; mechanisation in manufacturing and service industry and increase in robotic processing that are reducing the number of jobs needed; climate change and growing scarcity of many natural resources.
The FuTure oF Global enerGy SySTemS
39The Future of Energy
Endnotes
1 David Archer, “The Long Thaw: How Humans Are Changing the Next 100,000 Years of Earth’s Climate”, 2008, Princeton University Press, ISBN 978-0-691-13654-7, 192 pages.
2 BP, “Energy Outlook 2035”, 2014, http://www.bp.com/en/global/corporate/about-bp/energy-economics/energy-outlook/outlook-to-2035.html.
3 IEA [International Energy Agency], “World Energy Outlook 2013, 2013, http://www.worldenergyoutlook.org/publications/weo-2013/.
4 Butler, “Changes in lifestyles leads to reduction in demand for oil by the transportation sector”, Financial Times, Dec. 15, 2013, http://blogs.ft.com/nick-butler/2013/12/15/peak-oil-the-trend-to-watch-is-peak-car/.
5 BP, “Statistical Review of world energy 2014”, 2014, http://www.bp.com/en/global/corporate/about-bp/energy-economics/statistical-review-of-world-energy.html; BP, “Energy Outlook 2035”, 2014, http://www.bp.com/en/global/corporate/about-bp/energy-economics/energy-outlook/outlook-to-2035.html.
6 Renewable Fuels Association, “World Fuel Ethanol Production”, http://ethanolrfa.org/pages/World-Fuel-Ethanol-Production. 7 Steve Rattner, “The Great Corn Con”, New York Times Opinion, June 25, 2011, http://www.nytimes.com/2011/06/25/
opinion/25Rattner.html; Green the Future, “Pros and cons of ethanol”, http://greenthefuture.com/ETHANOL_PROSCONS.html; Constanza Valdes, “Can Brazil Meet the World’s Growing Need for Ethanol?”, United States Department of Agriculture Economic Research Service, Dec. 1, 2011, http://www.ers.usda.gov/amber-waves/2011-december/can-brazil-meet-the-world%E2%80%99s-growing-need-for-ethanol.aspx.
8 DoE [U.S. Department of Energy], “Natural gas vehicles”, http://www.afdc.energy.gov/vehicles/natural_gas.html; Alan J. Krupnick, “Will Natural Gas Vehicles Be in Our Future?”, Issue Brief 11-06, May 2011, http://www.rff.org/rff/documents/rff-ib-11-06.pdf.
9 A good introduction to bio-fuel from algae is available at: Wikipedia, “Algae fuel”, http://en.wikipedia.org/wiki/Algae_fuel. Large scale production of biofuels made from algae poses sustainability concerns as discussed at Phys.org, “Large-scale production of biofuels made from algae poses sustainability concerns”, Oct. 24, 2012, http://phys.org/news/2012-10-large-scale-production-biofuels-algae-poses.html.
10 For the discussion of cost barriers to commercialization of algal oil see: Alternative Fuels, “Costs Can Hinder Algae Development”, http://alternativefuels.about.com/od/researchdevelopment/a/Costs-Can-Hinder-Algae-Development.htm.
11 [U.S. Department of Energy], “Engine Economy”, http://www.fueleconomy.gov/feg/tech_engine_more.shtml; Car and Driver, “Five fuel saving technologies”, Aug. 2008, http://www.caranddriver.com/features/five-fuel-saving-technologies-variable-valve-timing-and-lift-page-3.
12 World Coal Association, Coal statistics, http://www.worldcoal.org/resources/coal-statistics/ 13 IEA [International Energy Agency], “Global carbon-dioxide emissions increase by 1.0 Gt in 2011 to record high”, May 24, 2012, http://
www.iea.org/newsroomandevents/news/2012/may/name,27216,en.html.14 The $10/MMBtu price assumes lower end of production cost of about $3-4/MMBtu for natural gas, approximately $4.50/MMBtu
for transportation as LNG (cleaning, liquefaction, shipping, regasification), and roughly $1.50 MMBtu for profit and taxes. Asian LNG spot prices plunged in 2014 down to pre-Fukushima levels, because of ample supply, full national gas storage and portfolio players that are substituting LNG for pipeline gas. Ed Crooks, “US solar and wind start to outshine gas”, Financial Times, Sept. 18, 2014, http://www.ft.com/intl/cms/s/0/e8627a7a-3e82-11e4-adef-00144feabdc0.html#axzz3MiXKVsPk; Diane Cardwell, “Solar and Wind Energy Start to Win on Price vs. Conventional Fuels”, New York Times, Nov. 23, 2014, http://www.nytimes.com/2014/11/24/business/energy-environment/solar-and-wind-energy-start-to-win-on-price-vs-conventional-fuels.html.
15 Martin LaMonica, “Will methane hydrates fuel another gas boom?”, http://www.technologyreview.com/news/512506/will-methane-hydrates-fuel-another-gas-boom.
16 Global Wind Energy Council, “Global Statistics”, http://www.gwec.net/global-figures/graphs/. 17 IEA [International Energy Agency], “topic: Solar (PV and CSP)”, http://www.iea.org/topics/solarpvandcsp/; EPIA [European
Photovoltaic Industry Association], “Global Market Outlook for Photovoltaics 2014-2018”, http://www.epia.org/fileadmin/user_upload/Publications/EPIA_Global_Market_Outlook_for_Photovoltaics_2014-2018_-_Medium_Res.pdf.
18 Geothermal Energy Association, http://www.geo-energy.org/. 19 India Wind Energy Association, http://www.inwea.org/.20 DoE [U.S. Department of Energy], “Photovoltaic System Pricing Trends, Historical, Recent, and Near-Term Projections”, by NREL, 2014
Edition, http://www.nrel.gov/docs/fy14osti/62558.pdf.21 For an introduction see: SmartGrid.Gov, http://www.smartgrid.gov/ and Wikipedia, “Smart Grid”, http://en.wikipedia.org/wiki/
Smart_grid.22 See for Betz law for maximum power from wind turbines: Wikipedia, “Betz Law”, http://en.wikipedia.org/wiki/Betz’s_law.

The FuTure oF Global enerGy SySTemS
40 The Future of Energy
23 Wikipedia, “Solar cell efficiency”, http://en.wikipedia.org/wiki/Solar_cell_efficiency. 24 For an example of the ongoing debate see: Mark Disendorf, ”A detailed look at renewable baseload energy”, June 25, 2011, https://
skepticalscience.com/news.php?p=2&t=393&&n=799. 25 IAEA PRIS [International Atomic Energy Agency Power Reactor Information System], http://www.iaea.org/pris/;
The World Nuclear Organization, “Current and future generation plans for new reactors, http://world-nuclear.org/info/Current-and-Future-Generation/Plans-For-New-Reactors-Worldwide/.
26 For efforts in standardization of nuclear reactor designs see, for example: World Nuclear Association, “International Standardization of Nuclear Reactor Designs”, http://worldnuclear.org/WNA/Publications/WNA-Reports/CORDEL--Standardization-of-Reactor-Designs/; USNRC [U.S. Nuclear Regulatory Commission], “Backgrounder on New Nuclear Plant Designs”, http://www.nrc.gov/reading-rm/doc-collections/fact-sheets/new-nuc-plant-des-bg.html.
27 IEA [International Energy Agency], “Efficient World Scenario: Policy Framework”, World Energy Outlook 2012, http://www.worldenergyoutlook.org/media/weowebsite/energymodel/documentation/Methodology_EfficientWorldScenario.pdf.
28 IEA [International Energy Agency], “450 Scenario: Method and Policy Framework”, World Energy Outlook 2012, http://www.worldenergyoutlook.org/media/weowebsite/energymodel/documentation/Methodology_450Scenario.pdf.
29 IEA [International Energy Agency], “Scenarios and projections”, http://www.iea.org/publications/scenariosandprojections/. 30 BP, “BP energy outlook 2035 for Brazil”, http://www.bp.com/content/dam/bp/pdf/Energy-economics/Energy-Outlook/Country_
insights_Brazil_2035.pdf. EIA [U.S. Energy Information Administration, “Presalt oil and natural gas provide an increasing share of Brazil’s production”, Today in Energy, Jan. 9, http://www.eia.gov/todayinenergy/detail.cfm?id=195112015
31 World Nuclear Association, “Country profiles”, http://www.world-nuclear.org/info/Country-Profiles/. 32 Reuters, “Mexico Senate approves final bill to open energy sector”, http://in.reuters.com/article/2014/08/07/mexico-reforms-
senate-idINL2N0QD07D20140807; Laurence Iliff and David Luhnow, “Pemex CEO: Mexican Energy Overhaul Opens Opportunity”, The Wall Street Journal, Dec. 13, 2013, http://online.wsj.com/news/articles/SB10001424052702303932504579256693926525588; Christopher Hellman, “How Oil Reforms Could Trigger Mexico’s Biggest Economic Boom In A Century”, Forbes, Oct. 1, 2013, http://www.forbes.com/sites/christopherhelman/2013/10/01/mexicos-oil-reforms-set-to-trigger-biggest-economic-boom-in-100-years/
33 EIA [U.S. Energy Information Administration], “Overview: Mexico is a major non-OPEC oil producer and is among the largest sources of U.S. oil imports”, http://www.eia.gov/countries/cab.cfm?fips=MX; EIA [U.S. Energy Information Administration], “Overview: Canada is one of the world’s five largest energy producers and is the principal source of U.S. energy imports”, http://www.eia.gov/countries/cab.cfm?fips=CA.
34 IAEA PRIS [International Atomic Energy Agency Power Reactor Information System], “Small and medium sized reactors (SMRs) development, assessment and deployment”, http://www.iaea.org/NuclearPower/SMR/.
35 World Nuclear Association, “Generation IV nuclear reactors”, http://www.world-nuclear.org/info/Nuclear-Fuel-Cycle/Power-Reactors/Generation-IV-Nuclear-Reactors/.
36 The World Bank estimate of the population in 2011 of the region is 462 million. 37 Gazprom, “Blue Stream”, http://www.gazprom.com/about/production/projects/pipelines/blue-stream/. 38 Nord Stream, http://www.nord-stream.com/. 39 South Stream, http://www.south-stream.info/. 40 EIA [U.S. Energy Information Administration], “Multiple factors push Western Europe to use less natural gas and more coal”, http://
www.eia.gov/todayinenergy/detail.cfm?id=13151. 41 World Nuclear Association, “Nuclear Power in Russia”, http://www.world-nuclear.org/info/Country-Profiles/Countries-O-S/Russia--
Nuclear-Power/.42 Eve Conant, “Russia’s Nuclear Reactors Could Take over the World, Safe or Not”, Scientific American, Oct. 9, 2013. 43 Reuters, “Future of nuclear power in France”, http://www.reuters.com/article/2014/10/10/us-france-energy-
idUSKCN0HZ1LB20141010.44 World Nuclear Association, “Plans For New Reactors Worldwide”, http://www.world-nuclear.org/info/Current-and-Future-
Generation/Plans-For-New-Reactors-Worldwide/.45 EIA [U.S. Energy Information Administration], “EIA Country factsheets”, http://www.eia.gov/countries/.46 EIA [U.S. Energy Information Administration], “EIA country fact sheet Egypt”, http://www.eia.gov/countries/cab.cfm?fips=EG. 47 Desertec, “Desertec Project”, http://www.desertec-africa.org/. 48 WAGPA, “West-Africa Gas Pipeline”, http://www.wagpa.org/. 49 Mozambique LNG, “Natural gas discoveries and production in Mozambique”, http://www.mzlng.com/.50 EIA [U.S. Energy Information Administration], “EIA country factsheet Turkey”, http://www.eia.gov/countries/cab.cfm?fips=TU.51 Socar, “The Baku-Tbilisi-Erzurum Pipeline”, http://new.socar.az/socar/en/activities/transportation/baku-tbilisi-erzurum-gas-
pipeline.52 The Trans Adriatic Pipeline, http://www.trans-adriatic-pipeline.com.53 World Nuclear Association, “Nuclear power factsheet Turkey”, http://www.world-nuclear.org/info/Country-Profiles/Countries-T-Z/
Turkey/.

The FuTure oF Global enerGy SySTemS
41The Future of Energy
54 CNN, “Israel’s development of natural gas fields”’, http://money.cnn.com/2013/08/29/news/companies/israel-nobledelek.pr.fortune/.
55 World Nuclear Association, “Nuclear power in United Arab Emirates”, http://www.world-nuclear.org/info/Country-Profiles/Countries-T-Z/United-Arab-Emirates/.
56 R. Gupta, H. Shankar, and S. Joshi, “Development, Energy Security and Climate Security: India’s Converging Goals”, Sustainable Development and Climate Change, Eds S. Joshi and M. Linke, Rupa Publications India, 2010, http://globalenergyobservatory.org/docs/analysis_papers/Gupta_ORF_Conf_final(v10).pdf.
57 Economic Times, ”Car sales in India: Domestic car sales by Indian automobile manufacturers”, http://articles.economictimes.indiatimes.com/2014-01-10/news/46066322_1_domestic-car-sales-indian-automobile-manufacturers-siam.
58 EIA [U.S. Energy Information Administration], “EIA country fact sheet India”, http://www.eia.gov/countries/cab.cfm?fips=IN59 Ministry of Power, GOI, “Electricity capacity addition in 12th five year plan (2012-2017) in India: “Report of The Working Group on Power
for Twelfth Plan (2012-17)”, January, 2012; http://planningcommission.nic.in/aboutus/committee/wrkgrp12/wg_power1904.pdf; Ministry of Power, GOI, “Capacity Addition of Power, starred question no.151”, March 7, 2013, http://powermin.gov.in/loksabhatable/pdf/Lok_07032013_Eng.pdf. The Economic Times, “Govt plans 88,537 MW new power generation capacity addition during 2012-17”, Sarita C. Singh, September 20, 2013, http://articles.economictimes.indiatimes.com/2013-09-20/news/42252701_1_capacity-mw-hydropower-plants.
60 Ministry of New and Renewable Energy [MNRE], GOI, “Status of renewable generation capacity in India, http://www.mnre.gov.in/mission-and-vision-2/achievements/.
61 Ministry of New and Renewable Energy [MNRE], GOI, “Jawaharlal Nehru National Solar Mission Phase II – Policy Document”, Dec. 2012, http://mnre.gov.in/file-manager/UserFiles/draft-jnnsmpd-2.pdf.
62 World Nuclear Organization, “Nuclear Power in India”, http://www.world-nuclear.org/info/Country-Profiles/Countries-G-N/India/. 63 Geoffrey Pyatt, “Taking Stock of the U.S.-India Nuclear Deal”, U.S. Department of State, Sep. 30, 2011, http://www.state.gov/p/sca/
rls/rmks/2011/174883.htm. 64 Bhabha Atomic Research Centre, GOI, “Strategy for nuclear energy”, http://www.barc.gov.in/about/anushakti_sne.html. 65 R. Gupta and H. Shankar, “Options for development and meeting Electric Power Demand in South Asia”, Global Energy Observatory,
http://globalenergyobservatory.org/docs/analysis_papers/Gupta_SA_BU_Pardee.pdf.66 IAEA PRIS [International Atomic Energy Agency Power Reactor Information System], “Country statistics and details China,”, http://
www.iaea.org/PRIS/CountryStatistics/CountryDetails.aspx?current=CN. 67 World Nuclear Association, “Nuclear Power in China”, Dec. 30, 2014 http://www.world-nuclear.org/info/Country-Profiles/Countries-
A-F/China--Nuclear-Power/. 68 Marketwatch, “China’s 2012 vehicle sales up 4.3%, miss forecast”, Jan. 11, 2013, http://www.marketwatch.com/story/chinas-2012-
vehicle-sales-up-43-miss-forecast-2013-01-11. 69 BP, “BP Energy Outlook 2035”, http://www.bp.com/content/dam/bp/pdf/Energy-economics/Energy-Outlook/Country_insights_
China_2035.pdf. 70 World Nuclear Association, “Nuclear power in South Korea”, http://world-nuclear.org/info/Country-Profiles/Countries-O-S/South-
Korea/. 71 IEA [International Energy Agency], “World Energy Outlook, 2013”, Special Report on South East Asia”, http://www.worldenergyoutlook.
org/southeastasiaenergyoutlook/#d.en.43468.72 EIA [U.S. Energy Information Administration], “EIA Country fact sheets Australia“, Aug. 28, 2013, http://www.eia.gov/countries/cab.
cfm?fips=AS. 73 BP, “BP Energy Outlook 2035 - Africa”, http://www.bp.com/content/dam/bp/pdf/Energy-economics/Energy-Outlook/Country_
insights_Africa_2035.pdf. 74 WRI [World Resource Institute], “Global Coal Risk Assessment Data Analysis and Market Research”, Ailun Yang and Yuyun Culi, Nov.
2012, http://www.wri.org/publication/global-coal-risk-assessment. 75 EPA [U.S. Environmental Protection Agency],“What is carbon dioxide capture and sequestration?”, http://www.epa.gov/
climatechange/ccs/Carbon Capture and Sequestration Technologies Program at MIT, http://sequestration.mit.edu/.76 Boston Consulting Group, “Batteries for Electric Cars: Challenges, Opportunities, and the outlook to 2020”, 2010, http://www.bcg.
com/documents/file36615.pdf. 77 Tesla, “The Tesla Roadster”, http://www.teslamotors.com/models/features#/performance.78 BMW, “The BMW i3 specifications” http://www.bmw.com/com/en/newvehicles/i/i3/2013/showroom/design.html.79 The Car Connection, “The Chevrolet Volt car specifications”, http://www.thecarconnection.com/overview/chevrolet_volt_2013.80 US News, “Car ranking: Hybrid Cars”, http://usnews.rankingsandreviews.com/cars-trucks/rankings/Hybrid-Cars/.81 JCESR, “Scientific and Technical Need”, http://www.jcesr.org/research/technical-summary/; Kevin Bullis, Kevin Bullis, “For Tesla
Motors, Success Is All About the Batteries”, Nov. 6, 2013, http://www.technologyreview.com/view/521201/for-tesla-motors-success-is-all-about-the-batteries/.

The FuTure oF Global enerGy SySTemS
42 The Future of Energy
82 The Washington Post, “Cellulosic ethanol, once the way of the future, is off to a delayed, boisterous start”, by Steve Muffson, Nov. 8, 2013, http://www.washingtonpost.com/business/economy/cellulosic-ethanol-once-the-way-of-the-future-is-off-to-a-delayed-boisterous-start/2013/11/08/a1c41a70-35c7-11e3-8a0e-4e2cf80831fc_story.html.
83 Office of energy efficiency and renewable energy, “Bio energy-Algae”, http://www1.eere.energy.gov/bioenergy/algae.html. 84 National Academy of Engineering, “The Hydrogen Economy: Opportunities, Costs, Barriers, and R&D Needs,” 2004, Washington,
D.C., The National Academies Press, ISBN O-309-53068-7, Retrieved 17 Dec 2010.85 Rachel Nuwer, “The Guarded Secret of the Plants: Will Dan Nocera’s Artificial Leaf Revolutionize Energy?”, Ecoimagination brief:, May
15, 2012, http://www.ecomagination.com/the-guarded-secret-of-the-plants-will-dan-noceras-artificial-leaf-revolution-energy.86 Earth Security Group, “The Earth Security Index 2014”, http://earthsecurity.org/earth-security-index/.

43The Future of Energy
Supply Side Economics and the Need for Energy Diversification
Rajan Gupta, Theoretical Division, Los Alamos National Laboratory, USA
Thomas Elmar Schuppe, Observer Research Foundation, India


Supply Side economicS and the need for energy diverSification
45The Future of Energy
In order to understand supply-side economics of energy resources, diversification by both suppliers and consumers, and trade, the following issues will be examined in this paper:vCurrent status of global resources and how they
are evolving. This part will include estimating which countries will have significant resources left by 2050 based on an understanding of reserves and production trends. Based on such an analysis, projections will be made, in cases where trends are relatively robust, about which countries will control significant resources by 2050 or earlier.
vHow the supply side will evolve, driven by technology, economic, political, social and environmental considerations, and what changes this will force on the consumers.
vWhat options and opportunities for diversification are likely to become available over time for both suppliers and consumers and what their likely drivers and long-term consequences are.
At different points in this paper specific countries will be used to highlight and exemplify the points made. The discussion is informed by four trends that stand out throughout the history of energy use:vThe amount of energy used per person and
social and economic development have been studied extensively, and a strong correlation is observed between the two.1 Access to energy has been a primary enabling factor in human development.
vHumankind has simultaneously exploited all possible forms of energy sources available, often using each for multiple purposes.
vNew fuels and sources of power have been integrated into existing energy mixes depending on the ease of recovery, distribution and use, and the technology available for using them. For example, the overlapping use of human muscle
Introductionpower, wind, wood, coal, diesel and nuclear for the propulsion of ships, and the evolution from coal to first diesel and then to electricity for powering trains.
vA fuel switch has taken place when a cleaner, cheaper or more convenient-to-use fuel or power source has become available. Examples include cooking fuels that evolved from wood, peat, coal char and animal dung found naturally on earth’s surface to coal to oil to natural gas and propane. Today, many cooking appliances run on electric power.
The contention is that these trends will continue. For example, bio-mass from forests and all other burnable waste, historically collected and used for heating and cooking or put into landfills, is now being combusted in thermal power plants and classified as renewable fuel. In the future, once the conversion of lignocellulose to ethanol (cellulosic ethanol) becomes economical, these resources might also be used to produce high-value biofuels. Animal dung, which was used as fertiliser and cooking fuel, is now also being used to produce bio-gas.
It is also maintained that the drivers of change will continue to be technological innovations, cost, access, and ease of distribution and use. Social and international political pressure, driven by considerations of climate change and environmental pollution, will play an increasing role and could significantly change the picture, particularly as technological innovations provide new options for non-fossil fuel-based dispatchable electricity generation and efficient transportation.
To mitigate climate change, emissions of greenhouse gases have to be reduced drastically. The last time in history that CO2 concentrations in the atmosphere were stable was pre-industrialisation at about 280 ppm. Pre-industrial

Supply Side economicS and the need for energy diverSification
46 The Future of Energy
annual emissions of CO2 are estimated at 2-3 Gt, whereas today they have reached around 33 Gt (this estimate does not include contributions from other greenhouse gases) as shown in Figure 1. To stabilise CO2 levels at current levels (400 ppm in 2013), emissions have to be reduced by over 90 percent overnight. Stabilising at even 450 ppm (‘450 Scenario’ in Figure 1) is a daunting challenge, which will require international agreements on emissions of greenhouse gases that are far more restrictive and effective than the Kyoto Protocol.2 On the other hand, mitigation measures will have to take into account economic realities and the development needs of both developing and developed countries. Also, based on recent examples of public discussions and rejection of energy from biofuels, fracking and nuclear power in many parts of the world, one should expect all future fuel and power options to face public scrutiny regarding cost-effectiveness, safety and lifetime environmental impacts. Transitioning away from the status-quo, i.e., energy systems based on fossil fuels, will therefore not be achieved easily.
Global Demand and Supply
Global energy needs are staggering. In 2011, about five TW of installed power capacity generated about 22,000 TWh of electricity as shown in Figure 2. By 2050, an anticipated population of nine to 10 billion (according to United Nations Population Division) will require twice this – about 10 TW supplying about 45,000 TWh per year. This doubling represents an annual 1.8 percent growth in energy demand over 37 years and includes the one percent business-as-usual decrease in energy intensity due to increased efficiency. It is anticipated that the 10 TW generation capacity will be composed of roughly the following wedges: Coal (two TW at 80 percent plant load factor (PLF)), natural gas (two TW at 65 percent PLF), nuclear (one TW at 90 percent PLF), hydro (1.5 TW at 45 percent PLF), wind (three TW at 30 percent PLF), solar (one TW at 20 percent PLF) and “others” (0.5 TW at 50 percent PLF). During this period, CO2 emissions are projected to grow by only 30 percent due to fuel switching, increased
*These are based on three IEA scenarios: (i) ‘Current Policies Scenario,’ with PED growing at 1.6% per year; (ii) ‘New Policies Scenario,’ with PED growing at 1.2% per year; and (iii) ‘450 scenario’ that would stabilise CO2 concentration at 450 ppm. Source: IEA WEO 2013
Figure 1: Historic Annual Primary Energy Demand (Mtoe) and CO2 emissions (Gt) with Projection up to 2035*

Supply Side economicS and the need for energy diverSification
47The Future of Energy
efficiency and growth in renewable generation by OECD countries as also shown in Figure 2.
Similarly, for liquid fuels the WEO projections are 104 mbpd by 2040 as shown in Figure 3 (BP’s projection in the Energy Outlook 2035 is
*1 Gt of carbon = 3.667 Gt of CO2.Source: IEA WEO (2013), p. 191
108 mbpd).3 Unfortunately, there is no alternative to oil at the scale of an oil-wedge (an oil-wedge has been taken to be equivalent to 10 mbpd), and from present perspective it is unlikely that one will emerge by 2035. The total sum of all biofuels may reach five mbpd, as shown in
Figure 2: Global Electricity Usage, CO2 Emissions Intensity (grams CO2/kWh) and Total CO2 Emissions from Electricity Generation (Gt of carbon)* (2011, 2035)

Supply Side economicS and the need for energy diverSification
48 The Future of Energy
Figure 4, if production cost of production of cellulosic ethanol and algal oil becomes competitive with fossil oil as projected by the IEA in WEO 2013. Dwindling water resources, competition with food and environmental impacts will be major factors limiting the amount of biofuels that can/will be produced. The best option for eliminating greenhouse gas emissions from the transport sector is a transition to electric vehicles. In this eventuality, additional electricity will have to be generated by non-fossil sources to cut greenhouse gas emissions, and only the demands of the petrochemical industry will need to be met by fossil oil and gas.
Today, petroleum products dominate fuels used for transportation (light vehicles, trucks, airplanes and ships). Significant reduction in usage of oil is possible by gains in efficiency and fuel switching. Future fossil fuel-based options with lower emissions include cars, train engines and long-haul trucks fuelled by compressed/liquefied natural gas (CNG/LNG); hybrid/electric vehicles; and more efficient, safe and effective public transport systems.
Electric power generation is currently dominated by coal, natural gas, nuclear and hydroelectric systems. These are likely to grow until all countries achieve adequate total capacity and energy security. Of these, nuclear and hydroelectric are essentially carbon neutral, at least during production. Wind and solar present the largest opportunity for growth amongst renewable systems. It is unlikely that the total capacity of other low-carbon systems such as geothermal, biomass-fired power plants, and tidal and wave energy systems will scale to more than a few hundred gigawatts by 2050. Their contribution will be important and will constitute part of the last wedge called “others.” Current trends in their growth rate indicate that these will continue to present a local and limited opportunity in the near to mid-term. Similarly, the probability of commercial fusion reactors operating by 2050 is small.
The greatest challenge for countries that import a significant fraction of the fossil fuels they consume is the ability to pay for the imports if
* Includes impacts of fuel switching and efficiency gains.Source: IEA WEO (2014), p. 102
Figure 3: Projected Demand of 104 mbpd of Oil in 2040*

Supply Side economicS and the need for energy diverSification
49The Future of Energy
prices remain high and volatile. Many countries are already accumulating large trade deficits driven mostly by the cost of importing fossil fuels as shown in Figure 5 (other prominent examples not shown in the figure include India, Spain and Italy). Such a foreseeable financial burden suggests that all countries without adequate reserves of fossil fuels would have compelling economic incentives to make the transition to renewables independent of considerations of climate change. Three major reasons why this is not happening fast enough are: (i) the enormous existing energy and transportation infrastructure and investment in fossil fuels; (ii) easily accessible fossil fuels continue to provide the fastest and surest path of development; and (iii) solar and wind are more expensive and do not, on their own, provide baseload generation. As a result, the business-as-usual scenario is persisting even under the threat of global warming, and the transition to low-carbon options is proving to be slow and challenging, especially with nuclear power generation capacity not growing significantly.
Low-Carbon Options for Baseload Power Generation
Hydro: Technically and economically feasible, hydroelectric capacity worldwide is estimated at about two TW, of which about one TW has already been developed and generated 3566 TWh in 2011. Since the average plant load factor for hydroelectric units is about 45 percent4 and generation is seasonal at most sites, the two TW is effectively equal to one TW of nuclear or coal-fired capacity. One must keep in mind that hydroelectric generation already has significant annual variation due to natural weather patterns and climate change is expected to have additional severe impacts in many regions. Thus, hydroelectric by itself or in combination with solar and wind is not sufficient to constitute a reliable dispatchable system. A great advantage of hydro turbines and systems is their fast start and ramp up rates. These characteristics suggest that in the future, the most effective use of reservoir- and pumped storage-based hydroelectric plants will be as backups to solar and wind farms rather than for
Figure 4: Biofuel Production (Ethanol and Biodiesel) in Selected Regions of the World (2012, 2035)
Source: IEA WEO (2013), p. 388

Supply Side economicS and the need for energy diverSification
50 The Future of Energy
baseload, i.e., integrated systems of hydro, wind and solar plants can provide a large fraction of dispatchable low-carbon electricity.
Nuclear Power: Worldwide, there are 434 operating nuclear reactors with a total capacity of 392 GW that generated about 2,500 TWh/year during 2001-2013.5 Significant growth of nuclear power (to even reach a wedge of one TW by 2050) is, however, very uncertain due to issues of safety, security, waste management and economics. Projected growth is about 300 GW by 2040 in the ‘New Policies Scenario’ by IEA as shown in Figure 6. Issues of safety and security, however, continue to trump the advantages: The cost of fuel, uranium, is a very small fraction of the operating cost, so volatility in its price has a minimal impact on the cost of electricity; adequate conventional reserves of uranium exist to serve demand for this century; the fuel is compact (about 150 tonnes/year/GW) and has
been moved safely and securely around the world; and nuclear reactors do not emit greenhouse gases during operation. Without significant additional growth in nuclear generation, the world, in addition to improvements in energy efficiency, will have to rely heavily on solar and wind systems, which in 2013 provided a few percent of the world’s electricity from 318 GW of wind and 137 GW of solar installed capacity. The timeline of how they can or will scale up to multi-terrawatt capacity, overcome the intermittency challenge, and significantly displace coal and natural gas for baseload generation is uncertain. To seriously address climate change starting today, fostering the growth of nuclear power and integrated renewable systems has to be a key part of all credible long-term solutions. The challenge is to design realistic roadmaps of growth of such integrated systems applicable to countries at different stages of development that address both energy and climate security.
Source: IEA WEO (2013), p. 294
Figure 5: Energy and Non-Energy Trade Balance of Selected Regions (2008-2012)

Supply Side economicS and the need for energy diverSification
51The Future of Energy
Diversification/Growth of Fuel Supply
In this paper, three overall trends in the diversification of energy supply are examined: The future evolution of fossil fuel supply and its use, growth in renewable sources of energy, and the opportunities for accelerating the transition to a world with a smaller carbon footprint. Three time frames are considered: Near term, implying up to 2025; medium term, from 2025 to 2040; and long term, the period beyond 2040. The total time horizon in question is up to 2050.
The rest of the paper is organised as follows. It first reviews the supply of fossil-fuels – coal, oil and natural gas. It then examines diversification in power generation and how it will impact the cost of electricity. The paper ends with an enumeration of key conclusions.
CoalCoal has been mined and used extensively in all forms for over two hundred years. Overall, growth in demand for coal is projected to increase until about 2020 and then stay steady until at least 2040 as shown in Figure 7a.6 The technology to extract coal from both near surface (open pit mining) and deep seams (underground mining) is mature. Similarly, developments in boiler technology and scrubbers for removing toxic and polluting emissions have facilitated usage of coal with different caloric and water content and toxic impurities (heavy metals, sulphur, etc.). As a result, all varieties of coal are being exploited. Significant improvements have also been made in coal-fired power plant technology. Today’s ultra-supercritical steam cycle units achieve 42-46 percent fuel efficiency, have smaller emissions and are much more flexible, i.e., they can withstand faster ramp up rates and more frequent starts.
Figure 6: Historical and Projected Nuclear Installed Capacity in IEA’s ‘New Policies Scenario’ (1970-2040)
Source: IEA WEO (2014), p. 387

Supply Side economicS and the need for energy diverSification
52 The Future of Energy
Figure 7a: Regional Composition of Demand for Coal, Historic and Projected till 2040 (btoe)
Source: Statoil Energy Perspectives (2013), p. 29
Figure 7b offers a comparison of the share of coal and gas in the power sector for four major economies. In North America and the EU, natural gas has been displacing coal to a certain extent. This pattern is projected to continue to increase as long as gas prices stay low. In China too, the share of coal-fired generation will start to decrease as nuclear, combined cycle gas turbine (CCGT) and renewable generation increases even though the total amount of coal consumed will stay constant between 2020 and 2040 (Figure 7a). In other non-OECD Asian countries (Figure 7b), the share of coal is projected to grow, since it will remain the cheapest fuel, and that of gas decrease as indigenous reserves are exhausted and because the projected price of traded gas is high.
China is the largest producer and consumer of coal (about 4.0 billion tonnes in 2012) with imports meeting around six percent of total demand. China’s marginal cost of production for thermal coal, around $80-$100 a tonne, is driving international spot prices (at least the cost of seaborne coal in Asia) as Chinese importers
opportunistically switch between domestic and imported coal. This cost and fraction of imported coal is likely to change as the need to mine deeper mines and exploit deposits in western provinces of China grows, which only further add to costs because an extensive transportation infrastructure will need to be built. Given the current consumption, installed coal-fired power generation capacity (about 700 GW, most of which uses super-critical technology and was installed after 2006) and continued increase in demand of electric power, China will most likely continue to consume at least four Gt of coal per year over the next thirty years – until about 2040,as shown in Figure 7a, the earliest timeframe by which growth of installed renewable, combined cycle gas turbine and nuclear generation capacity could exceed growth in demand and significantly reduce dependence on coal. Maintaining four Gt/year during this period already takes into account a decrease in demand growth due to a projected transition from a manufacturing economy to a larger service sector. This scenario is remarkable in that the cumulative consumption at four Gt per year for 30

Supply Side economicS and the need for energy diverSification
53The Future of Energy
years amounts to China’s total estimated reserves of about 115 Gt. If this scenario unfolds, then China’s imports of coal will continue to increase as its domestic reserves, particularly those easier to access, are exhausted and remaining reserves/resources (particularly those in western China) become more expensive to produce.
The second country that will significantly impact the price and volume of internationally traded coal is India. The growth in its coal-fired generation capacity has been accelerating since 2006, and in 2013 there was about 150 GW of captive and grid-connected coal-fired generating capacity but with an average energy conversion efficiency of only about 25 percent. Unfortunately, the enabling infrastructure (coal mining and transport and the electric grid) has not kept pace and the supply of domestic coal is already falling short due to inadequate mining and transport capacity. Because of the low caloric value (about 3,500 Kcal/kg), India’s reserves of about 60 Gt can sustain 400 GW
of supercritical generation capacity for about 30 years if mining and distribution capacity can be ramped up to 1.5 Gt per year. In addition, many large (called mega and ultra) coal-fired power plants are being developed along coastal areas that have been designed to consume only imported coal. Thus, if India’s power generation stays reliant on coal, then the most likely scenario is that it will need to import over one Gtper year by 2040.
In short, China’s and India’s reserves of 115 and 60 Gt respectively imply that domestic coal can provide them with a thirty-year window of opportunity for coal-fired generation capacity of 700 and 400 GW operating at 80 percent PLF. Highlighting this as a 30-year window of opportunity for China and India ignores many factors such as evolving cost of coal, technological breakthroughs facilitating resource-to-reserves conversion opportunities, of pollution and environmental impacts, and international mandates on mitigating global climate change.
Figure 7b: Historical and Projected Share* of Coal and Natural Gas in the Power Sector (1990-2035)
*The projected changes in fuel mix have regional drivers: Cheap gas in the US, environmental and climate change policies in EU, rising incomes giving rise to environmental concerns and development of nuclear and gas in China, and economic factors in other non-OECD Asia.Source: BP Energy Outlook 2035, p. 86

Supply Side economicS and the need for energy diverSification
54 The Future of Energy
Essentially, domestic reserves are finite and the existence of large global reserves should not lead to complacency. Any given consumer country relying on large-scale imports may not be able to afford them and suppliers may choose not to export in a carbon-constrained world. In a scenario where coal remains a major fuel for power generation in China and India, one can conservatively assume that together they will need to import over two Gt of coal per year by 2040. Only a handful of countries have large enough reserves to meet this kind of demand, and even these countries will need to significantly ramp up production and the associated infrastructure for exporting coal.
Analysing historic trends and projected growth in coal usage and exports, and assuming that no significant new reserves are brought online, current estimates7 show that only seven countries will have significant reserves remaining post 2040 (countries with more than 10 Gt in reserves in 2012) to supply a significant fraction of the over two Gt per year of thermal coal needed by just China and India. (As discussed above, in this scenario, China and India will have largely depleted their indigenous reserves by 2040). These seven countries are the US, Russia, Australia, Germany, Ukraine, Kazakhstan and South Africa. Since German reserves are mostly lignite, in which there has not been significant international trade, the other six countries will have to be the major suppliers. With so few suppliers, the coal outlook can range from a no-coal economy in compliance with a carbon-constrained world to a market-driven one with high prices correlated with the price of natural gas or a high marginal price of mining unconventional coal (including or even excluding external costs).
If large-scale import is not an option, then to guarantee long-term energy security based on coal-fired generation, China and India in particular will increasingly need to develop cost-effective capacity to mine thinner and/or deeper seams. One promising but yet to be demonstrated at scale
technology to exploit thin and/or deep seams is in situ gasification. However, its environmental impacts could be large and cost-effective methods to mitigate them also need to be developed.
An interesting test case of how the market will adjust to depleting reserves will arise in the near term when Indonesia can no longer export significant quantities of thermal coal. It has increased production by 375 percent between 2002 and2012 and is currently the largest exporter of thermal coal. Unless new reserves are confirmed, it is not clear whether it can continue to increase production at current rates.
Geography too will play an important role in determining the supply chain. Coal from Russia, Ukraine and Kazakhstan will most likely go to countries connected to them by railways, i.e., Eastern Europe and China. The rest of the world will therefore have to rely on the US, Australia and South Africa for coal. In a carbon-constrained world, it is very unlikely that these three democratic countries with environmentally enlightened publics could justify exporting large amounts of coal. For example, will the public in the US, which today mines and consumes about one Gt of coal per year and has 243 Gt in reserves, allow companies to build railway and port capacity to export one Gt or more of coal per year as their own consumption decreases? One should note that the US exported only about 40 Mt of steam coal in 2012 and 20138 and the public opposition to building new export infrastructure is growing. In a CO2-constrained world, as domestic supplies of coal dwindle in most countries, there will be severe constraints in supply leading to high volatility in prices. At that point, international bodies regulating greenhouse gas emissions would need the support of only a few exporting countries to force major coal importing countries to transition to other forms of power generation. Such a CO2-constrained world is the more likely scenario; therefore, countries dependent on imports for coal-fired generation must develop a roadmap to complete the transition to other

Supply Side economicS and the need for energy diverSification
55The Future of Energy
sources of power by 2050.
In this carbon-constrained scenario, the two ways in which coal would remain a defensible fuel for power generation are: One, Carbon Capture and Storage (CCS) is scaled up from current demonstration projects to sequestering over 10 Gt of CO2 per year. In addition to the cost of building the infrastructure, large-scale deployment of CCS will require the public to be convinced that risks of leakage and subterranean migration of CO2 and toxins are small and that the environmental impacts of the associated infrastructure such as pipelines are acceptable. And two, in situ coal gasification technology becomes cost-effective and its environmental impacts are understood and mitigated.
Almost all developed countries have already crossed the peak of their coal-fired generation capacity and thus annual coal usage. Over the coming decades they can start reducing CO2 emissions by increasing the efficiency of their coal-fired plants and by replacing the least efficient ones by a combination of CCGT, nuclear, hydro, solar and wind systems. All such countries at or past the peak in their installed coal-fired capacity can therefore afford to agree to international agreements capping CO2 emissions at current levels. Even China, having already reached close to the anticipated maximum sustainable usage of about four Gt of coal per year, is in a position to participate in such agreements as the recent US-China climate agreement (as per this agreement, China will achieve its peak CO2
emissions around 2030). Only countries such as India, that are still in early stages of using coal to facilitate development, will have a very difficult time agreeing to cap CO2 emissions at current levels. However, as they get increasingly isolated in the international arena, they may be forced to comply with caps on total emissions at current levels. As a result, they may face very serious impediments to development since it is highly unlikely that they can bring alternative sources – CCGT, nuclear, hydro, solar and wind systems –
online fast enough to keep pace with the growth in demand. Such countries face a tough uphill battle. They need to develop a detailed and realistic backup roadmap that provides needed growth in power generation capacity to address development needs which, at the same time, is also accepted by the international community in a carbon-constrained world and by local populations rebelling against environmental pollution and water shortages.
OilFossil oil is used primarily for transportation driven by internal combustion engines and for petrochemicals. Eighty-six of the roughly 88 mbpd of oil used worldwide in 2012 (i.e. 98 percent) came from fossil fuels, and the rest, used for transportation, is either bio-ethanol or biodiesel. These biofuels are unlikely to grow to more than three mboe in the next two to three decades (Figure 3).9 Thus, the primary emphasis of planners and policymakers for reduction of oil use has been on efficiency, including transitioning to hybrid and/or electric cars and building public transport systems. On the other hand, over the coming decades, as more people are able to afford individual transport vehicles,10 demand for oil is generally anticipated to continue to increase, especially in developing and emerging economies as shown in Figure 8.
Supplying countries have an incentive to keep the price of oil affordable to encourage this growth in demand. To counter this growth in demand is the rising burden of importing oil leading to trade deficits and the high cost to consumers. Thus, both governments and individuals in importing countries have an incentive to promote efficiency and reduce consumption. Trends in these two counter currents can change rapidly as evident after the 2008 recession. Furthermore, with the price of oil on average staying at about $100/barrel from 2011 till 2014 there has been a sustained decrease in consumption of oil in many countries. Consequently, predictions of growth

Supply Side economicS and the need for energy diverSification
56 The Future of Energy
in demand have large uncertainties; however, most agencies (IEA, EIA and oil companies as well) predict continued increase in global consumption. The recent plunge in prices from over $100/barrel to below $50/barrel demonstrates that reserves of conventional and unconventional oil can be profitably brought to the market at prices of about $50/barrel as shown in Figure 10. Stagnation in demand and geopolitics can drive similar price volatility in the future.
Over the last decade, oil companies have developed and deployed the technology to exploit unconventional resources – deep sea, arctic, heavy oil, tar sands and tight or shale oil – and are beginning to realise their enormous potential. Even a very conservative estimate of conventional and unconventional resources suggests that up to 2050 and beyond, possible short-term shortages in oil supply would most likely be due to economic factors (e.g. uncertainty in demand leading
to inadequate investment in exploration and recovery) and geopolitics, since most (80 percent) of the conventional reserves are controlled by national companies and are located in politically unstable regions. In the absence of major political instabilities, and without an increase in alternatives, the amount of oil extracted annually will depend on demand. Producing countries and companies will respond to this growing demand by bringing more resources online.
In a carbon-constrained world, unconventional oil may have a finite window of opportunity (also expressed in the ongoing discussion on “unburnable carbon”). At some point in time as the global population stabilises, shares of renewable generation and high mileage electric cars increase, the demand for crude oil, especially expensive unconventional oil, will start to decrease. Countries with large conventional reserves could then squeeze out
Figure 8: History of Oil Production (left) and Consumption (right) by Region (mbpd) (1988-2013)
Source: BP Statistical Review 2014, p. 12

Supply Side economicS and the need for energy diverSification
57The Future of Energy
investment in exploration, production and export of unconventional oil and gas. For example, after the growth in production of pre-salt oil in Brazil over the next ten years, conventional production from OPEC countries is projected to rise and could squeeze out more expensive unconventional oil if growth in demand stalls. This could start happening as early as 2030. Unforeseen developments such as the dramatic fall in crude oil price in 2014 due to stagnation in demand, large strategic reserves, Saudi Arabia’s strategic swing vote and the concomitant ineffectiveness of other OPEC countries are providing a preview of this effect.
Since the development of unconventional resources is relatively new, estimates of global reserves have large uncertainties; nevertheless, given the long lead-time (five to 10 years) needed to bring new resources online, one can assess, based on history, who will be the major suppliers
and importers of oil over the next three decades. Europe, South Asia, China, the Asian Tigers and the US will remain the major importers; the Persian Gulf and Caspian Sea countries, Russia, West Africa (Nigeria and Angola), North Africa, Venezuela, Mexico and Canada will remain the main exporters. The most significant changes anticipated by the IEA, as illustrated in Figure 9, are the decreasing imports by the US due to its development of unconventional sources; continued increase of imports in China, India, Southeast Asia and exporting countries; and increase in exports of pre-salt oil from Brazil.11
Price and its stability are harder to predict. In a purely market-driven economy, the supposed driver of international price is the marginal cost of production, shown in Figure 10, that varies significantly between conventional and non-conventional sources. Unconventional oil is more expensive, partly because more
Figure 9: Change in the Share of Net Oil and Gas Imports/Exports in Selected Regions in IEA WEO ‘New Policies Scenario’ (2011-2035)
The percentages of exports and imports are respectively calculated from the following ratios:export/total produced and imports/total consumed. Source: IEA WEO (2013), p. 77

Supply Side economicS and the need for energy diverSification
58 The Future of Energy
Figure 10: Production Cost/Break-Even Prices and Size of Remaining Technically Recoverable Oil Resources (above) and of Economically Recoverable Unconventional Oil (below)
Rystad develops estimates based on bottom up analysis of global fields, licenses, and potentially recoverable resources given currently available technology and activity levels. All resource values depicted in the graph are cumulative expected production from 2012 until 2100, excluding already produced oil through 2011. Oil and field condensate only, not natural gas plant liquids. Note that for oil sands development costs CERI, Alberta ERCB, and NEB are used.Source: IEA analysis of Rystad Energy data.
expensive technology is required and also because continuous investment is required over the lifetime of a well to maintain production.
Countries with large conventional reserves can more easily increase production and influence the price to discourage investment in unconventional

Supply Side economicS and the need for energy diverSification
59The Future of Energy
Figure 11: Crude Oil Prices ($/barrel) and World Events that Influenced Major Changes (1988-2013)
Source: BP Statistical Review of World Energy 2014, p. 15
exploration – as the Saudis have shown in the course of 2014 in order to maintain their global market share, especially in competition with tight oil production in the US. In theory, it is in the interest of all exporters, however, to keep the oil price high to maximise profits and attract investment in exploration and production, but not too high to cause an economic recession and make investments in alternatives attractive – something OPEC is familiar with given that it wants to maintain a sustained demand for oil. In the near to mid-term, keeping unconventional oil in the supply mix to set the marginal cost of production helps keep the prices high.
Volatility in the oil market has historically been correlated with political instability and/or lower production due to under-investment in exploration and recovery (poor governance in producing countries) than due to any real shortages in reserves (Figure 11). For example, the recent declining production in Mexico and Venezuela is
due to poor governance – inadequate investment and the fact that foreign companies with latest technology are being driven out.
One must also always keep in mind the existence of extensive additional resources globally, as shown in Figure 12, which might be exploited as prices rise. With growing demand and improvements in recovery technology, the only foreseeable impediment to their development (i.e., converting these resources to reserves) could be cost or public/political opposition in response to environmental impacts and climate change given rising greenhouse gas emissions.
In short, on the supply side, there is little incentive for countries and companies that can produce and export oil/gas competitively in the international market to not continue to develop these resources since it is unlikely that the transportation sector will transition away from liquid fuels any time soon. The use of hybrid and higher mileage

Supply Side economicS and the need for energy diverSification
60 The Future of Energy
electricity vehicles will grow, as will those running on CNG or LNG; however, it is unlikely that these will grow fast enough to result in a decrease in demand for oil in the coming decades. Unfortunately, the investment in public transport systems is small compared to the growing demand for mobility driven by rapid urbanisation in the developing world. As long as the only other option is poor/unsafe public transport, people will continue to invest in individual transport.12 With little or no threat to their bonanza in the near term, the important question for oil exporting countries is: Are they investing oil revenues in broad-based development so that their citizens become innovators, compete globally in other manufacturing and service industries, and help diversify the economy? Norway is a good example of a country investing its oil and gas revenues to facilitate long-term development.13
The Persian Gulf countries are the largest exporters of oil. It is therefore instructive to examine the case of one of them: The United Arab Emirates (UAE) has started to diversify its portfolio
of energy sources and economy while still relying on revenues generated by exporting oil. The UAE holds the seventh largest reserves of conventional oil (97.8 billion barrels in 2012) and of natural gas (6 tcm).14 Of the seven emirates comprising the UAE, Abu Dhabi holds about 94 percent of these reserves. Export of oil accounts for over 80 percent of UAE’s revenue.
Most of the electricity in the UAE is generated in highly efficient power and water desalination plants using gas turbines. In spite of its large reserves of natural gas, it is a net importer of gas since a large fraction of the gas it produces is sour that is re-injected for enhanced oil recovery. To meet its growing gas demand, it invested in the Dolphin gas pipeline linking Qatar to UAE and Oman.15 Furthermore, LNG regasification terminals have been set up.
With a rapidly growing population and domestic consumption, the UAE can no longer rely on oil exports to maintain its high per capita GDP. It needs other sources of revenue. Its initiatives at
Figure 12: Estimates of Cumulative Production to Date, Reserves and Total Recoverable Conventional and Unconventional Resources for Coal, Natural Gas and Oil (2011/12)
Source: IEA WEO (2013), p. 72
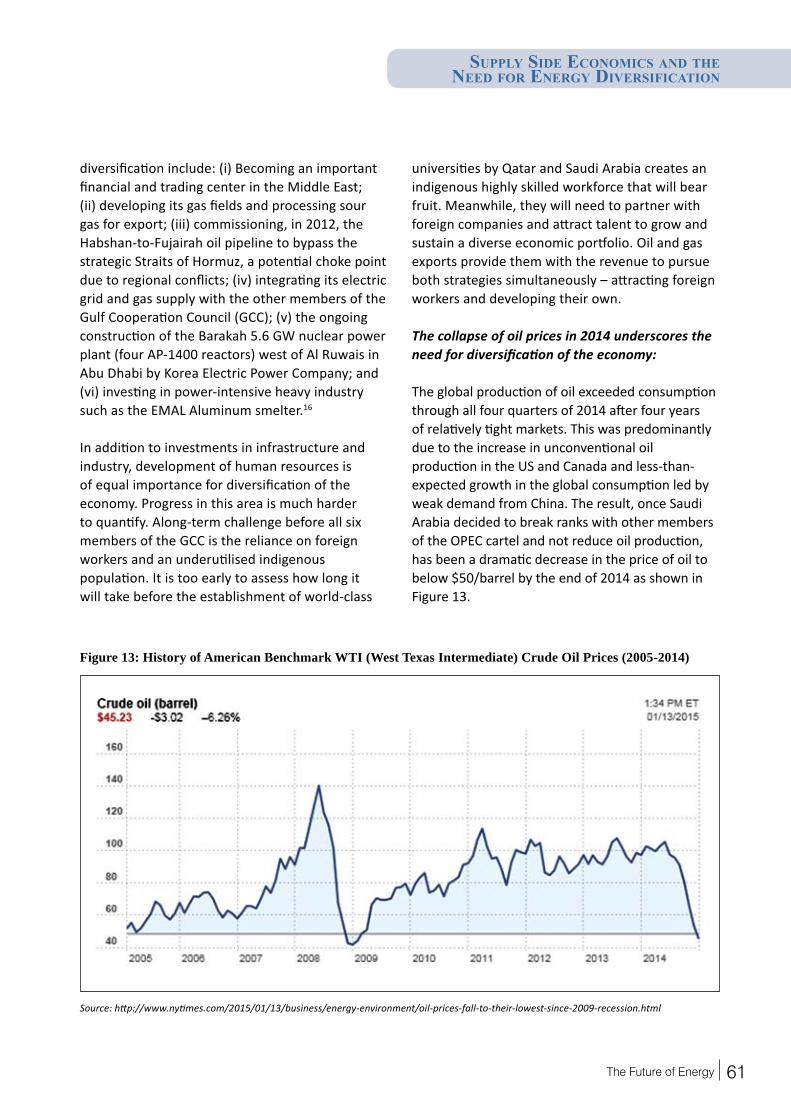
Supply Side economicS and the need for energy diverSification
61The Future of Energy
diversification include: (i) Becoming an important financial and trading center in the Middle East; (ii) developing its gas fields and processing sour gas for export; (iii) commissioning, in 2012, the Habshan-to-Fujairah oil pipeline to bypass the strategic Straits of Hormuz, a potential choke point due to regional conflicts; (iv) integrating its electric grid and gas supply with the other members of the Gulf Cooperation Council (GCC); (v) the ongoing construction of the Barakah 5.6 GW nuclear power plant (four AP-1400 reactors) west of Al Ruwais in Abu Dhabi by Korea Electric Power Company; and (vi) investing in power-intensive heavy industry such as the EMAL Aluminum smelter.16
In addition to investments in infrastructure and industry, development of human resources is of equal importance for diversification of the economy. Progress in this area is much harder to quantify. Along-term challenge before all six members of the GCC is the reliance on foreign workers and an underutilised indigenous population. It is too early to assess how long it will take before the establishment of world-class
universities by Qatar and Saudi Arabia creates an indigenous highly skilled workforce that will bear fruit. Meanwhile, they will need to partner with foreign companies and attract talent to grow and sustain a diverse economic portfolio. Oil and gas exports provide them with the revenue to pursue both strategies simultaneously – attracting foreign workers and developing their own.
The collapse of oil prices in 2014 underscores the need for diversification of the economy:
The global production of oil exceeded consumption through all four quarters of 2014 after four years of relatively tight markets. This was predominantly due to the increase in unconventional oil production in the US and Canada and less-than-expected growth in the global consumption led by weak demand from China. The result, once Saudi Arabia decided to break ranks with other members of the OPEC cartel and not reduce oil production, has been a dramatic decrease in the price of oil to below $50/barrel by the end of 2014 as shown in Figure 13.
Figure 13: History of American Benchmark WTI (West Texas Intermediate) Crude Oil Prices (2005-2014)
Source: http://www.nytimes.com/2015/01/13/business/energy-environment/oil-prices-fall-to-their-lowest-since-2009-recession.html

Supply Side economicS and the need for energy diverSification
62 The Future of Energy
The trillion-dollar question is – will the prices stay low? The oil reserves of most oil exporting countries are nationally owned and oil revenues constitute the bulk of the government revenues. Over the years, these governments have built up large budgets and costly public appeasement policies by providing subsidies based on these revenues. As a result of these commitments, they start incurring budget deficits once the price of oil falls below a certain value independent of the marginal price of production. This break-even price for a number of exporting countries is shown in Figure 14. The current price of about $50/barrel is well below the break-even price for all major exporters, including Saudi Arabia (about $90/barrel), other than perhaps Canada, and has put a huge pressure on their economies. Past high oil prices allowed Saudi Arabia to build large reserves that are held in its central bank, the Saudi Arabian Monetary Agency; its high break-even
price is because it also significantly increased its expenditures over the last five years.17 While it may be willing to use its monetary reserves to keep the prices low for some time, the other exporters are already hurting. For example, by January 2015 Venezuela and Iran were canvassing OPEC to cut production and raise prices.
Sustained low prices will also drive out some high-cost non-conventional oil production and might set back investments in them for years. The bottom line is, even if global consumption picks up because of the current low price, it will not offset the loss of revenues incurred by the exporters who have gotten used to prices over $100/barrel. It is therefore anyone’s guess as to when any given exporter will reach its breaking point, what austerity measures these nations can adopt, what social disruptions will result and what will be the consequences to the global economy of their
Figure 14: Price of Brent Crude Oil Prices in 2014 vs. Price at which Select Large Exporting Countries Start Incurring Budget Deficits since 2009
Note that in January 2015, the prices had fallen even further to $50/bbl.Source: The Economist, http://www.economist.com/blogs/graphicdetail/2014/10/daily-chart-7

Supply Side economicS and the need for energy diverSification
63The Future of Energy
misery. The swing vote and the future of oil prices, for the time being, remains largely in the hands of Saudi Arabia.
Natural GasNatural gas is widely hailed as the bridge fuel between the fossil-fuel dominated economy of the 20th century (mostly by coal and oil) and the future zero-carbon economy based on renewable sources. Even though it is a relative newcomer vis-à-vis coal and oil, it is the cleanest burning and most multipurpose fuel of the three. It is used widely for home, commercial and industrial use. It is an energy-efficient transportation fuel in the form of CNG or LNG, and is used extensively for generating power using combustion turbines. It is also a key feedstock in the fertiliser and petrochemical industry. After processing, natural gas burns with relatively little pollution, but it is
Figure 15: Global Flows of International Natural Gas Trade in 2013 (bcm)
Source: BP Statistical review of World Energy 2014, p. 29
nevertheless a fossil fuel that produces CO2 when burned. Methane is a powerful greenhouse gas and any leakages during production, processing and/or transport contribute to global warming. From an economic and logistics perspective it has two major drawbacks because it is a gas – transport and storage. The cost of transport when a pipeline is not an option, for example exporting gas from the US to China, is large, about $4-8/MMBtu,18 and storage of natural gas as LNG is expensive and limited in scope. The questions that need to be addressed with respect to realising the full potential of natural gas as a multipurpose fuel are: (i) Is there sufficient economically recoverable reserve of natural gas, and its geographic distribution, that the industry will invest in enlarging not just production but the natural gas-based economy as a whole, for example CNG-fueled cars?; (ii) Where will the price stabilise with respect to coal and oil?; and (iii) Can

Supply Side economicS and the need for energy diverSification
64 The Future of Energy
the production, especially of shale gas, be made more environmentally benign to overcome the environmental impacts and objections regarding the current practice of hydraulic fracturing?
Most of the natural gas production in 2013 was from the exploitation of conventional reserves; the geographic trade in 2013 is illustrated in Figure 15. Four countries – Russia, Turkmenistan, Iran and Qatar account for about 60 percent of current conventional reserves. The next largest reserves, about four percent each, are in the US and Saudi Arabia. After these there are 11 countries, each with a share of one to three percent of the world’s total, and these include many of the current exporters: Trinidad and Tobago, Norway, Algeria, Australia, Indonesia and Malaysia. Historically, European countries and the Asian Tigers (Japan, Taiwan, South Korea and Singapore) have dominated imports of natural gas. Recent growth in demand has been mostly in producing countries and Asia-Pacific, and has been driven by the power generation sector. Outside of North America, export of natural gas is dominated by the Netherlands, Norway, Russia, Turkmenistan (mostly by pipelines); Trinidad and Tobago, Nigeria, Qatar, Indonesia, Malaysia and Australia (mostly as LNG); and by Algeria through pipelines and as LNG. The development of new pipelines and LNG terminals takes five to 10 years and requires very significant investment. So, growth in supply is incremental and most of the LNG liquefaction terminals under construction are in Australia, East-Africa and Asia-Pacific, the new centers of export and of demand respectively.19
Most developed countries have over built capacity in both gas and coal-fired power plants to balance their energy portfolio by increasing coal-fired generation when the price of natural gas is high and vice-versa. This is evident in Europe since 2010, where demand of gas has not taken offdue to high relative price, and many countries, for example Germany as discussed later in this paper, have expanded their coal-fired power generation instead for the time being. Because of this
elasticity in demand for natural gas, producing countries are developing their export capacity incrementally and in sync with long-term sale agreements and construction of new pipelines and/or LNG facilities. Even then, as price fluctuates and demand varies, these facilities go through periods of underutilisation, for example LNG regasification terminals in Europe since 2011.20 A second strategy that countries importing natural gas, especially as LNG, follow to ward against disruptions in supply is to maintain a diverse portfolio of sources. Large importers, for example Japan, South Korea and Spain, have spread their purchases over many suppliers.
Post Fukushima, the landed price of LNG in Japan reached about $20 per MMBtu as a result of the shutting down of all nuclear reactors and the consequent sudden increase in gas demand. In terms of stored chemical energy, this price was equivalent to that for oil (1 toe = 40 MMBtu and $800/tonne for the price of oil) and about seven to eight times that of coal (using 1 tce = 30 MMBtu and $80/ton for the price of coal). At these prices, coal-fired generation becomes much more attractive in the absence of a carbon tax or trading scheme as well as in spite of its environmental impacts. Three changes can tip the scale back in favor of natural gas: (i) A significant carbon tax that makes coal more expensive; (ii) global development of shale gas resources leading to lower prices; and (iii) a global rejection of nuclear power.
The first and third are mostly policy issues, albeit driven by economics and energy security. In this paper the second issue is reviewed – development of shale gas resources in Europe, which currently imports most of the natural gas it consumes. Since European countries are also leading the world in experimenting with a carbon pricing and in rejecting nuclear power, the question is whether Europe is on a fast track to repeat the success of shale gas production in the US or whether it will remain dependent on gas imports.

Supply Side economicS and the need for energy diverSification
65The Future of Energy
Prospects for shale gas production in Europe:
According the recent study by ARI, Europe holds about 25 tcm of technically recoverable shale gas.21 This is about a third of conventional reserves in Europe and Eurasia that are essentially all concentrated in Russia and Turkmenistan. The region’s shale gas resources are located in three major areas that contain multiple basins, sub-basins and different plays as shown in Figure 16. One area of prospective gas runs from eastern Denmark and southern Sweden (Alum shales) across northern and eastern Poland (Silurian shales) into Ukraine; the second stretches from northwest UK through the Netherlands and northwest Germany to southwest Poland; and the third from southern UK through France (Paris basin), the Netherlands, northern Germany and Switzerland. According to these assessments, southern Europe does not have large basins. It should be noted, however, that with limited
validated drilling results, overview maps such as the one shown in Figure 16 are largely based upon geological evidence and do not provide a statement on commercial viability of gas extraction.
In addition to the lack of adequate data from drilled wells, there are many geological, social and economic reasons why Europe is likely to be less prospective than North America. These reasons include: vA more fragmented geology (volume and area),
and less mature and more geologically active basins resulting in smaller sweet spot areas than in the US.
vSignificantly deeper shale formations (2,500 to 3,700 meters below the surface) than the formations in North America, and many promising ones offshore in the North Sea.
vHigher population density, which limits both access to promising drilling sites and constrains
Figure 16: Map of Shale Gas and Coal-Bed Methane Basin in Europe
Source: IEA (2012), Golden Rules for a Golden Age of Gas, p. 121

Supply Side economicS and the need for energy diverSification
66 The Future of Energy
large-scale, closely-spaced drilling sites.vStricter environmental regulations, higher public
awareness and active opposition. The public is sensitised to the disruptive impacts of the truck traffic associated with the wells for transporting water and equipment.
vState ownership of oil and gas rights versus landowner’s rights in the US, which might limit the incentives for private landowners and communities to accept and benefit from local shale gas development.
vHighly fragmented and nationalised legislation and regulations regarding upstream unconventional gas production within Europe, even though the European Commission has adopted non-binding recommendations in January 2014.
vSignificantly higher shale production costs in Europe compared to the US due to geological and technical reasons as well as higher regulatory and environmental expenses.
vA lack of dynamic investment and production stimulating factor of continuous drilling obligations in Europe.
vThe need for shale gas in Europe to be competitive with imports of conventional gas from Russia, the Caspian Sea basin and North Africa, regions to which it is connected via an extensive network of pipelines.
Keeping these challenges in mind, the state of affairs in selected European nations is as follows:
vFrance, with estimated reserves of about four tcm (compared to annual consumption of 0.04 tcm and negligible indigenous production of conventional gas), was expected to be one of the first countries to develop its shale gas resources. However, in 2011 the government banned shale gas production using hydraulic fracturing (fracking) because of public and political concerns over the environmental impacts and furthermore cancelled the exploration permits issued in 2010 to Schuepbach Energy and Total. President Hollande confirmed the ban and France’s
constitutional court upheld it on 11 October 2013.22
vIn the UK (0.75 tcm), shale gas activities are strongly backed by the current government, but it is unlikely to be a game changer soon as the estimated reserves are less than one tcm and public discussion on its need is ongoing. Although the moratorium due to environmental and seismic concerns has been lifted, progress is still slow.
vGermany, with about 0.5 tcm listed, is in a similar boat as the UK and faces strong public awareness and opposition. The new draft legislation has taken a cautious approach that may allow fracking based on strict environmental regulations and audits.
vScandinavia (1.2 tcm) sits on top of the large and promising Alum Basin. However, after some test wells in Sweden, Shell stopped activities there. The 2013 updated assessments from ARI has eliminated speculative area for Alum Shale in Norway and put reserves down to zero from a promising 2.3 tcm in the former version.
vPoland, with its promising Baltic Basin, was the designated European champion and the Polish government has been actively boosting the shale gas industry to reduce its unwelcomed dependence on Russian gas and to diversify away from coal. Several setbacks and problems have dampened Poland’s hopes. A series of first test drills did not prove viable for commercial shale gas production, leading to the exit of some multinational players (ExxonMobil, Talisman and Marathon). Recent reassessments by the Polish Geological Institute and the EIA have scaled down expectations. Furthermore, a number of hurdles exist regarding geology, gas transmission and distribution infrastructure, legislation and bureaucracy and, last but not least, the questionable profitability of shale gas production. In order to trigger shale gas exploration, the Polish government has established tax breaks and streamlined regulations and procedures. Nevertheless, the current assessment is that even with strong political support, large-scale production is not

Supply Side economicS and the need for energy diverSification
67The Future of Energy
expected before 2020.vUkraine, with estimated 3.5 tcm, is also keen
to exploit its shale gas resources to reduce dependence on Russia. In 2013 it signed a contract with Royal Dutch Shell allowing it to explore the Yuviska block, and ENI, Chevron and other majors are said to be ready to join in. While encouraging, it is too early to assess how shale gas recovery will evolve in Ukraine, especially in light of the current political instability.
The upshot is that shale gas is unlikely to be a game changer in Europe in the near term. One would have thought that Russia would view the development of shale gas as not being in its best interest and improve trade relations to maintain its strong position vis-à-vis gas and oil exports to Europe. Its annexation of Crimea and intervention in Ukraine in 2014 has instead led to economic sanctions and isolation. Moreover, against the
backdrop of the ongoing Ukraine crisis with Russia, the EU has published a European energy security strategy and cautiously addressed the option of shale gas development to compensate for falling conventional gas production.
Figure 17 gives the IEA assessment of the global geographic distribution of remaining unconventional gas resources in tcm at the end of 2012. According to such assessments, Argentina and China have amongst the largest predicted resources of shale gas and they have the motivation to exploit them because of a large growing demand for gas. Again, both countries face serious social, infrastructure and technological challenges, and regulatory impediments to attracting investment and international participation. Argentina will have to address issues of populist government policies, price controls and an unattractive business climate for foreign companies.23 The Chinese government
Figure 17: Remaining Unconventional Resources of Gas (tcm) in Selected Regions in IEA WEO ‘New Policies Scenario’ (end of 2012)
Source: IEA WEO (2013), p. 116

Supply Side economicS and the need for energy diverSification
68 The Future of Energy
is committed to rapid development of its shale gas resources, but their reserves are again deeper than in the US and in less accessible and more water-stressed areas (mountainous, arid west and southwest or overlapping with conventional oil or gas fields) that will need larger investment in exploration and infrastructure.
The regulatory and business climate for foreign companies also needs to be improved.24 As a result, the growth in exploration and production is much slower than expected. The bottom line is that it remains to be seen how soon any country outside North America can join in the shale gas revolution.
Diversification in Power Generation In the last section opportunities and hurdles in the future supply of fossil fuels were discussed, with the conclusion that historic models based on demand and supply, and moderated by geopolitics, persist for investment in the exploration and production of coal, oil and gas. The focus now is on electric power generation; the impact of integration of utility scale solar and wind plants; and the long-term promise of creating combinations that evolve towards zero-emission systems.
Figure 18 compares the composition by fuel source of electric energy generated in 2011/2013 versus
Figure 18: The Fraction of Electric Energy Generated as a Function of the Fuel Source in Thirteen Large Consumer Countries/Regions and the Average for OECD Countries
Data are compared for years 2005 and 2011/2013.Source:IEA Electricity Information. Compiled by authors.
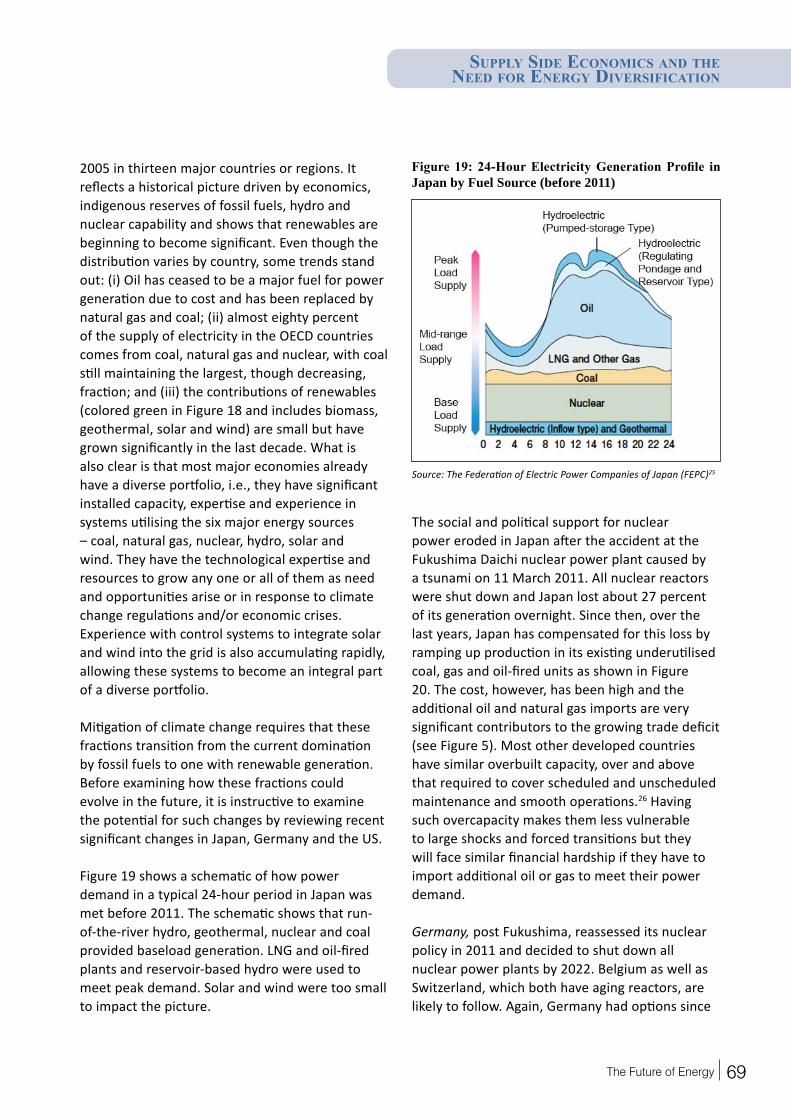
Supply Side economicS and the need for energy diverSification
69The Future of Energy
2005 in thirteen major countries or regions. It reflects a historical picture driven by economics, indigenous reserves of fossil fuels, hydro and nuclear capability and shows that renewables are beginning to become significant. Even though the distribution varies by country, some trends stand out: (i) Oil has ceased to be a major fuel for power generation due to cost and has been replaced by natural gas and coal; (ii) almost eighty percent of the supply of electricity in the OECD countries comes from coal, natural gas and nuclear, with coal still maintaining the largest, though decreasing, fraction; and (iii) the contributions of renewables (colored green in Figure 18 and includes biomass, geothermal, solar and wind) are small but have grown significantly in the last decade. What is also clear is that most major economies already have a diverse portfolio, i.e., they have significant installed capacity, expertise and experience in systems utilising the six major energy sources – coal, natural gas, nuclear, hydro, solar and wind. They have the technological expertise and resources to grow any one or all of them as need and opportunities arise or in response to climate change regulations and/or economic crises. Experience with control systems to integrate solar and wind into the grid is also accumulating rapidly, allowing these systems to become an integral part of a diverse portfolio.
Mitigation of climate change requires that these fractions transition from the current domination by fossil fuels to one with renewable generation. Before examining how these fractions could evolve in the future, it is instructive to examine the potential for such changes by reviewing recent significant changes in Japan, Germany and the US.
Figure 19 shows a schematic of how power demand in a typical 24-hour period in Japan was met before 2011. The schematic shows that run-of-the-river hydro, geothermal, nuclear and coal provided baseload generation. LNG and oil-fired plants and reservoir-based hydro were used to meet peak demand. Solar and wind were too small to impact the picture.
Figure 19: 24-Hour Electricity Generation Profile in Japan by Fuel Source (before 2011)
Source: The Federation of Electric Power Companies of Japan (FEPC)25
The social and political support for nuclear power eroded in Japan after the accident at the Fukushima Daichi nuclear power plant caused by a tsunami on 11 March 2011. All nuclear reactors were shut down and Japan lost about 27 percent of its generation overnight. Since then, over the last years, Japan has compensated for this loss by ramping up production in its existing underutilised coal, gas and oil-fired units as shown in Figure 20. The cost, however, has been high and the additional oil and natural gas imports are very significant contributors to the growing trade deficit (see Figure 5). Most other developed countries have similar overbuilt capacity, over and above that required to cover scheduled and unscheduled maintenance and smooth operations.26 Having such overcapacity makes them less vulnerable to large shocks and forced transitions but they will face similar financial hardship if they have to import additional oil or gas to meet their power demand.
Germany, post Fukushima, reassessed its nuclear policy in 2011 and decided to shut down all nuclear power plants by 2022. Belgium as well as Switzerland, which both have aging reactors, are likely to follow. Again, Germany had options since

Supply Side economicS and the need for energy diverSification
70 The Future of Energy
Figure 20: Monthly Electricity Generation by Source and Consumption of Fossil Fuels before and after the Fukushima Disaster (2007-2013)
The loss of nuclear capacity was compensated by increased imports and use of LNG and oil. Post Fukushima, fossil fuels contributed about 90% of the electricity generation. Source: EIA Today in Energy, http://www.eia.gov/todayinenergy/detail.cfm?id=10391
it had excess capacity in both coal and gas-fired units and was making very significant investment in solar and wind systems driven by policy and incentives. The guaranteed tariffs to solar and
wind operators (part of the “Energiewende” policy that set the goal of 80 percent share of renewable energy in electricity generation by 2050) meant that power companies were obliged to first

Supply Side economicS and the need for energy diverSification
71The Future of Energy
absorb generation from these and run-of-the-river hydroelectric power plants.27 For the remaining generation, the way the German system evolved, included surprises. In the short term, due to the collapse of the EU Emission Trading Scheme, the higher costs of power from natural gas versus coal (Figure 21) favored higher utilisation of coal-fired units, many of which are the recently built high-efficiency supercritical units (those burning domestic lignite are called BoA, short for Braun-kohlenkraftwerk mit optimierter Anlagentechnik). The result is that natural gas units (albeit cleaner and more energy-efficient) have been squeezed out of the market. Even the recently commissioned high-efficiency CCGT units, such as the latest SGT5-8000H turbines by Siemens at Irsching, are highly underutilised as a result.28
In Figure 22, electricity demand over a typical week in Germany and the composition of
the supply is shown. To accommodate the large generation from wind turbines during that weekend, energy companies scaled back generation from black coal and natural gas since these fuels are imported and more costly. To optimally reduce overall costs, power plants using them are the first to be scaled back independent of conversion efficiency. Also, grid connections to neighboring countries allow Germany to export excess generation (shown in green in Figure 22), which was substantial and comparable to the sum of wind and solar generation throughout the week. Integration at the system level allows Germany to maintain energy security and export excess generation.
Germany has taken a bold step towards zero-carbon generation by promoting renewables and renouncing the option of nuclear power. The initial transformation towards renewables has
Figure 21: Development of Clean Dark and Spark Spreads in Germany (2013-2015)
The curves show the evolution of the clean dark spread (black) and clean spark spread (blue) in EUR/MWh. The spreads are the difference between the price received for electricity produced and the cost of the natural gas (coal) needed to produce that electricity, including CO2 emissions (allowance) cost. If the spread turns negative (blue curve for gas) the power station loses money by operating. There is a growing divergence between clean dark and spark spread, making investments in coal power plants (relatively) increasingly attractivein recent years.Source: RWE29

Supply Side economicS and the need for energy diverSification
72 The Future of Energy
been achieved with a price tag in the form of the EEG surcharge. Germany, with its high-technology industry, ground-up activism by the municipal corporations and citizens, and willingness of the citizens to pay higher price for green energy, faces the near- and medium-term questions of whether the renewable subsidies can be phased away and whether the economy will be able to withstand the impacts of higher cost of electricity.30 Already, protests against high household energy costs have led to sweeping reforms of renewable energy laws to keep power prices from spiralling out of control.31 Not surprisingly, the reform of Germany Renewable Energy Act that entered into effect in August 2014 is going to address not only the problem of escalating costs by focusing on the most cost-effective technologies, but also improve the cost distribution among industrial and private consumers.
The US has historically obtained about 50 percent of its electric power from coal-fired units. The
boom in shale gas production has made natural gas-fired generation highly competitive since 2008. Serendipitously, the US had overbuilt CCGT capacity during 1995-2004 when gas was cheap, so in 2008 it was in a position to rapidly transition from coal to gas-fired units and reduce its coal-fired generation fraction to about 37 percent by 2012.33 (Also note that a GW capacity CCGT power plant can now be brought online in about 18-24 months and the regulatory requirements are fewer). As a result, the two goals – profit and reducing the carbon and environmental footprint – became aligned.
The examples of these three countries highlight the advantages of a diversified portfolio of generation, integrated systems and of maintaining excess capacity. Countries with large fuel reserves and/or overbuilt capacity have options and can exploit them quickly: the natural gas-rich US could make the transition from coal to gas overnight, whereas Germany could renounce nuclear power
Figure 22: Actual Electricity Generation in Germany by Fuel Source and Exports (during a Week in March 2013)
Source: Fraunhofer Institute for Solar Energy Systems (ISE)32

Supply Side economicS and the need for energy diverSification
73The Future of Energy
in response to public pressure and go back to a higher fraction of coal-fired generation. Germany could equally well have increased gas-fired generation but due to prevalent market conditions expanded coal because it is the much cheaper option. Similarly,overbuilt capacity allowed Japan to substitute nuclear by fossil fuel systems in a short time in response to a crisis.
However, in a carbon-constrained world, the question is how countries starting with distributions similar to those shown in Figure 18 can accelerate the transition to carbon-neutral systems. Installations of wind and solar systems are growing and wind is now price competitive with natural gas on total energy generated ($/kWh) basis (see, for example, the analysis of levelised cost of generation by EIA34). Nevertheless, the challenge of integrating intermittent and fluctuating generation from solar and wind, real-time management of economics of different systems and the long experience with and investment in existing fossil fuel-based systems makes the transition difficult. Countries therefore maintain the full diversity of generating options to ensure energy security under rare, disruptive events and integrate renewable generation in small increments to ensure reliability of supply at each step. Below are examples of three countries – Brazil, Canada and Denmark – which have the resources to follow credible roadmaps towards zero-carbon systems while preserving energy security and yet have not stopped installing and using fossil fuel-based units.
Brazil generates about 80 percent of its electricity from hydro, and a large fraction of these projects are reservoir based.35 It can therefore integrate very substantial amounts of solar and wind energy into the grid, with hydro providing backup and stability. So it should come as no surprise that the availability of inexpensive backup power from hydro allowed a large number of wind farms to win bids at the annual energy auctions at rates that made bids from coal- and gas-based plants less competitive. The government, however, wants
to maintain a diverse portfolio for times when the wind does not blow, there is a year with low rainfall, or in the event of any other emergency. It thus revised its rules for energy auction starting in 2013 by creating different categories of plants so that hydro and fossil fuel-fired plants do not compete against wind to ensure development of all three.36 New installations of CCGT plants that provide additional generation capacity for meeting peak demand and as backup to renewables have also been facilitated by the linking of the natural gas pipelines in the northeast and southeast by the Southeast Northeast Integration Gas Pipeline (GASENE) in March 2010.37 (The GASENE pipeline will also reduce the amount of natural gas that Brazil imports by transporting gas from new fields in the Campos Basin to Rio de Janeiro). Adding to this mix, Brazil plans to enlarge its nuclear power fleet, starting with the 1,350 MW Angra-3 reactor that is expected to come online in 2016, as an important part of its diverse portfolio to ensure long-term energy security and to meet its growing demand for electricity.
Brazil could provide an example of an emerging economy that is rich in fossil fuels and yet chooses to meet its electric demand through a combination of hydro, nuclear, solar and wind systems. Achieving this would require significant investment in the transmission grid. Or it can continue with the current policy of opportunistically installing CCGT (and even coal) plants near demand centres along with hydro, wind and solar. The question for the future, assuming a continued demand growth of about seven percent per year as seen over the last decade, is if the public will advocate for a mix including significant fossil fuel-based generation that results in a lower tariff or whether the public will be willing to pay higher rates and require utility companies to work towards a zero-carbon system and, at the same time, maintain underutilised fossil fuel-based capacity to be used only for backup to guarantee high-quality reliable power. Brazil has the resources and the revenue from growing oil exports to try the bolder approach, similar to what Germany is trying

Supply Side economicS and the need for energy diverSification
74 The Future of Energy
under a different economic, social and resource environment.
Canada presents a different case study. It obtains about 60 percent of electricity from hydro and has vast untapped hydroelectric potential concentrated in British Columbia, Ontario and Quebec, whereas Alberta has large deposits of coal, gas and tar sands. The electric power grid in each state is mostly oriented north-south, so it is much easier to export power to the US than to even a neighbouring state. As a result, for example, Quebec cannot easily export power to its neighbours or further develop its hydro potential in response to demand growth in other states without significant investment in an east-west transmission grid. Ontario, with a diverse portfolio, had previously decided to eliminate coal-fired generation by 2014 (in which it has been successful) and is investing in CCGT, hydroelectric and wind projects. It has also recommissioned mothballed nuclear reactors. Alberta is modernising its coal-fired units. Overall, Canada is therefore consuming less coal but the fall in coal production is much less. The savings in coal that used to be consumed in Alberta and the coal that used to be transported from Alberta to Ontario is now being exported to Asian markets. Thus, while Canada is making serious efforts to reduce its carbon footprint in the power generation sector, it is at the same time capitalising on the opportunity to export the “saved” coal to be burned elsewhere. Will this story be repeated by other countries with multiple fuel options as they transition away from coal-fired generation? The answer most likely is yes, as long as China and India continue to rely on imported coal.
Lastly, the well-publicised success story of wind-power in Denmark is considered, which in 2013 obtained almost 30 percent of its electricity from wind, a percentage that has only been growing.38
This growth is, however, not occurring in isolation, as many favourable conditions exist. Denmark is, in fact, a good example of what needs to happen for renewable generation to become a significant
fraction of the total. First, Denmark has plenty of onshore and offshore wind resources with a country average turbine load factor of more than 25 percent. Second, it has two pioneering state-of-the-art turbine manufacturing companies, Vestas and Siemens Wind Power, that are creating new opportunities with the development of high-capacity onshore and offshore systems. Third, the integration of wind is facilitated by the Danish grid being part of the Scandinavian grid, which allows fluctuations in wind energy to be balanced by hydro generation in Norway and Sweden and nuclear power from Finland and Sweden. Fourth, there is active electricity trade with Germany, Sweden and Norway, providing an outlet for excess generation from wind. Wind power has been effectively integrated into a larger, well-integrated system. Fifth, Denmark takes climate change very seriously and has formulated a very aggressive Energy Strategy 2050,39 with the target of full phase-out of fossil fuels for electricity and transport purposes by 2050. It strongly supports aggressive reductions of greenhouse gas emissions in international meetings and is developing a detailed implementation plan to meet its zero-carbon goal. Lastly, the public is very supportive of wind farms in their backyards and is willing to pay a higher price for electricity to promote them. Looking ahead, it will be instructive to see how, given all the favourable conditions, it replaces the current share of generation by fossil fuels (about 45 percent of the electricity comes from coal and another 20 percent from natural gas) by low-carbon options.
The Future of Nuclear PowerNo discussion on power generation and a zero-emission economy is complete without a peek into the crystal ball of nuclear energy. The legacy of the Three Mile Island and Chernobyl accidents, and the recent meltdown at the Fukushima Daiichi plant, have created very significant setbacks to the growth of nuclear power. The challenges are largely economic, relatively high-cost of new builds in the absence of a carbon tax, and public

Supply Side economicS and the need for energy diverSification
75The Future of Energy
perceptions. Even if one makes a convincing case that modern generation III and III+ reactors are overdesigned and safe, the public is not convinced that the cadre of operators are well trained in safety and security procedures and the utility companies sufficiently well-motivated (regulated) to not cut corners vis-à-vis operations and maintenance during the lifetime of the plant. Such a visceral lack of trust by the public played a very significant role in forcing the German government to decide to shut down all nuclear reactors by 2022.
Further, the global public is wondering who can be trusted if even the Japanese and Germans operators and utility companies cannot be trusted to follow safety and security procedures. They question the basic premise that a workforce that is adequately steeped in a culture of safety and security can be trained and maintained globally. Lastly, there is the additional issue of waste disposal, for which technical options exist but the public is not convinced of their long-term viability and safety. In short, they do not want reactors or waste-disposal sites “in their backyard.”
Addressing all the safety, security and liability concerns has contributed very significantly to price escalation and delays in construction.40 As a result, nuclear power and nuclear industry in 2013 has mostly grown in four countries in which government-controlled companies play a major role – Russia, China, India and South Korea. A number of countries such as the UAE, Turkey, Vietnam, Egypt and Saudi Arabia are planning or constructing their first reactors; nevertheless, large-scale growth of nuclear power worldwide remains uncertain. Without significant growth of nuclear power, the remaining near-term options to transition to a zero-carbon economy are increases in efficiency, terawatt-scale installations of hydro (with a total potential of about two TW of which about one has been realised), solar and wind, and fossil fuel-fired plants with carbon capture and storage.
Cost of ElectricityOne must, in addition to an analysis of the fraction of energy generated by the various fuel sources as shown in Figure 18, discuss the cost of electricity to the public. Household electricity prices (in Euro cents/kWh and including all taxes) in European countries are shown in Figure 23 for the second semester of 2013.41 A comparison of the 2013 prices in US cents/kWh for major economies is shown in Figure 24. It is evident from these figures that the public in countries that take climate change seriously are willing to live with (or at least experiment with for the time being) higher cost of electricity. Three countries that strongly support measures to reduce emissions of greenhouse gases – Denmark, Germany and Spain – have the highest prices. Their experience suggests that the sustainable cost of electricity with about 30 percent renewable generation is between $0.3-0.4/kWh. Environmentalists contend that this is indeed the true sustainable cost of electricity, and if fossil fuel-based generation is cheaper, it is because it is subsidised and because externalities (such as climate change, environmental and health impacts) have not been accounted for.
Can all countries afford a higher price of electricity in a range of $0.3-0.4/kWh? As discussed earlier, developing countries without large reserves of fossil fuels are already facing a dilemma: Should they follow the fastest road to development using imported fossilfuels and ignore impacts of emissions, or should they pursue slow growth that is based on more costly renewable generation but one that is sustainable in the long run? Initially and in the near term, they are more likely to continue to rely on fossil fuels and may be unwilling or unable to afford the additional costs of solar and wind systems, or they may not have an adequate transmission grid or control systems to integrate renewables. They may also be willing to accept the environmental consequences of using fossil fuels. For instance, very few coal-fired plants in India have scrubbers to limit emissions of even SOx and NOx. Internally, they can get

Supply Side economicS and the need for energy diverSification
76 The Future of Energy
Figure 23: Cost of Electricity for Households (Inclusive of Taxes) in Various European Countries (Euro cents/kWh) for the Second Semester of 2013
Source: European Commission, DG Energy

Supply Side economicS and the need for energy diverSification
77The Future of Energy
Figure 24: Comparison of the Average Price of Electricity (Including All Taxes) in Europe and Select States in the US (US cents/kWh) (2013)
Source: EIA, http://www.eia.gov/todayinenergy/detail.cfm?id=18851

Supply Side economicS and the need for energy diverSification
78 The Future of Energy
away with this option because most of these countries have growing and restive populations demanding fast growth as their highest priority. In the medium to long term they may be forced to close down coal-fired plants before the investment has been fully recovered (coal plants have a 30-50 year life) in a carbon-constrained world if the public rebels against environmental pollution or the government is unable to afford adequate supplies of imported fossil-fuels as indigenous/conventional reserves are exhausted and international prices continue to rise. These challenges pose a constant threat to energy security and achieving a balance between the two strategies in a fiscally strapped environment is not easy. In less than ideal conditions, either strategy could easily fail and undermine their investments and development. Independent of the strategy they choose, developing countries also need to plan for impacts of climate change that are expected to be large, especially for those countries lying within the tropics. In short, lack of energy and climate security could accelerate the many other serious challenges they face to create the “perfect storm.”
Serious Challenges to Integration of Solar and Wind SystemsHere are two examples to illustrate why integration of wind and solar systems into the grid above a certain percentage poses an economic challenge and requires special enabling circumstances. These examples also highlight the observation that if significant reservoir-based hydro or nuclear capacity does not exist and fossil fuel-fired plants are used for backup, reductions in greenhouse emissions will continue to be limited.
Consider a grid-connected community in which every household has installed solar photovoltaic (PV) systems that under net-metering makes their electricity bill zero. The utility company then has no revenue generation from this community. Its function is to absorb all the extra production from solar during the day and supply backup
power (largely from fossil fuel-based generation) during the times when there is no sunlight, and to do this without any compensation. To survive economically, the utility company needs to export the extra power to other communities during the day and/or charge all customers a connection fee for providing backup power. Assuming that on average there are six hours of sunshine in a day, to absorb the extra power generated by the enlightened community would require the utility company provides this power to another two or three similar communities that do not have any solar installations. Furthermore, the company would also need to maintain the original fossil fuel-fired generation capacity as “backup” to cover all the non-daylight hours and cloudy days without sufficient PV generation. Charging for these backup services, either on a per kWh basis (which amounts to negating the net-metering agreement) or as a fixed monthly connection charge would increase the cost to the consumer. In this ideal scenario, even with only about a third of the people installing solar PV systems, net-metering would not be sustainable and utility companies would need to charge a higher tariff to survive.
Off-grid solar and wind systems are an invaluable resource for communities that today have no electricity. However, as their expectations grow beyond low-power applications (solar lanterns, LEDs, fans, battery chargers) to fully switched systems, solar power or small wind turbines with battery storage become too expensive. As mentioned earlier, even when solar PV and wind systems become cost competitive, storage/backup remains the key hurdle to large-scale deployment.
Many of these issues are already affecting the market. The rising shares of renewable generation and characteristics of conventional generators are already challenging the usual business models of power companies at various levels. For instance, Europe is discussing establishing a capacity market for power generators that are severely impacted by current market conditions. The idea is to

Supply Side economicS and the need for energy diverSification
79The Future of Energy
compensate power plants with (too) low load factors for providing capacity, therefore making them financially viable for the long term. The markets would be setup via auctions; the first such auction by the UK power market was held in December 2014.42
The second example is Denmark, already discussed above. It, as well as Norway, Sweden and Finland, can continue to install more wind capacity because they are part of the larger Scandinavian grid. Hydro generation from Norway and Sweden, and nuclear from Sweden and Finland, can provide low-emissions backup. Also, Denmark can trade electricity with Germany. Other possible region where conditions for such integration exist are in countries of former Yugoslavia (Slovenia, Croatia, Serbia, Bosnia and Herzegovina, Kosovo and Montenegro) and the region around Austria and Switzerland, since they have large hydropower capacity and an interconnected transmission grid. The tough question, however, is can such prototypes of low-carbon systems be reproduced globally? The answer is yes for regions with large hydroelectric (or CCGT) capacity and for regions in which countries (provinces) are willing to cooperate, build an interconnected grid and agree on a common, reasonable tariff structure. In the absence of cooperation, countries with large baseload generation capacities can blackmail those with mainly solar and wind systems. Unfortunately, such favourable conditions of trade and cooperation do not exist in the most populous continent with the highest growing demand for energy – Asia. Even in the case of Denmark, it will be interesting to see how, having demonstrated 30 percent integration of wind, it replaces its coal and gas-fired generation, which today provides about 65 percent of the electricity, without further large increases in the tariff. Will Denmark retire its fossil fuel-based capacity if Norway develops its wind resources and offers to export more power to Denmark? More generally, will countries even within the European market be willing to accept long-term reliance on other countries for the majority of their electricity?
Potential Game Changing TechnologiesWhat novel technologies can help overcome current limitations of energy systems and address climate change? Below are brief mentions of five amongst many (see Table 1.6 and section 7 in WEO 2013), which are likely to be low probability possibilities in the nearterm, but may provide large-scale options in the medium to long term.
Batteries for electric Vehicles: The point at which electric cars are expected to become economical and start gaining a market share is when the price of lithium-ion (or equivalent high-performance rechargeable) batteries comes down from the current $500/kWh to about $100/kWh. The payoffs of an affordable battery are so large that venture capital is supporting many start-ups with a wide range of technologies. But the technological challenges remain equally large.43 Large-scale transition to electric vehicles will shift the burden of zero-carbon economy to the electricity generation sector.
A hydrogen economy: If hydrogen can be produced cost-effectively from non-fossil sources (bio-inspired or by electrolysis using inexpensive electrodes and electricity generated by wind and solar systems), then it can be used for both power generation and transport and also for producing hydrocarbons. Achieving such industrial-scale production, however, needs major technological breakthroughs that are unlikely in the near or mediumterm.
Carbon capture and storage (CCS) on gigatonne scale from large point sources such as fossil fuel-fired power plants would allow them to become part of the low-emissions generation mix. For CCS to become the norm, breakthroughs are needed for cost-effective technologies for separation of CO2 from flue gases emitted by conventional coal and gas-fired power plants and from syngas in case of integrated gasification combined cycle (IGCC) plants. In addition, extensive risk analysis and characterisation of each storage site needs to be done. Even when these hurdles are overcome

Supply Side economicS and the need for energy diverSification
80 The Future of Energy
there will be an economic and environmental cost: The additional cost of CCS is expected to double the cost of electricity even in regions with nearby storage sites and an extensive network of pipelines will need to be built to transport the CO2.
The fourth, and most likely long-term, innovation is in situ gasification for the utilisation of coal.44
Breakthroughs in technologies for controlling the underground burn and mitigation of environmental impacts would open up new large resources that would otherwise not be cost-effective. Produced syngas would fuel IGCC power plants, which have lower carbon intensity, and the separation of greenhouse gases from syngas and exhaust gases is easier. The overall environmental impacts of in situ gasification could potentially be less, since production would not involve strip mining or processing of coal, and much less water will be needed. One has to, however, ensure that the many toxic substances such as phenol and heavy metals left behind underground after the burn do not migrate and pollute aquifers. While many countries with large coal reserves/resources such as China, India, South Africa, New Zealand and Australia are pushing such unconventional technologies, especially after the success of deep horizontal drilling and hydraulic fracturing techniques leading to cost-effective production of shale gas and oil, the prospects of their large-scale implementation remain uncertain.
The last technology to highlight is the transmission grid that needs to be modernised and evolved towards a smart grid. The ultimate goal of a smart grid is incorporation of four novel characteristics: Sensors monitoring, in real time, the performance of the grid and energy utilisation along the entire network and at the load; information flow in both directions from control centres to end-users and back; accessible controls at the load to manage demand; and the ability to seamlessly integrate distributed, intermittent and fluctuating generation (solar and wind). Development of smart grids poses technological, financial and social challenges. Low-cost and robust monitors
need to be developed for mass deployment at all levels of the grid, of which smart meters are the first step. Control (SCADA) systems to collect, transmit and integrate data securely and process it in real time need to be developed as well as the human resources to manage and operate them. Lastly, the end-users have to allow dispatch centres and utility companies cyber access to their home systems to control load (raising serious legal and emotional issues of privacy, control, accidents and abuse) and to manage demand in exchange for lower rates, which realistically could be much higher than current rates due to the additional instrumentation needed and its management, maintenance and operation. Research and prototype development of these technologies has begun, but large-scale implementation is not expected in the nearterm.
Conclusions
A diverse portfolio of energy sources, supplies and technologies are being pursued by all countries to address their energy security needs and to counter price volatility and possible disruptions in supply. In addition to a discussion of evolving supply and demand, some features common to countries that have large renewable generation and stringent climate change mitigation policies have been abstracted. The key features examined and highlighted in this study include:
Fossil fuels will remain the backbone of energy systems for at least the next 20-30 years. In addition to large conventional reserves of coal, oil and natural gas, there exist extensive unconventional resources. The technologies to exploit them are being steadily developed.
Exports of coal and natural gas are dominated by very few countries. Importing countries seek to establish a diverse portfolio of suppliers, but many have established long-term contracts with one or two suppliers due to geographic or economic benefits. Stable spot market prices and the development of coal ports and LNG terminals

Supply Side economicS and the need for energy diverSification
81The Future of Energy
allow countries to maintain a larger portfolio of suppliers.
It is unlikely that there will be a significant competitor to oil for transportation in the near or medium term. Gains in efficiency (high mileage cars and hybrids) and an increase in the number of vehicles powered by natural gas will be countered by the increase in the number of vehicles on the roads and total miles driven. Significant penetration by electric cars is unlikely in this same time period. Thus, oil producing companies and exporting countries do not see a threat to their market in the near or mediumterm.
Countries that earn a significant fraction of their revenues from the export of oil and gas have not been able to diversify their economies.
The success of shale gas and oil in the US and Canada is unlikely to be duplicated in other countries in the short term. China is the most likely country to make the investments in the short run. It, however, needs to develop the required infrastructure and partner with international companies to repeat the North American success story. In the near term, new producers (LNG from conventional reserves in Australia, Tanzania and Mozambique and pre-salt oil from Brazil) are best poised to help meet the growing demand.
The future of nuclear power remains very uncertain. Most of the growth is projected to be in four countries – China, India, Russia and South Korea – with state owned or supported nuclear power companies. Many more countries, such as the UAE, Turkey, Vietnam and Egypt, are on their way to joining the nuclear club, raising additional concerns of safety and security.
There continue to be steady incremental improvements in energy efficiency, both in energy generation and in use. As a result, developed nations with stabilised populations and peaked primary energy demand are reducing their energy usage, energy intensity and carbon footprint.
The installation and integration of wind and solar systems without government subsidies is a very significant addition to the cost of electricity due to the capital costs, needed enhancements to the grid and the cost of backup. With backup provided by existing hydroelectric and gas turbines, countries can generate up to about 30 percent of the electricity from wind and solar but at a higher average cost of about $0.35/kWh. Lifecycle cost analyses of fossil fuel-based generation show that this is the true cost of electricity and that current rates are cheaper only because external costs (pollution, climate change and environmental impacts) have not been adequately accounted for.
Countries with very favourable incentives for the development of wind and solar power, for example Denmark and Germany, have attained significant capacity. For these to be sustainable without subsidies, the public has to be willing to pay a higher tariff for electricity, which it seems to be.
Countries which generate a large fraction of their electricity from wind and solar (for example, Denmark and Germany) are part of a larger grid and have active trade in electricity with their neighbours that significantly helps balance supply and demand. A well-connected grid, large reservoir-based hydroelectric generation and gas turbine-based generation capacity facilitates the integration of utility-scale solar and wind plants. Such integrated systems provide a credible path for evolution to zero-carbon systems.
Industrialised countries have overbuilt capacity of power generation spread over multiple fuel sources. This excess capacity provides resilience against volatility in price of fossil fuels and against disruptive consequences of disasters such as Fukushima in 2011. Developing countries do not have this flexibility, as demand exceeds supply by a large amount. Developing new capacity is already limited by the cost of the plant and the investment required to build and maintain the enabling infrastructure and the human resources. Developing the human resources to operate and

Supply Side economicS and the need for energy diverSification
82 The Future of Energy
maintain increasingly complex integrated systems is essential and takes significant time. They need technical and financial assistance to attain energy security and develop low-carbon systems.
The world is faced with an enormous challenge – to provide the anticipated nine billion people with 21st century opportunities in an environmentally responsible and sustainable manner. While
technological innovations are the default hope, social responsibility and lifestyle changes leading to efficient use of resources have an equally large role to play. Nature is being pushed to, and in many cases beyond, limits of sustainability. The impacts are long term, and in many cases, such as loss of species and desertification, are irreversible. The decisions made in this century will impact life on earth for centuries to come.

Supply Side economicS and the need for energy diverSification
83The Future of Energy
Endnotes
1. Jan Steckel et.al. “Development without energy? Assessing future scenarios of energy consumption in developing countries”, Potsdam Institute of Climate Impact Research, http://www.pik-potsdam.de/members/steckel/publications/development_energy_new.
IIASA [International Institute for Applied System Analysis, “Global Energy Assessment”, Chapter 2 presentation slides, http://www.iiasa.ac.at/web/home/research/Flagship-Projects/Global-Energy-Assessment/GEA_Chapter2.pdf.
2. United Nations, “The Kyoto Protocol”, http://unfccc.int/kyoto_protocol/items/2830.php. 3. IEA [International Energy Agency], “World Energy Outlook 2013 Factsheet”, 2013, http://www.iea.org/media/files/WEO2013_
factsheets.pdf. 4. REN21 Renewable Energy Policy Network for the 21st Century, “Renewables Global Status Report 2013”, 2013, http://www.
ren21.net/portals/0/documents/resources/gsr/2013/gsr2013_lowres.pdf .5. IEA [International Energy Agency], “World Energy Outlook 2014”, 2014, p. 351. 6. Statoil, “Energy Perspectives: Long-term macro and market outlook”, June 2013, http://www.statoil.com/no/NewsAndMedia/
News/EnergyPerspectives/Downloads/Energy%20Perspectives%202013.pdf. 7. BP, “Statistical Review of World Energy 2013”, \http://www.bp.com/content/dam/bp/pdf/statistical-review/statistical_review_
of_world_energy_2013.pdf.8. EIA [U.S. Energy Information Administration], “Quarterly Coal Report”, Release Date: Oct. 08, 2014, http://www.eia.gov/coal/
production/quarterly/. 9. Randy Schnepf and Brent D. Yacobucci, “Renewable Fuel Standards (RFS): Overview and Issues”, Congressional Research
Service, 2013, http://www.fas.org/sgp/crs/misc/R40155.pdf. 10. Worldometers, http://www.worldometers.info/cars/.11. EIA [U.S. Energy Information Administration], “Recent production growth from presalt resources increases Brazil’s total crude
output”, Today in Energy, Nov. 13, 2013, http://www.eia.gov/todayinenergy/detail.cfm?id=13771. 12. UITP, http://www.uitp.org/; UNEP, http://www.unep.org/transport/.13. Government of Norway, “The Government Pension Fund”, http://www.regjeringen.no/en/dep/fin/selected-topics/the-
government-pension-fund.html?id=1441.14. EIA [U.S. Energy Information Administration], “UAE country report”, http://www.eia.gov/countries/cab.cfm?fips=TC. 15. Dolphin Energy, “The Dolphin natural gas pipeline, Qatar Operations”, http://www.dolphinenergy.com/en/13/operations/
qatar-operations.16. Angela Neville, “Top Plant: Emirates Aluminium Smelter Complex (EMAL), Al-Taweelah, Abu Dhabi, United Arab Emirates”,
Powermag, Jan. 9, 2011, http://www.powermag.com/top-plantemirates-aluminum-smelter-complex-emal-al-taweelah-abu-dhabi-united-arab-emirates/?pagenum=1.
17. Reuters, “Saudi could see budget deficit next year, risks draining reserves –IMF”, Sep. 14, 2014, http://www.reuters.com/article/2014/09/24/imf-saudi-budget-idUSL6N0RP47K20140924.
18. D.K. Das, “Issues facing US Shale Gas exports to Japan”, Pipeline and Gas Journal (Dec. 2011), http://pipelineandgasjournal.com/issues-facing-us-shale-gas-exports-japan.
19. GIIGNL, http://www.giignl.org/publications.20. Reuters, “Many European LNG Terminals face idling, seek new activities”, Sep. 20, 2013, http://www.reuters.com/
article/2013/09/20/energy-lng-europe-idUSL5N0HF3KD20130920.21. ARI [Advanced Resources International], EIA/ARI World Shale Gas and Shale Oil Resource Assessment, 2013, http://www.adv-
res.com/pdf/A_EIA_ARI_2013%20World%20Shale%20Gas%20and%20Shale%20Oil%20Resource%20Assessment.pdf]22. David Jolly, “France upholds ban on hydraulic fracturing”, The New York Times, Oct. 11, 2013, http://www.nytimes.
com/2013/10/12/business/international/france-upholds-fracking-ban.html. 23. PlattsMcgraw Hill Financial, “Argentina’s Shale Gas holds promise, but better policies needed”, Experts”, September 25, 2013,
accessed January 11, 2014,http://www.platts.com/latest-news/natural-gas/washington/argentinas-shale-gas-holds-promise-but-better-21607352.
24. Jennifer Tomsen and Marc Davies, “Shale Gas in Asia: Significant Reserves, Substantial Challenges”, Bloomberg Law, November 1, 2014, accessed January 11, 2015, http://about.bloomberglaw.com/practitioner-contributions/shale-gas-in-asia-significant-reserves-substantial-challenges/.
25. The Federation of Electric Power Companies of Japan, “Graphical Flipchart of Nuclear & Energy Related Topics”, 2013, http://www.fepc.or.jp/english/library/graphical_flip-chart/__icsFiles/afieldfile/2013/06/13/all_english_2013_r1.pdf.

Supply Side economicS and the need for energy diverSification
84 The Future of Energy
26. This overbuilt capacity is much larger than required for scheduled and unscheduled outages and maintenance.The exact amount as a function of the share of renewable generation remains to be determined.
27. BMU [The Federal Environment Ministry, Germany], “Langfristszenarien und Strategien für den Ausbau der erneuerbaren Energien in Deutschland bei Berücksichtigung der Entwicklung in Europa und global”, Schlussbericht BMU - FKZ 03MAP146, DLR, IWES and IFNE, 29. März 2012, http://www.fvee.de/publikationen/publikation/?sb_damorder%5Buid%5D=4636&cHash=06b2c3f1ab6b2757a44b77db72802b87 .
28. Reuters, “E.ON’s Irsching plant in Bavaria to stay open – sources”, April 25, 2013, http://www.reuters.com/article/2013/04/25/germany-eon-irsching-idUSL6N0DC47N20130425.
29. RWE, “Forward Looking Statement(as of November 2014”), http://www.rwe.com/web/cms/mediablob/en/2620794/data/2620914/4/rwe/investor-relations/results-for-the-first-three-quarters-2014/RWE-Presentation-Q1-Q3-2014.pdf , Timera Energy, “A tough spread environment”, http://www.timera-energy.com/commodity-prices/a-tough-spread-environment/.
30. Bloomberg, “German Power-Price Swings Threaten Growth Engine: Energy Markets”, R. Morison and J. Mengewein, Oct. 16, 2013, http://www.bloomberg.com/news/2013-10-16/german-power-price-swings-threaten-growth-engine-energy-markets.html.
31. Reuters, “German cabinet set to approve flagship renewable energy reform”, M. Wacket, April 7, 2014, http://in.reuters.com/article/2014/04/07/germany-energy-idINL6N0MZ3EL20140407.
32. ISE [Fraunhofer Institute for Solar Energy Systems], Electricity production from solar and wind in Germany in 2013, Bruno Burger, (as of January 2014).
33. EIA [U.S. Energy Information Administration] ,http://www.eia.gov/tools/faqs/faq.cfm?id=427&t=3. 34. EIA [U.S. Energy Information Administration], “Annual Energy Outlook 2013”; http://www.eia.gov/forecasts/ieo/
pdf/0484(2013).pdf OpenEI [Open Energy Information], “Transparent Cost Database”, http://en.openei.org/apps/TCDB/.35. EIA [U.S. Energy Information Administration], “Brazil country report”, http://www.eia.gov/countries/cab.cfm?fips=BR. 36. Bloomberg, “Brazil Seeks Higher Power-Auction Rate to Spur Use of Coal, Gas”, St. Nielsen, April 13, 2013, http://www.
bloomberg.com/news/2013-04-12/brazil-seeks-higher-power-auction-rate-to-spur-use-of-coal-gas.html.37. Hydrocarbons-technology.com, “The Southeast Northeast Natural Gas Pipeline, Brazil”, http://www.hydrocarbons-technology.
com/projects/southeastnortheastga/.38. Denmark.dk [The Official Website of Denmark], “Wind energy”, http://denmark.dk/en/green-living/wind-energy/.39. IEA [International Energy Agency], “Energy Policies of IEA Countries, Denmark”, 2011 Review, http://www.iea.org/publications/
freepublications/publication/Denmark2011_unsecured.pdf.40. For example, the delays in the construction of the EPR reactors Olkiluoto-III (Finland) and Flamanville-III (France) by Areva.41. European Commission, DG Energy, “Quarterly Report on European Electricity Markets”, Volume 6 (July 2014).42. Timera Energy, “Commercial Implications of the UK Capacity market”, http://www.timera-energy.com/uk-power/commercial-
implications-of-the-uk-capacity-market/.43. See some examples of challenges to development of batteries for electric cars here: JCSER [Joint Center For Energy Storage
Research], “Scientific and Technical Need”, http://www.jcesr.org/research/technical-summary/. DoE [U.S. Department of Energy], “Batteries for Advanced Transportation Technologies (BATT) Program”, http://batt.lbl.gov/
home/. Kevin Bullis, “For Tesla Motors, Success Is All About the Batteries”, in: MIT Technology Review, Nov. 6, 2013, http://www.
technologyreview.com/view/521201/for-tesla-motors-success-is-all-about-the-batteries/. 44. E. Burton, J. Friedman and R. Upadhye, “Best practices in underground coal gasification”, draft, Lawrence Livermore National
Laboratory, https://www.purdue.edu/discoverypark/energy/assets/pdfs/cctr/BestPracticesinUCG-draft.pdf

85The Future of Energy
Enterprise Efficiency
Experiences of Brazil, Russia, India and South Africa
Vivan Sharan, Associate Fellow, Observer Research Foundation, India
Igor Makarov, Associate Professor, National Research University - Higher School of Economics, Russia
Louise Scholtz, Manager, Special Projects, Living Planet Unit, WWF, South Africa
Manisha Gulati, Energy Economist, WWF, South Africa
Inaiê Takaes Santos, Centre for Sustainability, FGV, Brazil


EntErprisE EfficiEncy
Experiences of Brazil, Russia, India and South Africa
87The Future of Energy
This report attempts to aggregate the resource efficiency experiences of businesses and industrial sectors in four emerging and developing countries. The efficient use of factor inputs in industrial production is a critical element of business responsibility, and in the case of resource-intensive industrial sectors, such efficiency is central. This report uses resource efficiency, particularly the use of energy resources in energy-intensive sectors, as a proxy for enterprise efficiency.
Since the global financial crisis began, the notion of business responsibility has gained prominence in public discourse. In contrast to the singular commercial objective of maximising shareholder wealth, the concept of business responsibility
Introductionfocuses on adding to stakeholder value. Therefore resource efficiency is an integral part of business responsibility. Moreover, efficient use of input resources like fuel and electricity creates greater resilience while coping with resource scarcity. It also lowers factor production costs, enhancing competitiveness of business and thereby benefiting stakeholders ranging from employees to consumers.
A 2012 study by an Indian sustainability advisory firm analysed the emission intensity performance of the 100 largest Indian and global companies over a period of time following the financial crisis.1 It found a strong correlation between better financial performance and lower emission
Source: India Market and Environment Report, Gtrade Carbon Ex Rating Services, 2012
Graph 1: Variation in Emission Intensities between the Largest Indian Companies and Global Companies, 2010

88 The Future of Energy
EntErprisE EfficiEncyExperiences of Brazil, Russia, India and South Africa
intensity in the case of both sets of companies. Moreover, it found that the emission intensity of the most efficient Indian companies was at par with that of the most efficient global companies (Graph 1). However, the variation (standard deviation) in performance among Indian companies was far greater than that observed in the case of global companies.
Extrapolating these results, it can be inferred that the scope for efficiency gains in energy-intensive industries, particularly those that lie towards the right of the bell curve, is large. Catalysing these gains would require alignment of a number of factors, including the prevailing domestic and international policy environment; business factors, such as factor input costs of production; industrial performance and energy efficiency benchmarks in relevant sectors; and other positive and negative externalities, including scarcity or abundance of resources, the price of produced energy, infrastructure availability and the efficiency of supply chains.
This report will closely examine experiences from India, Russia, Brazil and South Africa, four countries with a growing industrial base, a large number of transnational corporations and varying institutional frameworks. With a focus on the Indian example, the report seeks to present a synthesis of the industrial energy consumption policies in Brazil, Russia and South Africa. The objective is to draw meaningful suggestions for enhancing enterprise efficiency, based on variations between regimes; look at common opportunities for policy; and deconstruct the role of systemically important sectors in catalysing efficiency gains, by particularly focusing on analysis of a few Indian industrial sub-sectors.
Country Backgrounds
The industrial sector, which accounts for a large proportionate share of primary energy consumption, is likely to keep growing at a rapid pace in many parts of the emerging and
developing world. The United Nations Industrial Development Organisation has noted that “although industrialised economies account for nearly two thirds of world manufacturing output, developing and emerging industrial economies contribute the most to its growth. During the years of recession 2008-2013, the manufacturing value added of developing and emerging industrial economies grew by almost 5 percent per annum while the contribution of industrialised economies to global industrial growth was negative.”2
The four emerging and developing countries this report focuses on – Brazil, Russia, India and South Africa – are at different stages of economic growth and industrialisation. Brazil, Russia and India are at relatively similar levels of GDP (approximately $2 trillion), while South Africa is a smaller economy. The levels of per capita emissions, to an extent a function of the level of industrialisation or intensity of energy consumption in the industrial sector, are much higher in Russia and South Africa than in Brazil and India (Graph 2).
India is a developing economy, with a population exceeding 1.2 billion people. To sustain economic growth and simultaneously meet development targets, both its public and private sectors will need to respond to the systemic challenge of resource scarcity. Commensurate emphasis is needed on job creation for a vast labour force, infrastructure construction and the provision of basic social security for a large, uninsured and vulnerable population living below $2 a day.
Brazil and Russia are similarly sized in terms of population (Table 1). However, unemployment is a more pressing socio-economic concern in Brazil. The two countries also have very different demographic underpinnings, with a much larger younger population in Brazil, leading to greater potential for economic growth. South Africa is much smaller than the other three, but its employment challenge is no less urgent. With a low industrial base and low per capita energy consumption, India too has a commensurately

EntErprisE EfficiEncy
Experiences of Brazil, Russia, India and South Africa
89The Future of Energy
Source: World Bank Indicators (GDP – 2012, Emissions per Capita – 2010)
Graph 2: Per Capita Emissions and GDP (Brazil, Russia, India, South Africa)
Table 1: Key Metrics of Countries Analysed
Key Metrics Brazil Russia India South Africa
Population (Mid-Year, 2012, Millions) 193.0 143.2 1210.0 51.0
Unemployment Rate (%, 2012) 6.7 5.5 3.8 25.1
Economically Active Population (% Share) 68.6 53.0 53.0 35.4
Industrial Production (Preceding Year 2012 = 100) 97.3 102.6 102.9 102.0
Energy Consumption per Capita (kgoe, 2009) 1288.0 11249.0 400.0 1641.0
Source: BRICS Statistical Handbook, 2013
large unemployment burden.
In the case of most emerging and developing countries, perhaps especially those analysed in this report, energy efficiency is the lowest hanging fruit to achieve a low-carbon, sustainable and inclusive growth trajectory. Energy efficiency gains in the industrial sector in particular can be realised through an integrated resources management approach where government policies, industrial action and the operating environment are all aligned to achieve the goal of greater efficiency.
Indeed, it is incumbent upon large energy-intensive businesses and domestic energy sectors to realise energy efficiency gains in order to address resource scarcity and achieve global competitiveness.
Energy Consumption and Efficiency
IndiaWith an assumption of nine percent annual economic growth, it is projected that by 2031-32 India’s per capita energy consumption will

90 The Future of Energy
EntErprisE EfficiEncyExperiences of Brazil, Russia, India and South Africa
*Small hydro projects, solar, biogas, wind, urban and industrial waste powerSource: Ministry of Power, 2012
Graph 3: Installed Capacity of Power Generation based on Different Fuels, India, 2012
Source: Central Electricity Authority, Government of India (as on 30.04.2012)
Graph 4: Power Generated by Central, State and Private Sector as % of Total, India, 2012
43%
State Sector
30%
27%
Central Sector Private Sector
“increase by four to five times and power generation capacity would increase six-fold from 2006-07 level(s)”.3 A large proportion of the power generated will come from fossil fuels such as coal and gas. The Graph 3 shows the current energy mix with coal accounting for close to 57 percent of installed capacity, and coal, gas and oil accounting for over two-thirds of installed capacity.
Considering the impetus for expansion over the next few decades, a larger share of power generation will have to come from the private sector, currently accounting for less than a third of the total generation in the country (Graph 4). The private sector, to remain competitive, is more likely to install state-of-the-art industrial equipment for power generation. This would result in significant efficiency gains going forward. At present, Indian power plants have a low average net efficiency for power generation, emitting 0.8-0.9 kg/kWh of carbon dioxide.4
In India, the per capita Greenhouse Gas (GHG) emission without Land Use, Land-Use Change
and Forestry (LULUCF) was 1.7 tonnes of CO2 equivalent in 2007. With LULUCF, it was 1.5 tonnes per capita. While emissions per capita have increased since 1994, the emissions intensity of

EntErprisE EfficiEncy
Experiences of Brazil, Russia, India and South Africa
91The Future of Energy
Table 2: Sector Wise Emissions Growth, India, 2007*
Sector 2007 CAGR**
Electricity 37.80% 5.6
Transport 7.50% 4.5
Residential 7.20% 4.4
Other Energy 5.30% 1.9
Cement 6.80% 6.0
Iron & Steel 6.20% 2.0
Other Industry 8.70% 2.2
Agriculture 17.60% -0.2
Waste 3.00% 7.3
*The percentage emissions from each sector with respect to total GHG emissions without LULUCF ** Compound Annual Growth RateSource: Ministry of Environment and Forests, Government of India, May 2010
India’s GDP declined by more than 30 percent during the period 1994-2007.5 This is due to the rapid expansion of GDP from the liberalisation and globalisation of the economy, as well as efficiency improvements in emission-intensive sectors. Simultaneously, the sheer scale of expansion of the Indian economy has resulted in the fast growth of sectors/industries such as electricity, transport, cement, steel and construction, among others, as shown in the Table 2.
saving up to 25 percent of current energy use in the Indian industrial sector (Table 3).
BrazilHistorically, the income elasticity of electricity consumption in Brazil has been high – which has meant that electricity consumption has increased at a higher rate than income growth. Between 1970 and 2005, the average value was 1.67, reaching a maximum of 3.75 during the 1980s, when large electricity-intensive industrial projects came into operation and thermal energy was encouraged. Nevertheless, the recent trend for this parameter is downward. During 2000-2005 it reached 1.03.6 This decrease in the elasticity of electricity demand stems from more efficient use of electricity by industrial consumers, employing energy-saving methods, processes and equipment.7
Another factor that has contributed to lower relative consumption of electricity is price. As rates have grown well above inflation, consumers seek to reduce consumption to reduce spending. Graph 5 shows that in recent years energy intensity has remained relatively stable in Brazil, and specific sectors may even show an upward trend.
The Brazilian energy sector stands out for having a high share of renewable sources in its primary energy and electricity matrix (Graph 6). Currently, hydropower is responsible for 70 percent of the
Table 3: The scope for Increasing End Use Efficiency through Demand Side Management, India
Sector Potential (%)
Industry 10-25
Lighting 30-35
Commercial Buildings 50
Agriculture 40-45
Source: Annual Report, Bureau of Energy Efficiency, 2008
All of India’s coal-fired power stations use sub-critical technology, resulting in considerable efficiency losses. Moreover, the aggregate technical and commercial losses (AT&C) in the power sector are immense. Due to the poor financial health of state electricity utilities that are unable to maintain power distribution infrastructure and upgrade utilities, AT&C losses are currently above 35 percent. Energy efficiency can play a prominent role in addressing this challenge, and energy efficiency improvements through both supply-side and demand-side management are possible. Through demand-side management, for example, there is potential for

92 The Future of Energy
EntErprisE EfficiEncyExperiences of Brazil, Russia, India and South Africa
Source: Empresa de Pesquisa Energética, Ministry of Mines and Energy, 20128
Source: Empresa de Pesquisa Energética – EPE, 201410
Graph 5: Energy and Electricity Intensity, Brazil
Graph 6: Electricity Mix, Brazil, 2013
Electricity intensity (kWh/BRL (2010) Energy intensity [toe/1,000 BRL (2010)]
0
0.05
0.1
0.15
1970 1980 1990 2000 2010 2021
Hydro(70.7%)
Biomass(7.6%)
Wind(1.1%)
Natural gas(11.3%)
Oil products(4.4%)
Nuclear(2.4%)
Coal and coalproducts (2.6%)
total electricity supply, whereas biomass (mainly sugarcane bagasse) is responsible for 7.6 percent. Electricity generation in Brazilian power plants reached 570.025 TWh in 2013, 3.2 percent higher than in 2012. Final consumption reached 516.3 TWh, meaning that more than 15 percent of electricity produced was lost.9 The government sector accounts for around 86 percent of total
power generation in Brazil (which is even higher than that of India).
Although Brazil has a clean energy matrix when compared to international standards, it is worth noting that recent increases in the emission factor of the electricity sector has revealed a trend contrary to what should be pursued in light of emerging environmental and climate policies throughout the world (Graph 7). The average emission factor of the electricity consumed in Brazil was 96g CO2/kWh in 2013, whereas in 2011 this indicator had been three times lower. In 2014, the upward trend remained.
The Brazilian economy’s energy intensity is relatively low – it is approximately half as carbon-intensive as the US economy, 1.3 times lower than the European economy and a quarter that of the Chinese economy.12 Energy planning, which relied on optimistic projections for wind power and biomass in recent years, is likely to be reviewed due to the increasing share of thermal generation. The predominance of hydropower in Brazilian electricity generation also includes the risk that periods of drought will disrupt the hydrological cycle of watersheds in which the hydroelectric

EntErprisE EfficiEncy
Experiences of Brazil, Russia, India and South Africa
93The Future of Energy
RussiaFrom 2000 to 2007 Russia’s average annual GDP increase was 7.2 percent. It was based primarily on the extraction and export of fossil fuels, buoyed by high oil prices. According to estimates by the Ministry of Economic Development, a change in crude oil prices of $10 per barrel leads to Russian
Source: Ministry for Science, Technology and Innovation – MCTI, 201311
Graph 7: Electricity Emission Factor in Brazil (tCO2/MWh)
0.02
0.00
0.04
0.06
0.08
0.10
0.12
0.14
0.16
0.18
Jan-
06
Jun-
06
Nov
-06
Apr
-07
Sep
-07
Feb-
08
Jul-0
8
Dec
-08
May
-09
Oct
-09
Mar
-10
Aug
-10
Jan-
11
Jun-
11
Nov
-11
Apr
-12
Sep
-12
Feb-
13
Jul-1
3
Dec
-13
May
-14
Oct
-14
power plants are located. This means that energy supply diversification should be an important part of the country’s long-term energy planning. Moreover, Brazil’s National Confederation of Industry indicates that it is profitable to invest in energy efficiency for many sectors, according to the graph below.
Source: Confederação Nacional da Indústria – CNI, 200913
Graph 8: Cost of Energy Saved (BRL/MWh)
Mining
-meta
lStee
l
Chemica
l
Metallu
rgy
Others
Food a
nd
beve
rages
Paper
and p
ulp
Textile
Mining
- non
-meta
l
Ceramics
Smelting
36 55 59 60 61 73 74103 106
151
319
0
50
100
150
200
250
300
350
Marginal expansion cost - BRL 138/MWh

94 The Future of Energy
EntErprisE EfficiEncyExperiences of Brazil, Russia, India and South Africa
Source: BP Statistics 2014, World Development Indicators
Graph 9: GDP and Crude Oil Prices, Russia
0
20
40
60
80
100
120
0
500
1000
1500
2000
1991
1992
1993
1994
1995
1996
1997
1998
1999
2000
2001
2002
2003
2004
2005
2006
2007
2008
2009
2010
2011
2012
2013
GDP (billion 2010 dollars)
Crude oil prices (2010 dollars)
GDP growth of 0.4-0.5 percent (Graph 9). Russia possesses 5.2 percent of proven world oil reserves (8th globally) and 17.6 percent of proven world gas reserves (2nd globally). However, oil and gas production annual growth rates have decreased since the middle of the first decade of the 21st century. As a result, Russian economic growth has dramatically decelerated.
Russia’s oil sector is dominated by a few domestic firms. State-controlled Rosneft is the largest of them. This company continues to acquire energy assets all over the country. After the acquisition in 2013 of TNK-BP, the last significant market player with strong foreign participation, Rosneft became the largest public oil and gas company in the world in terms of volume of extraction and reserves.14
Electricity in Russia is generated primarily from fossil fuels (68 percent), but also by hydropower (20 percent) and nuclear energy (11 percent).15 Before 2008 the sector was dominated by the state monopoly Unified Energy System of Russia (RAO EES). Since 2008 large-scale reform of the sector has been carried out. Generating facilities were divided into wholesale companies, most of which were privatised. Some foreign companies, including the German E.On, the Italian ENEL and
the Finnish Fortum, also acquired some generating facilities. However, large players have continued to become larger; the share of state-controlled companies has increased, while the share of the independent players has decreased.16 All hydro projects are united under control of the company RusHydro, which is largely owned by the Russian government.17 All nuclear facilities are controlled by the state agency Rosatom.
The energy sector accounts for more than 70 percent of Russian exports18 and nearly 50 percent of its federal revenue.19 All attempts to diversify the economy have failed so far. The share of oil and gas in Russian exports has risen since the beginning of the century, although the income from exports of fossil fuels provided numerous opportunities to develop other sectors of the national economy. After passing from a planned to market economy Russia needs another transition – economic diversification.
Energy efficiency is a cornerstone of such a transition. Recognising this, in 2009, former Russian President Dmitri Medvedev declared a national goal to reduce energy intensity (of GDP) by 40 percent from 2007 levels by 2020. The state programme “Energy saving and energy efficiency

EntErprisE EfficiEncy
Experiences of Brazil, Russia, India and South Africa
95The Future of Energy
up to 2020” initiated simultaneously should lead to cumulative energy savings equal to 800 mtoe from 2011 to 2020.20 According to the World Bank and the Center for Energy Efficiency, investments of $320 billion in energy efficiency measures can save 45 percent of final primary energy consumption.21
Russian energy intensity began decreasing in 2000, and through 2008 decreased annually by five percent. About half of this decrease was due to structural shifts in the Russian economy as some Soviet energy-intensive sectors were substituted by services. A large share can also be explained by the modernisation of equipment.22 About a third of all energy in Russia is used for energy transformation and distribution (Graph 10). Given the dependence of the Russian economy on the extraction and processing of fossil fuels, this level is not extraordinary. However the volume of losses in the process of distribution (3.9 percent of total energy supply) is far above the level reported in developed countries.23 This gap is largely due to the deterioration of equipment in the Russian energy sector.
Source: International Energy Agency
Graph 10: Pattern of Energy Use, Russia 2000-2012 (ktoe)
800000
700000
600000
500000
400000
300000
200000
100000
2000 2001 2002 2003 2004 2005 2006 2007 2008 2009 2010 2011 20120
Power and heat productionEnergy industry own useIndustry
Oil, gas & coal processingLossesTransport
South AfricaSouth Africa is the second-largest economy in Africa (after Nigeria). It is also an energy-intensive economy with a high reliance on fossil fuels largely due to an abundance of coal. Coal accounts for 77 percent of the total primary energy mix and 95 percent of the electricity generation capacity in the country (Graph 11). The energy sector is the single largest source of GHG emissions, accounting for about 89 percent of the country’s total emissions.24 Eskom, the state electricity company, is responsible for electricity transmission and generates 95 percent of South Africa’s electricity.25, 26
South Africa is faced with the dilemma of simultaneously growing its economy and alleviating poverty, all the while improving efficiency of resource consumption – a situation similar to that of some of the other economies analysed in this study, such as India. South Africa’s energy consumption per capita is higher than the world average: 2.7 toe versus 1.8 toe.28 The South African industrial base was built on cheap electricity, and this has had consequences for energy efficiency. This is for two reasons. First, the

96 The Future of Energy
EntErprisE EfficiEncyExperiences of Brazil, Russia, India and South Africa
*Including biomass, geothermal and solarSource: Enerdata27
Graph 11: Power Generation by Source, South Africa
monetary value of energy savings did not justify investments in energy efficiency, or the pay-back period for interventions was extraordinarily long. Second, there are often limited opportunities to improve either the energy efficiency or the production process in electricity-intensive industries – such as aluminium smelters – based in the country.
Things have, however, begun to change in recent years. Low electricity tariffs, well below cost-effective levels, have led to poor investment decisions and a gross misallocation of the country’s economic resources. Consequently electricity tariffs have risen, causing a 78 percent increase in real electricity prices since 2008 (Graph 12).
Given that electricity is a key factor of production for South African industry, rising electricity prices have left industry with limited room to manoeuvre. It is compelling to pass on the price increase to the industrial consumer, as opposed to the voting population of household consumers. However, this causes a loss in industrial competitiveness. For export-focused industries such as metals and mining, output prices are set
according to international markets, and thus the industry is generally a price taker, competing on costs of production.
Liberalisation of the economy has meant a surge in imports of tradable products and has therefore limited industry’s ability to transfer electricity cost increases to the domestic market. The other option available to industry is to absorb the cost, eroding profit margins and invariably affecting shareholder investment decisions. Thus, industry has a strong financial incentive to save energy though greater efficiency.
Identifying Energy-Intensive Industries
This chapter identifies systemically critical industries across the four countries. Identification is based on indicators such as share of energy consumption, employment generation, share in gross capital formation, and share of total exports and investments. The objective is to identify industrial sub-sectors which are large energy consumers as well as important to each of the economies based on their individual needs

EntErprisE EfficiEncy
Experiences of Brazil, Russia, India and South Africa
97The Future of Energy
Source: Deloitte, 201229
Graph 12: Trend in Average Electricity Prices Realised by Eskom per kWh
and competitive advantages. These industries therefore represent the low hanging fruit for catalysing improvements in efficiency of energy consumption.
IndiaIndustry accounts for nearly half the gross capital formation (GCF) of the Indian economy.30 As a share of total GCF, the contribution of industry peaked at 56.2 percent in 1995-96 in the period since 1991. This sector has continued to allocate a significantly high share of its income to capital formation – a fundamental priority for the long-term growth and sustainability of the Indian economy (Table 4).
The manufacturing sector accounts for the highest share of industry GCF in India. Although India is one of the top 10 manufacturing economies in the world, India’s competitive disadvantage
Table 4: Gross Capital Formation in Industry, India
Share of Sectors of Industry in overall
GCF in Percent
2004-05 2008-09 2011-12
Mining 3.7 3.6 3.8
Manufacturing 34.1 26.8 27.9
Electricity 5.3 6.3 6.8
Construction 5.4 5.7 6.0
Share of Industry in GCF
48.4 42.5 44.4
Source: Economic Survey, 2012-13, Ministry of Finance, India
lies in the fact that its industrial economy has low-level technology, high input costs and poor infrastructure. India’s share in total manufacturing value added is a paltry 1.8 percent. Therefore India has fared better in the manufacture of medium- to low-technology products in labour-

98 The Future of Energy
EntErprisE EfficiEncyExperiences of Brazil, Russia, India and South Africa
Table 5: Key Efficiency Metrics for the Organised Manufacturing Sector, India, 2010-11:
Fuel Consumption as % of Total Output in 2010-11
Gross Value Added as a of Total Output in 2010-11
Total Emoluments as % of Total Output
Share of Interest to Total Output in %
4.2 17.8 22 10.6
Source: Economic Survey, 2012-13, Ministry of Finance, India
intensive sectors, and production has remained resource-intensive as illustrated in Table 5.
The share of the Gross Value Added of the manufacturing sector as a percentage of total output has declined from a peak of 24.9 percent in 1996-97 to 17.8 in 2010-11, indicating an increase in resource intensity of raw materials and other non-fuel inputs. High resource intensity has made the profitability of the sector considerably dependent on wages and interest rates.
The steel and cement sectors are two of the largest manufacturing sub-sectors in India. The steel sector contributes nearly two percent of Indian GDP, whereas India is the second-largest producer of cement in the world. Both sectors are systemically critical and are intrinsically linked to the growth of the Indian economy as core sectors.
BrazilIn 2012, the industrial sector31 in Brazil was responsible for 35 percent of final energy consumption (89 million toe). As presented in the graph below, within the industrial sector, specific sectors which deserve attention include foods and beverages production (27 percent), pig-iron and steel (19 percent), paper and pulp (11 percent), chemicals (eight percent), and non-ferrous and other metallurgical industries (eight percent).
According to the Brazilian Ministry of Labour, the manufacturing sector generated the largest share of employment in 2012, within which the food and beverages, textiles, chemicals, pulp and paper sub-sectors were some of the largest employers.
According to estimates from the Useful Energy Balance (BEU), the major portion of the technical potential for energy efficiency in Brazil lies in the residential, industrial and transport sectors. These together accounted for over 80 percent of final energy consumption in 2011. Considering the technical coefficients published in the BEU, it can be estimated that there is a technical potential of energy efficiency of approximately eight percent for the period 2012–2021.33 Under its National Electrical Energy Conservation Programme (Procel), Brazil’s National Confederation of Industry conducted an assessment on energy conservation potential in 13 industrial sub-sectors for which aggregated results are presented in Table 6.
It is worth noting that the foods and beverages, pig iron and steel, and paper and pulp sectors stand out for their share in final energy consumption, employment, energy intensity and potential for energy conservation.
RussiaIndustry35 takes the largest share of the total energy use and final energy consumption in Russia. Despite rapid industrial growth in 2000-2008 (more than five percent annually on average36), energy consumption in the industrial sector in 2008 was lower than in 2000, though in 2010 the level seen in 2000 was exceeded again. Half of all the energy used in industry is consumed by two sub-sectors – iron and steel production, responsible for 33 percent of total final energy consumption, and the chemicals and petrochemicals industry, covering 19 percent (without taking into account non-energy use).

EntErprisE EfficiEncy
Experiences of Brazil, Russia, India and South Africa
99The Future of Energy
Source: National Energy Balance 201332
Graph 13: Final Energy Consumption by Sector, Brazil
Table 6: Potential for Electricity Conservation in Selected Industrial Subsectors
Energy UsePotential (per year)
Sub-sectors with greatest conservation potential1,000 toe GWh
Motive power 2,032.4 23,640Steel Mining and quarrying Foods and beverages
Refrigeration 46.6 540Foods and beverages Chemical Textiles
Electric ovens 370.9 4,310Steel Non-ferrous metals Ferro-alloys
Electrolysis 191.4 2,230Non-ferrous metals Chemicals Paper and pulp
Lighting 60.2 700
Foods and beverages Textiles Mining and quarrying Paper and pulp
Other 2.4 30 Mining and quarrying
TOTAL 2,703.9 31,450
Source: Confederação Nacional da Indústria – CNI, 200934

100 The Future of Energy
EntErprisE EfficiEncyExperiences of Brazil, Russia, India and South Africa
Iron and steel
Chemical and petrochemical
Non-ferrous metals
Non-metallic minerals
Machinery
Mining and quarrying
Food and tobacco
Paper, pulp and printing
Other
19%
5%11%6%4%
6%5%
11%
33%
*Excluding energy sector and non-energy useSource: International Energy Agency
Graph 14: Break up of Energy consumption in Industry, Russia, 2012*
Non-metallic minerals’ producers consume 11 percent of all the energy used in industry, and enterprises specialising in machinery and food and tobacco each consume six percent (Graph 14).
Significant potential for reducing energy intensity lies in industry. Most of Russia’s industrial sub-
sectors are still less energy efficient than those in developed countries, as evidenced from consistently higher share of expenses on fuels and power in the prime cost of industrial production (given that energy prices in Russia are still much lower than in developed countries, this indicator actually underestimates the real gap in energy efficiency).
Taking into consideration share in total energy use, potential for energy savings and their structural relevance for the Russian economy, it is possible to identify three industrial sub-sectors which are of greatest interest in terms of catalysing greater enterprise efficiency. These sectors are outlined in Table 7.
South AfricaManufacturing, which is energy-intensive, is the second-largest contributor to the South African GDP at 15.4 percent, while mining and quarrying contribute five percent. Historically, mineral extraction provided the bulk of South Africa’s exports and jobs. However, due to a range of factors,37 its share of GDP has dropped from its peak in the 1970s, when it comprised one-fifth. Historically the South African industry’s competitiveness has been built on low electricity
Table 7: Some characteristics of Target Sectors
Sector Total energy use (excluding non-energy use of
fuels), mtoe, 2012
Share in total energy use, %, 2012
Share in GDP, %,
2012
Share in exports
of goods, %, 2012
Number of employed, thousand,
2011
Share of employed in industrial
sector,*** %, 2011
Energy 249.0* 25.2* 13,2 70.4 2253.1 16.9
Iron and steel 55.5 7.5 2.5 8.5 998.2** 7.5**
Chemicals and petrochemicals
27.6 3ю7 1.3 6.1665.9** 5.0**
*Excluding losses in the process of distribution** Employment in metallurgy and chemicals and petrochemicals is underestimated as it does not include such activities as extraction of metal ores and raw material for fertilisers. They are included by the Russian Statistical Service in the single group “Extraction of non-energy minerals” for which data is not detailed. Employment in these two activities can be crudely estimated at 300,000-400,000.*** Industrial sector includes extraction of minerals, manufacturing activities and manufacturing and distribution of electricity, gas and water.Sources: International Energy Agency, Russian Statistics Service, Federal Customs Service

EntErprisE EfficiEncy
Experiences of Brazil, Russia, India and South Africa
101The Future of Energy
tariffs. There are many factors that in the past38 had a bearing on the level and trend in electricity tariffs. A discussion on these is beyond the scope of this paper and it suffices to say that in 2006, South Africa had the lowest industrial electricity tariffs in the world. This had two broad consequences. First, South Africa became an appealing destination for investment in energy-intensive industries; second, the manufacturing industry in general became electricity-intensive.
The industrial sector consumed slightly over 65 percent of the final energy supplied in the country in 2009. Within the industrial sector, the
manufacturing industry – which includes various sub-sectors such as iron and steel, chemicals, non-ferrous metals, non-metallic minerals, pulp and paper, food and tobacco, and other unspecified industries – is the largest consumer of energy. It consumed 49 percent of the final energy supplied in the country in 2009. The largest sub-sector is iron and steel, which consumes 29 percent of the total energy used by the industry sector (Graph 15).
A 2011 study41 profiling 13 industries in South Africa in 2006 shows that basic metals (which includes iron and steel and non-ferrous metals), mining and quarrying and non-metallic minerals
Source: Department of Energy, Republic of South Africa, 201040
Graph 15: Energy Consumption by Industry, South Africa, 200639
Iron and Steel
Machinery
Mining and Quarrying
Non-ferrous Metals
Non-metallic Minerals
Non-specified (Industry)
Paper, Pulp and Printing
Textile and Leather
Wood and Wood Products
Chemical and Petrochemical
Construction
Food and Tobacco
27.4%13.8%
25%
0.9%
0.2%
0.1%
1.5%0.4%
16%
5%5%
0.2%
Table 8: Electricity intensity and output share per sector in South Africa, 2006
Sectors Electricity intensity GWh/$ million (PPP* adjusted) Ranking
Basic metals 1.095 1
Mining and quarrying 0.634 2
Non-metallic minerals 0.524 3
Agriculture and forestry 0.316 4
Paper, pulp and printing 0.207 5
* Purchasing Power ParitySource: Inglesi-Lotz and Blignaut 2011
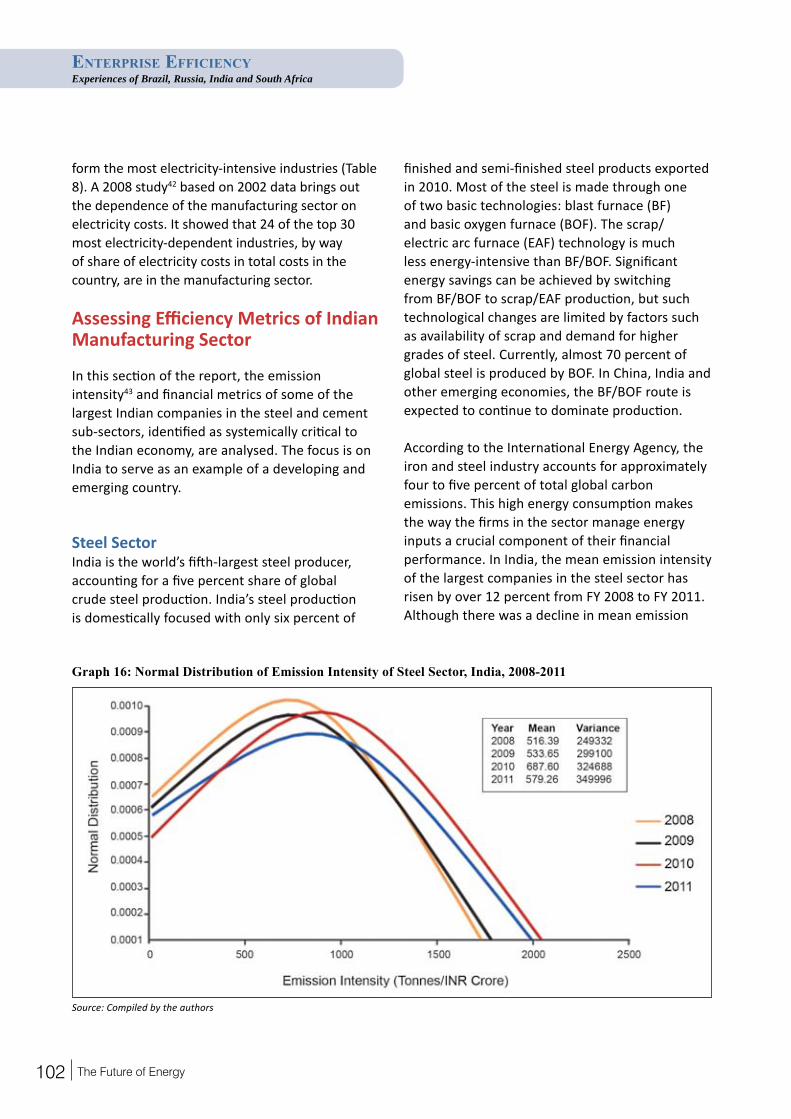
102 The Future of Energy
EntErprisE EfficiEncyExperiences of Brazil, Russia, India and South Africa
Source: Compiled by the authors
Graph 16: Normal Distribution of Emission Intensity of Steel Sector, India, 2008-2011
form the most electricity-intensive industries (Table 8). A 2008 study42 based on 2002 data brings out the dependence of the manufacturing sector on electricity costs. It showed that 24 of the top 30 most electricity-dependent industries, by way of share of electricity costs in total costs in the country, are in the manufacturing sector.
Assessing Efficiency Metrics of Indian Manufacturing Sector
In this section of the report, the emission intensity43 and financial metrics of some of the largest Indian companies in the steel and cement sub-sectors, identified as systemically critical to the Indian economy, are analysed. The focus is on India to serve as an example of a developing and emerging country.
Steel SectorIndia is the world’s fifth-largest steel producer, accounting for a five percent share of global crude steel production. India’s steel production is domestically focused with only six percent of
finished and semi-finished steel products exported in 2010. Most of the steel is made through one of two basic technologies: blast furnace (BF) and basic oxygen furnace (BOF). The scrap/electric arc furnace (EAF) technology is much less energy-intensive than BF/BOF. Significant energy savings can be achieved by switching from BF/BOF to scrap/EAF production, but such technological changes are limited by factors such as availability of scrap and demand for higher grades of steel. Currently, almost 70 percent of global steel is produced by BOF. In China, India and other emerging economies, the BF/BOF route is expected to continue to dominate production.
According to the International Energy Agency, the iron and steel industry accounts for approximately four to five percent of total global carbon emissions. This high energy consumption makes the way the firms in the sector manage energy inputs a crucial component of their financial performance. In India, the mean emission intensity of the largest companies in the steel sector has risen by over 12 percent from FY 2008 to FY 2011. Although there was a decline in mean emission

EntErprisE EfficiEncy
Experiences of Brazil, Russia, India and South Africa
103The Future of Energy
intensity in FY 2011, the variance of emission intensity rose by nearly eight percent. This means that alongside the decline in mean levels of emission intensity, the dispersion from the mean also increased.
In the graph below, it is clear that the largest companies – Tata Steel, SAIL and JSW Steel – command a significant proportion of total revenues of the firms assessed (over 77 percent) and are responsible for over 70 percent of the total GHG emissions in the sector. Revenues are seen to be positively correlated with emission intensity (as the upward sloping emission intensity trend line shows). However, this is largely because the relatively smaller companies exhibit erratic efficiency performance.
The varying level of emission intensity in the steel sector is not well explained by expenses on power and fuel as a percentage of revenue. This is because the trend line is distorted by a few outliers. It is natural for economies of scale to be a factor in terms of revenues generated. Larger
companies (such as JSW Steel, Tata Steel and SAIL) are able to acquire and run the latest technologies, and therefore spend much less on fuel and power than the relatively smaller companies (such as Nava Bharat Ventures and Jai Corp). Furthermore, the amount spent as a proportion of revenue on power and fuel varies considerably amongst the smaller companies, but the variation is smoother amongst the larger companies.
Cement SectorIndia is the second-largest cement manufacturer in the world after China, accounting for around six percent of total global production. The sector contributes over 1.3 percent of total GDP. There are over 150 large cement plants, with an installed capacity exceeding 230 million tonnes. According to the Indian Government’s inventory of GHG emissions, in 2007, 56 percent of cement sector emissions were from the industrial process and the rest from fossil fuel combustion. (The manufacturing process requires heat generation as well as electricity.) The energy required to produce
Source: Compiled by the authors
Graph 17: Revenue and Emission Intensity Trend of Steel Sector, India, 2011
0
400
800
1200
1600
2000
2400
2800
0
20000
40000
60000
80000
100000
120000
140000E
mis
sion
Inte
nsity
(tonn
es/C
rore
)
Revenue
Rev
enue
(IN
R C
rore
)
Emission Intensity Trend (Emission Intensity)
Jai C
orp Lt
d.
Nava B
harat
Ven
tures
Ltd.
Prakas
h Ind
ustrie
s Ltd.
Adhun
ik Meta
liks L
td.
Monne
t Ispa
t Ltd.
Jai B
alaji I
nds.
Ltd.
Uttam G
alva S
teels
Ltd.
Bhush
an S
teel L
td.
Jinda
l Stai
nless
Ltd.
Ispat
Indus
tries L
td.
Sesa G
oa Lt
d.
Jinda
l Stee
l & P
ower
Ltd.
JSW
Stee
l Ltd.
Steel A
uthori
ty of
India
Ltd.
Tata S
teel L
td.
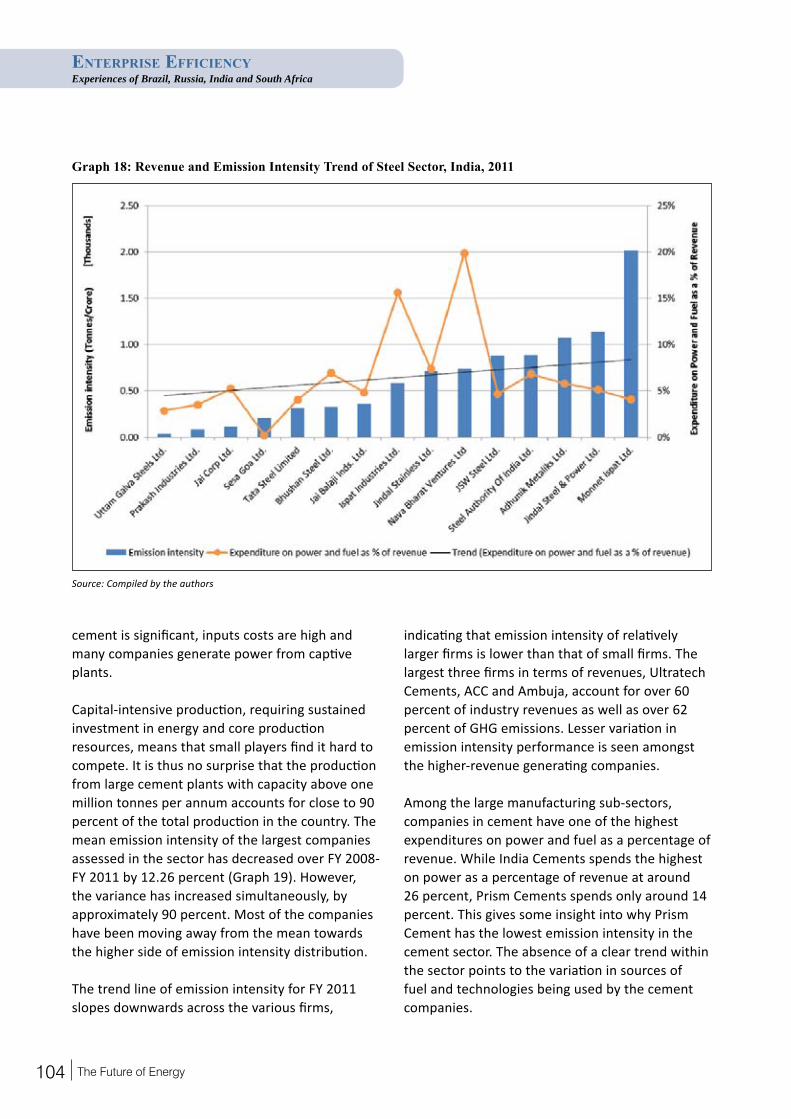
104 The Future of Energy
EntErprisE EfficiEncyExperiences of Brazil, Russia, India and South Africa
cement is significant, inputs costs are high and many companies generate power from captive plants.
Capital-intensive production, requiring sustained investment in energy and core production resources, means that small players find it hard to compete. It is thus no surprise that the production from large cement plants with capacity above one million tonnes per annum accounts for close to 90 percent of the total production in the country. The mean emission intensity of the largest companies assessed in the sector has decreased over FY 2008-FY 2011 by 12.26 percent (Graph 19). However, the variance has increased simultaneously, by approximately 90 percent. Most of the companies have been moving away from the mean towards the higher side of emission intensity distribution.
The trend line of emission intensity for FY 2011 slopes downwards across the various firms,
indicating that emission intensity of relatively larger firms is lower than that of small firms. The largest three firms in terms of revenues, Ultratech Cements, ACC and Ambuja, account for over 60 percent of industry revenues as well as over 62 percent of GHG emissions. Lesser variation in emission intensity performance is seen amongst the higher-revenue generating companies.
Among the large manufacturing sub-sectors, companies in cement have one of the highest expenditures on power and fuel as a percentage of revenue. While India Cements spends the highest on power as a percentage of revenue at around 26 percent, Prism Cements spends only around 14 percent. This gives some insight into why Prism Cement has the lowest emission intensity in the cement sector. The absence of a clear trend within the sector points to the variation in sources of fuel and technologies being used by the cement companies.
Source: Compiled by the authors
Graph 18: Revenue and Emission Intensity Trend of Steel Sector, India, 2011

EntErprisE EfficiEncy
Experiences of Brazil, Russia, India and South Africa
105The Future of Energy
Source: Compiled by the authors
Graph 19: Normal Distribution of Emission Intensity of Cement Sector 2008 - 2011
0.018
0.016
0.014
0.012
0.010
0.008
0.006
0.004
0.002
0.0000 500 1000 1500 2000
Year2008200920102011
Mean2123.432009.741868.581862.99
Year6637087776132556135261
2500 3000 3500
Emission Intensity (Tonnes/INR Crore)
Nor
mal
Dis
tribu
tin
Source: Compiled by the authors
Graph 20: Revenue and Emission Intensity Trend of Cement Sector, 2011
18000 4000
3500
3000
2500
2000
1500
1000
500
0
16000
14000
1200010000
800060004000
2000
0
Em
issi
on In
tens
ity(to
nnes
/Cro
re)
Rev
enue
(IN
R C
rore
)
Birla C
orpora
tion L
td
Orient
Paper
& Indu
stries
Ltd
Centur
y Tex
tiles &
Inds
. Ltd.
Madras
Cem
ent L
td.
Prism C
emen
t Ltd.
Shree C
emen
t Ltd.
India
Cemen
ts Ltd
.
Ambuja
Cemen
ts Ltd
.
ACC Ltd.
Ultratec
h Cem
ent L
td.
Revenue Emission Intensity (Tonnes/Crore) Trend (Emission Intensity)

106 The Future of Energy
EntErprisE EfficiEncyExperiences of Brazil, Russia, India and South Africa
Policy Drivers of Energy Efficiency
The systemic risks associated with climate change, coupled with pressures of competitiveness of production in the global economy, highlight the need for policies on energy efficiency, especially in industrial sub-sectors such as those identified by this report. Moreover, better energy disclosure practices can lead to improved accountability and encourage transparency across industry. This chapter aims to aggregate the main disclosure policies and energy efficiency policies in the four countries considered in this report.
IndiaIn attempting to respond to the dual challenges of resource scarcity and climate change, India made a voluntary commitment to reduce its emission intensity (of GDP) by 20-25 percent from 2005 levels by 2020 at the Convention of Parties meeting held in Copenhagen in 2009. This was largely to be met through
Source: Compiled by the authors
Graph 21: Revenue and Emission Intensity Trend of Cement Sector, 2011
energy efficiency gains. The National Action Plan on Climate Change released by the Prime Minister’s Council on Climate Change in June 2008 mandated the creation of eight missions to address climate change and resource scarcity in the country. The Council is also responsible for periodically reviewing and reporting on each mission’s progress. One such mission, which deals directly with energy efficiency policies and their implementation, is the National Mission for Enhanced Energy Efficiency (NMEEE). The Indian government has recognised that it is important to promote efficient energy use to simultaneously address resource scarcity and climate change. Building on the Energy Conservation Act, 2001, it has focused on the following energy efficiency initiatives:
Perform Achieve Trade Scheme: A market-based mechanism to enhance the cost effectiveness of improvements in energy efficiency in energy-intensive large industries, through certification of energy savings that can be traded.

EntErprisE EfficiEncy
Experiences of Brazil, Russia, India and South Africa
107The Future of Energy
Market Transformation for Energy Efficiency: It is a scheme to accelerate the shift to energy-efficient appliances in designated sectors through measures which make the products more affordable. Specific components under this programme include project preparation to utilise external funds for energy efficiency.
Efficiency Financing Platform: The NMEEE mandated the creation of mechanisms that would help finance demand-side management programmes in all sectors by capturing future energy savings under an Energy Efficiency Financing Platform. The Energy Efficiency Services Ltd. has been created as a corporate entity to provide market leadership.
The Framework for Energy-Efficient Economic Development: This has been set up to achieve the dual objectives of providing risk guarantees, etc., to lenders such as banks and venture capital funds, and provide incentives for Central Public Sector Undertakings to pursue energy efficiency projects.
Disclosures Framework
In the Companies (Disclosure of Particulars in the Report of Board of Directors) Rules, 1988, under the Companies Act, 1956, India, it is stated that “[e]very company shall, in the report of its board of directors, disclose particulars with respect to A) conservation of energy, B) technology absorption.” The Rules make it mandatory for companies which are part of energy-intensive industrial sectors such as steel and cement to disclose their total energy consumption and energy consumption per unit of production. The format for reporting is given in Table 9 in the “Form for Disclosure of Particulars with respect to Conservation of Energy” (“Form A”):
Within the voluntary reporting domain, the National Voluntary Guidelines on Social, Environmental and Economic Responsibilities of Business were notified by the Indian Ministry of Corporate Affairs in 2011. There are a number of suggestions around ethics, transparency,
accountability, etc. There are also suggestions on instituting environment management systems, reporting on environmental performance and creating support throughout the value chain for adopting better awareness of material risks.
BrazilOver the last decades, many government policies and programmes have been formed to promote energy efficiency in Brazil. The creation of the National Programme for Electricity Conservation
Table 9: Power and Fuel Consumption*
1. Electricity
a) Purchased Units
Total Cost
Rate / Unit
b) Own Generation
i. Through Diesel Generator
Units in Kwh
Units per ltr. of diesel oil
Cost / Unit
ii. Through steam turbine / generator
Units in Kwh
Quantity per ltr. of fuel oil / gas
Cost / Unit
2. Coal (specify quality and where used)
Quantity (tonnes)
Total Cost
Average Rate
3. Furnace Oil
Quantity (k. ltrs.)
Total Cost
Average Rate
4. Others / Internal Generation (Give Details)
Quantity
Total Cost
Rate/Unit
*The table is applicable to medium enterprises and larger categories registered in India44

108 The Future of Energy
EntErprisE EfficiEncyExperiences of Brazil, Russia, India and South Africa
(Procel) in 1985 aimed at promoting the rational use of electricity and increasing energy efficiency. Currently, it is split into different programmes focused on equipment, building, industry, lighting, and environmental sanitation, among others. Table 10 highlights the key policies and programmes that comprise Brazil’s energy efficiency framework.
Disclosures Framework
Currently, there is no (federal) mandatory GHG emission reporting requirement for Brazilian companies. Only two states (Sao Paulo, Rio de Janeiro) require GHG inventories for installations operating in their jurisdiction. The states of Minas Gerais and Paraná have established a public registry through which companies receive incentives (discount in licensing fee) for voluntary GHG
Table 10: Energy Efficiency Framework, Brazil
National Programme for Electricity Conservation – Procel (1985)
This programme aims at promoting the rational use of electricity and increasing energy efficiency. Currently, it is split in different verticals focused on equipment, building, industry, lighting, environmental sanitation and others. Procel Industry, for instance, aims at encouraging the adoption of efficient practices in electricity use by the industrial sector, micro and small companies, and commerce, by identifying energy-saving potential. According to the Brazilian government, the programme achieved nine TWh of energy savings in 2012, corresponding to two percent of country’s annual electricity consumption and 624,000 tCO2e of avoided emissions.45
National Programme for the Rational Use of Petroleum and Natural Gas Products (1991)
The programme stimulates efficiency in oil and gas products used mainly in residential, industrial and transportation sectors through technological evaluation analyses, educational initiatives and labelling for efficient vehicles and equipment.
Energy Efficiency Programme (Federal Law n. 9991/2000)
Managed by the Brazilian Electricity Regulatory Agency, the programme requires companies operating in the power sector to invest a minimum percentage (ranging from 0.25 percent to 0.50 percent) of their operational net revenues in energy efficiency programmes.
National Policy for Conservation and Rational Use of Energy (Federal Law n. 10295/2001)
The policy mandates the establishment of maximum levels of specific energy consumption, or minimum levels of energy efficiency, of energy consuming machines and equipment produced and commercialised in the country.
Brazilian Labelling Programme Coordinated by the National Institute for Metrology, Standardization and Industrial Quality, this programme provides information on the efficiency performance of products, especially home appliances.
emissions reporting. In light of these sub-national initiatives, as well as considering possible future information requirements for the adoption of economic instruments for emissions mitigation, the federal government has created an inter-ministerial working group for the establishment of a national registry of GHG emissions aiming at collecting data at the installation level, but a political decision to implement it is still to be made.
The BM&F Bovespa, the national stock exchange, has recommended that as of 2012, listed companies must state whether they publish a regular sustainability report or similar document and where it is available, or if not, explain why. This initiative entitled “Report or Explain” encourages companies to progressively adhere to the practice of reporting information and results which are related to environmental, social, and

EntErprisE EfficiEncy
Experiences of Brazil, Russia, India and South Africa
109The Future of Energy
The probability of achieving this goal is very low because with falling budget revenues in 2014 (as a consequence of falling oil prices), the expenditure on energy-saving initiatives is decreasing.48
Disclosures Framework
On 20 July 2010, amendments to the order of the Federal Service of Financial Markets “On approval of regulations on disclosure of information by issuers of securities” were passed. These amendments specify that all the JSCs should disclose information on the volume and cost of each of their energy sources used in the reporting year.49 But in practice, this data is only detailed in some cases, while only the total volume of consumed energy is disclosed in others. There are companies which do not provide information on energy consumption but describe the results of energy-saving initiatives.
In Russia, there are no legal requirements on the disclosure of information on GHG emissions. According to a KPMG 2010 study, even among companies that provide sustainability reports, the
corporate governance issues to their investors.46 Energy efficiency performance is an intrinsic part of this reporting.
RussiaMost of Russia’s legal requirements related to energy consumption were introduced in the federal law On Energy Saving and Energy Efficiency passed on November 11, 2009. The last article of the law contains instructions to the government on developing new – or correcting previous – legislation in order to introduce information on the volume and cost of energy resources, energy control devices and energy-saving potential in statistical form, as well as to oblige Joint Stock Companies (JSCs) to disclose information on energy consumption in annual reports.47 Table 11 highlights the key policies and programmes that comprise Russia’s energy efficiency-related requirements under the legislation.
Despite some positive changes, the plan to decrease the energy intensity of the Russian economy by 40 percent by 2020 seems distant.
Table 11: Requirements under Legislation, Russia
Energy efficiency labelling
It covers all domestic appliances from 2011 and all computers and clerical aids from 2012.
Installing of control devices for better accounting of energy consumption levels
It stipulates that by 2011 all the companies and state agencies should be equipped with such devices. By 2012, control devices should be installed in the housing sector. All energy payments should be based on the data provided by control devices.
Energy certification All state agencies, government-owned companies, energy companies and firms whose annual energy costs exceed 10 million roubles should be inspected at least once every five years. They should receive energy certificates after the inspection, a copy of which should be provided to the Ministry of Energy.
Programmes of energy efficiency and energy saving
All state agencies, state-owned companies as well as regions and local communities should pass their own energy efficiency programmes. To save energy, economic agents are entitled to sign energy service contracts with specialised companies.
Establishing of an integrated state information system on energy efficiency
This system presupposes collecting all energy information from companies, local communities and regions, analysing this information and providing informational support for economic agents on their potential for improving energy efficiency. The new state institution, Russian Energy Agency, has been established to manage this system.

110 The Future of Energy
EntErprisE EfficiEncyExperiences of Brazil, Russia, India and South Africa
share of those disclosing information on carbon emissions was just 22 percent. Moreover, only half of them provided information on their overall emissions while the others did not go beyond describing the results of specific carbon initiatives (notably within joint investment projects within the Kyoto protocol) or providing information on the emissions within specific industrial processes.50
Now the concept of monitoring, reporting and verification (MRV) is being prepared by the Russian government. According to preliminary plans, from 2016 onwards, all industrial and energy companies whose annual volume of direct GHG emissions exceeds 150 ktCO2e, as well as all air and railroad transport companies, should provide information on their GHG emissions. From 2017 the MRV system will be expanded to all industrial and energy companies with annual GHG emissions exceeding 50 ktCO2e, as well as to all the water transport companies. Alongside, a pool of independent auditors will be created for verification.51
South AfricaEnergy efficiency first appeared on the national agenda in South Africa in 2005 with the formulation of the National Energy Efficiency Strategy. This strategy sets a national final energy demand reduction target of 12 percent by 2015, and a voluntary sectoral target of 15 percent for industry.52 There are also other laws, regulations and policies that deal with energy efficiency.
The Electricity Regulation Act, 2006, provides for the Minister of Energy to prescribe energy efficiency measures. This has not been done to date, arguably because of the costs of such norms and standards on business. However, this Act has formed the basis for Regulations for Compulsory Norms and Standards for Reticulation Services in 2008 and Green Building Standards in 2011. In terms of the National Energy Act of 2008, the ministry also issued regulations pertaining to
energy efficiency, including the minimum levels of energy efficiency in each sector of the economy; steps and procedures necessary for the application of energy efficiency technologies and procedures; and energy efficiency standards for specific technologies and processes.
In addition, there is an Energy Efficiency Accord, which is a voluntary agreement between 24 major industrial energy users, seven industrial associations and the government to collectively work toward achieving the government’s energy-saving target. The accord has yielded positive energy savings. A quantitative assessment of all voluntary signatories showed that over 2,405 GWh of electricity was collectively saved by 15 of the 36 Accord signatories who were able to report their information for FY 2007.53 More recently, the government has included energy efficiency-related criteria in the Industrial Production Policy incentive scheme.
The South African National Standard SANS50001:2011, published in July 2011 by the South African Bureau of Standards, provides for the implementation of the voluntary international ISO50001 standard by organisations in South Africa to improve their energy efficiency performance. This voluntary International Performance Measurement and Verification Protocol is an example of the linkage of a voluntary mechanism with a legal instrument. It has been incorporated in tax legislation, and the government has indicated that energy audits will play an important role in its Energy Efficiency Strategy. The state power utility Eskom is making use of this tool to account for energy savings in its operations.54
An area to watch out for in the policy arena in the future will be the carbon tax, which is proposed to be implemented from January 2015. With this tax, it will be mandatory for installations emitting more than 0.1 GtCO2e annually or those which consume electricity that results in more than 0.1 GtCO2e annual emissions to report emissions.

EntErprisE EfficiEncy
Experiences of Brazil, Russia, India and South Africa
111The Future of Energy
Disclosures Framework
Currently, there is no mandatory energy reporting requirement in South Africa. Reporting takes place only when businesses claim tax incentives for energy efficiency under the Regulations on the Allowance for Energy Efficiency Savings, 2011, in which firms must prove their energy savings through professional measurement and verification. Yet companies often disclose carbon emissions in sustainability reports or on company websites, and carbon data is likely to be increasingly reported in annual reports under the Johannesburg Stock Exchange (JSE) mandatory reporting framework (applicable to the largest listed companies).Companies listed on the JSE must also comply with the King Code of Governance Principles for South Africa 2009 (King III) in terms of which they must issue an integrated annual report, defined as “a holistic and integrated representation of the company’s performance in terms of both its finance and its sustainability.”55
Although this includes reporting on environmental issues, there is no specific requirement that it should include an energy component. This is in contrast to more stringent codes such as the Combined Code of the United Kingdom, which is based on the ‘comply or explain’ principle; King III has opted for the more flexible ‘apply or explain’ approach to its principles and recommended practices.
Shared Experiences in Industrial Efficiency
In the preceding chapters, a discursive overview of the industrial and energy efficiency policy environment in Brazil, Russia, India and South Africa has been provided. The aim of this section is to aggregate shared experiences to highlight areas for mutual learning and future collaboration.
Macro TrendsScope for Energy Efficiency Gains: In all four countries assessed, certain industrial sub-sectors account for the largest proportion of energy consumption. For instance, Russia’s iron and steel production is responsible for 33 percent of total final energy consumption, and the chemical and petrochemical industry covers 19 percent (without taking into account non-energy use). The previous sections reflect that large energy efficiency savings can be made by targeted interventions in such energy-intensive sectors. In India, for instance, the government estimates that demand-side management in the industrial sector could create energy consumption efficiency gains of 10 to 25 percent.
Power Generation by the Private Sector: Over the next couple of decades, the private sector will play a more important role in energy generation. The decreasing role of the state creates mixed implications for overall energy efficiency. For instance, in Brazil, hydropower’s share has decreased (most of hydropower capacity is state-run), even as private sector electricity generation from fossil fuels has increased. In India it is generally acknowledged that over the next decades, as energy demand expands, a large share of power generation will have to come from the private sector. The government’s share of the Russian electricity sector is also expected to fall. These experiences necessitate mutual learning and experience sharing within the private sector.
Competitiveness of Industries and Energy Consumption: It is clear that in an increasingly resource-constrained world, the competitiveness of the industrial sector will be underpinned by the efficiency of resource consumption. For instance, in India, due to an increase in the resource intensity of raw materials and other non-fuel inputs, the profitability of the manufacturing sector has become dependent on wages and interest rates (both factors outside the control of business). In South Africa, electricity tariffs have historically been well below cost-effective

112 The Future of Energy
EntErprisE EfficiEncyExperiences of Brazil, Russia, India and South Africa
levels. Consequently, there has been a 78 percent increase in real electricity prices since 2008, which has affected the manufacturing sector severely. In both cases, negative externalities linked to energy can potentially erode industrial competitiveness unless efficiency of energy use is catalysed through policies and investments.
Regulating Industrial PerformanceTargeting Policies toward Sectors with Potential: One of the key elements of effective policy-making is recognising the importance of targeting low-hanging fruit. Under Brazil’s Procel, the country has achieved 9 TWh of energy savings in 2012, corresponding to two percent of the country’s annual electricity consumption, and 624,000 tCO2e of avoided emissions. Similarly, in India, the Perform Achieve Trade Scheme is a market-based mechanism to enhance the cost effectiveness of improvements in energy efficiency in large energy-intensive industries through certification of energy savings that can be traded.
Awareness through Disclosure: Various disclosure regimes are in place for large companies in three of the four countries assessed. In India, the National Voluntary Guidelines on Social, Environmental and Economic Responsibilities of Business were notified by the Indian Ministry of Corporate Affairs in 2011. Companies are to ‘Apply or Explain’ to the Securities Exchange Board of India on a format called Business Responsibility Reporting based on these national voluntary guidelines. South Africa has a King III Code which also follows the ‘comply or explain’ principle. In Brazil, listed companies (on BM&F Bovespa) have to state whether they publish a regular sustainability report or similar document and where it is available, and if not, then explain why. In all these cases it is clear that gradual steps towards disclosures are being taken in order not to put high costs of compliance on companies.
Fiscal Incentives for Energy Efficiency: Fiscal incentives have been used extensively by the
South African government to incentivise energy efficiency performance and disclosure. The South African National Standard SANS50001:2011 provides for the implementation of the voluntary international ISO50001 standard by organisations. Although this is a voluntary International Performance Measurement and Verification Protocol, it is a good example of the linkage of a voluntary mechanism with a legal instrument – tax rebates. This is an example of a policy which can be studied further. Indeed, integration of fiscal incentives within the framework of industrial policies in emerging and developing countries may represent a significant opportunity for improving efficiency performance.
Energy-Intensive Sectors – Lessons from IndiaHigh Variability within Sectors: The cement industry in India is an example of a sector where, even among the largest companies within the industrial sub-sector, there is large variation in efficiency of energy consumption. Similarly, the mean emission intensity of the steel sector has seen a rise of 12 percent over the time period assessed. This is mostly due to a large increase in variance between performance of different companies. There is a case to be made, therefore, for efficiency convergence within sectors, with policies and incentives enabling laggards to catch up with sector leaders.
Consolidation of Performance among the Largest Companies: In both the Indian sub-sectors assessed, economies of scale seems to be a compelling reason for relatively better performance as measured by emission intensity and revenue indicators. In the steel sector, the three largest companies account for over 77 percent of the revenues generated (from among the over two dozen companies assessed). There is also a direct correlation between larger revenues and lower emission intensities among these companies. In the cement sector, the largest three firms make up over 60 percent of total revenues,

EntErprisE EfficiEncy
Experiences of Brazil, Russia, India and South Africa
113The Future of Energy
and lesser variation is seen among higher revenue-generating companies.
Power and Fuel Input Costs Affect Businesses Asymmetrically: As indicated earlier, negative externalities for business profitability have arisen from a number of energy-related sources. In India’s steel sector, there is a positive correlation between expenditure on power and fuel as a percentage of revenue and emission intensity
within assessed companies. Companies in the cement sector are highly resource-intensive, and there is therefore an absence of a clear co-rrelation between power and fuel expenditures and varying levels of emission intensity. Evidently, factors such as processes used, technology employed, as well as scale of operations, are all responsible for efficiency performance, and policies targeting efficiency must be calibrated accordingly.

114 The Future of Energy
EntErprisE EfficiEncyExperiences of Brazil, Russia, India and South Africa
Endnotes
1 Assumed to be a proxy indicator for the energy efficiency of companies; for more, please refer to the ‘India Market and Environment Report’, Gtrade Carbon Ex Rating Services, 2012.
2 World Manufacturing Production: “World manufacturing production reort.” Unido, http://www.unido.org//fileadmin/user_media/Publications/Research_and_statistics/Branch_publications/Research_and_Policy/Files/Reports/World_Manufacturing_Production_Reports/STA_Report_on_Quarterly_production_2014Q1.pdf.
3 “Power and Energy,” Planning Commission, Government of India, http://planningcommission.nic.in/sectors/index.php?sectors=energy.
4 Shiv Pratapet Raghuvanshi, Carbon Dioxide Emissions from Coal Based Power Generation in India, Energy Conservation and Management, Elsevier, 2005.
5 “India: Greenhouse Gas Emissions 2007”, Ministry of Environment and Forests, GOI, May 2010, http://moef.nic.in/sites/default/files/Report_INCCA.pdf.
6 “Projeções da demanda de energia elétrica para o plano decenal de expansão de energia 2008-2017,” EPE. Empresa de Pesquisa Energética, Accessed on 19 December 2013, http://www.epe.gov.br/mercado/Documents/S%C3%A9rie%20Estudos%20de%20Energia/20080416_3.pdf
7 Nivalde Castro, Rubens Rosental, Nova tendênciaparaaElasticidade-Renda da Demanda de EnergiaElétrica no Brasil, InformativoEletrônicodoSetorElétrico – n. 2215 de 3 de março de 2008, Accessed on 13 January 2014, http://www.brazilink.org/tiki-download_file.php?fileId=112.
8 “Avaliação da EficiênciaEnergéticaparaospróximos 10 anos,” SérieEstudos de Demanda.Nota técnica DEA 16/12. Rio de Janeiro: EPE, Empresa de Pesquisa Energética 2012, Accessed on 13 January 2014, http://www.epe.gov.br/mercado/Documents/S%C3%A9rie%20Estudos%20de%20Energia/20121221_1.pdf
9 “Brazilian Energy Balance 2014 Year 2013” Rio de Janeiro: EPE, Empresa de Pesquisa Energética 2014, https://ben.epe.gov.br/BENRelatorioFinal.aspx?anoColeta=2014&anoFimColeta=2013.
10 “Ibid”11 “CO
2 emissions factors,” MCTI, Ministry of Science, Technology and Innovation, Accessed on 18 December 2014, http://www.mct.gov.br/index.php/content/view/321144.html#ancora.
12 Using the ‘Purchase Power Parity’ concept.13 “Eficiênciaenergéticanaindústria: o quefoifeito no Brasil, oportunidades de redução de custos e experiênciainternacional,” CNI.
ConfederaçãoNacional da Indústria, Brasília: CNI, Accessed on 05 September 2013, http://www.cni.org.br/portal/data/pages/FF808081314EB36201314F22482B7753.htm
14 T. Dzyadko, D.Dmitrienko, Rosneft provozglasilasebyakrupneyshey v mire publichnoyneftegazovoykompaniey, Vedomosti, March 21, 2013.
15 US Energy Information Administration16 Marlamov E. Pyat’ let bez RAO, Financial One, June 19, 2013.17 RusHydro, http://www.rushydro.ru/company.18 Federal Customs Service of the Russian Federation.19 Central Bank of the Russian Federation.20 L. Grigoryev, I. Makarov, A. Salmina, Russia’s Domestic Objective Situation and Debates on Global Climate Issues in: Climate
Change, Sustainable Development, and Human Security: A Comparative Analysis, Ed. by D.K. Vajpeyi, Lexington Books, 2013.21 “Energy Efficiency in Russia:Untapped reserves”, World Bank, CENEF, 2008.22 Bashmakov I.A., Myshak A.D. ayasistemauchyotapovysheniyaenergoeffektivnosti I ekonomiienergii. Moscow: CENEF, 2012.23 International Energy Agency.24 DEAT, 2000.25 “Independent Statistics and Analysis: US Energy Information and Administration,” EIA, Accessed on 7 January 2014, http://
www.eia.gov/countries/cab.cfm?fips=SF.26 “Enerdata and the Economist Intelligence Unit, 2011;” “Trends in global energy efficiency 2011,” Enerdatuk, Accessed on: 7
January 2014, //www.enerdata.net/enerdatauk/press-and-publication/publications/2011-trends-in-global-energy-efficiency.pdf.
27 “ Trends in global energy efficiency 2011,” Enerdata and the Economist Intelligence Unit, Accessed on: 7 January 2014, http://www.enerdata.net/enerdatauk/press-and-publication/publications/2011-trends-in-global-energy-efficiency.pdf.
28 “Enerdata and the Economist Intelligence Unit, 2011” “Trends in global energy efficiency 2011,” Enerdatuk, Accessed on: 7 January 2014, http://www.enerdata.net/enerdatauk/press-and-publication/publications/2011-trends-in-global-energy-efficiency.pdf.

EntErprisE EfficiEncy
Experiences of Brazil, Russia, India and South Africa
115The Future of Energy
29 “The Economic Impact of Electricity Price Increases on Various Sectors of the South African Economy, A Report consolidating the findings of recent research,” Deloitte, 2012, Accessed 10 July 2013, http://www.eskom.co.za/content/Economic%20Impact%20of%20Electrcity%20Price%20Increases%20%20Presentation~1.pdf.
30 The National Industrial Classification (NIC) is an essential Statistical Standard for developing and maintaining comparable data base according to economic activities. Such classifications are frequently used in classifying the economically active population, statistics of industrial production and distribution, the different fields of labour statistics and other economic data such as national income.
The Central Statistical Organisation (CSO), which is responsible for setting up of statistical standards. The National Industrial Classification 2008 seeks to provide a basis for the standardized collection, analysis and dissemination of industry (economic activity) wise economic data for India. Apart from being the standard industrial classification, that underpins Indian Industrial Statistics, NIC is widely used by the government agencies, industry associations and researchers for various administrative, analytical and research purposes.
Sector Section of NIC-2008 Level Description
Cement Section C: Manufacturing Division 23 Manufacture of other non-metallic mineral products
Iron and Steel Section C: Manufacturing Division 24 Manufacture of Basic Metals
31 The sectoral energy consumption classification adopted by the National Energy Balance follows the Code of Activities of the Federal Revenue of Brazil. However, more recently, the process of data collection and treatment is being adjusted to the current National Classification of Economic Activities – CNAE according to Brazilian Energy Balance 2013 Year 2012. The CNAE version 2.0 was structured based on the fourth version of International Standard Industrial Classification of All Economic Activities – ISIC, is applied on the National Statistical System, including National Accounts. Individual categories are organized in 21 sections, 87 divisions, 285 groups, 673 classes and 1301 subclasses.
Sector Section of CNAE 2.0 Level Description
Food and beverages C - Manufacturing Divisions 10 and 11Manufacture of food products (10) Manufacture of beverages (11)
Iron and steel C - Manufacturing Division 24 Manufacture of basic metals
Paper and pulp C - Manufacturing Division 17 Manufacture of paper and paper products
Chemical C - Manufacturing Division 20 Manufacture of chemicals and chemical products
32 “Brazilian Energy Balance 2013 Year 2012,” Empresa de Pesquisa Energética (2013), Rio de Janeiro: EPE, Accessed on 19 December 2013, https://ben.epe.gov.br/BENRelatorioFinal.aspx?anoColeta=2013&anoFimColeta=2012.
33 “Avaliação da EficiênciaEnergéticaparaospróximos 10 anos (2012-2012),” SérieEstudos de Demanda.Nota técnica DEA 16/12, Empresa de Pesquisa Energética (2012), Rio de Janeiro: EPE, 2012, Accessed on 13 January 2014, http://www.epe.gov.br/mercado/Documents/S%C3%A9rie%20Estudos%20de%20Energia/20121221_1.pdf
34 “Eficiênciaenergéticanaindústria: o quefoifeito no Brasil, oportunidades de redução de custos e experiênciainternacional,” ConfederaçãoNacional da Indústria 2009, Brasília: CNI, Accessed on 05 September 2013, http://www.cni.org.br/portal/data/pages/FF808081314EB36201314F22482B7753.htm.
35 Russian Classification of Economic Activities is the statistical standard used in Russia. It was composed on the base of Statistical classification of economic activities in the European Community and is used for classifying data on industrial output, employment, labour resources etc. It includes 99 classes of economic activities grouped in 17 sections. All classes of activities are divided into subclasses.
36 World Development Indicators37 Primarily diversification into manufacturing and services.38 When the dramatic slowdown of South African economic growth during the Apartheid period tipped the economy into
recession, Eskom, the monopolistic vertically integrated electric utility, had an excess capacity of more than a third of its installed capacity. Encouraging electricity load growth was imperative to the improvement of Eskom’s revenues. With most of the capital cost of generation already sunk, and its source of coal mainly locally accessed through long-term contracts at negotiated low prices, Eskom was able to provide cheap electricity tariffs compared to the rest of the world.
39 Data for 2009 is not available. Therefore, data for 2006 has been used.40 “South African Energy Synopsis 2010,” Department of Energy, Republic of South Africa, 2010., http://www.energy.gov.za/files/
media/explained/2010/South_African_Energy_Synopsis_2010.pdf.

116 The Future of Energy
EntErprisE EfficiEncyExperiences of Brazil, Russia, India and South Africa
41 R. Inglesi-Lotz and J. Blignaut, Electricity Intensities of the OECD and South Africa: A Comparison, Working paper 204, Sanedi, Accessed on: 30 July 2013, http://www.sanedi.org.za/wp-content/uploads/2012/02/ee/Electricity%20intensities%20of%20the%20OECD%20and%20South%20Africa-%20a%20comp.pdf []
42 “The Impact of electricity price increases and retaining on the South African economy: Final Report to the National Electricity Response Team (NERT) Economic Impact Task Tea,” HSRC, 2008, Accessed on 30 July 2013, http://www.hsrc.ac.za/en/research-outputs/keywords?keyword=ENERGY+SECTOR&letter=A&page-num=2
43 Emission intensity is estimated as total GHG emissions from a company divided by its total consolidated revenue.44 As per Micro, Small and Medium Enterprises Development Act, 2006, medium enterprise can be classified based on two criteria
– In case of enterprise engaged in manufacturing or production of goods, companies where the investment in plant and machinery is more than five crore rupees but does not exceed ten crore rupees.
In case of enterprises engaged in providing or rendering of services, companies where the investment in equipment is more than two crore rupees but does not exceed five crore rupees.
45 “Relatório de resultados do Procel 2013 - Ano base 2012,” Rio de Janeiro: Eletrobras, Procelinfo, Accessed on 13 January 2014, www.procelinfo.com.br.
46 The comprehensive list of companies with respective links to sustainability reports: “Sustainability Report or Integrated Report,” Bmfbovespa, http://www.bmfbovespa.com.br/en-us/markets/download/Relate-ou-Explique-ingles.pdf.
47 Ibid48 A. Davydova, Rossiyadenegnaklimat ne brosaet, Kommersant, December 15, 2014.49 Order of the Federal service of financial markets: “On approval of regulations on disclosure of information by issuers of
securities”, July 20, 2010.50 Otchetnost’ rossiiskikhkompaniy v oblastiustoychivogorazvitiya, KPMG, 2011.51 O. Pluzhnikov, O proektekontseptsiiformirovaniyasistemy monitoring, otchyotnosti I proverkiobyomavybrosovparnikovykhgazov,
Climate Change: Challenges and Opportunities for Business, Moscow, November 26, 2014.52 C. Bergh, Energy Efficiency in the South African Crude Oil Refining Industry: Drivers, Barriers and Opportunities, Thesis submitted
for MSc Sustianable Energy Engineering, University of Cape Town, 2012. 53 “Assessment Study of The Energy Efficiency Accord. Final Report 2008,” NBI, Accessed on 1 July 2013, Accessed on 14 July 2013,
http://www.nbi.org.za/SiteCollectionDocuments/ee_accord_assessment_report.pdf.54 “National Energy Efficiency Strategy Review,” Department of Energy, Government of South Africa, 2012, http://www.info.gov.
za/view/DownloadFileAction?id=179403.55 L. Van Ast, and Maclean, Carbon and water risk for South Africa’s top companies, bonds and equities: How corporate emissions
expose investors to carbon taxes and thirsty assets are vulnerable to climate change, Technical report prepared for WWF SA and Truecost, Awsassets, Accessed on 3 August 2012, http://awsassets.wwf.org.za/downloads/carbon_and_water_risk_for_south_africa_s_top_companies__bonds_and_equity_funds_final_rep.pdf.

117The Future of Energy
Energy Access: Country Perspectives
Ashish Gupta, Associate Fellow, Observer Research Foundation, India
Akhilesh Sati, Programme Manager, Observer Research Foundation, India
Louise Scholtz, Manager, Special Projects, Living Planet Unit, WWF, South Africa
Igor Makarov, Associate Professor, National Research University - Higher School of Economics, Russia
Zhongyi Yin, SRF & Executive VP, China Institute of Reform & Development, China


EnErgy AccEss: country PErsPEctivEs
119The Future of Energy
The global discourse on universal energy access became part of the mainstream development agenda only about a decade ago. The beginning was probably made when world leaders adopted eight millennium development goals (MDGs) at the United Nations (UN) headquarters in New York in 2000.1 Though universal access to energy was not among the eight goals chosen, it is reasonable to assume that there was implicit understanding that without universal access to modern energy services it would not be possible to achieve most of the MDGs. A 2005 report by the UN observed that lack of access to modern energy would limit ability to achieve the MDGs.2
The 12th International Energy Forum (IEF) Ministerial in Cancun in 2010 called for the international community to set up a ninth goal, specifically related to energy to consolidate the evident link between modern energy services and development goals.3 In its annual outlook report of 2010,4 the International Energy Agency (IEA), the energy think tank of the Organisation for Economic Co-operation and Development (OECD) nations, expressed ‘alarm’ over the lack of access to modern lighting and cooking energy services for billions of people around the world.
This sense of alarm over lack of access to modern energy services led to a number of global initiatives to increase energy access. The UN declared 2012 as the international year of sustainable energy for all with the goal of achieving universal access to energy for all (SE4ALL) by 2030.5 In 2013, a UN high-level panel of eminent persons recommended that universal access to modern energy services be included in the post-2015 development agenda.6
Despite these initiatives, the provision of universal access to energy remains a challenge. This paper aims to examine initiatives for universal energy
Introductionaccess in four BRICS nations and identify country-specific challenges, with a view to promoting knowledge sharing among emerging and developing countries.
Global Energy Access Status
In 2010, there were about 1.4 billion people (20 percent of the global population) who lacked access to electricity and 2.7 billion people (40 percent of the global population) who lacked access to modern cooking fuels.7 In 2013, the number of people without access to electricity had marginally come down to 18 percent of the global population and those without access to modern cooking fuels to 38 percent.8 Though this is a sign of progress, the pace of progress is unlikely to deliver universal energy access by 2035.
Projections based on policies currently in place show that by 2035 sub-Saharan Africa and developing Asia, which currently account for over 95 percent of the global total of people without access to modern energy services, will continue to have a significant share of their populations without such access.9 At present, India has the largest number of people without access to modern energy services in terms of absolute numbers, but the number in sub-Saharan Africa is expected to increase in future and the region is expected to overtake India on this parameter.
The provision of universal access to energy is expected to make only a small impact on global energy demand and consequently, will not contribute significantly to carbon emissions. The additional electricity demand for universal access is estimated to be about 120 mtoe which is just one percent of the total primary energy demand. For cooking, the additional demand in the form of bottled liquid petroleum gas (LPG) is expected to be about 0.82 mbpd which is about a hundredth of
EnErgy AccEss: country PErsPEctivEs
120 The Future of Energy
global oil demand. The additional carbon dioxide (CO2) emission is expected to be less than 0.7 percent of total emissions.10
Energy Access in India
Surveys conducted by the Indian government reveal that over 300 million people or 25 percent of the population lacked access to electricity, and over 800 million or 66 percent of the population lacked access to modern cooking fuels in India in 2011.11 These are striking figures when compared to levels of energy access in other BRICS nations which have achieved near universal electricity access. However, when compared to the energy access status in India about six decades ago, these figures convey significant progress.
India’s Electrification Programmes since IndependenceWhen India became independent in 1947, more than 90 percent of households lacked access to electricity. Increasing electricity supply was part of India’s programme for nation-building. Between 1947 and 2011, electricity supply increased by over 20,000 percent and village electrification by 35,000 percent. However, household electrification increased only by 2,000 percent. This confirms one of Nobel Laureate Amartya Sen’s key insights that increase in aggregate supply does not automatically translate into access at the individual level. Interventions are necessary to increase access. But even in this regard it is hard to find fault with the government’s efforts.
India’s 1st Plan document (1951-56) lamented that “only one in 200 villages was electrified and that just 3 percent of the population in six large towns consumed over 56 percent of the utility electricity.” The 2nd Plan document (1956-61) had some concrete observations on how to improve access to electricity. It estimated that the cost of extending electricity supply to villages at INR 60,000-70,000 per village amounted to a total capital outlay of about INR 3,000 crore for
complete electrification of villages. Towards this end, the Plan document earmarked a sum of INR 75 crore for electrification of small towns and villages. This was in addition to the sum of INR 20 crore allotted for expansion of power to small towns to facilitate employment generation in the first and second plan periods. The 3rd Plan (1961-66) observed that there was a 200 percent increase in the number of villages electrified and provided an allocation of INR 105 crore for rural electrification. Noting a 175 percent increase in village electrification and a 100 percent increase in energising irrigation pump sets in the preceding decade, the 4th Plan (1969-74) increased the outlay for rural electrification to over INR 400 crore.
Village electrification increased by over 200 percent in the 4th and 5th plan periods and most of the credit was given to the Minimum Needs Programme initiated in the 5th plan. The 6th Plan (1979-84) allocated INR 1,576 crore for rural electrification, which included INR 285 crore for Special Project Agriculture to be implemented by the Rural Energy Corporation (REC). The 7th plan (1984-89) introduced an Integrated Rural Energy Plan, which proposed that a basket of solutions such as rural electrification, use of petroleum products and fuel-wood, along with renewable energy sources, must be pursued towards the ultimate goal of 100 percent rural electrification. The diversification strategy based on the use of local resources and fuels reduced the allocation for rural electrification to about INR 47 crore (6.8 million euros) which was only three percent of the allocation in the previous plan period. Between the 4th and the 7th plan, rural electrification rates increased dramatically but faltered when the budget was reduced on account of the strategy of diversification of fuel sources (Figure 1).
The 8th (1992-97) and 9th (1997-02) plan outlays for rural electrification were INR 4,000 crore and INR 7,000 crore respectively. The 10th Plan (2002-07) was quite significant in terms of

EnErgy AccEss: country PErsPEctivEs
121The Future of Energy
rural electrification, as it contained a detailed investigation of rural electrification programmes. It acknowledged that while 86 percent of villages in India were claimed to have been electrified, less than 30 percent of the households had electricity connections and that electricity had played no role in generating economic activity in the ‘electrified’ villages. The Plan document emphasised the need for revising the definition of electrification, which stated that “a village was deemed electrified if electricity was used in the inhabited locality within the revenue boundary of the village for any purpose whatsoever”.
It also recommended coordination of multiple rural electrification and energy access programmes such as the Pradhan Mantri Gram Yojana, the Minimum Needs Programme for Rural Electrification, the MP Local Area Development Scheme, the Jawahar Gram Siddhi Yojana, the Kutir Jyoti Programme, Programmes of the Rural Electrification Corporation (REC) and decentralised Renewable Energy Programmes of the Ministry of New & Renewable Energy under the Integrated Rural Energy Programme with a plan outlay of about INR 178 crore (26 million euros). The
Figure 1: Progress of Electrification Programmes, 1947-2012
Source: Authors’ calculations from various documents of Planning Commission and Ministry of Power.
01000002000003000004000005000006000007000008000009000001000000
0
100,000
200,000
300,000
400,000
500,000
600,000
31.12.1947
1st P
lan
2nd P
lan
3rd P
lan
4th P
lan
5th P
lan
6th P
lan
7th P
lan
8th P
lan
9th P
lan
10th P
lan
11th P
lan
No. of R
ural Households (in ’00)
No.
of V
illag
es
No. of Villages Electrified No. of HHs Electrified (in '00)
document also mentioned an outlay of INR 1,600 crore (233 million euros) towards non-conventional energy sources but did not clarify whether this was for rural renewable energy sources.
The Rajiv Gandhi Grameen Vidyudikaran Yojana (RGGVY), a scheme launched in 2005 with the aim of providing universal access to electricity in five years, incorporated all the other schemes for rural electrification and was the primary thrust in the 11th Plan (2007-12). The basic provisions of the scheme were a 90 percent grant from the Central Government and 10 percent loan to the State Governments from the REC for provision of universal access to electricity as per the revised definition of electrification. The total cost of projects sanctioned under the RGGVY during the 10th and 11th Plans is estimated to be about INR 33,000 crore (4.8 billion euros). The cost estimate for the scheme during the 12th Plan is estimated to be about INR 50,000 crore (7.3 billion euros). It has been almost eight years since the RGGVY began but not all villages are yet electrified and not all households have access to electricity.

EnErgy AccEss: country PErsPEctivEs
122 The Future of Energy
Challenges in India’s Rural Electrification ProgrammesThe first challenge in India’s publicly funded grid-based electrification programmes is that it is not economically sustainable. The programmes make ever-growing demands on dwindling public resources and raise little or no revenue. One of the reasons for the inadequacy of the RGGVY scheme is that it is entirely based on subsidies with no scope for raising revenue. No doubt, with an average rural household’s consumption being less than 0.5 Kwh a day, and household density in villages being low, talk of raising revenue is meaningless. Even if there is enthusiasm for economic activity, the single phase connections provided under the RGGVY cannot facilitate any. And without economic activity there is little or no opportunity for raising revenue. The success of rural electrification programmes between 1970 and 1990 was primarily due to the fact that they energised pump sets that increased rural incomes through increased agricultural production, and consequently provided revenue returns for electricity distribution companies.
Second, there is the well-known challenge of cost, both in erecting infrastructure and in supplying electricity. This is not a challenge unique to India, but overall costs do appear to be relatively high in India. This is a significant challenge as there are many competing demands on India’s scarce public resources which underwrite electrification programmes. Even in 1955, the cost of providing grid-based electricity to a village was as high as INR 60,000-70,000. The current estimate is as high as INR 1 million. This is much higher than the cost of electrification per village in Brazil, estimated at INR 200,000. As per the latest data (March 2013), there were about 33,180 villages in India yet to be electrified. At INR 1 million per village this works out to more than INR 33 billion (483 million euros).
When it comes to supplying electricity, the challenge is even bigger. Almost all of India’s state-owned distribution companies have illiquid
balance sheets; many continue to accumulate losses. The accumulated debt of power distribution companies is estimated at INR 179,000 crore (26 billion euros) without subsidies and INR 80,000 crore if subsidies are taken into account (11 billion euros). This is roughly one to two percent of India’s GDP. These loss-making utilities have no incentive to supply electricity to rural households, especially when the cost of doing so is as high as INR 91/Kwh in some villages.12 The average loss per unit of electricity supplied to rural areas in India is estimated at INR 3.9/Kwh; this is almost twice the average purchase cost of electricity.13
Even if these financial challenges are overcome, there are social challenges to be addressed if the goal of universal access to electricity is to be achieved. Studies have found that rich households appropriate most of the benefits of subsidised rural electrification programmes.14 One study revealed that the lowest income groups derived no electrification benefits in terms of increases in household expenditure. In terms of income, the positive percentage impact was seen to be 46 percent for richer households compared to 26 percent for poorer households.15 It has also been found that spatial segregation between upper and lower caste households in villages affects access to electricity. Upper caste settlements, which command social and economic power, corner electricity infrastructure and assets and restrict its access to lower caste settlements. In response the government has redefined an electrified village as one in which at least 10 percent of lower caste households are electrified.16
There are other problems that rural electrification schemes have not considered. For example, it is very likely that the pace at which people are moving towards electricity and economic activity (to towns or cities) is faster than that at which electricity and economic activity are moving towards people through these schemes. If this is true, physical infrastructure erected at huge cost in rural areas will become redundant.

EnErgy AccEss: country PErsPEctivEs
123The Future of Energy
The push for decentralised renewable energy solutions such as solar and biomass is generally seen as the answer to high-cost grid-based systems. Though this appears to be a perfectly rational option, especially in the light of carbon emissions and financial resource constraints, it has not been as successful as one would presume. There are some success stories of innovative business models, but very few have proved to be financially self-sustaining. Anecdotal evidence suggests that the rural poor prefer high quality grid-based electricity rather than complex and intermittent renewable electricity technologies that are thrust upon them.17
This suggests that energy choices of the rural poor are influenced by energy options available to the affluent urban population and not by arguments of economic rationality or environmental sustainability. As most of the increase in electricity access in developing Asia is attributed to grid-based solutions, there is a need to review energy access programmes based on renewable energy.18
Access to Modern Cooking FuelsThe concern over access to modern cooking fuels such as bottled LPG is less than three decades old. Until the late 1980s, most government reports on energy projected an increase in demand for firewood, which remained the primary fuel used for cooking even in urban households until the late 1970s.19 Following the stabilisation of oil prices after the oil embargoes of the 1970s, kerosene stoves and bottled LPG were introduced in the market. Consequently, urban households rapidly shifted away from firewood use in their kitchens. Between 1970 and 2011 kerosene use increased by 150 percent and LPG use by 8,000 percent – albeit from a small base.
Despite this dramatic increase in the supply of petroleum-based fuels for cooking, more than 70 percent of households in India continued to use biomass (twigs, firewood and dried animal dung) as fuel for cooking even in 2011 (Figure 2). Biomass used for cooking accounts for over 26 percent of India’s total primary energy consumption – which is
Figure 2: Progress in Use of Modern Cooking Fuels, 1947-2012
Source: Census of India reports

EnErgy AccEss: country PErsPEctivEs
124 The Future of Energy
more than the India’s consumption of oil at 24 percent. In energy equivalent terms, the energy supplied by firewood, twigs and animal dung in India at 135 mtoe is more than the entire energy consumption of Australia at 123 mtoe. What this piece of data conceals is the tragic fact that the energy spent by millions of women and children in collecting biomass to burn in their stoves is not counted or even acknowledged in India’s energy balance sheet.
To obtain one unit of useful heat energy to cook a meal, millions of women and children, at the bottom of the income pyramid, have to collect and carry firewood and dung with six to seven units of energy because five units of energy is ‘wasted’ by the inefficient open cook stoves that they use (Figures 3 and 4). The next best use of their labour (the opportunity cost in economic terms) is almost ‘nothing’ because they are largely illiterate and have no special skills. This is a wealth-destroying system because the net energy gain (energy obtained for cooking minus the total energy
content in biomass plus human energy spent collecting/processing biomass) is negative.
As illustrated in the charts above, rural households have to collect (‘consume’) more energy than their wealthier counterparts in urban areas because over 80 percent of total energy collected by rural households is dissipated or wasted. In other words, the effective cost of energy used in most of the rural households is much higher than that in households which use modern cooking fuels such as natural gas, because their energy cost includes the transaction cost of gathering the fuel as well as the energy that is wasted in inefficient cooking stoves. For the nation as a whole, the opportunity cost of collecting and using firewood has been estimated to be more than $6 billion/year even if the wage rate is assumed to be just $1.33/day/person. While the cheapest, cleanest and the most efficient forms of cooking fuel such as LPG, natural gas and electricity are used by the richest households, the dirtiest, most inefficient and most expensive cooking fuels are used by the
Figure 3: Useful Energy Obtained by Households using Biomass
Source: Shahidur R. Khandker, Douglas F. Barnes, Hussain A. Samad (2010): “Energy Poverty in Rural and Urban India.”
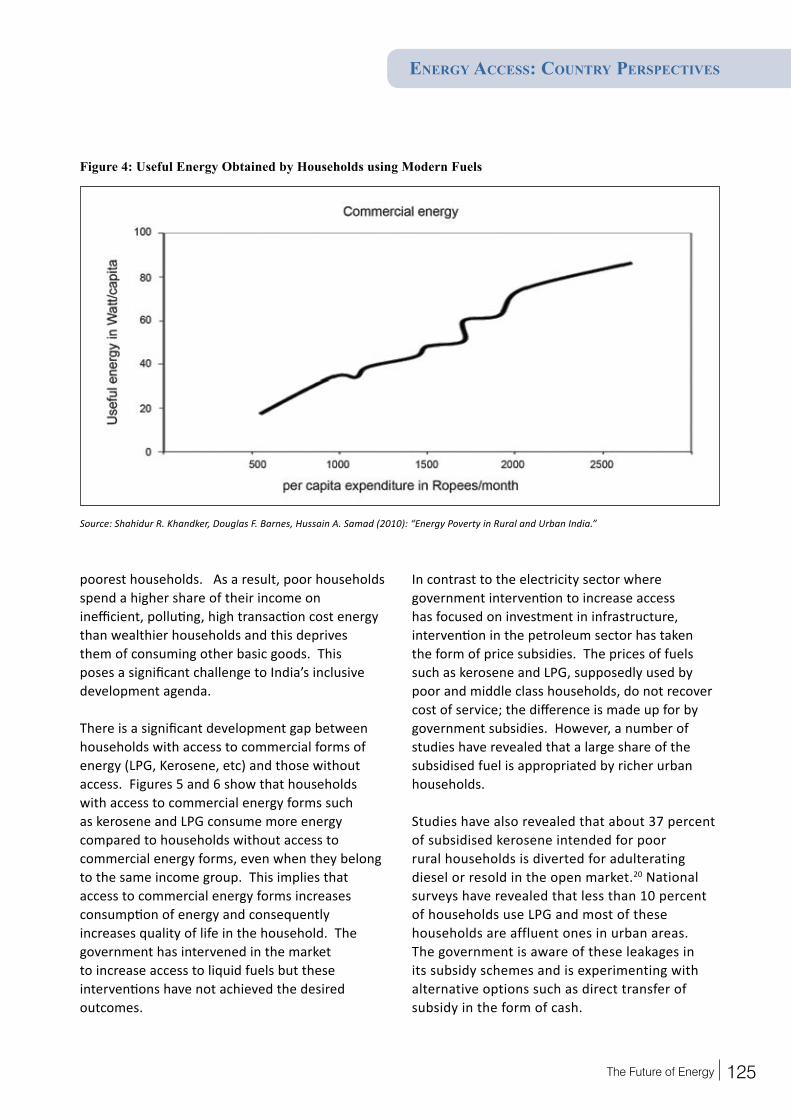
EnErgy AccEss: country PErsPEctivEs
125The Future of Energy
poorest households. As a result, poor households spend a higher share of their income on inefficient, polluting, high transaction cost energy than wealthier households and this deprives them of consuming other basic goods. This poses a significant challenge to India’s inclusive development agenda.
There is a significant development gap between households with access to commercial forms of energy (LPG, Kerosene, etc) and those without access. Figures 5 and 6 show that households with access to commercial energy forms such as kerosene and LPG consume more energy compared to households without access to commercial energy forms, even when they belong to the same income group. This implies that access to commercial energy forms increases consumption of energy and consequently increases quality of life in the household. The government has intervened in the market to increase access to liquid fuels but these interventions have not achieved the desired outcomes.
In contrast to the electricity sector where government intervention to increase access has focused on investment in infrastructure, intervention in the petroleum sector has taken the form of price subsidies. The prices of fuels such as kerosene and LPG, supposedly used by poor and middle class households, do not recover cost of service; the difference is made up for by government subsidies. However, a number of studies have revealed that a large share of the subsidised fuel is appropriated by richer urban households.
Studies have also revealed that about 37 percent of subsidised kerosene intended for poor rural households is diverted for adulterating diesel or resold in the open market.20 National surveys have revealed that less than 10 percent of households use LPG and most of these households are affluent ones in urban areas. The government is aware of these leakages in its subsidy schemes and is experimenting with alternative options such as direct transfer of subsidy in the form of cash.
Figure 4: Useful Energy Obtained by Households using Modern Fuels
Source: Shahidur R. Khandker, Douglas F. Barnes, Hussain A. Samad (2010): “Energy Poverty in Rural and Urban India.”

EnErgy AccEss: country PErsPEctivEs
126 The Future of Energy
Figure 5: Change in Commercial Energy Use with Income
Source: S. Pachauri, A. Mueller, A. Kemmler and D. Spreng (2004): “On Measuring Energy Poverty in Indian Households”
Figure 6: Change in Non-commercial Energy Use with Income
Source: S. Pachauri, A. Mueller, A. Kemmler and D. Spreng (2004): “On Measuring Energy Poverty in Indian Households”
EnErgy AccEss: country PErsPEctivEs
127The Future of Energy
Most analyses misinterpret the question of energy access in India as a problem of supply scarcity. Under the ‘scarcity’ framing, energy supplies are seen to be dwindling with little left for Indian consumers. Policy suggestions advise India to scrounge for energy from every source, every corner of the world. This is an attractive framing as it facilitates the transfer of disproportionate sums of money to state and private players who are supposedly in the business of securing energy for India. But as Prof. Amartya Sen has pointed out in his Nobel Prize winning work, physical availability of any vital resource, be it food or energy, is less important than broad purchasing power to obtain it.
As pointed out by Arvind Subramanian, India already has an informal ‘right to subsidised energy’ policy under which the price of energy sources and energy forms such as electricity are ‘subsidised’.21 The right to ‘subsidised’ energy has distorted the energy market to such an extent that it has become a barrier to investment in the energy sector. But the term ‘right to subsidised energy’ needs to be qualified. The so-called subsidy on energy is in reality a complex mix of cross subsidies that do not actually reduce the price of energy relative to other consumption goods for the average energy consumer. Apart from the fact that the average Indian pays one of the highest prices for energy (petroleum and electricity) in purchasing power parity terms,22 he/she also pays a higher share of wages to purchase a unit of energy compared to people in comparable countries such as Pakistan.23 Further, the energy system that delivers the ‘right to subsidised energy’ has a carefully crafted system of leaks that allows unintended beneficiaries to appropriate energy.
All this does not mean that the objective of providing energy access to all must be abandoned. Experiments with new and innovative ways of providing energy access must continue until the optimal solution is found.
Energy Access in South Africa
In 1994, the democratically elected South African government came to power and created a constitution which is world renowned for its all-inclusive description of human rights. One of those rights is access to electricity. The new dispensation inherited a grossly inequitable electricity system which it tackled with an electrification programme, aimed to achieve universal access to electricity by 2014. The programme has been fairly successful with access to electricity increasing from 35 percent of all households in 1990 to 84 percent of households in 2011, according to StatsSA2012.24
Although published data on the state of electrification varies from source to source,25 the general consensus is that about a quarter of South African households still do not have access to electricity. This number can be further contested because connected households do not necessarily have the means to buy electricity. This raises the question of whether South Africa’s current way of delivering electricity is contributing to inequality of access to electricity.
Almost 47 percent of South Africans are poor, defined as living in a household with less than R800 per month.26 If a suburban household were to use 700 kWh, the cost of electricity would make up a small percentage of their income which is generally between R 10,000 - R 15,000. The cost of 500 kWh to a township household would take up 23 percent of income, which is generally derived from social grants and pensions. Consequently, low income households either under consume electricity or cannot pay their electricity accounts.27 As a result, many homes are illegally connected to the grid.
History of Electrification in the New RegimeWith the end of apartheid, the new administration was constitutionally obliged to implement

EnErgy AccEss: country PErsPEctivEs
128 The Future of Energy
universal access to electricity for disadvantaged citizens. From 1994 to 2000, new policies were drafted and institutional reforms carried out in the electricity sector that would see electrification levels increase from about 35 percent to 71 percent. The state electricity utility Eskom was responsible for financing the programmes from 1991-2001.28 The Energy White Paper, 1998, asserted policy direction to establish a National Electrification Programme and in 2002, the Integrated National Electrification Programme (INEP) was created.
In 2005, INEP’s planning, funding and coordination was housed into the Department of Energy and Minerals (now the Department of Energy).29 About 190,000 new connections were auctioned annually, but each year the number of new households that came online was between 320,000 and 350,000. Thus delivery was below growth.30 The required funding allocation from 2007 to 2011 was about 50 percent less than what was required to address the backlog.31
The inefficient administration of the INEP programme negatively impacted its delivery, with the serious lack of technical and managerial skills within municipalities cited as the major barrier to its success.32 When the government realised that the poor could not afford electricity, it introduced Free Basic Electricity (FBE) in 2004. This was the government’s response to energy access for the energy poor. Poor households pay a nominal fee for connection, and receive 50 kWh per month paid for by the exchequer.
State of Energy AccessWhile the South African government wrestles with its electrification system, many citizens continue to live in energy poverty and rely on ‘dirty energy’ fuels for their energy needs. Coal, wood, paraffin stoves and candles all pose significant health and safety risks – such as fires and respiratory illnesses. These are also used in households that are connected to the grid but cannot afford the
cost of electricity beyond the 50 kWh provided free by the state. A study revealed that households spent about R120 per month on electricity and an additional R60 on other fuels.33 Access to electricity would address various issues, such as creating adequate lighting and more time to study at night, preventing women and girl children from spending up to two hours a day collecting fuel, making streets are safer to walk in at night and providing households with additional energy for other productive uses.34
Free Basic ElectricityTo a large extent, FBE fails to deliver equitable access to electricity. For most poor people, the biggest barrier to electricity access is the high connection fee. Pre-paid metering had been introduced to reduce the cost of billing and meter readings, as well as assisting the poor to not exceed affordable costs.35 Although this has addressed the issue of massive debt to municipalities, which were not able to pay for their energy purchases owing to under-recoveries, it still did not change the fact that electricity remains unaffordable for a large number of citizens.
FBE is purported to provide enough electricity for the poor, “suitable for basic lighting, TV, and radio, basic ironing and basic cooking” (DME 2003b: section 3.5), but the reality is that a small refrigerator alone used for just six hours a day would use up all the FBE allotted for a month and a hotplate used for two hours a day would use far more than the daily FBE amount.36
The system of accessing FBE is also complicated and time-consuming. The poor have to first prove that they are in a condition of poverty and get registered as indigent – in 2007 only 47,000 were registered. Once registered, they have to agree to have a pre-paid meter installed in their home and only then are they eligible for FBE. The meter installed is only a 10 amp supply which trips when several appliances are used at once, leading to frequent outages and disconnections.37 Forty eight

EnErgy AccEss: country PErsPEctivEs
129The Future of Energy
percent of municipalities have no maintenance plans for their distribution networks, or knowledge of power quality and performance issues.38 Half the municipalities do not have contingency plans for dealing with power cuts nor do they conduct maintenance checks.39 This is in spite of the fact that municipalities make an average 10-15 percent surplus from their electricity distribution and retail activities.40
As the poor have incremental access to money, electricity is bought incrementally at vending stores. This requires multiple visits and often long queues, posing risks to safety. In the Tshwane municipality, for instance, customers have a cap of 150 kWh on electricity purchases. This is instituted to make customers pay for other services and to prevent the illegal sale of electricity.41 That municipalities have to resort to this type of disincentive is indicative of a system that is not working for the poor. Further, the capping of the amount of energy that people can buy can be seen as an infringement of human rights. Highlighting this systemic inequity is the fact that mining and manufacturing companies are charged about half the tariffs that domestic customers are.42
In conclusion, the amount of electricity provided in the FBE falls short of the definition of universal access, which is generally accepted as energy for cooking, lighting, heating and potentially a cell phone charger or a TV. The inability of the poor to supplement FBE with additional energy purchases, and the need to resort to paraffin, coal and candles, points to deeply embedded socio-economic inequity. Similarly, a quarter of households remain unconnected to the grid, which indicates a structural dysfunction within government, ultimately precluding the goal of universal energy access.
Rural Access to Electricity in China
Before the founding of the People’s Republic of China, rural electric power consumption was only 20 million kWh or 0.58 percent of the total
national consumption. In the 1950s, rural power consumption grew at a steady rate, but total rural consumption remained small because of the small base. The period between 1960 and 1970 saw China’s rural power consumption growing at an average annual rate of 34 percent, much higher than the growth rate of total national power consumption. In the 1980s and 1990s, rural power demand continued to grow rapidly. In 1978, the percentage of towns, villages and rural households that had access to electricity were respectively 86.83 percent, 61.05 percent and 93.3 percent, while by 2000, these percentages rose to 98.45 percent, 98.23 percent and 98.03 percent.
According to statistics issued by the State Grid Corporation of China, national power development programmes such as rural power grid renovation and universal access to electricity have greatly improved access to electricity in rural and remote areas. Between 2003 and 2011, the grid power transformation capacity, electricity sales and power consumption per capita at and below the county level grew 2.1 times, 1.9 times and 2.3 times respectively. Importantly, consumption of electricity at and below the county level grew more rapidly than in cities, and rural electricity consumption grew more rapidly than in county-level cities.
For some years, the price of electricity in rural areas remained higher than in urban areas because the cost of power supply was much higher in the former, due to the high cost of maintaining the grid and low electricity load factor in rural areas. In order to reduce the price of electricity in rural areas, the rural electricity administration system was reformed and the rural power grid was renovated. Now, in most regions of China, rural and urban residents pay the same price for electricity.
Development of Smart Power Grids in ChinaIn China, a smart power grid is defined as a new model of power grid that includes various kinds of power generation equipment, power

EnErgy AccEss: country PErsPEctivEs
130 The Future of Energy
transmission and distribution networks, electric equipment and energy storage equipment along with the physical power grid. This is the basis by which the physical power grid is integrated with modern transducing and measuring technology, network technology, information communication technology, automation technology, intelligence control technology and so on. These technologies can monitor, control and accommodate the state of all the equipment of the power grid and can systematically and comprehensively optimise and balance the whole grid (achieving a balance between power generation, power transmission and distribution, and power use). A smart grid thus makes the electric power system clean, efficient, secure and reliable.
Accordingly, China’s State Power Grid Corporation‘s goals for building a nationally unified smart power grid were adopted in the 12th Five-Year Programme (2011-2015) on National Economic and Social Development. Further, goals and policy measures for speeding up the construction of a nationally unified power grid system have been specified in the “12th Five-Year Programme (2011-2015) on National Energy Science and Technology Development” as well as in the “12th Five-Year Programme (2011-2015) on Projects of Industrialising Key Smart Power Grid Technologies.”
By now, marked progress has been made in the construction of smart power grids – represented by the Strong Smart Grid being built by China’s State Power Grid Corporation – as well as in technology research and development and in the demonstration of new technologies. Key smart power grid equipment such as intelligent switches, composite apparatus and Optical Fibre Composite Low-Voltage Cable has been successfully developed. The construction of the comprehensive demonstration project of smart grid, the wind and solar power storage and transmission demonstration project in the Sino-Singapore Tianjin Eco-city, the Baoqing Lithium Battery Energy Storage Power Station Pilot Project,
and the Pilot Project of Wind Power Prediction and Operation Control for Large-Scaled Wind Farms in Shenzhen have all begun. Smart grid industry clusters such as the Central Plains Electronics Valley in Henan Province, the Jiangsu Provincial Smart Grid Research and Industrial Base, and the Smart Grid Industrial Park in Yangzhou have already taken shape.
According to the China’s State Power Grid Corporation’s plan, the construction of a nationally unified ultra-high voltage power grid made up of two vertical lines and two horizontal lines will be finished by 2015. The construction of a nationally unified ultra-high voltage power grid made up of three vertical lines and three horizontal lines will be through by 2017, while the construction of a nationally unified ultra-high voltage power grid made up of five vertical lines and five horizontal lines will be done by 2020. In addition, a project of 27 UHV DC transmission lines will also be completed by then. All these will lay a solid foundation for developing a nationally unified smart grid.
Structure and Trend of Rural Cooking EnergyAt present, rural cooking energy in China is mainly firewood (crop stalks and fuel wood), coal, liquefied gas/natural gas, electricity, biogas and solar energy. In 1996, 94.55 percent of rural households used firewood and coal as cooking energy and 5.07 percent used liquefied gas/natural gas for cooking purposes. By 2010, the percentage of rural households using firewood and coal as cooking energy fell to 48 percent, and the percentage of rural households using liquefied gas/natural gas as cooking energy increased to 22 percent. Meanwhile, 24 percent of rural households started to use biogas as cooking energy, six percent started to use electricity and one percent started to use solar energy.
Drivers for these changes in the structure of rural cooking energy in China include supportive
EnErgy AccEss: country PErsPEctivEs
131The Future of Energy
policies, technological advancement and the increasing income of rural households. The Chinese government has been supporting and encouraging rural households to use clean and renewable energy such as solar energy through subsidies. Technological advancements have created favourable conditions for biogas and solar energy to become stable and sustainable clean energy sources for rural areas. It has become possible for biomass solid fuel to be mass produced.
According to the goal of energy innovation set by the Chinese government, “the percentage of rural households using clean and renewable energy by 2020 should surpass 70 percent,” so it is anticipated that even more remarkable changes in the structure of rural cooking energy will take place. By then, it is expected that the percentage of rural households still using firewood and coal as cooking energy will fall from 48 percent in 2010 to 5.49 percent; the percentage of rural households using liquefied gas/natural gas as cooking energy will rise from 22 percent in 2010 to 24.5 percent; the percentage of rural households using biogas as cooking energy will rise from 24 percent in 2010 to 39.95 percent; the percentage of rural households using electricity as cooking energy will rise from 6 percent in 2010 to 10.07 percent; and the percentage of rural households using solar energy as cooking energy will rise from one percent in 2010 to 6.67 percent.
Development of Biomass Energy in Rural ChinaIn 2006, “Several Opinions on Advancing the Construction of Socialist New Countryside” by the Communist Party of China’s (CPC) Central Committee proposed to speed up rural energy development, actively spread biomass energy technology in suitable areas, substantially increase investment in rural biogas development and take advantage of biogas as a driver to promote renovation of rural household pigsties (and sheepcotes, lairs, stables) as well as of rural household toilets and kitchens. In 2012,
the 18th National Congress of the CPC called for advancing the revolution of energy production and consumption as well as creating innovations in energy supply.
The use of biomass energy in China began with rural households. Efforts of quite a few decades in China have reaped preliminary results - the government has been subsidising construction of rural household biomass digesters. The number of rural household biogas digesters increased from 18.06 million in 2005 to 40 million in 2012, and their annual output of biogas grew from 7.06 bcm in 2005 to 14 bcm in 2010. From 2005 to 2009, the number of livestock and poultry breeding farm biogas digesters increased from 3,556 to 536,354, and their annual output of biogas grew from 230 mcm to 765 mcm. In addition, the number of biomass tanks reached more than 1,500 in 2010, whose average capacity is 31 mcm each.
Subsidies for Developing Renewable EnergySubsidies for developing renewable energy mainly cover four items: rural household biogas digesters, livestock and poultry breeding community biogas projects and biogas projects for a number of rural households, large/medium-sized livestock and poultry farm biogas projects, and rural biogas service outlets. The subsidy standards are as follows:
Rural household biogas project: A rural household biogas project includes building a biogas digester and renovating the kitchen, the toilet and the pigsty/sheepfold/pen/stable. The total cost of this kind of project is about 4,000 RMB, which is shared by the central government, the local government and the rural household. The central government provides 1,200 to 1,500 RMB (1,500 RMB for households in the western region), the provincial government 1,000 RMB, the county government another 1,000 RMB and the household pays 500 to 800 RMB (500 RMB for households in the western region).

EnErgy AccEss: country PErsPEctivEs
132 The Future of Energy
Livestock and poultry breeding community biogas projects, and biogas projects for a number of rural households: A livestock and poultry breeding community biogas project refers to one that designates a zone for all livestock and poultry breeding of different households in a village. In this zone, livestock manure and waste water are collected and utilised to produce and supply biogas for a community of 50 rural households. The project includes a methane fermentation pool and facilities for pre-treatment of raw materials, biogas supply facilities and biogas manure utilisation.
The central government’s subsidy to each household for a livestock and poultry breeding community biogas project, and biogas project using livestock and poultry manure, is up to 120 percent of the amount for each rural household biogas project (1,200 RMB/1,500 RMB X number of households X 120 percent). The central government’s subsidy to each household joining a biogas project for a number of rural households by using straw as raw material is up to 150 percent of the amount given for each rural household biogas project (1,200 RMB/1,500 RMB X number of households X 150 percent).
Large and medium-sized biogas projects in livestock and poultry farms: The central government subsidises each pigsty with more than 3,000 pigs, each cattle farm with more than 200 milk cows and each beef cattle farm that annually produces 500 cattle to build a biogas project. To qualify for the subsidy, these livestock farms must be independent legal entities, well operated and capable of sharing the required part of the total investment. Usually, the central government’s subsidy is about 25 percent of the total investment up to one million RMB. The provincial government is required to subsidise another 25 percent and the municipal/county government another 20 percent.
Rural energy service system and its service outlets: Each county-level service station of the rural
energy service system in the central region can get a subsidy of 150,000 RMB from the central government, and one in the western region of 200,000 RMB. A village/town service outlet in the central region can get a subsidy of 35,000 RMB from the central government, while one in the western region can get 45,000 RMB.
Energy Access in Russia
Though nearly everyone in Russia has access to energy resources and there is practically no energy poverty in the country, structural problems in several areas impede provision of energy. The Russian power market is officially divided into three groups: Price zones, non-price zones and isolated areas (see Figure 1).
Price zones include the European zone, the Urals and Siberian zone. They are the core of the Russian United Energy System. The wholesale electricity market, with a large number of competing providers, works here. Prices are therefore not regulated. The competition among providers and their ability to substitute one another in case of an emergency ensure stability of supply and a relatively low level of electricity tariffs.
Non-price zones are also included in the United Energy System, but climatic conditions and large distances between consumers make competition among providers impossible. Prices are therefore regulated by the state in these areas. Tariffs are determined every year by the Federal Tariff Service on the basis of complicated calculations of production and transportation costs. The state’s intervention ensures relatively low tariffs. At the same time, the absence of market competition results in a lack of stimuli to modernise energy infrastructure.
Isolated areas experience the largest problems in terms of stability of access to energy resources. These areas are sparsely populated and represent a small portion of Russian energy market (only 9.4 GW of capacity43) but cover a huge area –

EnErgy AccEss: country PErsPEctivEs
133The Future of Energy
about one-third of the territory of Russia. They are not included in the United Energy System and there is no wholesale electricity market here. Moreover, most of these areas have no local energy resources. Fossil fuels are provided for their needs from the other regions on the eve of every cold season. It is done through the so-called “North delivery” – the regular large-scale provision of oil products, coal and fresh food products to the distant territories of the northeast subsidised by the state. The absence of market forces and the lack of local energy resources, combined with bad infrastructure and long distances, impose various risks on access to electricity in isolated areas.
First, electricity tariffs are much higher in the isolated territories than in the other areas. For example, in Magadan Oblast the simple electricity tariff for households using gas stoves amounts to 4.85 rubles/kWh. For reference, in Moscow Oblast
(the richest part of Russia) tariffs do not exceed 3.8 rubles/kWh, and in Volgograd Oblast (the Volga region), the maximum is 2.53 rubles/kWh.44 Average wages in northeastern Russia are higher than in other parts of the country because of an additional allowance for working in severe climatic conditions and the region’s remoteness from economically developed areas. However, there are some for whom energy bills represent a heavy burden, including those indigenous to the region.
Secondly, infrastructure and facilities in isolated areas are extremely outmoded. Breakdowns happen very often and there is no backup. Blackouts in Sakhalin Oblast, Kamchatkakrai, Magadan Oblast’ and other isolated areas have become regular occurences for the local population. Another factor that increases the possibility of breakdowns is the unstable climate, characterised by frequent cyclones from the ocean.
Figure 1: Zones of the Russian Power Market
Source: Kristiansen T. The Russian Power Market // The International Association of Energy Economics Energy Forum, No. 1, 2011.

EnErgy AccEss: country PErsPEctivEs
134 The Future of Energy
Thirdly, there is an additional risk for isolated regions due to poor logistics and dangers of interruptions in the “North delivery.” For many settlements, cargos are delivered by rivers or roads that are passable for only some weeks in a year. In case of bad weather or an accident, cargos sometimes can not be delivered, which forces local authorities to declare a state of emergency and claim special federal support.
The problems of access to energy resources in isolated regions can be mitigated in a number of ways. The government plans to build new power lines, implement renewable energy and develop transport infrastructure within the parameters of the Energy Strategy of Russia up to 2030 (2009),45 the State Programme of Social and Economic Development of the Far East and Baikal region (2013),46 and the Strategy of Development of Arctic Zone and Ensuring of National Security up to 2020 (2013).47
EnErgy AccEss: country PErsPEctivEs
135The Future of Energy
Endnotes
1 United Nations, Millennium Development Goals, accessed December 2013 http://www.un.org/millenniumgoals/. 2 Vijay Modi et al., Energy and the Millennium Development Goals (New York: Energy Sector Management Assistance Programme,
UNDP (2005).3 International Energy Agency (Paris: World Energy Outlook, 2010), 245.4 International Energy Agency (Paris: World Energy Outlook, 2010), 238.5 Global tracking framework, Sustainable Energy for All, accessed 19 December 2013 http://www.unep.org/
pdf/778890GTF0full0report.pdf.6 A New Global Partnership: Eradicate Poverty and Transform Economies through Sustainable Development, United Nation (New
York: UN, 2013), accessed 18 December 2013, http://www.un.org/sg/management/pdf/HLP_P2015_Report.pdf. 7 International Energy Agency (Paris: World Energy Outlook, 2010), 238.8 International Energy Agency (Paris: World Energy Outlook, 2010), 88.9 International Energy Agency (Paris: World Energy Outlook, 2010), 92.10 International Energy Agency (Paris: World Energy Outlook, 2010), 93.11 Census of India (2011)12 ABPS presentation 13 Prayas presentation14 Socioeconomic Impact of Rural Electrification in India (1983)15 Characteristics of Energy Access to the Poor and to Impoverished Regions in India16 New Definition of electrification by Government of India17 Kirit Parikh18 International Energy Agency (Paris: World Energy Outlook, 2013), 9319 N.C. Saxena, Wood Fuel Scenario & Policy in India, (Bangkok: FAO, 1997)20 National Council of Applied Economic Research21 Arvind Subramanium, “The economic consequences of Professor Amartya Sen”, Business Standard, July 9, 2013.22 Ïntegrated Energy Policy, (New Delhi: Planning Commission, 2006), 7323 “Pain at the Pump”, Bloomberg, accessed 15 January 2015 http://www.bloomberg.com/visual-data/gas-prices/24 Prasad, d.u. South African Electrification Programme, accessed 15 January 2015 http://energy-access.gnesd.org/index.
php?option=com_content&view=article&id=141:south-african-electrification-programme&catid=3:projects&Itemid=2425 Bekker,B., Gaunt, C.T. &Eberhard, A. d.u. Uncertainties within South Africa’s goal of universal access to electricity by 2012.
accessed 15 January 2015 http://www.gsb.uct.ac.za/files/UncertaintieswithinSouthAfricasgoalofuniversalaccesstoelectricity.pdf
26 Greg Ruiters, “Free basic electricity in South Africa: A strategy for helping or containing the poor?” in Electric Capitalism, ed. David Mcdonald, 249 – 263.
27 David Mcdonald, “Electric Capitalism: Conceptualizing electricity and capital accumulation in (South) Africa?” in Electric Capitalism, ed. David Mcdonald, 1 – 50.
28 Prasad, d.u. South African Electrification Programme.Available on the GNESD website.http://energy-access.gnesd.org/index.php?option=com_content&view=article&id=141:south-african-electrification-programme&catid=3:projects&Itemid=24
29 Prasad, d.u. South African Electrification Programme.Available on the GNESD website.http://energy-access.gnesd.org/index.php?option=com_content&view=article&id=141:south-african-electrification-programme&catid=3:projects&Itemid=24
30 Dr Wolsey Barnard. Overview of South African Non-grid Electrification Programme31 Barnard,W. d.u. Overview of South African Non-grid Electrification Programme. 32 Prasad, d.u. South African Electrification Programme.Available on the GNESD website.http://energy-access.gnesd.org/index.
php?option=com_content&view=article&id=141:south-african-electrification-programme&catid=3:projects&Itemid=2433 Greg Ruiters, “Free basic electricity in South Africa: A strategy for helping or containing the poor?” in Electric Capitalism, ed.
David Mcdonald, 249 – 263.34 Taryn Dinkelman, “The Effects of Rural Electrification on Employment: New Evidence from South Africa”, IDEAS (2008), accessed
15 January 2015, https://ideas.repec.org/a/aea/aecrev/v101y2011i7p3078-3108.html.35 Prasad, d.u. South African Electrification Programme, accessed 15 January 2015, http://energy-access.gnesd.org/index.
php?option=com_content&view=article&id=141:south-african-electrification-programme&catid=3:projects&Itemid=2436 Greg Ruiters, “Free basic electricity in South Africa: A strategy for helping or containing the poor?” in Electric Capitalism, ed.
David Mcdonald, 249 – 263.37 ibid38 ibid

EnErgy AccEss: country PErsPEctivEs
136 The Future of Energy
39 ibid40 ibid41 ibid42 ibid43 Renewable Energy Policy in Russia: Waking the Green Giant (Washington D.C.: IFC, 2011) 44 Nekommercheskoyepartnyorstvogarantiruyuschikhpostavschikovienergosbytocykhkompaniy. The official site: http://www.
pricemap.npgp.ru/45 Energeticheskaya strategiya Rossii na period do 2030 goda. Utverzhdena rasporyazheniem Pravitel’stva ot 13.11.2009
#1515-r.46 Gosudarstvennaya programma Rossiiskoy Federatsii “Social’no-ekonomicheskoye razvitiye Dal’nego Vostoka I Baikal’skogo
regiona”. Utverzhdena rasporyazheniem Pravitel’stva ot 29.03.2013 #466-r.47 StrategiyarazvitiyaArkticheskoyzonyRossiiskoyFederatsiiiobespecheniyanatsional’noybezopasnostina period do 2020 goda.
UtverzhdenaukazomPrezidenta 20.02.2013.


www.orfonline.org


![[ OIL AND GAS INDUSTRY ] · production of 3.3 million barrels per day of crude oil and 13.6 billion cubic feet of natural gas as of July 2013. 1 With a business environment that protects](https://img.dokumen.tips/doc/110x75/5f05ea127e708231d4155a4c/-oil-and-gas-industry-production-of-33-million-barrels-per-day-of-crude-oil.jpg)