Embed Size (px)
Citation preview

THE FIXED-INCOME MARKET IN URUGUAY*
Julio de Brun (Universidad ORT Uruguay)
Néstor Gandelman (Universidad ORT Uruguay)
Herman Kamil (International Monetary Fund)
Arturo C. Porzecanski (American University and Columbia University)
May 2006
Third Draft
Abstract
Uruguay’s capital markets remain underdeveloped despite the country’s financial
liberalization dating back to the 1970s, which was reinforced by passage of several
additional laws in the 1990s whose aim was to promote the local financial markets. The
government is able to raise funds domestically in what is a liquid bond market, but
private firms continue to fund themselves mostly out of retained earnings or else via
bank loans and suppliers’ credit. Moreover, when compared to others in Latin America,
Uruguayan firms feature the highest ratios of liability dollarization, and corporate debt
structures with the shortest maturities – currency and maturity mismatches that render
them (and by extension, their creditors) extremely fragile. A deepening of the domestic
capital market would probably alleviate this vulnerability of the Uruguayan economy.
The financial fragility of Uruguayan firms amplified by corporate governance issues are
the main impediments for the development of the capital markets. Given the current
firm practices and the absence of sizeable institutional investors besides the Pension
funds, the fixed income market will most likely remain a source of funding for very few
firms.
* The authors express their gratitude to Giorgina Piani for help in designing the survey; GriseldaCharlo, Graciela Basañez and Susana Picardo of the National Institute of Statistics (INE) for thesurvey’s implementation; Eduardo Barbieri of the Electronic Stock Market (BEVSA) for hissupport with the survey of financial intermediaries; Bruno Gili and Ignacio Munyo for sharingrelevant corporate financial data they had previously collected; and Daniel Sieradzki and GabrielMoszkowicz for excellent research assistance. All remaining errors are the sole responsibility ofthe authors. The views expressed herein are those of the authors and do not necessarily reflectthe views of the International Monetary Fund.

2
TABLE OF CONTENTS
TABLE OF CONTENTS 2
1. INTRODUCTION 3
2. THE DEVELOPMENT OF THE URUGUAYAN CAPITAL MARKET 4
2.1 Background 4
2.2 From the 1970s to the Brady Plan 4
2.3 Government access to international markets 6
2.4 Incipient development of the corporate sector 9
3. SUPPLY ANALYSIS: THE CORPORATE SECTOR 12
3.1 Databases 13
a. The AIN financial database 13
b. The INE survey 14
3.2 Financial structure of Uruguayan firms 16
a. Term and currency mismatches 19
b. The effect of an unanticipated devaluation 23
3.3 Survey of potential issuers: the INE database 26
a. Role of knowledge 26
b. Issuance of bonds and ABS 28
c. Problems with bank financing 28
d. Problems with bond financing 29
e. Obstacles to obtaining financing in Uruguay 30
f. Criteria to choose financing sources 31
3.4 Costs of issuance in the Uruguayan marketplace 32
4. DEMAND ANALYSIS: INSTITUTIONAL INVESTORS 33
4.1 The agents and their portfolios 33
4.1 Survey of institutional investors and intermediaries 36
a. Pension funds 36
b. Other institutional investors 38
c. Financial intermediaries 39
5. CONCLUSIONS 40
REFERENCES 42
APPENDIX 44
3
1. Introduction
The capital markets in Uruguay have remained underdeveloped despite thegrowth and internationalization of its onshore and offshore banking industryfollowing a liberalization that took place in the 1970s. Not even the developmentof a lively, liquid market for government securities has been able to nurture theparallel growth of a corporate bond market, and thus virtually all companiescontinue to rely mostly on financing from banks and suppliers rather than fromthe capital markets (De Brun, Gandelman and Barbieri, 2003). Certain lawspassed in the mid-1990s specifically intended to promote the development ofthe local capital markets did boost the issuance of corporate debt, particularlyon the part of banks. However, after some corporate defaults and near-defaultepisodes took place in the late 1990s, the confidence of investors was shatteredand the fledgling corporate bond market shriveled up – a vivid application of theliterature on agency costs and on the opportunistic behavior of shareholdersover bondholders.
In 2002, Uruguay suffered a profound financial crisis triggered by contagioneffects from the run on banks, massive currency devaluation, and giganticdefault on sovereign debt that took place in next-door Argentina. In the wake ofa run on its own exceedingly dollarized banking system, Uruguay’s governmentwas forced by the ensuing loss of international reserves to let the currencydepreciate rapidly; come to the financial support of some financial institutionsand intervene several failing private-sector banks, for which purpose massivefinancial backing from the Washington-based multilateral agencies wasobtained; and eventually arrange for a market-friendly restructuring of the publicdebt. The fall-out of this crisis on the local capital markets was such that thevolume traded in the traditional stock exchange fell by 14% in 2002 measured inUS dollars (USD), while volumes in the electronic exchange dropped by morethan half. Starting in the fourth quarter of 2003, however, the Uruguayaneconomy has staged a vigorous recovery and the government has regainedaccess to the domestic and international capital markets; in contrast, the localequity and fixed-income markets have not revived. There is lingering damage interms of investor confidence in firms, regulators, auditors and credit-ratingcompanies – but these may not be the only impediments to the furtherdeepening of the domestic fixed-income market.
The objectives of this paper are: (a) to recall the stunted development of thedebt market in Uruguay, including for both government and corporateinstruments; (b) to analyze whether and how the limited availability of long-termfunding via the fixed-income market is related to firm characteristics, like theirsize (d) to determine what institutional and regulatory aspects are hamperingthe development of the domestic capital markets. For this purpose, we haveconstructed a financial database on Uruguayan firms and we have generatednew data from a comprehensive survey of potential corporate issuers,institutional investors, and financial intermediaries.
The paper is organized as follows. Section 2 presents an overview of theUruguayan capital markets. The analysis of the supply side is conducted in

4
Section 3, including an analysis of the financial structure of Uruguayan firms,the perceived obstacles for each financing alternative, and an analysis of thecost of issuing bonds. Section 4 focuses on the demand side, with a descriptionof the main local institutional investors and the problems they believe exist.Section 5 is the conclusion.
2. The development of the Uruguayan capital market
2.2.1 Background
Between the 1930s and 1950s, Uruguay’s economy grew strongly based on animport-substitution strategy made viable by booming international demand forits agricultural products during World War II and the Korean War. However, therise of agricultural protectionism in Europe and the U.S., the small size of thedomestic market, increased recourse to inflationary finance of the governmentbudget, and the distortions generated by various forms of state interference,ended up depleting the possibilities of investment growth via this developmentstrategy. The Uruguayan economy thus experienced high inflation, massivecurrency depreciation, and economic stagnation between the mid-1950s andthe mid-1970s, with grave social and political consequences.
The surge of domestic inflation in the 1950s eroded the value of the public debtissued up to the 1930s to finance the development of most of the publicinfrastructure both at national and local government levels. The inflationaryenvironment and the weakness of the tax structure (mostly based on exporttaxes and import tariffs applied to a shrinking base of foreign trade) closed thegovernment’s access to financial markets starting in the late 1950s. Thedistortions introduced by inflation in the information provided by corporatefinancial statements also reduced their reliability and the attractiveness ofprivate-sector securities, and turnover in the local stock exchange decreasedsteadily until the mid-1970s.
2.2.2 From the 1970s to the Brady Plan
After stabilization policies and structural reforms were implemented starting in1973, inflation decelerated and economic growth resumed, accompanied by anincrease in foreign trade and private investment. The reforms included a taxstructure modernization, trade liberalization, and full convertibility of the capitalaccount of the balance of payments. Specifically, a value-added tax wasintroduced, non-tariff barriers to trade were mostly eliminated, import tariffswere gradually reduced, interest rate caps became non-binding, exchange-ratecontrols were eliminated, and the access of financial intermediaries to thecapital markets was liberalized.
A subsequent improvement in the fiscal situation allowed the government toreturn to the financial markets, and it did that by issuing securities via the local
5
stock exchange. Given the full convertibility of the Uruguayan peso, thegovernment was able to issue long-term debt denominated in USD, which wasaccepted by domestic and regional investors eager to protect themselves fromthe ravages of inflation. It was through domestic issues of short- and medium-term (up to 8-year) government debt that the local capital market was given anew lease on life after the mid-1970s.
Indeed, the government’s financing needs and liability-management operationshave set the tone for most activity in the Uruguayan capital markets ever sincethe financial reforms of the 1970s. Although it is counterintuitive at first sight, thedebt crisis of the 1980s spurred the issuance of public debt in the domesticcapital market as a substitute for the financing that was no longer forthcomingfrom foreign banks, the main source of new funds for the public sector duringthe second half of the 1970s. And because of the government’s relatively goodbehavior during the regional debt crisis – specifically, interest payments werealways made on time, and no unilateral default was ever declared – thegovernment managed to finance fiscal deficits equivalent to more than 4% ofGDP during the 1980s, paying less than 200 bps over LIBOR in the domesticmarket while restructuring principal payments on its external debt with privatebanks under both the Baker Initiative and the Brady Plan1.
As can be seen in Table A1 in the Appendix, there was a high and increasingparticipation of short-term debt (Treasury bills) in the market for governmentdebt during the second half of the 1980s. Starting in 1991, however, andfollowing the successful debt restructuring under the Brady Plan, thegovernment pursued a strategy of extending maturities. This is reflected in thedecreasing participation of short-term debt during the 1990s all the way until2001, when adverse developments in Argentina and then in Brazil scaredinvestors – and bank depositors – away.
The loans from international banks that were restructured successively sincethe early 1980s until the Brady arrangement in February 1991, constituted theonly market obligations subject to foreign jurisdiction. The contractual featuresof those loans were such that they were registered as obligations of the CentralBank (Banco Central del Uruguay, BCU), as presented in Table A2 in theAppendix. The bonds issued under the Brady arrangement (Par, New Moneyand Debt Conversion bonds) likewise were the only ones issued under foreignjurisdictions until 1994, when the government began to place new debt in theinternational market mainly in the form of Eurobonds. Indeed, by the end of the1990s, half of the central government debt outstanding was issued subject toforeign jurisdictions – a share would continue to rise in the years that followed.
During the mid-1970s, when the domestic market for public debt began to bedeveloped, the BCU acted as the government’s financial agent, issuingsecurities through the Montevideo Stock Exchange (Bolsa de Valores de
1 In addition to the confidence that Uruguay’s sovereign bonds may have inspired among
domestic investors, there is no doubt that capital outflows from Argentina during the 1980s alsobecame a strong source of demand for Uruguayan public debt.
6
Montevideo, BVM), giving stockbrokers a premium on the face value of thesecurities. The bonds where usually issued at par, and they were distributedproportionally among the participants. This practice was maintained until theearly 1990s, when the BCU began to issue public debt through auctions in anover-the-counter (OTC) market. Since then, the public sector’s presence in theprimary debt market has been infrequent.
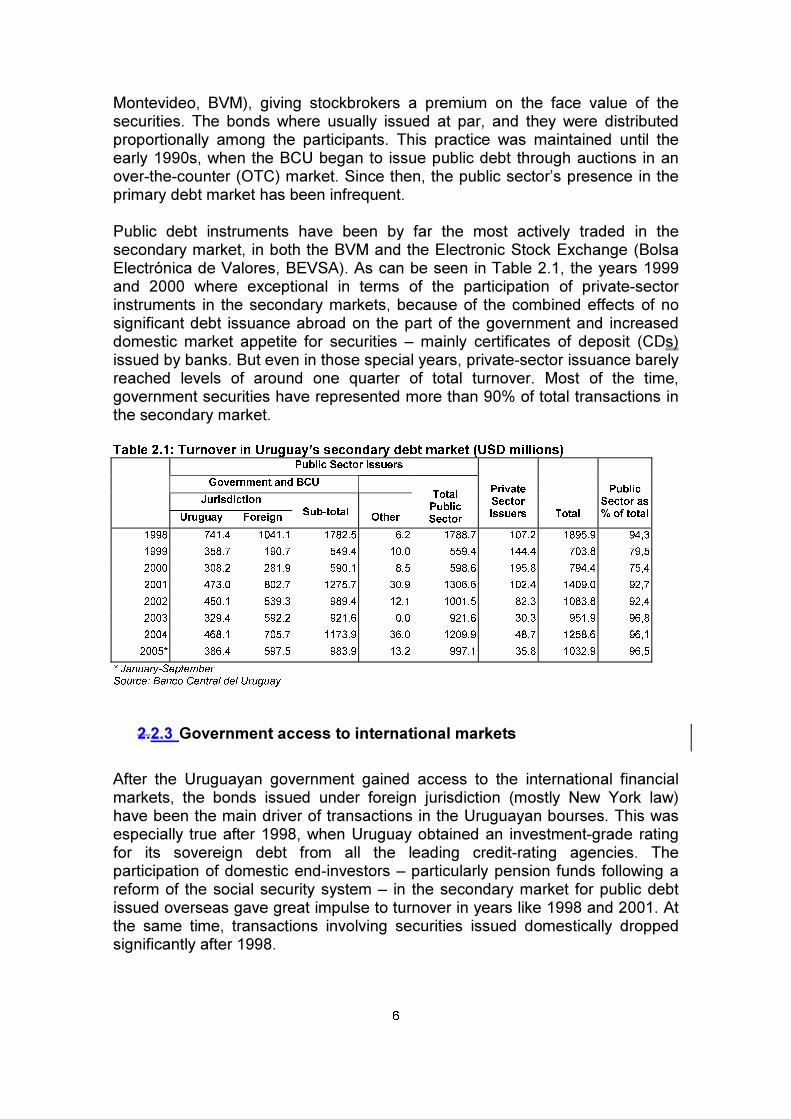
Public debt instruments have been by far the most actively traded in thesecondary market, in both the BVM and the Electronic Stock Exchange (BolsaElectrónica de Valores, BEVSA). As can be seen in Table 2.1, the years 1999and 2000 where exceptional in terms of the participation of private-sectorinstruments in the secondary markets, because of the combined effects of nosignificant debt issuance abroad on the part of the government and increaseddomestic market appetite for securities – mainly certificates of deposit (CDs)issued by banks. But even in those special years, private-sector issuance barelyreached levels of around one quarter of total turnover. Most of the time,government securities have represented more than 90% of total transactions inthe secondary market.
Table 2.1: Turnover in Uruguay’s secondary debt market (USD millions)Public Sector Issuers
Government and BCU
Jurisdiction
Uruguay ForeignSub-total
Other
TotalPublicSector
PrivateSectorIssuers Total
PublicSector as% of total
1998 741.4 1041.1 1782.5 6.2 1788.7 107.2 1895.9 94,3
1999 358.7 190.7 549.4 10.0 559.4 144.4 703.8 79,5
2000 308.2 281.9 590.1 8.5 598.6 195.8 794.4 75,4
2001 473.0 802.7 1275.7 30.9 1306.6 102.4 1409.0 92,7
2002 450.1 539.3 989.4 12.1 1001.5 82.3 1083.8 92,4
2003 329.4 592.2 921.6 0.0 921.6 30.3 951.9 96,8
2004 468.1 705.7 1173.9 36.0 1209.9 48.7 1258.6 96,1
2005* 386.4 597.5 983.9 13.2 997.1 35.8 1032.9 96,5
* January-SeptemberSource: Banco Central del Uruguay
2.2.3 Government access to international markets
After the Uruguayan government gained access to the international financialmarkets, the bonds issued under foreign jurisdiction (mostly New York law)have been the main driver of transactions in the Uruguayan bourses. This wasespecially true after 1998, when Uruguay obtained an investment-grade ratingfor its sovereign debt from all the leading credit-rating agencies. Theparticipation of domestic end-investors – particularly pension funds following areform of the social security system – in the secondary market for public debtissued overseas gave great impulse to turnover in years like 1998 and 2001. Atthe same time, transactions involving securities issued domestically droppedsignificantly after 1998.
7
The attractiveness of government securities issued abroad for participants inthe secondary market has been their relatively higher liquidity, at least incomparison with securities issued domestically, which usually have loweramounts outstanding. This effect was markedly reinforced after the debtrestructuring exercise of 2003, when many of the existing bonds submitted wereexchanged under the “liquidity option” for three “benchmark” bonds each ofwhich qualified (because of its size) to be included in the JP Morgan Emerging-Market Bond Index.2
The financial crises of 2002 and the debt exchange of 2003 seem to have hadenduring consequences on transactions in the domestic capital market. Not onlythe amounts traded in both domestic and external bonds are lower in recentyears than those observed in 2001, but also the composition of the instrumentshas changed. While in 2001 trading in domestic bonds amounted to US$440million and in short-term Treasury bills a mere US$32 million, in 2004transactions involving domestic bonds were reduced to US$195 million while inshort-term securities they increased to US$270 million. Even though thesuccessful debt restructuring of 2003 has allowed Uruguay’s government toregain access to the domestic and international financial markets, andsovereign spreads have compressed a great deal, the 2002-03 experience hasreinforced the traditional hold-to-maturity strategy of Uruguayan bondholders,reducing turnover in the secondary market and increasing the attractiveness ofshort-term instruments.
A visible characteristic of Uruguay’s public debt is its extremely high degree ofdollarization – now as well as before the 2003 debt restructuring. This long-standing willingness of the public sector to run a massive currency mismatchhas had repercussions throughout the Uruguayan financial system, and remainsone of its main sources of fragility (Licandro and Licandro, 2003; De Brun andLicandro, 2005). A critical step towards a greater presence of the domesticcurrency in the financial system and the capital markets is the development of ayield curve for sovereign instruments in domestic currency, to be used as abenchmark for the introduction of private-sector securities likewise denominatedin local currency, with the potential development of a market for derivativeproducts.
Indeed, during the past couple of years, the government has been trying topave the way for a financial market in peso-denominated instruments, featuringnominal, fixed-rate securities as well as inflation-adjusted debt. The issuance ofdebt instruments in pesos was kick-started when the BCU began to deal inshort-term Treasury bills in pesos for monetary policy purposes – and it grewrapidly during 2003-04, although the trend slowed down somewhat in 2005.
2 The Uruguayan debt exchange of 2003 gave bondholders two options: a) under the “extension
option,” an existing bond could be exchanged for a new one with same principal, currency andcoupon, but with an extended maturity (five years, on average); b) under the “liquidity option,”existing bonds could be exchanged for so-called benchmark bonds, under which many smallbonds could be aggregated. There were “benchmark” bonds both in the international and thelocal debt exchange transactions, but the size of the domestic benchmarks was much lowerthan the international ones.

8
Meantime, the introduction of inflation-adjusted instruments denominated inpesos got a boost from the international issue of a first inflation-linked bond inOctober 2003, for an amount equivalent to US$200 million.3 This was the firstplacement in the markets after the debt restructuring, and the first internationalissue of a Latin American sovereign bond denominated in local currency – atransaction that was emulated by Colombia and Brazil in 2004 and 2005,respectively. The real rate of 10.5% for a three-year maturity could beconsidered high, but was lower than the cost of placements made at that time inthe domestic market (usually above 11%).The catalytic effect of thatinternational placement is reflected in the increased interest of domesticinvestors -- and presumably foreign investors acting through domesticintermediaries – in local placements of UI bonds (where UI stands for unidadindexada, namely, debt indexed to the consumer price index). By the end of2004, the real interest rate on UI bonds with 10-year maturities had fallen tobelow 5%, and showed a further drop during 2005.
The successful placement of peso-denominated instruments in the local OTCand in international markets generated increased participation of thesesecurities in the local secondary market for public debt. Transactions involvinggovernment debt securities in pesos increased to 12% of total in 2003 (fromalmost zero before that) and to 26% in 2004, with a lower participation rate(above 20%) in the first nine months of 2005 (see Table 2.2). The lesserimpulse in the development of the secondary market for peso-denominatedinstruments in 2005 reflects the new government’s strategy to prioritize alengthening in the maturity of its debt, via long-term, USD-denominated debt inlocal and foreign markets. Nevertheless, the larger amount outstanding ofinflation-linked notes issued by the BCU and the government has helped toincrease turnover in the secondary market, from a mere 1.5% of public debttransactions in 2003 to 6% in 2004 and 14.5% in 2005.
Table 2.2: Public sector debt transactions by currency denomination (USD millions)2003 2004 2005*
Currency Value % of total Value % of total Value % of total
USD 843.1 87.8 948.7 73.8 744.4 74.2
Uruguayan pesos 113.1 11.8 330.1 25.7 224.4 22.4
Nominal 98.9 10.3 252.3 19.6 79.3 7.9
Indexed 14.2 1.5 77.8 6.0 145.1 14.5
Other 3.7 0.4 7.0 0.5 34.2 3.4
Total 959.9 100.0 1285.8 100.0 1003.1 100.0
* January-September.Source: Banco Central del Uruguay
The existence of a relatively active secondary market for public debtinstruments usually generates a mix of positive and negative externalities: Whilethey set a benchmark for private-sector debt issues which may prove useful forpricing and distribution purposes, they can also engender damaging crowding-out effects. Before undertaking our survey of potential corporate debt issuers,we hypothesized that the lively market for government debt in Uruguay would
3 This issue was expanded later (February 2004) to US$ 300 million.
9
have important implications for them, including in terms of issue size, pricing,maturity, and currency denomination. As it turns out, the potential issuers wesurveyed seem to disagree. With respect to their eventual issuance of bonds,only 15% of them believe that the mere existence of a liquid market forsovereign debt will facilitate their own issuance. In fact, the government isperceived as a competitor in the search for funding by 22% of surveyrespondents. In sum, most of the surveyed firms are neutral with respect to theimpact of government debt issuance in the market for private capital, but ifanything it is perceived more negatively than positively.
2.2.4 Incipient development of the corporate sector
During the 1990s, new legislation was enacted in an attempt to spur thedevelopment of a domestic capital market, particularly on the back of adeepening primary and secondary market for government securities. Many ofthe new rules were devoted to dealing with lingering issues of corporatetransparency.
The most important piece of legislation was the Securities Market Law (Law16.746 of May 30, 1996). Notwithstanding the initiative of the government topromote the approval of the Law, it also had the strong support o interestedparties, especially stockbrokers operating via the Montevideo Stock Exchange.From the side of the government, there was an explicit goal of facilitatingeconomic development through the deepening of financial access forUruguayan firms. The financial intermediaries, on their part, perceived businessopportunities with the development of the market for private sector securities,especially considering that renewed access by the government to internationalfinancial markets would gradually decrease the importance of the localexchanges in transactions involving public debt. Even for local banks, whichmay have seen challenges arising from the competition of capital markets inproviding funds for the corporate sector, the development of alternative sourcesof financing was perceived as a useful means to diversify financing risks. In fact,local banks have since acted as intermediaries in the public placement ofcorporate debt, with the main purpose of reducing their exposure to particularcorporate debtors.
Support from financial intermediaries for the new legislation was alsoforthcoming because the general framework adopted was too liberal withrespect to the regulation and supervision by government agencies ofintermediaries and stock exchanges. Notwithstanding the powers entitled to theBCU to regulate and supervise the activities of the exchanges, issuers andintermediaries, the over-the-counter transactions were explicitly excluded fromthe Securities Market Law provisions, and the principle of self-regulation ofbourses was enacted. Those weaknesses played a role in some irregularitiesobserved during the 2002 financial crisis. Besides, an attempt by the BCU topass a law (in December 2002) eliminating the self-regulation of bourses andincluding OTC transactions involving intermediaries under Securities Market
10
Law regulations met strong opposition from interested parties, who successfullylobbied against congressional discussion of the BCU proposal.
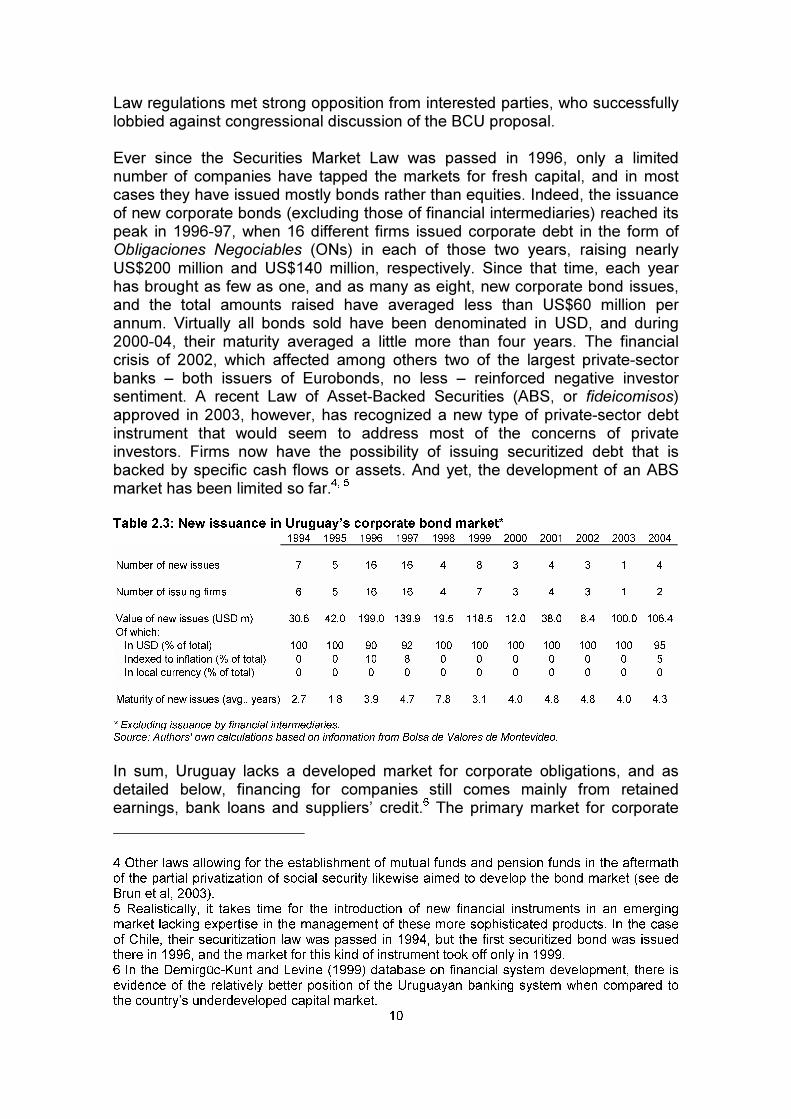
Ever since the Securities Market Law was passed in 1996, only a limitednumber of companies have tapped the markets for fresh capital, and in mostcases they have issued mostly bonds rather than equities. Indeed, the issuanceof new corporate bonds (excluding those of financial intermediaries) reached itspeak in 1996-97, when 16 different firms issued corporate debt in the form ofObligaciones Negociables (ONs) in each of those two years, raising nearlyUS$200 million and US$140 million, respectively. Since that time, each yearhas brought as few as one, and as many as eight, new corporate bond issues,and the total amounts raised have averaged less than US$60 million perannum. Virtually all bonds sold have been denominated in USD, and during2000-04, their maturity averaged a little more than four years. The financialcrisis of 2002, which affected among others two of the largest private-sectorbanks – both issuers of Eurobonds, no less – reinforced negative investorsentiment. A recent Law of Asset-Backed Securities (ABS, or fideicomisos)approved in 2003, however, has recognized a new type of private-sector debtinstrument that would seem to address most of the concerns of privateinvestors. Firms now have the possibility of issuing securitized debt that isbacked by specific cash flows or assets. And yet, the development of an ABSmarket has been limited so far.4, 5
Table 2.3: New issuance in Uruguay’s corporate bond market*1994 1995 1996 1997 1998 1999 2000 2001 2002 2003 2004
Number of new issues 7 5 16 16 4 8 3 4 3 1 4
Number of issuing firms 6 5 16 16 4 7 3 4 3 1 2
Value of new issues (USD m) 30.6 42.0 199.0 139.9 19.5 118.5 12.0 38.0 8.4 100.0 106.4
Of which:
In USD (% of total) 100 100 90 92 100 100 100 100 100 100 95
Indexed to inflation (% of total) 0 0 10 8 0 0 0 0 0 0 5
In local currency (% of total) 0 0 0 0 0 0 0 0 0 0 0
Maturity of new issues (avg., years) 2.7 1.8 3.9 4.7 7.8 3.1 4.0 4.8 4.8 4.0 4.3
* Excluding issuance by financial intermediaries.Source: Authors' own calculations based on information from Bolsa de Valores de Montevideo.
In sum, Uruguay lacks a developed market for corporate obligations, and asdetailed below, financing for companies still comes mainly from retainedearnings, bank loans and suppliers’ credit.6 The primary market for corporate
4 Other laws allowing for the establishment of mutual funds and pension funds in the aftermathof the partial privatization of social security likewise aimed to develop the bond market (see deBrun et al, 2003).5 Realistically, it takes time for the introduction of new financial instruments in an emergingmarket lacking expertise in the management of these more sophisticated products. In the caseof Chile, their securitization law was passed in 1994, but the first securitized bond was issuedthere in 1996, and the market for this kind of instrument took off only in 1999.6 In the Demirgüc-Kunt and Levine (1999) database on financial system development, there isevidence of the relatively better position of the Uruguayan banking system when compared tothe country’s underdeveloped capital market.
11
securities is currently dominated by the issuance of certificates of depositissued by banking institutions, which have accounted for almost 80% of totalprimary issuance in recent years. The issuance of a first ABS by the state-owned electric company represented 11% of total issuance in 2004, whilecorporate bonds accounted for a mere 6% of primary-market activity. Thesecondary market, for its part, has become mainly a vehicle for transactionsinvolving public debt instruments, which represented 94% of total turnover in2004.
In many recent business failures in Uruguay, a majority of equity holders haddelegated management to minorities. In other instances, minority shareholdersbecame hostage to majority owners who abused their rights, squeezing out saidminority players and forcing them to take heavy losses. A high-profile businessfailure – it later proved to be an organized scam – that took place in the late1990s elicited new regulation to enforce greater transparency. However, morerecent failures suggest that the problem is not solely one of lack oftransparency, but that agency problems may also be playing a significant role.These agency problems related to transparency and accountability issues haverecently been the focus on extensive debate around the globe, followingfinancial scandals even in the United States and Europe. Considering thatUruguay has an underdeveloped capital market, one could argue by analogywith the Klapper and Love (2002) findings that the role of corporate governanceis even more relevant than usual.
The peculiarities of separation (or lack thereof) between management,ownership and control may be relevant as well. It is typical in Uruguay thatboards of directors are very much linked to the main shareholders, andindependent persons serving on boards are very rare. In actual practice, it ismanagers, who are related to companies by virtue of labor contracts, whoconcentrate most decision rights – both managerial and control rights – ratherthan boards of directors. Yet another concern arises from the presence ofintegrated economic groups and of financial links among related companies.
The existing legislation on corporate structures (Law 16.060) includes someelements of protection for minority shareholders, but they are not sufficientgiven the practices and problems that have been encountered. Two governmentagencies have tried to fill the void: Recent regulations issued by the BCU havespecified duties, responsibilities and penalties in relation to external auditors,and the Office of the Auditor General (Auditoría Interna de la Nación, AIN) hasbeen introducing new rules to improve accounting standards and mandating theadoption of international best practices. But the most important improvement toLaw 16.060 will be the new Law on Bankruptcy procedures, which is about tobe debated in Congress. Its objective is to regulate the procedures governingcorporate debt restructurings and bankruptcies under a unified framework,inspired by the U.S. Chapter 11. Besides the acceleration of these procedures,including facilitating the transfer of ownership before a business loses its worth,which may help to increase recovery values, the proposed law also clarifies theresponsibilities and sanctions to acting majorities and managers in the failure ofa firm.

12
The country also has in place detailed regulations on the operations of credit-rating agencies, an activity that has come under scrutiny in recent yearsbecause of a series of failures in the assessment of corporate creditworthinessas evident in episodes of default in the context of the crisis of 2002. In our view,Uruguay’s experience with rating agencies is not all that dissimilar to thatobserved in other countries hit by systemic financial crises. As pointed outbelow when summarizing the results of our survey of institutional investors, itappears that the local market has come to accept the outcome even thoughthose default episodes did cause the rating agencies to lose some of theirreputation.
A technical issue that introduces a high degree of risk in the operation of thecapital markets in Uruguay, notwithstanding the difficulty of ascertain its preciseimpact, is the absence of a single depository agent and the less-than-adequateclearing and settlement process (Clarke, 2004). The BCU is the depositoryagent of securities included in the portfolios of the pension funds, as it is ingeneral when it comes to government securities issued in the domestic marketon a book-entry basis. However, there is no regulation in place concerning thecustody of physical bonds or securities issued by other financial and non-financial corporations. Moreover, the compensation process takes place in thefirst instance in the corresponding exchanges, and after that net balances aresettled on a bilateral manner through the accounts that agents maintain at theBCU. Since no guarantees are demanded on credit lines of the different marketoperators, there is always a risk that the transaction will not be completed, as infact happened in 2002 after four financial institutions were suspended. This isan issue which may be resolved in the near future, given the recentannouncement made by the BCU that it has drafted a new law that clarifies theprocess of payment-order confirmation and the introduction of collateral to backtransactions.
3. Supply analysis: The corporate sector
Here we describe the financial structure of Uruguayan firms and report on themain problems faced to finance their activities. We made use of two sources ofdata. First, we enlisted the collaboration of the National Statistics Institute(Instituto Nacional de Estadística, INE), which agreed to conduct a specialsurvey targeted at potential issuers of securities. The survey took place duringAugust-September 2005. We refer to this as the INE database. Second, usingdata from the Office of the Auditor General (AIN), we construct a financialdatabase covering 2001-03 that may shed light in the change in the financialstructure before and after the 2002 crisis, and may also differentiate betweenpublicly traded and non-publicly traded firms. We refer to this as the AINdatabase.

13
2.3.1 Databases
2.a. The AIN financial database
Past research on the financial structure of companies operating in Uruguay hasbeen hampered by the paucity of published balance sheets and incomestatements. This has been, in large measure, a consequence of theunderdevelopment of the country’s equity and fixed-income markets, whichmeant that most firms did not have to disclose such information.
In recent years, a great deal of corporate data has become available throughAIN, which has now made accessible a statistical base covering all sectors ofthe economy. One recent research effort by Munyo (2005) focused on acarefully defined sample of 500 enterprises (excluding financial and duty-free-zone companies) during 2001, before the country’s latest economic crisis. Inorder to be able to compare the financial structure of firms before and after theexchange rate crisis of 2002, we combined data from Munyo (2005) and Gili(2005) and gathered new financial statements in order to have the financialinformation of 98 firms before and after the exchange rate crisis. 7 8 Therefore,we have a picture of the financial structure of publicly and non-publicly tradedfirms under a crawling currency peg regime (up to mid-2002) and under asharply depreciated, floating currency regime (afterwards). Table 3.1 presentsthe number of observations by sector of activity (ISIC Revision 2) and accordingto degree of access to the capital markets.
Table 3.1: Number of firms as per the AIN financial databaseISIC (Rev 2):
1. Agriculture, Hunting, Forestry and Fishing 2
2. Mining and Quarrying 0
3. Manufacturing 42
4. Electricity, Gas and Water 0
5. Construction 4
6. Wholesale and Retail Trade and Restaurants and Hotels 29
7. Transport, Storage and Communication 4
8. Financing, Insurance, Real Estate and Business Services 0
9. Community, Social and Personal Services 8
0. Activities not Adequately Defined 9
Access to the capital market:
Non-publicly traded 86
Publicly traded 12
7 Many financial statements from the AIN were made available to Universidad ORT thanks to an
agreement with the business association Liga de Defensa Comercial (LIDECO).8 The final database is mucher larger in terms of firms and years but we restrict to these 98firms for 2001 and 2003 to avoid composition biases.
14
Total 98
Source: Authors’ own calculations based on AIN.
2.b. The INE survey
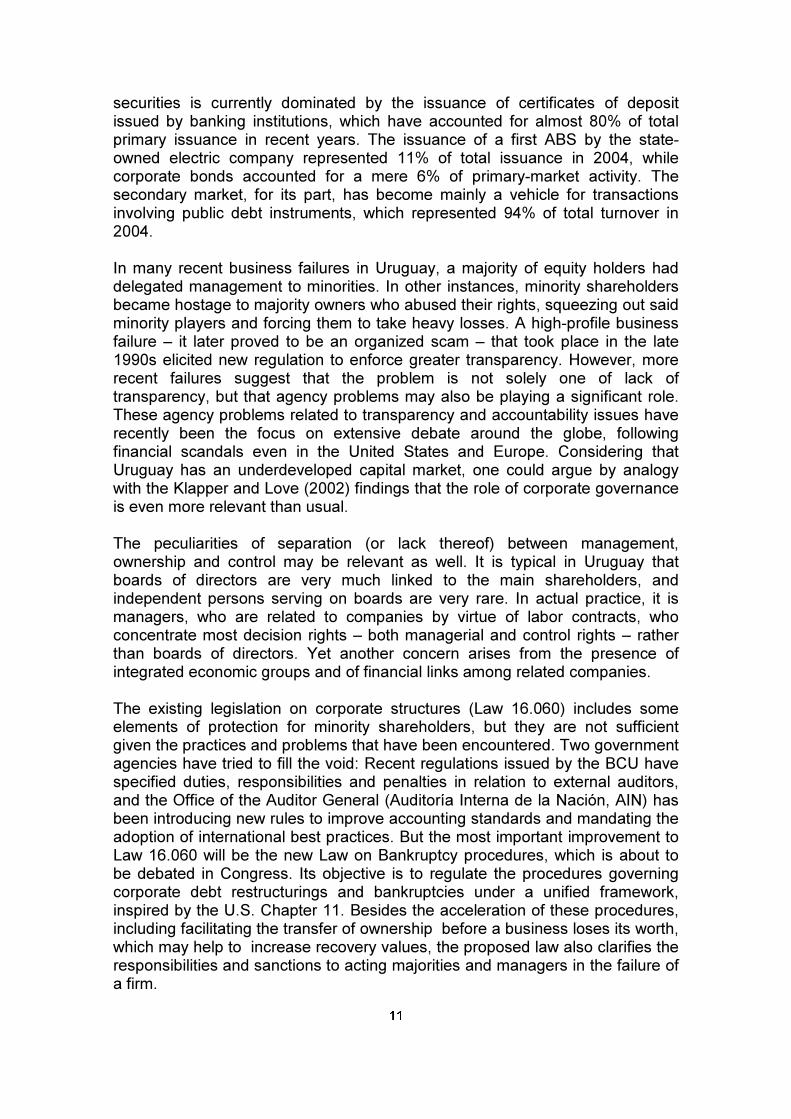
INE conducts an annual survey of economic activity that encompasses mostsectors of the economy. Since the capital markets are not a real option for smallfirms, we did not attempt to target INE’s whole sample: Our sample thereforeincludes all firms regularly surveyed by INE that have more than 50 employees.The rate of response was to 100%,9 and we therefore ended up with 463 firmsadequately covering the following sectors (according to ISIC Rev. 3): D-Manufacturing, G-Commerce, H-Hotels and restaurants, I-Transportationservices, K-Real estate and machine rentals, M-Educational services, and N-Health services.
Table 3.2 disaggregates surveyed firms by branch of activity and by district oflocation (so-called departments). Given Uruguay’s economic structure, the mostimportant omission from the sample is that of individuals and firms engaged inactivities such farming and cattle. The rest of the economy would appear to beadequately represented. Table 3.3 presents the breakdown by location(department). As expected, especially due to the omission of firms engaged inagriculture, most of the firms are located in the capital city of Montevideo.
Table 3.2: Number of firms as per the INE surveyCases % of total
ISIC (Rev. 3):
D. Manufacturing 223 48.2
F. Construction 1 0.2
G. Commerce 15 3.2
H. Hotels & restaurants 11 2.4
I. Transportation & communications 32 6.9
K. Real estate, machinery rentals & other 42 9.1
M. Educational services 54 11.7
N. Health services 57 12.3
Not classified 28 6.0
Total 463 100.0
Source: Authors’ own calculations based on INE survey.
9 Since INE was in charge of the field survey, this made answering the survey a legal obligation,
and firms risked being fined if they failed to comply.

15
Table 3.3: Number of firms surveyed according to locationDepartment Cases % of total
Artigas 2 0.4
Canelones 26 5.6
Cerro Largo 1 0.2
Colonia 10 2.2
Durazno 4 0.9
Flores 1 0.2
Florida 4 0.9
Lavalleja 1 0.2
Maldonado 9 1.9
Montevideo 366 79.0
Paysandú 10 2.2
Río Negro 1 0.2
Rivera 4 0.9
Rocha 1 0.2
Salto 7 1.5
San José 9 1.9
Soriano 2 0.4
Tacuarembó 3 0.6
Treinta y Tres 2 0.4
Total 463 100.0
Source: Authors’ own calculations based on INE survey.
The vast majority of firms surveyed are 100% owned by Uruguayans, with only14% of them being majority-owned by foreigners. The country’s partners in theMercosur area (Argentina, Brazil and Paraguay) account for 28% of theseforeign investors; 18% are from the United States and 46% are from variousEuropean countries.
Table 3.4: Number of firms surveyed by origin of ownershipCases % of total
National ownership 389 84.2
1% to 19% foreign ownership 2 0.4
20% to 49% foreign ownership 6 1.3
more 50% foreign ownership 65 14.1
Total 462 100.0
Source: Authors’ own calculations based on INE survey.
Table 3.5: Origin of capital of foreign firms surveyed (more than 50% foreign ownership)Country Cases % of total
1.Argentina 15 23.1
2.Brasil 3 4.6
3.Chile 1 1.5
4.USA 12 18.5
5.Europe 30 46.2
6.Other 4 6.2
Total 65 100.0
Source: Authors’ own calculations based on INE survey.
16
In the late 1980s, changes were instituted in the regulation of businesscompanies and a single regulatory body of rules applicable to different types oforganizational forms was put in place. An explicit objective of this reform was toprovide investors with a range of structures, each with its own particularities asto ownership and control, in order that they might accommodate different needsand thus facilitate investment in general.
In Uruguay, business ventures are usually organized as corporations (sociedadanónima), limited-liability companies (sociedad de responsabilidad limitada), orpartnerships (sociedad colectiva). In recent years, except when tax reasonsfavor the use of any of the latter structures, most companies are organizingthemselves as corporations. Furthermore, the regulatory changes of the 1980sseem to have had the expected effect of increasing the number of corporations,since in the mid-1970s the ratio of corporations to limited-liability companieswas 1 to 5, while in the mid-1980s the number was evenly balanced – and bythe mid-1990s there were some 4,400 corporations vs. about 3,000 limited-liability companies (Olivera and Bugallo, 1996).
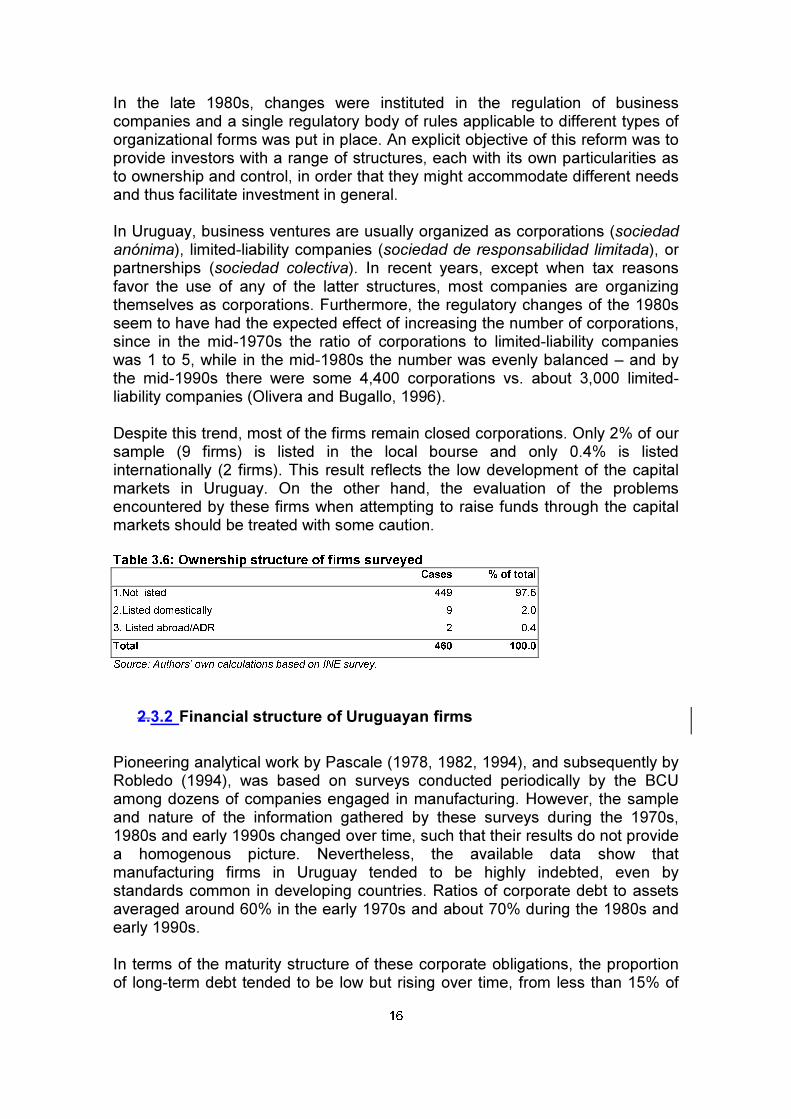
Despite this trend, most of the firms remain closed corporations. Only 2% of oursample (9 firms) is listed in the local bourse and only 0.4% is listedinternationally (2 firms). This result reflects the low development of the capitalmarkets in Uruguay. On the other hand, the evaluation of the problemsencountered by these firms when attempting to raise funds through the capitalmarkets should be treated with some caution.
Table 3.6: Ownership structure of firms surveyedCases % of total
1.Not listed 449 97.6
2.Listed domestically 9 2.0
3. Listed abroad/ADR 2 0.4
Total 460 100.0
Source: Authors’ own calculations based on INE survey.
2.3.2 Financial structure of Uruguayan firms
Pioneering analytical work by Pascale (1978, 1982, 1994), and subsequently byRobledo (1994), was based on surveys conducted periodically by the BCUamong dozens of companies engaged in manufacturing. However, the sampleand nature of the information gathered by these surveys during the 1970s,1980s and early 1990s changed over time, such that their results do not providea homogenous picture. Nevertheless, the available data show thatmanufacturing firms in Uruguay tended to be highly indebted, even bystandards common in developing countries. Ratios of corporate debt to assetsaveraged around 60% in the early 1970s and about 70% during the 1980s andearly 1990s.
In terms of the maturity structure of these corporate obligations, the proportionof long-term debt tended to be low but rising over time, from less than 15% of

17
total prior to 1980 to nearly 40% of total by the early 1990s. This ability to obtainlonger-term funds may have been related to the sharply increased dollarizationof liabilities over time: corporate debts in foreign currencies represented lessthan 20% of total liabilities up until the mid-1970s, but they accounted for morethan 60% of total by the early 1980s, averaging two thirds of total during 1989-91. As a result of this liability dollarization, most companies began to run largecurrency mismatches, since their sales were largely booked in local currencyand their foreign-currency-denominated assets were small (e.g., 10% of totalassets during 1982-84). This exposed them to financial losses every time thatthe exchange rate suffered a major depreciation – at least once a decade.
Banks have been by far the principal source of financing for manufacturingcompanies in Uruguay, with obligations to them representing more than half,and sometimes more than two thirds, of total corporate liabilities. Access to alocal bond market has never been a realistic option for most firms, except forthe few years during the mid-1990s when new debt instruments (theaforementioned Obligaciones Negociables, ONs) became popular in the wakeof new legislation raising the amount that firms could issue (relative to theircapital). However, nearly 70% of the securities traded belonged to those issuedby private-sector banks, and as mentioned the market dried up in the late 1990sfollowing the filing for bankruptcy of one of the corporate issuers – the poultryfirm Moro in 1998 (Bentancor 1999).
A longitudinal study by Monteserín and Chiappori (2004) focused on companiesthat had issued securities and therefore had been obligated to publish theirfinancial balance sheets and income statements. This is an admittedly non-representative sample of firms. The authors developed two samples. The firstfeatured 26 companies that had issued stocks and provided accounts during 17years in a row (1985-2001). They exhibited fairly stable ratios of debt to assetsaveraging 46% – much lower than the leverage ratios seen in prior studies. Thesecond set included 38 firms that had issued bonds (ONs), some of which hadpreviously issued stocks and thus were part of the first sample, for whichfinancial accounts were available for eight consecutive years (1994-2001). Thislatter sample exhibited leverage ratios of close to 60%, which tended toincrease over time (from an initial level of close to 50% to almost 70%) inreflection of their issuance of corporate bonds.
Munyo (2005) found that 60% of corporate financing needs were met throughborrowing (40% therefore from retained earnings), none of which included theissuance of equity or debt securities. Reliance on bank credit was on averageas great as on trade credit, though larger companies with greater tangibleassets tended to rely proportionally more on bank rather than trade financing,and had greater access to long-term financing.
Table 3.7 reports summary statistics for 2004 for the firms surveyed by INE.Coincidentally with Munyo’s results, the two main sources of external funds forthe surveyed firms were bank loans and suppliers’ credit. The principalcomponent of the “other liabilities” column is internally generated funds, withsecurities accounting for a tiny proportion of total liabilities.

18
We present the computation of three oft-reported financial indicators. Thesolvency ratio is defined as the ratio of equity over the sum of equity and totalliabilities. A second indicator is the ROA (return on assets), defined as the ratiobetween the net operating income before interest payments and total assets.The median ROA is 50% lower than the mean ROA, implying that thedistribution of this statistic is heavily skewed to the left. Given the implicit riskpresent in investment projects taking place in Uruguay, an ROA median of 6.5%seems to be somewhat low. As a rule of thumb, we could take this figure as themaximum interest rate that Uruguayan firms could afford to pay. The leverageindicator is defined as the ratio between total liabilities and total equity.
Table 3.7 Summary statistics of firms surveyed by INE (data for 2004)Structure of liabilities (% of total)
Bonds Bank loans Suppliers’ credit Other liabilities
Median 0.0 16.1 21.8 38.2
Mean 0.6 26.2 27.8 45.2
SD 4.5 28.0 24.2 33.8
# of cases 453 452 453 451
Financial ratios
Solvency ROA Leverage
Median 0.5 6.5 0.8
Mean 0.4 9.1 2.4
SD 0.9 81.7 9.9
# of cases 459 457 459
Note: Solvency= equity / (equity + liabilities); ROA= net operating income / assets; Leverage = liabilities / equity;Source: Authors’ own calculations based on INE survey.
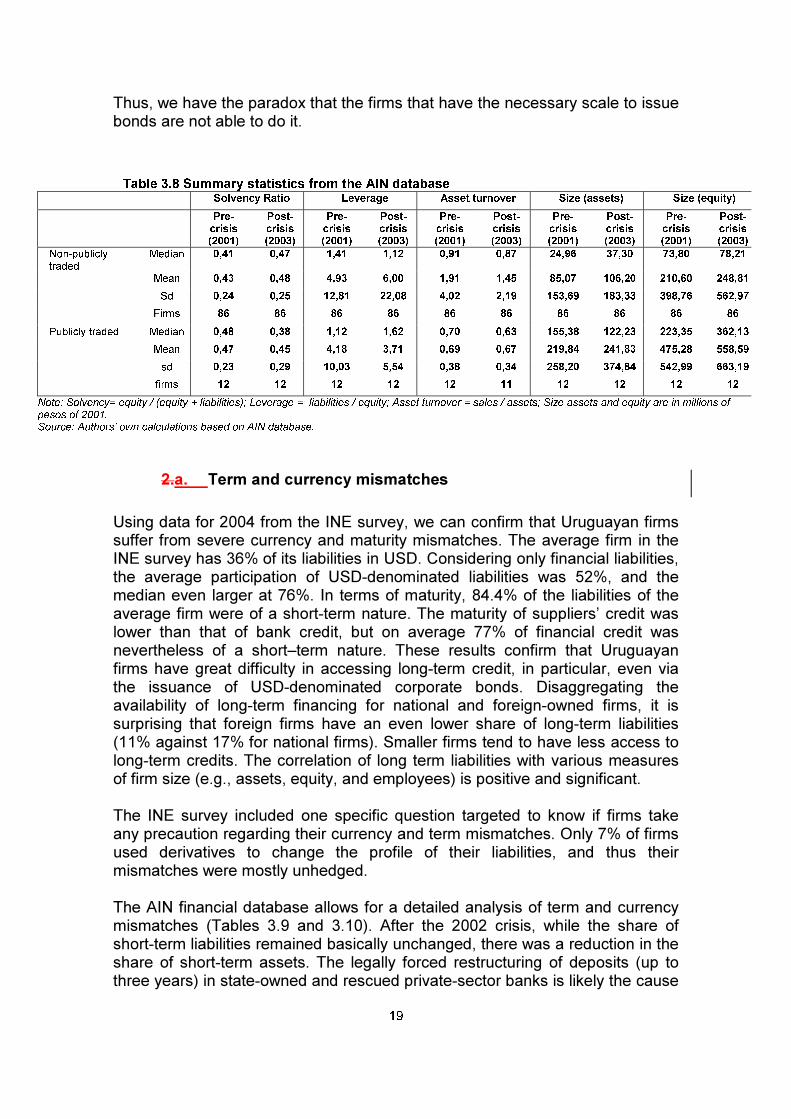
Table 3.8 reports financial summary statistics for the database constructedusing the information from the AIN. Here we disaggregate between publicly andnon-publicly traded firms. De Brun, Gandelman and Barbieri (2003) reports thatbetween 1997 and 2000 the asset turnover ratio slowed down, causingdeterioration in the profitability ratios. The same seems to have happened in the2001-03 period, most likely due to the 2002 crisis.
Publicly traded firms are substantially larger than non-publicly traded firms. Thiscan be seen both in the total assets and equity columns. There is anendogeneity problem in the access to capital markets that calls for caution wheninterpreting the effect of access to capital markets on other variables. Forinstance, larger firms may be more likely to have access to longer-term bankcredit and also may be prone to have access to financing through the capitalmarkets. If this is the case, the share of long-term credit may not be a feature ofthe capital market but, rather, may be a consequence of firm size.
Among the non-publicly traded firms in our database there are none with thesize of the average publicly traded firms. Naturally, the candidates to issuebonds are the largest firms in the country – the state owned public utility firms.
19
Thus, we have the paradox that the firms that have the necessary scale to issuebonds are not able to do it.
Table 3.8 Summary statistics from the AIN databaseSolvency Ratio Leverage Asset turnover Size (assets) Size (equity)
Pre-crisis(2001)
Post-crisis(2003)
Pre-crisis(2001)
Post-crisis(2003)
Pre-crisis(2001)
Post-crisis(2003)
Pre-crisis(2001)
Post-crisis(2003)
Pre-crisis(2001)
Post-crisis(2003)
Non-publiclytraded
Median 0,41 0,47 1,41 1,12 0,91 0,87 24,96 37,30 73,80 78,21
Mean 0,43 0,48 4,93 6,00 1,91 1,45 85,07 106,20 210,60 248,81
Sd 0,24 0,25 12,81 22,08 4,02 2,19 153,69 183,33 398,76 562,97
Firms 86 86 86 86 86 86 86 86 86 86
Publicly traded Median 0,48 0,38 1,12 1,62 0,70 0,63 155,38 122,23 223,35 362,13
Mean 0,47 0,45 4,18 3,71 0,69 0,67 219,84 241,83 475,28 558,59
sd 0,23 0,29 10,03 5,54 0,38 0,34 258,20 374,84 542,99 663,19
firms 12 12 12 12 12 11 12 12 12 12
Note: Solvency= equity / (equity + liabilities); Leverage = liabilities / equity; Asset turnover = sales / assets; Size assets and equity are in millions ofpesos of 2001.Source: Authors’ own calculations based on AIN database.
2.a. Term and currency mismatches
Using data for 2004 from the INE survey, we can confirm that Uruguayan firmssuffer from severe currency and maturity mismatches. The average firm in theINE survey has 36% of its liabilities in USD. Considering only financial liabilities,the average participation of USD-denominated liabilities was 52%, and themedian even larger at 76%. In terms of maturity, 84.4% of the liabilities of theaverage firm were of a short-term nature. The maturity of suppliers’ credit waslower than that of bank credit, but on average 77% of financial credit wasnevertheless of a short–term nature. These results confirm that Uruguayanfirms have great difficulty in accessing long-term credit, in particular, even viathe issuance of USD-denominated corporate bonds. Disaggregating theavailability of long-term financing for national and foreign-owned firms, it issurprising that foreign firms have an even lower share of long-term liabilities(11% against 17% for national firms). Smaller firms tend to have less access tolong-term credits. The correlation of long term liabilities with various measuresof firm size (e.g., assets, equity, and employees) is positive and significant.
The INE survey included one specific question targeted to know if firms takeany precaution regarding their currency and term mismatches. Only 7% of firmsused derivatives to change the profile of their liabilities, and thus theirmismatches were mostly unhedged.
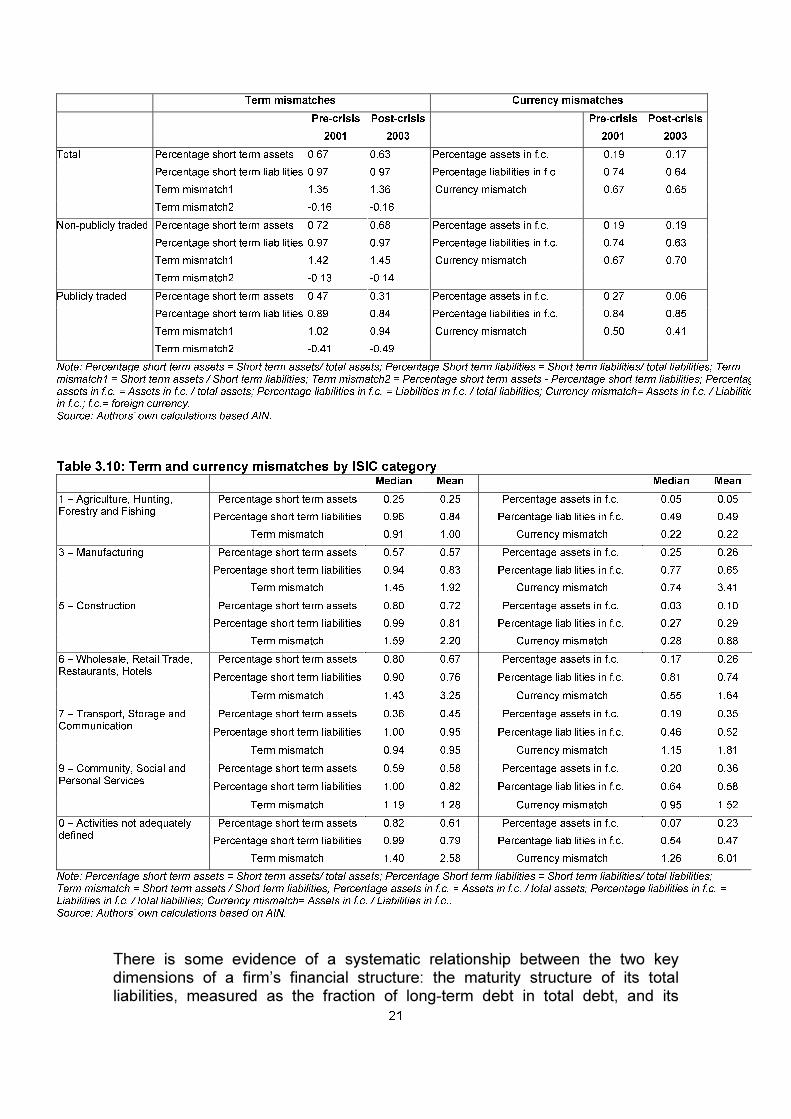
The AIN financial database allows for a detailed analysis of term and currencymismatches (Tables 3.9 and 3.10). After the 2002 crisis, while the share ofshort-term liabilities remained basically unchanged, there was a reduction in theshare of short-term assets. The legally forced restructuring of deposits (up tothree years) in state-owned and rescued private-sector banks is likely the cause
20
of this reduction. Maturity mismatches seems also to be larger among non-publicly traded firms.
The percentage of assets in foreign currency in 2003 is slightly lower than in2001 for both publicly and non-publicly traded firms. On the contrary, the shareof USD liabilities increased after the currency and banking crisis. The decreasein asset dollarization may in part be produced by the de-dollarization agendapushed since then by the government, and the increased share of USDliabilities is likely a direct effect of currency devaluation. Both effects areprobably responsible for the fact that while in 2001 USD assets were 57% ofUSD liabilities, by 2003 they were equivalent to only 48%.10
Table 3.10 reports the currency and term structure by sector of economicactivity. The common factor to all of them is the high dollarization of liabilities,lower dollarization of assets, extremely high share of short-term liabilities, andlower share of short-term assets. Thus, currency and term mismatches are aphenomenon common to all sectors of activity.
Uruguay’s dollarization experience, as in the case of many other countries inLatin America and beyond, is the legacy of several decades of high andunstable rates of inflation, which eroded trust in the national currency as a storeof value, medium of exchange and even a unit of account. In the absence ofwidespread indexation to inflation, economic agents became unwilling to enterinto any medium-term contracts unless the payment amounts specified wereprotected from currency depreciation, and indirectly from the ravages ofinflation, by being indexed to or expressed in USD. As a result, firmsincreasingly realized that any obligations to banks or suppliers not subject tocorrection for inflation or currency depreciation necessarily would be of a veryshort-term nature. Practically the only way to obtain longer-term funds – otherthan through the issuance of equity stakes, of course – way to do so viacontracts in USD, exposing oneself to a currency mismatch. This is whybetween 90% and 100% of all corporate bonds issued during 1994-2004 weredenominated in USD. Indeed, the currency and maturity composition of anyobligation contemplated by borrowers or lenders came to be determined jointlyas part of the same portfolio decision.
Table 3.9: Term and currency mismatches (median)
10 Sometimes it is argued that the key measure of currency mismatch is the comparison of the
currency denomination of liabilities with the denomination of firm revenues. In previous versionsof this paper we reported as a second measure of currency mismatch minuscule values for theratio between exports and liabilities in foreign currency. Since we do not have export data forthe whole period we prefer no to report them.
21
Term mismatches Currency mismatches
Pre-crisis Post-crisis Pre-crisis Post-crisis
2001 2003 2001 2003
Total Percentage short term assets 0.67 0.63 Percentage assets in f.c. 0.19 0.17
Percentage short term liabilities 0.97 0.97 Percentage liabilities in f.c. 0.74 0.64
Term mismatch1 1.35 1.36 Currency mismatch 0.67 0.65
Term mismatch2 -0.16 -0.16
Non-publicly traded Percentage short term assets 0.72 0.68 Percentage assets in f.c. 0.19 0.19
Percentage short term liabilities 0.97 0.97 Percentage liabilities in f.c. 0.74 0.63
Term mismatch1 1.42 1.45 Currency mismatch 0.67 0.70
Term mismatch2 -0.13 -0.14
Publicly traded Percentage short term assets 0.47 0.31 Percentage assets in f.c. 0.27 0.06
Percentage short term liabilities 0.89 0.84 Percentage liabilities in f.c. 0.84 0.85
Term mismatch1 1.02 0.94 Currency mismatch 0.50 0.41
Term mismatch2 -0.41 -0.49
Note: Percentage short term assets = Short term assets/ total assets; Percentage Short term liabilities = Short term liabilities/ total liabilities; Termmismatch1 = Short term assets / Short term liabilities; Term mismatch2 = Percentage short term assets - Percentage short term liabilities; Percentagassets in f.c. = Assets in f.c. / total assets; Percentage liabilities in f.c. = Liabilities in f.c. / total liabilities; Currency mismatch= Assets in f.c. / Liabilitiein f.c.; f.c.= foreign currency.Source: Authors’ own calculations based AIN.
Table 3.10: Term and currency mismatches by ISIC categoryMedian Mean Median Mean
Percentage short term assets 0.25 0.25 Percentage assets in f.c. 0.05 0.05
Percentage short term liabilities 0.96 0.84 Percentage liabilities in f.c. 0.49 0.49
1 – Agriculture, Hunting,Forestry and Fishing
Term mismatch 0.91 1.00 Currency mismatch 0.22 0.22
Percentage short term assets 0.57 0.57 Percentage assets in f.c. 0.25 0.26
Percentage short term liabilities 0.94 0.83 Percentage liabilities in f.c. 0.77 0.65
3 – Manufacturing
Term mismatch 1.45 1.92 Currency mismatch 0.74 3.41
Percentage short term assets 0.80 0.72 Percentage assets in f.c. 0.03 0.10
Percentage short term liabilities 0.99 0.81 Percentage liabilities in f.c. 0.27 0.29
5 – Construction
Term mismatch 1.59 2.20 Currency mismatch 0.28 0.88
Percentage short term assets 0.80 0.67 Percentage assets in f.c. 0.17 0.26
Percentage short term liabilities 0.90 0.76 Percentage liabilities in f.c. 0.81 0.74
6 – Wholesale, Retail Trade,Restaurants, Hotels
Term mismatch 1.43 3.25 Currency mismatch 0.55 1.64
Percentage short term assets 0.36 0.45 Percentage assets in f.c. 0.19 0.35
Percentage short term liabilities 1.00 0.95 Percentage liabilities in f.c. 0.46 0.52
7 – Transport, Storage andCommunication
Term mismatch 0.94 0.95 Currency mismatch 1.15 1.81
Percentage short term assets 0.59 0.58 Percentage assets in f.c. 0.20 0.36
Percentage short term liabilities 1.00 0.82 Percentage liabilities in f.c. 0.64 0.58
9 – Community, Social andPersonal Services
Term mismatch 1.19 1.28 Currency mismatch 0.95 1.52
Percentage short term assets 0.82 0.61 Percentage assets in f.c. 0.07 0.23
Percentage short term liabilities 0.99 0.79 Percentage liabilities in f.c. 0.54 0.47
0 – Activities not adequatelydefined
Term mismatch 1.40 2.58 Currency mismatch 1.26 6.01
Note: Percentage short term assets = Short term assets/ total assets; Percentage Short term liabilities = Short term liabilities/ total liabilities;Term mismatch = Short term assets / Short term liabilities; Percentage assets in f.c. = Assets in f.c. / total assets; Percentage liabilities in f.c. =Liabilities in f.c. / total liabilities; Currency mismatch= Assets in f.c. / Liabilities in f.c..Source: Authors’ own calculations based on AIN.
There is some evidence of a systematic relationship between the two keydimensions of a firm’s financial structure: the maturity structure of its totalliabilities, measured as the fraction of long-term debt in total debt, and its

22
degree of liability dollarization, measured as the percentage of total liabilitieswhich are denominated in, or indexed to, USD. Here we have plotted saidrelationship using yearly observations from 1994 to 2001, where eachobservation in the plot corresponds to a given maturity/dollarization combinationof a firm’s indebtedness in a particular year. To control for common factorsdriving both the duration and currency profile, we used the orthogonalcomponents of dollarization and maturity to a set of common regressors,including firm size, maturity of assets, the tradable nature of output, theimportance of exports, and the extent of leverage and foreign ownership.
Figure 3.1: Maturity/dollarization combinations for Uruguayan firms
Source: Kamil (2004)
The scatter diagram suggests the presence of a strong firm-level correlationbetween the maturity of corporate debt and its dollarization, in this case with acorrelation coefficient of 0.35 with a t-statistic of 9.5. 11 According to the AINdatabase, for 2001 the simple correlation coefficient is of 0.34 and decreases to0.12 for 2003. This empirical evidence suggests that the observed dollarizationof liabilities may well be motivated by a desire to extend the maturity structure ofobligations – and not necessarily by a given currency preference.
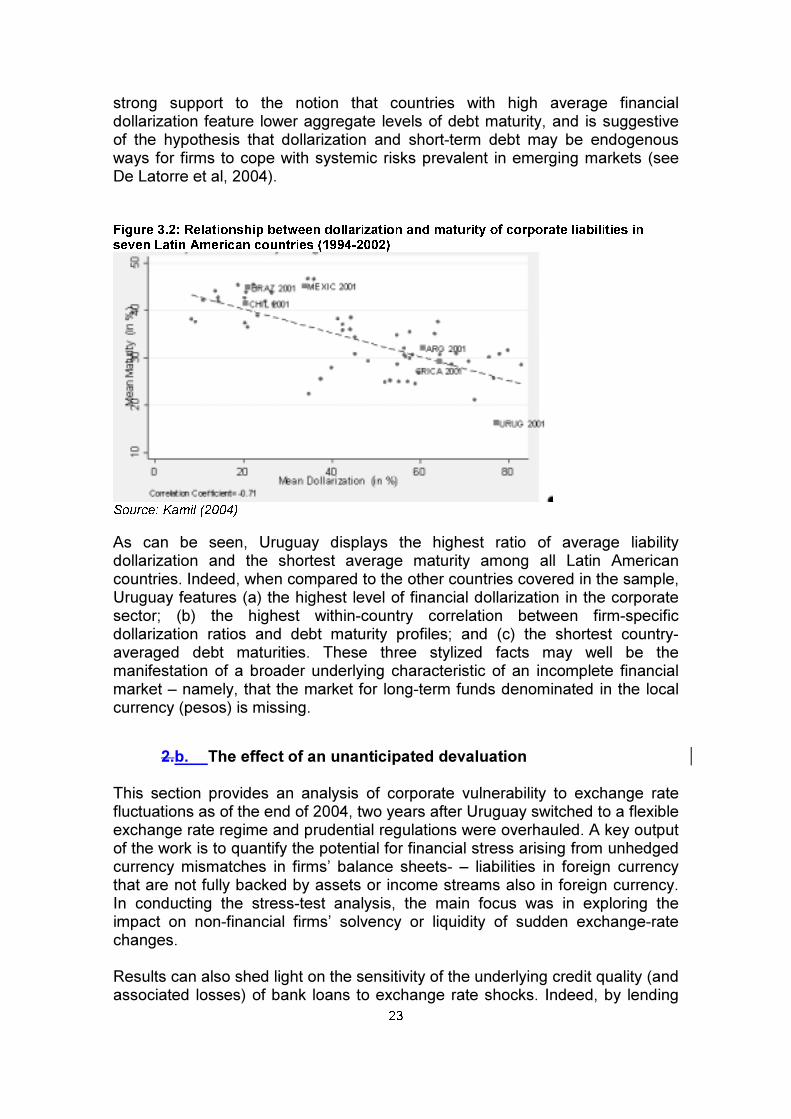
We have also considered the relationship between maturity and dollarization ofliabilities across seven Latin American countries. Figure 3.2 plots the cross-country relationship between average maturity and average dollarization of debtin each year during 1994-2002. Each point in the chart represents acountry/year observation, obtained by averaging the firm-specific maturity anddollarization ratios in the cross-section in a given year. The figure provides
11 A similar plotting for other highly dollarized economies, such as Argentina and Costa Rica,
produces similar results. It is noteworthy that the degree of correlation between debt maturityand dollarization tends to decrease monotonically as we consider countries with lower degreesof financial dollarization, such as Brazil, Chile and Mexico (Kamil, 2004).
23
strong support to the notion that countries with high average financialdollarization feature lower aggregate levels of debt maturity, and is suggestiveof the hypothesis that dollarization and short-term debt may be endogenousways for firms to cope with systemic risks prevalent in emerging markets (seeDe Latorre et al, 2004).
Figure 3.2: Relationship between dollarization and maturity of corporate liabilities inseven Latin American countries (1994-2002)
Source: Kamil (2004)
As can be seen, Uruguay displays the highest ratio of average liabilitydollarization and the shortest average maturity among all Latin Americancountries. Indeed, when compared to the other countries covered in the sample,Uruguay features (a) the highest level of financial dollarization in the corporatesector; (b) the highest within-country correlation between firm-specificdollarization ratios and debt maturity profiles; and (c) the shortest country-averaged debt maturities. These three stylized facts may well be themanifestation of a broader underlying characteristic of an incomplete financialmarket – namely, that the market for long-term funds denominated in the localcurrency (pesos) is missing.
2.b. The effect of an unanticipated devaluation
This section provides an analysis of corporate vulnerability to exchange ratefluctuations as of the end of 2004, two years after Uruguay switched to a flexibleexchange rate regime and prudential regulations were overhauled. A key outputof the work is to quantify the potential for financial stress arising from unhedgedcurrency mismatches in firms’ balance sheets- – liabilities in foreign currencythat are not fully backed by assets or income streams also in foreign currency.In conducting the stress-test analysis, the main focus was in exploring theimpact on non-financial firms’ solvency or liquidity of sudden exchange-ratechanges.
Results can also shed light on the sensitivity of the underlying credit quality (andassociated losses) of bank loans to exchange rate shocks. Indeed, by lending
24
USD to domestic firms and consumers (most of them non-USD earners), manybanks may well have traded exchange rate risk for default risk, shifting theircurrency mismatch from their own balance sheets to those of firms (andconsumers). This is especially relevant in the case of Uruguay, where loans tothe corporate sector account for a significant portion of total lending and aremostly denominated in USD.
The results of the previous subsection show that Uruguayan firms still face thepotential for financial stress arising from sizable and unhedged balance sheetcurrency mismatches – liabilities in foreign currency that are not fully backed byassets or income streams also in foreign currency. Although these mismatchesmay not be a concern in the current external environment of low interest ratesand an appreciating domestic currency, they may become a source of financialinstability once external conditions become less benign.
In conducting the sensitivity analysis, the main focus was to explore thelinkages between exchange rate developments and the corporate sector, byexamining the impact on non-financial firms’ solvency or liquidity of exchangerate risk. To assess a firm’s financial health, we used two criteria: a) the debt-service coverage ratio (the fraction of financial liabilities coming due in less thana year covered by cash flow) and b) the net worth position of the firm (totalassets minus total liabilities).
For the purpose of the stress test, we defined a firm to be financially stressedwhenever an exchange-rate depreciation made it unable to meet short-termobligations12 (liquidity effect) and/or pushed the firm to a negative equityposition (balance sheet effect). We thus assessed the effect that differentexchange rate shocks have on interest coverage ratios and the proportion offirms that are at greater risk of defaulting. To assess the downside exchangerate risk of the corporate sector, we stress-tested the portfolio of each firm to a5%, 10%, 20%, 40%, 60%, 80% and 100% nominal devaluation.
Estimates on the contractionary effects of a sudden devaluation areconservative (i.e., they provide a lower bound) for four reasons. First, we onlyconsidered a sudden depreciation of the domestic currency, excluding othersimultaneous effects like an increase in interest rates which typicallyaccompanies said depreciation. Second, to assess the vulnerability to foreigncurrency borrowing, we only considered financial debt, implicitly assuming thatUSD trade-credit liabilities could be rolled over through negotiations withsuppliers in the event of financial distress. Third, the exercise was static innature in that we only considered the direct or “first round” effect on each firm,excluding spillover or dynamic effects – for example, a breakdown in the chainof payments among firms. Finally, we only considered firms that as 2004 had aninitially healthy financial position, to avoid the results being contaminated byfirms near bankruptcy.
12 Amortization of capital plus interest.
25
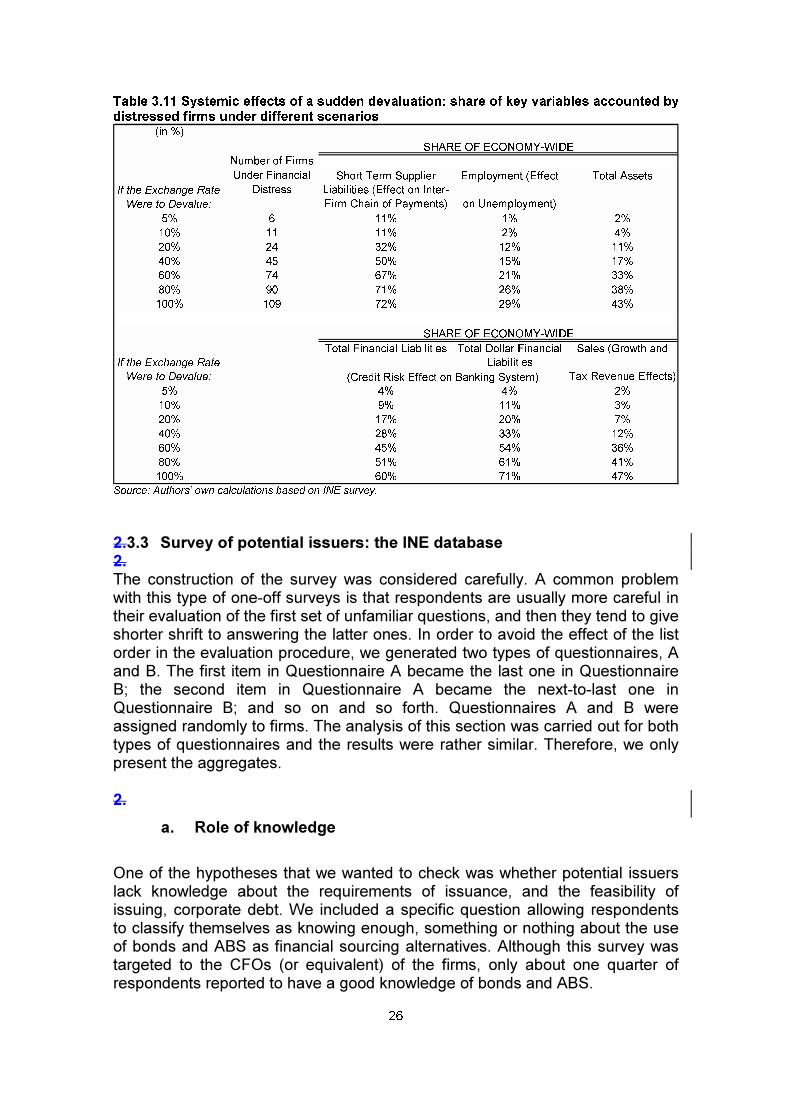
The results of the stress test show whether different scenarios featuring asignificant depreciation of the peso would have a large effect on corporatecapital and ability to service bank debt. For every possible static scenario, thenumber expressed in percentage terms represents the fraction accounted bythe group of distressed firms in the total value of each variable for the wholesample.
The results presented in Table 3.11 indicate that Uruguayan firms remainvulnerable to a sudden peso depreciation, given high levels of unhedged, short-term foreign currency borrowing – liabilities in foreign currency that are not fullybacked by assets or income streams also in foreign currency. Furthermore,93% of the firms without a complete, natural hedge do not buy financial hedgesin the market. In this sense, there is no evidence that the corporate sector wasmore resilient to foreign exchange rate risk than before the 2002 crisis.
The high share of financial liabilities accounted by the pool of firms in distresssuggests a significant vulnerability of the banking system to corporate creditrisk. For prudential reasons, bank balance sheets are protected from the directimpact of a devaluation, as their net assets in foreign currency adequatelyreflect the dollarization of their balance sheet. Commercial banks, however, areexposed to devaluation-induced credit risks from loans granted to non-USDearners or firms with significant currency mismatches13. Thus, the highproportion of unhedged foreign currency borrowing can render Uruguayan firms– and by extension, their bank creditors – highly vulnerable to a sharp increasein the exchange rate14.
Systemic effects of a sudden devaluation can extend well beyond the bankingsector, working through other channels like the breakdown of the inter-firmchain of payments. While these cross-linkages within the real sector are nottypically the focus of vulnerability analysis, the potential for cascading inter-firmexposure is in principle relevant given the importance of supplier’s credit in thetotal liabilities of corporations.
13 This is especially true in the case of Uruguay, where most domestic foreign-currency deposits
are offset by domestic foreign-currency loans, not by assets held abroad. The banking sector’snet foreign asset position is generally positive, but close to balance.
14 Results from the stress test also suggest a potentially significant fiscal cost of a sudden
devaluation. For relatively high values of a sudden nominal depreciation, the fraction of totalsales accounted for firms in distress reach almost 50%, implying a significant impact onproduction and fiscal revenues.
26
Table 3.11 Systemic effects of a sudden devaluation: share of key variables accounted bydistressed firms under different scenarios
(in %)
Total Assets
5% 6 11% 1% 2%
10% 11 11% 2% 4%
20% 24 32% 12% 11%
40% 45 50% 15% 17%
60% 74 67% 21% 33%
80% 90 71% 26% 38%
100% 109 72% 29% 43%
5% 4% 4% 2%
10% 9% 11% 3%
20% 17% 20% 7%
40% 28% 33% 12%
60% 45% 54% 36%
80% 51% 61% 41%
100% 60% 71% 47%
Number of Firms
Under Financial
Distress
SHARE OF ECONOMY-WIDE
SHARE OF ECONOMY-WIDE
(Credit Risk Effect on Banking System)
If the Exchange Rate
Were to Devalue:
If the Exchange Rate
Were to Devalue:
Short Term Supplier
Liabilities (Effect on Inter-
Firm Chain of Payments)
Employment (Effect
on Unemployment)
Total Financial Liabilities Total Dollar Financial
Liabilities
Sales (Growth and
Tax Revenue Effects)
Source: Authors’ own calculations based on INE survey.
2.3.3 Survey of potential issuers: the INE database2.The construction of the survey was considered carefully. A common problemwith this type of one-off surveys is that respondents are usually more careful intheir evaluation of the first set of unfamiliar questions, and then they tend to giveshorter shrift to answering the latter ones. In order to avoid the effect of the listorder in the evaluation procedure, we generated two types of questionnaires, Aand B. The first item in Questionnaire A became the last one in QuestionnaireB; the second item in Questionnaire A became the next-to-last one inQuestionnaire B; and so on and so forth. Questionnaires A and B wereassigned randomly to firms. The analysis of this section was carried out for bothtypes of questionnaires and the results were rather similar. Therefore, we onlypresent the aggregates.
2.
a. Role of knowledge
One of the hypotheses that we wanted to check was whether potential issuerslack knowledge about the requirements of issuance, and the feasibility ofissuing, corporate debt. We included a specific question allowing respondentsto classify themselves as knowing enough, something or nothing about the useof bonds and ABS as financial sourcing alternatives. Although this survey wastargeted to the CFOs (or equivalent) of the firms, only about one quarter ofrespondents reported to have a good knowledge of bonds and ABS.
27
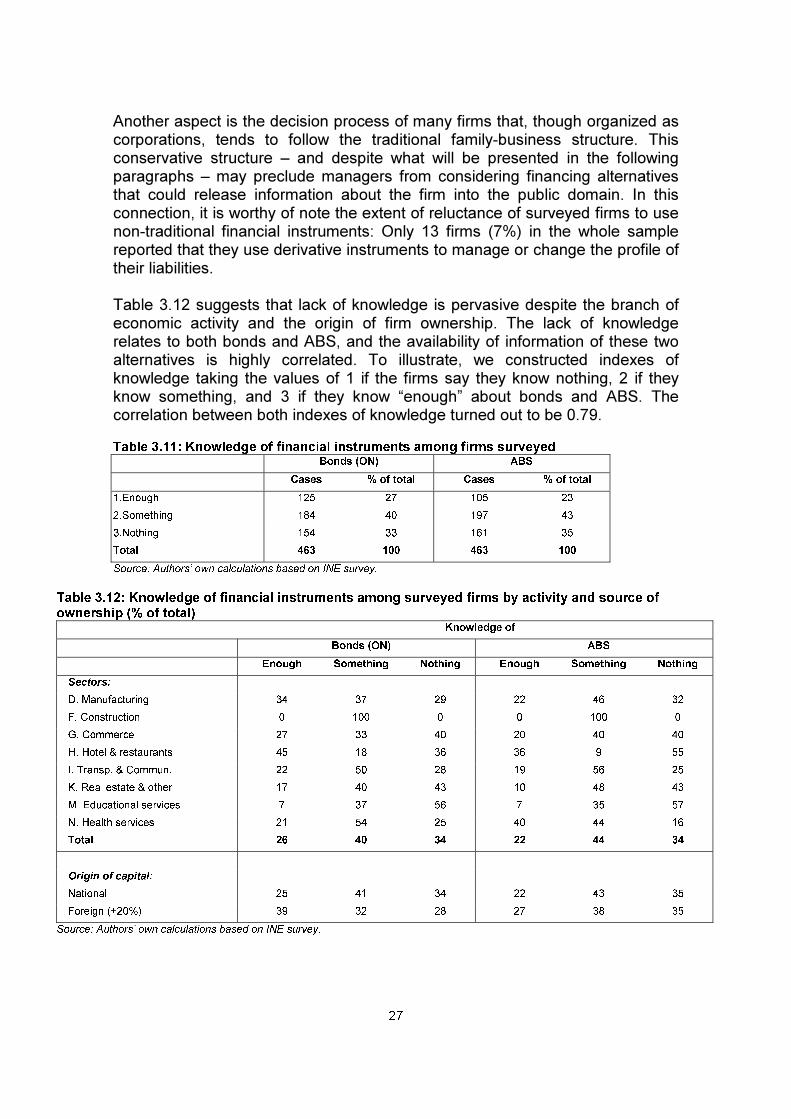
Another aspect is the decision process of many firms that, though organized ascorporations, tends to follow the traditional family-business structure. Thisconservative structure – and despite what will be presented in the followingparagraphs – may preclude managers from considering financing alternativesthat could release information about the firm into the public domain. In thisconnection, it is worthy of note the extent of reluctance of surveyed firms to usenon-traditional financial instruments: Only 13 firms (7%) in the whole samplereported that they use derivative instruments to manage or change the profile oftheir liabilities.
Table 3.12 suggests that lack of knowledge is pervasive despite the branch ofeconomic activity and the origin of firm ownership. The lack of knowledgerelates to both bonds and ABS, and the availability of information of these twoalternatives is highly correlated. To illustrate, we constructed indexes ofknowledge taking the values of 1 if the firms say they know nothing, 2 if theyknow something, and 3 if they know “enough” about bonds and ABS. Thecorrelation between both indexes of knowledge turned out to be 0.79.
Table 3.11: Knowledge of financial instruments among firms surveyedBonds (ON) ABS
Cases % of total Cases % of total
1.Enough 125 27 105 23
2.Something 184 40 197 43
3.Nothing 154 33 161 35
Total 463 100 463 100
Source: Authors’ own calculations based on INE survey.
Table 3.12: Knowledge of financial instruments among surveyed firms by activity and source ofownership (% of total)
Knowledge of
Bonds (ON) ABS
Enough Something Nothing Enough Something Nothing
Sectors:
D. Manufacturing 34 37 29 22 46 32
F. Construction 0 100 0 0 100 0
G. Commerce 27 33 40 20 40 40
H. Hotel & restaurants 45 18 36 36 9 55
I. Transp. & Commun. 22 50 28 19 56 25
K. Real estate & other 17 40 43 10 48 43
M. Educational services 7 37 56 7 35 57
N. Health services 21 54 25 40 44 16
Total 26 40 34 22 44 34
Origin of capital:
National 25 41 34 22 43 35
Foreign (+20%) 39 32 28 27 38 35
Source: Authors’ own calculations based on INE survey.

28
2.b. Issuance of bonds and ABS
Of the 463 firms in our sample, 10 firms have outstanding bonds and 21 haveissued ABS. Approximately the same number of firms had in the past issuedbonds and ABS, and at least according to this survey, we should not expectmany new issuers in the future.
Table 3.13: Issuance of bonds and ABS by firms surveyed
Currently outstandingPast issuance
(2002-2005)Future plans(2006-2007)
Bonds ABS Bonds ABS Bonds ABS
Yes 10 21 7 23 7 10
No 453 441 456 438 429 419
Uncertain 27 34
No data 1 2
Total 463 463 463 463 463 463
Source: Author’s own calculations based on INE survey.
Of those firms that used to issue bonds in the past and no longer do soanymore, 12 firms reported specific reasons why they stopped. There is no onereason that clearly predominates over others: High costs of issuance werereported 3 times; high interest rates were mentioned 2 times; low investordemand was reported 4 times; other issuance requirements were mentioned 2times; and bad reputation of the firm was admitted 2 times.
2.c. Problems with bank financing
Uruguayan firms have two main sources of external funds: bank loans andsuppliers’ credit. Naturally, most the bank financing is provided by financialinstitutions located in-country: About 300 firms report that they obtain creditform local banks, and only 20 firms report having access to credit from banksabroad. This also affected the rates of response to the questions relating toproblems with the availability of bank financing. More than 90% of the samplewas able to evaluate weather collateral requirements, bank monitoring, slowapproval processes, high interest rates in pesos, or access to credit only in USDwere aspects relating to accessing bank credit from institutions operating inUruguay. On the other hand, only 40% of firms were able to evaluate thesefactors with respect to banks located outside Uruguay.
Table 3.14 reports the percentage of those respondents that considered each ofthese issues to be a problem. In spite of the already-mentioned currencymismatches of Uruguayan firms, availability of credit only in USD is notconsidered a problem per se. According to the results of this survey, theproblem is not the availability of peso-denominated loans, but rather theirrelatively high cost. Another important problem is the requirement for firms toput up collateral, and to a lesser extent the speed of approval and disbursementof loans.
29
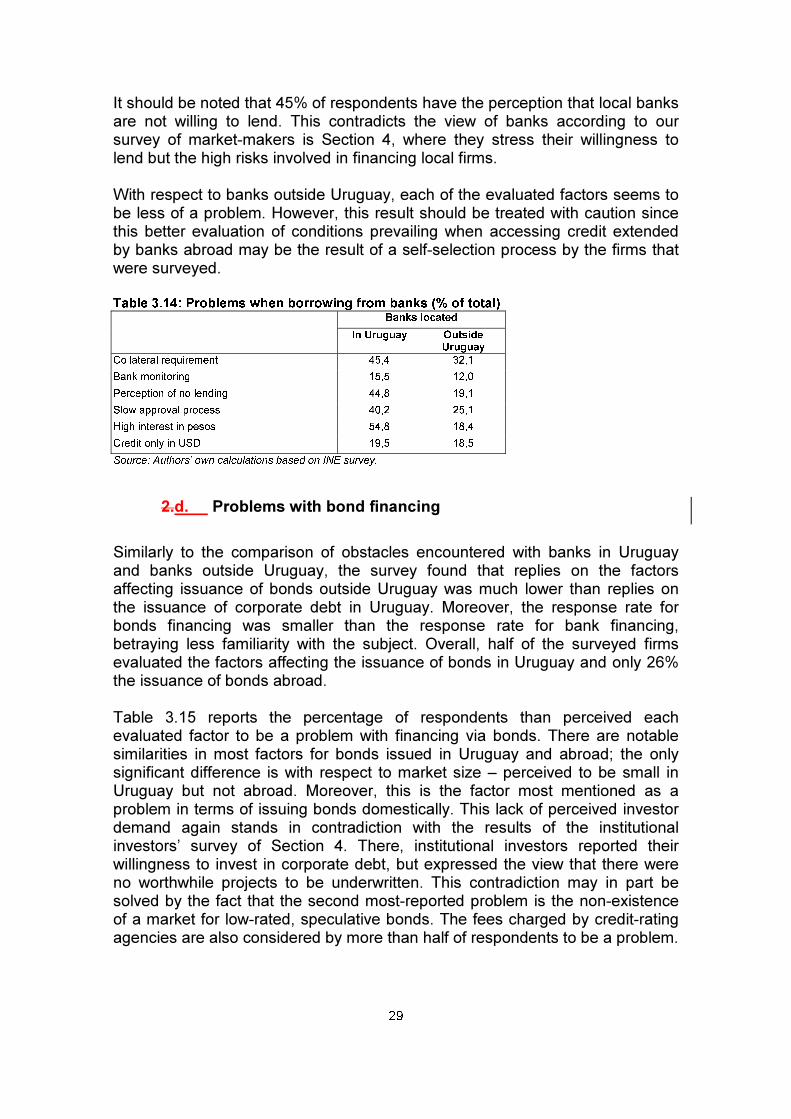
It should be noted that 45% of respondents have the perception that local banksare not willing to lend. This contradicts the view of banks according to oursurvey of market-makers is Section 4, where they stress their willingness tolend but the high risks involved in financing local firms.
With respect to banks outside Uruguay, each of the evaluated factors seems tobe less of a problem. However, this result should be treated with caution sincethis better evaluation of conditions prevailing when accessing credit extendedby banks abroad may be the result of a self-selection process by the firms thatwere surveyed.
Table 3.14: Problems when borrowing from banks (% of total)Banks located
In Uruguay OutsideUruguay
Collateral requirement 45,4 32,1
Bank monitoring 15,5 12,0
Perception of no lending 44,8 19,1
Slow approval process 40,2 25,1
High interest in pesos 54,8 18,4
Credit only in USD 19,5 18,5
Source: Authors’ own calculations based on INE survey.
2.d. Problems with bond financing
Similarly to the comparison of obstacles encountered with banks in Uruguayand banks outside Uruguay, the survey found that replies on the factorsaffecting issuance of bonds outside Uruguay was much lower than replies onthe issuance of corporate debt in Uruguay. Moreover, the response rate forbonds financing was smaller than the response rate for bank financing,betraying less familiarity with the subject. Overall, half of the surveyed firmsevaluated the factors affecting the issuance of bonds in Uruguay and only 26%the issuance of bonds abroad.
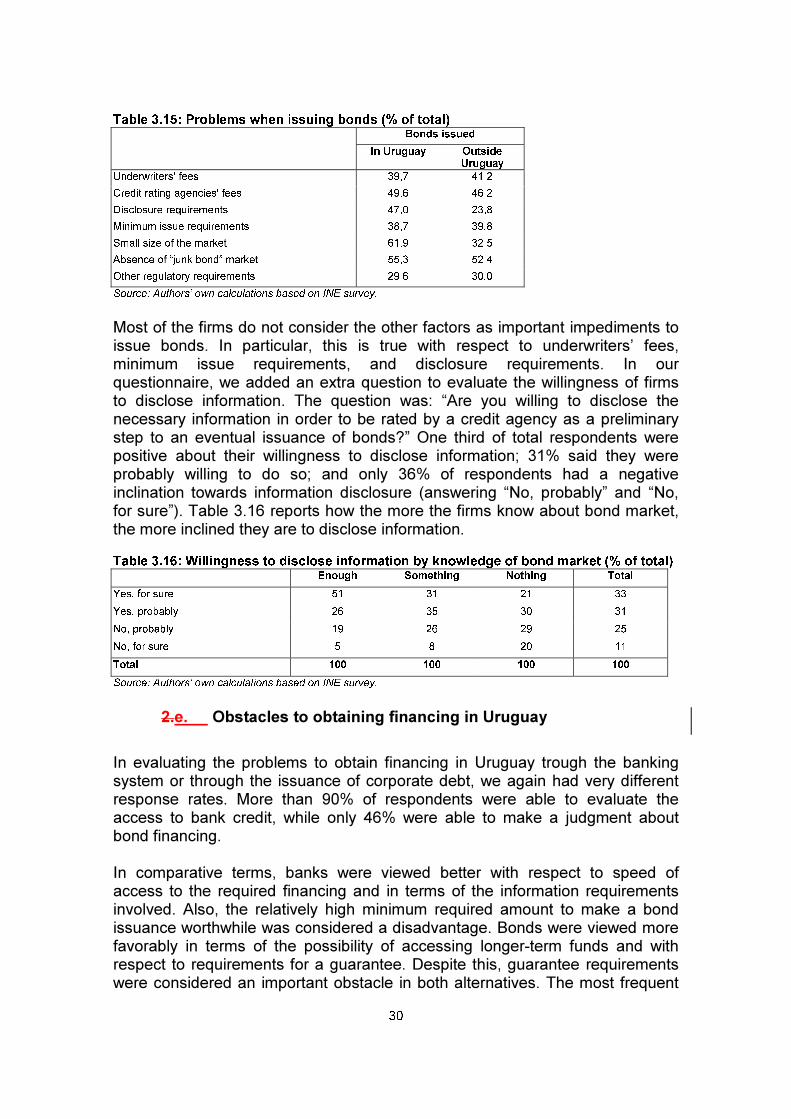
Table 3.15 reports the percentage of respondents than perceived eachevaluated factor to be a problem with financing via bonds. There are notablesimilarities in most factors for bonds issued in Uruguay and abroad; the onlysignificant difference is with respect to market size – perceived to be small inUruguay but not abroad. Moreover, this is the factor most mentioned as aproblem in terms of issuing bonds domestically. This lack of perceived investordemand again stands in contradiction with the results of the institutionalinvestors’ survey of Section 4. There, institutional investors reported theirwillingness to invest in corporate debt, but expressed the view that there wereno worthwhile projects to be underwritten. This contradiction may in part besolved by the fact that the second most-reported problem is the non-existenceof a market for low-rated, speculative bonds. The fees charged by credit-ratingagencies are also considered by more than half of respondents to be a problem.
30
Table 3.15: Problems when issuing bonds (% of total)Bonds issued
In Uruguay OutsideUruguay
Underwriters' fees 39,7 41,2
Credit rating agencies' fees 49,6 46,2
Disclosure requirements 47,0 23,8
Minimum issue requirements 38,7 39,8
Small size of the market 61,9 32,5
Absence of “junk bond” market 55,3 52,4
Other regulatory requirements 29,6 30,0
Source: Authors’ own calculations based on INE survey.
Most of the firms do not consider the other factors as important impediments toissue bonds. In particular, this is true with respect to underwriters’ fees,minimum issue requirements, and disclosure requirements. In ourquestionnaire, we added an extra question to evaluate the willingness of firmsto disclose information. The question was: “Are you willing to disclose thenecessary information in order to be rated by a credit agency as a preliminarystep to an eventual issuance of bonds?” One third of total respondents werepositive about their willingness to disclose information; 31% said they wereprobably willing to do so; and only 36% of respondents had a negativeinclination towards information disclosure (answering “No, probably” and “No,for sure”). Table 3.16 reports how the more the firms know about bond market,the more inclined they are to disclose information.
Table 3.16: Willingness to disclose information by knowledge of bond market (% of total)Enough Something Nothing Total
Yes, for sure 51 31 21 33
Yes, probably 26 35 30 31
No, probably 19 26 29 25
No, for sure 5 8 20 11
Total 100 100 100 100
Source: Authors’ own calculations based on INE survey.
2.e. Obstacles to obtaining financing in Uruguay
In evaluating the problems to obtain financing in Uruguay trough the bankingsystem or through the issuance of corporate debt, we again had very differentresponse rates. More than 90% of respondents were able to evaluate theaccess to bank credit, while only 46% were able to make a judgment aboutbond financing.
In comparative terms, banks were viewed better with respect to speed ofaccess to the required financing and in terms of the information requirementsinvolved. Also, the relatively high minimum required amount to make a bondissuance worthwhile was considered a disadvantage. Bonds were viewed morefavorably in terms of the possibility of accessing longer-term funds and withrespect to requirements for a guarantee. Despite this, guarantee requirementswere considered an important obstacle in both alternatives. The most frequent
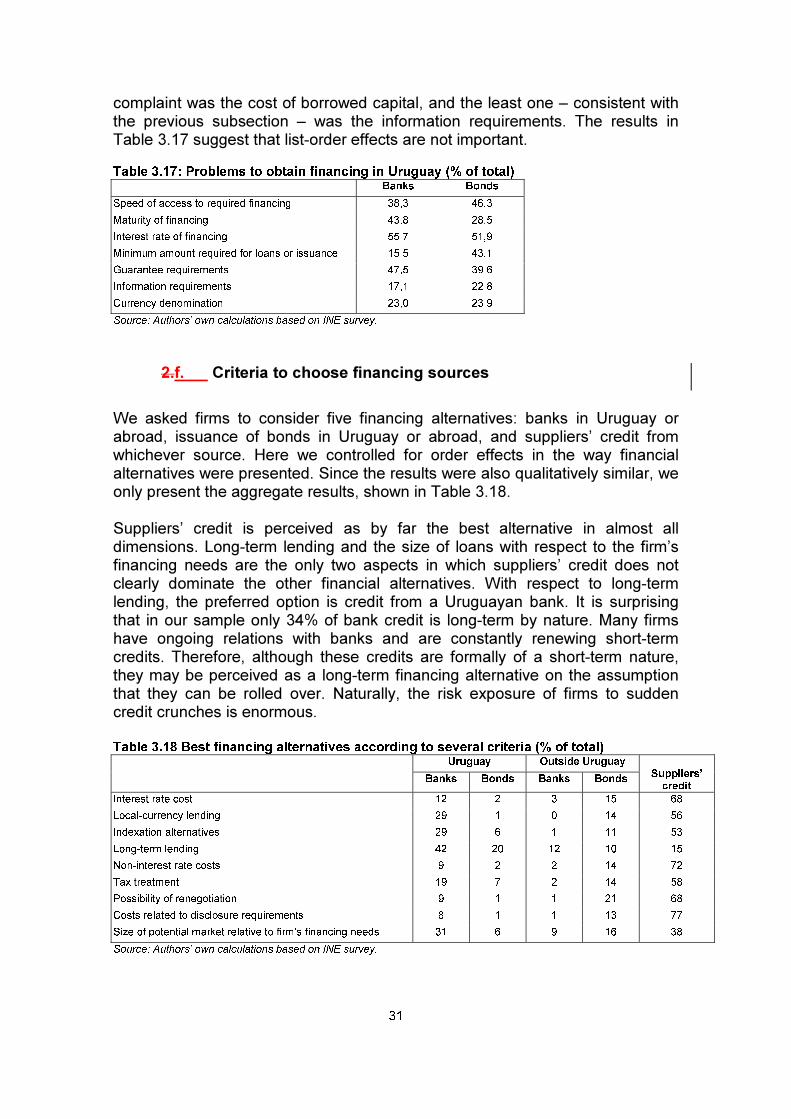
31
complaint was the cost of borrowed capital, and the least one – consistent withthe previous subsection – was the information requirements. The results inTable 3.17 suggest that list-order effects are not important.
Table 3.17: Problems to obtain financing in Uruguay (% of total)Banks Bonds
Speed of access to required financing 38,3 46,3
Maturity of financing 43,8 28,5
Interest rate of financing 55,7 51,9
Minimum amount required for loans or issuance 15,5 43,1
Guarantee requirements 47,5 39,6
Information requirements 17,1 22,8
Currency denomination 23,0 23,9
Source: Authors’ own calculations based on INE survey.
2.f. Criteria to choose financing sources
We asked firms to consider five financing alternatives: banks in Uruguay orabroad, issuance of bonds in Uruguay or abroad, and suppliers’ credit fromwhichever source. Here we controlled for order effects in the way financialalternatives were presented. Since the results were also qualitatively similar, weonly present the aggregate results, shown in Table 3.18.
Suppliers’ credit is perceived as by far the best alternative in almost alldimensions. Long-term lending and the size of loans with respect to the firm’sfinancing needs are the only two aspects in which suppliers’ credit does notclearly dominate the other financial alternatives. With respect to long-termlending, the preferred option is credit from a Uruguayan bank. It is surprisingthat in our sample only 34% of bank credit is long-term by nature. Many firmshave ongoing relations with banks and are constantly renewing short-termcredits. Therefore, although these credits are formally of a short-term nature,they may be perceived as a long-term financing alternative on the assumptionthat they can be rolled over. Naturally, the risk exposure of firms to suddencredit crunches is enormous.
Table 3.18 Best financing alternatives according to several criteria (% of total)Uruguay Outside Uruguay
Banks Bonds Banks BondsSuppliers’
credit
Interest rate cost 12 2 3 15 68
Local-currency lending 29 1 0 14 56
Indexation alternatives 29 6 1 11 53
Long-term lending 42 20 12 10 15
Non-interest rate costs 9 2 2 14 72
Tax treatment 19 7 2 14 58
Possibility of renegotiation 9 1 1 21 68
Costs related to disclosure requirements 8 1 1 13 77
Size of potential market relative to firm’s financing needs 31 6 9 16 38
Source: Authors’ own calculations based on INE survey.

32
2.3.4 Costs of issuance in the Uruguayan marketplace
We applied the methodology of Zervos (2004), to address the costs of issuingdebt in the Uruguayan corporate bond market. These costs only apply to theprivate sector, since the government issues debt in the domestic market at nocost.
Among the main costs detected are the intervening bank fees, being the mostimportant the underwriting fees.15 The range is wide, depending on thecomplexity of the issue and the characteristics of the issuer. They usually varybetween 0.5% and 1.5% of the issue amount, applying the lower bound to“plain-vanilla” corporate bonds issued by well-established firms, and the upperto more sophisticated financial structures, like ABS.
The arrangement costs of the issue can be charged to the issuer by theintervening bank or any other financial advisor. According with the interviewsmade, they are usually close to 0.75%, while distribution costs have a range of0.75-1.50%. Another important cost related to the issue comes from legal fees,associated with the preparation of a legal document, usually accompanied by aprospectus and an offering memorandum. These costs are the more difficult toestimate, but according to information provided by local issuers they have arange of US$5,000-10,000.
In the case of Uruguay no regulatory fees apply. The two bourses, Bolsa deValores de Montevideo and Bolsa Electrónica de Valores, apply registrationfees that vary from 0.04% to 0.10%, depending on the size of the issue. Thehigher fee apply for issues less than US$1.5 million, while the lower is chargedto issues higher than US$20 million. Finally, the Uruguayan regulatory agencyrequires at least one credit rating for all issuers. The fees charged by creditrating agencies usually vary from US$10,000 to US$15.000.
There are other costs that are charged during the life of the bond. For instance,a fiduciary agent, when needed, usually applies annual fees of 0.15-0.25%. Thetwo bourses charge, besides the initial registration cost, an annual maintenancefee of 0.005-0.020%. The credit rating agencies also apply annual fees, usuallyaround 10% of the initial fee. We only consider in this paper the initial costs. Wedo not consider other costs, such as for auditing financial statements, given thatthose costs are of a more general nature, especially considering that the firmsthat issue securities are required to present audited financial statements.
The results are presented in Table 3.19. Given the fixed nature of many of theissuance costs, we examine the impact of the costs for a wide range of facevalue issued, as in Zervos (2004). As expected, issuance costs are moresignificant in relation with the size of the issue for the smaller ones. For issues
15 In fact, it is not strictly necessary to have a bank as underwriter and even an underwriter of
any kind. The firms that have a well-established reputation as issuers usually do not payunderwriter fees. In some cases, the stockbroker assumes the role of underwriter, and their feesare similar to those of the banks.

33
higher than US$10 million, the costs in Uruguay compare reasonably well withthose of Chile and Brazil, according to Zervos (2004), but are much higher thanin Mexico (see Table 3.20). The problems arise when the costs are adjusted formaturity. Until recently, the maturity of Uruguayan corporate bonds was veryshort, and thus the impact of issuance costs was quite significant in the overalldecision. For instance, a 3% issuance cost is equivalent to an increase of 76bps in the interest rate for a 4-year bond, while it only adds 30 bps to the cost ofa 10-year bond.
Table 3.19: Costs of a “plain vanilla” domestic bond issue (in USD and %)
Face value issued (000 USD)
1500 3000 10000 20000 50000
Underwriting fees (1%) 15000 30000 100000 200000 500000
Arranger fees (0.75%) 11250 22500 75000 150000 375000
Distribution costs 22500 45000 150000 300000 500000
Legal fees 5000 5000 8000 8000 10000
Stock exchange registration (*) 3000 6000 15000 20000 40000
Rating agency 10000 10000 12000 12000 15000
Total costs 66750 118500 360000 690000 1440000
% of issue size 4,45% 3,95% 3,60% 3,45% 2,88%Note: (*) Assuming registration in both bourses
Source: Authors’ own calculations..
Table 3.20: Costs of Domestic Bond Issue in several Latin American countries (% ofissue)
Faced value issued (000 USD)
10000 20000 50000
Brazil n/a 4.20% 2.78%Chile 4.76% 4.20% 2.85%Mexico n/a 1.99% 1.58%Uruguay 3.60% 3.45% 2.88%Source: Zervos (2004) and authors’ own calculations.
4. Demand analysis: Institutional investors
2.4.1 The agents and their portfolios
The principal institutional investors in Uruguay’s capital market are the pensionfunds, created after the reform of the social security system in 1996. There arefour companies managing pension funds: The state-owned República AFAPplus the three asset managers owned by private-sector banks operating inUruguay, which are Afinidad AFAP, Integración AFAP and Unión Capital AFAP.
The importance of the pension funds comes not only from the size of the fundsunder management – the equivalent of more than US$2 billion as of end-October 2005 – but also from their highly qualified staff, operating in a verycompetitive environment. For both reasons, the investment decisions of thepension funds are a clear sign of the quality of the securities underconsideration.
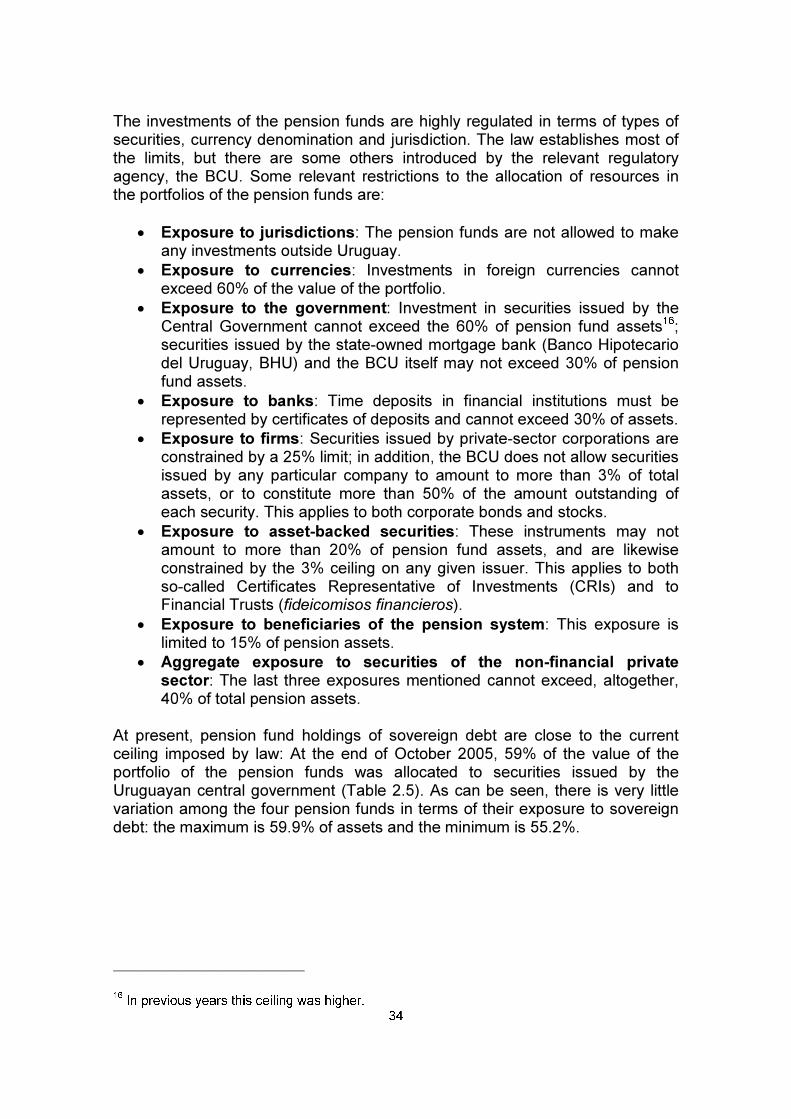
34
The investments of the pension funds are highly regulated in terms of types ofsecurities, currency denomination and jurisdiction. The law establishes most ofthe limits, but there are some others introduced by the relevant regulatoryagency, the BCU. Some relevant restrictions to the allocation of resources inthe portfolios of the pension funds are:
• Exposure to jurisdictions: The pension funds are not allowed to makeany investments outside Uruguay.
• Exposure to currencies: Investments in foreign currencies cannotexceed 60% of the value of the portfolio.
• Exposure to the government: Investment in securities issued by theCentral Government cannot exceed the 60% of pension fund assets16;securities issued by the state-owned mortgage bank (Banco Hipotecariodel Uruguay, BHU) and the BCU itself may not exceed 30% of pensionfund assets.
• Exposure to banks: Time deposits in financial institutions must berepresented by certificates of deposits and cannot exceed 30% of assets.
• Exposure to firms: Securities issued by private-sector corporations areconstrained by a 25% limit; in addition, the BCU does not allow securitiesissued by any particular company to amount to more than 3% of totalassets, or to constitute more than 50% of the amount outstanding ofeach security. This applies to both corporate bonds and stocks.
• Exposure to asset-backed securities: These instruments may notamount to more than 20% of pension fund assets, and are likewiseconstrained by the 3% ceiling on any given issuer. This applies to bothso-called Certificates Representative of Investments (CRIs) and toFinancial Trusts (fideicomisos financieros).
• Exposure to beneficiaries of the pension system: This exposure islimited to 15% of pension assets.
• Aggregate exposure to securities of the non-financial privatesector: The last three exposures mentioned cannot exceed, altogether,40% of total pension assets.
At present, pension fund holdings of sovereign debt are close to the currentceiling imposed by law: At the end of October 2005, 59% of the value of theportfolio of the pension funds was allocated to securities issued by theUruguayan central government (Table 2.5). As can be seen, there is very littlevariation among the four pension funds in terms of their exposure to sovereigndebt: the maximum is 59.9% of assets and the minimum is 55.2%.
16 In previous years this ceiling was higher.

35
Table 2.5: Portfolios of Uruguayan pension funds (as October 31, 2005)
Total República Afinidad Unión Capital Integración
Value of the portfolio (USD millions) 2132.3 1200.6 382,1 369.5 180.1
Asset composition (% of total portfolio) 100.0 100.0% 100.0 100.0 100.0
Central government 59.0 59.3 59.1 59.9 55.2
BCU and BHU 24.7 23.0 27.1 27.5 25.5
Time deposits and CDs 7.6 8.5 7.0 6.7 4.3
Corporate bonds and stocks 1.1 1.5 0.3 1.1 0.9
CRIs, financial trusts 1.8 1.8 1.8 1.8 1.7
Loans to affiliates 0.9 1.1 0.6 0.6 0.6
Cash 4.9 4.9 4.1 2.5 11.7
Source: Banco Central del Uruguay
The pension funds are also heavily invested in securities issued by themonetary authority: 23.7% in the aggregate, with a concentration in newlyissued inflation-linked securities, which represent 21.9% of the total portfolio.The sum of holdings of securities issued by the BCU and the BHU (24.7% oftotal assets) are nonetheless below the maximum of 30% established by law.
Pension fund exposures to non-financial, private-sector instruments are wellbelow the limits: All the corporate bonds, stocks, CRIs and financial trusts heldrepresented a mere 2.9% of total assets at the end of October 2005.Interestingly, the aggregate cash position of the four pension funds at the end ofOctober (4.9% of assets) was almost as large as their holdings of private sectorsecurities issued by non-financial enterprises. Given their relatively young age,most of their liabilities are long term in nature. In general, the pension fundshave been reducing their cash positions since the crisis of 2002, when theyreached a peak of 18.8% in July of that year. During the twelve months endingthis past October, cash holdings were cut from 9.2% to 4.9% of total portfolios,and the main use of those funds was the purchase of bank-issued CDs, whichincreased their participation in portfolios from 3.9% in October 2004 to 7.6% byOctober 2005.
The pension funds had contributed greatly to the development of a market forpeso-denominated instruments, at least through their participation in the primarymarket for debt. Prior to the financial crisis of 2002, the holdings of peso-denominated instruments represented around one-fourth of the total portfolio ofthe pension funds. The crisis induced a run from domestic currency, andinstruments in pesos decreased to less than 5% of the value of pension assetsby mid-2002. The country’s economic and financial stabilization has sincesupported a rebound in demand for peso instruments, and by the end ofOctober 2005 their share in pension funds had jumped to 55.7% of total, mostlyin the form of inflation-linked securities (45.2% of portfolios, see Table 2.6)17.
17 The increased participation of domestic currency instruments in pension fund portfolios was
initially induced by restrictions on the maximum amount of foreign-currency denominated assetsimposed by the BCU in September 2002, which mandated a gradual reduction of the limit to60% of portfolios. As of October 2005, this restriction was no longer binding.
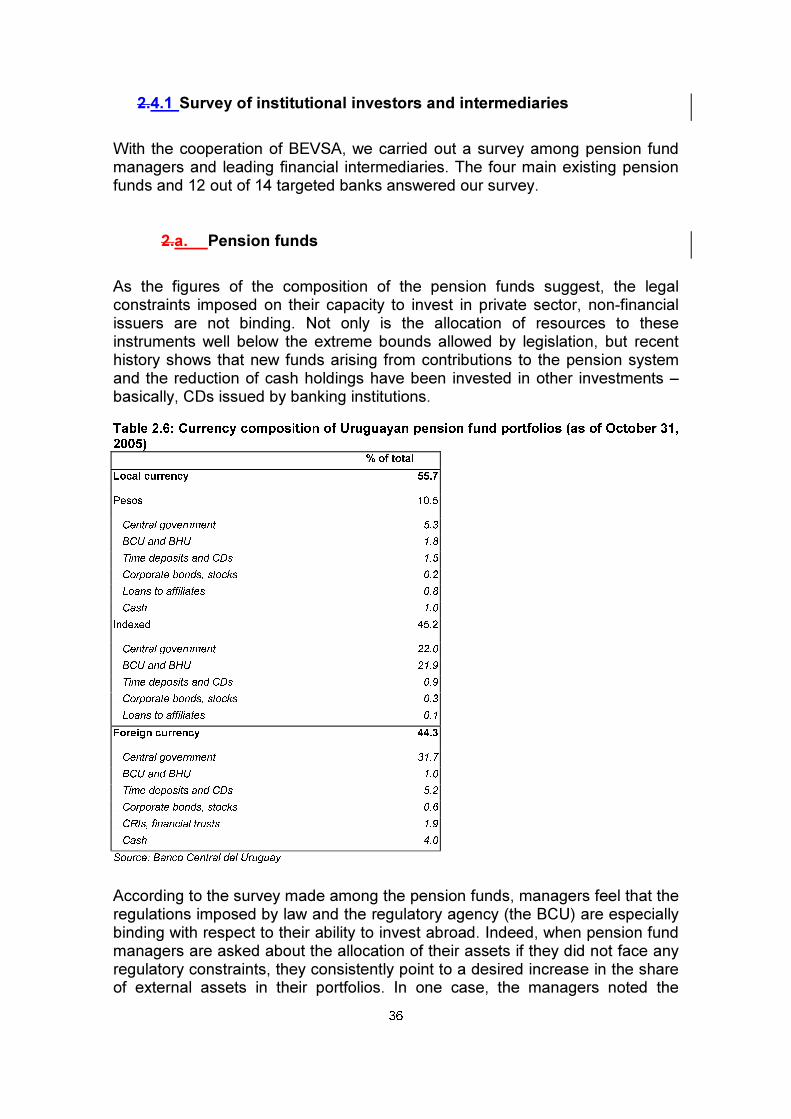
36
2.4.1 Survey of institutional investors and intermediaries
With the cooperation of BEVSA, we carried out a survey among pension fundmanagers and leading financial intermediaries. The four main existing pensionfunds and 12 out of 14 targeted banks answered our survey.
2.a. Pension funds
As the figures of the composition of the pension funds suggest, the legalconstraints imposed on their capacity to invest in private sector, non-financialissuers are not binding. Not only is the allocation of resources to theseinstruments well below the extreme bounds allowed by legislation, but recenthistory shows that new funds arising from contributions to the pension systemand the reduction of cash holdings have been invested in other investments –basically, CDs issued by banking institutions.
Table 2.6: Currency composition of Uruguayan pension fund portfolios (as of October 31,2005)
% of total
Local currency 55.7
Pesos 10.5
Central government 5.3
BCU and BHU 1.8
Time deposits and CDs 1.5
Corporate bonds, stocks 0.2
Loans to affiliates 0.8
Cash 1.0
Indexed 45.2
Central government 22.0
BCU and BHU 21.9
Time deposits and CDs 0.9
Corporate bonds, stocks 0.3
Loans to affiliates 0.1
Foreign currency 44.3
Central government 31.7
BCU and BHU 1.0
Time deposits and CDs 5.2
Corporate bonds, stocks 0.6
CRIs, financial trusts 1.9
Cash 4.0
Source: Banco Central del Uruguay
According to the survey made among the pension funds, managers feel that theregulations imposed by law and the regulatory agency (the BCU) are especiallybinding with respect to their ability to invest abroad. Indeed, when pension fundmanagers are asked about the allocation of their assets if they did not face anyregulatory constraints, they consistently point to a desired increase in the shareof external assets in their portfolios. In one case, the managers noted the

37
restriction affecting the possibility to invest in CDs issued by banks – notbecause of the ceiling on the overall portfolio of the pension fund, but becauseof limitations posed by the net worth of the issuer. As can be expected from thebehavior revealed in the composition of the portfolios, no binding legalrestrictions are emphasized on the side of their ability to invest in the securitiesof private sector, non-financial firms.
The survey reveals a perception of high risk entailed in investments in corporatebonds. Among the factors affecting the decision to invest in said instruments,the answer to the criterion “high risk of insolvency” was “Yes” in all the answersobtained. In three of the four cases, the criterion “limited legal recourse in theevent of default” was considered a relevant factor. This perception may bebased on the recent history of defaults involving issuers of corporate bonds.
The availability of information does not seem to be a limiting factor in thedemand for corporate bonds. Only one of the four managers answered “Yes” tothe criterion “lack of timely information about the issuer,” suggesting that defaultrisks are viewed as related more to sudden changes in the macroeconomicenvironment rather than to lack of appropriate information on the issuer. In thesame vein, only one manager considered the credit rating system to be of “lowquality” or too costly – the same single manager that pointed to inadequateinformation about issuers. In sum, according to the majority of the managers ofthe pension funds, problems with the potential demand for corporate bonds donot arise from an inadequate information system to assess the risk involved, butfrom a perception of high macroeconomic risks stemming from the highvulnerability of Uruguayan companies to economic shocks and difficulties toenforce creditor rights in the event of a default.
All the managers of pension funds surveyed considered “low marketcapitalization” as a limiting factor, but the absence of a deep secondary marketdoes not seem to be relevant for the decision to invest in corporate bonds. Inthree of the four cases, the answer to “low liquidity/poor functioning of thesecondary market” was “No”, revealing that, in general, the pension funds actas hold-to-maturity investors.
When the managers are asked about the allocation of additional funds in theirportfolio, the answers point to the need for a greater diversification. They wouldlike to reduce the share of government securities in their portfolio (except in onecase) and to increase the participation of domestic private-sector securities andforeign assets. Asked about the apparent contradiction of being ready toincrease investments in “domestic corporate bonds” in a context where they cando this already, managers say that any marginal availability of funds would likelybe directed to CDs issued by banks. In one case, the additional funds would beallocated to cash, given the perceived lack of investment opportunities.
The evidence on the perception of either a “crowding-out” effect or a positiveexternality effect between government and corporate bonds is mixed. Thereaction to the statement “A large stock of government bonds is important forthe development of the corporate bond market” is tilted to “disagreement”

38
(except in one case), suggesting that, from the point of view of the pensionfunds, the underdevelopment of the capital market is not a constraint to allocateresources to private-sector projects. At the same time, the statement“Government and corporate bonds are substitutes in your portfolio” had areaction also tilted to disagreement (except in the same case as before).
The apparent contradiction with the expectation that government debt serves asa useful benchmark to develop the capital market, facilitating issuance byprivate-sector firms once transactions costs are reduced, can be explained bythe special characteristics of the pension funds as institutional investors. As waspointed out earlier, the pension funds in Uruguay seem to behave as hold-to-maturity investors, and so they are mostly worried with an adequate assumptionof risk through an appropriate design of the financial instrument and with accessto the primary market – rather than with the extent of liquidity in the secondarymarket or the eventual impact of public debt on returns on private-sectorsecurities. This explanation is consistent with the good reception that somestructured (asset-backed) credits issued recently had among pension funds – infact, in some instances these instruments were placed solely among pensionfunds. The common factor that those successful placements had wasappropriate contract design aimed at facilitating the recovery of the investmentin case of default.
2.b. Other institutional investors
Besides the pension funds, there are other institutional investors involved in themanagement of sector-specific pension systems, like those funds serving self-employed professionals and bank employees. Given that those other pensionsystems also have some participation in the Uruguayan capital market, weextended the survey to cover these secondary pension funds, as well.
Like in the case of the pension funds already considered, government securitiesrepresent the greater portion of the portfolios managed by these institutionalinvestors. They share with the managers of the main pension funds theirworries about “high insolvency risk” on the part of corporate bond issuers, butthey are more consistently concerned with problems of appropriate informationabout the issuer – including the role of credit-rating agencies and the reliabilityof their judgments – and with the extent of liquidity in the secondary market. Itmust be taken into account that, in contrast to the relatively new managers ofpension funds in the wake of the reform of the social security system of 1995,the pension funds for self-employed professionals and bank employees aretotally mature, and the composition of their portfolios thus look for returns butalso for high liquidity.
Consistent with this view, all the surveyed investors attribute importance, aslimiting factors affecting their decision to invest in corporate bonds, to problemssuch as “low market capitalization” and “low liquidity/functioning of thesecondary market”. As in the case of the managers of the main pension funds,there is no clear consensus about the role of government debt in the
39
development of the capital market. The statement “A large stock of governmentbonds is important for the development of the corporate bond market” receivesa variety of reactions, while the statement “Government and corporate bondsare substitutes in your portfolio” receives answers tilted toward “disagreement”.Since government securities are so prominent in pension fund portfolios, theseanswers can be interpreted as expressing an interest in private-sector securitiesas a means to increase average returns on portfolios.
2.c. Financial intermediaries
Given the absence of a great variety of institutional investors and the importantpresence of retail investors in the Uruguayan capital market, we considereduseful to extend the survey to include some important market-makers like banksand stock brokers, whose opinions are also influential in the investmentdecision of their customers.
There are no significant differences in the points of view of the market makerswith those already referred coming from institutional investors. Among thebanks that gave information on the composition of their portfolios (nine of twelvereported their own and third-party positions), only two (of nine) reported asignificant (around 10%) share of corporate bonds. In the rest, the share wasalmost zero. There are in fact many coincidences in terms of risk-returnconsiderations about the limitations to investing in corporate bonds. Theperception is that returns are often too low given the default risks involved, orthat default risks are unacceptably high given the returns available. Like in thecase of other institutional investors, there are more concerns about liquidity inthe secondary market than in the case of the main pension funds. It iscomplemented by a generalized view that “low market capitalization” is adeterminant factor discouraging the investment in corporate debt.
However, as a difference with other financial intermediaries, there is a greatdeal of dispersion in reactions to the eventual lack of good quality in theservices provided by credit-rating agencies, but most of the firms surveyedagree that the “lack of timely information about the issuer” is a relevant factorthat militates against investments in private-sector corporate bonds.
The revealed interest in corporate debt showed to be particularly negative whenfinancial intermediaries were asked about the allocation of increased resources.Only one of twelve showed a consistent interest in augment the share ofcorporate debt under this scenario. Notwithstanding that, the interest in“corporate debt indexed to inflation if it became widely available” had a moremixed response, possibly reflecting the fact that main factors that discourageinvestment in corporate bonds are “low secondary market liquidity” and “lowmarket capitalization” (and that is the reason why the note “widely available”can make a difference).
40
5. Conclusions
The Uruguayan capital markets in general and the fixed income market inparticular have functioned well in terms of allowing for secondary markettransactions of government debt, but are extremely undeveloped in terms ofprivate-sector securities. After a short period of relative boom in the mid-1990s,the market for corporate debt declined and has remained underdeveloped. Thefinancial fragility of Uruguayan firms (so clearly obvious in the 2002 crisis)amplified by corporate governance problems are the main reasons for suchunderdevelopment.
From an investor point of view, the perception of high corporate fragility makesthem eager to invest in public debt, other financial instruments locally or abroad,or even to make direct investments in sectors where by their specific knowledgethey can quantify industry-specific risks and corporate governance problems.
The existence of financial intermediaries with the ability to closely monitor theperformance of the firms in their portfolios could alleviate the high riskassociated with local corporations. In the past, several investment funds wereactive in the market but unfortunately they also disappeared due to acombination of the economic crisis and internal (fund) corporate governanceproblems that affected their reputation. Today the main institutional investorsare the pension funds. There are other institutional investors of lesserimportance, like insurance companies (the main one is state-owned) and otherones involved in the management of sector-specific pension systems. Theemergence of new institutional investors (e.g. investment funds) is unlikely.Based on the good reputation of the pension funds, it may be advisable to allowthem to manage more than one fund (e.g., complementary retirement benefits)and capture more investments that can at least in part be targeted to thecorporate sector. Currently, the law does not allow them to do this.
The roots for the corporate sector fragility can be found in an unstablemacroeconomic environment and the widespread nature of currencymismatches. The macroeconomic instability of the last decades is responsiblefor the high dollarization of the Uruguayan economy and the absence offinancial instruments denominated in local currency. The government is nowpursuing a de-dollarization agenda, and institutional investors – the leadingpension funds – have played an important role in the development of a marketfor peso-denominated (mostly inflation-adjusted) instruments. But householdsand firms are somewhat more reluctant to change long-term practices inpersonal portfolio management, so it is not clear that currency mismatches willsoon be reduced. Thus, firms are likely to keep running currency mismatcheswhile the banking system keeps running currency-related credit risks.
Uruguay has been the most dollarized country in Latin America and yet also thecountry where corporate debt has had the shortest average maturity. Thissituation has generated currency and maturity mismatches that have exposedthe country’s firms to dangerous currency and refinancing risks. The

41
development of a deeper fixed-income market would surely ameliorate thesestructural financial problems faced by Uruguayan firms.
Although there may be some regulatory deficiencies, the main determinants ofthis condition of limited access are not of a regulatory nature. The majorperceived shortcomings by institutional investors are not inadequate informationto assess the risks involved, but rather the vulnerability of Uruguayan firms tomacroeconomic shocks and difficulties to enforce creditor rights in the event ofdefault.
Moreover, potential issuers declare their willingness to disclosure the requestedinformation in order to be rated as a first step to eventual debt issuance.Beyond this declared willingness, there is surprisingly little knowledge amongcorporate managers about financial alternatives to borrowing from banks andsuppliers.
Despite the fact that transparency is not perceived as a problem by investorsand the apparent readiness of many firms to disclose information, the usualagency problems associated with long-term debt have promoted opportunisticbehavior by firm owners and managers that in the end have resulted in defaultepisodes. These episodes generated important negative externalities thataffected and still linger in the domestic capital market.
A deepening of the fixed-income market could help to extend corporate debtmaturities, helping to reduce these kinds of mismatches and thereby fosteringinvestment in fixed assets and economic growth. Moreover, reduceddependence on short-term bank credit would also lower the exposure of firms tointerest-rate and credit-availability cycles.
Currently, the only actively traded issues in the market are those issued by thepublic sector. There are very few private-sector firms that look attractive for thecapital markets. We expect that those few firms that until now have managed tomaintain their reputation and have been successful in the past in securing fundsfrom the capital market will continue to do have access. Eventually, we couldobserve some new firms from expanding sectors getting into the fixed-incomemarket. The appearance of ABS transactions may allow investors to get aroundthe financial fragility problem and especially the corporate governance problem,but again the size of the firms makes it difficult to find assets or claims on futureincome large enough to make issuance worthwhile. Thus, most firms will likelykeep funding their activities through the banking sector and through supplier’scredit.
Existing large state-owned firms could fund their investments through the capitalmarket. The problem is that they are restricted because their debt is included inand managed as public sector debt, and their investment plans are part ofdiscretional government spending. Nevertheless, other public sector-relatedprojects like private sector issuance to finance public infrastructure projects maycome to pass.

42
The overwhelming size of the government’s indebtedness does not seem to begenerating sizeable crowding-out effects. Our survey showed that firms werepretty neutral with respect to the effect of government debt. Given the earlyfinancial liberalization of the Uruguayan economy, capital movements are suchthat in the absence of Uruguayan public debt, those agents currently holdingthese assets could have obtained similar ones in the international markets.Government debt may set a benchmark for private sector debt pricing, butaccording to our survey, firms do not really appreciate this externality and in anycase it is something of a second-order of magnitude given the other moresevere problems encountered. In the meantime, the issuance and trading ofgovernment debt certainly allows the two Uruguayan bourses to survive.
References
Bentancor, A. (1999). Estructura financiera de las empresas en Uruguay. XIVJornadas Anuales de Economía. Banco Central del Uruguay. Montevideo
Clarke, Alvaro (2004): Uruguay: Sources of Growth: An Analysis of the CapitalMarket in Uruguay. Background paper included in a study on Sources of Growthin Uruguay. World Bank.
De Brun, J., N. Gandelman and E. Barbieri (2003). Investment and FinancialRestrictions at the Firm Level in Uruguay. In Arturo Galindo and FabioSchiantarelli, editors, Credit Constraints and Investment in Latin America.Washington, DC: IADB, pp. 259-291.
De Brun, J. and G. Licandro (2005). To Hell and Back: Crisis Management in aDollarized Economy, the Case of Uruguay. Paper presented at the Conferenceon the Policy Implications of De Facto Dollarization, held at Banco de laReserva del Perú, Lima.
Demirgüc-Kunt, A. and R. Levine (1999): Bank-Based and Market-BasedFinancial System: Cross-Country Comparisons, manuscript, The World Bank.
De la Torre, A and S.. Schmukler, 2004. Coping with Risks throughMismatches: Domestic and International Financial Contracts for EmergingEconomies. International Finance, Vol. 7 (3), pp. 349-390.
Gilli, B. (2005). Estructura de capital de las empresas uruguayas en el marcode la teoría de jerarquía de preferencias. Universidad de Valencia.
Kamil, H. (2004). A New Database on the Currency Composition and MaturityStructure of Firms’ Balance Sheets in Latin America: 1990-2002”, Mimeo IADB
Kamil, H. (2005). Exchange Rate Regimes and Corporate FinancialVulnerability in Dollarized Economies. Doctoral dissertation, University ofMichigan, Ann Arbor.
43
Klapper, L. and I. Love (2002) “Corporate Governance, Investor Protection andPerformance in Emerging Markets” Manuscript, Development Research Group,World Bank.
Licandro, G. and J. A. Licandro (2003). “Building the De-dollarization agenda:The Case of Uruguay.” Money Affairs, CEMLA, Vol. XVI (#1), July-December.
Monteserín, G. and D. Chiappori (2004). Dinámica de las decisions definanciamiento: estudio aplicado a empresas instaladas en Uruguay. XIXJornadas Anuales de Economía. Banco Central del Uruguay. Montevideo
Munyo, I. (2005). The Determinants of Capital Structure: Evidence from anEconomy Without [a] Stock Market. Draft, September 2005.
Olivera, R. and B. Bugallo (1996) "Evolución en la Adopción del Tipo Social",unpublished manuscript.
Pascale, R. (1978) Inversión, financiamiento y rentabilidad de la industriamanufacturera uruguaya. Montevideo: Banco Central del Uruguay.
Pascale, R. (1982). Comportamiento financiero de la industria manufacturerauruguaya. Montevideo: Banco Central del Uruguay.
Pascale, R. (1994). Finanzas de las empresas uruguayas. Montevideo: BancoCentral del Uruguay.
Robledo, I. (1994). Estructura financiera de la empresa e inversión: el casouruguayo. Documento de Trabajo CERES #14. Montevideo.
Zervos, S. (2004), The Transactions Costs of Primary Market Issuance:TheCase of Brazil, Chile, and Mexico, World Bank Policy Research Working Paper3424.

Appendix
Table A1: Level and composition of central government bonds (as % of GDP)
Domestic bonds (issued under domestic law) Foreign bonds (issued under foreign laws)
Domestic Currency Domestic CurrencyForeign Currency
Nominal IndexedForeign Currency
Indexed
Prices
Long Term Short Term Short Term Long TermShort Term Long Term
Overnightinterestrates
TOTALDOMESTIC
BONDS Long Term Short TermNominal
PricesOvernightinterestrates
TOTALFOREIGNBONDS
Total
1985 11,9% 9,8% 1,0% 0,0% 0,0% 0,0% 0,0% 22,7% 0,0% 0,0% 0,0% 0,0% 0,0% 0,0% 22,7%
1986 11,0% 8,9% 2,0% 0,0% 0,0% 0,0% 0,0% 21,9% 0,0% 0,0% 0,0% 0,0% 0,0% 0,0% 21,9%
1987 9,2% 9,5% 1,7% 0,0% 0,0% 0,0% 0,0% 20,5% 0,0% 0,0% 0,0% 0,0% 0,0% 0,0% 20,5%
1988 9,8% 11,1% 2,1% 0,0% 0,0% 0,0% 0,0% 23,0% 0,0% 0,0% 0,0% 0,0% 0,0% 0,0% 23,0%
1989 9,7% 11,8% 1,9% 0,0% 0,0% 0,0% 0,0% 23,4% 0,0% 0,0% 0,0% 0,0% 0,0% 0,0% 23,4%
1990 9,7% 12,2% 1,7% 0,0% 0,0% 0,0% 0,0% 23,6% 0,0% 0,0% 0,0% 0,0% 0,0% 0,0% 23,6%
1991 8,8% 10,1% 0,6% 0,0% 0,0% 0,0% 0,0% 19,5% 0,0% 0,0% 0,0% 0,0% 0,0% 0,0% 19,5%
1992 9,1% 7,2% 0,5% 0,0% 0,0% 0,0% 0,0% 16,7% 0,0% 0,0% 0,0% 0,0% 0,0% 0,0% 16,7%
1993 8,6% 5,5% 0,6% 0,0% 0,0% 0,0% 0,0% 14,7% 0,0% 0,0% 0,0% 0,0% 0,0% 0,0% 14,7%
1994 7,0% 4,6% 0,2% 0,0% 0,0% 0,0% 0,0% 11,8% 2,3% 0,0% 0,0% 0,0% 0,0% 2,3% 14,1%
1995 7,1% 4,9% 0,0% 0,0% 0,0% 0,0% 0,0% 12,0% 2,3% 0,0% 0,0% 0,0% 0,0% 2,3% 14,3%
1996 7,5% 4,2% 0,0% 0,0% 0,0% 0,0% 0,0% 11,8% 2,6% 0,0% 0,0% 0,0% 0,0% 2,6% 14,4%
1997 7,6% 4,2% 0,4% 0,0% 0,0% 0,0% 0,0% 12,2% 3,8% 0,0% 0,0% 0,0% 0,0% 3,8% 16,0%
1998 7,4% 4,9% 0,3% 0,0% 0,0% 0,0% 0,0% 12,6% 5,3% 0,0% 0,0% 0,0% 0,0% 5,3% 17,8%
1999 8,0% 3,6% 0,3% 0,0% 0,0% 0,0% 0,0% 11,9% 6,8% 0,0% 0,0% 0,0% 0,0% 6,8% 18,7%
2000 8,5% 0,6% 0,3% 0,0% 0,0% 0,0% 0,0% 9,4% 9,8% 0,0% 0,0% 0,0% 0,0% 9,8% 19,2%
2001 9,9% 2,8% 0,3% 0,0% 0,0% 0,0% 0,0% 13,0% 15,7% 0,0% 0,0% 0,0% 0,0% 15,7% 28,7%
2002 13,2% 2,1% 0,9% 0,0% 0,0% 1,5% 0,0% 17,6% 27,0% 0,0% 0,0% 0,0% 0,0% 27,0% 44,6%
2003 13,2% 4,2% 2,4% 0,0% 0,0% 1,7% 0,0% 21,6% 32,4% 0,0% 0,0% 1,7% 0,0% 34,1% 55,7%
2004 10,0% 4,0% 0,6% 0,0% 0,0% 2,4% 0,0% 17,0% 27,1% 0,0% 2,1% 2,6% 0,0% 31,7% 48,7%
2005 7,7% 2,7% 0,2% 0,0% 0,0% 3,9% 0,0% 14,6% 27,0% 0,0% 0,9% 2,3% 0,0% 30,2% 44,8%
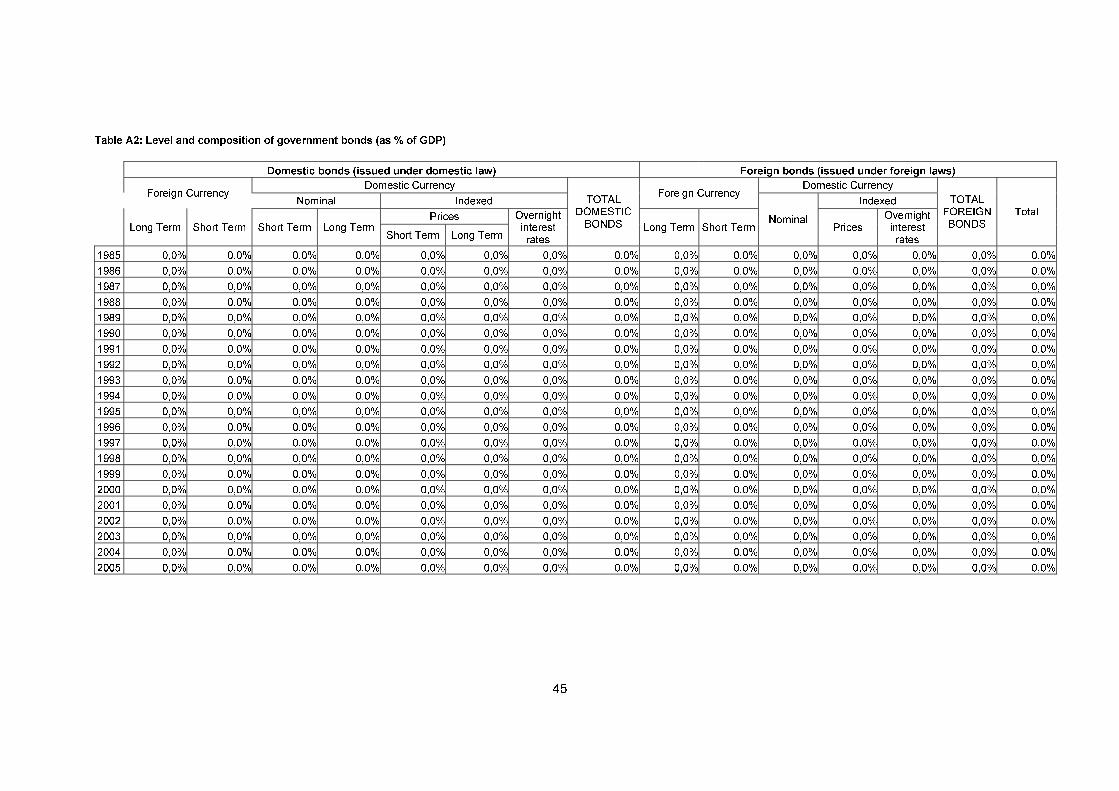
45
Table A2: Level and composition of government bonds (as % of GDP)
Domestic bonds (issued under domestic law) Foreign bonds (issued under foreign laws)
Domestic Currency Domestic CurrencyForeign Currency
Nominal IndexedForeign Currency
Indexed
PricesLong Term Short Term Short Term Long Term
Short Term Long Term
Overnightinterestrates
TOTALDOMESTIC
BONDS Long Term Short TermNominal
PricesOvernightinterestrates
TOTALFOREIGNBONDS
Total
1985 0,0% 0,0% 0,0% 0,0% 0,0% 0,0% 0,0% 0,0% 0,0% 0,0% 0,0% 0,0% 0,0% 0,0% 0,0%
1986 0,0% 0,0% 0,0% 0,0% 0,0% 0,0% 0,0% 0,0% 0,0% 0,0% 0,0% 0,0% 0,0% 0,0% 0,0%
1987 0,0% 0,0% 0,0% 0,0% 0,0% 0,0% 0,0% 0,0% 0,0% 0,0% 0,0% 0,0% 0,0% 0,0% 0,0%
1988 0,0% 0,0% 0,0% 0,0% 0,0% 0,0% 0,0% 0,0% 0,0% 0,0% 0,0% 0,0% 0,0% 0,0% 0,0%
1989 0,0% 0,0% 0,0% 0,0% 0,0% 0,0% 0,0% 0,0% 0,0% 0,0% 0,0% 0,0% 0,0% 0,0% 0,0%
1990 0,0% 0,0% 0,0% 0,0% 0,0% 0,0% 0,0% 0,0% 0,0% 0,0% 0,0% 0,0% 0,0% 0,0% 0,0%
1991 0,0% 0,0% 0,0% 0,0% 0,0% 0,0% 0,0% 0,0% 0,0% 0,0% 0,0% 0,0% 0,0% 0,0% 0,0%
1992 0,0% 0,0% 0,0% 0,0% 0,0% 0,0% 0,0% 0,0% 0,0% 0,0% 0,0% 0,0% 0,0% 0,0% 0,0%
1993 0,0% 0,0% 0,0% 0,0% 0,0% 0,0% 0,0% 0,0% 0,0% 0,0% 0,0% 0,0% 0,0% 0,0% 0,0%
1994 0,0% 0,0% 0,0% 0,0% 0,0% 0,0% 0,0% 0,0% 0,0% 0,0% 0,0% 0,0% 0,0% 0,0% 0,0%
1995 0,0% 0,0% 0,0% 0,0% 0,0% 0,0% 0,0% 0,0% 0,0% 0,0% 0,0% 0,0% 0,0% 0,0% 0,0%
1996 0,0% 0,0% 0,0% 0,0% 0,0% 0,0% 0,0% 0,0% 0,0% 0,0% 0,0% 0,0% 0,0% 0,0% 0,0%
1997 0,0% 0,0% 0,0% 0,0% 0,0% 0,0% 0,0% 0,0% 0,0% 0,0% 0,0% 0,0% 0,0% 0,0% 0,0%
1998 0,0% 0,0% 0,0% 0,0% 0,0% 0,0% 0,0% 0,0% 0,0% 0,0% 0,0% 0,0% 0,0% 0,0% 0,0%
1999 0,0% 0,0% 0,0% 0,0% 0,0% 0,0% 0,0% 0,0% 0,0% 0,0% 0,0% 0,0% 0,0% 0,0% 0,0%
2000 0,0% 0,0% 0,0% 0,0% 0,0% 0,0% 0,0% 0,0% 0,0% 0,0% 0,0% 0,0% 0,0% 0,0% 0,0%
2001 0,0% 0,0% 0,0% 0,0% 0,0% 0,0% 0,0% 0,0% 0,0% 0,0% 0,0% 0,0% 0,0% 0,0% 0,0%
2002 0,0% 0,0% 0,0% 0,0% 0,0% 0,0% 0,0% 0,0% 0,0% 0,0% 0,0% 0,0% 0,0% 0,0% 0,0%
2003 0,0% 0,0% 0,0% 0,0% 0,0% 0,0% 0,0% 0,0% 0,0% 0,0% 0,0% 0,0% 0,0% 0,0% 0,0%
2004 0,0% 0,0% 0,0% 0,0% 0,0% 0,0% 0,0% 0,0% 0,0% 0,0% 0,0% 0,0% 0,0% 0,0% 0,0%
2005 0,0% 0,0% 0,0% 0,0% 0,0% 0,0% 0,0% 0,0% 0,0% 0,0% 0,0% 0,0% 0,0% 0,0% 0,0%

46
Table A3: Level and Composition of BCU Bonds (as a percentage of GDP)
Domestic bonds (issued under domestic law) Foreign bonds (issued under foreign laws)
Domestic Currency Domestic CurrencyForeign Currency
Nominal IndexedForeign Currency
Indexed
PricesLong Term Short Term Short Term Long Term
Short Term Long Term
Overnightinterestrates
TOTALDOMESTIC
BONDS Long Term Short TermNominal
PricesOvernightinterestrates
TOTALFOREIGNBONDS
Total
1985 0,8% 0,0% 0,0% 0,8% 38,8% 38,8% 39,6%
1986 2,0% 0,0% 0,0% 2,0% 30,2% 30,2% 32,1%
1987 1,7% 0,0% 0,0% 1,7% 32,9% 32,9% 34,5%
1988 0,0% 0,0% 0,0% 0,0% 32,3% 32,3% 32,3%
1989 0,0% 0,0% 0,0% 0,0% 31,1% 31,1% 31,1%
1990 1,7% 0,0% 0,0% 1,7% 28,8% 28,8% 30,5%
1991 0,6% 0,0% 0,0% 0,6% 14,4% 14,4% 15,0%
1992 0,5% 0,0% 0,0% 0,5% 9,6% 9,6% 10,1%
1993 0,0% 0,0% 0,0% 0,0% 7,5% 7,5% 7,5%
1994 0,0% 0,0% 0,0% 0,0% 6,1% 6,1% 6,1%
1995 1,1% 0,0% 0,0% 1,1% 5,4% 5,4% 6,5%
1996 0,3% 0,0% 0,0% 0,3% 4,9% 4,9% 5,2%
1997 0,4% 0,0% 0,0% 0,4% 4,4% 4,4% 4,8%
1998 0,3% 0,0% 0,0% 0,3% 3,9% 3,9% 4,2%
1999 0,6% 0,0% 0,0% 0,6% 3,4% 3,4% 3,9%
2000 0,0% 0,0% 0,0% 0,0% 3,2% 3,2% 3,2%
2001 0,0% 0,0% 0,0% 0,0% 2,5% 2,5% 2,5%
2002 0,0% 0,0% 0,0% 0,0% 3,5% 3,5% 3,5%
2003 1,0% 1,1% 0,0% 2,1% 1,4% 1,4% 3,5%
2004 1,2% 3,0% 0,0% 4,2% 1,1% 1,1% 5,3%
2005 3,1% 0,9% 1,3% 5,2% 0,2% 0,2% 5,4%
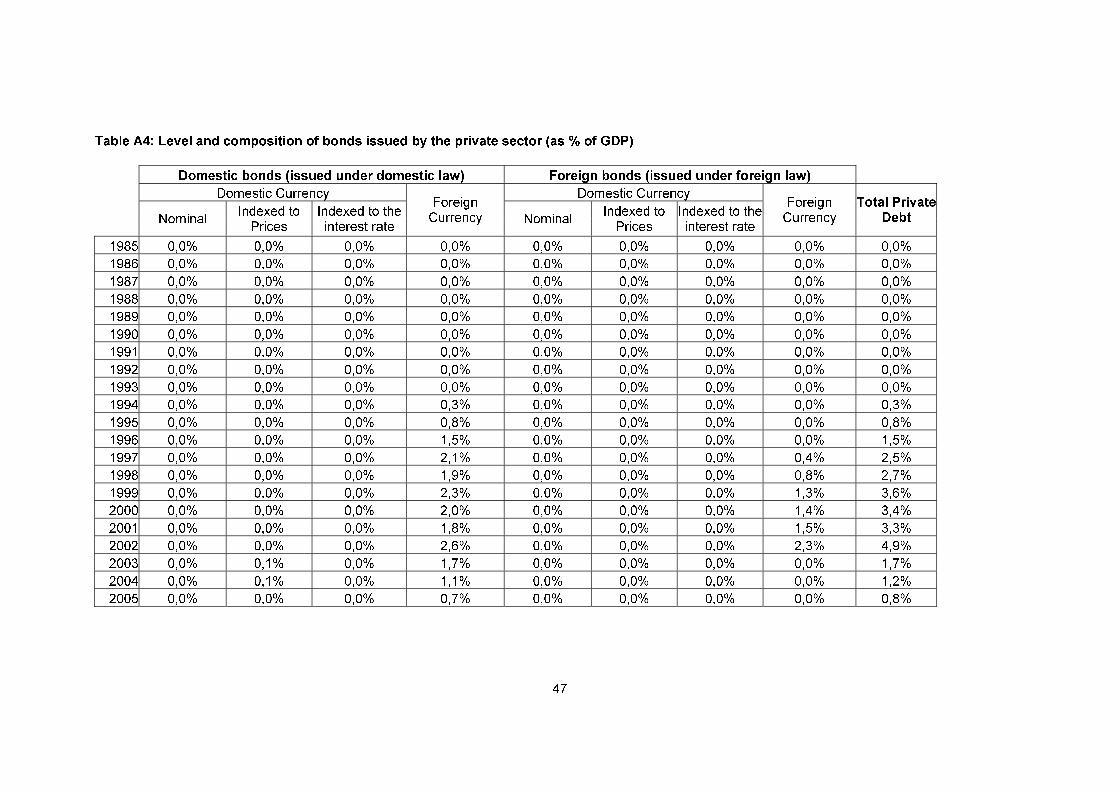
47
Table A4: Level and composition of bonds issued by the private sector (as % of GDP)
Domestic bonds (issued under domestic law) Foreign bonds (issued under foreign law)
Domestic Currency Domestic Currency
NominalIndexed to
PricesIndexed to theinterest rate
ForeignCurrency Nominal
Indexed toPrices
Indexed to theinterest rate
ForeignCurrency
Total PrivateDebt
1985 0,0% 0,0% 0,0% 0,0% 0,0% 0,0% 0,0% 0,0% 0,0%
1986 0,0% 0,0% 0,0% 0,0% 0,0% 0,0% 0,0% 0,0% 0,0%
1987 0,0% 0,0% 0,0% 0,0% 0,0% 0,0% 0,0% 0,0% 0,0%
1988 0,0% 0,0% 0,0% 0,0% 0,0% 0,0% 0,0% 0,0% 0,0%
1989 0,0% 0,0% 0,0% 0,0% 0,0% 0,0% 0,0% 0,0% 0,0%
1990 0,0% 0,0% 0,0% 0,0% 0,0% 0,0% 0,0% 0,0% 0,0%
1991 0,0% 0,0% 0,0% 0,0% 0,0% 0,0% 0,0% 0,0% 0,0%
1992 0,0% 0,0% 0,0% 0,0% 0,0% 0,0% 0,0% 0,0% 0,0%
1993 0,0% 0,0% 0,0% 0,0% 0,0% 0,0% 0,0% 0,0% 0,0%
1994 0,0% 0,0% 0,0% 0,3% 0,0% 0,0% 0,0% 0,0% 0,3%
1995 0,0% 0,0% 0,0% 0,8% 0,0% 0,0% 0,0% 0,0% 0,8%
1996 0,0% 0,0% 0,0% 1,5% 0,0% 0,0% 0,0% 0,0% 1,5%
1997 0,0% 0,0% 0,0% 2,1% 0,0% 0,0% 0,0% 0,4% 2,5%
1998 0,0% 0,0% 0,0% 1,9% 0,0% 0,0% 0,0% 0,8% 2,7%
1999 0,0% 0,0% 0,0% 2,3% 0,0% 0,0% 0,0% 1,3% 3,6%
2000 0,0% 0,0% 0,0% 2,0% 0,0% 0,0% 0,0% 1,4% 3,4%
2001 0,0% 0,0% 0,0% 1,8% 0,0% 0,0% 0,0% 1,5% 3,3%
2002 0,0% 0,0% 0,0% 2,6% 0,0% 0,0% 0,0% 2,3% 4,9%
2003 0,0% 0,1% 0,0% 1,7% 0,0% 0,0% 0,0% 0,0% 1,7%
2004 0,0% 0,1% 0,0% 1,1% 0,0% 0,0% 0,0% 0,0% 1,2%
2005 0,0% 0,0% 0,0% 0,7% 0,0% 0,0% 0,0% 0,0% 0,8%
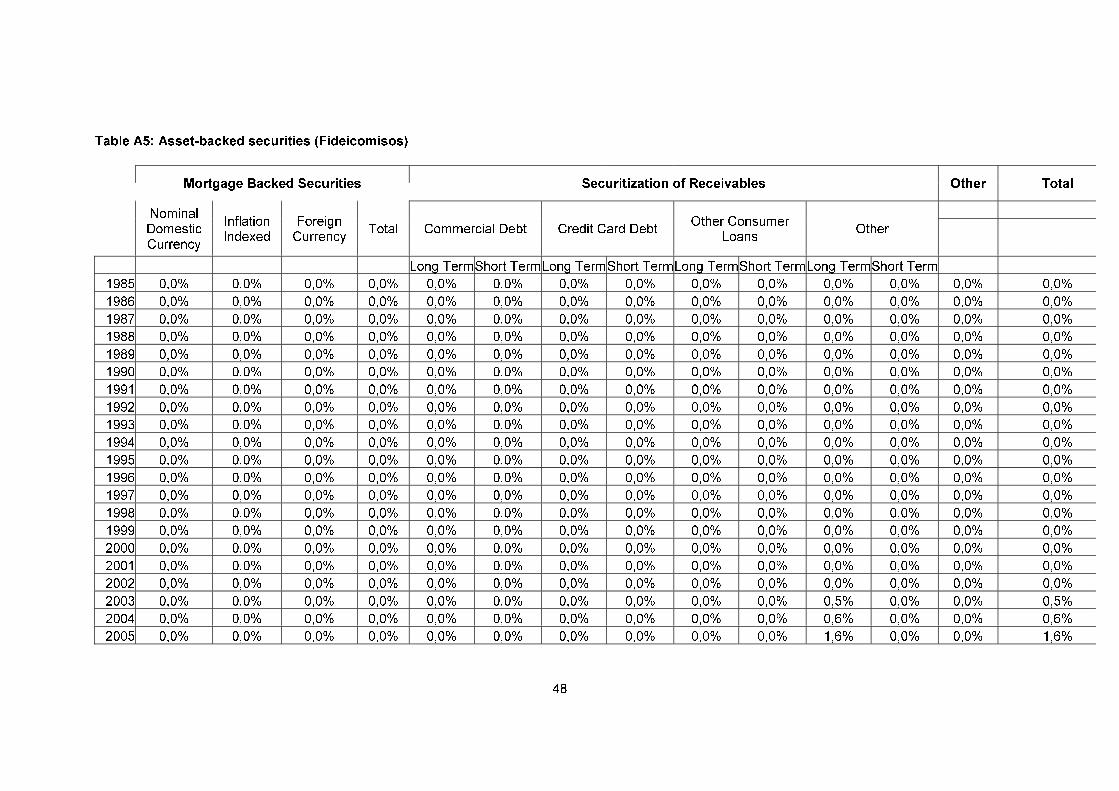
48
Table A5: Asset-backed securities (Fideicomisos)
Mortgage Backed Securities Securitization of Receivables Other Total
NominalDomesticCurrency
InflationIndexed
ForeignCurrency
Total Commercial Debt Credit Card DebtOther Consumer
LoansOther
Long TermShort TermLong TermShort TermLong TermShort TermLong TermShort Term
1985 0,0% 0,0% 0,0% 0,0% 0,0% 0,0% 0,0% 0,0% 0,0% 0,0% 0,0% 0,0% 0,0% 0,0%
1986 0,0% 0,0% 0,0% 0,0% 0,0% 0,0% 0,0% 0,0% 0,0% 0,0% 0,0% 0,0% 0,0% 0,0%
1987 0,0% 0,0% 0,0% 0,0% 0,0% 0,0% 0,0% 0,0% 0,0% 0,0% 0,0% 0,0% 0,0% 0,0%
1988 0,0% 0,0% 0,0% 0,0% 0,0% 0,0% 0,0% 0,0% 0,0% 0,0% 0,0% 0,0% 0,0% 0,0%
1989 0,0% 0,0% 0,0% 0,0% 0,0% 0,0% 0,0% 0,0% 0,0% 0,0% 0,0% 0,0% 0,0% 0,0%
1990 0,0% 0,0% 0,0% 0,0% 0,0% 0,0% 0,0% 0,0% 0,0% 0,0% 0,0% 0,0% 0,0% 0,0%
1991 0,0% 0,0% 0,0% 0,0% 0,0% 0,0% 0,0% 0,0% 0,0% 0,0% 0,0% 0,0% 0,0% 0,0%
1992 0,0% 0,0% 0,0% 0,0% 0,0% 0,0% 0,0% 0,0% 0,0% 0,0% 0,0% 0,0% 0,0% 0,0%
1993 0,0% 0,0% 0,0% 0,0% 0,0% 0,0% 0,0% 0,0% 0,0% 0,0% 0,0% 0,0% 0,0% 0,0%
1994 0,0% 0,0% 0,0% 0,0% 0,0% 0,0% 0,0% 0,0% 0,0% 0,0% 0,0% 0,0% 0,0% 0,0%
1995 0,0% 0,0% 0,0% 0,0% 0,0% 0,0% 0,0% 0,0% 0,0% 0,0% 0,0% 0,0% 0,0% 0,0%
1996 0,0% 0,0% 0,0% 0,0% 0,0% 0,0% 0,0% 0,0% 0,0% 0,0% 0,0% 0,0% 0,0% 0,0%
1997 0,0% 0,0% 0,0% 0,0% 0,0% 0,0% 0,0% 0,0% 0,0% 0,0% 0,0% 0,0% 0,0% 0,0%
1998 0,0% 0,0% 0,0% 0,0% 0,0% 0,0% 0,0% 0,0% 0,0% 0,0% 0,0% 0,0% 0,0% 0,0%
1999 0,0% 0,0% 0,0% 0,0% 0,0% 0,0% 0,0% 0,0% 0,0% 0,0% 0,0% 0,0% 0,0% 0,0%
2000 0,0% 0,0% 0,0% 0,0% 0,0% 0,0% 0,0% 0,0% 0,0% 0,0% 0,0% 0,0% 0,0% 0,0%
2001 0,0% 0,0% 0,0% 0,0% 0,0% 0,0% 0,0% 0,0% 0,0% 0,0% 0,0% 0,0% 0,0% 0,0%
2002 0,0% 0,0% 0,0% 0,0% 0,0% 0,0% 0,0% 0,0% 0,0% 0,0% 0,0% 0,0% 0,0% 0,0%
2003 0,0% 0,0% 0,0% 0,0% 0,0% 0,0% 0,0% 0,0% 0,0% 0,0% 0,5% 0,0% 0,0% 0,5%
2004 0,0% 0,0% 0,0% 0,0% 0,0% 0,0% 0,0% 0,0% 0,0% 0,0% 0,6% 0,0% 0,0% 0,6%
2005 0,0% 0,0% 0,0% 0,0% 0,0% 0,0% 0,0% 0,0% 0,0% 0,0% 1,6% 0,0% 0,0% 1,6%

49