Embed Size (px)
Citation preview

ORIGINAL ARTICLE
The first draft of the pigeonpea genome sequence
Nagendra K. Singh & Deepak K. Gupta & Pawan K. Jayaswal & Ajay K. Mahato &
Sutapa Dutta & Sangeeta Singh & Shefali Bhutani & Vivek Dogra & Bikram P. Singh &
Giriraj Kumawat & Jitendra K. Pal & Awadhesh Pandit & Archana Singh &
Hukum Rawal & Akhilesh Kumar & G. Rama Prashat & Ambika Khare & Rekha Yadav &
Ranjit S. Raje & Mahendra N. Singh & Subhojit Datta & Bashasab Fakrudin &
Keshav B. Wanjari & Rekha Kansal & Prasanta K. Dash & Pradeep K. Jain &
Ramcharan Bhattacharya & Kishor Gaikwad & Trilochan Mohapatra & R. Srinivasan &
Tilak R. Sharma
Received: 2 July 2011 /Accepted: 7 October 2011 /Published online: 25 October 2011# Society for Plant Biochemistry and Biotechnology 2011
Abstract Pigeonpea (Cajanus cajan) is an important grainlegume of the Indian subcontinent, South-East Asia andEast Africa. More than eighty five percent of the worldpigeonpea is produced and consumed in India where it is a
key crop for food and nutritional security of the people.Here we present the first draft of the genome sequence of apopular pigeonpea variety ‘Asha’. The genome was assem-bled using long sequence reads of 454 GS-FLX sequencingchemistry with mean read lengths of >550 bp and >10-foldgenome coverage, resulting in 510,809,477 bp of high qualitysequence. Total 47,004 protein coding genes and 12,511transposable elements related genes were predicted. Weidentified 1,213 disease resistance/defense response genesand 152 abiotic stress tolerance genes in the pigeonpeagenome that make it a hardy crop. In comparison to soybean,pigeonpea has relatively fewer number of genes for lipidbiosynthesis and larger number of genes for cellulosesynthesis. The sequence contigs were arranged in to 59,681scaffolds, which were anchored to eleven chromosomes ofpigeonpea with 347 genic-SNP markers of an intra-speciesreference genetic map. Eleven pigeonpea chromosomesshowed low but significant synteny with the twenty chromo-somes of soybean. The genome sequence was used to identifylarge number of hypervariable ‘Arhar’ simple sequence repeat(HASSR) markers, 437 of which were experimentallyvalidated for PCR amplification and high rate of polymor-phism among pigeonpea varieties. These markers will beuseful for fingerprinting and diversity analysis of pigeonpeagermplasm and molecular breeding applications. This is thefirst plant genome sequence completed entirely through anetwork of Indian institutions led by the Indian Council ofAgricultural Research and provides a valuable resource for thepigeonpea variety improvement.
Keywords Pigeonpea . Genome sequence . Diseaseresistance . SSR markers . Legumes
Electronic supplementary material The online version of this article(doi:10.1007/s13562-011-0088-8) contains supplementary material,which is available to authorized users.
N. K. Singh (*) :D. K. Gupta : P. K. Jayaswal :A. K. Mahato :S. Dutta : S. Singh : S. Bhutani :V. Dogra : B. P. Singh :G. Kumawat : J. K. Pal :A. Pandit :A. Singh :H. Rawal :A. Kumar :G. Rama Prashat : R. Kansal : P. K. Dash : P. K. Jain :R. Bhattacharya :K. Gaikwad : T. Mohapatra :R. Srinivasan :T. R. SharmaNational Research Centre on Plant Biotechnology,Indian Agricultural Research Institute,New Delhi 110 012, Indiae-mail: [email protected]
A. Khare : R. Yadav : R. S. RajeDivision of Genetics, Indian Agricultural Research Institute,New Delhi 110012, India
M. N. SinghInstitute of Agricultural Sciences, Banaras Hindu University,Varanasi, UP 221005, India
S. DattaIndian Institute of Pulses Research,Kanpur, UP 208024, India
B. FakrudinUniversity of Agricultural Sciences,Dharwad, Karnataka 580005, India
K. B. WanjariPanjabrao Deshmukh Krishi Vidyapeeth,Krishinagar,Akola, Maharasthra 444 104, India
J. Plant Biochem. Biotechnol. (Jan–June 2012) 21(1):98–112DOI 10.1007/s13562-011-0088-8
AbbreviationsHASSR hypervariable ‘Arhar’ simple sequence repeatsSNP single nucleotide polymorphismAKI Agricultural knowledge initiative
Introduction
Pigeonpea or Red Gram (Cajanus cajan (L.) Millspaugh) isan important food legume for the tropical and subtropicalregions of Indian subcontinent, South-East Asia and EastAfrica. It is a shrub with self-compatible cleistogamousflowers, but is often cross-pollinated by bees with 10–15%out crossing. The estimated size of pigeonpea genomepacked in 11 chromosomes is 858 Mbp (Greilhuber andObermayer 1998). It plays important role in food andnutritional security because it is a rich source of proteins,minerals and vitamins. Pigeonpea seeds are consumedmainly as split pea soups such as ‘Dal’ and ‘Sambar’ buta significant proportion is also consumed as green pea
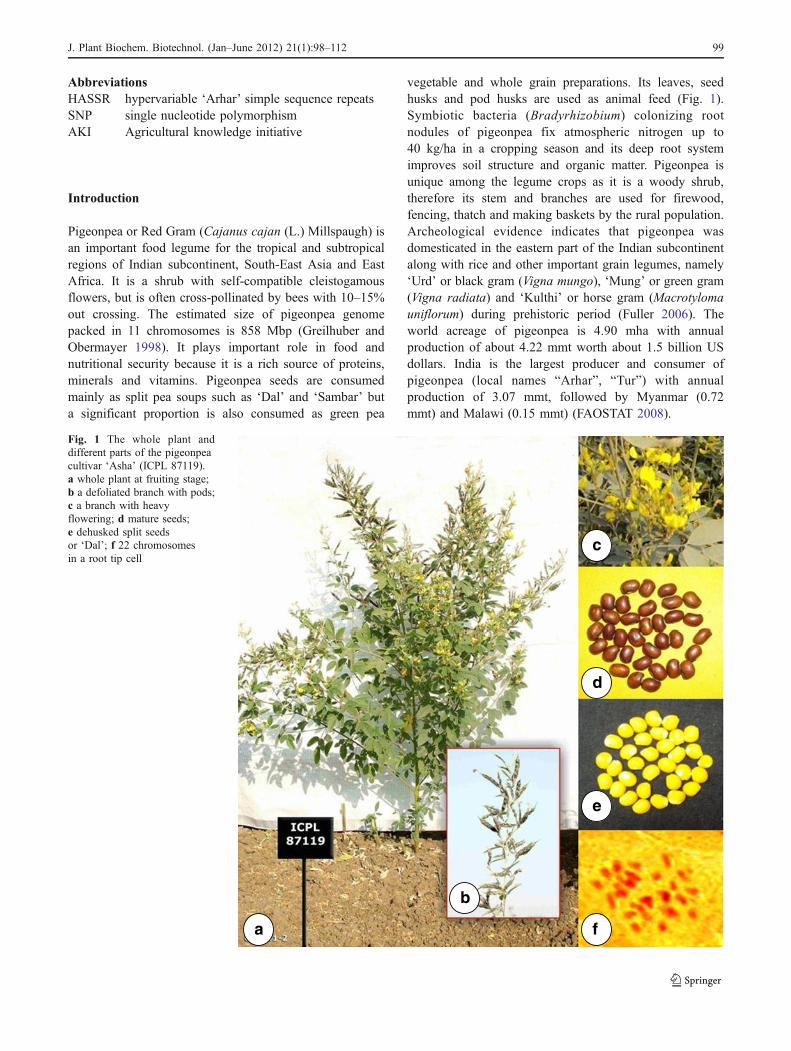
vegetable and whole grain preparations. Its leaves, seedhusks and pod husks are used as animal feed (Fig. 1).Symbiotic bacteria (Bradyrhizobium) colonizing rootnodules of pigeonpea fix atmospheric nitrogen up to40 kg/ha in a cropping season and its deep root systemimproves soil structure and organic matter. Pigeonpea isunique among the legume crops as it is a woody shrub,therefore its stem and branches are used for firewood,fencing, thatch and making baskets by the rural population.Archeological evidence indicates that pigeonpea wasdomesticated in the eastern part of the Indian subcontinentalong with rice and other important grain legumes, namely‘Urd’ or black gram (Vigna mungo), ‘Mung’ or green gram(Vigna radiata) and ‘Kulthi’ or horse gram (Macrotylomauniflorum) during prehistoric period (Fuller 2006). Theworld acreage of pigeonpea is 4.90 mha with annualproduction of about 4.22 mmt worth about 1.5 billion USdollars. India is the largest producer and consumer ofpigeonpea (local names “Arhar”, “Tur”) with annualproduction of 3.07 mmt, followed by Myanmar (0.72mmt) and Malawi (0.15 mmt) (FAOSTAT 2008).
a
b
c
d
e
f
Fig. 1 The whole plant anddifferent parts of the pigeonpeacultivar ‘Asha’ (ICPL 87119).a whole plant at fruiting stage;b a defoliated branch with pods;c a branch with heavyflowering; d mature seeds;e dehusked split seedsor ‘Dal’; f 22 chromosomesin a root tip cell
J. Plant Biochem. Biotechnol. (Jan–June 2012) 21(1):98–112 99

Knowledge of the genetic basis of yield, quality andstress tolerance is important for genetic improvement ofpigeonpea. Until a couple of years ago pigeonpea wasconsidered an orphan legume crop but now substantialamount of genomic resources have been generated, largelyowing to the efforts of Indo-US Agricultural KnowledgeInitiative (AKI), NSF and GCP funded projects, (Varshneyet al. 2009, 2010a; Dutta et al. 2011; Bohra et al. 2011).Pigeonpea cultivars have a narrow genetic base due tolimited breeding efforts and poor utilization of wild pigeonpeaspecies. Availability of genome sequence will accelerate theutilization of pigeonpea germplasm resources in breeding(Yang et al. 2006; Saxena 2008; Varshney et al. 2010b).Development of molecular markers tightly linked to theimportant agronomic traits is a prerequisite for undertakingmolecular breeding in plants. But molecular basis of mostagronomic traits in pigeonpea remains unexplored due to lowlevel of DNA polymorphism in the primary gene pool andlimited number of validated molecular markers (Ratnaparkheet al. 1995; Yang et al. 2006; Odeny et al. 2009; Dutta et al.2011; Bohra et al. 2011).
The aim of present study was: (a) to decode thepigeonpea genome by using next generation sequencingtechnologies and analyse its genes and repeat DNAcontents; (b) generation of chromosome specific sequenceby anchoring the sequence scaffolds to a high densityreference molecular linkage map and its comparison withsoybean genome; and (c) development of SSR markers forgene discovery and molecular breeding applications.Pigeonpea variety ‘Asha’ selected for this purpose is apopular variety with one of the highest breeder seed indentsin India and is resistant to common diseases of pigeonpea,namely Fusarium wilt and sterility mosaic disease.
Materials and methods
Plant materials
Pigeonpea variety ‘Asha’ (ICPL87119) was used forgenome sequencing and validation of newly designedHASSR markers. To identify informative HASSR markers,a set of 8 genotypes namely Asha, UPAS 120, HDM 04–1,Pusa Dwarf, H2004-1, Bahar, Maruti and TTB7 wasscreened for marker polymorphism. The seeds wereobtained originally from IARI, New Delhi, ICRISATHyderabad, IIPR Kanpur and CCSHAU Hisar.
Genome sequence assembly and submission to NCBIGenBank
High quality genomic DNA was isolated from the leaves ofa single plant of variety ‘Asha’ using CTAB method
(Murray and Thompson 1980). Sequencing of 19 plates ofwhole genome shotgun libraries of short DNA fragmentswas carried out using GS-FLX Phase D chemistry, and 3plates of paired end sequences from a library of 20 Kb longfragments of pigeonpea genomic DNA using GS-FLXTitanium chemistry (Margulies et al. 2005). Filtered highquality sequence reads were assembled using “Newbler GSDe Novo assembler version 2.5.3” (Roeche Inc. Germany)with: Overlap minimum match length = 25 bp, Largegenome = True, Number of CPU used = 0 (all), Excludecontigs of <500 bp. The GS Assembler is designed tocompare all sequence reads in a pair wise fashion. Readsthat overlap one another are joined into contigs. Theconsensus sequence for a contig is computed by taking anaverage of all aligned reads at a specific nucleotideposition, the paired end reads were used for makingscaffolds of sequence contigs. The large sequence contigswere quality checked and contaminating sequences wereidentified and removed. The quality check passed Fastafiles containing 510,809,477 bp of pigeonpea genomesequence were further processed using command linesoftware of NCBI to generate .sqn file (http://www.ncbi.nlm.nih.gov/HTGS/tbl2asninfo.html), which was submittedto GenBank as draft genome version 1 using GenomesMacro Send direct submission tool.
Gene annotation
Thewhole genome large sequence contigs were passed throughFGENESH tool of MOLQUEST software (www.softberry.com) using Arabidopsis thaliana gene models as reference.From all predicted genes only those with size of >500 bpwere taken for further analysis. The genes were BLASTsearched against NCBI non-redundant database using opti-mized search parameters of gap opening penalty (G) = 4, gapextension penalty (E) = 1, mismatch score (q) = −1, matchscore (r) = 1, word size (W) = 11 and e-value <e−20 (Singh etal. 2004). Low complexity regions were included in thesearch. The BLAST search output was processed usingBLAST Parser software (http://geneproject.altervista.org/).All the hits having bit scores of >100 and e values of <e−20
were tabulated in Microsoft Excel. Gene annotations weremanually curated and categorized based on their functions.Details of pigeonpea transcriptome assemblies used forvalidation of predicted gene models is described earlier (Duttaet al. 2011). The predicted genes were manually curated withdifferent keywords/phrases using auto filters to find R-likeand defense response genes and categorize them into fivemain classes (Hulbert et al. 2001; The Rice Chromosomes 11and 12 sequencing consortia 2005): (a) NBS-LRR (matchingwith NBS-LRR, but not with LZ-NBS-LRR and LRR, CC-NBS-LRR, Rp 1-d8, Lr10, Mla 1 and rust resistance), (b) LZ-NBS-LRR (matching with LZ-NBS-LRR, but not with NBS-
100 J. Plant Biochem. Biotechnol. (Jan–June 2012) 21(1):98–112

LRR, CC-NBS-LRR, LRR and RPM1), (c) LRR-TM(matching with serine/threonine kinases and Cf2/Cf5 resis-tance), (d) miscellaneous category (matching with diseaseresistance, viral resistance, LRR, but not with NBS-LRR, CC-NBS-LRR, LZ-NBS-LRR), (e) defense response genes(matching with glucanases, chitinases and thaumatin likeproteins). Similarly, genes for abiotic stress tolerance, lipidmetabolism, sugar and starch biosynthesis, cellulose synthesisand transcription factors were also identified and categorized.
Annotation of transposable elements and repeats
Both De novo and homology based approaches were usedfor the identification of repeats in the large sequencecontigs of pigeonpea genome. We used Repeat Modelersoftware pipeline for the construction of repeat library usingRECON and Repeat Scout software (Benson 1999; Bao andEddy 2002). Repeat Masker software was used forannotation using RMBLAST as search engine (Woottonand Federhen 1993; Lander et al. 2001; Waterston et al.2002). Same strategy was used for the identification ofrepeats in genetically anchored scaffolds. We developedand added two different Perl scripts (Split masker, Maskedtable) in the Repeat Masker to break the large data set intoindividual files and simultaneously run the complete file inone go. Masked table script produced results on percentageof masked elements in each scaffold and exported it inMicrosoft Ecxel.
For analysis of ribosomal RNA genes we downloaded allplant rDNA data from NCBI and used BLASTN search tofind 28S, 18S and 5.8S rRNA genes in the pigeonpeagenome. 5S rRNA genes were searched using a pigeonpeasequence obtained by cloning of Cot1 repeat fraction.tRNAscan software (Schattner et al. 2005; Lowe and Eddy1997) was used for prediction of transfer RNA genes.The miRNA genes were identified using BLASTN search(e >1*10−5, top hits) of sequences present in the miRNAdatabase, allowing no more than three mismatches (miRBAserelease 17.0, Griffiths-Jones 2004; Griffiths-Jones et al. 2006,2008; Kozomara and Griffiths-Jones 2011). Rfam database(version 10.1, May 2011, Gardner et al. 2010; Griffiths-Joneset al. 2005) was used for identification of ribosomal, smallnuclear and small nucleolar RNA genes. For snRNA onlythose families having 100% identity and e values of <0.001were selected, whereas for snoRNA 80% identity and evalues of <0.001 were selected.
Anchoring of sequence scaffolds to pigeonpeachromosomes
The sequence scaffolds were anchored to a high densitylinkage map of genic-SNP markers of an intra-speciesreference mapping population derived from Asha/
UPAS120. The linkage map was based on two Illuminamultiplex SNP assays of 1536-plex and 768-plex SNPsidentified by comparing deep coverage transcriptomeassemblies of the parental lines Asha and UPAS 120 (Duttaet al. 2011 and our unpublished results). The 59,681sequence scaffolds assembled from the 454 GS-FLXsequence data were used to create a local database. Total366 genic-SNP marker sequences genetically mapped toeleven pigeonpea chromosomes were BLASTN searchedagainst this database at a cutoff bit score of ≥100 ande-value of <e−20. Gene density per 50 kb of anchoredscaffolds was plotted for each chromosome at respectivegenetic map positions (cM) using Microsoft Excel. An-chored scaffolds were also scanned for the identificationand annotation of RE using Repeat Modeler and RepeatMasker software, respectively. The percentage of RE ineach scaffold was plotted against the gene density. The TErelated genes in the scaffolds were identified using BLASTsearch in the NCBI-NR database.
Comparison between pigeonpea and soybean genomes
A total of 42,094 non-TE related genes were predicted fromthe pseudomolecules of twenty chromosomes of soybean(Glycine max) using the same approach as described aboveand a local database was created. Genes in the anchoredscaffolds of pigeonpea were searched against this databaseusing BLASTN with optimized search parameters (Singh etal. 2004). The output was parsed using BLAST Parsersoftware (http://geneproject.altervista.org/) and tabulated inMicrosoft Excel. Chromosomal positions of both pigeonpeaand soybean genes were retained in the gene headers foranalysis of synteny. Numbers of hits with bit scores ≥100for each of the eleven pigeonpea chromosomes was countedin soybean and tabulated using Microsoft Excel. Similarcomparison was made using single copy pigeonpea genesagainst the soybean chromosomes and a circular syntenymap was plotted according to Krzywinski et al. (2009). Toidentify single copy genes a local database of all thepredicted pigeonpea genes was created using ‘formatdb’script of the NCBI local BLAST (Altschul, et al. 1990). Allgenes in the database were searched against themselves tofind their copy numbers in the genome.
In silico mining, primer design and validation of genomic-SSR markers
All assembled contigs were screened for the presence ofSSRs using MISA software (http://pgrc.ipk-gatersleban.de/misa). MISA created two types of files namely, 454All-Contigs.fna.misa and 454AllContigs.fna.misa.statistics.MISA files were transferred to Microsoft Excel whereSSRs were classified into mono-, di-, tri-, tetra-, penta- and
J. Plant Biochem. Biotechnol. (Jan–June 2012) 21(1):98–112 101

hexa-nucleotide and compound repeats. The minimumrepeat number was set at 10 for mono-, 6 for di-, and 5for tri-, tetra-, penta- and hexa-nucleotides. CompoundSSRs were defined as those loci having ≥2 SSRsinterrupted by ≤100 bp of non-repetitive sequence. Class ISSRs with repeat lengths of ≥20 bp and hypervariable SSRswith repeat lengths of ≥50 bp were extracted according toTemnykh et al. (2001) and Singh et al. (2010), respectively.Nomenclature of markers HASSR1-HASSR437 usingprefix H for hypervariable A for “Arhar” (pigeonpea)followed by SSR identification number was on the samepattern as describes earlier for pigeonpea genic-ASSRmarkers (Dutta et al. 2011). Primer pairs flanking therepeats were designed using Primer3 software (http://frodo.wi.mit.edu/). The target amplicon size was set to 100–260 bp, annealing temperature to 60°C, primer length to20 bp and GC content to 50%. The primers were BLASTsearched against the whole genome sequence to identifythose with unique binding sites. For marker validationgenomic DNA of eight pigeonpea genotypes was adjustedto a final concentration of 25 ng/μl. Total 437 genomicHASSR loci were first tested for PCR amplification usinggenomic DNA from Asha using PTC225 Gradient Cycler(Bio-Rad). PCR was carried out in 15 μl reaction volumecontaining 1.5 μl of 10× reaction buffer, 0.20 μl of 10 mMdNTPs (133 μM), 1.5 μl each of forward and reverseprimers (10 pmol), 2.5 μl (62.5 ng) of template genomicDNA and 0.15 μl (0.75 U) of Taq DNA polymerase(Vivantis Technologies). The PCR cycling profile was:initial denaturation at 94°C for 5 min, followed by 35cycles of 94°C for 1 min., 55°C for 1 min., 72°C for 1 minand a final extension at 72°C for 7 min. Re-screening ofprimers that did not amplify at these conditions wasdone by sequentially decreasing the annealing tempera-ture by 1°C; and for the primers producing multiplebands by sequentially increasing the annealing temper-ature by 1°C. The optimized SSR markers were thenused for genotyping of eight varieties to check the levelof polymorphism. PCR products were separated byelectrophoresis in 4% Metaphor agarose gels (Lonza,Rockland USA) containing 0.1 μg/ml ethidium bromidein 1× TBE buffer at 130 V for 4 h, visualized andphotographed in gel documentation system Fluorchem™5,500 (Alfa Innotech Crop., USA).
Results and discussion
Pigeonpea genome assembly
The aim of present study was to generate the first draft ofpigeonpea genome sequence by making use of longsequence reads of 454 GS-FLX pyrosequencing ‘Phase D’
chemistry with modal read lengths of >550 bases. A total of25,489,474 sequence reads with sequence information of10,101,433,318 bp was generated. The primary sequenceassembly included 21,102,008 sequence reads (82.79%)with 9.48 Gb sequence data, >10× coverage of the pigeon-pea genome in 332,766 sequence contigs with consensussequence of ~548 Mb. Of this, 192,089 contigs were largerthan 500 bases with consensus sequence of ~511 Mb,average contig size of 2,661 bp, N50 contig size of4,522 bp and largest contig size of 45,193 bp. After qualitycheck (QC) 384 contig sequences were identified asbacterial contaminations and hence discarded. High qualityof sequence assembly was evident from 97.9% (~500 Mb)of the consensus bases having Phred Quality scores of >40,reflecting an error rate of less than 1 in 10,000 bp (Ewingand Green 1998). Finally, 191,705 QC-passed large contigswith total 510,809,477 bp sequence. This Whole GenomeShotgun project has been deposited at DDBJ/EMBL/GenBank under the accession AFSP00000000. The versiondescribed in this paper is the first version, AFSP01000000.The contigs were arranged into 59,681 scaffolds with thehelp of paired end sequences of 20 kb fragment library,covering ~458 Mb of genome sequence with averagescaffold size of 7,679 bp, N50 size of 13,989 bp and thelargest scaffold size of 177,971 bp. Thus 83.5% of thecontig sequences were arranged in the scaffolds, and 16.5%still remained as singletons. The large sequence contigs,representing about 60% of the estimated 858 Mb size of thepigeonpea genome (Greilhuber and Obermayer 1998), wereused for the analysis of genes and repeat contents of thegenome and mining of SSR loci. In addition, 40.7 Gb ofSOLiD mate pair sequence reads and 80.4 Gb of Illuminashotgun sequence reads have been generated for improvingthe genome coverage and sequence quality (Fig. 2). Thepublished BAC paired end sequence data set is alsoavailable for improving the scaffolds (Bohra et al. 2011).Initial analysis showed 764.27 Mb coverage of the pigeon-pea genome. However, present report describes analysis ofthe first draft using the 454 GS-FLX sequences only.
Gene content of the pigeonpea genome
The 454 GS-FLX large sequence contigs containing~511 Mb of high quality sequence were used for geneprediction using FGENESH software. Total 59,515 geneswere predicted with average gene size of 1,170 bp, largestgene size of 11,523 bp and the smallest gene size of 501 bp(Table 1). The average exon and intron sizes were 268 bpand 288 bp, respectively, which are comparable to soybean,the species most closely related to pigeonpea, for whichgenome sequence is available (Schmutz et al. 2010). Thepredicted coding sequences of the genes were comparedwith a high coverage transcriptome sequence assembly
102 J. Plant Biochem. Biotechnol. (Jan–June 2012) 21(1):98–112

database including Sanger ESTs and 454-FLX transcrip-tome sequence assembly (TSA) contigs (Dutta et al. 2011).Approximately 99.9% of the predicted genes showedsignificant matches within the pigeon pea transcriptomedatabase. Of the 59,515 predicted genes, 42,059 showedsignificant matches in the NCBI-NR database with bitscores higher than 100. Total 15,558 genes showed poorhits with bit scores lower than 100 and 2,147 genes showedno hits; therefore these sequences are unique to pigeonpea.Predicted genes were classified into different functionalcategories (Supplementary Table S1). Total 12,511 genes(21.02%) were TE-related and 27,441 genes (46.12%) wereof unknown function. The unknown category includes 2,147genes with no matches in the NCBI–NR database, 15,558
genes showing poor BLAST hits with bit scores <100 and9,746 genes showing significant matches in the NCBIdatabase with hypothetical category of genes. We addedthese 9,746 genes to the unknown function categorybecause they show significant matches with our pigeon-pea transcriptome database and hence are real genesshowing expression. Only sixteen genes belonged tohypothetical category as they did not show significantmatch with any transcript sequence. The remaining19,547 genes, 41.58% of the 47,004 protein coding genes,were those with known functions. Of these 6,180 wererelated to physiological traits, 1,213 for disease resistanceand defense response, 3,601 for cellular transportation,216 for stress response, 139 for protein synthesis, 453 for
Fig. 2 Flow diagram of thestrategy used for the decodingof pigeonpea genome sequence
J. Plant Biochem. Biotechnol. (Jan–June 2012) 21(1):98–112 103

growth and development, 751 for DNA synthesis andrepair and 6,994 genes for miscellaneous functions(Fig. 3).
Pigeonpea genome has a large number of 1,213 diseaseresistance (R-like) and defense response (DR) genes, whichis 2.58% of all protein coding genes (Supplementary TableS1). These were divided into five classes based on sequencehomology with the well established category of R-like andDR genes (Fig. 4). Total 98 DR genes were identifiedwhich belonged to three classes, namely chitinases (31genes), glucanases (56 genes) and thaumatin-like proteins(11 genes). Out of 1,115 R-like genes, 219 (19.6%)belonged to miscellaneous category including genes forviral resistance, verticillium wilt resistance, bacterial blight
resistance and genes containing LRR motif but withoutNBS, CC or LZ motifs. Of the total R-like genes the largestnumber of 459 genes (41.1%) showed homology to LRR-TM type genes, the second largest number of 436 genes(39.1%) showed homology to NBS-LRR type genes. Onlyone gene belonged to LZ-NBS-LRR category. The largenumber of disease resistance and defense response genesmakes pigeonpea a hardy crop with fewer diseases.
Pigeonpea genome has 152 homologs of genes that havebeen implicated in abiotic stress tolerance in other plantspecies (Table 2). These include, 56 genes for heat shockproteins, 32 genes for glutathione-S-transferase (GST), 28genes for trehalose-6-phosphate synthase (TPS), 8 genes forglutamine synthase (GS), 7 genes for water channel proteinaquaporins and several transcription factors involved inabiotic stress response e.g. DREB, NAC and MYB genes(Supplementary Table S2).
Schmutz et al. (2010) identified 1,127 putative acyl lipidmetabolism genes in the oilseed crop soybean. A similaranalysis of genes for lipid metabolism in pigeonpea genome
Table 1 Summary of gene prediction statistics in the genomesequence of pigeonpea variety ‘Asha’
Description Size/number
Size of the assembled genome sequence (bp) 510,809,477
Number of large sequence contigs 191,705
Number of protein coding genes 47,004
Number of TE-related genes 12,511
Largest gene size (bp) 11,523
Smallest gene Size (bp) 501
Average gene Size (bp) 1,170
Total number of exons 233,560
Largest exon size (bp) 6,555
Average exon size (bp) 268
Maximum number of exons in a gene 54
Total number of introns 180,000
Largest intron size (bp) 4,884
Average intron size (bp) 288
Stress Response(216)
DNA Synthesis and Repair(751)
Physiological Traits(6180)
Defense response(1213) Transportation
(3601)
Protein Synthesis(139)
Growth and Development
(453)
Unknown Function(27441)
Miscellaneous (6994)
Hypothetical (16)
TE Related(12511)
Fig. 3 Frequency of differentcategories of genes in the511 Mb of pigeonpea genomesequence. Unknown categoryincludes genes unique topigeonpea and those showingmatches with hypotheticalcategory genes of other species
Fig. 4 Frequency distribution of five main categories of resistance-like (R-like) and defense response (DR) genes predicted in thepigeonpea genome
104 J. Plant Biochem. Biotechnol. (Jan–June 2012) 21(1):98–112
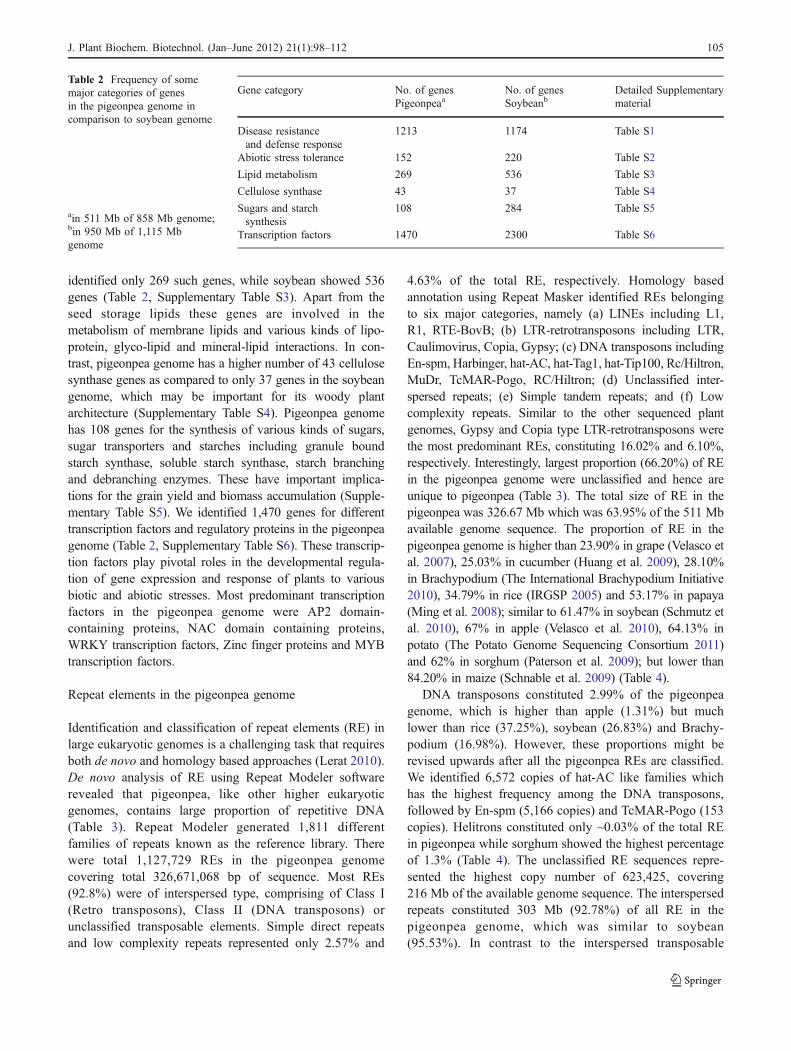
identified only 269 such genes, while soybean showed 536genes (Table 2, Supplementary Table S3). Apart from theseed storage lipids these genes are involved in themetabolism of membrane lipids and various kinds of lipo-protein, glyco-lipid and mineral-lipid interactions. In con-trast, pigeonpea genome has a higher number of 43 cellulosesynthase genes as compared to only 37 genes in the soybeangenome, which may be important for its woody plantarchitecture (Supplementary Table S4). Pigeonpea genomehas 108 genes for the synthesis of various kinds of sugars,sugar transporters and starches including granule boundstarch synthase, soluble starch synthase, starch branchingand debranching enzymes. These have important implica-tions for the grain yield and biomass accumulation (Supple-mentary Table S5). We identified 1,470 genes for differenttranscription factors and regulatory proteins in the pigeonpeagenome (Table 2, Supplementary Table S6). These transcrip-tion factors play pivotal roles in the developmental regula-tion of gene expression and response of plants to variousbiotic and abiotic stresses. Most predominant transcriptionfactors in the pigeonpea genome were AP2 domain-containing proteins, NAC domain containing proteins,WRKY transcription factors, Zinc finger proteins and MYBtranscription factors.
Repeat elements in the pigeonpea genome
Identification and classification of repeat elements (RE) inlarge eukaryotic genomes is a challenging task that requiresboth de novo and homology based approaches (Lerat 2010).De novo analysis of RE using Repeat Modeler softwarerevealed that pigeonpea, like other higher eukaryoticgenomes, contains large proportion of repetitive DNA(Table 3). Repeat Modeler generated 1,811 differentfamilies of repeats known as the reference library. Therewere total 1,127,729 REs in the pigeonpea genomecovering total 326,671,068 bp of sequence. Most REs(92.8%) were of interspersed type, comprising of Class I(Retro transposons), Class II (DNA transposons) orunclassified transposable elements. Simple direct repeatsand low complexity repeats represented only 2.57% and
4.63% of the total RE, respectively. Homology basedannotation using Repeat Masker identified REs belongingto six major categories, namely (a) LINEs including L1,R1, RTE-BovB; (b) LTR-retrotransposons including LTR,Caulimovirus, Copia, Gypsy; (c) DNA transposons includingEn-spm, Harbinger, hat-AC, hat-Tag1, hat-Tip100, Rc/Hiltron,MuDr, TcMAR-Pogo, RC/Hiltron; (d) Unclassified inter-spersed repeats; (e) Simple tandem repeats; and (f) Lowcomplexity repeats. Similar to the other sequenced plantgenomes, Gypsy and Copia type LTR-retrotransposons werethe most predominant REs, constituting 16.02% and 6.10%,respectively. Interestingly, largest proportion (66.20%) of REin the pigeonpea genome were unclassified and hence areunique to pigeonpea (Table 3). The total size of RE in thepigeonpea was 326.67 Mb which was 63.95% of the 511 Mbavailable genome sequence. The proportion of RE in thepigeonpea genome is higher than 23.90% in grape (Velasco etal. 2007), 25.03% in cucumber (Huang et al. 2009), 28.10%in Brachypodium (The International Brachypodium Initiative2010), 34.79% in rice (IRGSP 2005) and 53.17% in papaya(Ming et al. 2008); similar to 61.47% in soybean (Schmutz etal. 2010), 67% in apple (Velasco et al. 2010), 64.13% inpotato (The Potato Genome Sequencing Consortium 2011)and 62% in sorghum (Paterson et al. 2009); but lower than84.20% in maize (Schnable et al. 2009) (Table 4).
DNA transposons constituted 2.99% of the pigeonpeagenome, which is higher than apple (1.31%) but muchlower than rice (37.25%), soybean (26.83%) and Brachy-podium (16.98%). However, these proportions might berevised upwards after all the pigeonpea REs are classified.We identified 6,572 copies of hat-AC like families whichhas the highest frequency among the DNA transposons,followed by En-spm (5,166 copies) and TcMAR-Pogo (153copies). Helitrons constituted only ~0.03% of the total REin pigeonpea while sorghum showed the highest percentageof 1.3% (Table 4). The unclassified RE sequences repre-sented the highest copy number of 623,425, covering216 Mb of the available genome sequence. The interspersedrepeats constituted 303 Mb (92.78%) of all RE in thepigeonpea genome, which was similar to soybean(95.53%). In contrast to the interspersed transposable
Table 2 Frequency of somemajor categories of genesin the pigeonpea genome incomparison to soybean genome
ain 511 Mb of 858 Mb genome;bin 950 Mb of 1,115 Mbgenome
Gene category No. of genesPigeonpeaa
No. of genesSoybeanb
Detailed Supplementarymaterial
Disease resistanceand defense response
1213 1174 Table S1
Abiotic stress tolerance 152 220 Table S2
Lipid metabolism 269 536 Table S3
Cellulose synthase 43 37 Table S4
Sugars and starchsynthesis
108 284 Table S5
Transcription factors 1470 2300 Table S6
J. Plant Biochem. Biotechnol. (Jan–June 2012) 21(1):98–112 105

elements, simple repeats and low complexity repeatscontributed only 2.57% and 4.63% of the pigeonpea genome,respectively. These values were higher than 0.75% and 1.77%for the soybean genome (Schmutz et al. 2010).
Non-coding RNA genes in the pigeonpea genome
Genomes of higher plants contain thousands of copies ofgenes for non-coding RNA including rRNA, tRNA,
Table 4 Major classes of repeat elements (RE) in the pigeonpea genome in comparison to ten other sequenced plant genomes
Repeat Category Pigeon pea Soybean Apple Brachypodium Cucumber Grape Papaya Potato Rice Sorghum Maize
Genome sequence (Mb) 511 955 742 271 227 477 271 727 370 740 2045
RE in genome (%) 63.95 61.47 67.00 28.10 25.03 23.90 53.17 64.13 34.79 62.00 84.20
1. Interspersed repeats
1.1 Class I(Retro transposons)
23.6 68.7 55.72 83.01 48.55 85.8 82.72 50.44 55.60 87.9 89.77
Line 1.03 0.4 9.6 6.91 6.94 – 2.08 3.50 3.22 0.10 1.16
Copia 6.1 20.28 8.1 17.28 – 21.08 10.61 – 11.05 8.40 28.1
Gypsy 16.02 48.01 37.36 57.12 – 61.93 53.64 – 31.28 30.7 55.05
1.2 Class II(DNA transposons)
2.99 26.83 1.31 16.98 4.94 6.26 0.39 6.14 37.25 12.00 10.22
Hat super family 1.52 0.06 0.41 0.84 – 3.58 – – 1.08 0.02 1.35
Harbinger 0.14 0.47 0 1.49 – – – – – 0.02 –
Helitron 0.03 0.86 0 0.64 – – – – – 1.30 2.64
1.3 Unclassified 66.2 – 35.35 – 46.49 2.99 16.44 43.40 – 1.17 –
2. Simple repeats 2.57 0.75 – – – – – – – – –
3. Low complexityrepeats
4.63 1.77 – – – – – – – – –
Table 3 Different types ofrepeat elements in the 511 Mbof pigeonpea genome sequence
Repeat category Number of elements Sequence length (bp) Percent of repeats
1. Interspersed repeats
1.1 Class I (Retro transposons) 127,602 77,096,057 23.59
LINE-L1 5,239 2,270,477 0.69
LINE-R1 1,277 784,129 0.24
LINE-RTE-BovB 2,087 333,215 0.10
LTR 186 39,775 0.01
LTR-Caulimovirus 2,508 1,376,233 0.42
LTR-Copia 40,373 19,937,308 6.10
LTR-Gypsy 75,932 52,354,920 16.02
1.2 Class II (DNA transposons) 21,212 9,772,250 2.99
En-spm 5,166 2,339,643 0.71
Harbinger 1,348 467,230 0.14
hat-AC 6,572 4,059,651 1.24
hat-Tag1 1,806 586,556 0.17
hat-Tip100 934 337,903 0.10
MuDR 4,980 1,830,967 0.56
TcMAR-Pogo 153 43,654 0.01
RC/Hiltron 253 106,646 0.03
1.3 Unclassified 623,425 216,262,607 66.20
2. Simple repeats 72,522 8,405,304 2.57
3. Low complexityrepeats 282,968 15,134,850 4.63
Total 1,127,729 326,671,068 99.98
106 J. Plant Biochem. Biotechnol. (Jan–June 2012) 21(1):98–112

miRNA, snRNA and snoRNAwhich play important role inthe cellular protein synthesis machinery and regulation ofexpression of protein coding genes. In the pigeonpeagenome we identified 35 copies of 28S rRNA genes, 66copies of 18S rRNA (largest match of 2,346 bp in contignumber 7,811) and 77 copies of 5.8S rRNA (largest matchof 2,166 bp in contig number 77,111). We identified 270copies of 5S rRNA genes using pigeonpea specific rDNAprobes. We expect more copies of rRNA genes in thefinished genome. The tRNAscan-SE software identified671 tRNA genes. Of this, twenty were pseudogenes andtwo have undetermined anticodon isotypes. Remaining 649tRNA genes have 50 different anticodons, representing allthe twenty amino acids (Supplementary Table S7AB). Themaximum number of genes were for leucine tRNAs (49),followed by serine (47), arginine (45) and glycine (45).Thirty six of the pigeonpea tRNA genes contain introns.
MicroRNAs (miRNAs) are important regulators ofseveral biological processes like plant growth and devel-opment. These are 20–24 nucleotides in length. The 17threlease of miRBAse database contains 19,724 maturemiRNA sequences including 3,423 genes of plant origin.We identified 100 miRNA genes belonging to 32 differentfamilies in the pigeonpea genome (Fig. 5, SupplementaryTable S8). Out of the 100 miRNA genes, 52 belong tomiR829.1 family of Arabidopsis thaliana, which targetsexpression of three different proteins: (a) 3-ketoacyl-CoAreductase (b) P-glycoprotein and (c) central motor kinesin1. There were four miRNA genes targeting ATP-sulfurylaseand sulphate transporters (miR395), three genes eachtargeting Apetala2-like transcription factors (miR172) andF-box (miR393a) putative elements arein. There weretwenty seven miRNA gene families with one or two copies
of miRNA genes. Pigeonpea genome contains 226 snRNAgenes showing homology in the Rfam database version10.1 (May 2011). U6 family of snRNA showed the highestcopy number of 97 genes, followed by U2 (48 genes) andU1 (34 genes) (Supplementary Table S9A). Further searchwith the Rfam database identified 335 sequences belongingto 90 families of snoRNA genes. The snoR71 family hasthe highest number of 166 genes, followed by snoRA7 andsnoRD14 families having 10 genes each, the remainingfamilies had 1–6 genes per family (Supplementary TableS9B).
Anchoring of pigeonpea sequence scaffolds to genetic map
We developed a high density intra-species reference geneticmap of pigeonpea based on 366 genic-SNP markers (unpub-lished data). The 59,681 sequence scaffolds of pigeonpeagenome were compared with the sequences of mapped genic-SNP markers and 347 (99.3%) of these showed matches withan equal number of scaffolds, covering total sequence of~7.42 Mb. The anchored scaffolds provide genome widenucleation points for the finishing of the pigeonpea genomeand creation of large pseudomolecules for its eleven chromo-somes. The 347 scaffolds were assigned to the eleven linkagegroups of pigeonpea (Table 5). We predicted 1,041 genes inthe anchored scaffolds, 63 of these genes were identified asTE-related genes and 26 genes did not show any hit in thedatabase.
Out of the 7,424,371 bp of anchored scaffolds 1.697 Mb(23%) were RE which was less than half of the 63.95% REin the whole pigeonpea genome, indicating that theanchored scaffolds represented gene-rich regions of thegenome. Chromosome 10 showed the highest RE content
miR156, 1miR159, 2miR160, 1
miR166, 2
miR167, 1
miR169, 2
miR171, 2
miR172, 3miR297, 1
miR390, 1
miR393, 3miR394, 1miR395, 4
miR396, 1miR397, 1
miR399, 2
miR414, 1
miR466, 1
miR467, 1
miR828*, 1
miR829.1, 52
miR1171, 1
miR1507, 1
miR1515, 1
miR1527, 3
miR1863, 2
miR2111, 1miR2218, 1
miR2923, 1
miR4371, 2miR5072, 2
miR5141, 1
Fig. 5 Distribution of100 copies of miRNA in 32different family in peageonpeagenome
J. Plant Biochem. Biotechnol. (Jan–June 2012) 21(1):98–112 107

(26.24%) while chromosome 11 showed the lowest REcontent (15.43%). Anchored scaffolds represented only~1.6% of the total ~458 Mb of assembled scaffolds, butthey do provide a random sample of the genome and largenumber of nucleation points for the finishing of thegenome. The average number of genes per 50 kb ofscaffold sequence in the entire genome was 7.01 (Table 5).The gene density in the scaffolds was expected to beinversely proportional to the repeats density, which was truefor many of the anchored scaffolds. For example, inchromosome 2, 3 and 5 we could clearly find this patternfor most of the scaffolds (Fig. 6). There was no uniformpattern for all the chromosomes, e.g. there was higherdensity of repeats in the middle portion of chromosomes 1,5, 7 and 9, in one half of the chromosomes 4 and 10 and
both the telomeric ends of chromosome 3. There was noclear difference in the repeat density along the lengthsof chromosomes 2, 6, 8 and 11 (Fig. 6). In contrast, alltwenty chromosomes of soybean have higher repeatdensity in the centromeric regions and higher gene densitynear the telomeres (Schmutz et al. 2010). The gene densityin the anchored scaffolds of pigeonpea chromosomes wasin the range of 6.31 to 9.97 per 50 kb. Chromosome 11showed the highest gene density of 9.97% and lowest REcontent of 15%. However, this picture may change as the sizeof scaffolds grows and we capture a high proportion ofgenome in the anchored scaffolds. We plan to merge theIllumina and Solexa data to increase the sequence coverageand BAC end sequence for increasing the size of anchoredscaffolds.
Fig. 6 Density of genes and repeat elements (TE) in the 347 anchoredscaffolds on the eleven chromosomes of pigeonpea. Blue bars on theleft side of each chromosome represent RE percentage in the scaffoldand orange bars on the right side represent gene density per 50 kb.
Red segments at the end of orange bars represent number of TE-related genes in the scaffold. Discontinuous blue bars indicate REdensity of >40% whereas discontinuous orange bars represent genedensity in excess of >10 genes per 50 kb
Table 5 Gene and repeat densities in the pigeonpea genome scaffolds anchored with 347 genetically mapped genic-SNP markers
Chrom. No. No. ofMarkers
Size of scaffolds(bp)
No. of genes No. of genes per 50 kb Size of repeats(bp)
Percent repeatsin scaffolds
1 40 797,775 122 7.65 182,690 22.90
2 40 763,938 103 6.74 1,74,751 22.88
3 64 1,078,018 136 6.31 264,330 24.42
4 49 1,404,117 194 6.91 274,870 19.58
5 27 431,074 60 6.96 108,700 25.22
6 19 442,848 58 6.55 108,148 24.42
7 27 768,188 101 6.57 167,903 21.86
8 18 338,877 51 7.52 85,621 25.27
9 28 640,548 99 7.73 150,894 23.56
10 23 583,427 82 7.03 152,508 26.14
11 12 175,561 35 9.97 27,072 15.42
Total 347 7,424,371 1,041 7.01 1,697,486 22.87
108 J. Plant Biochem. Biotechnol. (Jan–June 2012) 21(1):98–112

Comparative analysis of pigeonpea and soybean genomes
Pigeonpea and soybean belong to the same clade Millet-tieae of the plant family Fabaceae (Wojciechowski 2003).Both are important crop plants but have quite different plantarchitecture and seed composition. Pigeonpea is a shrubgrown as annual crop that has high seed protein and starchcontents but minimal oil content. Soybean on the otherhand is an annual herb with seeds rich in oil and protein butlow in carbohydrates. Therefore, we were interested to seethe difference in the genome organization and gene contentof the two species. The 47,004 protein coding genes ofpigeonpea were compared with 42,094 protein codinggenes of soybean using BLAST search with defaultparameters. Total 31,937 (67.94%) of the pigeonpea genesshowed matches with soybean genes at a cutoff bit score of100, whereas 9,067 genes were unique to pigeonpea.Similarly, out of 42,094 genes predicted in soybean40,392 showed significant matches with pigeonpea genes,whereas 1,702 genes were unique to soybean. This showsthat pigeonpea has significantly higher number of uniquegenes that differentiate it from soybean.
Conservation of synteny between pigeonpea and soy-bean was analysed on the basis of 347 genetically anchoredscaffolds of pigeonpea. There are total 1,041 genes in theanchored scaffolds of which 512 are single copy genes.Number of matches with all genes and single copy genes ofpigeonpea in twenty chromosomes of soybean are shown inSupplementary Table S10. Genes on each of the pigeonpeachromosomes showed matches with multiple soybeanchromosomes but some soybean chromosomes showedsignificantly higher number of matches, and therefore arelikely be syntenic. Another aspect to this analysis wascomparison of all genes versus single copy pigeonpeagenes which are shown to have a greater conservation ofsynteny between rice and wheat (Singh et al. 2007). Ourcomparison of all genes versus single copy pigeonpeagenes with soybean also showed an improved visualizationof synteny with single copy genes (Supplementary TableS10AB). Therefore, we focused on comparison of homol-ogy of single copy pigeonpea genes with the protein codinggenes in twenty chromosomes of soybean (Fig. 7, Supple-mentary Table S10B). Chromosome 1 of pigeonpea showedmatches with multiple soybean chromosomes even on thebasis of single copy genes, but highest number of matcheswere found with chromosomes 8 and 5. Similarly, chromo-some 2 of pigeonpea showed highest number of matcheswith chromosomes 19 and 10 of soybean. Chromosome 3showed highest number of matches with chromosomes 13and 15 of soybean. Chromosome 4 showed highest numberof matches with chromosomes 12 and 13 of soybean.Chromosome 5 showed highest number of matches withchromosomes 13, 12 and 17 of soybean. Chromosome 6
showed highest number of matches with chromosomes 9and 3 of soybean. Chromosome 7 showed highest numberof matches with chromosomes 10 and 20 of soybean.Chromosome 8 of pigeonpea did not show high syntenywith any specific chromosomes of soybean but it showedhighest number of match with chromosomes 13 and 14.Chromosome 9 showed high number of matches withchromosomes 2, 12, 3, 11 and 16 of soybean. Chromosome10 showed highest number of matches with chromosomes18, 17 and 2 of soybean. Chromosome 11 of pigeonpea didnot show high synteny with any specific chromosomes ofsoybean but highest numbers of matches were withchromosomes 14 and 18. A clear conservation of syntenywas observed only with chromosomes 1, 3, 4 and 9 ofpigeonpea with chromosomes 2, 5, 7, 8, 12, 13, 15 and 17of soybean (Fig. 7). Chromosomes 2, 5, 6, 7 and 10 did notshow clear synteny with any soybean chromosomes.Chromosomes 8 and 11 of pigeonpea did not show morethan 10 matches with any of the soybean chromosomes(Fig. 7, Supplementary Table S10B). Low level of syntenybetween pigeonpea and soybean suggests that they mighthave only one genome in common and both are ancientamphipods. Their genomes have highly evolved after speci-ation from a common ancestral species; hence there is limitedconservation of synteny between the two. This is in contrast tohigh conservation of macro synteny between rice and wheat,which separated about 50 mya (Singh et al. 2007).
Fig. 7 Circular map of syntenic relationship between 11 pairs ofpigeonpea chromosomes with 20 pairs of soybean chromosomesbased on 512 single copy genes in the genetically anchored scaffoldsof pigeonpea genome. The outer circles depict soybean chromosomebars showing proportion of gene matches with different chromosomesof pigeonpea and vice versa
J. Plant Biochem. Biotechnol. (Jan–June 2012) 21(1):98–112 109

Development and validation of hyper variable HASSRmarkers for pigeonpea
Pigeonpea genome was analysed to identify 1,89,895 SSRloci comprising of 100,373 mono-nucleotide, 49,325 di-nucleotide, 18,505 tri-nucleotide, 2,217 tetra-nucleotide,512 penta-nucleotides, 815 hexa-nucleotide and 18,148compound repeats (Table 6). Overall there is one SSR locusfor every 2.88 kb of the pigeonpea genome sequence.Mononucleotide repeats are the most abundant class ofSSRs in most genomes and pigeonpea was no exception tothis. However, these do not serve as useful markers andexcluding this category there was one SSR every 6.12 kb ofthe genome sequence. The frequency of SSR loci decreasedsuccessively with increasing size of the repeat unit frommono- to penta-nucleotide repeats, but frequency of hexa-nucleotide repeats was higher than penta-nucleotide repeatsand compound repeats were much more abundant, compa-rable in frequency to the di-nucleotide repeats (Table 6).Among the two types of mono-nucleotide repeats, A/T weremuch more abundant than G/C (Supplementary Table S11).Among the di-nucleotide repeats, AT/AT was the mostfrequent while GT/AC and CG/CG were the least frequent. Inthe tri-nucleotide category AAT/ATT repeats were the most
abundant while ACG/CGT and TAC/GTAwere scarce. In thetetra-nucleotide category AAAT/ATTTwas the most commonmotif whereas AAGG/CCTT, ACGT/ACGT, ACTA/TAGTand AGGA/TCCTwere least frequent. In the penta-and hexanucleotide categories also AT-rich repeats were more preva-lent than the GC-rich repeats.
Search for class I SSRs (n ≥20 bp, Temnykh et al. 2001)and hyper variable HASSRs (n ≥50 bp, Singh et al. 2010)revealed that class I SSRs are most prevalent in the di-nucleotide category, whereas HASSRs are most abundant inthe compound SSR category (Table 6). Based on the SSRlength criteria 46,501 loci were classified as class I SSR and11,711 of these were HASSR. All the SSR loci belonging totetra-, penta-, hexa- and compound category were of class ISSR, while more than half (10,891) of the compound SSRswas of HASSR type. In contrast, mononucleotide repeatsnever reached a size of more than 50 bp, however this couldbe partly due to limitation of the 454 sequencing technologyin dealing with large homopolymers. Due to their higherpolymorphism longer SSR loci are more useful for routinegenetic diversity analysis, fingerprinting, QTL mapping andmolecular breeding applications in the laboratories lackingsophisticated fragment analysis and SNP genotyping plat-forms, but having simple agarose gel electrophoresis facility(Singh et al. 2010).
For wet lab validation we attempted to design PCRprimers for 1,220 HASSR loci, taking 300 loci from thecompound SSRs and all the loci from the remainingcategories. But flanking primers could be designed suc-
Table 6 Frequency of SSRs in the 511 Mb of pigeonpea genomesequence
Type of SSR Total no.of SSRs
Class I SSR(n ≥20 bp)
HASSRa
(n ≥50 bp)
Mononucleotide 1,00,373 987 0
Dinucleotide 49,325 18,000 203
Trinucleotide 18,505 5,822 515
Tetranucleotide 2,217 2,217 17
Pentanucleotide 512 512 15
Hexanucleotide 815 815 70
Compound 18,148 18,148 10,891
Total 189,895 46,501 11,711
a Hypervariable “Arhar” SSR
Table 7 Wet lab validation of the PCR amplification and polymorphism of 437 HASSR markers designed from pigeonpea genome sequenceinformation
SSR category No. of loci Poly-morphic Mono-morphic Unexpectedsize bands
Not amplified % Polymorphism
Trinucleotide 281 124 103 28 26 44.1
Tetranucleotide 10 5 3 2 0 50.0
Pentanucleotide 7 1 3 2 1 14.2
Hexanucleotide 16 8 6 2 0 50.0
Complex 123 8 97 6 12 6.5
Total 437 146 212 40 39 40.8
300
200
100
Fig. 8 Agarose gel showing allelic variation in PCR product size withthree different HASSR markers (HASSR27, HASSR28, HASSR27) ina set of eight pigeonpea varieties. 1 Asha, 2 UPAS 120, 3 HDM 04–1,4 Pusa Dwarf, 5 H2004-1, 6 Bahar, 7 Maruti, 8 TTB7; M=100 bpDNA size marker
110 J. Plant Biochem. Biotechnol. (Jan–June 2012) 21(1):98–112

cessfully for amplification of only 530 of these loci, mainlydue to location of the SSRs near one end of the sequencecontigs. Surprisingly, no primer could be designed for thedi-nucleotide category. Each of the designed primers wasthen compared with the whole genome sequence data toensure that it bound to a unique position in the genome toprevent non-specific annealing. After this 93 loci werediscarded due to multiple matches and primers weresynthesized for 437 HASSR loci containing tri-, tetra-,penta- and hexa-nucleotide repeats as well as compoundSSRs (Table 7). Details of validation results for the 437HASSR markers, including primer sequences, Tm values,GC content and polymorphism level are shown in Supple-mentary Table S12. Total 358 primer pairs amplified asingle PCR product of expected size and these werescreened for polymorphism in a set of eight pigeonpeagenotypes. We observed higher validation success rate of81.92% for these genomic-SSR markers as compared to72% success with genic-SSR markers described earlier(Dutta et al. 2011). HASSR markers showed 40.8%polymorphism (Table 7, Fig. 8), which is three times higherthan 12.9% polymorphism observed with type I genic-SSRmarkers on the same set of eight genotypes (Dutta et al.2011). Among the different categories of HASSR markers,complex SSRs showed the least polymorphism of only6.5% (Table 7). This was discouraging because most of theHASSR loci belonged to this category (Table 6). TheHASSR polymorphism was much higher than the earlierreported 28.40% polymorphism for BAC-end sequencederived genomic SSR markers obtained using high resolu-tion capillary electrophoresis (Bohra et al. 2011). Thisunderlines the high potential utility of the HASSR markersin pigeonpea molecular breeding.
The work presented here is the first draft of the wholegenome sequence of pigeonpea and is the first report of aplant genome sequenced entirely in India. The 47,004protein coding genes predicted in the pigeonpea genome aresimilar to that in soybean, potato and tomato, butsignificantly higher than Arabidopsis and rice. Ninety-ninepoint nine percent of the predicted genes were supported byRNA expression data, suggesting that these are true genes.A small proportion of genome scaffolds were geneticallyanchored with 347 mapped SNP markers which providenucleation points for further finishing of the genome to largepseudomolecules of the eleven chromosomes. A comprehen-sive set of 46,501 Class I SSRs and 11,711 hypervariableHASSR loci were identified, and 437 HASSR markers wereexperimentally validated for amplification and higher rate ofpolymorphism. HASSR markers have high potential utility inthe genetic diversity analysis, fingerprinting and molecularbreeding for efficient utilization of pigeonpea germplasmresources in breeding improved varieties. The networkpartners under Indo-US AKI have already developed a
EMS-mutagenized population and more than 24 recombinantinbred line populations for mapping of important agronomictraits including Fusarium wilt, sterility mosaic disease, flood-ing tolerance, seed size and number, plant type, droughttolerance and Dal (milling) quality of pigeonpea.
Acknowledgments We are grateful to the Indian Council ofAgricultural Research (ICAR) New Delhi for financial supportthrough Indo-US Agricultural Knowledge Initiative (AKI) andNetwork Project on Transgenics in Crops (NPTC) projects. SD isgrateful to the Council of Scientific and Industrial Research,Government of India for financial support (Grant no. 09/083/(0342)/2011/EMR-I)
References
Altschul SF, Gish W, Miller W, Myers EW, Lipman DJ (1990) Basiclocal alignment search tool. J Mol Biol 215:403–410
Bao Z, Eddy SR (2002) Automated de novo identification of repeatssequence families in sequenced genomes. Genome Res 12:1269–1276
Benson G (1999) Tandem repeats finder: a program to analyze DNAsequences. Nucleic Acids Res 27:573–580
Bohra A, Dubey A, Saxena RK, Varma Penmetsa R, Poornima KN,Kumar N, Farmer AD, Srivani G, Upadhyaya HD, Gothalwal R,Ramesh S, Singh D, Saxena KB, Kavi Kishor PB, Singh NK,Town CD, May GD, Cook DR, Varshney RK (2011) Analysis ofBAC-end sequences (BESs) and development of BES-SSRmarkers for genetic mapping and hybrid purity assessment inpigeonpea (Cajanus spp.). BMC Plant Biol 11:56
Dutta S, Kumawat G, Singh BP, Gupta DK, Singh S, Dogra V,Gaikwad K, Sharma TR, Raje RS, Bandhopadhya TK, Datta S,Singh MN, Fakrudin B, Kulwal P, Wanjari KB, Varshney RK,Cook DR, Singh NK (2011) Development of genic-SSR markersby deep transcriptome sequencing in pigeonpea [Cajanus cajan(L.) Millspaugh]. BMC Plant Biol 11:17
Ewing B, Green P (1998) Base-calling of automated sequencer tracesusing Phred II. Error probabilities. Genome Res 8:186–194
FAOSTAT 2008 [http://faostat.fao.org]Fuller DQ (2006) Agricultural origins and frontiers in South Asia: a
working synthesis. J World Prehist 20:1–86Gardner PP, Daub J, Tate J, Moore BL, Osuch IH, Griffiths-Jones S, Finn
RD, Nawrocki EP, Kolbe DL, Eddy SR, Bateman A (2010) Rfam:wikipedia, clans and the “decimal” release. Nucleic Acids Res10:1093–1129
Greilhuber J, Obermayer R (1998) Genome size variation in Cajanuscajan Fabaceae: a reconsideration. Plant Syst Evol 212:135–141
Griffiths-Jones S (2004) The microRNA Registry. Nucleic Acids Res32:D109–D111
Griffiths-Jones S, Moxon S, Marshall M, Khanna A, Eddy SR,Bateman A (2005) Rfam: annotating non-coding RNAs incomplete genomes. Nucleic Acids Res 33:121–124
Griffiths-Jones S, Grocock RJ, van Dongen S, Bateman A, Enright AJ(2006) miRBase: microRNA sequences, targets and genenomenclature. Nucleic Acids Res 34:D140–D144
Griffiths-Jones S, Saini HK, van Dongen S, Enright AJ (2008)miRBase: tools for microRNA genomics. Nucleic Acids Res 36:D154–D158
Huang S, Li R, Zhang Z, Li L, Gu X, Fan W, Lucas WJ, Wang X, XieB, Ni P, Ren Y, Zhu H, Li J, Lin K (2009) The genome of thecucumber, Cucumis sativus L. Nat Genet 41:1275–1281
J. Plant Biochem. Biotechnol. (Jan–June 2012) 21(1):98–112 111

Hulbert SH, Webb CA, Smith SM, Sun Q (2001) Resistance genecomplexes: evolution and utilization. Annu Rev Phytopathol39:285–312
International Rice Genome Sequencing Project (2005) The map-basedsequence of the rice genome. Nature 436:793–800
Kozomara A, Griffiths-Jones S (2011) miRBase: integrating micro-RNA annotation and deep-sequencing data. Nucleic Acids Res39:D152–D157
Krzywinski M, Schein J, Birol I, Connors J, Gascoyne R, Horsman D,Jones SJ, Marra MA (2009) Circos: an information aesthetic forcomparative genomics. Genome Res 19:1639–1645
Lander ES, Linton LM, Birren B, Nusbaum C, Zody MC, Baldwin J,Devon K, Dewar K, Doyle M, FitzHugh W, Funke R, Gage D,Harris K, Heaford A, Howland J et al (2001) Initial sequencingand analysis of the human genome. Nature 409:860–921
Lerat E (2010) Identifying repeats and transposable elements insequenced genomes: how to find your way through the denseforest of programs. Heredity 104:520–533
Lowe TM, Eddy SR (1997) tRNAscan-SE: a program for improveddetection of transfer RNA genes in genomic sequence. NucleicAcids Res 25:955–964
Margulies M, Egholm M, Altman WE, Attiya S, Bader JS, BembenLA, Berka J, Braverman MS, Chen YJ, Chen Z, Dewell SB, DuL, Fierro JM, Gomes XV, Godwin BC et al (2005) Genomesequencing in microfabricated high-density picolitre reactors.Nature 437:376–380
Ming R, Hou S, Feng Y, Yu Q, Dionne-Laporte A, Saw JH, Senin P,Wang W, Ly BV, Lewis KLT, Salzberg SL, Feng L, Jones MR,Skelton RL, Murray JE, Chen C, Qian W et al (2008) The draftgenome of the transgenic tropical fruit tree papaya (Caricapapaya L.). Nature 452:991–996
Murray MG, Thompson WF (1980) Rapid isolation of high molecularweight plant DNA. Nucleic Acid Res 8:4321–4325
Odeny DA, Jayashree B, Gebhardt C, Crouch J (2009) New micro-satellite markers for pigeonpea (Cajanus cajan (L.) millsp.).BMC Res Notes 2:35
Paterson AH, Bowers JE, Remy B, Inna D, Jane G, Gundlach H,Georg H, Uffe H, Therese M, Alexander P, Jeremy S, Manuel S,Haibao T, Xiyin W et al (2009) The Sorghum bicolor genomeand the diversification of grasses. Nature 457:551–556
Ratnaparkhe MB, Gupta VS, Ven Murthy MR, Ranjekar PK (1995)Genetic finger printing of pigeonpea (Cajanus cajan (L.) Millsp.)and its wild relatives using RAPD markers. Theor Appl Genet91:893–898
Saxena KB (2008) Genetic improvement of pigeonpea-a review. TropPlant Biol 1:159–178
Schattner P, Brooks AN, Lowe TM (2005) The tRNAscan-SE,snoscan and snoGPS web servers for the detection of tRNAsand snoRNAs. Nucleic Acids Res 33:W686–689
Schmutz J, Cannon SB, Schlueter J, Ma J, Mitros T, William N, HytenDL, Qijian S, Thelen JJ, Jianlin C, Dong X et al (2010) Genomesequence of the palaeopolyploid Soybean. Nature 463:178–183
Schnable PS, Doreen W, Fulton RS, Stein JC, Fusheng W, Shiran P,Chengzhi L, Jianwei Z, Lucinda F, Graves TA, Patrick M, ReilyAD, Laura C et al (2009) The B73 maize genome: complexity,diversity, and dynamics. Science 326:1112–1115
Singh NK, Raghuvanshi S, Srivastava SK, Gaur A, Pal AK, Dalal V,Singh A, Ghazi IA et al (2004) Sequence analysis of the long armof rice chromosome 11 for rice–wheat synteny. Funct IntegrGenomics 4:102–117
Singh NK, Vivek D, Kamlesh B, Singh Binay K, Chitra G, Archana S,Ghazi Irfan A, Mahavir Y, Awadhesh P, Rekha D, Singh PK,Harvinder S, Koundal Kirpa R, Kishor G, Trilochan M, SharmaTilak R (2007) Single-copy genes define a conserved orderbetween rice and wheat for understanding differences caused byduplication, deletion, and transposition of genes. Funct IntegrGenomics 7:17–35
Singh H, Deshmukh RK, Singh A, Singh AK, Gaikwad K, SharmaTR, Mohapatra T, Singh NK (2010) Highly variable SSRmarkers suitable for rice genotyping using agarose gels. MolBreed 25:359–364
Temnykh S, DeClerck G, Lukashova A, Lipovich L, Cartinhour S,McCouch S (2001) Computational and experimental analysis ofmicrosatellites in rice (Oryza sativa L.): frequency, lengthvariation, transposon associations, and genetic marker potential.Genome Res 11:1441–1452
The International Brachypodium Initiative (2010) Genome sequencingand analysis of the model grass Brachypodium distachyon.Nature 463:763–768
The Potato Genome Sequencing Consortium (2011) Genome sequenceand analysis of the tuber crop potato. Nature 475:189–195
The Rice Chromosomes 11 and 12 sequencing consortia (2005) Thesequence of rice chromosome 11 and 12, rich in disease resistancegenes and recent gene duplication. BMC Biology 3: 1–18
Varshney RK, Close TJ, Singh NK, Hoisington DA, Cook DR (2009)Orphan legume crops enter the genomics era. Curr Opin PlantBiol 12:202–210
Varshney RK, Penmetsa RV, Dutta S, Kulwal PL, Saxena RK, Datta S,Sharma TR, Rosen B, Carrasquilla-Garcia N, Farmer AD, DubeyA, Saxena KB, Gao J, Fakrudin B, Singh MN, Singh BP, WanjariKB, Yuan M, Srivastava RK, Kilian A, Upadhyaya HD,Mallikarjuna N, Town CD, Bruening GE, He G, May GD,McCombie R, Jackson SA, Singh NK, Cook DR (2010a)Pigeonpea genomics initiative (PGI): an international effort toimprove crop productivity of pigeonpea (Cajanus cajan L.). MolBreed 26:393–408
Varshney RK, Thudi M, May GD, Jackson SA (2010b) Legumegenomics and breeding. Plant Breed Rev 33:257–304
Velasco R, Andrey Z, Michela T, Cartwright DA, Alessandro C,Dmitry P, Massimo P, FitzGerald LM, Silvia V, Julia R, GiuliaM, Diana I, Giuseppina C, Wardell B et al (2007) A high qualitydraft consensus sequence of the genome of a heterozygousgrapevine variety. PLoS One 12:31326
Velasco R, Zharkikh A, Jason A, Amit D, Alessandro C, Ananth K,Paolo F, Bhatnagar SK, Troggio M, Pruss D, Salvi S, Pindo M,Baldi P, Castellett S et al (2010) The genome of the domesticatedapple (Malus × domestica Borkh.). Nat Genet 42:833–839
Waterston RH et al (2002) Initial sequencing and comparative analysisof the mouse genome. Nature 420(5):20–62
Wojciechowski MF (2003) Reconstructing the phylogeny of legumes(Leguminosae): an early 21st century perspective. In: KlitgaardBB, Bruneau A (eds) Advances in legume Systematics, Part 10,Higer level Systematics. Royal Botanic Gardens, Kew, pp 5–35
Wootton JC, Federhen S (1993) Statistics of local complexity in aminoacid equences and sequence databases. Comput Chem 17:149–163
Yang S, Pang W, Harper J, Carling J, Wenzl P, Huttner E, Zong X,Kilian A (2006) Low level of genetic diversity in cultivatedpigeonpea compared to its wild relatives is revealed by diversityarrays technology (DArT). Theor Appl Genet 113:585–595
112 J. Plant Biochem. Biotechnol. (Jan–June 2012) 21(1):98–112


![Evaluation of pigeonpea [Cajanus cajan (L.) millsp ... · EVALUATION OF PIGEONPEA [Cajanus cajan (L.) Millsp.] ... Improved pigeonpea [Cajanus cajan (L.) Millsp.] ... from Otobi,](https://img.dokumen.tips/doc/110x75/5ac7c4847f8b9a5d718c0d07/evaluation-of-pigeonpea-cajanus-cajan-l-millsp-of-pigeonpea-cajanus-cajan.jpg)