Embed Size (px)
Citation preview

THE FINANCIALMARKETDEVELOPMENTINDEX
R E G U L A T O R
F R A M E W O R K
Y
TRANSITION REPORT 2021-22 SYSTEM UPGRADE: DELIVERING THE DIGITAL DIVIDEND
110

THE FINANCIALMARKETDEVELOPMENTINDEX
R E G U L A T O R
F R A M E W O R K
Y
This chapter introduces a new index measuring the development of financial markets in the EBRD regions and comparator economies. The first part of the index covers conditions supporting the sustainable development of financial markets, looking at the macroeconomic environment, legal and regulatory frameworks, market infrastructure and the investor base. The second component tracks market outcomes in terms of the depth, liquidity and diversification of markets across various asset classes. The two components are closely related, although smaller economies tend to have markets that are less deep than the supporting conditions alone might suggest. Despite notable improvements since 2014 in terms of the conditions for financial market development in the EBRD regions (particularly regarding macroeconomic conditions and market infrastructure), substantial challenges remain. This chapter also identifies key constraints for each economy in terms of the future development of financial markets.
IntroductionThis chapter introduces a new index capturing the development of financial markets in the EBRD regions and several comparator economies (both advanced economies and emerging markets). It focuses on traded financial products, covering money, capital and derivatives markets. The advanced economy comparators are Canada, Cyprus, France, Germany, Japan, Sweden, the United Kingdom and the United States of America. The emerging market comparators (Colombia, Peru, South Africa and Thailand) span three different continents and are similar to their peers in the EBRD regions in terms of their size and level of economic development.
The Financial Market Development Index (FMDI) comprises two equally weighted subindices covering (i) the necessary conditions for sustainable market development and (ii) asset class-specific indicators reflecting the extent of such development. The first subindex covers macroeconomic conditions, legal and regulatory frameworks, market infrastructure and the depth of the local investor base (which is, to some extent, determined by the pension system and other structural policies).
The second part of the index captures market outcomes in terms of the depth, liquidity and diversification of markets across several asset classes: fixed income, equities, money markets and derivatives.1 The two components of the index are closely related, although markets in smaller economies tend to be less deep than the supporting conditions alone might suggest.
Despite notable improvements since 2014 in terms of the conditions for financial market development in the EBRD regions (particularly in terms of the macroeconomic environment and market infrastructure), substantial challenges remained at the end of 2020.
The lack of a well-developed local investor base is a key constraint in most economies in the EBRD regions that do not have well-established defined contribution pension systems. In addition, life insurance companies (where they exist) tend to have low investment capacity.
While market infrastructure tends to be a key constraint in economies with less developed financial markets (such as Albania, Azerbaijan, Belarus and Kosovo), more developed markets (such as Poland and Slovenia) also face challenges in the area of clearing and nominee accounts. Meanwhile, legal and regulatory frameworks are a key constraint in Egypt, Lebanon, Turkmenistan and Ukraine.
Macroeconomic conditions are less of a constraint in the EBRD regions. At the same time, however, there is still significant dollarisation of loans and deposits in a number of economies. And in smaller, less developed markets, interest
CHAPTER 5 THE FINANCIAL MARKET DEVELOPMENT INDEX
111
1 See Annex 5.1 in the online version of this report for a full description of the methodology underpinning the construction of the index.

rate differentials between comparable debt instruments denominated in local and foreign currencies can be large and persistent, exceeding average long-term currency depreciation by 5 percentage points or more.
Overall, south-eastern Europe (SEE) and Russia have seen the greatest improvements in terms of the conditions supporting financial market development (particularly in the area of legal frameworks). Overall progress in terms of reducing the distance to the frontier has been slowest in Turkey and the southern and eastern Mediterranean (SEMED), as improvements in market infrastructure have been offset by the weakness of macroeconomic frameworks.
This chapter starts by looking at the two components of the index, discussing macroeconomic conditions, legal and regulatory frameworks, market infrastructure and investor bases, as well as market outcomes across asset classes. That discussion touches on the evolution of the conditions governing financial market development over time, as well as looking at the interest rate differentials between local currency and foreign currency instruments that can be observed in various economies. The chapter then moves on to look at the conditions that appear to matter most for financial market development in individual economies, before ending with a number of concluding remarks.
The components of the Financial Market Development Index
Macroeconomic conditionsHistorically, many emerging markets and developing economies have experienced significant dollarisation of loans, deposits and capital market transactions.2 Such high levels of dollarisation often go hand in hand with high interest rates in local currency relative to equivalent rates in foreign currency (typically US dollars or euros), which compensate investors for the high perceived likelihood of fiscal, external and banking crises. What is more, such crises have indeed been a common occurrence.3
In a vicious cycle, high levels of dollarisation make adjusting to external shocks more difficult and increase the likelihood of a crisis. An economy’s currency typically depreciates in response to an adverse shock (such as a drop in commodity prices in the case of a major commodity exporter). This makes a country’s exports more competitive and makes imports more expensive, boosting domestic demand. However, if the liabilities of households, firms or the government are denominated in foreign currency, the cost of servicing them rises as the local currency depreciates, hindering that macroeconomic adjustment.
In order to break this cycle, stable economic conditions are needed over a prolonged period of time with a view to building investors’ confidence in the local currency and local
capital markets, coupled with a strong political commitment to pursuing a credible capital market development agenda. When these conditions are met, the gap between the interest rates on long-term government debt denominated in local currency and the US dollar tends to converge to zero or the average long-term rate of currency depreciation. However, in smaller, less developed markets, interest rate differentials can be large and persistent, exceeding average long-term currency depreciation (measured here over a 20-year period) by 5 percentage points or more, as is the case in Egypt, the Caucasus and several economies in Central Asia (see Chart 5.1).
Reflecting these trends, the pillar capturing macroeconomic conditions that are supportive of local financial markets comprises four equally weighted components: price stability underpinned by a credible monetary policy, low perceived vulnerabilities in the external sector, sound government finances and a well-functioning banking sector. When these conditions are met, local capital markets can be effectively connected to global markets and the local banking system, providing a counter cyclical source of funding during crises. In addition, the government is able to provide emergency support to some key market players in the event of economic turbulence, and its securities serve as a robust benchmark for the development of other market segments. In contrast, in an environment of high and volatile inflation and high perceived risks of a fiscal, banking or balance-of-payments crisis, markets are likely to remain less
CHART 5.1. In a number of economies, interest rate differentials between instruments denominated in local and foreign currencies exceed the average long-term rate of currency depreciation
Source: Bloomberg, IMF, national authorities and authors’ calculations. Note: Based on sovereign bonds with an outstanding maturity of between four and seven years or the closest available maturity. Negative values on the horizontal axis denote depreciation against the US dollar. In the case of Romania, interest rate differentials and currency depreciation are measured relative to the euro, rather than the US dollar.
45-degree line
Average currency movement against US$, 2000-20 (per cent per year)
Interest rate differential between local currencyand US$ (percentage points)ROU
RUS
TUR
SRB
UKR
HRV
EGY
KAZ
HUN
MAR
UZB
POL TUN
GEOARM
JOR
MNG KGZ
AZE
-18 -16 -14 -12 -10 -8 -6 -4 -2 0 2-2
0
2
4
6
8
10
12
14
16
18
112
TRANSITION REPORT 2021-22 SYSTEM UPGRADE: DELIVERING THE DIGITAL DIVIDEND
2 See EBRD (2015) for a discussion of this issue.3 See Laeven and Valencia (2013) for data and an overview, as well as EBRD (2010).

CHART 5.2. Many economies in the EBRD regions have macroeconomic conditions that are comparable to those of advanced economies
Source: National authorities, IMF, CEIC, Bloomberg and authors’ calculations. Note: GDP per capita is expressed in US dollars at market exchange rates. The distance to the frontier is indicated on a scale of 0 to 100, where 100 represents the frontier.
GDP per capita in US$ (log scale)
Mac
roec
onom
ic c
ondi
tions
in 2
020
(dis
tanc
e to
fron
tier)
ALB
ARM AZE
BGR
BIH
BLR
CZE
EGY
EST
GEOGRC GRC
HRV
HUN
JOR
KAZKGZ
LBN
LTULVA
MAR
MDA
MKD
MNE
MNG
POL
PSE
ROU
RUS
SRB SVK SVN
TJK
TUN
TUR
UKR
UZB
KOS
CAN
CYP
FRA DEU
JPN
SWE
GBR
USA
ZAF
THA COL
PER
R۰٫۳۲۷۸ = ² R² = 0.3278
500 800 1,600 3,200 6,400 12,800 51,20020
30
40
50
60
70
80
90
100
THE SECOND PART OF THE INDEX TRACKS MARKET DEPTH AND DIVERSIFICATION ACROSS FOUR ASSET CLASSES: EQUITIES, FIXED INCOME, MONEY MARKETS AND DERIVATIVES
THE FIRST PART OF THE INDEX CAPTURES CONDITIONS SUPPORTING THE DEVELOPMENT OF CAPITAL MARKETS: THE MACROECONOMIC ENVIRONMENT, LEGISLATIVE FRAMEWORKS, MARKET INFRASTRUCTURE AND THE INVESTOR BASE
liquid, with investors demanding a substantial premium to compensate them for perceived risks.
The price stability score is higher where average annual (year-on-year) inflation is lower and so is the differential between the local currency policy rate and the yield on long-term US dollar denominated bonds issued by the government.
The score capturing conditions in the external sector gives credit to economies with significant international reserves relative to their short-term external financing needs (measured as the sum of the current account deficit and external debt with an outstanding maturity of one year or less). Meanwhile, high reliance on commodity export revenues as a percentage of GDP lowers the score. At the same time, however, the objective of curbing external vulnerabilities needs to be balanced against the objective of effectively connecting local and global capital markets and building a diversified investor base. Consequently, additional credit is given to economies with fewer restrictions on cross-border capital flows (as measured by an index of capital account openness).4
The score capturing government finances looks at levels of government debt and interest payments (as a percentage of GDP), with government debt having half the weight to account for the differing debt-servicing abilities of high- and lower-income economies.
The score measuring conditions in the banking sector penalises economies with high levels of non performing
loans (NPLs) relative to total loans and high loan-to-deposit ratios, while recognising that a well-functioning banking system relies on both wholesale and retail sources of funding (so banking systems with loan to deposit ratios of up to 90 per cent are awarded the maximum score, while sectors where loans are 250 per cent or more of deposits are awarded the minimum score).
The overall score for the pillar capturing macroeconomic conditions is expressed in terms of the distance to the frontier (which represents the highest-scoring economy for the period in question: Estonia). A similar approach is followed for the three other pillars of the first subindex. Sweden scores highest as regards legal and regulatory frameworks, Japan is the highest-scoring economy when it comes to the investor base, and several economies (including the United Kingdom and the United States of America) are regarded as being at the frontier in terms of market infrastructure. Thus, the overall subindex of conditions for sustainable financial market development, which averages scores across the four pillars, represents the distance to a hypothetical frontier that aggregates the strongest conditions across several economies, with no economy currently standing at that frontier (which is represented by a score of 100).
As one might expect, economies with higher levels of income per capita (measured using GDP per capita in US dollars) tend to have better macroeconomic conditions (see Chart 5.2). This relationship is far from perfect, however. Turkey, for instance, scores poorly relative to its income per capita, reflecting its persistently high inflation and external financing requirements. In Bulgaria, Morocco and Serbia, on the other hand, macroeconomic policy frameworks appear to be stronger than one would expect on the basis of income per capita alone.
113
CHAPTER 5 THE FINANCIAL MARKET DEVELOPMENT INDEX
4 See Chinn and Ito (2006).

Over time, macroeconomic conditions have strengthened somewhat in most economies in the EBRD regions, thanks to more robust fiscal and monetary policy frameworks (which can be seen in the fact that the dots tend to lie above the 45-degree line in Chart 5.3). Notable exceptions, each of which reflects specific circumstances, include Lebanon (which has defaulted on sovereign debt), Georgia and Tunisia (which are tourism-dependent economies where the Covid-19 crisis has exacerbated external and fiscal imbalances) and Turkey (which has persistently high inflation and a large current account deficit).
On average, the economies of the EBRD regions now tend to score relatively highly on macroeconomic conditions that support the development of capital markets. Indeed, when it comes to macroeconomic frameworks, EU member states in the EBRD regions score just as highly as – if not higher than – advanced economy comparators, as do some economies in the Western Balkans.
Legal and regulatory frameworksEffective legal and regulatory frameworks are crucial in order to reduce the risks and costs associated with capital market transactions and incentivise increased market activity. In particular, robust property rights and the quality of their enforcement have been found to determine the degree of development in capital markets. They tend to be stronger in countries where legal systems are based on common law rather than civil law.5 Furthermore, countries where minority shareholders enjoy stronger protection against expropriation by insiders have been shown to have more developed securities markets.6
Consequently, the pillar capturing legal and regulatory frameworks covers international property rights and the rule of law, but also measures the development of legal and regulatory frameworks that are relevant for money and derivatives markets. It encompasses four equally weighted components: accounting and reporting standards; the legal environment underpinning financial transactions; membership of global standard-setting bodies; and the rule of law and the soundness of the regulatory environment. The accounting and reporting standards component is based on scores measuring the strength of auditing and reporting standards as compiled by the World Economic Forum and the use of International Financial Reporting Standards (IFRS) or Generally Accepted Accounting Principles (US GAAP). These are prerequisites for raising financing through capital markets, and their absence in some countries in the EBRD regions represents a significant obstacle to the expansion of activity, particularly in the corporate issuance segment.
Derivatives are essential components of financial markets, as they allow market participants to manage risks through hedging and facilitate access to local currency for international lenders and investors. This is particularly important in circumstances where onshore local currency
CHART 5.3. Since 2014, macroeconomic conditions have improved in most economies in the EBRD regions
Source: National authorities, IMF, CEIC, Bloomberg and authors’ calculations. Note: The distance to the frontier is indicated on a scale of 0 to 100, where 100 represents the frontier.
45-degree line
Macroeconomic conditions in 2014 (distance to frontier)
Mac
roec
onom
ic c
ondi
tions
in 2
020
(dis
tanc
e to
fron
tier)
ALB
ARM AZE
BGR
BIH
BLR
CZE
EGY
EST
GEO GRC
HRV
HUN
JOR
KAZ
KGZ
LBN
LTU LVA
MAR
MDA
MKD
MNE
MNG
POL
PSE
ROU
RUS
SRB
SVK
SVN
TJK
TKM
TUN
TUR
UKR
UZB
KOS CAN
CYP
FRA DEU
JPN
SWE
GBR
USA
ZAF
THA COL
PER
0 10 20 30 40 50 60 70 80 90 1000
10
20
30
40
50
60
70
80
90
100
securities markets are underdeveloped. The development of derivatives trading – especially over-the-counter (OTC) trading – can be greatly facilitated by the existence of master agreements covering areas such as netting, close-out netting and the adequate provision and enforcement of collateral.7
Repurchase (repo) agreements are a key component of a well-functioning money market and the monetary policy transmission mechanism, requiring a robust framework to ensure the enforceability of and access to collateral.8 Reflecting this, the score capturing the legal environment for financial transactions reflects the use of master agreements provided by the International Swaps and Derivatives Association (ISDA) and the use of general master repurchase agreements (GMRAs) developed by the International Capital Market Association (ICMA).
The legal and regulatory framework pillar also captures countries’ membership of international standard-setting bodies, which reflects their readiness to adhere to global regulatory standards governing securities and derivatives markets, as well as the prudential regulation and supervision of their financial sectors. That third component of the pillar rewards countries for membership of the International Organization of Securities Commissions (IOSCO), which is the global standard setter for the securities sector and develops, implements and promotes adherence to internationally recognised standards for securities regulation. Given the bank-centric nature of financial systems in the EBRD regions and banks’ key role in financial markets as traders, issuers, intermediaries and investors, that component also reflects countries’ membership of
114
TRANSITION REPORT 2021-22 SYSTEM UPGRADE: DELIVERING THE DIGITAL DIVIDEND
5 See La Porta et al. (1997).+ See Djankov et al. (2008).
7 See ISDA (2010).8 See ICMA (2019).

CHART 5.4. Legal and regulatory frameworks have been strengthened in many economies in the EBRD regions since 2014
Source: Bank for International Settlements (BIS), ISDA, IOSCO, Property Rights Alliance, WEF, World Justice Project and authors' calculations. Note: The distance to the frontier is indicated on a scale of 0 to 100, where 100 represents the frontier.
45-degree line
Legal environment in 2014 (distance to frontier)
Lega
l env
ironm
ent i
n 20
20 (d
ista
nce
to fr
ontie
r)
ALB
ARM
AZE
BGR
BIH
BLR
CZE
EGY
EST
GEO
GRC
HRV
HUN
JOR
KAZ
KGZ
LBN
LTU
LVA
MAR
MDA MKD
MNE
MNG
POL
PSE
ROU
RUS
SRB
SVK SVN
TJK
TUN
TUR
UKR
UZB KOS
CAN CYP
FRA
DEU JPNSWE
GBR USA
ZAF
THA COL
PER
0 20 40 60 80 1000
10
20
30
40
50
60
70
80
90
100
the Basel Committee on Banking Supervision (BCBS), which is the global standard-setting body for the prudential regulation of banks.
While the first three components of the legal and regulatory framework pillar focus on the laws adopted in each country, the fourth component aims to capture the strength of enforcement. It combines (i) the Property Rights Alliance’s International Property Rights Index and (ii) the World Justice Project’s Rule of Law Index (which is the leading global index for original independent data on the rule of law, covering 128 countries and jurisdictions).
Many economies have strengthened the legal frameworks governing the development of financial markets since 2014, including Romania, Russia and Serbia (see Chart 5.4). Such improvements have stemmed mainly from the issuance of ISDA legal opinions and improved adherence to global regulatory standards for securities markets and the banking sector. Romania is the only country in the EBRD regions where GMRAs have been introduced in the past five years, while new ISDA legal opinions have also been issued in Armenia and Georgia. Adherence to global regulatory standards for securities markets has also been strengthened in Armenia and Kazakhstan (which have both become IOSCO members), while the use of IFRS accounting standards has been enhanced in Georgia and Montenegro.
As in the case of macroeconomic conditions, the overall score for the legal and regulatory framework pillar is strongly – but not perfectly – correlated with economic development. In Belarus, for instance, the legal frameworks governing financial markets are far less developed than one would expect on the basis of the country’s per capita income.
Market infrastructureThe development of local capital markets requires reliable clearing and settlement infrastructure, as well as services provided by central securities depositories (CSDs) and central clearing counterparties (CCPs) that ensure the safekeeping and efficient trading of securities and derivatives, reduce settlement and counterparty risks, and support financial stability. These key dimensions of financial market development are captured by the market infrastructure pillar.
A clearing component looks at whether an independent CCP has been established and, if so, whether that CCP complies with the internationally recognised standards contained in the European Market Infrastructure Regulation (EMIR) or equivalent regulations for non-EU countries. A lower score is assigned if a stock exchange or a CSD provides clearing services.
The settlement component is assigned the maximum score where the national CSD complies with the standards stipulated by the Central Securities Depositories Regulation (CSDR). This reflects the availability of a delivery-versus-payment (DVP) settlement method with a T+2/T+3 settlement cycle, which enables foreign institutional investors to effectively access local markets. The minimum score is assigned if pre-funding is required. A T+2 (T+3) settlement cycle implies settlement (and transfer of, say, shareholder rights in the case of equity purchases) two (three) working days after the transaction takes place.
The market infrastructure pillar also assesses market access and the degree of investor protection through a component reflecting the establishment of omnibus accounts with legally defined nominee status, which have historically played an important role in allowing foreign investors to access capital markets in emerging market economies. Nominee accounts are those where the investor holds securities in the name of a different entity (for example, a market intermediary or the national CSD), which acts as the operator of the nominee account and whose name appears on the register of the issuer of securities. The use of nominee accounts is an essential component of financial markets, as it facilitates securities trading by reducing administration costs and transaction times. In order to ensure adequate protection of investors, such accounts need to have a legally defined nominee status which can effectively provide for securities ownership (including voting rights in the case of equities) and segregate client assets from those of the intermediary. Such segregation limits the risk of investors not being able to recover their assets if the intermediary encounters financial difficulties.
The assessment of market infrastructure also looks at whether there are direct links between national CSDs and international central securities depositories (ICSDs) such as Clearstream and Euroclear, enabling foreign investors to access local capital markets without the need to open an account with the local CSD. Indirect links via an intermediary
115
CHAPTER 5 THE FINANCIAL MARKET DEVELOPMENT INDEX

acting as a subcustodian (as in the case of Greece and Poland, for instance) are assigned a lower score.
Since 2014, notable improvements have been observed in a number of economies in the EBRD regions in the area of market infrastructure, in line with the general improvements in digital infrastructure that were documented in Chapter 1. Indeed, several economies where market infrastructure was previously weak (such as Egypt, Kazakhstan and Ukraine) have seen particularly large improvements (see Chart 5.5). Local market access for international investors has improved in a number of countries (such as Armenia, Egypt, Georgia, Kazakhstan, Romania and Ukraine) through the establishment of links between domestic CSDs and ICSDs. Clearing infrastructure has been upgraded in a number of economies (including Kazakhstan, Russia and Turkey). Settlement efficiency for securities transactions has improved in Egypt, North Macedonia, Russia and Uzbekistan thanks to the introduction of DVP and/or the implementation of a T+2 settlement cycle, and legally robust nominee status or omnibus accounts have been introduced in Bulgaria, Mongolia, Tajikistan, Tunisia and Ukraine.
Local investor baseThe final pillar of the conditions part of the index tracks the depth and diversification of the local investor base, which largely reflects the development of defined contribution pension systems (involving individual pension savings accounts), as well as other structural policies supportive of the development of life insurance and other institutional investors (such as mutual funds). The pillar assessing the local investor base aggregates indicators capturing total assets in retirement savings plans and total gross life insurance premia (both as a percentage of GDP), as well as the number of mutual funds available in the local currency.
Institutional investors such as pension funds and life insurance companies are incentivised to make long-term
CHART 5.5. Market infrastructure has improved in many economies since 2014
Source: National CSDs, clearing entities and securities exchanges, Clearstream, Euroclear and authors’ calculations. Note: The distance to the frontier is indicated on a scale of 0 to 100, where 100 represents the frontier.
45-degree line
Market infrastructure in 2014 (distance to frontier)
Mar
ket i
nfra
stru
ctur
e in
202
0 (d
ista
nce
to fr
ontie
r)
ALB
ARM
AZE
BGR BIH
BLR
CZE
EGY
EST
GEO
GRC HRV
HUN
JOR
KAZ
KGZ
LBN
LTULVA LVA
MAR
MDA
MKD
MNE MNG
POL
PSE
ROU
RUS
SRB
SVK SVN
TJK TJK
TKM
TUN
TUR
UKR
UZB
KOS
CAN
CYP
FRA
DEUJPN
SWE
GBR
USA
ZAF
THA
COL
PER
0 20 40 60 80 1000
10
20
30
40
50
60
70
80
90
100
CHART 5.6. The depth of the investor base has changed little over time
Source: Bloomberg, European Central Bank, IMF, OECD, S&P Global Market Intelligence, Swiss Re, WEF and authors' calculations.Note: The distance to the frontier is indicated on a scale of 0 to 100, where 100 represents the frontier.
45-degree line
Depth of investor base in 2014 (distance to frontier)
Dept
h of
inve
stor
bas
e in
202
0 (d
ista
nce
to fr
ontie
r)
ALB
ARM
AZE
BGR
BIH BLR
CZEEGY EGY
EST
GEO
GRC
HRV
HUN
JOR
KAZ
KGZ
LBN
LTU
LVA
MAR
MDA MKD
MNE
MNG
POL
PSE
ROU
RUS
SRB
SVK
SVN
TJK TKM
TUN
TUR
UKR
UZB
KOS
CAN
CYP
FRA
DEU
JPN SWE GBR USA
ZAF
THA COL
PER
0 10 20 30 40 50 60 70 80 90 1000
10
20
30
40
50
60
70
80
90
100
investments, as these match their long-dated liabilities (such as future pension payments). Indeed, the size of the institutional investor base and the level of contractual savings (such as individual pension accounts) explain, along with macroeconomic stability, a large percentage of cross-country differences in the depth of financial markets.9
As financial systems in the EBRD regions tend to be dominated by banks – similar to the situation in many advanced European economies – the investor base pillar also takes account of the banking sector’s aggregate holdings of debt securities. This reflects bond trading by banks’ treasury departments and could also serve as a proxy for activity in repo markets.10
In contrast with the recent improvements in macroeconomic conditions, market infrastructure and legal frameworks, there has generally been relatively little change in the depth of local investor bases since 2014 (see Chart 5.6). At the same time, significant improvements have been observed in Croatia, Kazakhstan and Kosovo (where private pension funds’ assets have increased substantially), as well as in Russia (which has seen improvements in pensions, life insurance and banks’ bond holdings).
This is also an area where there are more differences between advanced economy comparators, with more developed local investor bases being found in Japan and the United Kingdom and a smaller investor base being observed in Germany, reflecting differences in pension systems and saving behaviour. The local institutional investor bases of emerging market comparator economies have witnessed improvements during the reference period and, like advanced economies, also exhibit a high degree of heterogeneity. For example, South Africa’s large private pension system puts it higher than most advanced economies in our sample, whereas the local institutional investor bases of smaller economies in South America are broadly comparable to those of countries in the EBRD regions.
116
TRANSITION REPORT 2021-22 SYSTEM UPGRADE: DELIVERING THE DIGITAL DIVIDEND
9 See IFC (2017).10 In general, higher scores are awarded in economies where banks hold more traded
securities (expressed as a percentage of total bank assets). At the same time, however, large holdings of sovereign bonds may crowd out credit to the private sector. Moreover, if banks tend to buy sovereign bonds and repo them with the central bank, locking in “risk-free” returns, those securities may be rarely traded, with the activity contributing little to market building. To reflect that fact, a threshold of 30 per cent is applied when evaluating the ratio of banking sector debt securities to total assets.

CHART 5.7. Economies with better conditions for capital market development tend to enjoy greater market depth
Source: BIS, Bloomberg, Cbonds, EBRD, ICMA, IMF, MSCI, World Federation of Exchanges and authors' calculations.Note: The trend line represents a quadratic fit.
Capital market conditions in 2020
Dept
h of
cap
ital m
arke
ts in
202
0
ALB ARM
AZE AZE
BGR BIH BLR
CZE
EGY EST
GEO
GRC
HRV
HUN
JOR
KAZ
KGZ
LBN
LTU
LVA MAR
MDA
MKD MNE MNG
POL
PSE
ROU
RUS RUS
SRB
SVK
SVN
TJK TKM
TUN
TUR
UKR UZB
KOS
CAN
CYP
FRA DEU
JPN SWE
GBR USA
ZAF
THA
COL
PER
0 10 20 30 40 50 60 70 80 90 1000
10
20
30
40
50
60
70
80
90
100
Market depth and diversificationThe second subindex of the FMDI focuses on market outcomes, as opposed to conditions that support market development. It reflects the depth, diversification and liquidity of markets across four asset classes: equities, fixed income, money markets and derivatives (each with a weight of 25 per cent).
Each component aggregates between 4 and 12 indicators, reflecting market capitalisation, turnover, benchmark index classification (MSCI and FTSE for equities; Barclays Global for fixed income) and the number of different issuers for each asset type (corporations, financial institutions, municipal authorities and governments). The index also takes account of the availability of specific instruments, such as exchange-traded funds (ETFs), bonds issued by international financial institutions (IFIs) in local currency and green bonds, as well as the availability of a robust sovereign yield curve serving as a benchmark for municipal and corporate securities across different maturities. The money markets component also encompasses indicators that aim to measure liquidity and diversification by considering the availability of reliable short-term local benchmark rates and their use in financial instruments by market participants, based on EBRD treasury traders’ expert opinions.
As expected, the depth and diversification of financial markets are closely linked to local conditions (see Chart 5.7). For example, the largest and most liquid markets in the EBRD regions can be found in the countries with the strongest financial market conditions (such as the Czech Republic, Hungary, Poland and Russia).
However, the size of the economy appears to affect this relationship. The greater the issuance of sovereign debt and pools of other instruments in nominal terms, the greater the market liquidity, making markets more attractive to both local and non-resident investors. As a result, smaller economies – including economies in central Europe and the Baltic states (CEB) – tend to have lower market depth and liquidity for a given level of conditions. In this context, regional integration of smaller markets, supported by appropriate policy measures, can help to make those markets more attractive to investors (see Box 5.1 for a discussion of the experience of the Baltic states). Conversely, several large economies with weaker conditions for the development of capital markets (including Egypt, Kazakhstan and Ukraine) have larger, more liquid markets than one would expect on the basis of the supporting conditions alone.
While conditions for the development of financial markets – especially macroeconomic stability and legal and regulatory frameworks – have been strengthened since 2014, few economies in the EBRD regions have witnessed improvements in the depth and liquidity of their financial markets during that period. The greatest improvements have been observed in countries where fixed income markets have expanded significantly (such as the Czech Republic, Egypt, Hungary, Kazakhstan and Russia). In many cases, these developments reflect large-scale issuance of government debt securities to finance policies adopted in response to the Covid-19 crisis. In addition, with the exception of Russia, those improved scores also reflect the issuance of the first green bonds in those markets. In Egypt (and, to a lesser extent, the Czech Republic and Russia) significant improvements have also been seen in local money markets.
EACH SUBCOMPONENT OF THE INDEX OF FINANCIAL MARKET DEVELOPMENT AGGREGATES BETWEEN
4 AND 12INDICATORS
117
CHAPTER 5 THE FINANCIAL MARKET DEVELOPMENT INDEX

Conditions for the development of financial markets: the remaining challengesThe overall subindex of conditions for financial market development is a weighted average of its four components. It ranges from 0 to 100, with higher values corresponding to conditions that are more supportive of financial market development.
Although the relationship between those four components is strong, priorities in terms of the conditions for the development of local financial markets vary across economies. Table 5.1 indicates the area with the greatest distance to the frontier in each economy. By construction, any economy, regardless of its level of financial market development, will have at least one area that is identified as a key constraint (with several areas being highlighted in cases where the differences between the relevant distances are small enough not to be statistically significant).
The lack of a well-developed local investor base is a key constraint in most economies in the EBRD regions, as well as some comparator economies (including Germany). Many of those countries do not have well-established defined contribution pension systems (referred to as “second-pillar” pension systems), while life insurance companies (where they exist) have low investment capacity.
While market infrastructure tends to be a key constraint in economies with less developed financial markets (such as Albania, Azerbaijan, Belarus and Kosovo), more developed markets (such as Greece, Poland and Slovenia) also face challenges in the area of clearing or nominee accounts. In Poland a direct link with an ICSD is needed to strengthen cross-border market access, while in Greece reforms are required to introduce legally defined nominee accounts in order to strengthen investor protection while ensuring the efficiency of transactions.
Legal and regulatory frameworks are a key constraint in Egypt, Lebanon, Turkmenistan and Ukraine. Within the European Union, Latvia (which does not have an ISDA legal opinion on netting/close-out netting) also has a relatively low score in this area.
Macroeconomic conditions tend to be less of a constraint in the EBRD regions (in contrast with, say, South Africa, where the Covid-19 crisis has compounded the effects of weak investment over the last decade). That being said, a number of economies do have relatively large distances to the frontier in terms of macroeconomic conditions, with examples including Turkmenistan and Lebanon (where dual exchange rates are present), Turkey (where inflation expectations are not anchored) and Russia (where a lack of economic diversification is weighing on perceptions of macroeconomic stability). Meanwhile, many advanced comparator economies have seen the distance to the macroeconomic conditions frontier increase of late, with
public debt levels and inflation rates rising markedly on account of the Covid-19 crisis.
Overall, the SEE region and Russia have seen the greatest improvements in terms of conditions supporting the development of capital markets, particularly in the area of legal and regulatory frameworks (see Chart 5.8). Across the EBRD regions and emerging market comparators, improvements in terms of market infrastructure have tended to outpace improvements in other categories. Overall progress in terms of reducing the distance to the frontier has been slowest in Turkey and the SEMED region, as improvements in market infrastructure have been offset by the weakness of macroeconomic frameworks and, in some cases, the weakening of legal frameworks.
CHART 5.8. The SEE region and Russia have seen the greatest improvements in conditions
Source: National authorities, IMF, CEIC, Bloomberg and authors’ calculations. Note: The scores shown in this chart for the various regions and categories are simple averages based on the figures presented in Table 5.1. The emerging market comparators are Colombia, Peru, South Africa and Thailand, and the advanced economy comparators are Canada, Cyprus, France, Germany, Japan, Sweden, the United Kingdom and the United States of America. The distance to the frontier is indicated on a scale of 0 to 100, where 100 represents the frontier. Country groups are ranked in ascending order on the basis of the overall subindex of conditions.
Central Asia EEC SEMED SEE Turkey Emergingmarket
comparators
Russia CEB Advancedeconomy
comparators
Dist
ance
to fr
ontie
r sco
re
2014
2020
2014
2020
2014
2020
2014
2020
2014
2020
2014
2020
2014
2020
2014
2020
2014
2020
0
20
40
60
80
100
Macroeconomic conditions Legal frameworks Market infrastructure Investor base
INDEX VALUES ARE ON A SCALE OF
0 TO 100AND INDICATE THE DISTANCE TO THE FRONTIER (WHICH IS REPRESENTED BY THE HIGHEST-SCORING ECONOMY IN EACH CATEGORY)
118
TRANSITION REPORT 2021-22 SYSTEM UPGRADE: DELIVERING THE DIGITAL DIVIDEND

Conditions Market depth Conditions in 2020
Economy 2020 2014 2020 2014Macroeconomic
conditionsLegal
frameworks Market
infrastructure Investor baseJapan 96.3 96.8 81.2 71.9 90.0 98.7 100.0 96.6Sweden 94.7 93.8 79.8 70.1 93.9 99.4 100.0 85.4Canada 93.8 93.0 91.8 79.1 91.4 98.5 100.0 85.2United States of America 93.6 92.6 99.6 93.8 91.2 97.2 100.0 85.8United Kingdom 92.3 94.4 89.0 86.2 82.7 97.1 100.0 89.5France 89.6 89.7 86.6 86.5 93.5 95.7 100.0 69.1Germany 87.2 87.8 83.0 71.3 94.7 98.0 100.0 56.2South Africa 85.3 78.9 83.3 59.8 67.3 91.6 88.0 94.3Slovenia 81.5 71.6 27.3 26.9 91.7 92.6 83.0 58.7Poland 80.3 76.7 49.8 50.5 89.7 90.3 81.0 60.3Slovak Republic 79.9 81.3 26.2 22.4 93.3 90.5 83.0 52.9Hungary 79.1 72.7 50.5 43.3 94.9 90.7 88.0 42.7Czech Republic 76.7 73.9 43.8 30.8 99.7 94.3 83.0 29.8Estonia 76.5 68.2 24.8 14.4 100.0 82.7 77.0 46.4Latvia 75.5 68.8 16.0 31.6 99.1 74.4 77.0 51.5Lithuania 75.1 68.7 22.9 24.6 97.5 85.3 77.0 40.4Russia 72.4 55.4 59.1 47.0 71.3 80.4 92.0 45.9Cyprus 69.8 64.9 20.6 15.9 80.8 91.5 58.0 48.9Romania 67.9 56.2 28.7 33.3 91.4 90.4 58.0 31.7Greece 67.6 66.6 35.0 28.4 67.6 87.6 69.0 46.1Thailand 66.1 63.8 69.1 47.6 86.7 60.4 58.0 59.5Croatia 63.8 55.9 18.6 16.1 79.3 73.7 56.0 46.3Turkey 60.9 61.5 52.3 46.1 57.0 86.6 56.0 43.9Colombia 60.5 53.0 32.9 26.2 81.7 60.4 50.0 50.1Bulgaria 59.0 53.0 15.2 14.7 95.7 60.5 52.0 27.8Serbia 56.7 43.2 12.3 16.3 87.3 67.1 58.0 14.3Peru 54.7 48.2 21.4 18.8 88.7 58.4 29.0 42.6Morocco 53.5 51.1 19.7 17.4 77.8 47.5 58.0 30.9North Macedonia 49.7 44.4 15.1 7.3 88.8 29.1 58.0 22.7Kazakhstan 47.3 30.4 37.4 18.7 59.5 42.8 52.0 34.8Bosnia and Herzegovina 46.9 40.3 11.2 10.3 86.7 41.7 50.0 9.2Armenia 44.1 35.2 10.8 13.1 69.7 55.2 38.0 13.4Egypt 44.0 30.5 29.5 12.2 53.1 30.3 58.0 34.6Jordan 43.9 45.2 15.2 10.1 77.4 48.4 33.0 16.8Ukraine 43.6 21.9 20.3 18.4 65.2 34.5 48.0 26.7Montenegro 42.7 37.9 10.1 10.4 76.1 44.2 42.0 8.5Georgia 38.4 34.5 16.3 19.2 69.4 42.6 31.0 10.6Albania 38.4 33.2 13.1 12.6 83.7 43.2 0.0 26.5Moldova 37.9 33.1 14.5 11.9 66.1 28.1 42.0 15.4Mongolia 36.3 22.2 8.1 7.5 58.3 36.7 33.0 17.4Kyrgyz Republic 34.2 34.7 7.0 8.6 68.9 20.8 42.0 5.0Kosovo 32.3 25.0 4.2 3.9 79.9 15.8 0.0 33.4Tunisia 32.0 29.9 16.3 12.3 39.9 30.4 46.0 11.6Azerbaijan 30.1 29.6 9.4 6.7 68.7 35.8 8.0 7.7Uzbekistan 27.7 20.5 13.6 3.4 49.7 21.9 38.0 1.2Tajikistan 26.0 16.8 1.7 0.0 65.1 13.7 25.0 0.0Lebanon 25.3 35.5 9.7 4.7 26.1 13.3 46.0 15.7Belarus 21.1 16.9 14.0 13.2 60.1 15.4 0.0 8.9West Bank and Gaza 19.9 18.4 3.9 3.4 34.3 15.1 25.0 5.3Turkmenistan 0.9 1.3 0.0 0.0 0.0 0.0 0.0 3.5
TABLE 5.1. Index of conditions for financial market development and market depth
Source: EBRD. Note: Index values for 2014 (2020) are calculated on the basis of data for 2014 (2020) or the closest year available. Index values are on a scale of 0 to 100 and indicate the distance to the frontier (which is represented by the highest-scoring economy in each category). Economies are ranked on the basis of the overall score for conditions in 2020, which is calculated as an average of the four conditions pillars. The distance to the frontier is calculated by taking z-scores (standardised deviations from the mean) for each category, adding the lowest value observed across all economies and expressing the resulting score as a percentage of the maximum score (the frontier). For each economy, the area with the lowest score is highlighted. Where the differences between an economy’s lowest scores are not statistically significant, several scores are highlighted.
119
CHAPTER 5 THE FINANCIAL MARKET DEVELOPMENT INDEX
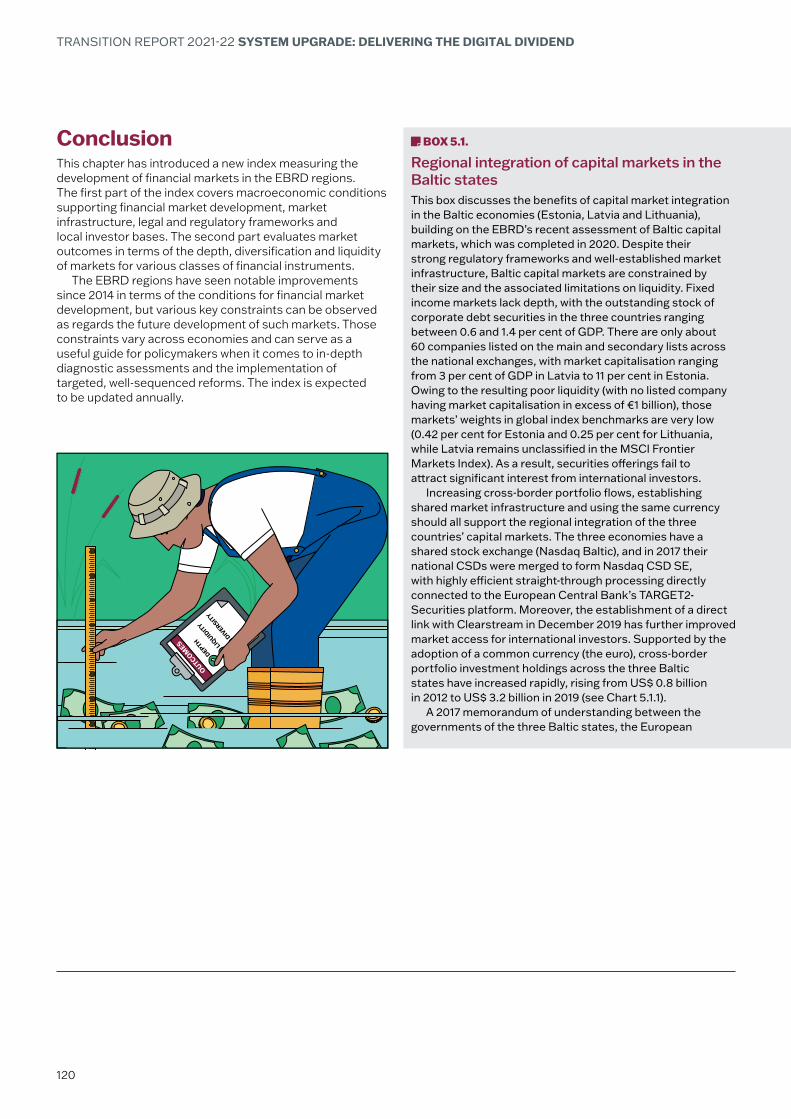
ConclusionThis chapter has introduced a new index measuring the development of financial markets in the EBRD regions. The first part of the index covers macroeconomic conditions supporting financial market development, market infrastructure, legal and regulatory frameworks and local investor bases. The second part evaluates market outcomes in terms of the depth, diversification and liquidity of markets for various classes of financial instruments.
The EBRD regions have seen notable improvements since 2014 in terms of the conditions for financial market development, but various key constraints can be observed as regards the future development of such markets. Those constraints vary across economies and can serve as a useful guide for policymakers when it comes to in-depth diagnostic assessments and the implementation of targeted, well-sequenced reforms. The index is expected to be updated annually.
BOX 5.1.
Regional integration of capital markets in the Baltic states This box discusses the benefits of capital market integration in the Baltic economies (Estonia, Latvia and Lithuania), building on the EBRD’s recent assessment of Baltic capital markets, which was completed in 2020. Despite their strong regulatory frameworks and well-established market infrastructure, Baltic capital markets are constrained by their size and the associated limitations on liquidity. Fixed income markets lack depth, with the outstanding stock of corporate debt securities in the three countries ranging between 0.6 and 1.4 per cent of GDP. There are only about 60 companies listed on the main and secondary lists across the national exchanges, with market capitalisation ranging from 3 per cent of GDP in Latvia to 11 per cent in Estonia. Owing to the resulting poor liquidity (with no listed company having market capitalisation in excess of €1 billion), those markets’ weights in global index benchmarks are very low (0.42 per cent for Estonia and 0.25 per cent for Lithuania, while Latvia remains unclassified in the MSCI Frontier Markets Index). As a result, securities offerings fail to attract significant interest from international investors.
Increasing cross-border portfolio flows, establishing shared market infrastructure and using the same currency should all support the regional integration of the three countries’ capital markets. The three economies have a shared stock exchange (Nasdaq Baltic), and in 2017 their national CSDs were merged to form Nasdaq CSD SE, with highly efficient straight-through processing directly connected to the European Central Bank’s TARGET2-Securities platform. Moreover, the establishment of a direct link with Clearstream in December 2019 has further improved market access for international investors. Supported by the adoption of a common currency (the euro), cross-border portfolio investment holdings across the three Baltic states have increased rapidly, rising from US$ 0.8 billion in 2012 to US$ 3.2 billion in 2019 (see Chart 5.1.1).
A 2017 memorandum of understanding between the governments of the three Baltic states, the European
DEPTH LIQUID
ITY
DIVERSIT
YOUTCOM
ES
120
TRANSITION REPORT 2021-22 SYSTEM UPGRADE: DELIVERING THE DIGITAL DIVIDEND

ReferencesM. Chinn and H. Ito (2006)“What matters for financial development? Capital controls, institutions, and interactions”, Journal of Development Economics, Vol. 81, No. 1, pp. 163-192.S. Djankov, R. La Porta, F. Lopez-de-Silanes and A. Shleifer (2008)“The law and economics of self-dealing”, Journal of Financial Economics, Vol. 88, No. 3, pp. 430-465.EBRD (2010)Transition Report 2010 – Recovery and Reform, London.EBRD (2015)Transition Report 2015-16 – Rebalancing Finance, London.ICMA (2019)“Frequently Asked Questions on Repo”. Available at: www.icmagroup.org/Regulatory-Policy-and-Market-Practice/repo-and-collateral-markets/icma-ercc-publications/frequently-asked-questions-on-repo (last accessed on 30 August 2021).IFC (2017)“The importance of local capital markets for financing development”, EM Compass Notes, No. 28.ISDA (2010)“The Importance of Close-Out Netting”, ISDA Research Notes, No. 1. Available at: www.isda.org/a/USiDE/ netting-isdaresearchnotes-1-2010.pdf (last accessed on 30 August 2021).L. Laeven and F. Valencia (2013)“Systemic Banking Crises Database”, IMF Economic Review, Vol. 61, No. 2, pp. 225-270.R. La Porta, F. Lopez-de-Silanes, A. Shleifer and R. Vishny (1997)“Legal Determinants of External Finance”, The Journal of Finance, Vol. 52, No. 3, pp. 1131-1150.
CHART 5.1.1. Cross-border portfolio investment holdings across the three Baltic states have risen rapidly
Source: IMF and authors’ calculations.
Tota
l cro
ss-b
orde
r por
tfolio
inve
stm
ent h
oldi
ngs
in o
ther
Bal
tic s
tate
s (U
S$ m
illio
n)
Estonia Latvia Lithuania
Dec
12
Jun
13
Dec
13
Jun
14
Dec
14
Jun
15
Dec
15
Jun
16
Dec
16
Jun
17
Dec
17
Jun
18
Dec
18
Jun
19
0
200
400
600
800
1000
1200
1400
Commission and the EBRD has paved the way for multiple initiatives aimed at attracting investment through the establishment of a common capital market. These include a framework for corporate commercial paper using common issuance documentation (with the first transaction taking place in 2021) and a pan-Baltic accelerator fund aimed at supporting access to finance for pre initial public offering (pre-IPO) exchange-traded small and mid-cap companies. Significant progress has also been made on legislative frameworks for covered bonds, with the first issuances taking place in 2020. Work is ongoing with a view to aligning those frameworks in order to enable issuances to be covered by pan-Baltic pools of assets – a very attractive solution for financial institutions operating in all three countries.
Work is also ongoing with index providers on the adoption of a pan-Baltic single index classification. This would bring the region closer to meeting the size requirements for inclusion in the emerging markets category, although the combined size of the three markets would remain small compared with other emerging markets in the region (such as Bulgaria, Hungary or Poland), and additional efforts to list large companies (with market capitalisation in excess of €1 billion) would be needed in order to meet the market size criteria set by index providers.
121
CHAPTER 5 THE FINANCIAL MARKET DEVELOPMENT INDEX