Embed Size (px)
Citation preview

Global Financial Stability
Outlook
Fabio Natalucci Deputy Director
Monetary and Capital Markets Department
International Monetary Fund
1

Financial Stability Risks Could Rise Sharply
Vulnerabilities
Continue to Build
• High nonfinancial leverage
• Stretched asset valuations
• EM external borrowing
• Bank exposures & FX funding
Risks Could Rise Sharply
Possible triggers:
• Broader EM pressures
• Escalation of trade tensions
• Political and policy uncertainty
• Faster monetary policy
normalization
Since the April 2018 GFSR
• Global financial conditions have
tightened somewhat, but remain
broadly accommodative
• Near-term risks have increased
modestly, while medium-term
risks remain elevated
2

MARKET DEVELOPMENTS
3
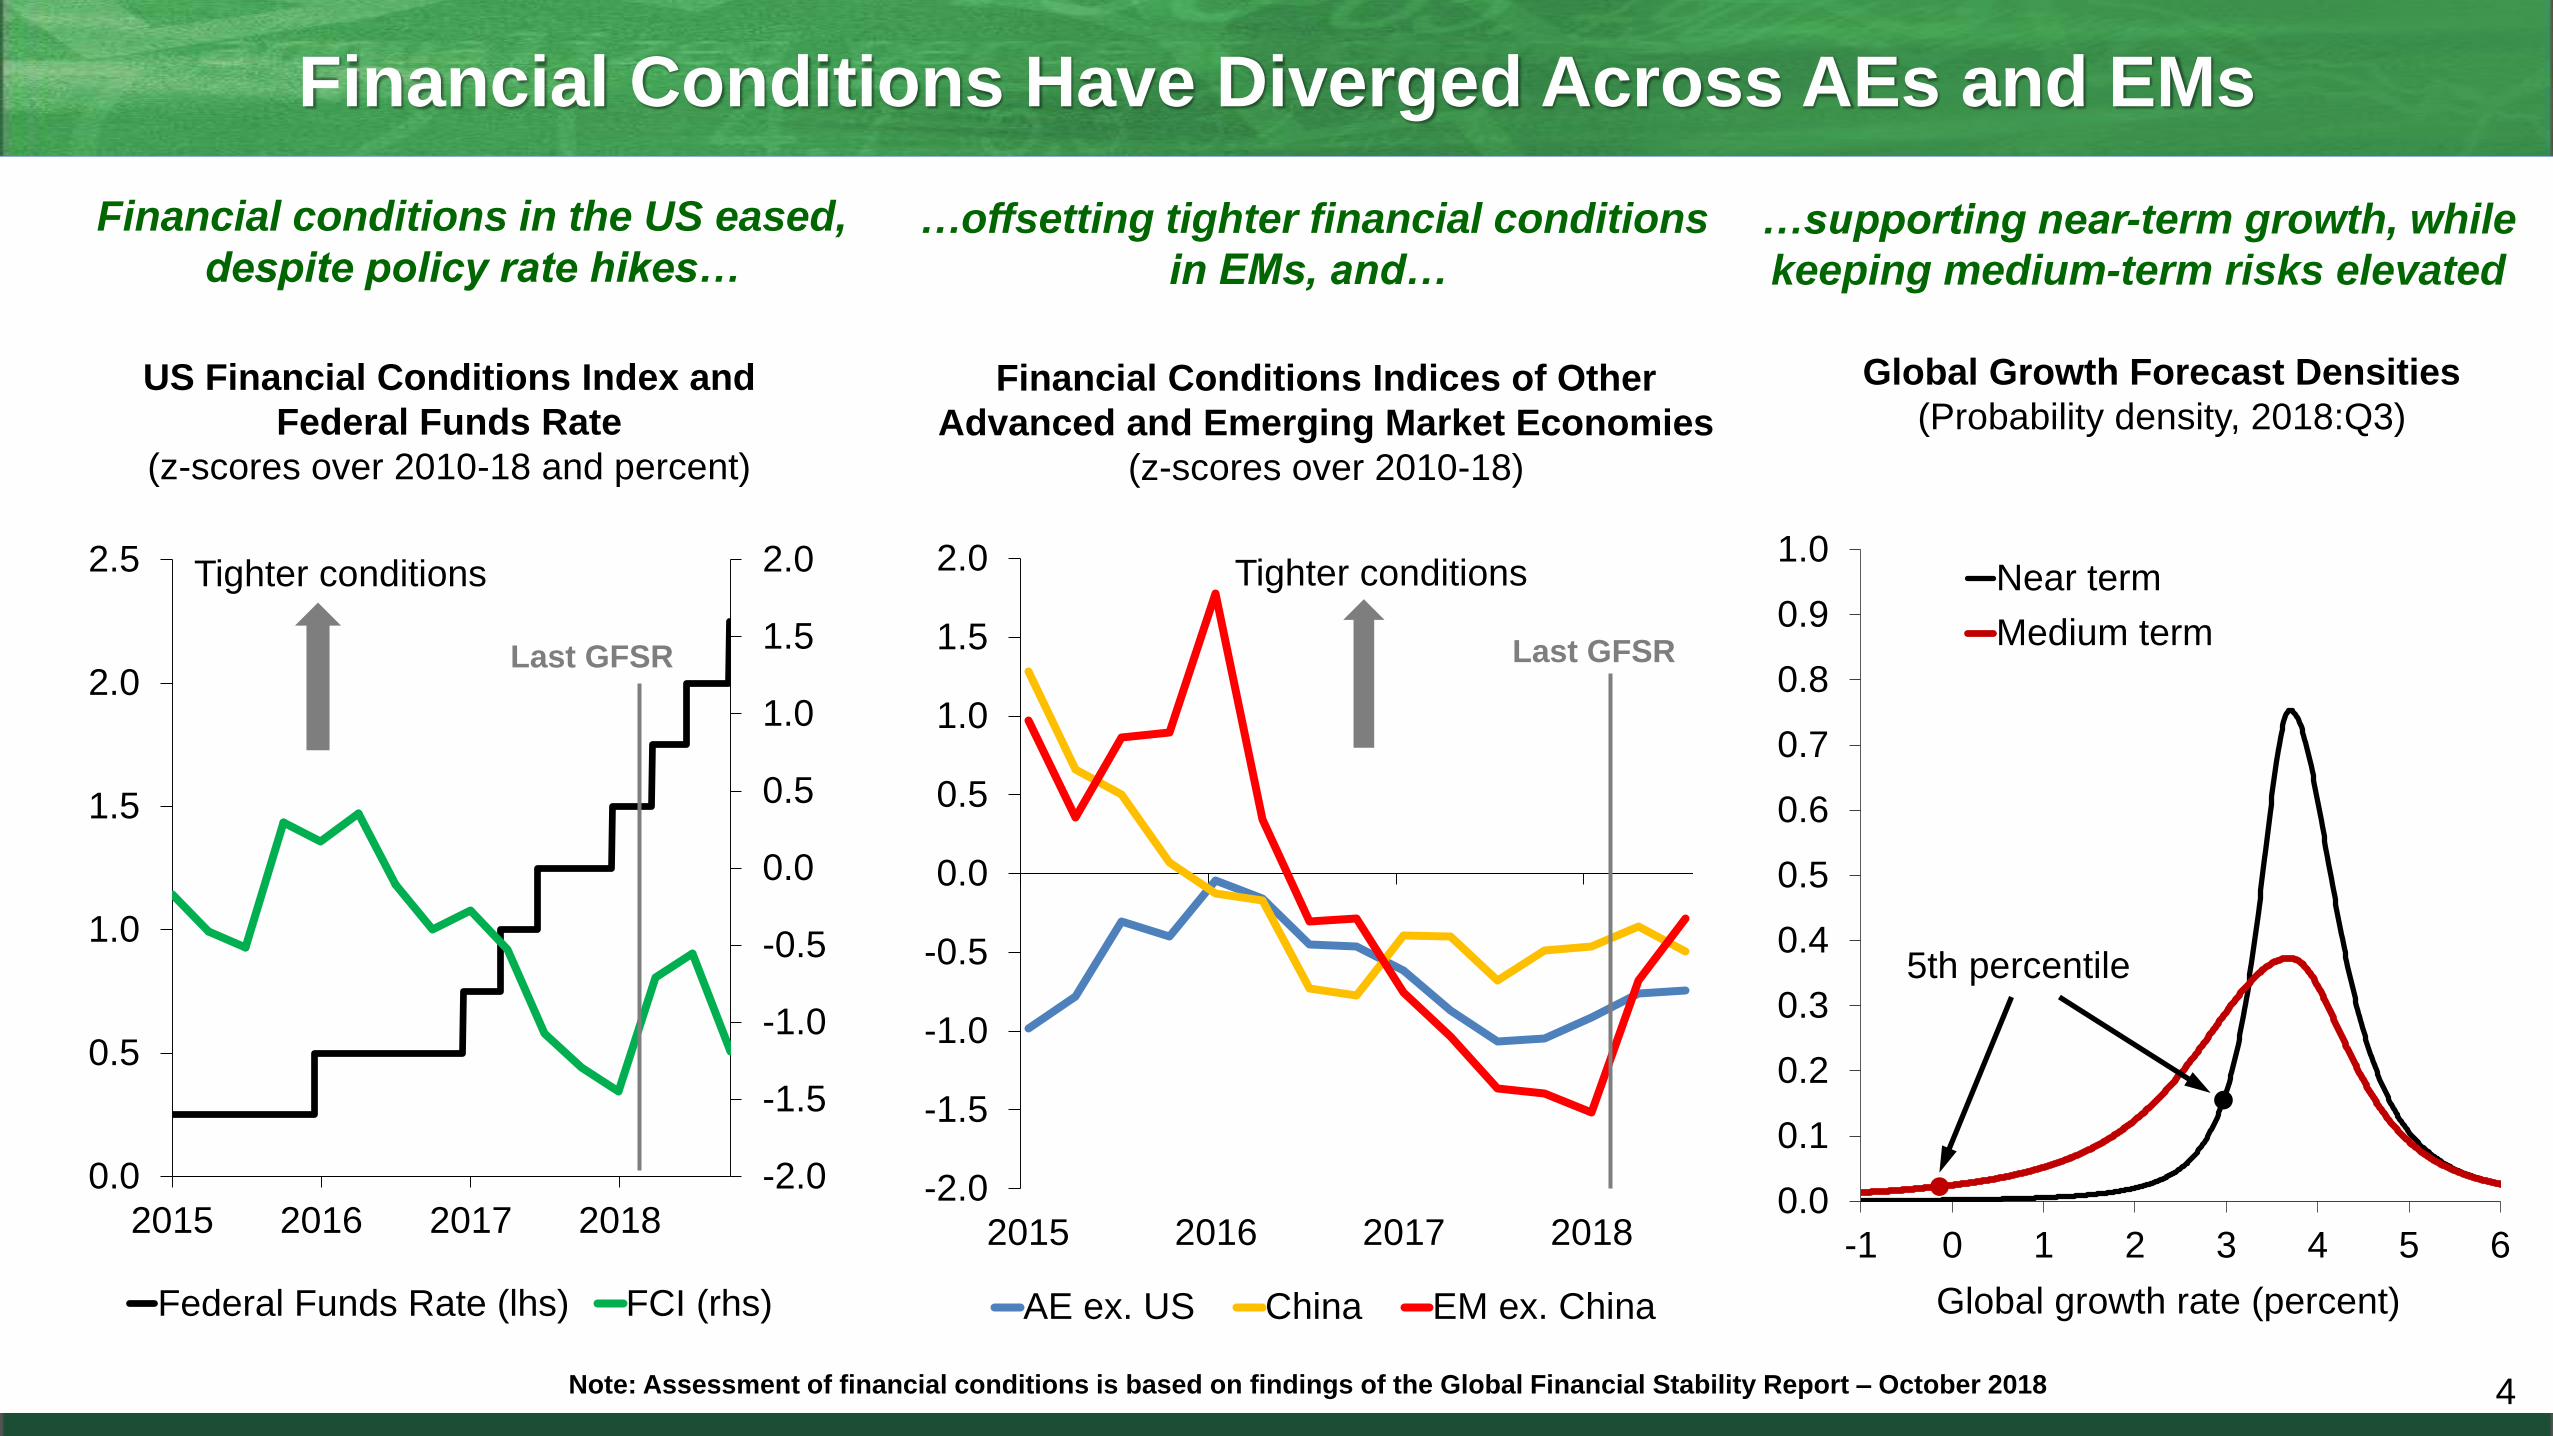
Financial Conditions Have Diverged Across AEs and EMs
Financial Conditions Indices of Other
Advanced and Emerging Market Economies
(z-scores over 2010-18)
-2.0
-1.5
-1.0
-0.5
0.0
0.5
1.0
1.5
2.0
2015 2016 2017 2018
AE ex. US China EM ex. China
Last GFSR
Tighter conditions
Financial conditions in the US eased,
despite policy rate hikes…
Global Growth Forecast Densities
(Probability density, 2018:Q3)
…offsetting tighter financial conditions
in EMs, and…
4
…supporting near-term growth, while
keeping medium-term risks elevated
0.0
0.1
0.2
0.3
0.4
0.5
0.6
0.7
0.8
0.9
1.0
-1 0 1 2 3 4 5 6
Near term
Medium term
5th percentile
Global growth rate (percent)
US Financial Conditions Index and
Federal Funds Rate
(z-scores over 2010-18 and percent)
-2.0
-1.5
-1.0
-0.5
0.0
0.5
1.0
1.5
2.0
0.0
0.5
1.0
1.5
2.0
2.5
2015 2016 2017 2018
Federal Funds Rate (lhs) FCI (rhs)
Last GFSR
Tighter conditions
Note: Assessment of financial conditions is based on findings of the Global Financial Stability Report – October 2018

The sharp selloff in US stocks triggered a
global stock market correction…
Major Stock Index Performance
(index to Jan 1, 2018; YTD change in parentheses)
… leading to a significant fall in equity
valuations
12-month Forward Price-to-Earnings Ratio
(z-score since 1987; current value in parentheses)
5
Recent Market Movements Have Contributed to Tighter Conditions
-2.0
-1.5
-1.0
-0.5
0.0
0.5
1.0
2012 2013 2014 2015 2016 2017 2018
US (15.3) Europe (11.9)
Japan (12.3) EM (10.2)80
90
100
110
Jan Feb Mar Apr May Jun Jul Aug Sep Oct Nov Dec
US (3.5%) Europe (-8.8%)
Japan (-9.3%) EM (-12.2%)
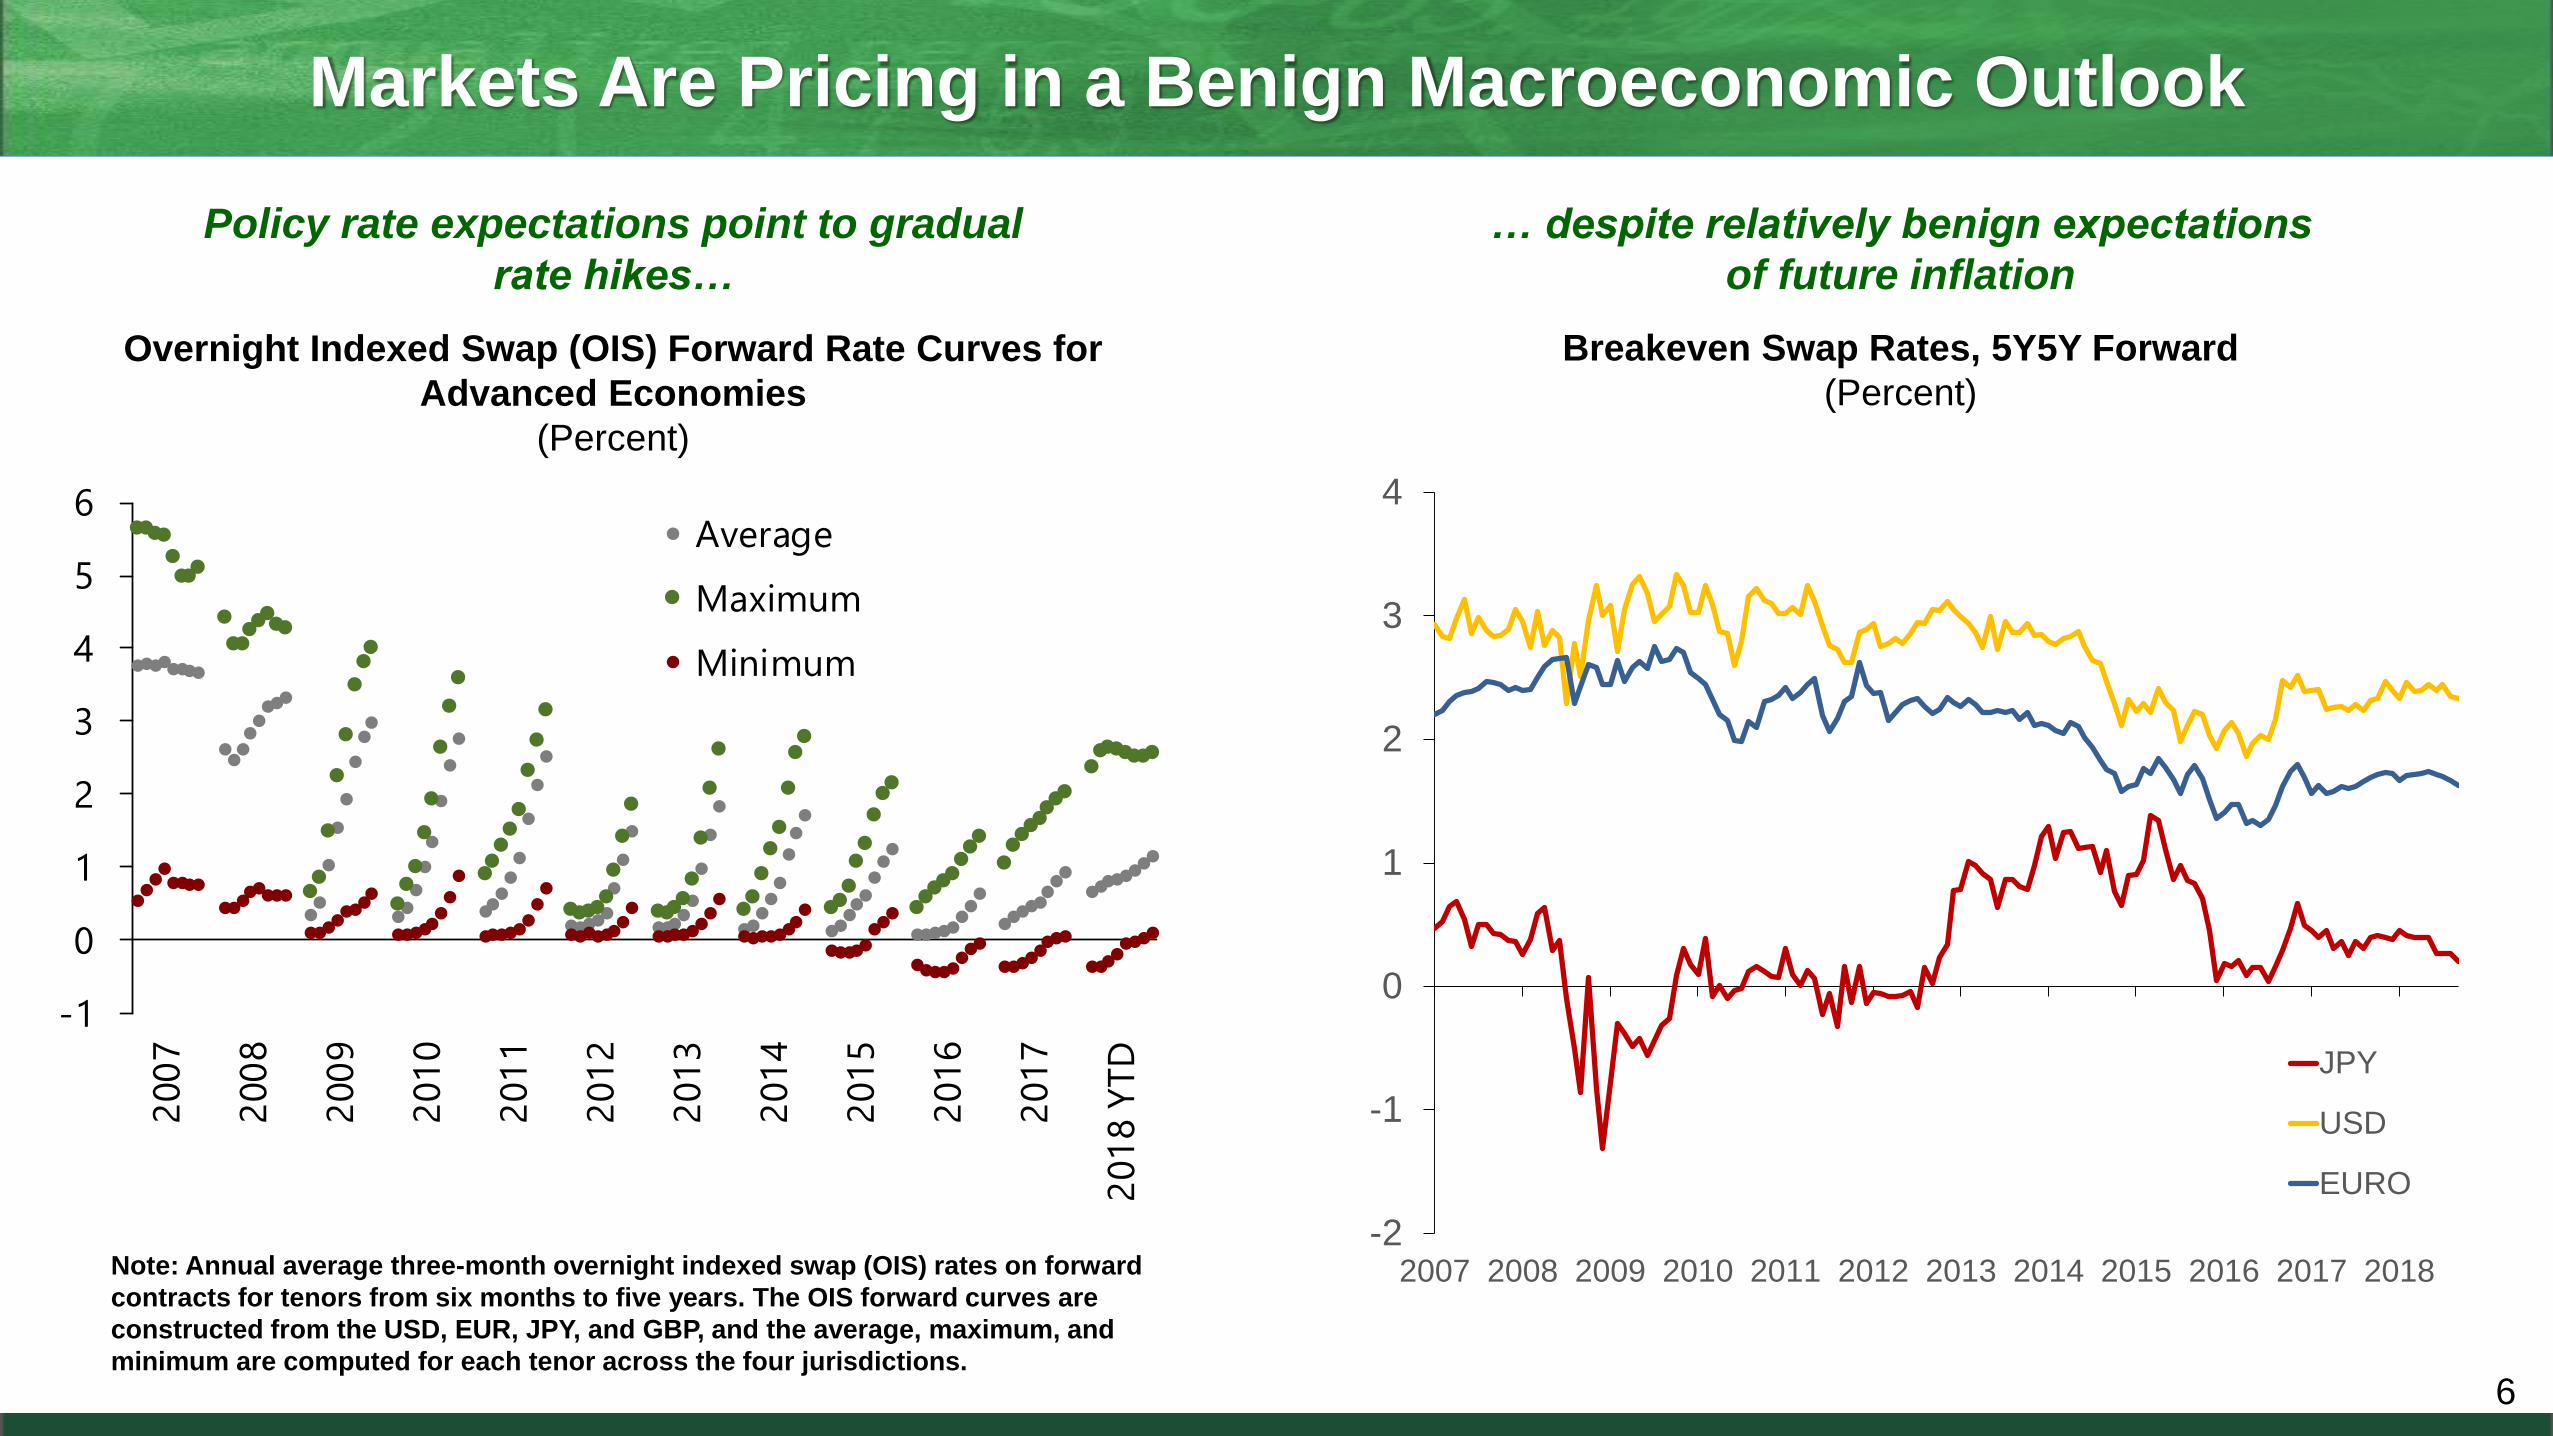
Markets Are Pricing in a Benign Macroeconomic Outlook
6
Policy rate expectations point to gradual
rate hikes…
… despite relatively benign expectations
of future inflation
Breakeven Swap Rates, 5Y5Y Forward
(Percent)
Overnight Indexed Swap (OIS) Forward Rate Curves for
Advanced Economies
(Percent)
Note: Annual average three-month overnight indexed swap (OIS) rates on forward
contracts for tenors from six months to five years. The OIS forward curves are
constructed from the USD, EUR, JPY, and GBP, and the average, maximum, and
minimum are computed for each tenor across the four jurisdictions.
-2
-1
0
1
2
3
4
2007 2008 2009 2010 2011 2012 2013 2014 2015 2016 2017 2018
JPY
USD
EURO
-1
0
1
2
3
4
5
6
200
7
200
8
200
9
201
0
201
1
201
2
201
3
201
4
201
5
201
6
201
7
201
8 Y
TD
Average
Maximum
Minimum
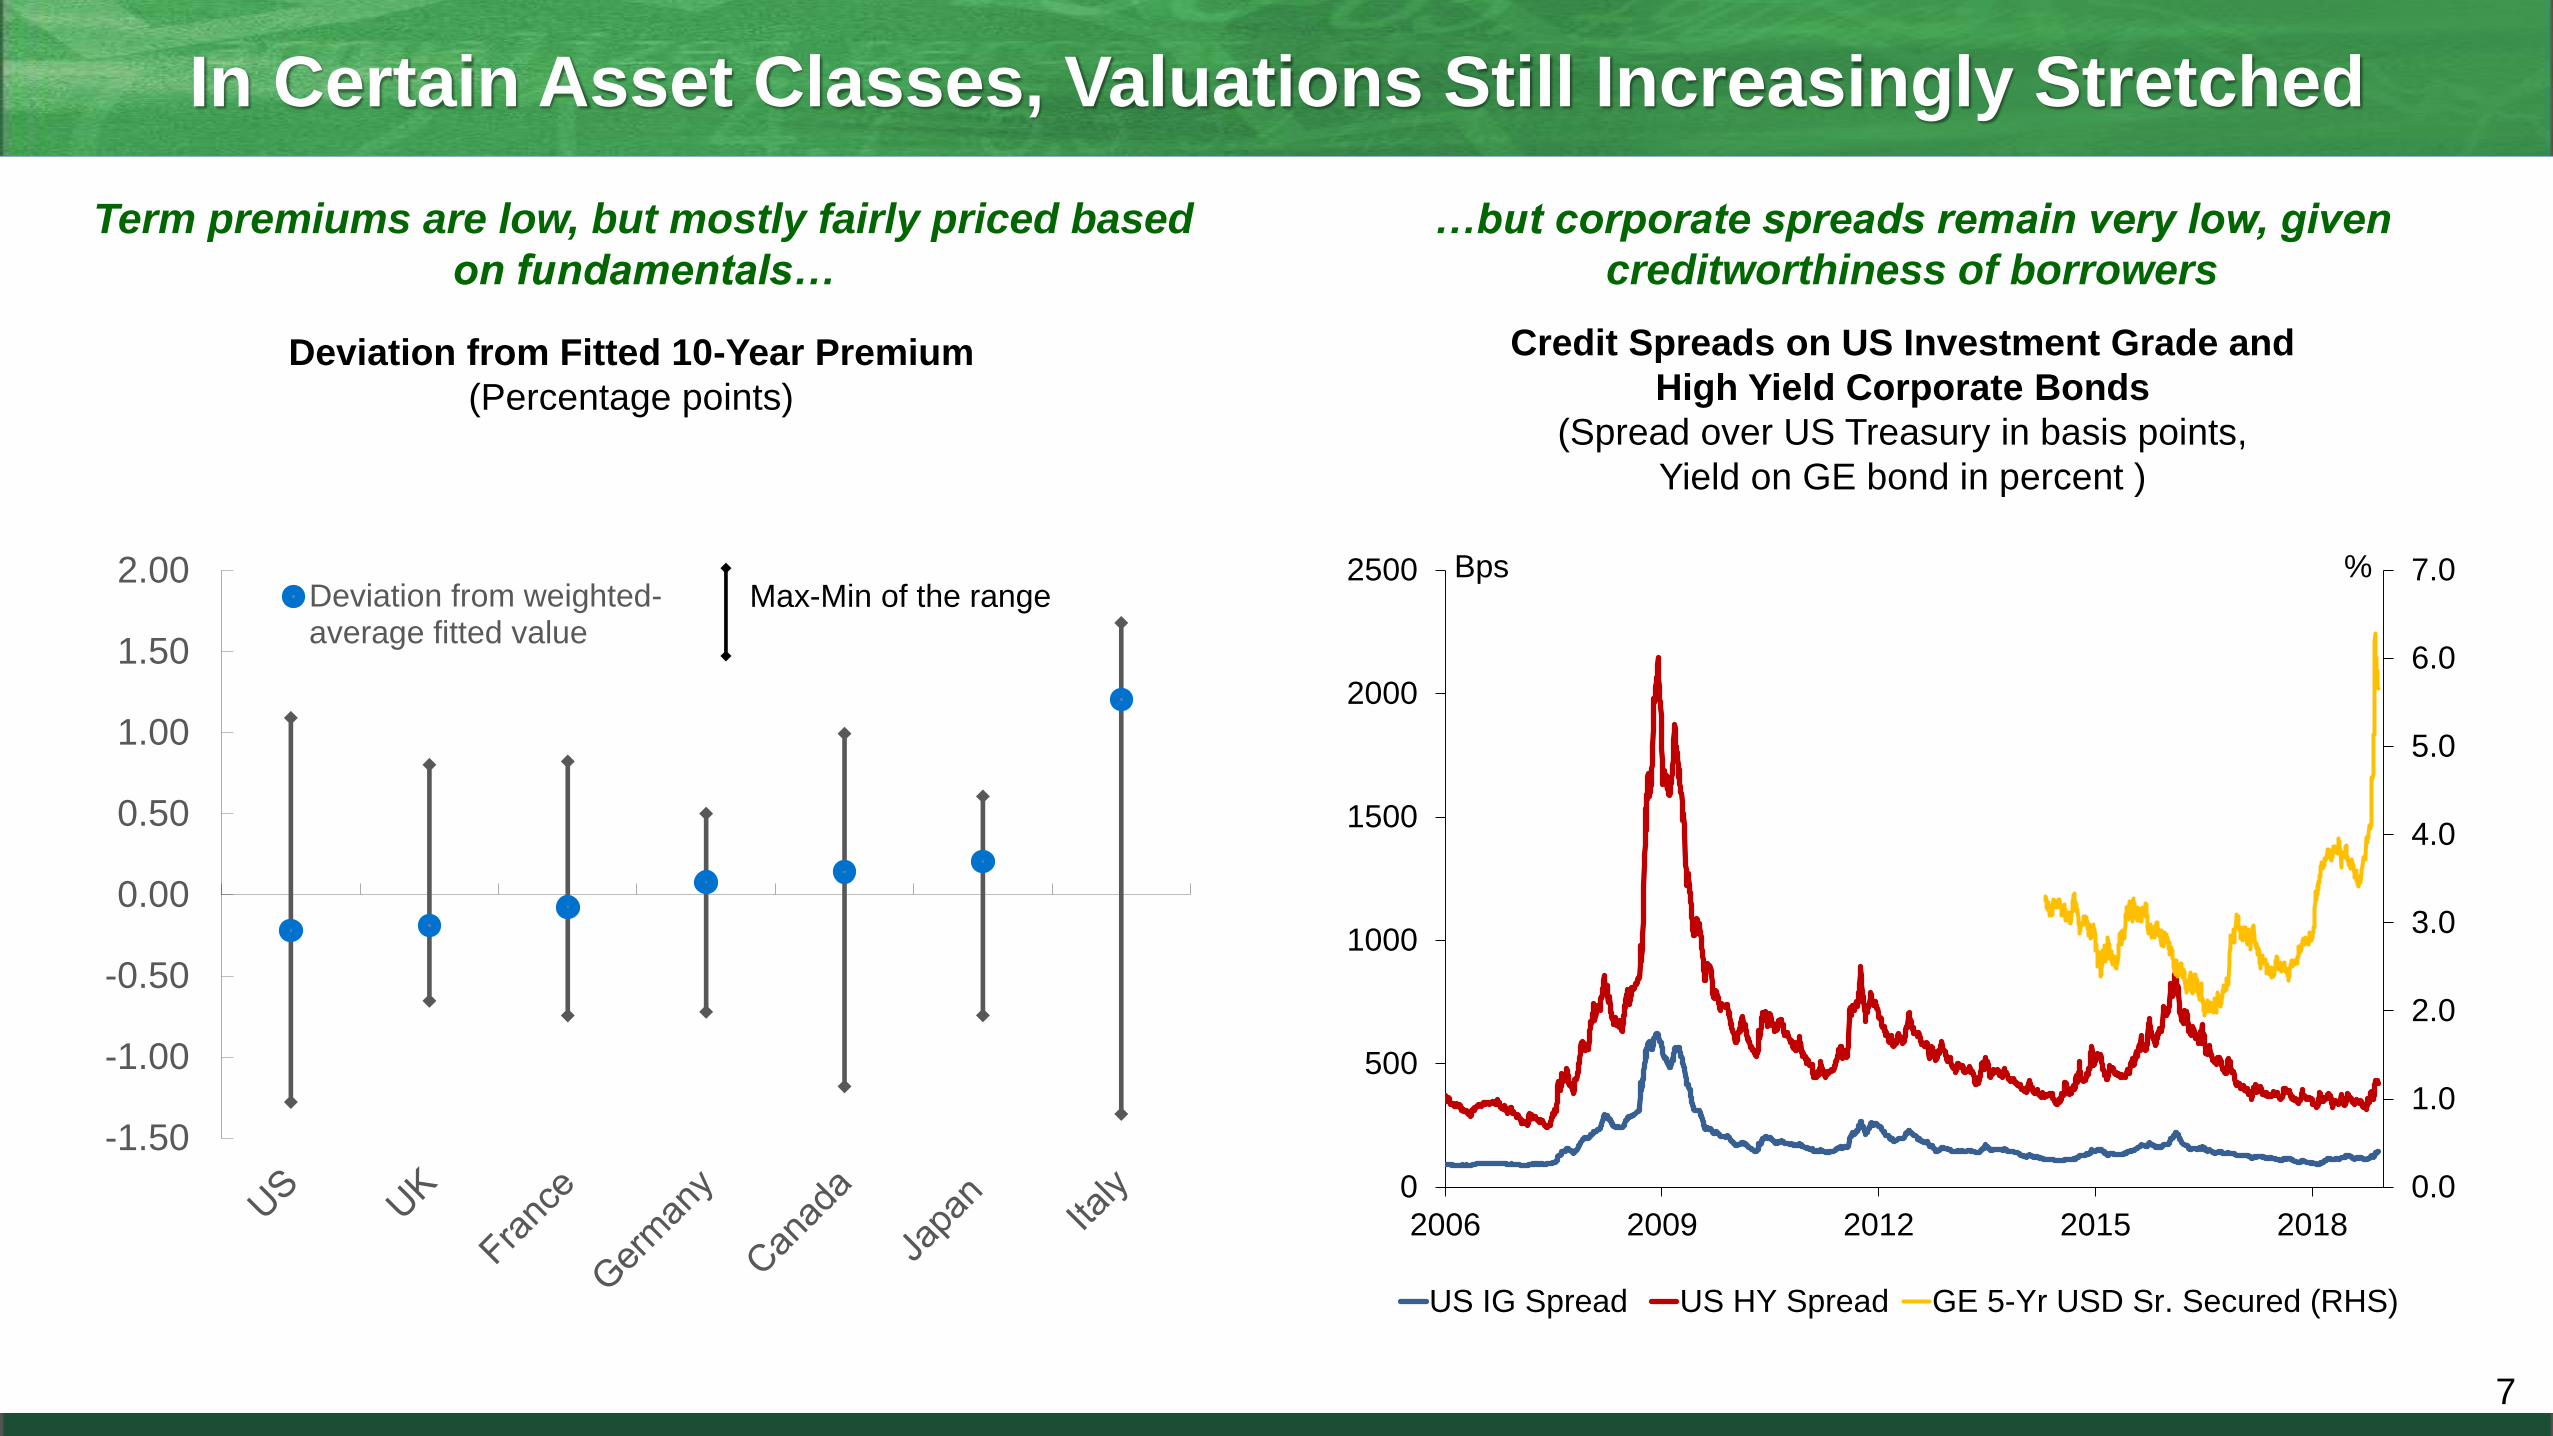
In Certain Asset Classes, Valuations Still Increasingly Stretched
Term premiums are low, but mostly fairly priced based
on fundamentals…
Credit Spreads on US Investment Grade and
High Yield Corporate Bonds
(Spread over US Treasury in basis points,
Yield on GE bond in percent )
7
…but corporate spreads remain very low, given
creditworthiness of borrowers
Deviation from Fitted 10-Year Premium
(Percentage points)
-1.50
-1.00
-0.50
0.00
0.50
1.00
1.50
2.00Deviation from weighted-average fitted value
Max-Min of the range
0.0
1.0
2.0
3.0
4.0
5.0
6.0
7.0
0
500
1000
1500
2000
2500
2006 2009 2012 2015 2018
US IG Spread US HY Spread GE 5-Yr USD Sr. Secured (RHS)
%Bps
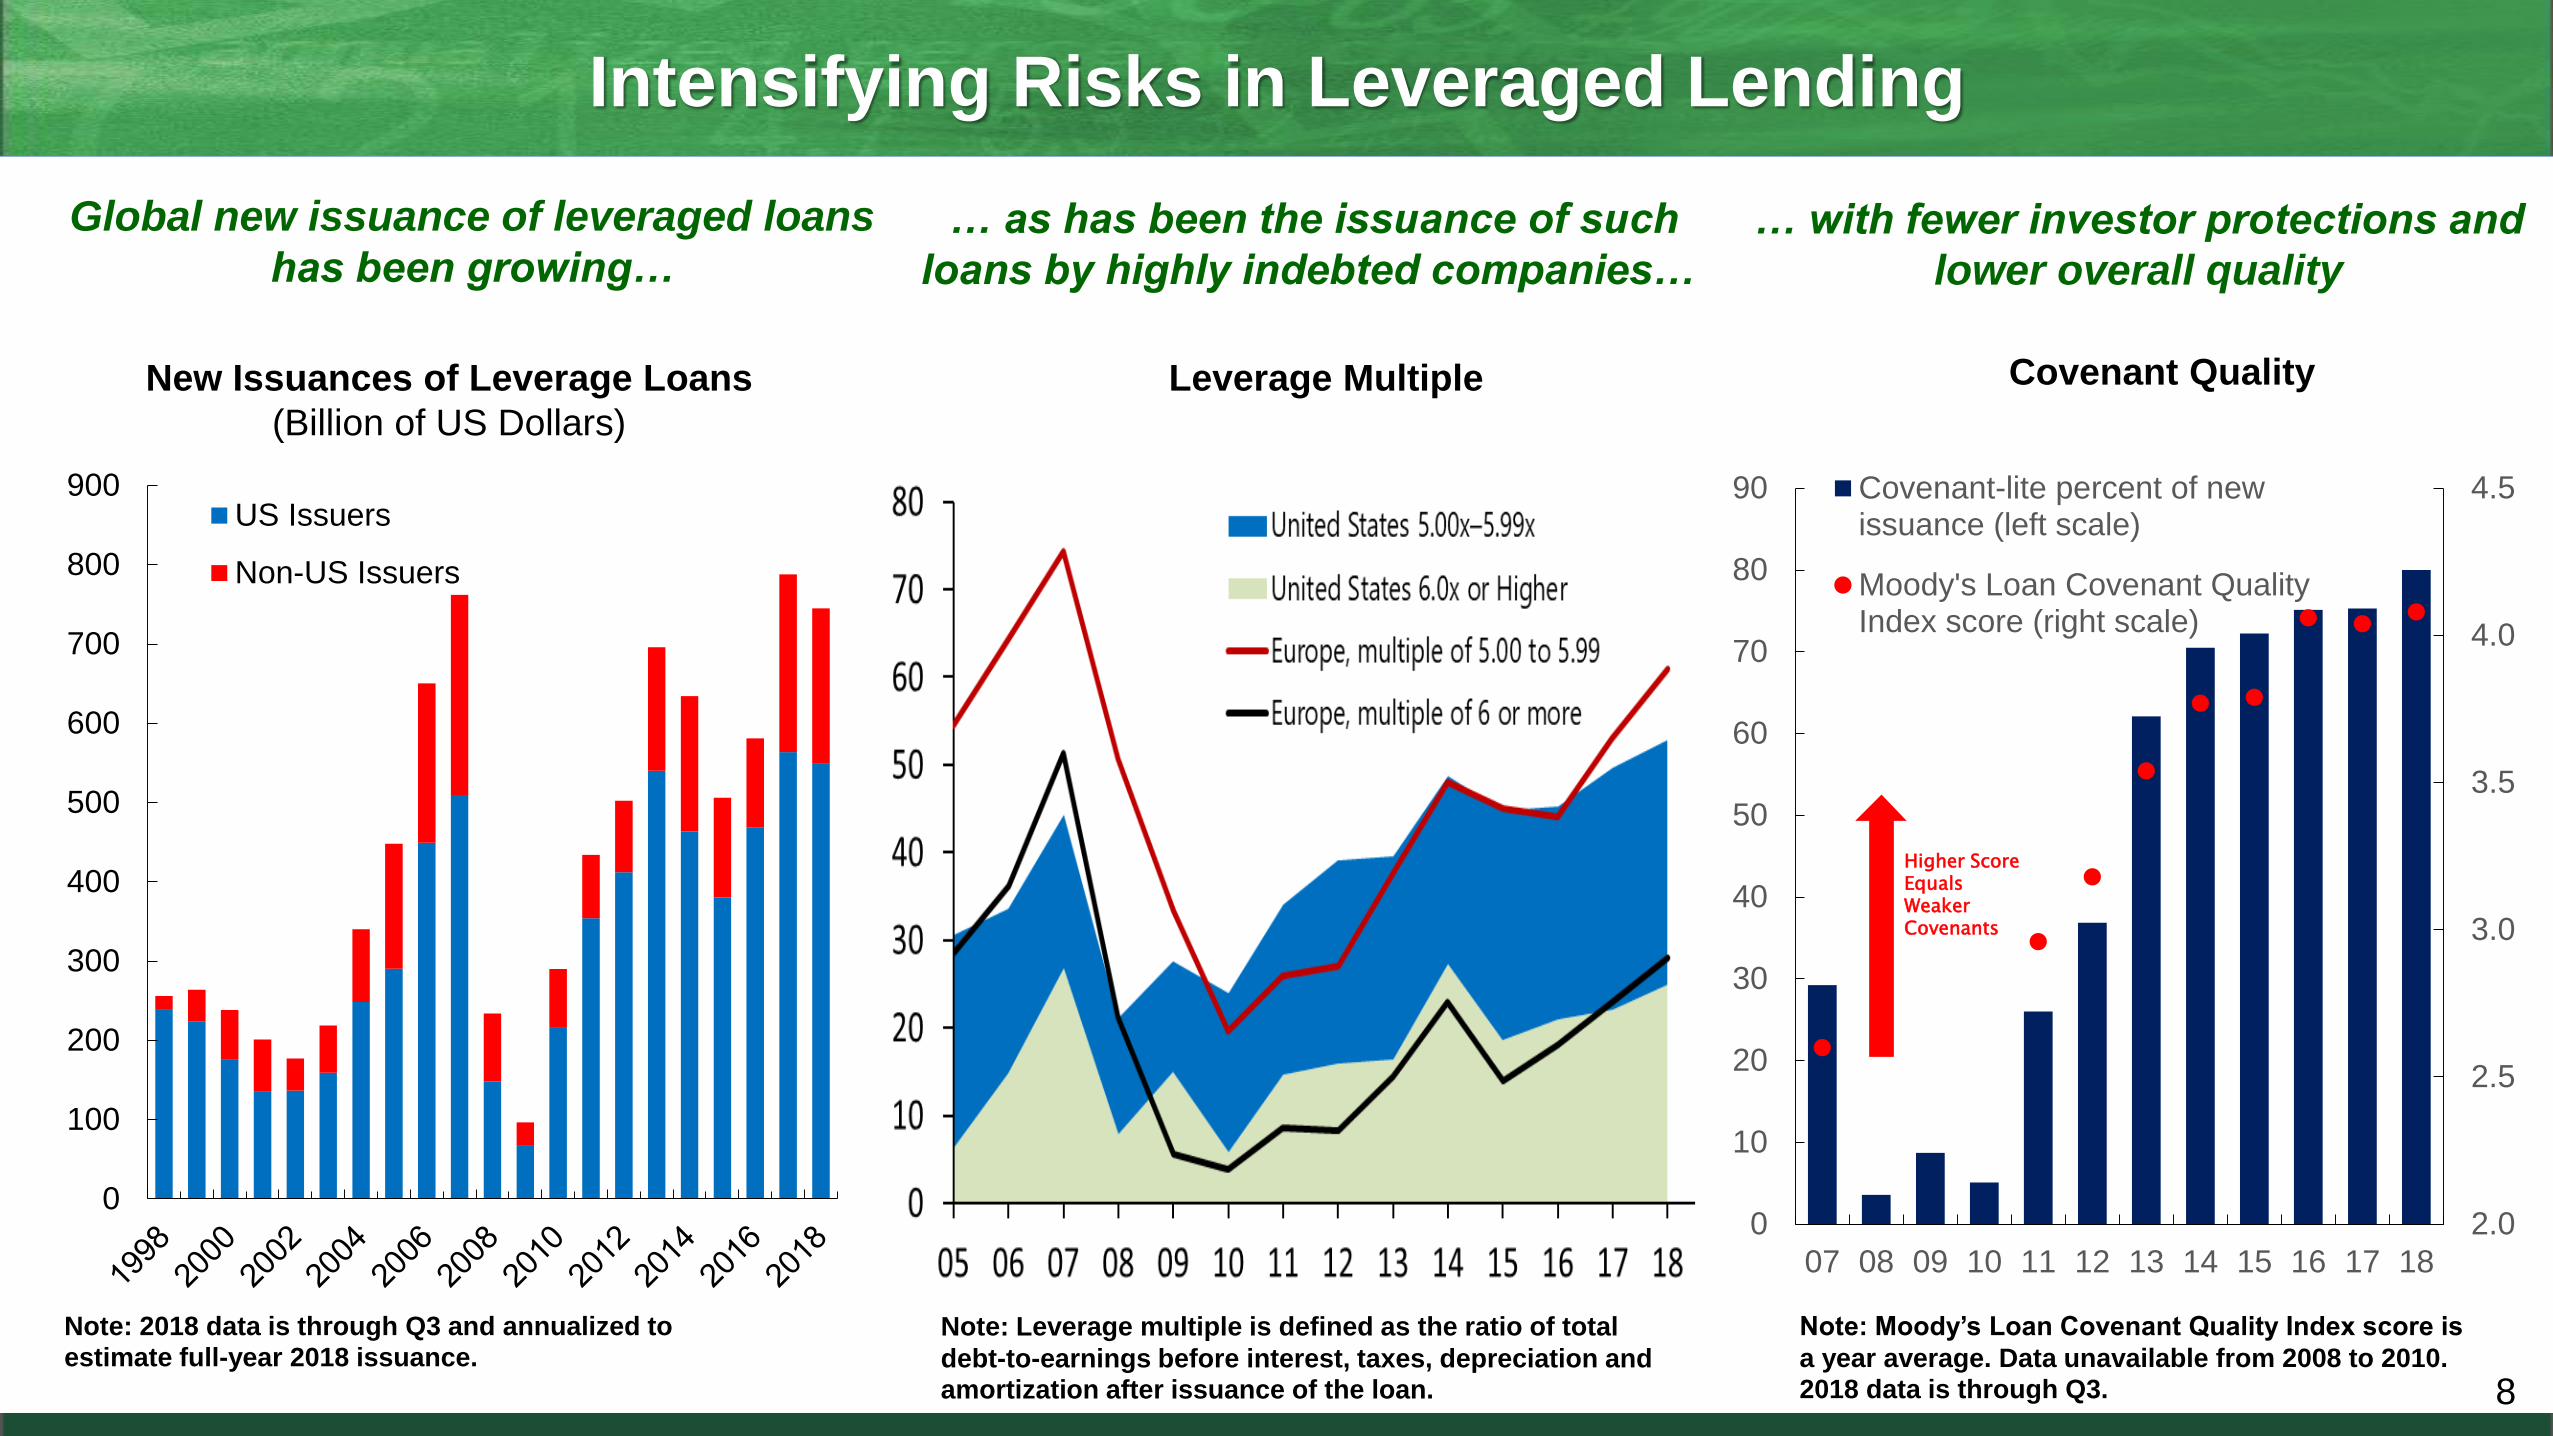
Intensifying Risks in Leveraged Lending
Leverage Multiple
Global new issuance of leveraged loans
has been growing…
Covenant Quality
… as has been the issuance of such
loans by highly indebted companies…
8
… with fewer investor protections and
lower overall quality
New Issuances of Leverage Loans
(Billion of US Dollars)
Note: 2018 data is through Q3 and annualized to estimate full-year 2018 issuance.
Note: Leverage multiple is defined as the ratio of total
debt-to-earnings before interest, taxes, depreciation and amortization after issuance of the loan.
Note: Moody’s Loan Covenant Quality Index score is
a year average. Data unavailable from 2008 to 2010. 2018 data is through Q3.
0
100
200
300
400
500
600
700
800
900US Issuers
Non-US Issuers
2.0
2.5
3.0
3.5
4.0
4.5
0
10
20
30
40
50
60
70
80
90
07 08 09 10 11 12 13 14 15 16 17 18
Covenant-lite percent of newissuance (left scale)
Moody's Loan Covenant QualityIndex score (right scale)
Higher Score Equals Weaker Covenants

Portfolio Flows to EMs Have Been Under Pressure
9
EM Portfolio Flows by Investor Type
(US$ bn, 3-month rolling sum)
EM portfolio flows have declined, driven by
a reversal in retail fund flows
Some moderation in EM portfolio flows is expected
due to ongoing US monetary policy normalization
Baseline: Estimated Cumulative Impact of External
Factors on Portfolio Flows to EMs
(US$ bn)
-120
-90
-60
-30
0
30
60
90
120
150
2013 2014 2015 2016 2017 2018
Renminbi
devaluationU.S. electionTaper
tantrum
Institutional
flows
Retail flows
EM
Sell-off
Total flows
-140
-120
-100
-80
-60
-40
-20
0
20
2017Q4 2018Q2 2018Q4 2019Q2 2019Q4
Risk aversion (assumed to stay at 2018:Q3 level)
Fed balance sheet (from Federal Reserve)
Fed rates (consistent with WEO)
Estimates through 2018Q3
Baseline Outlook

-50 0 50 100 150 200 250 300 350 400
ChinaPoland
ChileMalaysia
PeruKazakhstanPhilippines
ColombiaHungary
RussiaIndonesia
Mexico
BrazilSouth Africa
Turkey
EgyptNigeriaUkraine
ArgentinaLebanon
Investors Have So Far Differentiated Among EMs
10
Lower-rated EMs have seen larger widening in
external debt spreads…… but outsized FX currency moves have been limited
to a few countries
USD Government Bond Spreads
(changes since end-March; basis points)
A
BBB
BB
B
EM and AE Currencies against the USD
(index, 3/30/18=100)
Note: Letters refer to foreign currency long-term sovereign credit ratings, as assigned by at least two out of the three major credit rating agencies
Note: “High spread EMs” include Argentina, Brazil, South Africa, and Turkey; “Oil exporters” include Colombia, Kazakhstan, Mexico, and Russia.
65
70
75
80
85
90
95
100
105
Apr May Jun Jul Aug Sep Oct Nov Dec
Advanced economies Oil exporters
All EMs High spread EMs
Depreciation against
the dollar

EM Policy Responses to Market Pressures Have Varied
EM policy responses have included policy rate hikes…
Changes in Actual and Expected Policy Rates
(changes from 3/30/18 to 11/07/18; basis points)
…and foreign exchange market interventions
11
-75
-50
-25
0
25
50
Oct-14 Jul-15 Apr-16 Jan-17 Oct-17 Jul-18
Latin America
EM Asia
CEEMEA
14 EMs excluding China
Reserves Operations
(US$ bn)
Note: In Argentina, the monetary regime was changed on October 1.
-150
-100
-50
0
50
100
150
200
250
300
350
Bra
zil
Chin
a
Mala
ysia
Pola
nd
Colo
mbia
Thaila
nd
Chile
Rom
ania
India
Hunga
ry
Phili
ppin
es
South
Afr
ica
Indon
esia
Mexic
o
Turk
ey
Russia
Arg
entina
Change in forward policy rate forend-2019
Change in actual policy rate
1125
1682
3275
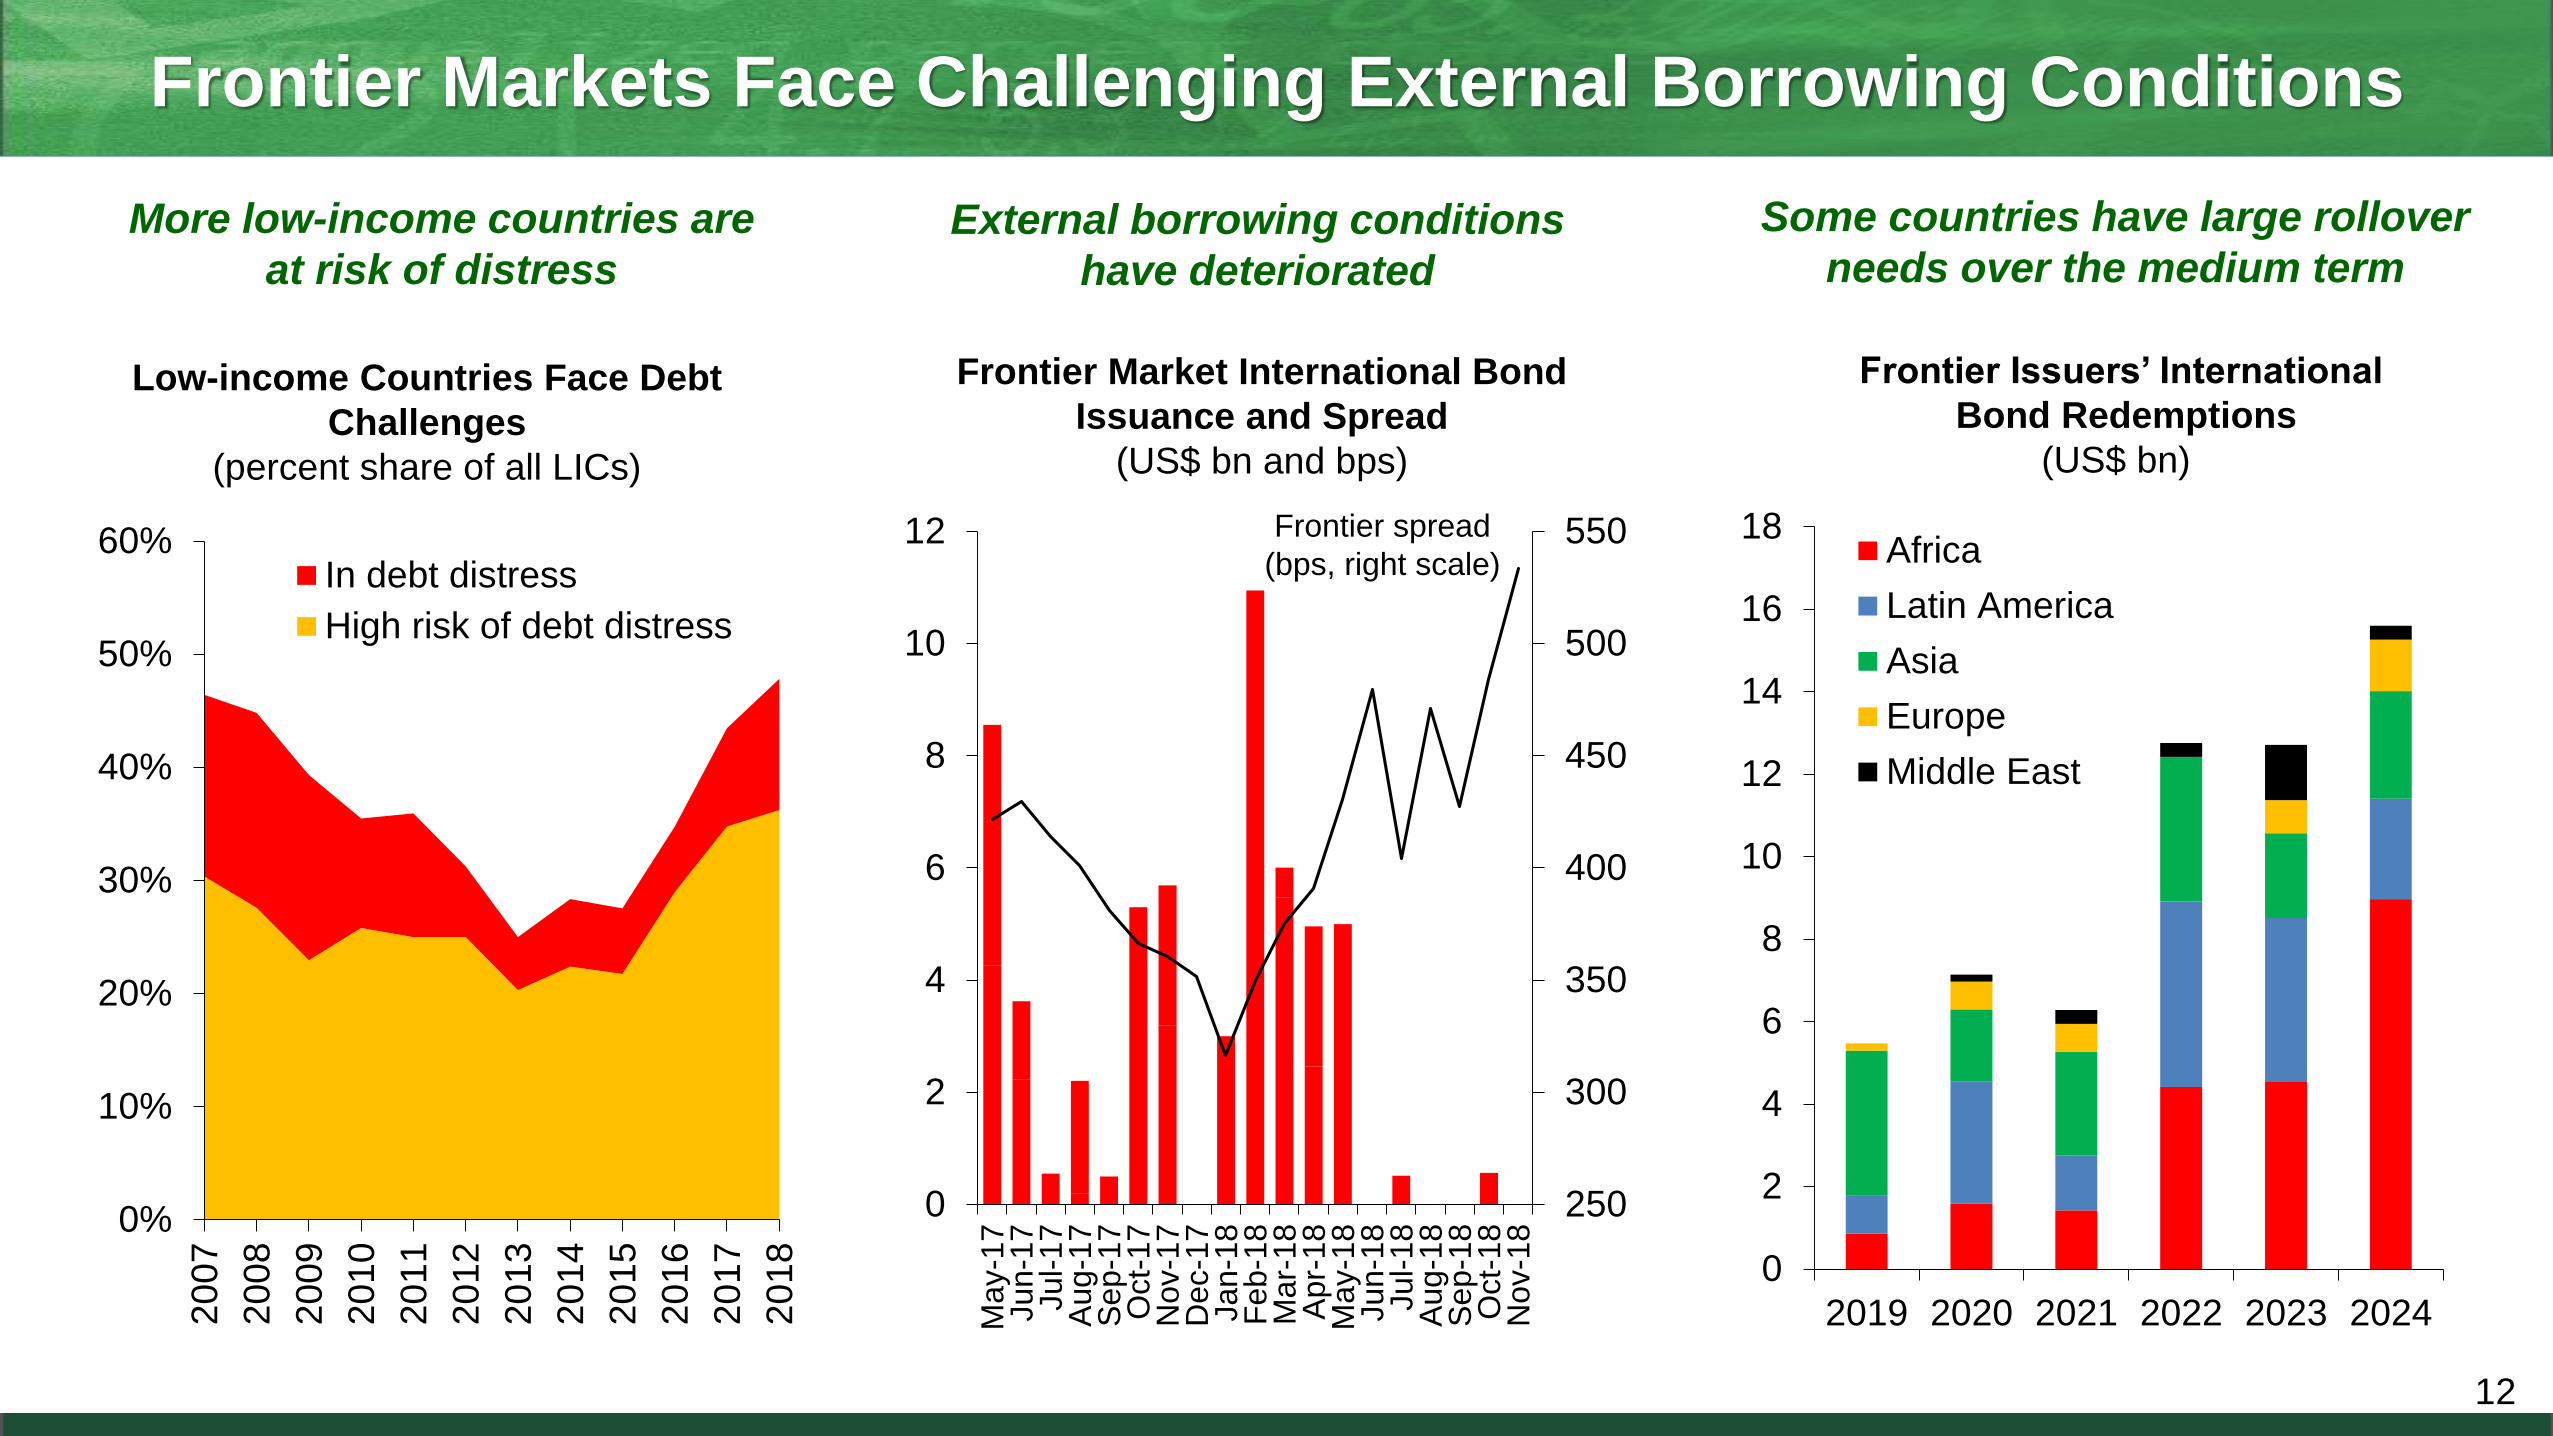
Frontier Markets Face Challenging External Borrowing Conditions
12
Frontier Market International Bond
Issuance and Spread
(US$ bn and bps)
Frontier Issuers’ International
Bond Redemptions
(US$ bn)
Low-income Countries Face Debt
Challenges
(percent share of all LICs)
More low-income countries are
at risk of distress
External borrowing conditions
have deteriorated
Some countries have large rollover
needs over the medium term
0
2
4
6
8
10
12
14
16
18
2019 2020 2021 2022 2023 2024
Africa
Latin America
Asia
Europe
Middle East
0%
10%
20%
30%
40%
50%
60%
20
07
20
08
20
09
20
10
20
11
20
12
20
13
20
14
20
15
20
16
20
17
20
18
In debt distress
High risk of debt distress
250
300
350
400
450
500
550
0
2
4
6
8
10
12
Ma
y-1
7Ju
n-1
7Ju
l-1
7A
ug
-17
Se
p-1
7O
ct-
17
No
v-1
7D
ec-1
7Ja
n-1
8F
eb
-18
Ma
r-18
Ap
r-18
Ma
y-1
8Ju
n-1
8Ju
l-1
8A
ug
-18
Se
p-1
8O
ct-
18
No
v-1
8
Frontier spread
(bps, right scale)

FINANCIAL VULNERABILITIES
13
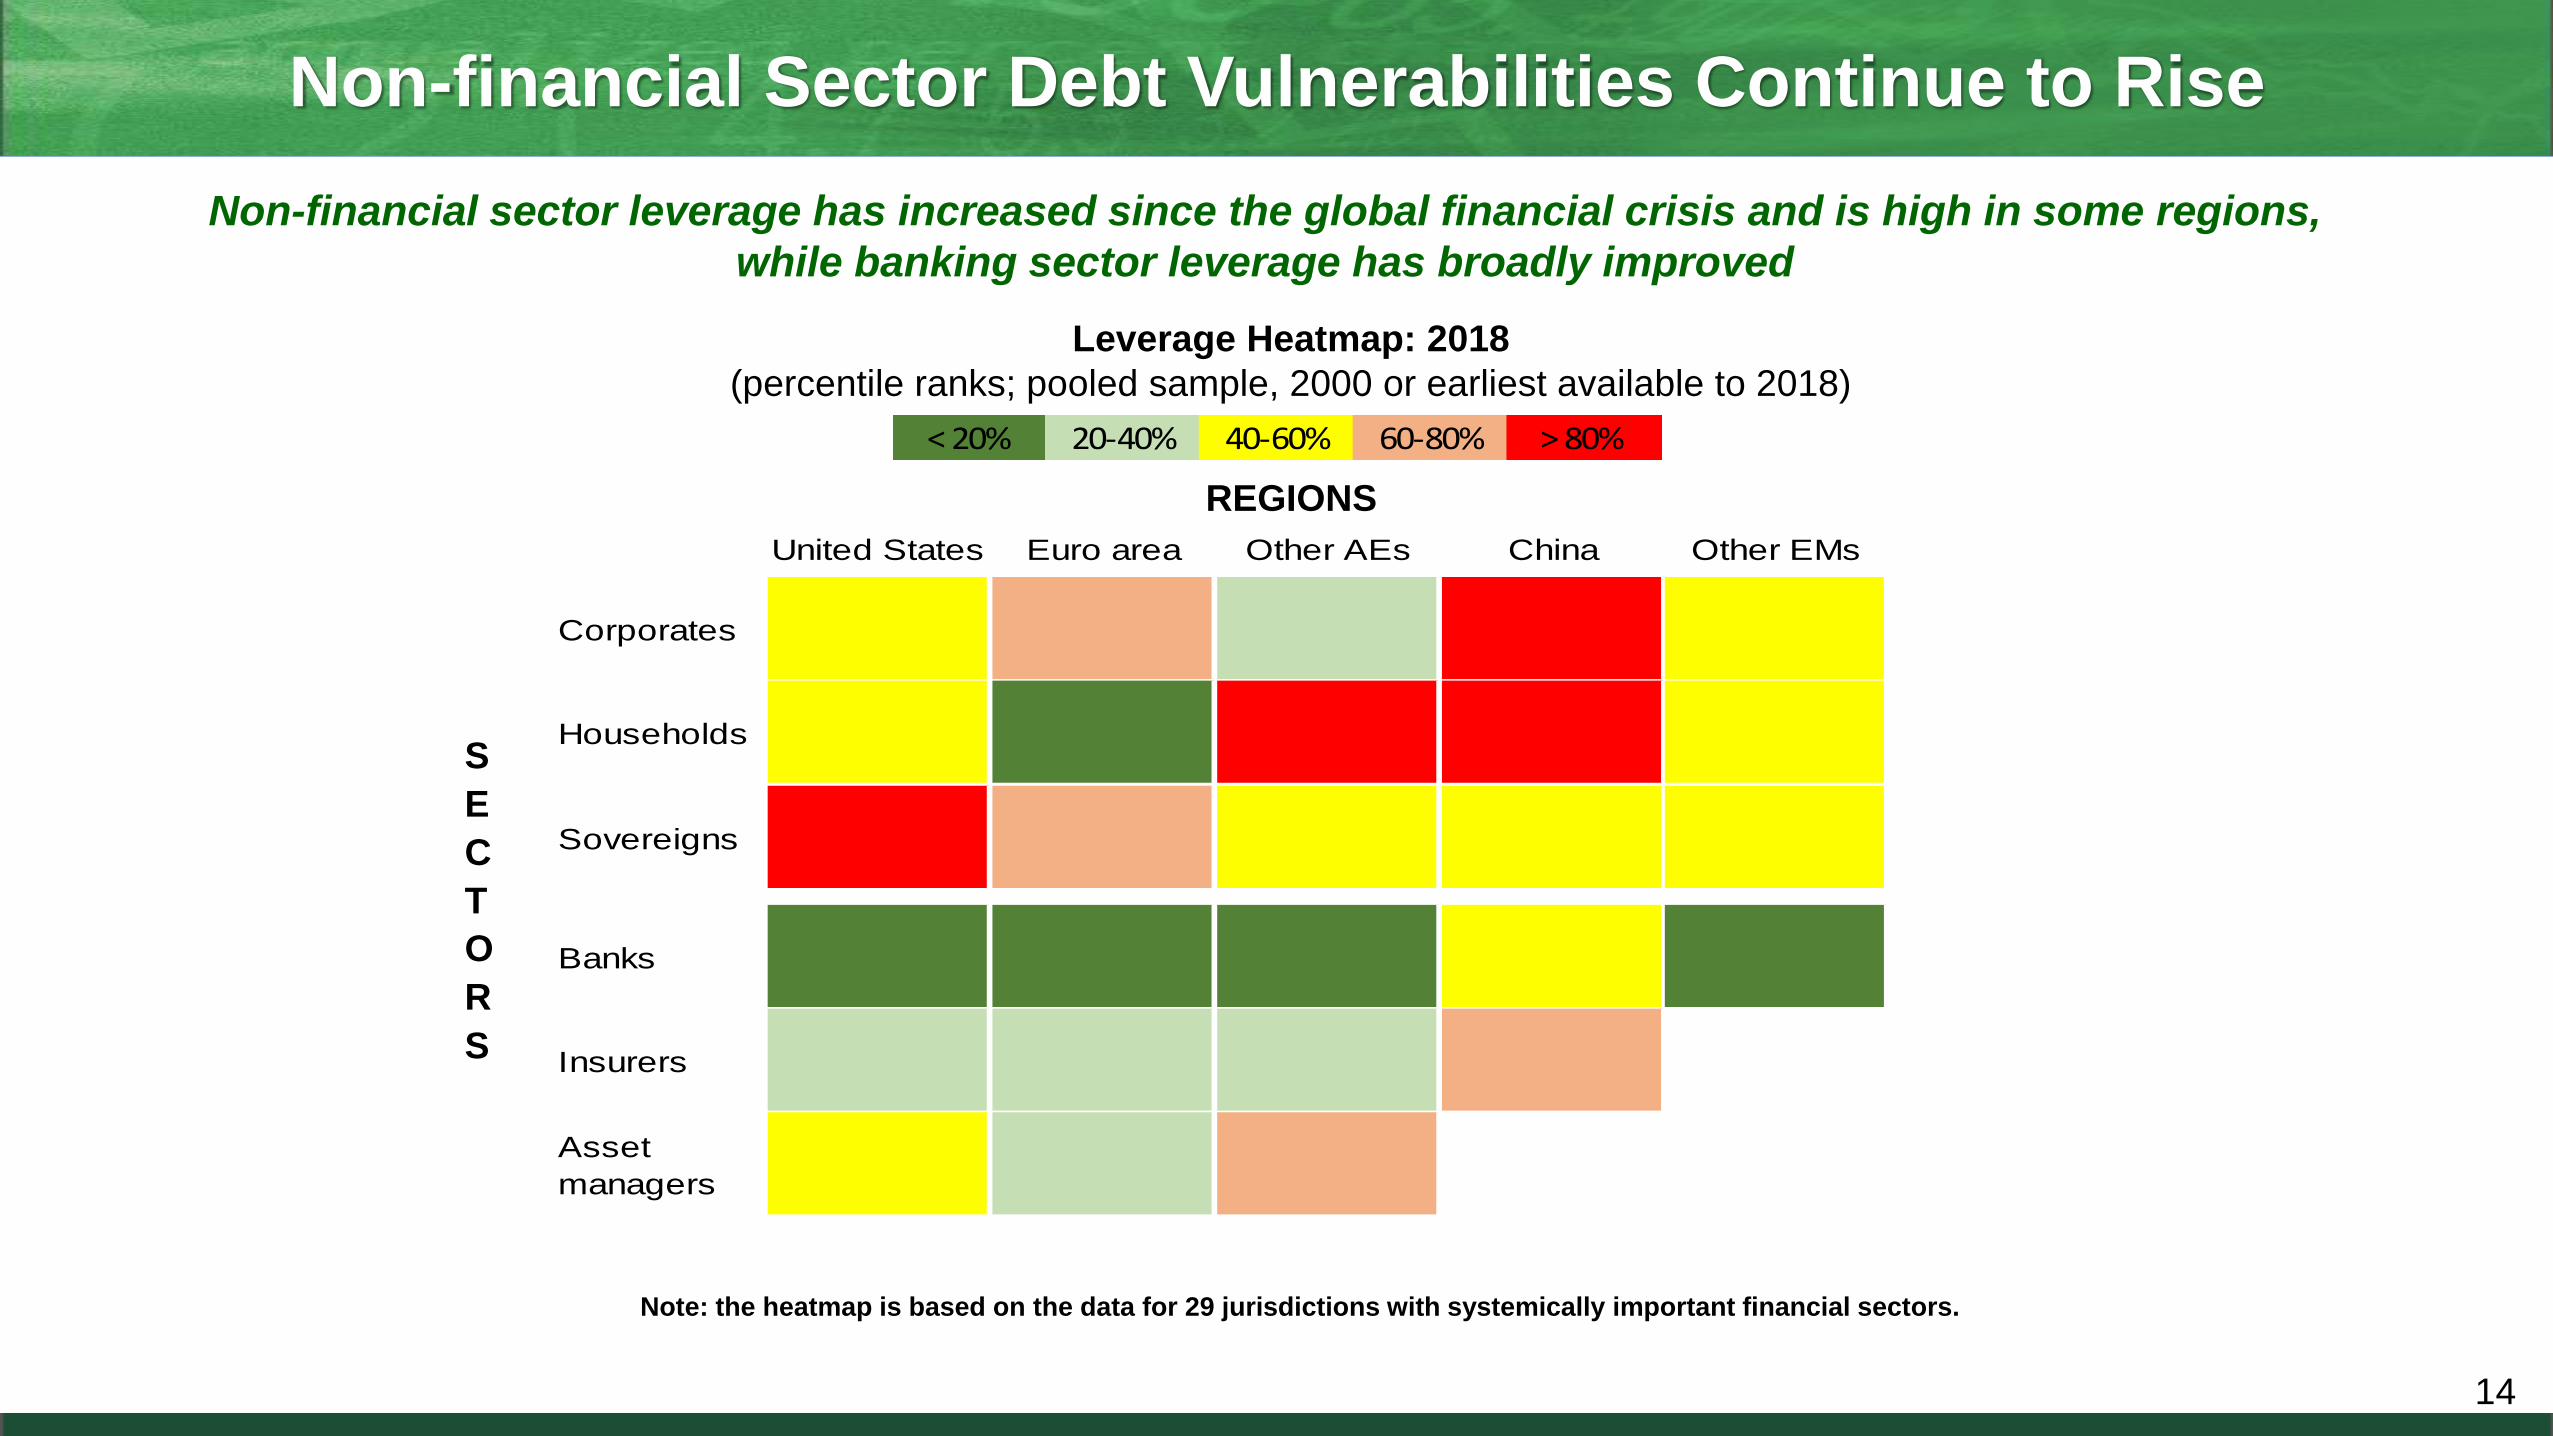
Non-financial Sector Debt Vulnerabilities Continue to Rise
14
Leverage Heatmap: 2018
(percentile ranks; pooled sample, 2000 or earliest available to 2018)
REGIONS
Non-financial sector leverage has increased since the global financial crisis and is high in some regions,
while banking sector leverage has broadly improved
S
E
C
T
O
R
S
Note: the heatmap is based on the data for 29 jurisdictions with systemically important financial sectors.
United States Euro area Other AEs China Other EMs
Corporates
Households
Sovereigns
Banks
Insurers
Asset
managers
< 20% 20-40% 40-60% 60-80% > 80%

Banks’ Exposure to Opaque and Illiquid Assets a Concern
15
... but these holdings are still large relative
to capital of some G-SIBs.
Note: the vertical axis shows the estimated loss (in percent) on Level 2 and Level 3
assets that would result in a 1 percentage point reduction in each bank’s leverage ratio.
Exposure to Level 2 and Level 3 Asset, 2018
(percent)
0
2
4
6
8
10
12
14
16
18
20
0 2 4 6 8 10 12
North America
Euro area
Other Europe
Asia and Pacific
Level 2 and Level 3 assets to Basel III Tier 1 capital (times)
0
1
2
3
4
5
6
7
8
9
10
2014 2015 2016 2017 2018
Other
Europe
Asia and Pacific
North
America
Euro
area
G-SIB Holdings of Level 2 and Level 3 Assets
(Multiple of Basel III Tier 1 capital)
G-SIB holdings of illiquid assets have fallen …

EM Vulnerabilities Need to Be Carefully Monitored
16
Emerging Markets: Key Risks and Vulnerabilities
VulnerabilitiesRisks Buffers
Faster monetary policy normal-
ization in advanced economies
• Strong U.S. dollar
• Rising interest rates
Political risks
• Trade tensions
• Policy uncertainty
Contagion
• High leverage
• Large external financing needs
• Short-term foreign currency debt
• Flighty investors
• Trade exposures
• Sound policy frameworks
• Foreign exchange reserves
• Fiscal buffers
• Deep and liquid local markets
• Strong local investor base

30
50
70
90
110
19
95
19
97
19
99
20
01
20
03
20
05
20
07
20
09
20
11
20
13
20
15
20
17
75th 90th Median
High Public and External Debt Are Key Vulnerabilities for EMs
17
Global
Financial
Crisis
90
140
190
240
290
340
390
440
19
95
19
97
19
99
20
01
20
03
20
05
20
07
20
09
20
11
20
13
20
15
20
17
75th 90th Median
0
20
40
60
80
100
120
19
95
19
97
19
99
20
01
20
03
20
05
20
07
20
09
20
11
20
13
20
15
20
17
10th 25th Median
Government Debt to GDP Reserves to ARA Metric 1/External Debt to Exports
Public debt and external debt ratios have increased across many EMs since the global financial crisis,
while FX reserve ratios have remained close to the pre-crisis levels
Notes: all ratios in percent. Red shades show the weakest percentiles of all EMEs for each vulnerability metric.
1/ The ARA metric reflects potential balance-of-payment FX liquidity needs in adverse circumstances and is used to assess adequacy of FX reserves against potential FX liquidity
drains (see IMF Policy Paper, 2015 “Assessing Reserve Adequacy-Specific Proposals.”)

China: Deleveraging and De-risking Progress
18
Regulatory tightening has slowed the
buildup of risks in financial sector…
Investment Products and Small-to-Medium
Bank Claims on Financial Institutions
(Three-month change, trillions of renminbi)
Corporate Defaults and Corporate
Bond Spreads
(Billions of renminbi, basis points)
… and led to tighter credit
conditions for weaker borrowers…
Leverage at Nonfinancial Traded
Companies
(Top 100 Chinese firms by assets)
… but the deleveraging process is
far from complete.
Note: Leverage is measured as the ratio of liabilities to
common equity.
-4
-2
0
2
4
6
8
2015 16 17 18
Investment products
Bank intrafinancial sector claims
4.0
4.5
5.0
5.5
6.0
6.5
2010 2011 2012 2013 2014 2015 2016 2017 2018:Q1 2018:Q2
0
5
10
15
20
25
30
35
40
45
200
250
300
350
400
450
500
2014 2015 2016 2017 2018
Annual defaulted bonds (billions of renminbi, right scale)
2018 pace (billions of renminbi, annualized, right scale)
Yield spread of AA- bonds to five-year government bonds(basis points, left scale)

Liquidity Risk in the Chinese Bond Market
19
Trading turnover fluctuates more than
in other countries…
Annual Growth in 3-Month Average Bond
Trading Volumes, by Country and Bond Type
(Percent)
Rolling 60-day Sum of Daily Bond
Trading to Outstanding Total and
One-Month SHIBOR interbank Rate
… and volumes tend to fall when
interbank rates rise.
Repo Borrowing Outstanding and
Trading Volumes
(Trillions of Renminbi)
Trading volumes decline poses risks
given growing short-term borrowing
-100
-50
0
50
100
150
200
250
300
2013 2014 2015 2016 2017 2018
US government China government
US corporate China corporate
0.0
0.2
0.4
0.6
0.8
1.0
0
2
4
6
8
10
12
60-day bond
turnover ratio
(right scale)
Interbank
yield
(left scale)
>1.5x standard
deviation 60-day
move in bond yields
0
2
4
6
8
10
12
Total short-term borrowing
Average daily trading volume
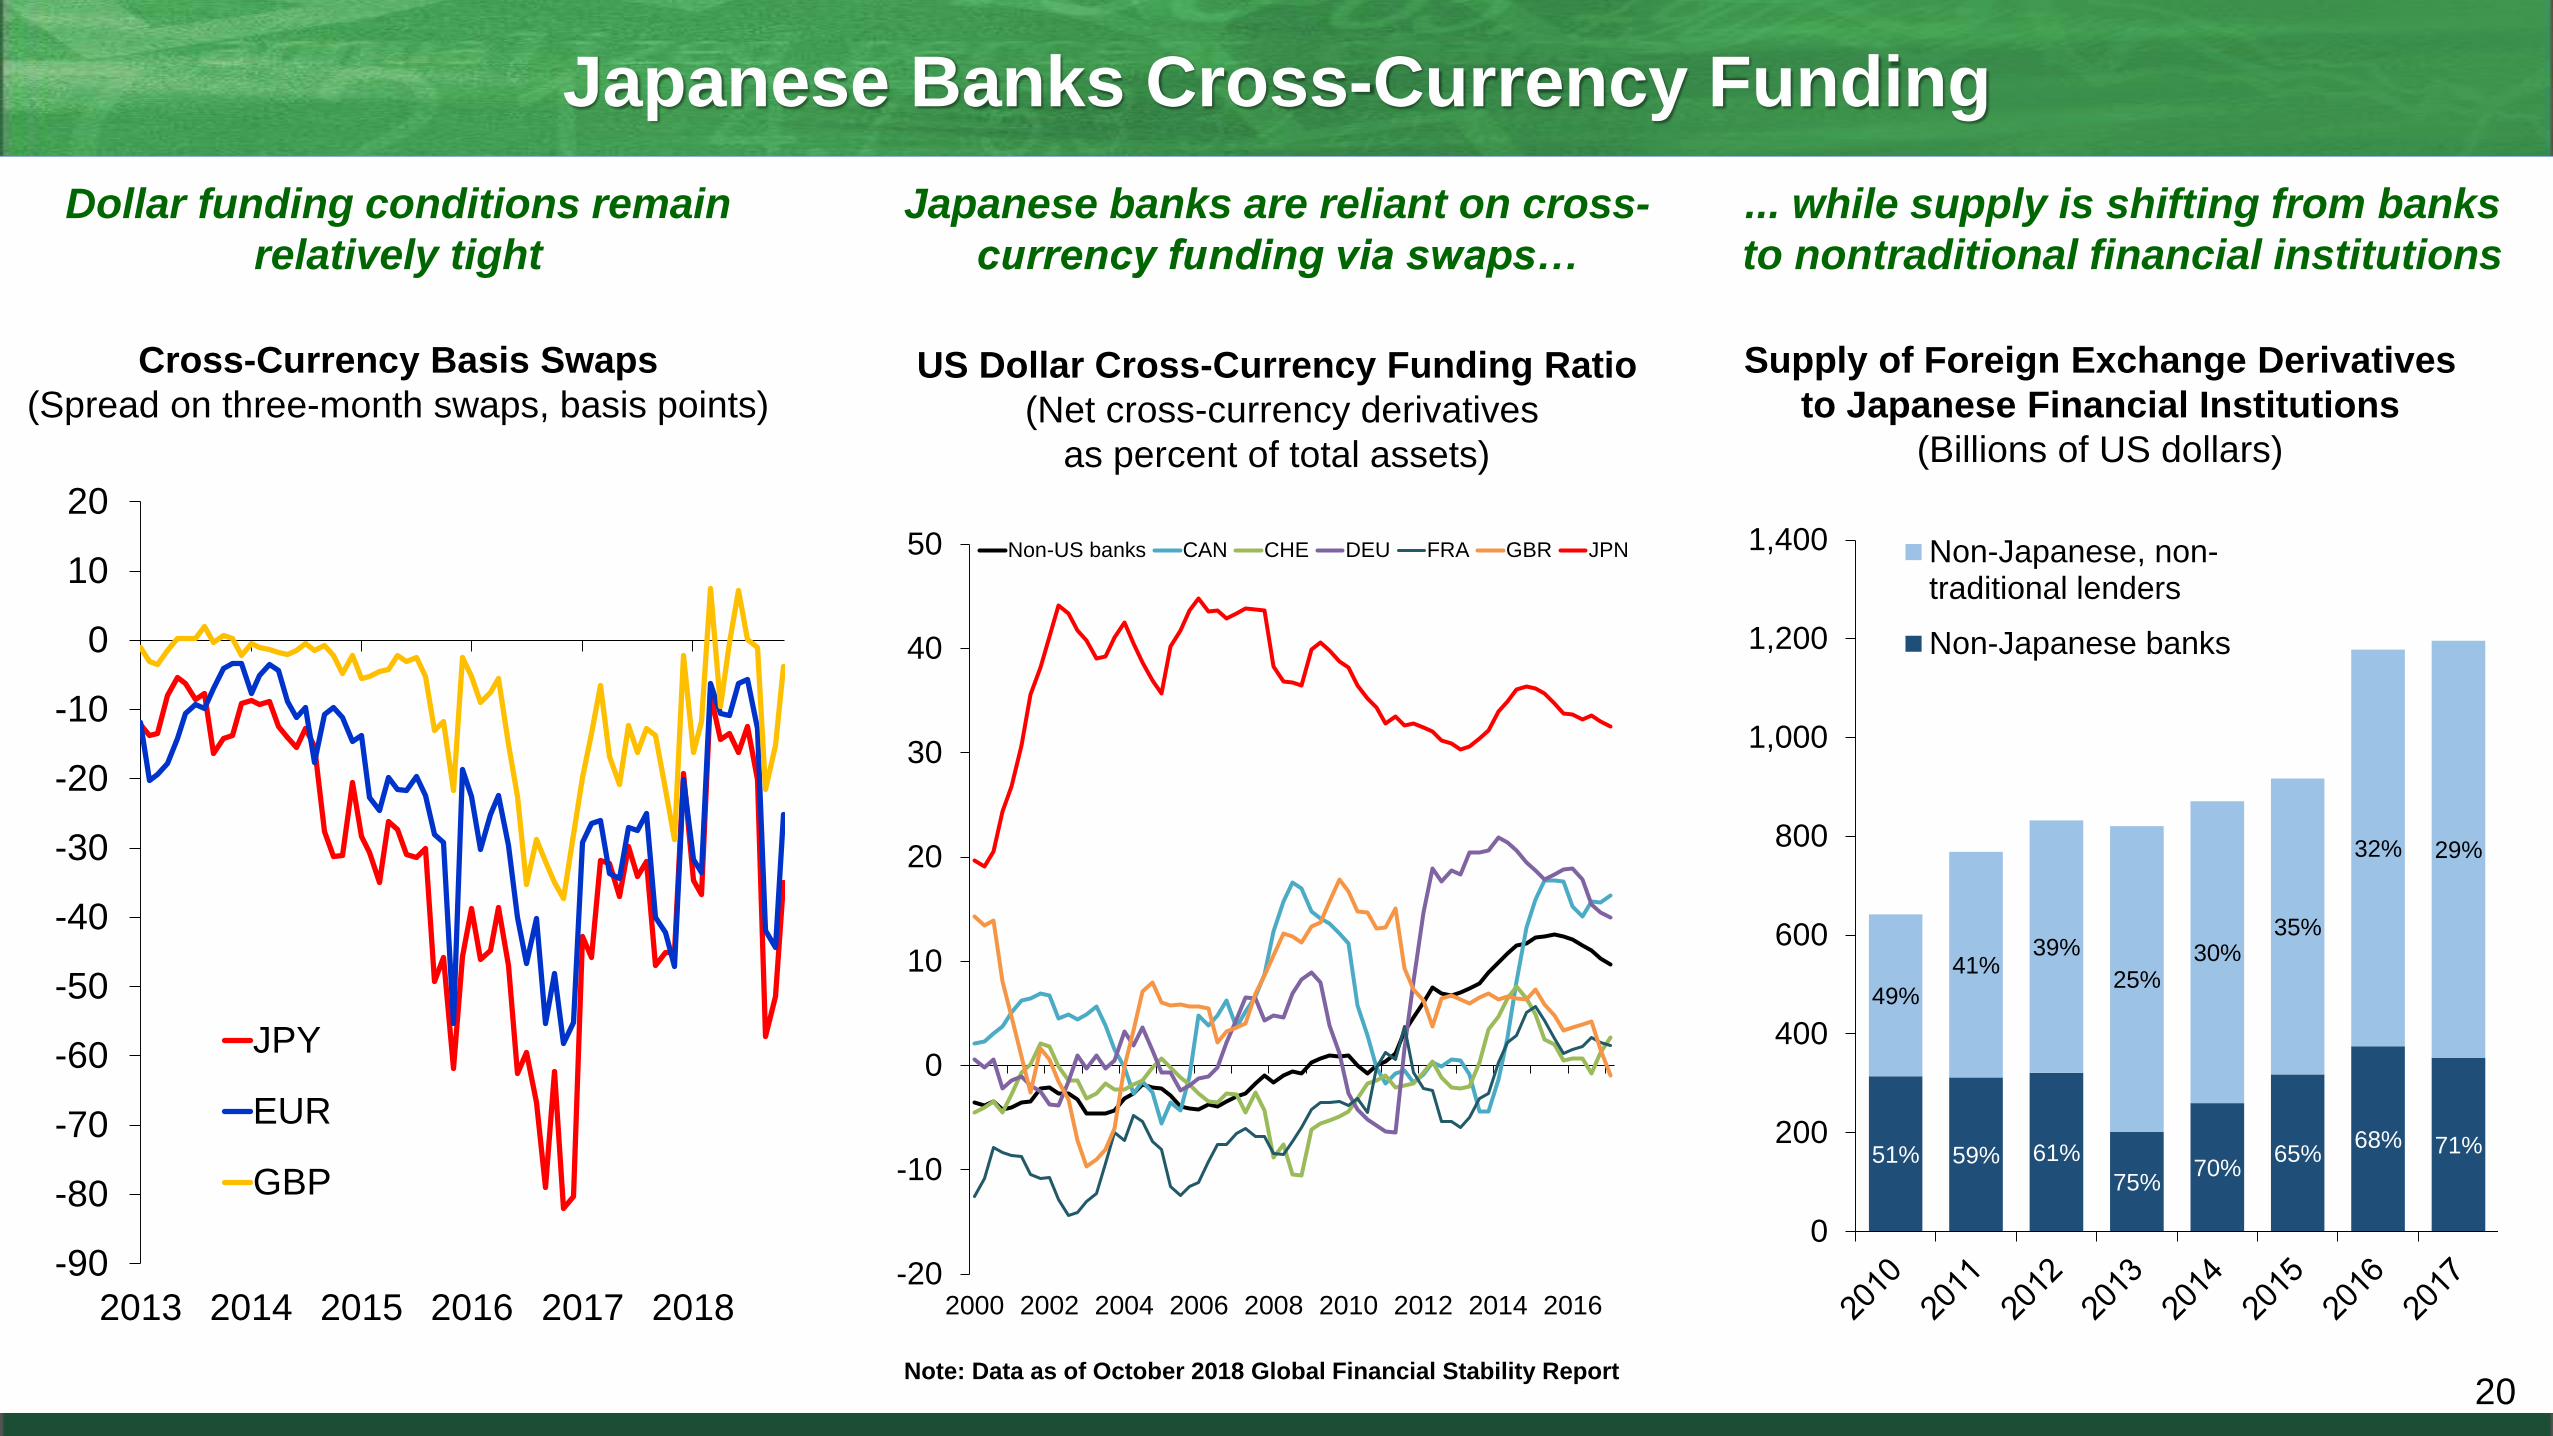
Japanese Banks Cross-Currency Funding
20
Japanese banks are reliant on cross-
currency funding via swaps…
US Dollar Cross-Currency Funding Ratio
(Net cross-currency derivatives
as percent of total assets)
Cross-Currency Basis Swaps
(Spread on three-month swaps, basis points)
Dollar funding conditions remain
relatively tight
Supply of Foreign Exchange Derivatives
to Japanese Financial Institutions
(Billions of US dollars)
... while supply is shifting from banks
to nontraditional financial institutions
Note: Data as of October 2018 Global Financial Stability Report
51% 59% 61%
75%70%
65%68% 71%
49%
41%39%
25%30%
35%
32% 29%
0
200
400
600
800
1,000
1,200
1,400 Non-Japanese, non-traditional lenders
Non-Japanese banks
-20
-10
0
10
20
30
40
50
2000 2002 2004 2006 2008 2010 2012 2014 2016
Non-US banks CAN CHE DEU FRA GBR JPN
-90
-80
-70
-60
-50
-40
-30
-20
-10
0
10
20
2013 2014 2015 2016 2017 2018
JPY
EUR
GBP

FINANCIAL STABILITY RISKS
21

The Outlook for EMs Remains Challenging
22
Adverse scenario assumptions:
• US corporate bond spreads widen
by 100 bps
• US 10-years bond yields fall 30 bps
• The US dollar rises 5 percent
0.0
0.1
0.2
0.3
0.4
0.5
0.6
0.7
0.8
0.9
1.0
-1.5 -1.0 -0.5 0.0 0.5 1.0 1.5 2.0
Baseline
Scenario
5th percentile
A deterioration in the global risk appetite could lead to larger portfolio outflows from EMs
Portfolio flows in percent of EM GDP
Baseline and Adverse Scenarios:
Near-Term Debt Portfolio Flows Forecast Densities

0.0
0.1
0.2
0.3
0.4
0.5
0.6
0.7
0.8
-1.5 0.5 2.5 4.5 6.5
Baseline
Trade scenario
1.5 ppts
An Escalation of Trade Tensions Could Raise Financial Stability Risks
23
Near Term Medium Term
WEO/GFSR Trade Tensions Scenario: Growth Forecast Densities
Global GDP growth rate (percent)
0
0.1
0.2
0.3
0.4
0.5
0.6
0.7
0.8
-1.5 0.5 2.5 4.5 6.5
Baseline
Trade scenario with persistent financialconditions shock
Global GDP growth rate (percent)

An Increase in Policy Uncertainty Could Trigger A Risk-off Sentiment
25
Markets remain concerned about
fiscal policy uncertainty in Italy…
…and redenomination risk
Italian Sovereign Spreads and Bank Equities Italy Redenomination Risk
(CDS spread difference between ISDA ’03 and ‘14 definitions, bps)
0
20
40
60
80
100
120
2016 2017 2018
Italy
France
Spain
French
presidential
elections
Italian
general
elections
0.5
0.6
0.7
0.8
0.9
100
150
200
250
300
350
Jan Feb Mar Apr May Jun Jul Aug Sep Oct Nov Dec
10-year Bond Spreadover Bunds (bps, LHS)
Italian Banks Price-to-Book (RHS)

Large Financial Sector Exposure to the Sovereign is a Concern
25
… and these risks are not limited to
banking institutions
Insurers’ Exposure to Southern European
Sovereigns, 2017Q4
(Percent of capital)
… but risks from growing
“sovereign-bank” nexus are rising…
Banking System Exposure to Domestic
Governments, 2018
(Percent of assets)
Note: Based on the latest available data in 2018. The size of
the circles is proportional to the banking systems’ exposure
to their domestic government (relative to assets)
Bank balance sheet weaknesses
are gradually being addressed…
Italian Banks: Non-Performing Loans
(Percent of total bank loans)
0.0
4.0
8.0
12.0
16.0
20.0
20
05
Q4
20
06
Q3
20
07
Q2
20
08
Q1
20
08
Q4
20
09
Q3
20
10
Q2
20
11
Q1
20
11
Q4
20
12
Q3
20
13
Q2
20
14
Q1
20
14
Q4
20
15
Q3
20
16
Q2
20
17
Q1
20
17
Q4
ITAPRT
JPNBEL
ESP
USA
GRCKOR
CHE
IRL
DEU
GBRFRA0
2
4
6
8
10
12
14
0 100 200 300 400 500 600
Domestic sovereign CDS spread (basis points)
Asia and Pacific
Euro area
North America
Other Europe
0
50
100
150
200
250
300
ITA ESP PRT GRC
Domestic
Cross-border
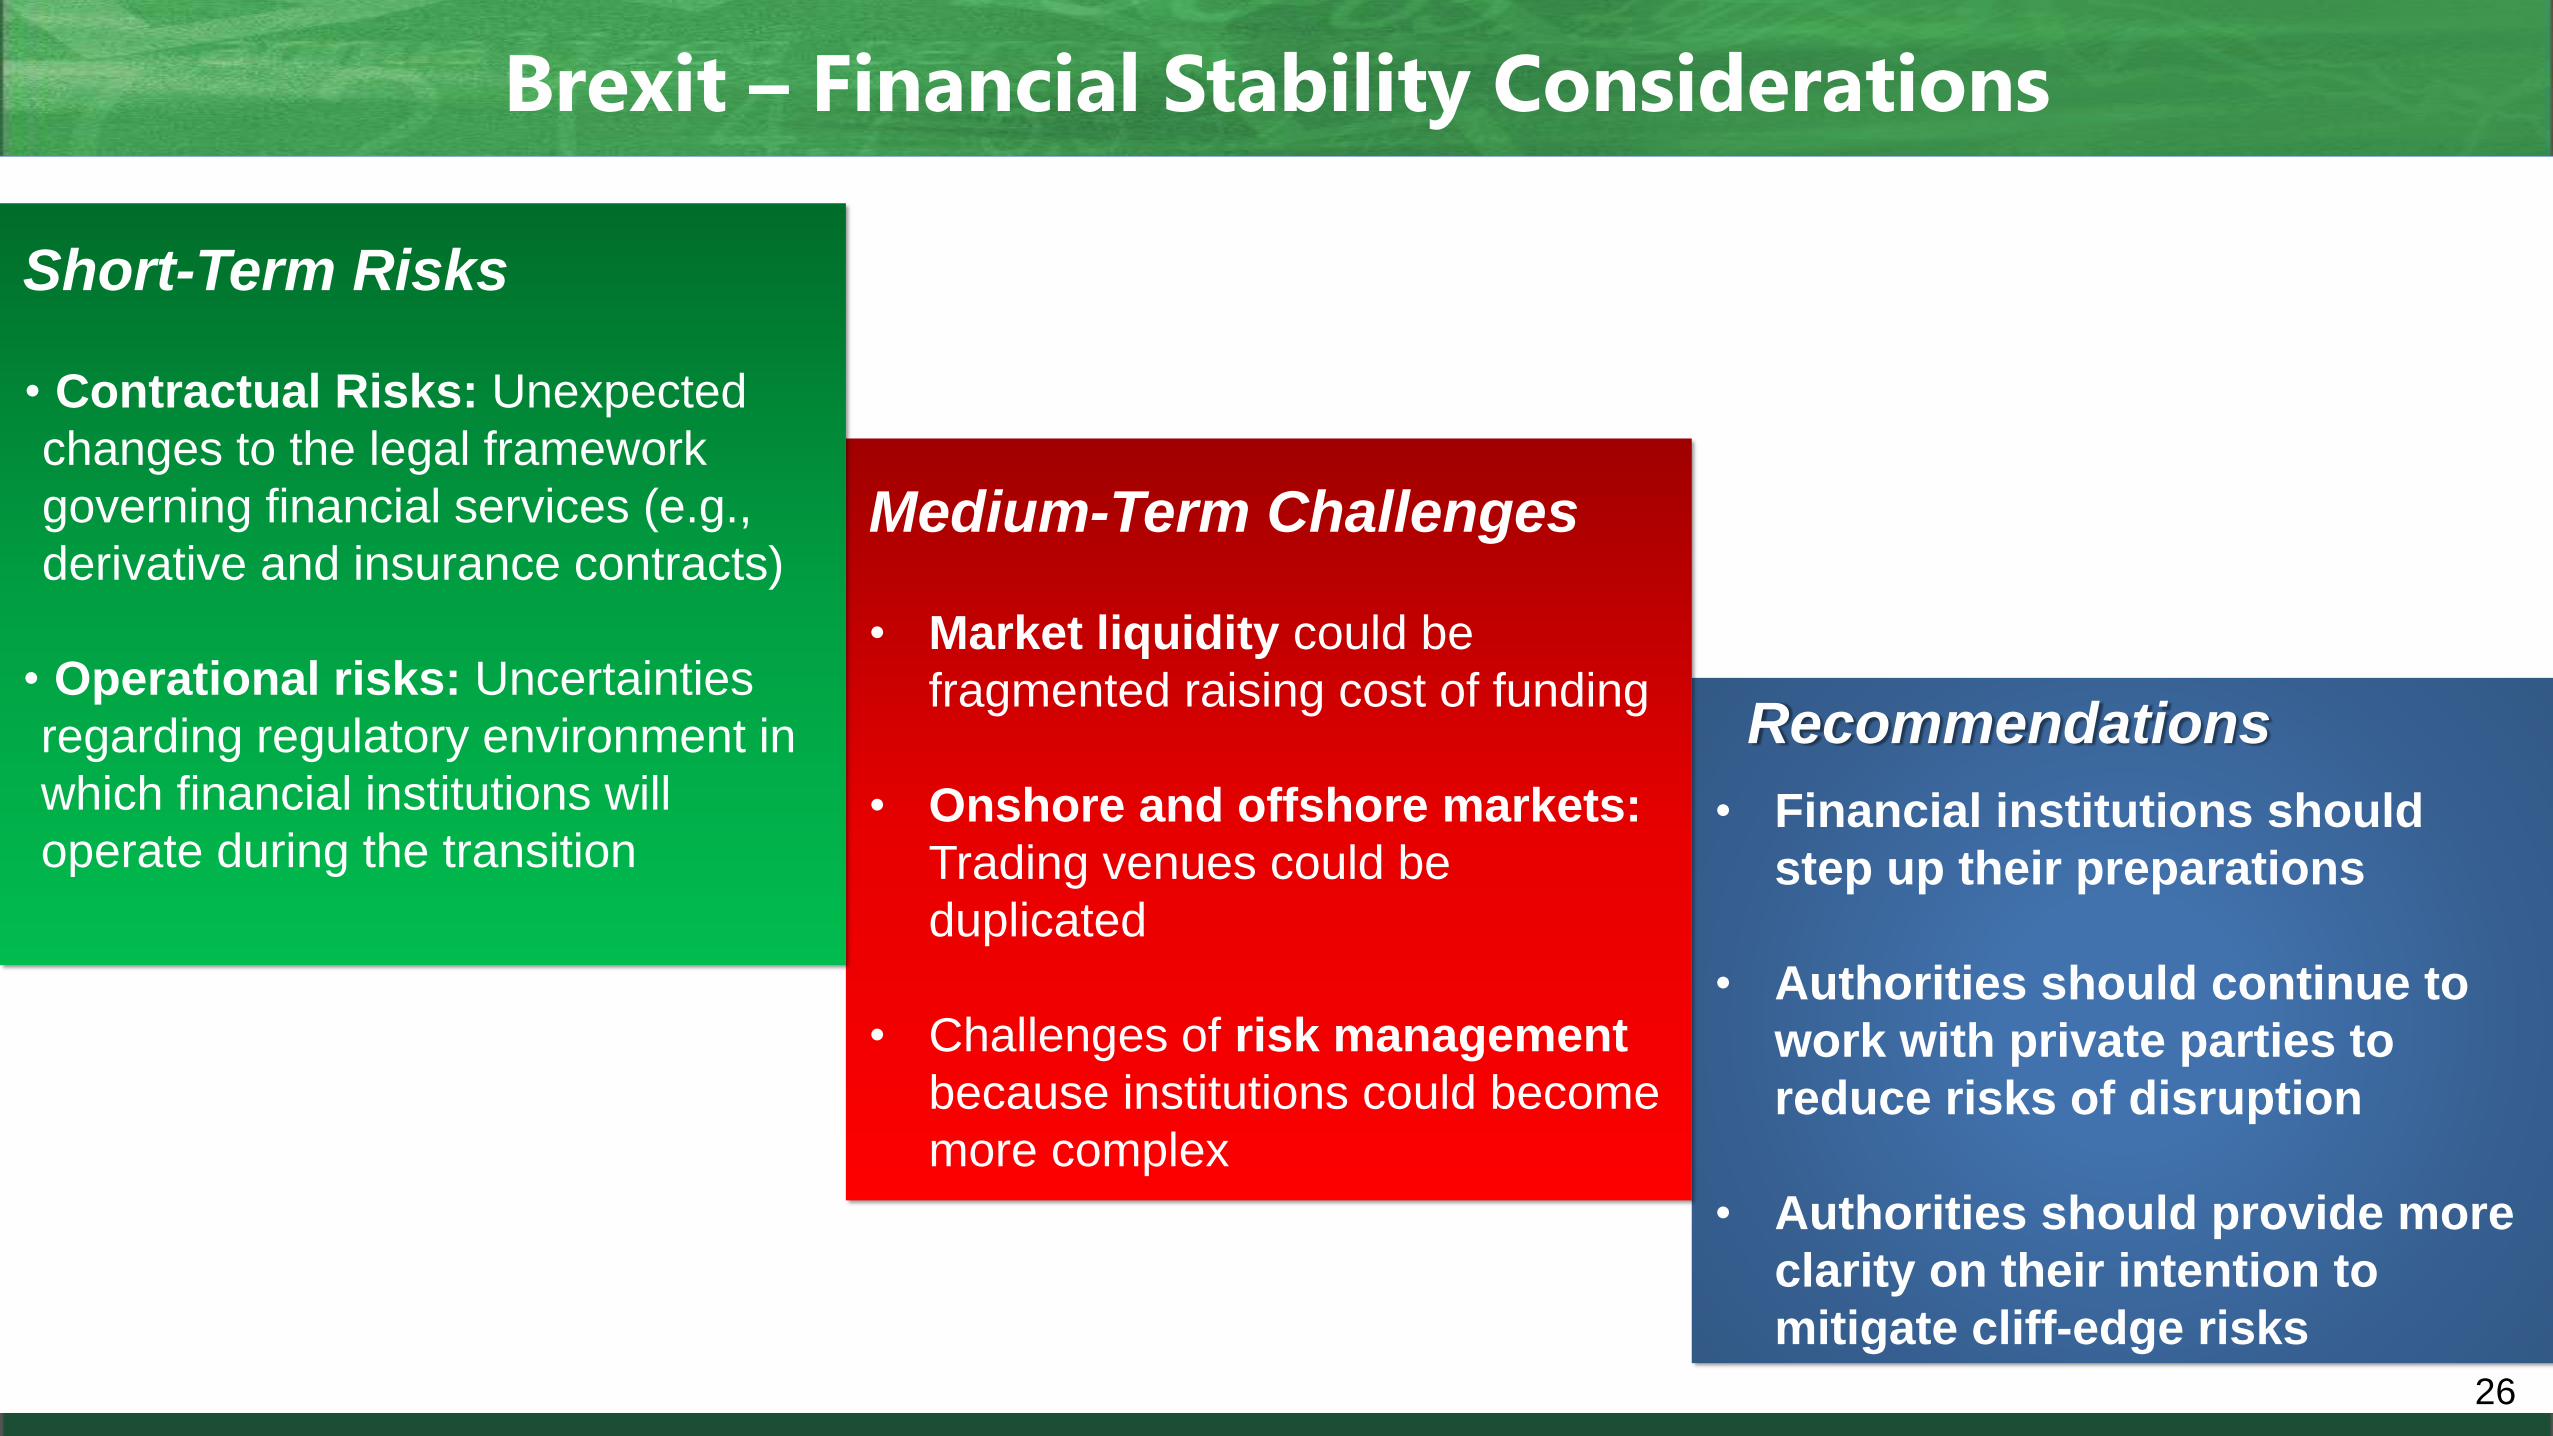
Brexit – Financial Stability Considerations
Recommendations
• Financial institutions should
step up their preparations
• Authorities should continue to
work with private parties to
reduce risks of disruption
• Authorities should provide more
clarity on their intention to
mitigate cliff-edge risks
Medium-Term Challenges
• Market liquidity could be
fragmented raising cost of funding
• Onshore and offshore markets:
Trading venues could be
duplicated
• Challenges of risk management
because institutions could become
more complex
Short-Term Risks
• Contractual Risks: Unexpected
changes to the legal framework
governing financial services (e.g.,
derivative and insurance contracts)
• Operational risks: Uncertainties
regarding regulatory environment in
which financial institutions will
operate during the transition
26

A DECADE AFTER THE CRISIS: ARE WE SAFER?
27

Regulatory Reform Agenda Is Yet to be Completed and Fully Implemented
28
Quality of Regulation and Supervision Macroprudential Authorities’ Powers
Percent of
banking assets
Compliant
Largely compliant
Materially noncompliant
Capital
Liquidity Percent of countries, 2017
Compel
Comply or explain
Recommend
None

New Risks Need to Be Actively Monitored
29
… and the assets of nonbank financial institutions
have increased
Bank and Other Financial Institutions’ Assets
(percent of GDP)
80
100
120
140
160
180
200
220
240
OFIs Banks
The systemic importance of central counterparties
has grown…
CCPs and Other Counterparties in Derivatives Clearing
(share of different counterparties, percent )
0
10
20
30
40
50
60
20
04
20
05
20
06
20
07
20
08
20
09
20
10
20
11
20
12
20
13
20
14
20
15
20
16
20
17
Central counterparties
Banks and securities firms
Hedge funds
Other residual financial institutions
Insurance and special purpose vehicles
Note: the remaining two categories, “reporting dealers” and “nonfinancial
institutions”, are not shown in the chart
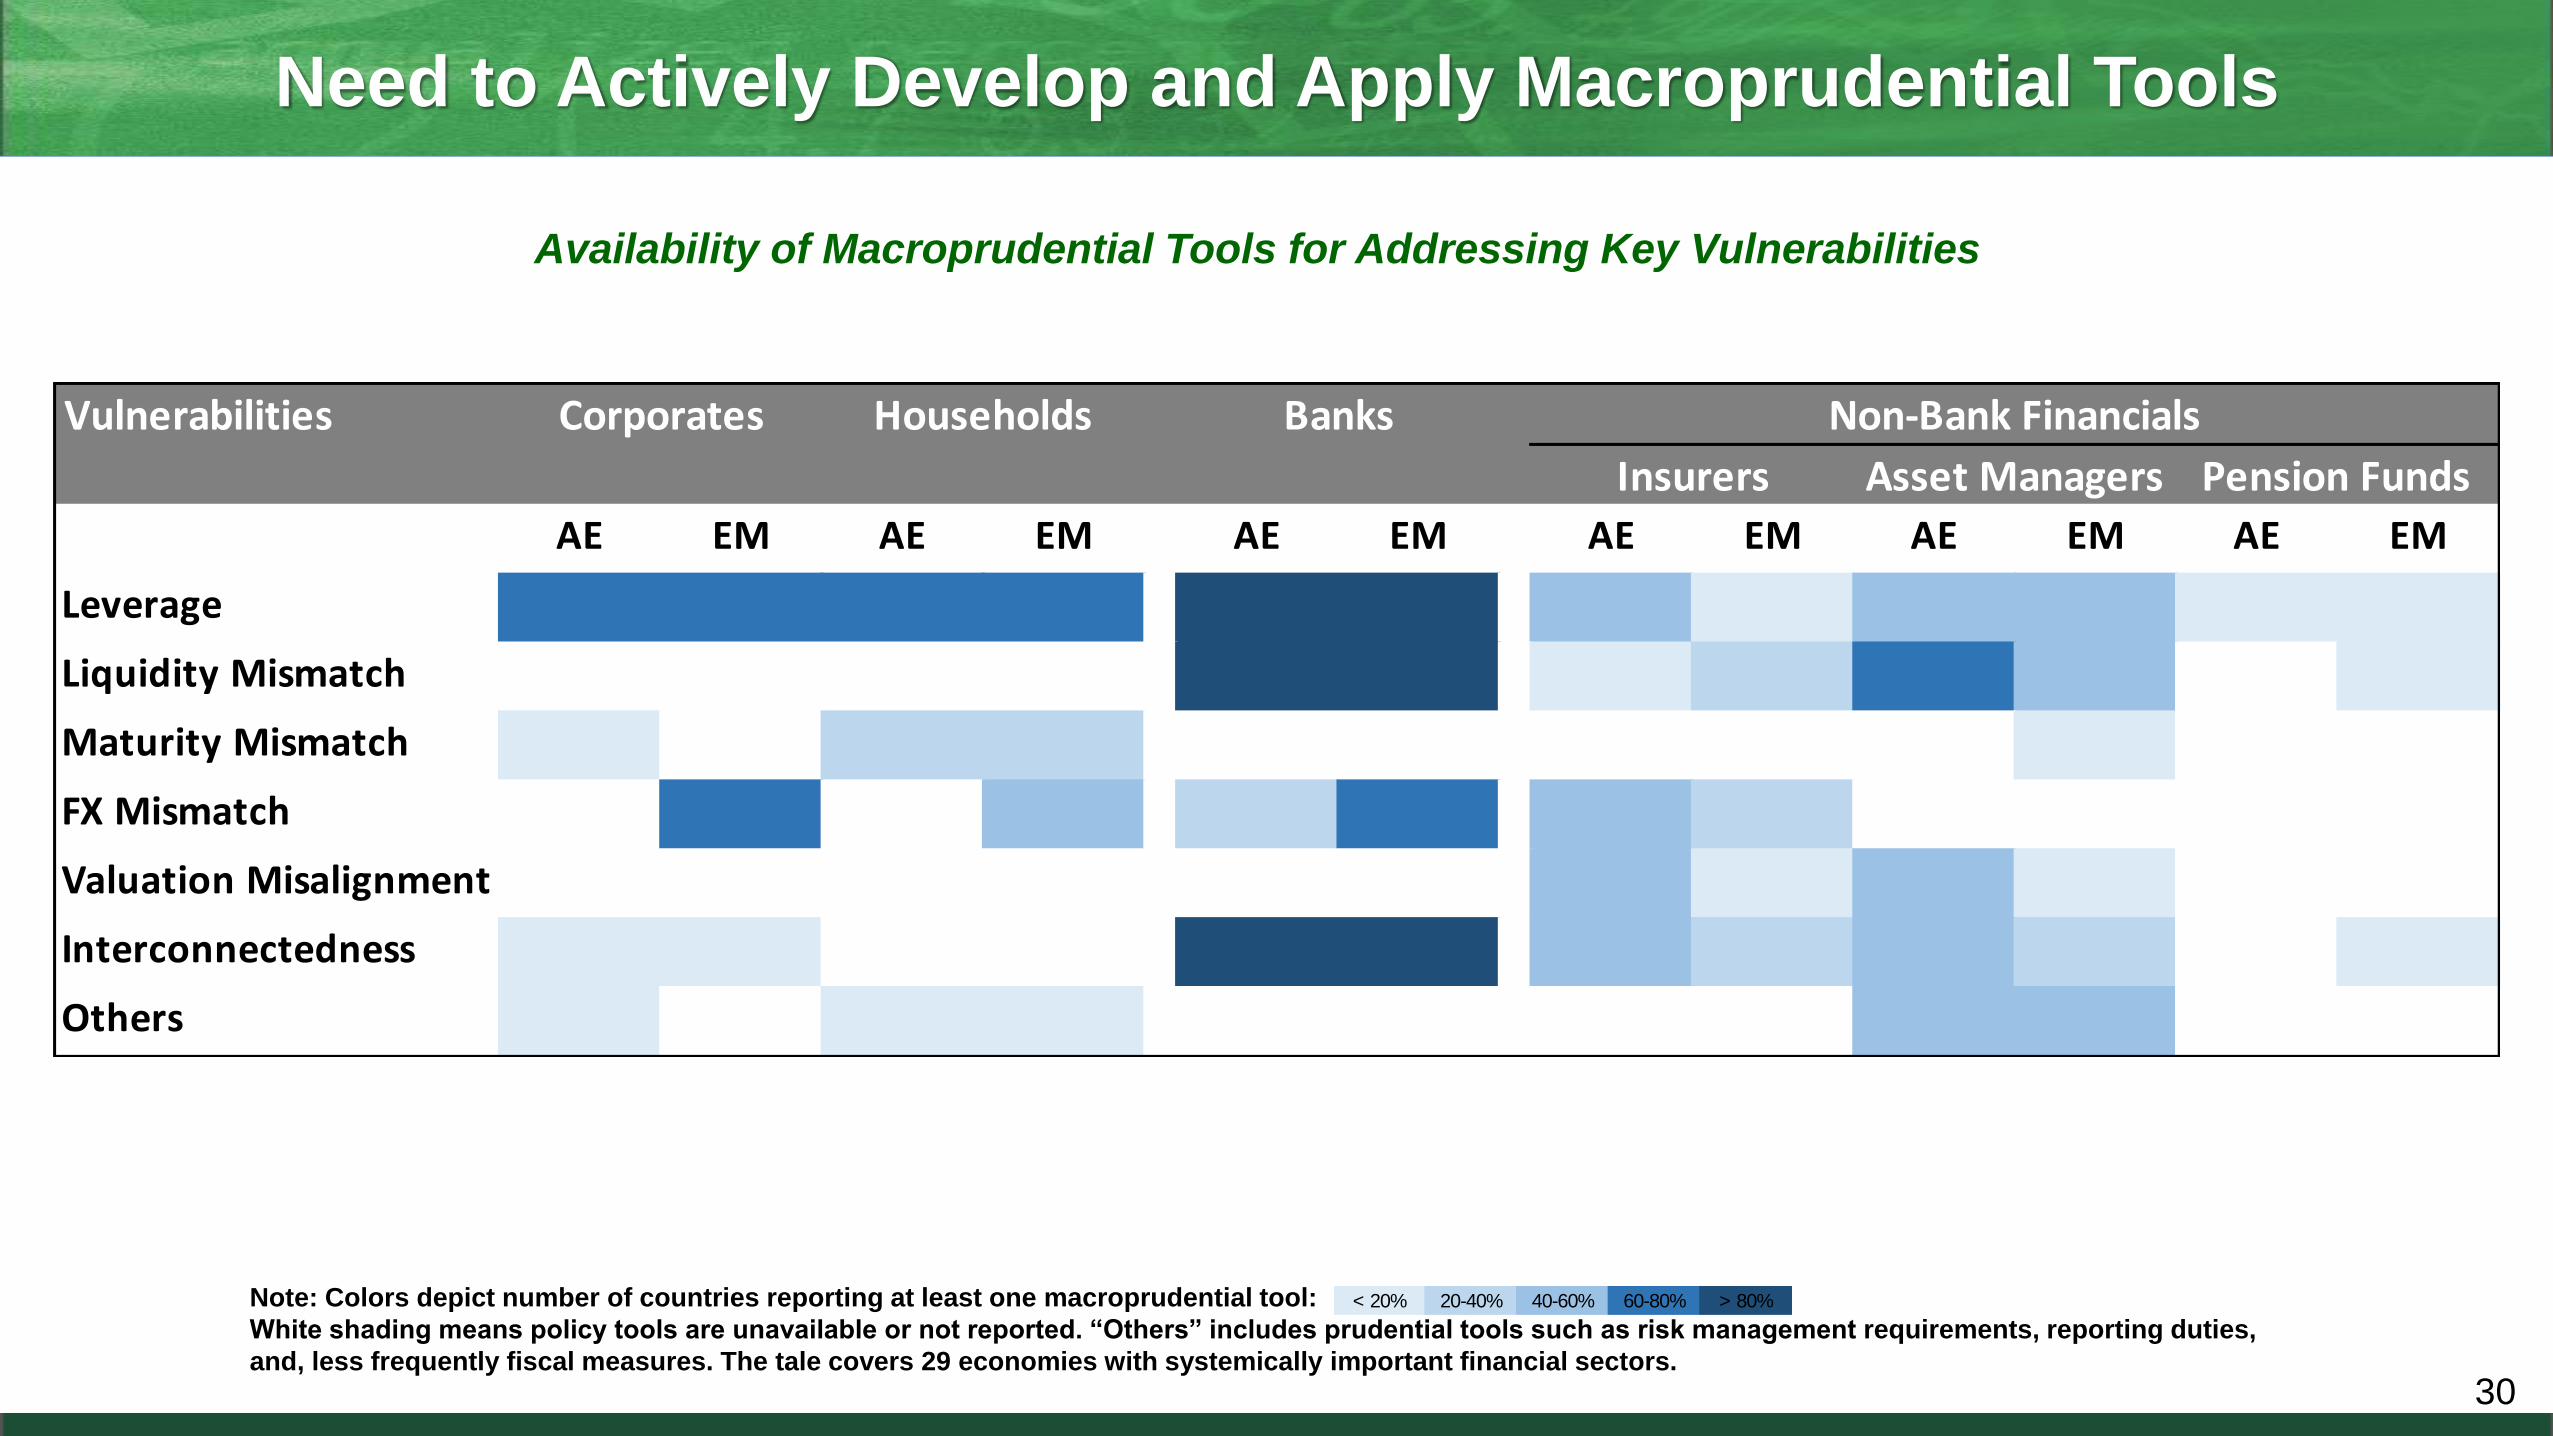
Need to Actively Develop and Apply Macroprudential Tools
30
Availability of Macroprudential Tools for Addressing Key Vulnerabilities
Note: Colors depict number of countries reporting at least one macroprudential tool:
White shading means policy tools are unavailable or not reported. “Others” includes prudential tools such as risk management requirements, reporting duties,
and, less frequently fiscal measures. The tale covers 29 economies with systemically important financial sectors.
< 20% 20-40% 40-60% 60-80% > 80%
Vulnerabilities
AE EM AE EM AE EM AE EM AE EM AE EM
Leverage 14.00 6.00 16.00 5.00 21.00 7.00 13.00 1.00 12.00 4.00 2.00 1.00
Liquidity Mismatch 0.00 0.00 0.00 0.00 21.00 7.00 3.00 2.00 15.00 3.00 0.00 1.00
Maturity Mismatch 1.00 0.00 5.00 2.00 0.00 0.00 0.00 0.00 0.00 1.00 0.00 0.00
FX Mismatch 0.00 5.00 0.00 3.00 7.00 6.00 13.00 2.00 0.00 0.00 0.00 0.00
Valuation Misalignment 0.00 0.00 0.00 0.00 0.00 0.00 12.00 1.00 12.00 1.00 0.00 0.00
Interconnectedness 1.00 1.00 0.00 0.00 22.00 7.00 13.00 2.00 13.00 2.00 0.00 1.00
Others 2.00 0.00 2.00 1.00 0.00 0.00 0.00 0.00 13.00 3.00 0.00 0.00
Corporates Households Banks Non-Bank Financials
Insurers Pension FundsAsset Managers