Embed Size (px)
Citation preview
Vanguard U.S. Stock Index Funds
Mid-Capitalization Portfolios
Vanguard Extended Market Index Fund
Vanguard Mid-Cap Index Fund
Vanguard Mid-Cap Growth Index Fund
Vanguard Mid-Cap Value Index Fund
Annual Report | December 31, 2017
Contents
Please note: The opinions expressed in this report are just that—informed opinions. They should not be considered promisesor advice. Also, please keep in mind that the information and opinions cover the period through the date on the front of thisreport. Of course, the risks of investing in your fund are spelled out in the prospectus.
See the Glossary for definitions of investment terms used in this report.About the cover: Nautical images have been part of Vanguard’s rich heritage since its start in 1975. For anincoming ship, a lighthouse offers a beacon and safe path to shore. You can similarly depend on Vanguard to putyou first––and light the way––as you strive to meet your financial goals. Our client focus and low costs,stemming from our unique ownership structure, assure that your interests are paramount.
Vanguard’s Principles for Investing Success
We want to give you the best chance of investment success. Theseprinciples, grounded in Vanguard’s research and experience, can put you onthe right path.
Goals. Create clear, appropriate investment goals.
Balance. Develop a suitable asset allocation using broadly diversified funds.
Cost. Minimize cost.
Discipline. Maintain perspective and long-term discipline.
A single theme unites these principles: Focus on the things you can control.We believe there is no wiser course for any investor.
Your Fund’s Performance at a Glance. . . . . . . . . . . . . . . . . . 1
Chairman’s Perspective. . . . . . . . . . . . . . . . . . . . . . . . . . . . . 5
Results of Proxy Voting. . . . . . . . . . . . . . . . . . . . . . . . . . . . . 9
Extended Market Index Fund. . . . . . . . . . . . . . . . . . . . . . . . 11
Mid-Cap Index Fund. . . . . . . . . . . . . . . . . . . . . . . . . . . . . . . 36
Mid-Cap Growth Index Fund. . . . . . . . . . . . . . . . . . . . . . . . 60
Mid-Cap Value Index Fund. . . . . . . . . . . . . . . . . . . . . . . . . . 78
Your Fund’s After-Tax Returns. . . . . . . . . . . . . . . . . . . . . . . 99
About Your Fund’s Expenses. . . . . . . . . . . . . . . . . . . . . . . 101
Glossary. . . . . . . . . . . . . . . . . . . . . . . . . . . . . . . . . . . . . . . 104
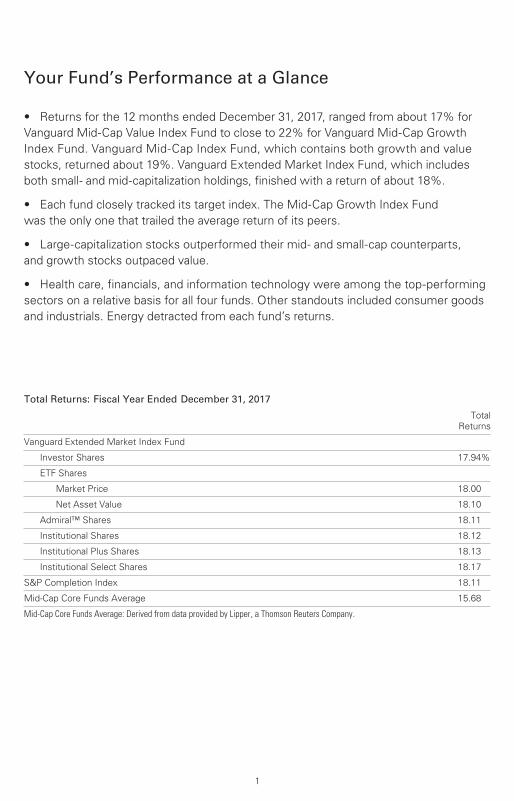
Your Fund’s Performance at a Glance
1
Total Returns: Fiscal Year Ended December 31, 2017
Total Returns
Vanguard Extended Market Index Fund
Investor Shares 17.94%
ETF Shares
Market Price 18.00
Net Asset Value 18.10
Admiral™ Shares 18.11
Institutional Shares 18.12
Institutional Plus Shares 18.13
Institutional Select Shares 18.17
S&P Completion Index 18.11
Mid-Cap Core Funds Average 15.68
Mid-Cap Core Funds Average: Derived from data provided by Lipper, a Thomson Reuters Company.
• Returns for the 12 months ended December 31, 2017, ranged from about 17% for
Vanguard Mid-Cap Value Index Fund to close to 22% for Vanguard Mid-Cap Growth
Index Fund. Vanguard Mid-Cap Index Fund, which contains both growth and value
stocks, returned about 19%. Vanguard Extended Market Index Fund, which includes
both small- and mid-capitalization holdings, finished with a return of about 18%.
• Each fund closely tracked its target index. The Mid-Cap Growth Index Fund
was the only one that trailed the average return of its peers.
• Large-capitalization stocks outperformed their mid- and small-cap counterparts,
and growth stocks outpaced value.
• Health care, financials, and information technology were among the top-performing
sectors on a relative basis for all four funds. Other standouts included consumer goods
and industrials. Energy detracted from each fund’s returns.
2
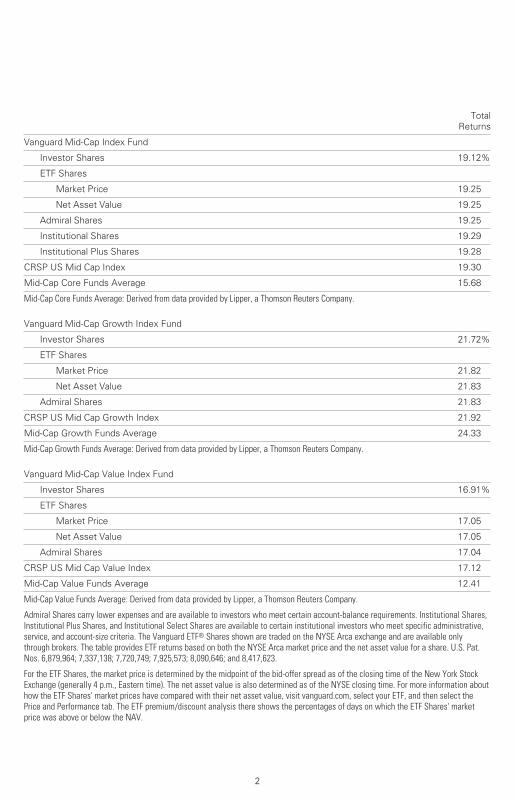
Total Returns
Vanguard Mid-Cap Index Fund
Investor Shares 19.12%
ETF Shares
Market Price 19.25
Net Asset Value 19.25
Admiral Shares 19.25
Institutional Shares 19.29
Institutional Plus Shares 19.28
CRSP US Mid Cap Index 19.30
Mid-Cap Core Funds Average 15.68
Mid-Cap Core Funds Average: Derived from data provided by Lipper, a Thomson Reuters Company.
Vanguard Mid-Cap Growth Index Fund
Investor Shares 21.72%
ETF Shares
Market Price 21.82
Net Asset Value 21.83
Admiral Shares 21.83
CRSP US Mid Cap Growth Index 21.92
Mid-Cap Growth Funds Average 24.33
Mid-Cap Growth Funds Average: Derived from data provided by Lipper, a Thomson Reuters Company.
Vanguard Mid-Cap Value Index Fund
Investor Shares 16.91%
ETF Shares
Market Price 17.05
Net Asset Value 17.05
Admiral Shares 17.04
CRSP US Mid Cap Value Index 17.12
Mid-Cap Value Funds Average 12.41
Mid-Cap Value Funds Average: Derived from data provided by Lipper, a Thomson Reuters Company.
Admiral Shares carry lower expenses and are available to investors who meet certain account-balance requirements. Institutional Shares,Institutional Plus Shares, and Institutional Select Shares are available to certain institutional investors who meet specific administrative,service, and account-size criteria. The Vanguard ETF® Shares shown are traded on the NYSE Arca exchange and are available onlythrough brokers. The table provides ETF returns based on both the NYSE Arca market price and the net asset value for a share. U.S. Pat.Nos. 6,879,964; 7,337,138; 7,720,749; 7,925,573; 8,090,646; and 8,417,623.
For the ETF Shares, the market price is determined by the midpoint of the bid-offer spread as of the closing time of the New York Stock Exchange (generally 4 p.m., Eastern time). The net asset value is also determined as of the NYSE closing time. For more information about how the ETF Shares' market prices have compared with their net asset value, visit vanguard.com, select your ETF, and then select the Price and Performance tab. The ETF premium/discount analysis there shows the percentages of days on which the ETF Shares' market price was above or below the NAV.
3
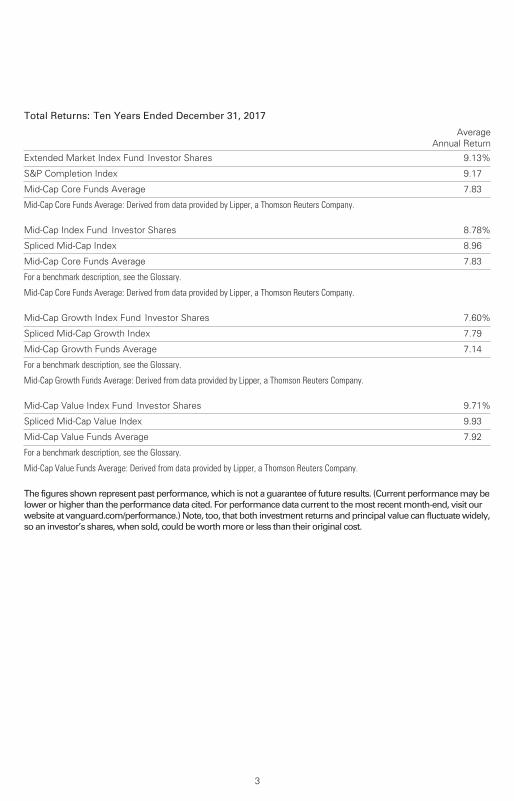
Total Returns: Ten Years Ended December 31, 2017
Average
Annual Return
Extended Market Index Fund Investor Shares 9.13%
S&P Completion Index 9.17
Mid-Cap Core Funds Average 7.83
Mid-Cap Core Funds Average: Derived from data provided by Lipper, a Thomson Reuters Company.
Mid-Cap Index Fund Investor Shares 8.78%
Spliced Mid-Cap Index 8.96
Mid-Cap Core Funds Average 7.83
For a benchmark description, see the Glossary.
Mid-Cap Core Funds Average: Derived from data provided by Lipper, a Thomson Reuters Company.
Mid-Cap Growth Index Fund Investor Shares 7.60%
Spliced Mid-Cap Growth Index 7.79
Mid-Cap Growth Funds Average 7.14
For a benchmark description, see the Glossary.
Mid-Cap Growth Funds Average: Derived from data provided by Lipper, a Thomson Reuters Company.
Mid-Cap Value Index Fund Investor Shares 9.71%
Spliced Mid-Cap Value Index 9.93
Mid-Cap Value Funds Average 7.92
For a benchmark description, see the Glossary.
Mid-Cap Value Funds Average: Derived from data provided by Lipper, a Thomson Reuters Company.
The figures shown represent past performance, which is not a guarantee of future results. (Current performance may be lower or higher than the performance data cited. For performance data current to the most recent month-end, visit our website at vanguard.com/performance.) Note, too, that both investment returns and principal value can fluctuate widely, so an investor’s shares, when sold, could be worth more or less than their original cost.
4
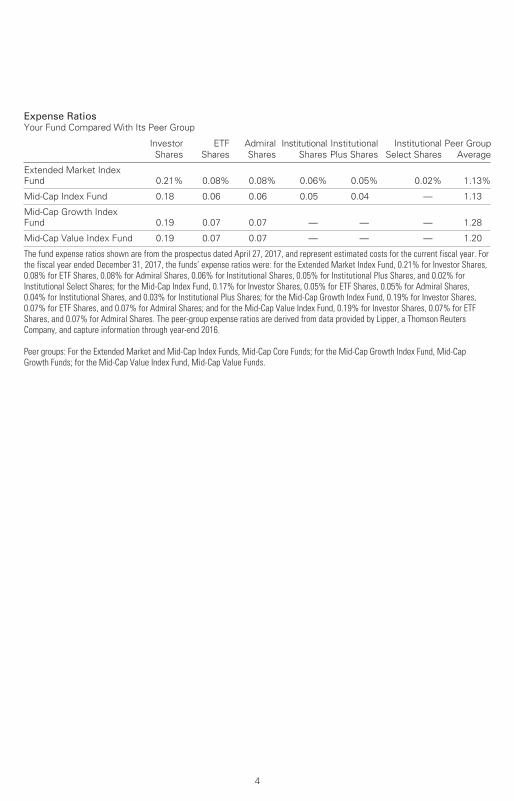
Expense RatiosYour Fund Compared With Its Peer Group
Investor
Shares
ETF
Shares
Admiral
Shares
Institutional
Shares
Institutional
Plus Shares
Institutional
Select Shares
Peer Group
Average
Extended Market Index
Fund 0.21% 0.08% 0.08% 0.06% 0.05% 0.02% 1.13%
Mid-Cap Index Fund 0.18 0.06 0.06 0.05 0.04 — 1.13
Mid-Cap Growth Index
Fund 0.19 0.07 0.07 — — — 1.28
Mid-Cap Value Index Fund 0.19 0.07 0.07 — — — 1.20
The fund expense ratios shown are from the prospectus dated April 27, 2017, and represent estimated costs for the current fiscal year. Forthe fiscal year ended December 31, 2017, the funds’ expense ratios were: for the Extended Market Index Fund, 0.21% for Investor Shares,0.08% for ETF Shares, 0.08% for Admiral Shares, 0.06% for Institutional Shares, 0.05% for Institutional Plus Shares, and 0.02% forInstitutional Select Shares; for the Mid-Cap Index Fund, 0.17% for Investor Shares, 0.05% for ETF Shares, 0.05% for Admiral Shares,0.04% for Institutional Shares, and 0.03% for Institutional Plus Shares; for the Mid-Cap Growth Index Fund, 0.19% for Investor Shares,0.07% for ETF Shares, and 0.07% for Admiral Shares; and for the Mid-Cap Value Index Fund, 0.19% for Investor Shares, 0.07% for ETFShares, and 0.07% for Admiral Shares. The peer-group expense ratios are derived from data provided by Lipper, a Thomson ReutersCompany, and capture information through year-end 2016.
Peer groups: For the Extended Market and Mid-Cap Index Funds, Mid-Cap Core Funds; for the Mid-Cap Growth Index Fund, Mid-CapGrowth Funds; for the Mid-Cap Value Index Fund, Mid-Cap Value Funds.

Dear Shareholder,
Lately I’ve been asked a lot about my
legacy. And candidly, that phrase bugs
me—it isn’t my legacy. Vanguard’s
success is a result of thousands of
my colleagues committing to a clear
mission: helping investors achieve
their financial goals.
The reason the topic has come up is
that on December 31, 2017, I officially
stepped down as Vanguard’s CEO after
almost a decade in that role. I’ll remain
chairman for a period to be determined
by the board of directors. Tim Buckley,
who was previously Vanguard’s president
and chief investment officer, was elected
CEO. I can’t think of a better successor.
I’ve spent 32 years at Vanguard—almost
my entire professional life—and during
that time I’ve had the good fortune of
working with smart, principled colleagues
from across the world. I’ve learned from
each of them.
In particular, I would like to thank
Jack Bogle, our founder, who took a
chance on me when I was a young
business school graduate, and Jack
Brennan, my predecessor as CEO,
who constantly challenged me with
new roles and responsibilities.
Chairman’s Perspective
Bill McNabb
Chairman
5
When you’re just starting out, there
is nothing quite like getting votes of
confidence from people you respect.
The short list
A milestone like this naturally brings about
some reflection. With that in mind, here’s
a tally—by no means exhaustive—of the
accomplishments that we at Vanguard are
proud of:
Low costs. Over the last decade, we cut
our average asset-weighted expense ratio
by about 50%.1 This isn’t a result of some
contrived price war. Since its founding,
Vanguard has emphasized the benefits
of low-cost investing. As Jack Bogle once
said: “The honest steward who charges
least, wins most. But not for himself; for
those investors who entrust their assets
to his care. It is not all that complicated.”
Global diversification. Through our
thought leadership and investment
options, such as our target-date funds,
Vanguard has encouraged clients to
obtain exposure to international markets.
Global diversification isn’t just about
helping to control risk—it can also be a
way of expanding your set of opportunities
and harnessing the potential of all markets.
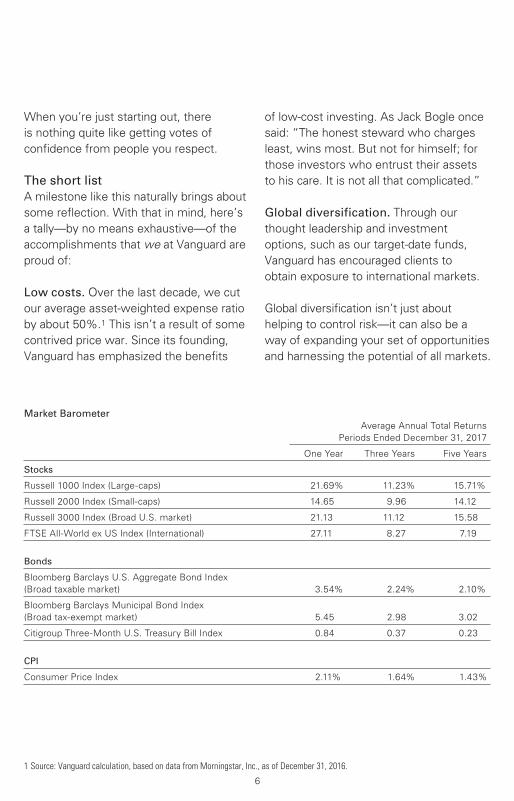
Market Barometer
Average Annual Total Returns
Periods Ended December 31, 2017
One Year Three Years Five Years
Stocks
Russell 1000 Index (Large-caps) 21.69% 11.23% 15.71%
Russell 2000 Index (Small-caps) 14.65 9.96 14.12
Russell 3000 Index (Broad U.S. market) 21.13 11.12 15.58
FTSE All-World ex US Index (International) 27.11 8.27 7.19
Bonds
Bloomberg Barclays U.S. Aggregate Bond Index
(Broad taxable market) 3.54% 2.24% 2.10%
Bloomberg Barclays Municipal Bond Index
(Broad tax-exempt market) 5.45 2.98 3.02
Citigroup Three-Month U.S. Treasury Bill Index 0.84 0.37 0.23
CPI
Consumer Price Index 2.11% 1.64% 1.43%
1 Source: Vanguard calculation, based on data from Morningstar, Inc., as of December 31, 2016.
6

I’ve been glad to see more and more
clients embracing global diversification.
I believe this trend will continue as
Vanguard’s way of investing takes
hold in international markets.
Affordable advice. In the wake of the
2008–2009 Global Financial Crisis, we
began working on a new advice model.
In 2015, we launched Vanguard Personal
Advisor Services®, a hybrid advice offering
that delivers value through a combination
of a professional advisor and powerful
digital technology at a competitive price.
Across the industry, we’ve seen the
cost of providing advice coming down.
Traditional advisors are embracing
low-cost investments, and that, in turn,
helps them reduce costs for their own
clients. This is a trend that all of us at
Vanguard would like to see continue.
Great people. I’ve interacted with
hundreds of companies of all sizes and
in all industries, and the one quality that
sets Vanguard apart from most of them is
our emphasis on people. It’s a testament
to our culture that colleagues spend 15,
20, or, as in my case, more than 30 years
of their professional lives here. Investors
benefit because we have consistent,
experienced fund management teams
and a deep bench of talent that ensures
that things go smoothly when it’s time
for a transition.
We’ve done a great job attracting new
talent, too. We made some notable
additions to senior management in the
last two years, and we’re continuously
grooming our next generation of leaders.
Ready for what comes next
When I was contemplating coming to
work at Vanguard, I sat down with my
rowing coach at his home in Philadelphia.
Over cheese steaks, he told me that the
most important thing was to work for a
company that had the same values I held
deeply. He was like a second father to
me, so I trusted his judgment at a time
when I wasn’t so sure about my own.
Back then, I never could have anticipated
the success Vanguard would have in the
coming decades.
I’m no better at predicting the future
now. Vanguard has enjoyed significant
growth in the last few years, and that
presents its own unique set of challenges
and opportunities, such as the role we’re
playing in advocating for better corporate
governance among companies our funds
invest in. And the asset management
industry is confronting significant changes
brought on by technology, shifting
demographics, and new regulations.
Although the future is uncertain, I’m
confident that Vanguard is well-prepared
to tackle whatever comes its way. And
one thing I’m sure of: There are big parts
of the world that would be well-served
by our way of investing.
7

It’s humbling to think about the impact
the work we do at Vanguard has on
clients who are trying to raise a family,
buy a first home, save for college, or
prepare for retirement. I’ve always tried
to make decisions with investors’ best
interests in mind. It has been a privilege
working with people who hold to that
same ideal.
Thank you for entrusting us with
your assets.
Sincerely,
F. William McNabb III
Chairman
January 1, 2018
8
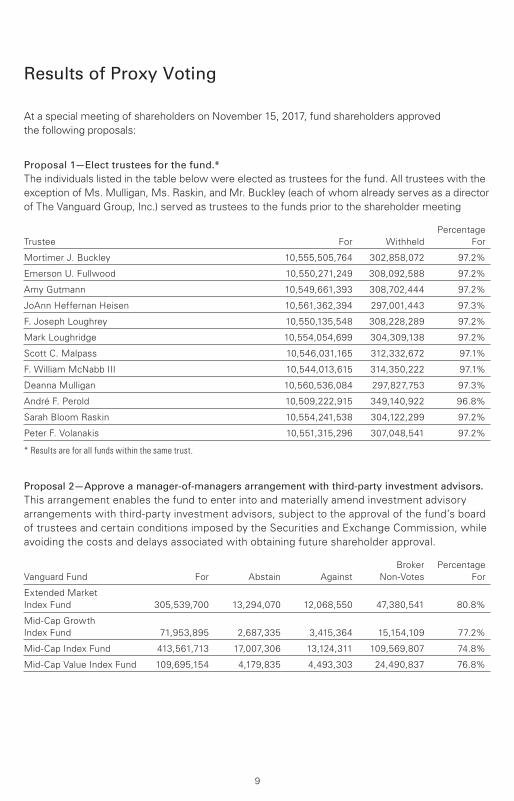
Results of Proxy Voting
At a special meeting of shareholders on November 15, 2017, fund shareholders approved
the following proposals:
Proposal 1—Elect trustees for the fund.*
The individuals listed in the table below were elected as trustees for the fund. All trustees with the
exception of Ms. Mulligan, Ms. Raskin, and Mr. Buckley (each of whom already serves as a director
of The Vanguard Group, Inc.) served as trustees to the funds prior to the shareholder meeting
Percentage
Trustee For Withheld For
Mortimer J. Buckley 10,555,505,764 302,858,072 97.2%
Emerson U. Fullwood 10,550,271,249 308,092,588 97.2%
Amy Gutmann 10,549,661,393 308,702,444 97.2%
JoAnn Heffernan Heisen 10,561,362,394 297,001,443 97.3%
F. Joseph Loughrey 10,550,135,548 308,228,289 97.2%
Mark Loughridge 10,554,054,699 304,309,138 97.2%
Scott C. Malpass 10,546,031,165 312,332,672 97.1%
F. William McNabb III 10,544,013,615 314,350,222 97.1%
Deanna Mulligan 10,560,536,084 297,827,753 97.3%
André F. Perold 10,509,222,915 349,140,922 96.8%
Sarah Bloom Raskin 10,554,241,538 304,122,299 97.2%
Peter F. Volanakis 10,551,315,296 307,048,541 97.2%
* Results are for all funds within the same trust.
Proposal 2—Approve a manager-of-managers arrangement with third-party investment advisors.
This arrangement enables the fund to enter into and materially amend investment advisory
arrangements with third-party investment advisors, subject to the approval of the fund’s board
of trustees and certain conditions imposed by the Securities and Exchange Commission, while
avoiding the costs and delays associated with obtaining future shareholder approval.
Broker Percentage
Vanguard Fund For Abstain Against Non-Votes For
Extended Market
Index Fund 305,539,700 13,294,070 12,068,550 47,380,541 80.8%
Mid-Cap Growth
Index Fund 71,953,895 2,687,335 3,415,364 15,154,109 77.2%
Mid-Cap Index Fund 413,561,713 17,007,306 13,124,311 109,569,807 74.8%
Mid-Cap Value Index Fund 109,695,154 4,179,835 4,493,303 24,490,837 76.8%
9
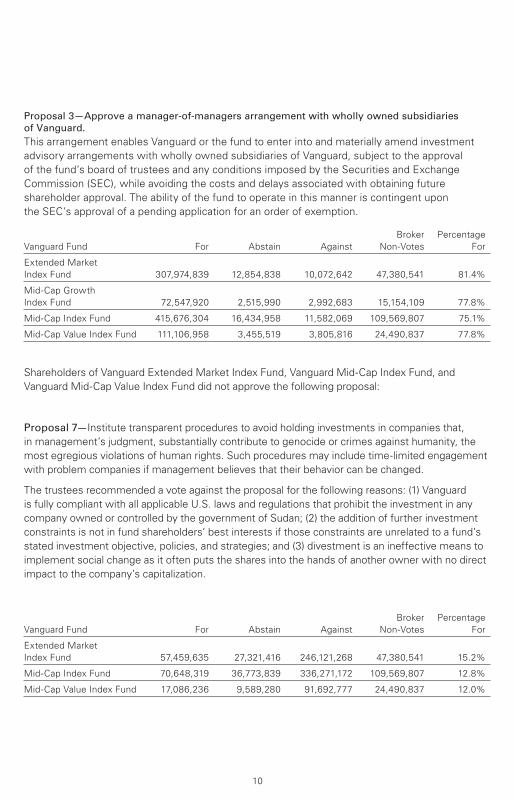
Proposal 3—Approve a manager-of-managers arrangement with wholly owned subsidiaries
of Vanguard.
This arrangement enables Vanguard or the fund to enter into and materially amend investment
advisory arrangements with wholly owned subsidiaries of Vanguard, subject to the approval
of the fund’s board of trustees and any conditions imposed by the Securities and Exchange
Commission (SEC), while avoiding the costs and delays associated with obtaining future
shareholder approval. The ability of the fund to operate in this manner is contingent upon
the SEC’s approval of a pending application for an order of exemption.
Broker Percentage
Vanguard Fund For Abstain Against Non-Votes For
Extended Market
Index Fund 307,974,839 12,854,838 10,072,642 47,380,541 81.4%
Mid-Cap Growth
Index Fund 72,547,920 2,515,990 2,992,683 15,154,109 77.8%
Mid-Cap Index Fund 415,676,304 16,434,958 11,582,069 109,569,807 75.1%
Mid-Cap Value Index Fund 111,106,958 3,455,519 3,805,816 24,490,837 77.8%
Shareholders of Vanguard Extended Market Index Fund, Vanguard Mid-Cap Index Fund, and
Vanguard Mid-Cap Value Index Fund did not approve the following proposal:
Proposal 7—Institute transparent procedures to avoid holding investments in companies that,
in management’s judgment, substantially contribute to genocide or crimes against humanity, the
most egregious violations of human rights. Such procedures may include time-limited engagement
with problem companies if management believes that their behavior can be changed.
The trustees recommended a vote against the proposal for the following reasons: (1) Vanguard
is fully compliant with all applicable U.S. laws and regulations that prohibit the investment in any
company owned or controlled by the government of Sudan; (2) the addition of further investment
constraints is not in fund shareholders’ best interests if those constraints are unrelated to a fund’s
stated investment objective, policies, and strategies; and (3) divestment is an ineffective means to
implement social change as it often puts the shares into the hands of another owner with no direct
impact to the company’s capitalization.
Broker Percentage
Vanguard Fund For Abstain Against Non-Votes For
Extended Market
Index Fund 57,459,635 27,321,416 246,121,268 47,380,541 15.2%
Mid-Cap Index Fund 70,648,319 36,773,839 336,271,172 109,569,807 12.8%
Mid-Cap Value Index Fund 17,086,236 9,589,280 91,692,777 24,490,837 12.0%
10
Extended Market Index Fund
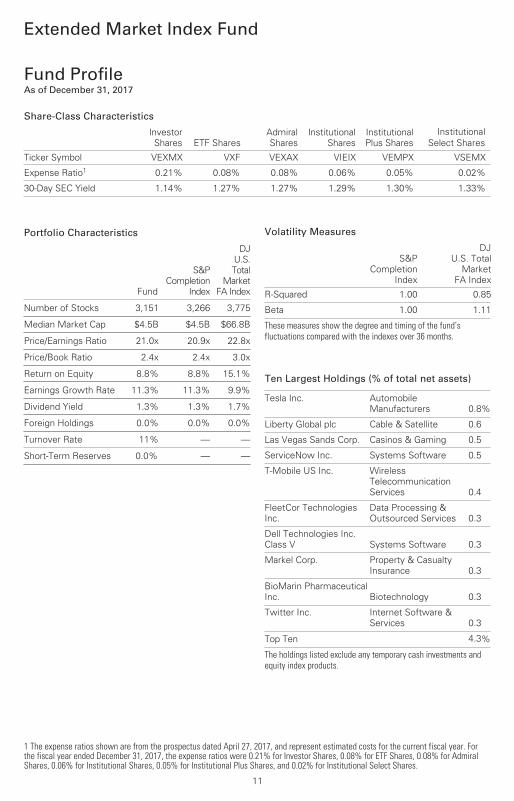
Fund ProfileAs of December 31, 2017
1 The expense ratios shown are from the prospectus dated April 27, 2017, and represent estimated costs for the current fiscal year. Forthe fiscal year ended December 31, 2017, the expense ratios were 0.21% for Investor Shares, 0.08% for ETF Shares, 0.08% for AdmiralShares, 0.06% for Institutional Shares, 0.05% for Institutional Plus Shares, and 0.02% for Institutional Select Shares.
11
Share-Class Characteristics
Investor
Shares ETF Shares
Admiral
Shares
Institutional
Shares
Institutional
Plus Shares
Institutional
Select Shares
Ticker Symbol VEXMX VXF VEXAX VIEIX VEMPX VSEMX
Expense Ratio1 0.21% 0.08% 0.08% 0.06% 0.05% 0.02%
30-Day SEC Yield 1.14% 1.27% 1.27% 1.29% 1.30% 1.33%
Volatility Measures
S&P
Completion
Index
DJ
U.S. Total
Market
FA Index
R-Squared 1.00 0.85
Beta 1.00 1.11
These measures show the degree and timing of the fund’s fluctuations compared with the indexes over 36 months.
Ten Largest Holdings (% of total net assets)
Tesla Inc. Automobile
Manufacturers 0.8%
Liberty Global plc Cable & Satellite 0.6
Las Vegas Sands Corp. Casinos & Gaming 0.5
ServiceNow Inc. Systems Software 0.5
T-Mobile US Inc. Wireless
Telecommunication
Services 0.4
FleetCor Technologies
Inc.
Data Processing &
Outsourced Services 0.3
Dell Technologies Inc.
Class V Systems Software 0.3
Markel Corp. Property & Casualty
Insurance 0.3
BioMarin Pharmaceutical
Inc. Biotechnology 0.3
Twitter Inc. Internet Software &
Services 0.3
Top Ten 4.3%
The holdings listed exclude any temporary cash investments andequity index products.
Portfolio Characteristics
Fund
S&P
Completion
Index
DJ
U.S.
Total
Market
FA Index
Number of Stocks 3,151 3,266 3,775
Median Market Cap $4.5B $4.5B $66.8B
Price/Earnings Ratio 21.0x 20.9x 22.8x
Price/Book Ratio 2.4x 2.4x 3.0x
Return on Equity 8.8% 8.8% 15.1%
Earnings Growth Rate 11.3% 11.3% 9.9%
Dividend Yield 1.3% 1.3% 1.7%
Foreign Holdings 0.0% 0.0% 0.0%
Turnover Rate 11% — —
Short-Term Reserves 0.0% — —
Investment Focus
Market Cap
Value
Large
Medium
Small
Blend Growth Style
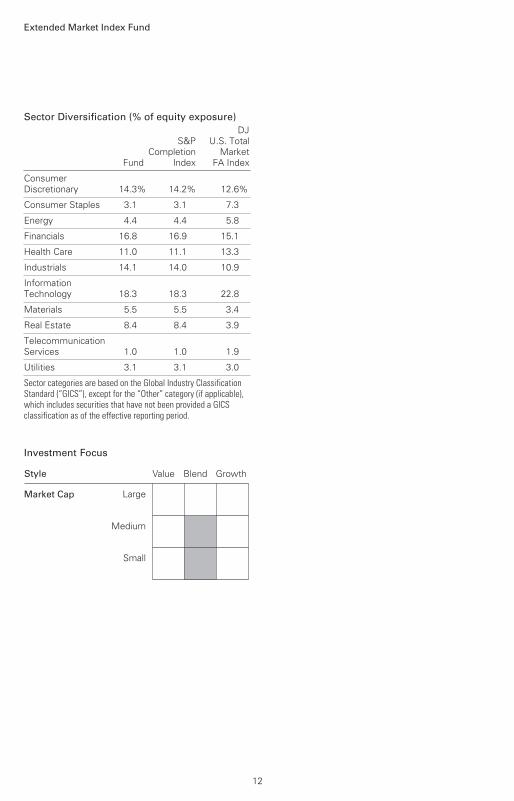
Extended Market Index Fund
Sector Diversification (% of equity exposure)
Fund
S&PCompletion
Index
DJU.S. Total
MarketFA Index
ConsumerDiscretionary 14.3% 14.2% 12.6%
Consumer Staples 3.1 3.1 7.3
Energy 4.4 4.4 5.8
Financials 16.8 16.9 15.1
Health Care 11.0 11.1 13.3
Industrials 14.1 14.0 10.9
InformationTechnology 18.3 18.3 22.8
Materials 5.5 5.5 3.4
Real Estate 8.4 8.4 3.9
TelecommunicationServices 1.0 1.0 1.9
Utilities 3.1 3.1 3.0
Sector categories are based on the Global Industry ClassificationStandard (“GICS”), except for the “Other” category (if applicable),which includes securities that have not been provided a GICSclassification as of the effective reporting period.
12
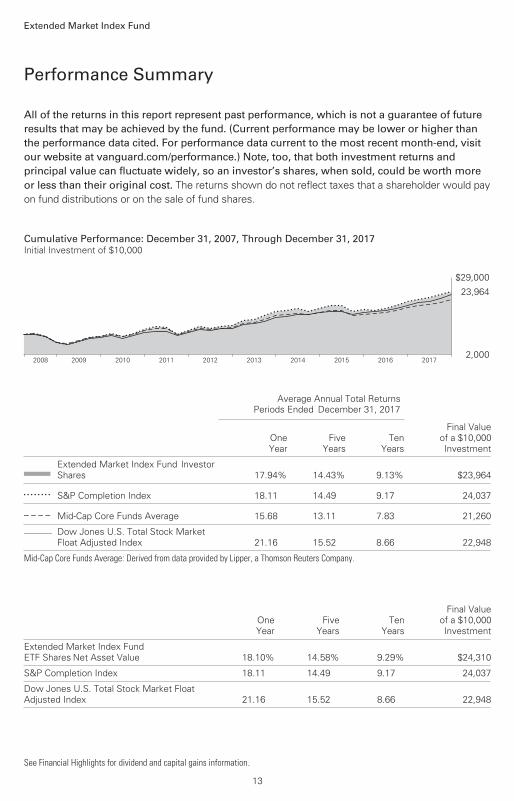
All of the returns in this report represent past performance, which is not a guarantee of future results that may be achieved by the fund. (Current performance may be lower or higher thanthe performance data cited. For performance data current to the most recent month-end, visitour website at vanguard.com/performance.) Note, too, that both investment returns and principal value can fluctuate widely, so an investor’s shares, when sold, could be worth more or less than their original cost. The returns shown do not reflect taxes that a shareholder would pay
on fund distributions or on the sale of fund shares.
Performance Summary
Extended Market Index Fund
See Financial Highlights for dividend and capital gains information.
13
Cumulative Performance: December 31, 2007, Through December 31, 2017Initial Investment of $10,000
2017201620152014201320122011201020092008
$29,000
2,000
23,964
Average Annual Total Returns
Periods Ended December 31, 2017
OneYear
FiveYears
TenYears
Final Valueof a $10,000Investment
Extended Market Index Fund*InvestorShares 17.94% 14.43% 9.13% $23,964
• • • • • • • • S&P Completion Index 18.11 14.49 9.17 24,037
– – – – Mid-Cap Core Funds Average 15.68 13.11 7.83 21,260________ Dow Jones U.S. Total Stock Market
Float Adjusted Index 21.16 15.52 8.66 22,948
Mid-Cap Core Funds Average: Derived from data provided by Lipper, a Thomson Reuters Company.
OneYear
FiveYears
TenYears
Final Valueof a $10,000Investment
Extended Market Index FundETF Shares Net Asset Value 18.10% 14.58% 9.29% $24,310
S&P Completion Index 18.11 14.49 9.17 24,037
Dow Jones U.S. Total Stock Market FloatAdjusted Index 21.16 15.52 8.66 22,948
Extended Market Index Fund
14
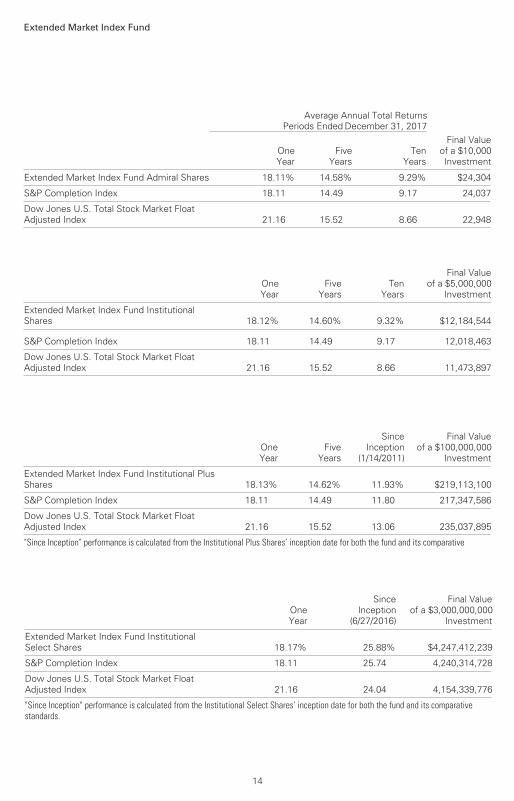
Average Annual Total Returns
Periods Ended December 31, 2017
OneYear
FiveYears
TenYears
Final Valueof a $10,000Investment
Extended Market Index Fund Admiral Shares 18.11% 14.58% 9.29% $24,304
S&P Completion Index 18.11 14.49 9.17 24,037
Dow Jones U.S. Total Stock Market Float Adjusted Index 21.16 15.52 8.66 22,948
OneYear
FiveYears
TenYears
Final Valueof a $5,000,000
Investment
Extended Market Index Fund InstitutionalShares 18.12% 14.60% 9.32% $12,184,544
S&P Completion Index 18.11 14.49 9.17 12,018,463
Dow Jones U.S. Total Stock Market FloatAdjusted Index 21.16 15.52 8.66 11,473,897
OneYear
FiveYears
SinceInception
(1/14/2011)
Final Valueof a $100,000,000
Investment
Extended Market Index Fund Institutional PlusShares 18.13% 14.62% 11.93% $219,113,100
S&P Completion Index 18.11 14.49 11.80 217,347,586
Dow Jones U.S. Total Stock Market FloatAdjusted Index 21.16 15.52 13.06 235,037,895
"Since Inception" performance is calculated from the Institutional Plus Shares’ inception date for both the fund and its comparative
OneYear
SinceInception
(6/27/2016)
Final Valueof a $3,000,000,000
Investment
Extended Market Index Fund InstitutionalSelect Shares 18.17% 25.88% $4,247,412,239
S&P Completion Index 18.11 25.74 4,240,314,728
Dow Jones U.S. Total Stock Market FloatAdjusted Index 21.16 24.04 4,154,339,776
"Since Inception" performance is calculated from the Institutional Select Shares’ inception date for both the fund and its comparative standards.
Extended Market Index Fund
15
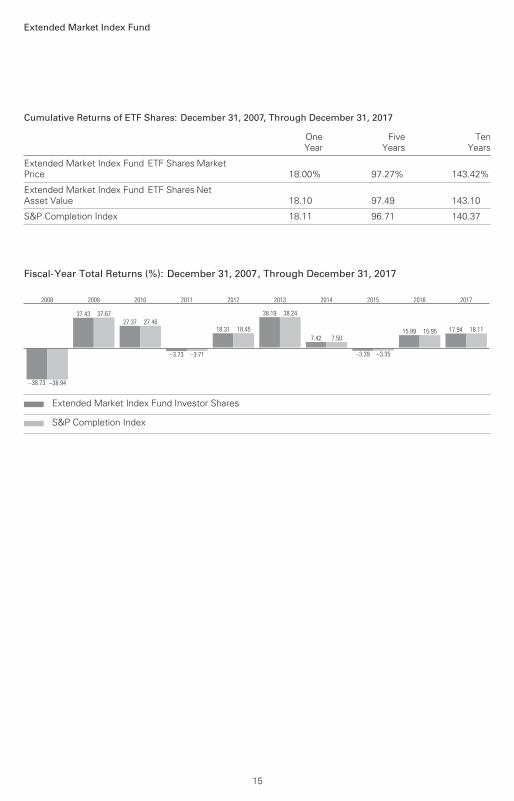
Cumulative Returns of ETF Shares: December 31, 2007, Through December 31, 2017
OneYear
FiveYears
TenYears
Extended Market Index Fund ETF Shares MarketPrice 18.00% 97.27% 143.42%
Extended Market Index Fund ETF Shares NetAsset Value 18.10 97.49 143.10
S&P Completion Index 18.11 96.71 140.37
Fiscal-Year Total Returns (%): December 31, 2007, Through December 31, 2017
–38.73 –38.94
2008
37.43 37.67
2009
27.37 27.46
2010
–3.73 –3.71
2011
18.31 18.45
2012
38.19 38.24
2013
7.42 7.50
2014
–3.39 –3.35
2015
15.99 15.95
2016
17.94 18.11
2017
Extended Market Index Fund Investor Shares
S&P Completion Index
Financial Statements
Extended Market Index Fund
Market Percentage
Value• of Net
Shares ($000) Assets
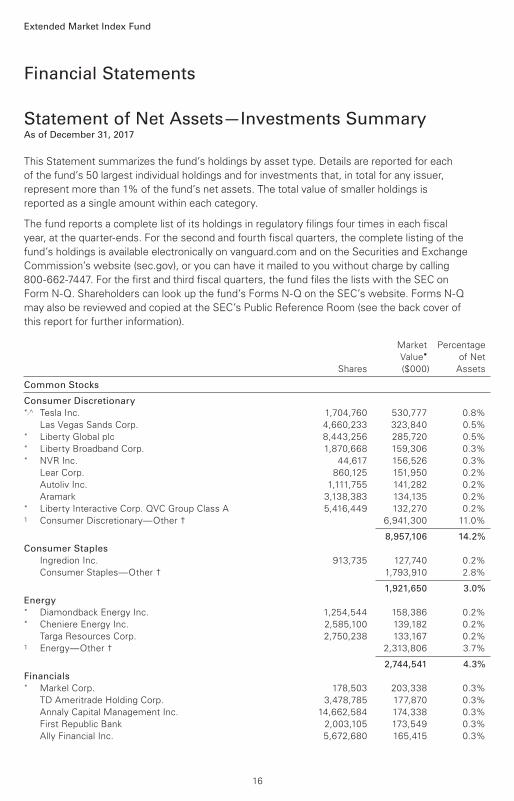
This Statement summarizes the fund’s holdings by asset type. Details are reported for each
of the fund’s 50 largest individual holdings and for investments that, in total for any issuer,
represent more than 1% of the fund’s net assets. The total value of smaller holdings is
reported as a single amount within each category.
The fund reports a complete list of its holdings in regulatory filings four times in each fiscal
year, at the quarter-ends. For the second and fourth fiscal quarters, the complete listing of the
fund’s holdings is available electronically on vanguard.com and on the Securities and Exchange
Commission’s website (sec.gov), or you can have it mailed to you without charge by calling
800-662-7447. For the first and third fiscal quarters, the fund files the lists with the SEC on
Form N-Q. Shareholders can look up the fund’s Forms N-Q on the SEC’s website. Forms N-Q
may also be reviewed and copied at the SEC’s Public Reference Room (see the back cover of
this report for further information).
Statement of Net Assets—Investments SummaryAs of December 31, 2017
Common Stocks
Consumer Discretionary*,^ Tesla Inc. 1,704,760 530,777 0.8%
Las Vegas Sands Corp. 4,660,233 323,840 0.5% * Liberty Global plc 8,443,256 285,720 0.5% * Liberty Broadband Corp. 1,870,668 159,306 0.3% * NVR Inc. 44,617 156,526 0.3%
Lear Corp. 860,125 151,950 0.2%
Autoliv Inc. 1,111,755 141,282 0.2%
Aramark 3,138,383 134,135 0.2% * Liberty Interactive Corp. QVC Group Class A 5,416,449 132,270 0.2% 1 Consumer Discretionary—Other † 6,941,300 11.0%
8,957,106 14.2%
Consumer Staples
Ingredion Inc. 913,735 127,740 0.2%
Consumer Staples—Other † 1,793,910 2.8%
1,921,650 3.0%
Energy* Diamondback Energy Inc. 1,254,544 158,386 0.2% * Cheniere Energy Inc. 2,585,100 139,182 0.2%
Targa Resources Corp. 2,750,238 133,167 0.2% 1 Energy—Other † 2,313,806 3.7%
2,744,541 4.3%
Financials* Markel Corp. 178,503 203,338 0.3%
TD Ameritrade Holding Corp. 3,478,785 177,870 0.3%
Annaly Capital Management Inc. 14,662,584 174,338 0.3%
First Republic Bank 2,003,105 173,549 0.3%
Ally Financial Inc. 5,672,680 165,415 0.3%
16
Extended Market Index Fund
Market Percentage
Value• of Net
Shares ($000) Assets
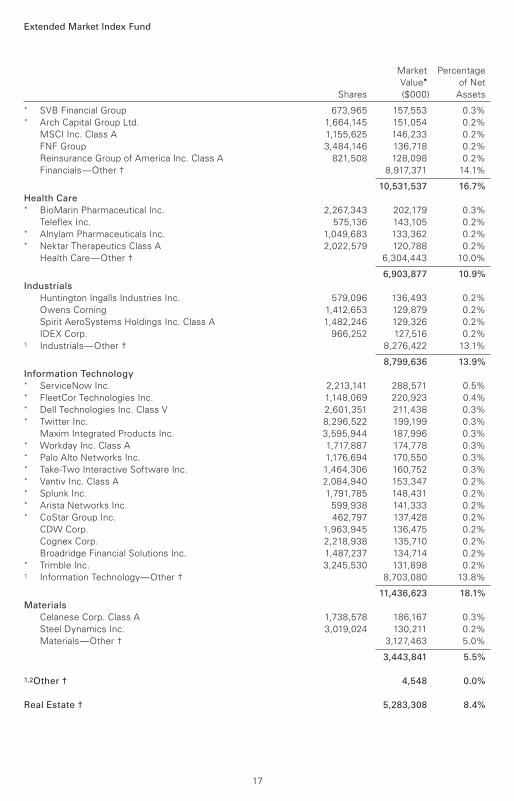
* SVB Financial Group 673,965 157,553 0.3% * Arch Capital Group Ltd. 1,664,145 151,054 0.2%
MSCI Inc. Class A 1,155,625 146,233 0.2%
FNF Group 3,484,146 136,718 0.2%
Reinsurance Group of America Inc. Class A 821,508 128,098 0.2%
Financials—Other † 8,917,371 14.1%
10,531,537 16.7%
Health Care* BioMarin Pharmaceutical Inc. 2,267,343 202,179 0.3%
Teleflex Inc. 575,136 143,105 0.2% * Alnylam Pharmaceuticals Inc. 1,049,683 133,362 0.2% * Nektar Therapeutics Class A 2,022,579 120,788 0.2%
Health Care—Other † 6,304,443 10.0%
6,903,877 10.9%
Industrials
Huntington Ingalls Industries Inc. 579,096 136,493 0.2%
Owens Corning 1,412,653 129,879 0.2%
Spirit AeroSystems Holdings Inc. Class A 1,482,246 129,326 0.2%
IDEX Corp. 966,252 127,516 0.2% 1 Industrials—Other † 8,276,422 13.1%
8,799,636 13.9%
Information Technology* ServiceNow Inc. 2,213,141 288,571 0.5% * FleetCor Technologies Inc. 1,148,069 220,923 0.4% * Dell Technologies Inc. Class V 2,601,351 211,438 0.3% * Twitter Inc. 8,296,522 199,199 0.3%
Maxim Integrated Products Inc. 3,595,944 187,996 0.3% * Workday Inc. Class A 1,717,887 174,778 0.3% * Palo Alto Networks Inc. 1,176,694 170,550 0.3% * Take-Two Interactive Software Inc. 1,464,306 160,752 0.3% * Vantiv Inc. Class A 2,084,940 153,347 0.2% * Splunk Inc. 1,791,785 148,431 0.2% * Arista Networks Inc. 599,938 141,333 0.2% * CoStar Group Inc. 462,797 137,428 0.2%
CDW Corp. 1,963,945 136,475 0.2%
Cognex Corp. 2,218,938 135,710 0.2%
Broadridge Financial Solutions Inc. 1,487,237 134,714 0.2% * Trimble Inc. 3,245,530 131,898 0.2% 1 Information Technology—Other † 8,703,080 13.8%
11,436,623 18.1%
Materials
Celanese Corp. Class A 1,738,578 186,167 0.3%
Steel Dynamics Inc. 3,019,024 130,211 0.2%
Materials—Other † 3,127,463 5.0%
3,443,841 5.5%
1,2Other † 4,548 0.0%
Real Estate † 5,283,308 8.4%
17
Extended Market Index Fund
Market Percentage
Value• of Net
Shares ($000) Assets
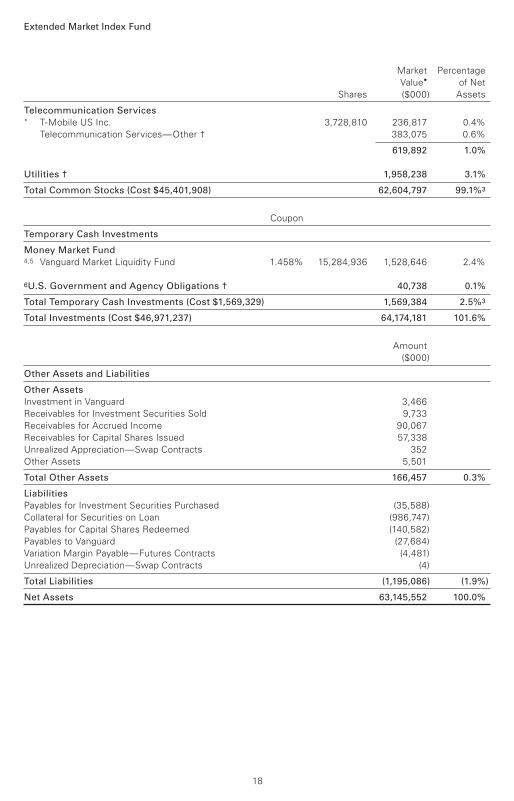
Telecommunication Services* T-Mobile US Inc. 3,728,810 236,817 0.4%
Telecommunication Services—Other † 383,075 0.6%
619,892 1.0%
Utilities † 1,958,238 3.1%
Total Common Stocks (Cost $45,401,908) 62,604,797 99.1%3
Coupon
Temporary Cash Investments
Money Market Fund4,5 Vanguard Market Liquidity Fund 1.458% 15,284,936 1,528,646 2.4%
6U.S. Government and Agency Obligations † 40,738 0.1%
Total Temporary Cash Investments (Cost $1,569,329) 1,569,384 2.5%3
Total Investments (Cost $46,971,237) 64,174,181 101.6%
Amount
($000)
Other Assets and Liabilities
Other Assets
Investment in Vanguard 3,466
Receivables for Investment Securities Sold 9,733
Receivables for Accrued Income 90,067
Receivables for Capital Shares Issued 57,338
Unrealized Appreciation—Swap Contracts 352
Other Assets 5,501
Total Other Assets 166,457 0.3%
Liabilities
Payables for Investment Securities Purchased (35,588)
Collateral for Securities on Loan (986,747)
Payables for Capital Shares Redeemed (140,582)
Payables to Vanguard (27,684)
Variation Margin Payable—Futures Contracts (4,481)
Unrealized Depreciation—Swap Contracts (4)
Total Liabilities (1,195,086) (1.9%)
Net Assets 63,145,552 100.0%
18
Extended Market Index Fund
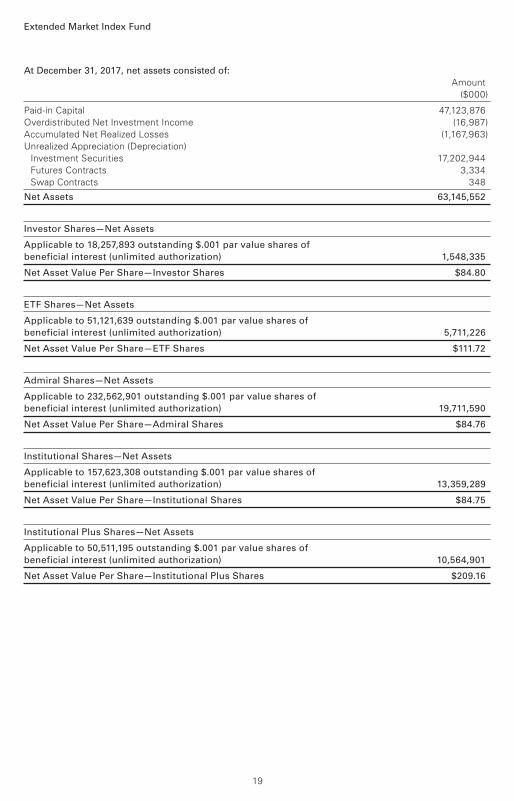
At December 31, 2017, net assets consisted of:
Amount
($000)
Paid-in Capital 47,123,876
Overdistributed Net Investment Income (16,987)
Accumulated Net Realized Losses (1,167,963)
Unrealized Appreciation (Depreciation)
Investment Securities 17,202,944
Futures Contracts 3,334
Swap Contracts 348
Net Assets 63,145,552
Investor Shares—Net Assets
Applicable to 18,257,893 outstanding $.001 par value shares of
beneficial interest (unlimited authorization) 1,548,335
Net Asset Value Per Share—Investor Shares $84.80
ETF Shares—Net Assets
Applicable to 51,121,639 outstanding $.001 par value shares of
beneficial interest (unlimited authorization) 5,711,226
Net Asset Value Per Share—ETF Shares $111.72
Admiral Shares—Net Assets
Applicable to 232,562,901 outstanding $.001 par value shares of
beneficial interest (unlimited authorization) 19,711,590
Net Asset Value Per Share—Admiral Shares $84.76
Institutional Shares—Net Assets
Applicable to 157,623,308 outstanding $.001 par value shares of
beneficial interest (unlimited authorization) 13,359,289
Net Asset Value Per Share—Institutional Shares $84.75
Institutional Plus Shares—Net Assets
Applicable to 50,511,195 outstanding $.001 par value shares of
beneficial interest (unlimited authorization) 10,564,901
Net Asset Value Per Share—Institutional Plus Shares $209.16
19
Extended Market Index Fund
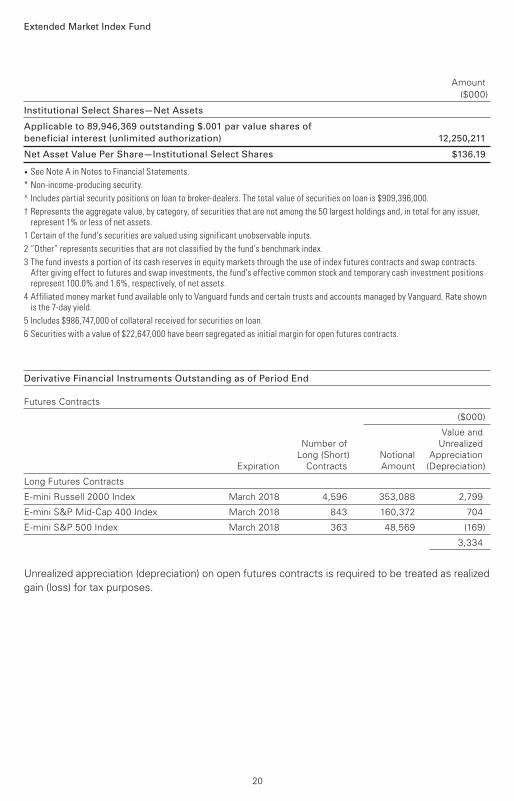
Derivative Financial Instruments Outstanding as of Period End
Futures Contracts
($000)
Value and
Number of Unrealized
Long (Short) Notional Appreciation
Expiration Contracts Amount (Depreciation)
Long Futures Contracts
E-mini Russell 2000 Index March 2018 4,596 353,088 2,799
E-mini S&P Mid-Cap 400 Index March 2018 843 160,372 704
E-mini S&P 500 Index March 2018 363 48,569 (169)
3,334
Unrealized appreciation (depreciation) on open futures contracts is required to be treated as realized
gain (loss) for tax purposes.
Amount
($000)
Institutional Select Shares—Net Assets
Applicable to 89,946,369 outstanding $.001 par value shares of
beneficial interest (unlimited authorization) 12,250,211
Net Asset Value Per Share—Institutional Select Shares $136.19
• See Note A in Notes to Financial Statements.
* Non-income-producing security.
^ Includes partial security positions on loan to broker-dealers. The total value of securities on loan is $909,396,000.
† Represents the aggregate value, by category, of securities that are not among the 50 largest holdings and, in total for any issuer, represent 1% or less of net assets.
1 Certain of the fund’s securities are valued using significant unobservable inputs.
2 “Other” represents securities that are not classified by the fund’s benchmark index.
3 The fund invests a portion of its cash reserves in equity markets through the use of index futures contracts and swap contracts. After giving effect to futures and swap investments, the fund’s effective common stock and temporary cash investment positions represent 100.0% and 1.6%, respectively, of net assets.
4 Affiliated money market fund available only to Vanguard funds and certain trusts and accounts managed by Vanguard. Rate shown is the 7-day yield.
5 Includes $986,747,000 of collateral received for securities on loan.
6 Securities with a value of $22,647,000 have been segregated as initial margin for open futures contracts.
20
Extended Market Index Fund
See accompanying Notes, which are an integral part of the Financial Statements.
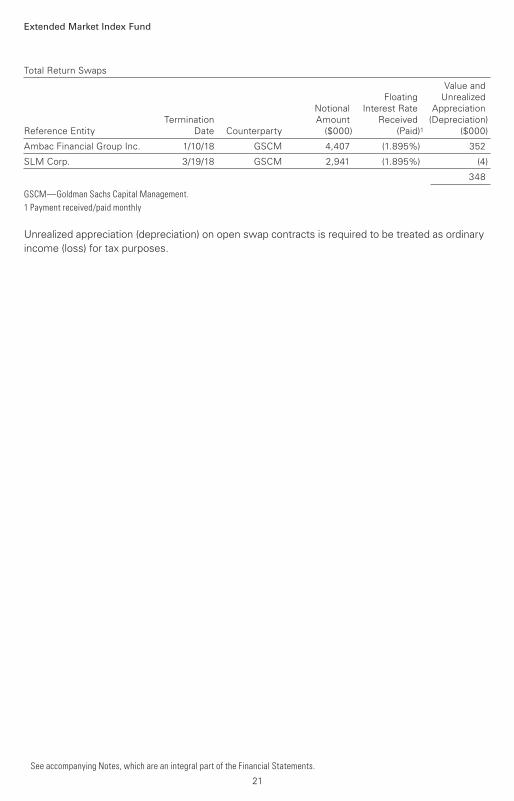
Total Return Swaps
Value and
Floating Unrealized
Notional Interest Rate Appreciation
Termination Amount Received (Depreciation)
Reference Entity Date Counterparty ($000) (Paid)1 ($000)
Ambac Financial Group Inc. 1/10/18 GSCM 4,407 (1.895%) 352
SLM Corp. 3/19/18 GSCM 2,941 (1.895%) (4)
348
GSCM—Goldman Sachs Capital Management.
1 Payment received/paid monthly
Unrealized appreciation (depreciation) on open swap contracts is required to be treated as ordinary
income (loss) for tax purposes.
21
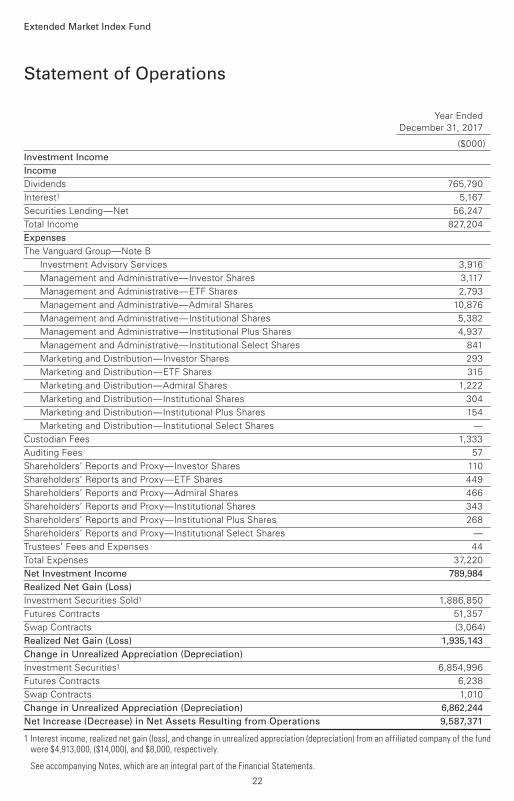
Year Ended
December 31, 2017
($000)
Investment Income
Income
Dividends 765,790
Interest1 5,167
Securities Lending—Net 56,247
Total Income 827,204
Expenses
The Vanguard Group—Note B
Investment Advisory Services 3,916
Management and Administrative—Investor Shares 3,117
Management and Administrative—ETF Shares 2,793
Management and Administrative—Admiral Shares 10,876
Management and Administrative—Institutional Shares 5,382
Management and Administrative—Institutional Plus Shares 4,937
Management and Administrative—Institutional Select Shares 841
Marketing and Distribution—Investor Shares 293
Marketing and Distribution—ETF Shares 315
Marketing and Distribution—Admiral Shares 1,222
Marketing and Distribution—Institutional Shares 304
Marketing and Distribution—Institutional Plus Shares 154
Marketing and Distribution—Institutional Select Shares —
Custodian Fees 1,333
Auditing Fees 57
Shareholders’ Reports and Proxy—Investor Shares 110
Shareholders’ Reports and Proxy—ETF Shares 449
Shareholders’ Reports and Proxy—Admiral Shares 466
Shareholders’ Reports and Proxy—Institutional Shares 343
Shareholders’ Reports and Proxy—Institutional Plus Shares 268
Shareholders’ Reports and Proxy—Institutional Select Shares —
Trustees’ Fees and Expenses 44
Total Expenses 37,220
Net Investment Income 789,984
Realized Net Gain (Loss)
Investment Securities Sold1 1,886,850
Futures Contracts 51,357
Swap Contracts (3,064)
Realized Net Gain (Loss) 1,935,143
Change in Unrealized Appreciation (Depreciation)
Investment Securities1 6,854,996
Futures Contracts 6,238
Swap Contracts 1,010
Change in Unrealized Appreciation (Depreciation) 6,862,244
Net Increase (Decrease) in Net Assets Resulting from Operations 9,587,371
1 Interest income, realized net gain (loss), and change in unrealized appreciation (depreciation) from an affiliated company of the fund were $4,913,000, ($14,000), and $8,000, respectively.
Statement of Operations
Extended Market Index Fund
See accompanying Notes, which are an integral part of the Financial Statements.
22
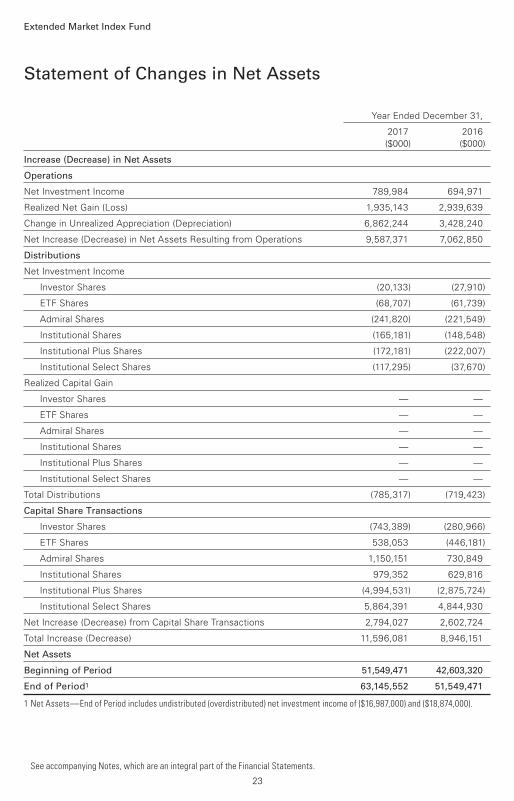
Statement of Changes in Net Assets
Extended Market Index Fund
See accompanying Notes, which are an integral part of the Financial Statements.
Year Ended December 31,
2017 2016
($000) ($000)
Increase (Decrease) in Net Assets
Operations
Net Investment Income 789,984 694,971
Realized Net Gain (Loss) 1,935,143 2,939,639
Change in Unrealized Appreciation (Depreciation) 6,862,244 3,428,240
Net Increase (Decrease) in Net Assets Resulting from Operations 9,587,371 7,062,850
Distributions
Net Investment Income
Investor Shares (20,133) (27,910)
ETF Shares (68,707) (61,739)
Admiral Shares (241,820) (221,549)
Institutional Shares (165,181) (148,548)
Institutional Plus Shares (172,181) (222,007)
Institutional Select Shares (117,295) (37,670)
Realized Capital Gain
Investor Shares — —
ETF Shares — —
Admiral Shares — —
Institutional Shares — —
Institutional Plus Shares — —
Institutional Select Shares — —
Total Distributions (785,317) (719,423)
Capital Share Transactions
Investor Shares (743,389) (280,966)
ETF Shares 538,053 (446,181)
Admiral Shares 1,150,151 730,849
Institutional Shares 979,352 629,816
Institutional Plus Shares (4,994,531) (2,875,724)
Institutional Select Shares 5,864,391 4,844,930
Net Increase (Decrease) from Capital Share Transactions 2,794,027 2,602,724
Total Increase (Decrease) 11,596,081 8,946,151
Net Assets
Beginning of Period 51,549,471 42,603,320
End of Period1 63,145,552 51,549,471
1 Net Assets—End of Period includes undistributed (overdistributed) net investment income of ($16,987,000) and ($18,874,000).
23
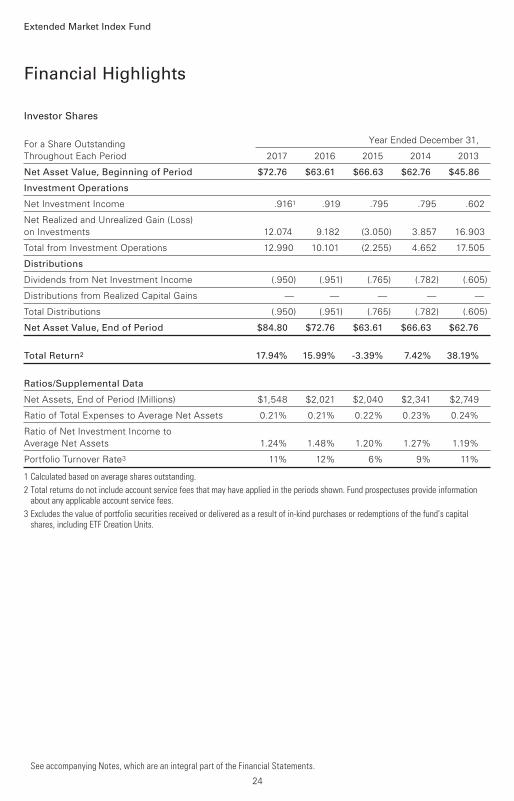
Investor Shares
For a Share Outstanding Year Ended December 31,
Throughout Each Period 2017 2016 2015 2014 2013
Net Asset Value, Beginning of Period $72.76 $63.61 $66.63 $62.76 $45.86
Investment Operations
Net Investment Income .9161 .919 .795 .795 .602
Net Realized and Unrealized Gain (Loss)
on Investments 12.074 9.182 (3.050) 3.857 16.903
Total from Investment Operations 12.990 10.101 (2.255) 4.652 17.505
Distributions
Dividends from Net Investment Income (.950) (.951) (.765) (.782) (.605)
Distributions from Realized Capital Gains — — — — —
Total Distributions (.950) (.951) (.765) (.782) (.605)
Net Asset Value, End of Period $84.80 $72.76 $63.61 $66.63 $62.76
Total Return2 17.94% 15.99% -3.39% 7.42% 38.19%
Ratios/Supplemental Data
Net Assets, End of Period (Millions) $1,548 $2,021 $2,040 $2,341 $2,749
Ratio of Total Expenses to Average Net Assets 0.21% 0.21% 0.22% 0.23% 0.24%
Ratio of Net Investment Income to
Average Net Assets 1.24% 1.48% 1.20% 1.27% 1.19%
Portfolio Turnover Rate3 11% 12% 6% 9% 11%
1 Calculated based on average shares outstanding.
2 Total returns do not include account service fees that may have applied in the periods shown. Fund prospectuses provide information about any applicable account service fees.
3 Excludes the value of portfolio securities received or delivered as a result of in-kind purchases or redemptions of the fund’s capital shares, including ETF Creation Units.
Financial Highlights
See accompanying Notes, which are an integral part of the Financial Statements.
Extended Market Index Fund
24
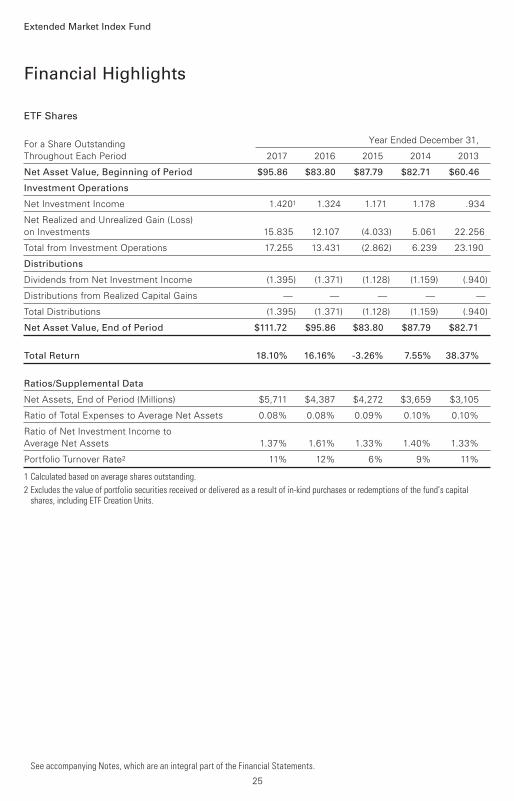
ETF Shares
For a Share Outstanding Year Ended December 31,
Throughout Each Period 2017 2016 2015 2014 2013
Net Asset Value, Beginning of Period $95.86 $83.80 $87.79 $82.71 $60.46
Investment Operations
Net Investment Income 1.4201 1.324 1.171 1.178 .934
Net Realized and Unrealized Gain (Loss)
on Investments 15.835 12.107 (4.033) 5.061 22.256
Total from Investment Operations 17.255 13.431 (2.862) 6.239 23.190
Distributions
Dividends from Net Investment Income (1.395) (1.371) (1.128) (1.159) (.940)
Distributions from Realized Capital Gains — — — — —
Total Distributions (1.395) (1.371) (1.128) (1.159) (.940)
Net Asset Value, End of Period $111.72 $95.86 $83.80 $87.79 $82.71
Total Return 18.10% 16.16% -3.26% 7.55% 38.37%
Ratios/Supplemental Data
Net Assets, End of Period (Millions) $5,711 $4,387 $4,272 $3,659 $3,105
Ratio of Total Expenses to Average Net Assets 0.08% 0.08% 0.09% 0.10% 0.10%
Ratio of Net Investment Income to
Average Net Assets 1.37% 1.61% 1.33% 1.40% 1.33%
Portfolio Turnover Rate2 11% 12% 6% 9% 11%
1 Calculated based on average shares outstanding.
2 Excludes the value of portfolio securities received or delivered as a result of in-kind purchases or redemptions of the fund’s capital shares, including ETF Creation Units.
Financial Highlights
See accompanying Notes, which are an integral part of the Financial Statements.
Extended Market Index Fund
25
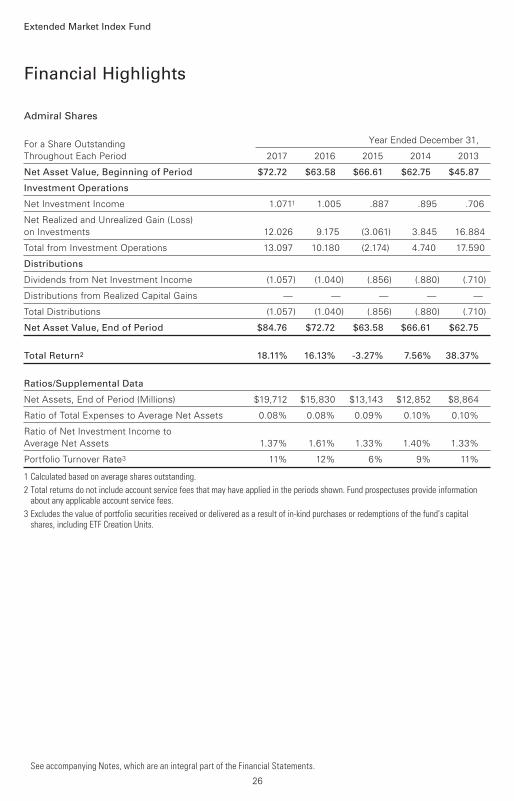
Admiral Shares
For a Share Outstanding Year Ended December 31,
Throughout Each Period 2017 2016 2015 2014 2013
Net Asset Value, Beginning of Period $72.72 $63.58 $66.61 $62.75 $45.87
Investment Operations
Net Investment Income 1.0711 1.005 .887 .895 .706
Net Realized and Unrealized Gain (Loss)
on Investments 12.026 9.175 (3.061) 3.845 16.884
Total from Investment Operations 13.097 10.180 (2.174) 4.740 17.590
Distributions
Dividends from Net Investment Income (1.057) (1.040) (.856) (.880) (.710)
Distributions from Realized Capital Gains — — — — —
Total Distributions (1.057) (1.040) (.856) (.880) (.710)
Net Asset Value, End of Period $84.76 $72.72 $63.58 $66.61 $62.75
Total Return2 18.11% 16.13% -3.27% 7.56% 38.37%
Ratios/Supplemental Data
Net Assets, End of Period (Millions) $19,712 $15,830 $13,143 $12,852 $8,864
Ratio of Total Expenses to Average Net Assets 0.08% 0.08% 0.09% 0.10% 0.10%
Ratio of Net Investment Income to
Average Net Assets 1.37% 1.61% 1.33% 1.40% 1.33%
Portfolio Turnover Rate3 11% 12% 6% 9% 11%
1 Calculated based on average shares outstanding.
2 Total returns do not include account service fees that may have applied in the periods shown. Fund prospectuses provide information about any applicable account service fees.
3 Excludes the value of portfolio securities received or delivered as a result of in-kind purchases or redemptions of the fund’s capital shares, including ETF Creation Units.
Financial Highlights
See accompanying Notes, which are an integral part of the Financial Statements.
Extended Market Index Fund
26
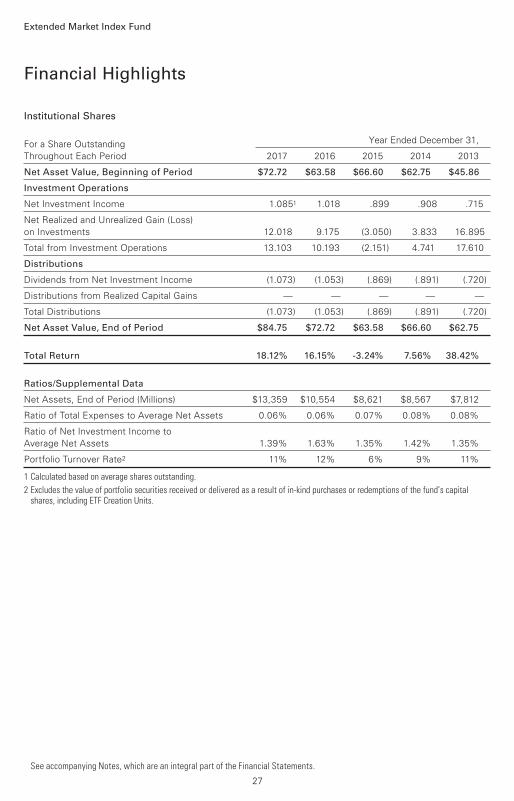
Institutional Shares
For a Share Outstanding Year Ended December 31,
Throughout Each Period 2017 2016 2015 2014 2013
Net Asset Value, Beginning of Period $72.72 $63.58 $66.60 $62.75 $45.86
Investment Operations
Net Investment Income 1.0851 1.018 .899 .908 .715
Net Realized and Unrealized Gain (Loss)
on Investments 12.018 9.175 (3.050) 3.833 16.895
Total from Investment Operations 13.103 10.193 (2.151) 4.741 17.610
Distributions
Dividends from Net Investment Income (1.073) (1.053) (.869) (.891) (.720)
Distributions from Realized Capital Gains — — — — —
Total Distributions (1.073) (1.053) (.869) (.891) (.720)
Net Asset Value, End of Period $84.75 $72.72 $63.58 $66.60 $62.75
Total Return 18.12% 16.15% -3.24% 7.56% 38.42%
Ratios/Supplemental Data
Net Assets, End of Period (Millions) $13,359 $10,554 $8,621 $8,567 $7,812
Ratio of Total Expenses to Average Net Assets 0.06% 0.06% 0.07% 0.08% 0.08%
Ratio of Net Investment Income to
Average Net Assets 1.39% 1.63% 1.35% 1.42% 1.35%
Portfolio Turnover Rate2 11% 12% 6% 9% 11%
1 Calculated based on average shares outstanding.
2 Excludes the value of portfolio securities received or delivered as a result of in-kind purchases or redemptions of the fund’s capital shares, including ETF Creation Units.
Financial Highlights
See accompanying Notes, which are an integral part of the Financial Statements.
Extended Market Index Fund
27
Financial Highlights
See accompanying Notes, which are an integral part of the Financial Statements.
Extended Market Index Fund
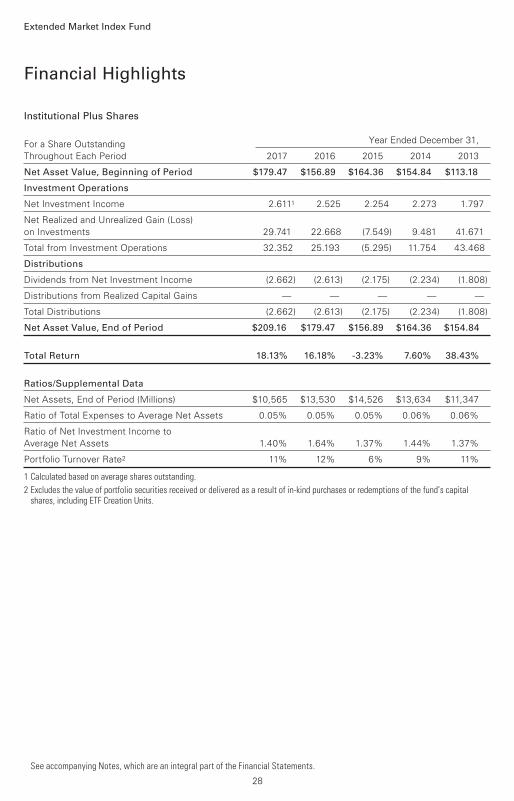
Institutional Plus Shares
For a Share Outstanding Year Ended December 31,
Throughout Each Period 2017 2016 2015 2014 2013
Net Asset Value, Beginning of Period $179.47 $156.89 $164.36 $154.84 $113.18
Investment Operations
Net Investment Income 2.6111 2.525 2.254 2.273 1.797
Net Realized and Unrealized Gain (Loss)
on Investments 29.741 22.668 (7.549) 9.481 41.671
Total from Investment Operations 32.352 25.193 (5.295) 11.754 43.468
Distributions
Dividends from Net Investment Income (2.662) (2.613) (2.175) (2.234) (1.808)
Distributions from Realized Capital Gains — — — — —
Total Distributions (2.662) (2.613) (2.175) (2.234) (1.808)
Net Asset Value, End of Period $209.16 $179.47 $156.89 $164.36 $154.84
Total Return 18.13% 16.18% -3.23% 7.60% 38.43%
Ratios/Supplemental Data
Net Assets, End of Period (Millions) $10,565 $13,530 $14,526 $13,634 $11,347
Ratio of Total Expenses to Average Net Assets 0.05% 0.05% 0.05% 0.06% 0.06%
Ratio of Net Investment Income to
Average Net Assets 1.40% 1.64% 1.37% 1.44% 1.37%
Portfolio Turnover Rate2 11% 12% 6% 9% 11%
1 Calculated based on average shares outstanding.
2 Excludes the value of portfolio securities received or delivered as a result of in-kind purchases or redemptions of the fund’s capital shares, including ETF Creation Units.
28
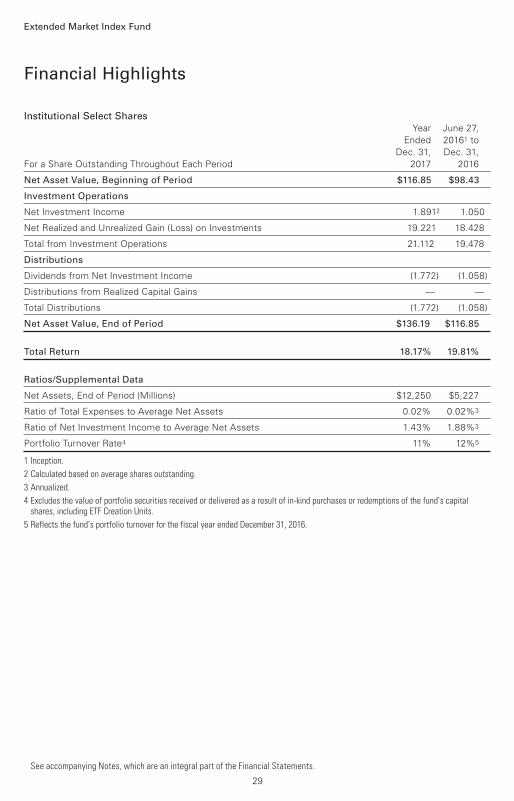
Institutional Select Shares
Year June 27,
Ended 20161 to
Dec. 31, Dec. 31,
For a Share Outstanding Throughout Each Period 2017 2016
Net Asset Value, Beginning of Period $116.85 $98.43
Investment Operations
Net Investment Income 1.8912 1.050
Net Realized and Unrealized Gain (Loss) on Investments 19.221 18.428
Total from Investment Operations 21.112 19.478
Distributions
Dividends from Net Investment Income (1.772) (1.058)
Distributions from Realized Capital Gains — —
Total Distributions (1.772) (1.058)
Net Asset Value, End of Period $136.19 $116.85
Total Return 18.17% 19.81%
Ratios/Supplemental Data
Net Assets, End of Period (Millions) $12,250 $5,227
Ratio of Total Expenses to Average Net Assets 0.02% 0.02%3
Ratio of Net Investment Income to Average Net Assets 1.43% 1.88%3
Portfolio Turnover Rate4 11% 12%5
1 Inception.
2 Calculated based on average shares outstanding.
3 Annualized.
4 Excludes the value of portfolio securities received or delivered as a result of in-kind purchases or redemptions of the fund’s capital shares, including ETF Creation Units.
5 Reflects the fund’s portfolio turnover for the fiscal year ended December 31, 2016.
Financial Highlights
See accompanying Notes, which are an integral part of the Financial Statements.
Extended Market Index Fund
29
Notes to Financial Statements
Extended Market Index Fund
Vanguard Extended Market Index Fund is registered under the Investment Company Act of 1940
as an open-end investment company, or mutual fund. The fund offers six classes of shares:
Investor Shares, ETF Shares, Admiral Shares, Institutional Shares, Institutional Plus Shares, and
Institutional Select Shares. Investor Shares are available to any investor who meets the fund’s
minimum purchase requirements. ETF Shares are listed for trading on NYSE Arca; they can be
purchased and sold through a broker. Admiral Shares, Institutional Shares, Institutional Plus
Shares, and Institutional Select Shares are designed for investors who meet certain administrative,
service, and account-size criteria.
A. The following significant accounting policies conform to generally accepted accounting
principles for U.S. investment companies. The fund consistently follows such policies in
preparing its financial statements.
1. Security Valuation: Securities are valued as of the close of trading on the New York Stock
Exchange (generally 4 p.m., Eastern time) on the valuation date. Equity securities are valued at
the latest quoted sales prices or official closing prices taken from the primary market in which
each security trades; such securities not traded on the valuation date are valued at the mean
of the latest quoted bid and asked prices. Securities for which market quotations are not readily
available, or whose values have been materially affected by events occurring before the fund’s
pricing time but after the close of the securities’ primary markets, are valued by methods deemed
by the board of trustees to represent fair value. Investments in Vanguard Market Liquidity Fund are
valued at that fund’s net asset value. Temporary cash investments are valued using the latest bid
prices or using valuations based on a matrix system (which considers such factors as security
prices, yields, maturities, and ratings), both as furnished by independent pricing services.
2. Futures Contracts: The fund uses index futures contracts to a limited extent, with the objectives of
maintaining full exposure to the stock market, maintaining liquidity, and minimizing transaction
costs. The fund may purchase futures contracts to immediately invest incoming cash in the
market, or sell futures in response to cash outflows, thereby simulating a fully invested position
in the underlying index while maintaining a cash balance for liquidity. The primary risks associated
with the use of futures contracts are imperfect correlation between changes in market values
of stocks held by the fund and the prices of futures contracts, and the possibility of an illiquid
market. Counterparty risk involving futures is mitigated because a regulated clearinghouse
is the counterparty instead of the clearing broker. To further mitigate counterparty risk, the fund
trades futures contracts on an exchange, monitors the financial strength of its clearing brokers
and clearinghouse, and has entered into clearing agreements with its clearing brokers. The
clearinghouse imposes initial margin requirements to secure the fund’s performance and requires
daily settlement of variation margin representing changes in the market value of each contract.
Futures contracts are valued at their quoted daily settlement prices. The notional amounts
of the contracts are not recorded in the Statement of Net Assets. Fluctuations in the value
of the contracts are recorded in the Statement of Net Assets as an asset (liability) and in the
Statement of Operations as unrealized appreciation (depreciation) until the contracts are closed,
when they are recorded as realized futures gains (losses).
30
Extended Market Index Fund
During the year ended December 31, 2017, the fund’s average investments in long and short
futures contracts represented less than 1% and 0% of net assets, respectively, based on the
average of the notional amounts at each quarter-end during the period.
3. Swap Contracts: The fund has entered into equity swap contracts to earn the total return
on selected reference stocks in the fund’s target index. Under the terms of the swaps, the fund
receives the total return on the referenced stock (i.e., receiving the increase or paying the decrease
in value of the selected reference stock and receiving the equivalent of any dividends in respect
of the selected referenced stock) over a specified period of time, applied to a notional amount that
represents the value of a designated number of shares of the selected reference stock at the
beginning of the equity swap contract. The fund also pays a floating rate that is based on short-
term interest rates, applied to the notional amount. At the same time, the fund invests an amount
approximating the notional amount of the swap in high-quality temporary cash investments.
The notional amounts of swap contracts are not recorded in the Statement of Net Assets.
Swaps are valued daily based on market quotations received from independent pricing services
or recognized dealers and the change in value is recorded in the Statement of Net Assets as an
asset (liability) and in the Statement of Operations as unrealized appreciation (depreciation) until
termination of the swap, at which time realized gain (loss) is recorded. A risk associated with all
types of swaps is the possibility that a counterparty may default on its obligation to pay net
amounts due to the fund. The fund’s maximum amount subject to counterparty risk is the
unrealized appreciation on the swap contract. The fund mitigates its counterparty risk by
entering into swaps only with a diverse group of prequalified counterparties, monitoring their
financial strength, entering into master netting arrangements with its counterparties,
and requiring its counterparties to transfer collateral as security for their performance. In the
absence of a default, the collateral pledged or received by the fund cannot be repledged,
resold, or rehypothecated. In the event of a counterparty’s default (including bankruptcy), the
fund may terminate any swap contracts with that counterparty, determine the net amount owed
by either party in accordance with its master netting arrangements, and sell or retain any collateral
held up to the net amount owed to the fund under the master netting arrangements. The swap
contracts contain provisions whereby a counterparty may terminate open contracts if the fund net
assets decline below a certain level, triggering a payment by the fund if the fund is in a net liability
position at the time of the termination. The payment amount would be reduced by any collateral
the fund has pledged. Any securities pledged as collateral for open contracts are noted in the
Statement of Net Assets. The value of collateral received or pledged is compared daily to the
value of the swap contracts exposure with each counterparty, and any difference, if in excess
of a specified minimum transfer amount, is adjusted and settled within two business days.
During the year ended December 31, 2017, the fund’s average amounts of investments in total
return swaps represented less than 1% of net assets, based on the average of notional amounts
at each quarter-end during the period.
4. Federal Income Taxes: The fund intends to continue to qualify as a regulated investment
company and distribute all of its taxable income. Management has analyzed the fund’s tax
positions taken for all open federal income tax years (December 31, 2014–2017), and has
concluded that no provision for federal income tax is required in the fund’s financial statements.
31
Extended Market Index Fund
5. Distributions: Distributions to shareholders are recorded on the ex-dividend date.
6. Securities Lending: To earn additional income, the fund lends its securities to qualified
institutional borrowers. Security loans are subject to termination by the fund at any time, and
are required to be secured at all times by collateral in an amount at least equal to the market
value of securities loaned. Daily market fluctuations could cause the value of loaned securities
to be more or less than the value of the collateral received. When this occurs, the collateral
is adjusted and settled on the next business day. The fund further mitigates its counterparty
risk by entering into securities lending transactions only with a diverse group of prequalified
counterparties, monitoring their financial strength, and entering into master securities lending
agreements with its counterparties. The master securities lending agreements provide that,
in the event of a counterparty’s default (including bankruptcy), the fund may terminate any loans
with that borrower, determine the net amount owed, and sell or retain the collateral up to the
net amount owed to the fund; however, such actions may be subject to legal proceedings. While
collateral mitigates counterparty risk, in the event of a default, the fund may experience delays
and costs in recovering the securities loaned. The fund invests cash collateral received in Vanguard
Market Liquidity Fund, and records a liability in the Statement of Net Assets for the return of the
collateral, during the period the securities are on loan. Securities lending income represents fees
charged to borrowers plus income earned on invested cash collateral, less expenses associated
with the loan. During the term of the loan, the fund is entitled to all distributions made on or in
respect of the loaned securities.
7. Credit Facility: The fund and certain other funds managed by The Vanguard Group (“Vanguard”)
participate in a $3.1 billion committed credit facility provided by a syndicate of lenders pursuant to
a credit agreement that may be renewed annually; each fund is individually liable for its borrowings,
if any, under the credit facility. Borrowings may be utilized for temporary and emergency purposes,
and are subject to the fund’s regulatory and contractual borrowing restrictions. The participating
funds are charged administrative fees and an annual commitment fee of 0.10% of the undrawn
amount of the facility; these fees are allocated to the funds based on a method approved by the
fund’s board of trustees and included in Management and Administrative expenses on the fund’s
Statement of Operations. Any borrowings under this facility bear interest at a rate based upon the
higher of the one-month London Interbank Offered Rate, federal funds effective rate, or overnight
bank funding rate plus an agreed-upon spread.
The fund had no borrowings outstanding at December 31, 2017, or at any time during the period
then ended.
8. Other: Dividend income is recorded on the ex-dividend date. Interest income includes income
distributions received from Vanguard Market Liquidity Fund and is accrued daily. Premiums and
discounts on debt securities purchased are amortized and accreted, respectively, to interest
income over the lives of the respective securities. Security transactions are accounted for on the
date securities are bought or sold. Costs used to determine realized gains (losses) on the sale of
investment securities are those of the specific securities sold.
32
Extended Market Index Fund
Each class of shares has equal rights as to assets and earnings, except that each class separately
bears certain class-specific expenses related to maintenance of shareholder accounts (included in
Management and Administrative expenses), shareholder reporting, and the proxy. Marketing and
distribution expenses are allocated to each class of shares based on a method approved by the
board of trustees. Income, other non-class-specific expenses, and gains and losses on investments
are allocated to each class of shares based on its relative net assets.
B. In accordance with the terms of a Funds’ Service Agreement (the “FSA”) between Vanguard
and the fund, Vanguard furnishes to the fund investment advisory, corporate management,
administrative, marketing, and distribution services at Vanguard’s cost of operations (as defined
by the FSA). These costs of operations are allocated to the fund based on methods and guidelines
approved by the board of trustees. Vanguard does not require reimbursement in the current period
for certain costs of operations (such as deferred compensation/benefits and risk/insurance costs);
the fund’s liability for these costs of operations is included in Payables to Vanguard on the
Statement of Net Assets.
Upon the request of Vanguard, the fund may invest up to 0.40% of its net assets as capital
in Vanguard. At December 31, 2017, the fund had contributed to Vanguard capital in the amount
of $3,466,000, representing 0.01% of the fund’s net assets and 1.39% of Vanguard’s capitalization.
The fund’s trustees and officers are also directors and employees, respectively, of Vanguard.
C. Various inputs may be used to determine the value of the fund’s investments. These inputs
are summarized in three broad levels for financial statement purposes. The inputs or methodologies
used to value securities are not necessarily an indication of the risk associated with investing
in those securities.
Level 1—Quoted prices in active markets for identical securities.
Level 2—Other significant observable inputs (including quoted prices for similar securities, interest
rates, prepayment speeds, credit risk, etc.).
Level 3—Significant unobservable inputs (including the fund’s own assumptions used to determine
the fair value of investments). Any investments valued with significant unobservable inputs are
noted on the Statement of Net Assets.
The following table summarizes the market value of the fund’s investments as of December 31,
2017, based on the inputs used to value them:
Level 1 Level 2 Level 3
Investments ($000) ($000) ($000)
Common Stocks 62,600,249 11 4,537
Temporary Cash Investments 1,528,646 40,738 —
Futures Contracts—Liabilities1 (4,481) — —
Swap Contracts—Assets — 352 —
Swap Contracts—Liabilities — (4) —
Total 64,124,414 41,097 4,537
1 Represents variation margin on the last day of the reporting period.
33
Extended Market Index Fund
D. Distributions are determined on a tax basis and may differ from net investment income and
realized capital gains for financial reporting purposes. Differences may be permanent or temporary.
Permanent differences are reclassified among capital accounts in the financial statements to reflect
their tax character. Temporary differences arise when certain items of income, expense, gain,
or loss are recognized in different periods for financial statement and tax purposes. These
differences will reverse at some time in the future. Differences in classification may also result
from the treatment of short-term gains as ordinary income for tax purposes.
During the year ended December 31, 2017, the fund realized $2,570,553,000 of net capital gains
resulting from in-kind redemptions—in which shareholders exchanged fund shares for securities
held by the fund rather than for cash. Because such gains are not taxable to the fund, and are not
distributed to shareholders, they have been reclassified from accumulated net realized losses to
paid-in capital.
For tax purposes, at December 31, 2017, the fund had $13,850,000 of ordinary income available
for distribution. At December 31, 2017, the fund had available capital losses totaling $1,163,440,000
to offset future net capital gains. Of this amount, $24,584,000 is subject to expiration on
December 31, 2018. Capital loss carryforwards of $49,578,000 expired on December 31, 2017;
accordingly, such losses have been reclassified from accumulated net realized losses to paid-in
capital. Capital losses of $1,138,856,000 realized beginning in fiscal 2011 may be carried forward
indefinitely under the Regulated Investment Company Modernization Act of 2010, but must be
used before any expiring loss carryforwards.
At December 31, 2017, the cost of investment securities for tax purposes was $46,977,167,000.
Net unrealized appreciation of investment securities for tax purposes was $17,197,014,000,
consisting of unrealized gains of $20,180,906,000 on securities that had risen in value since
their purchase and $2,983,892,000 in unrealized losses on securities that had fallen in value
since their purchase.
E. During the year ended December 31, 2017, the fund purchased $13,797,239,000
of investment securities and sold $11,247,337,000 of investment securities, other
than temporary cash investments. Purchases and sales include $5,479,430,000
and $5,132,920,000, respectively, in connection with in-kind purchases and redemptions
of the fund’s capital shares.
34
Extended Market Index Fund
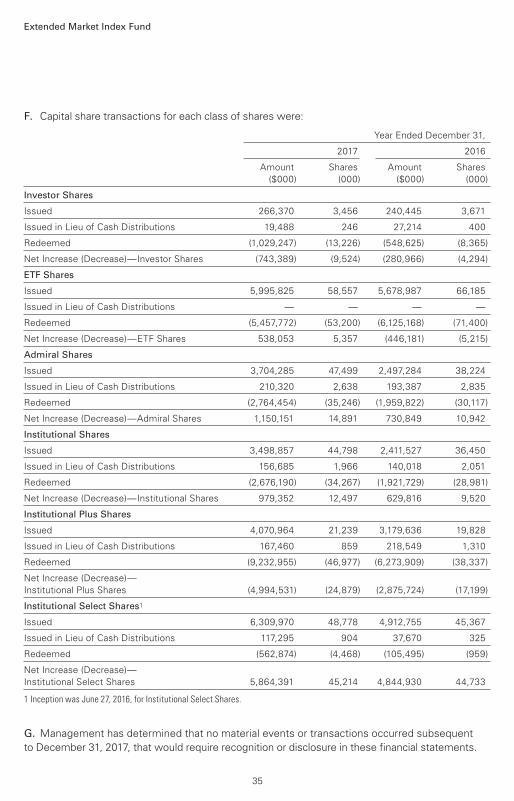
F. Capital share transactions for each class of shares were:
Year Ended December 31,
2017 2016
Amount Shares Amount Shares
($000) (000) ($000) (000)
Investor Shares
Issued 266,370 3,456 240,445 3,671
Issued in Lieu of Cash Distributions 19,488 246 27,214 400
Redeemed (1,029,247) (13,226) (548,625) (8,365)
Net Increase (Decrease)—Investor Shares (743,389) (9,524) (280,966) (4,294)
ETF Shares
Issued 5,995,825 58,557 5,678,987 66,185
Issued in Lieu of Cash Distributions — — — —
Redeemed (5,457,772) (53,200) (6,125,168) (71,400)
Net Increase (Decrease)—ETF Shares 538,053 5,357 (446,181) (5,215)
Admiral Shares
Issued 3,704,285 47,499 2,497,284 38,224
Issued in Lieu of Cash Distributions 210,320 2,638 193,387 2,835
Redeemed (2,764,454) (35,246) (1,959,822) (30,117)
Net Increase (Decrease)—Admiral Shares 1,150,151 14,891 730,849 10,942
Institutional Shares
Issued 3,498,857 44,798 2,411,527 36,450
Issued in Lieu of Cash Distributions 156,685 1,966 140,018 2,051
Redeemed (2,676,190) (34,267) (1,921,729) (28,981)
Net Increase (Decrease)—Institutional Shares 979,352 12,497 629,816 9,520
Institutional Plus Shares
Issued 4,070,964 21,239 3,179,636 19,828
Issued in Lieu of Cash Distributions 167,460 859 218,549 1,310
Redeemed (9,232,955) (46,977) (6,273,909) (38,337)
Net Increase (Decrease)—
Institutional Plus Shares (4,994,531) (24,879) (2,875,724) (17,199)
Institutional Select Shares1
Issued 6,309,970 48,778 4,912,755 45,367
Issued in Lieu of Cash Distributions 117,295 904 37,670 325
Redeemed (562,874) (4,468) (105,495) (959)
Net Increase (Decrease)—
Institutional Select Shares 5,864,391 45,214 4,844,930 44,733
1 Inception was June 27, 2016, for Institutional Select Shares.
G. Management has determined that no material events or transactions occurred subsequent
to December 31, 2017, that would require recognition or disclosure in these financial statements.
35
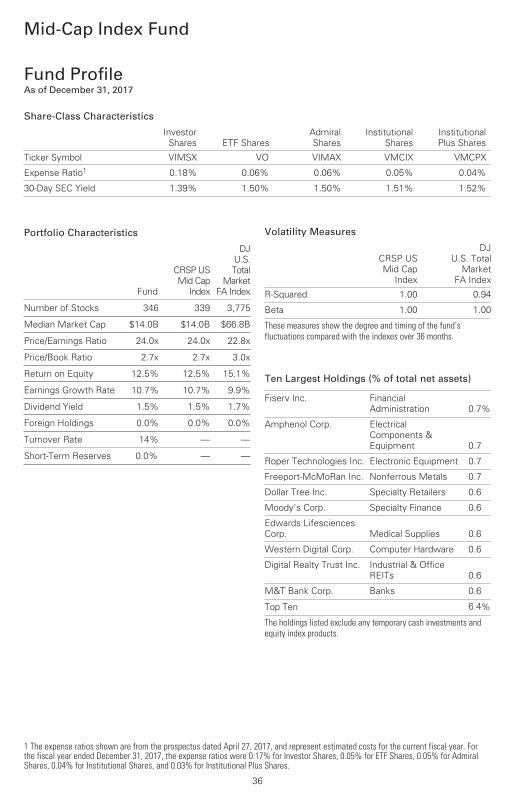
Mid-Cap Index Fund
Fund ProfileAs of December 31, 2017
1 The expense ratios shown are from the prospectus dated April 27, 2017, and represent estimated costs for the current fiscal year. Forthe fiscal year ended December 31, 2017, the expense ratios were 0.17% for Investor Shares, 0.05% for ETF Shares, 0.05% for AdmiralShares, 0.04% for Institutional Shares, and 0.03% for Institutional Plus Shares.
36
Share-Class Characteristics
Investor
Shares ETF Shares
Admiral
Shares
Institutional
Shares
Institutional
Plus Shares
Ticker Symbol VIMSX VO VIMAX VMCIX VMCPX
Expense Ratio1 0.18% 0.06% 0.06% 0.05% 0.04%
30-Day SEC Yield 1.39% 1.50% 1.50% 1.51% 1.52%
Volatility Measures
CRSP US
Mid Cap
Index
DJ
U.S. Total
Market
FA Index
R-Squared 1.00 0.94
Beta 1.00 1.00
These measures show the degree and timing of the fund’s fluctuations compared with the indexes over 36 months.
Ten Largest Holdings (% of total net assets)
Fiserv Inc. Financial
Administration 0.7%
Amphenol Corp. Electrical
Components &
Equipment 0.7
Roper Technologies Inc. Electronic Equipment 0.7
Freeport-McMoRan Inc. Nonferrous Metals 0.7
Dollar Tree Inc. Specialty Retailers 0.6
Moody's Corp. Specialty Finance 0.6
Edwards Lifesciences
Corp. Medical Supplies 0.6
Western Digital Corp. Computer Hardware 0.6
Digital Realty Trust Inc. Industrial & Office
REITs 0.6
M&T Bank Corp. Banks 0.6
Top Ten 6.4%
The holdings listed exclude any temporary cash investments andequity index products.
Portfolio Characteristics
Fund
CRSP US
Mid Cap
Index
DJ
U.S.
Total
Market
FA Index
Number of Stocks 346 339 3,775
Median Market Cap $14.0B $14.0B $66.8B
Price/Earnings Ratio 24.0x 24.0x 22.8x
Price/Book Ratio 2.7x 2.7x 3.0x
Return on Equity 12.5% 12.5% 15.1%
Earnings Growth Rate 10.7% 10.7% 9.9%
Dividend Yield 1.5% 1.5% 1.7%
Foreign Holdings 0.0% 0.0% 0.0%
Turnover Rate 14% — —
Short-Term Reserves 0.0% — —
Investment Focus
Market Cap
Value
Large
Medium
Small
Blend Growth Style
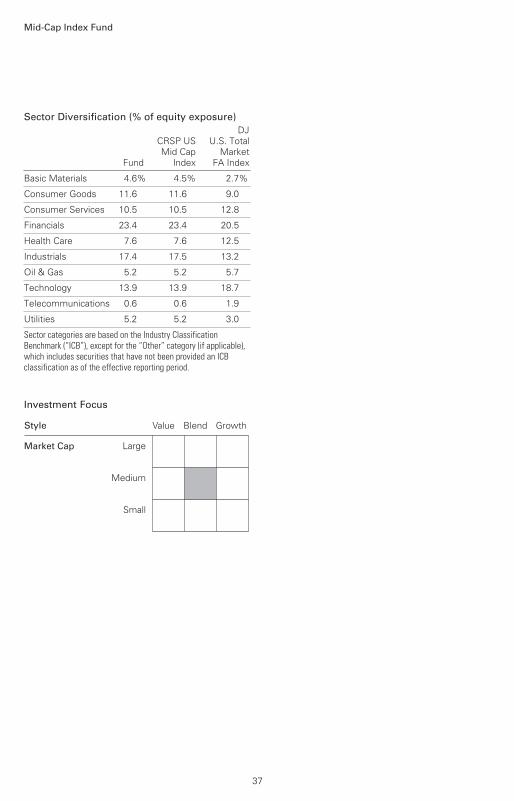
Mid-Cap Index Fund
Sector Diversification (% of equity exposure)
Fund
CRSP USMid Cap
Index
DJU.S. Total
MarketFA Index
Basic Materials 4.6% 4.5% 2.7%
Consumer Goods 11.6 11.6 9.0
Consumer Services 10.5 10.5 12.8
Financials 23.4 23.4 20.5
Health Care 7.6 7.6 12.5
Industrials 17.4 17.5 13.2
Oil & Gas 5.2 5.2 5.7
Technology 13.9 13.9 18.7
Telecommunications 0.6 0.6 1.9
Utilities 5.2 5.2 3.0
Sector categories are based on the Industry ClassificationBenchmark (“ICB”), except for the “Other” category (if applicable),which includes securities that have not been provided an ICBclassification as of the effective reporting period.
37
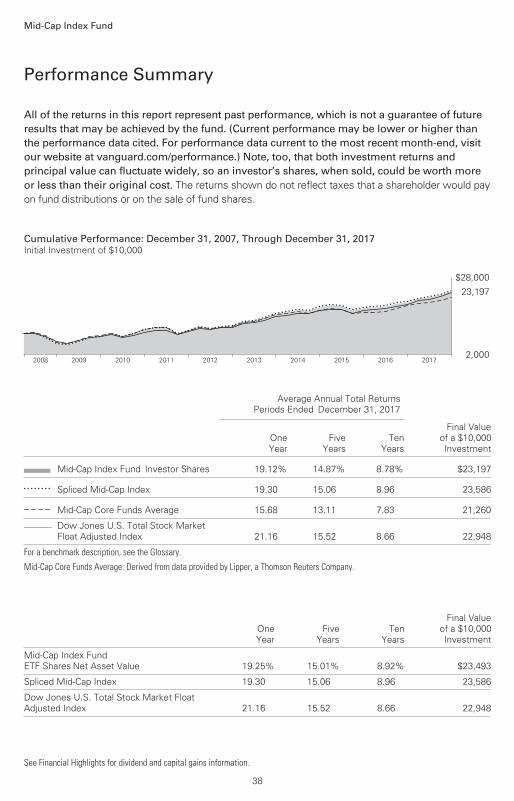
All of the returns in this report represent past performance, which is not a guarantee of future results that may be achieved by the fund. (Current performance may be lower or higher thanthe performance data cited. For performance data current to the most recent month-end, visitour website at vanguard.com/performance.) Note, too, that both investment returns and principal value can fluctuate widely, so an investor’s shares, when sold, could be worth more or less than their original cost. The returns shown do not reflect taxes that a shareholder would pay
on fund distributions or on the sale of fund shares.
Performance Summary
Mid-Cap Index Fund
See Financial Highlights for dividend and capital gains information.
38
Cumulative Performance: December 31, 2007, Through December 31, 2017Initial Investment of $10,000
2017201620152014201320122011201020092008
$28,000
2,000
23,197
Average Annual Total Returns
Periods Ended December 31, 2017
OneYear
FiveYears
TenYears
Final Valueof a $10,000Investment
Mid-Cap Index Fund*Investor Shares 19.12% 14.87% 8.78% $23,197
• • • • • • • • Spliced Mid-Cap Index 19.30 15.06 8.96 23,586
– – – – Mid-Cap Core Funds Average 15.68 13.11 7.83 21,260________ Dow Jones U.S. Total Stock Market
Float Adjusted Index 21.16 15.52 8.66 22,948
For a benchmark description, see the Glossary.
Mid-Cap Core Funds Average: Derived from data provided by Lipper, a Thomson Reuters Company.
OneYear
FiveYears
TenYears
Final Valueof a $10,000Investment
Mid-Cap Index FundETF Shares Net Asset Value 19.25% 15.01% 8.92% $23,493
Spliced Mid-Cap Index 19.30 15.06 8.96 23,586
Dow Jones U.S. Total Stock Market FloatAdjusted Index 21.16 15.52 8.66 22,948
Mid-Cap Index Fund
39
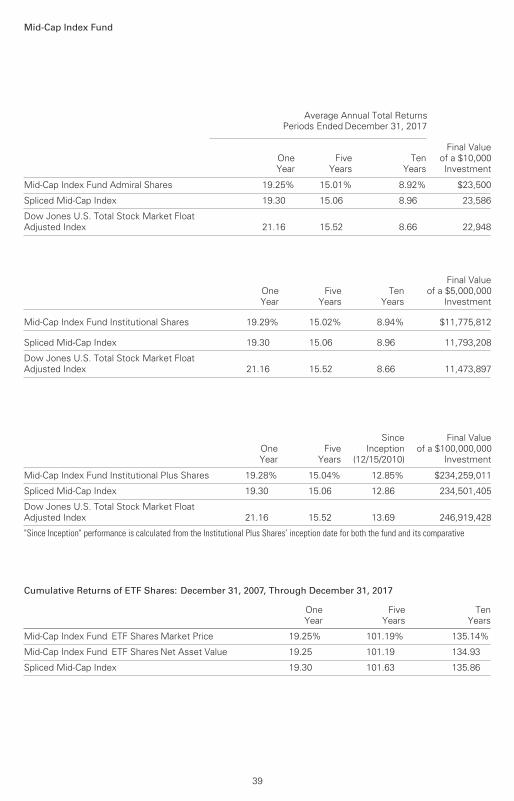
Average Annual Total Returns
Periods Ended December 31, 2017
OneYear
FiveYears
TenYears
Final Valueof a $10,000Investment
Mid-Cap Index Fund Admiral Shares 19.25% 15.01% 8.92% $23,500
Spliced Mid-Cap Index 19.30 15.06 8.96 23,586
Dow Jones U.S. Total Stock Market Float Adjusted Index 21.16 15.52 8.66 22,948
OneYear
FiveYears
TenYears
Final Valueof a $5,000,000
Investment
Mid-Cap Index Fund Institutional Shares 19.29% 15.02% 8.94% $11,775,812
Spliced Mid-Cap Index 19.30 15.06 8.96 11,793,208
Dow Jones U.S. Total Stock Market FloatAdjusted Index 21.16 15.52 8.66 11,473,897
OneYear
FiveYears
SinceInception
(12/15/2010)
Final Valueof a $100,000,000
Investment
Mid-Cap Index Fund Institutional Plus Shares 19.28% 15.04% 12.85% $234,259,011
Spliced Mid-Cap Index 19.30 15.06 12.86 234,501,405
Dow Jones U.S. Total Stock Market FloatAdjusted Index 21.16 15.52 13.69 246,919,428
"Since Inception" performance is calculated from the Institutional Plus Shares’ inception date for both the fund and its comparative
Cumulative Returns of ETF Shares: December 31, 2007, Through December 31, 2017
OneYear
FiveYears
TenYears
Mid-Cap Index Fund ETF Shares Market Price 19.25% 101.19% 135.14%
Mid-Cap Index Fund ETF Shares Net Asset Value 19.25 101.19 134.93
Spliced Mid-Cap Index 19.30 101.63 135.86
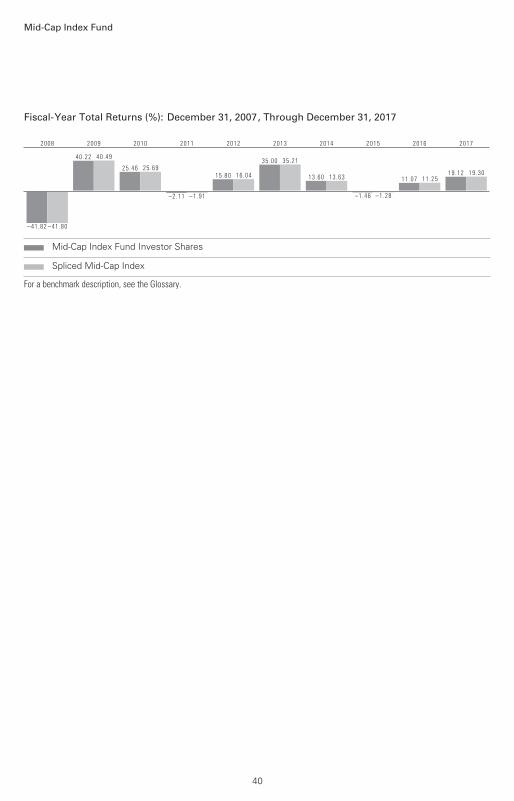
Mid-Cap Index Fund
40
Fiscal-Year Total Returns (%): December 31, 2007, Through December 31, 2017
–41.82 –41.80
2008
40 .22 40 .49
2009
25 .46 25 .69
2010
–2.11 –1.91
2011
15 .80 16 .04
2012
35 .00 35 .21
2013
13 .60 13 .63
2014
–1.46 –1.28
2015
11 .07 11 .25
2016
19 .12 19 .30
2017
Mid-Cap Index Fund Investor Shares
Spliced Mid-Cap Index
For a benchmark description, see the Glossary.
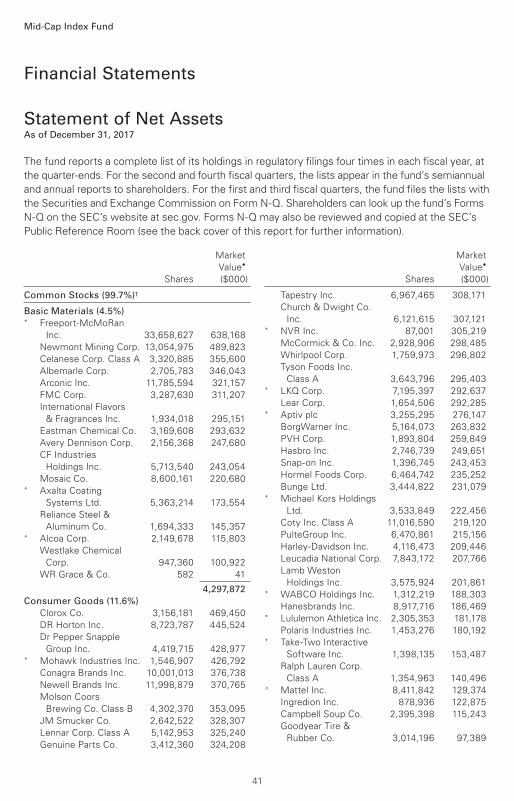
Market
Value•
Shares ($000)
Market
Value•
Shares ($000)
Common Stocks (99.7%)1
Basic Materials (4.5%) * Freeport-McMoRan
Inc. 33,658,627 638,168
Newmont Mining Corp. 13,054,975 489,823
Celanese Corp. Class A 3,320,885 355,600
Albemarle Corp. 2,705,783 346,043
Arconic Inc. 11,785,594 321,157
FMC Corp. 3,287,630 311,207
International Flavors
& Fragrances Inc. 1,934,018 295,151
Eastman Chemical Co. 3,169,608 293,632
Avery Dennison Corp. 2,156,368 247,680
CF Industries
Holdings Inc. 5,713,540 243,054
Mosaic Co. 8,600,161 220,680* Axalta Coating
Systems Ltd. 5,363,214 173,554
Reliance Steel &
Aluminum Co. 1,694,333 145,357* Alcoa Corp. 2,149,678 115,803
Westlake Chemical
Corp. 947,360 100,922
WR Grace & Co. 582 41
4,297,872
Consumer Goods (11.6%)
Clorox Co. 3,156,181 469,450
DR Horton Inc. 8,723,787 445,524
Dr Pepper Snapple
Group Inc. 4,419,715 428,977* Mohawk Industries Inc. 1,546,907 426,792
Conagra Brands Inc. 10,001,013 376,738
Newell Brands Inc. 11,998,879 370,765
Molson Coors
Brewing Co. Class B 4,302,370 353,095
JM Smucker Co. 2,642,522 328,307
Lennar Corp. Class A 5,142,953 325,240
Genuine Parts Co. 3,412,360 324,208
Tapestry Inc. 6,967,465 308,171
Church & Dwight Co.
Inc. 6,121,615 307,121* NVR Inc. 87,001 305,219
McCormick & Co. Inc. 2,928,906 298,485
Whirlpool Corp. 1,759,973 296,802
Tyson Foods Inc.
Class A 3,643,796 295,403* LKQ Corp. 7,195,397 292,637
Lear Corp. 1,654,506 292,285* Aptiv plc 3,255,295 276,147
BorgWarner Inc. 5,164,073 263,832
PVH Corp. 1,893,804 259,849
Hasbro Inc. 2,746,739 249,651
Snap-on Inc. 1,396,745 243,453
Hormel Foods Corp. 6,464,742 235,252
Bunge Ltd. 3,444,822 231,079* Michael Kors Holdings
Ltd. 3,533,849 222,456
Coty Inc. Class A 11,016,590 219,120
PulteGroup Inc. 6,470,861 215,156
Harley-Davidson Inc. 4,116,473 209,446
Leucadia National Corp. 7,843,172 207,766
Lamb Weston
Holdings Inc. 3,575,924 201,861* WABCO Holdings Inc. 1,312,219 188,303
Hanesbrands Inc. 8,917,716 186,469* Lululemon Athletica Inc. 2,305,353 181,178
Polaris Industries Inc. 1,453,276 180,192* Take-Two Interactive
Software Inc. 1,398,135 153,487
Ralph Lauren Corp.
Class A 1,354,963 140,496^ Mattel Inc. 8,411,842 129,374
Ingredion Inc. 878,936 122,875
Campbell Soup Co. 2,395,398 115,243
Goodyear Tire &
Rubber Co. 3,014,196 97,389
Financial Statements
Statement of Net AssetsAs of December 31, 2017
The fund reports a complete list of its holdings in regulatory filings four times in each fiscal year, at
the quarter-ends. For the second and fourth fiscal quarters, the lists appear in the fund’s semiannual
and annual reports to shareholders. For the first and third fiscal quarters, the fund files the lists with
the Securities and Exchange Commission on Form N-Q. Shareholders can look up the fund’s Forms
N-Q on the SEC’s website at sec.gov. Forms N-Q may also be reviewed and copied at the SEC’s
Public Reference Room (see the back cover of this report for further information).
Mid-Cap Index Fund
41
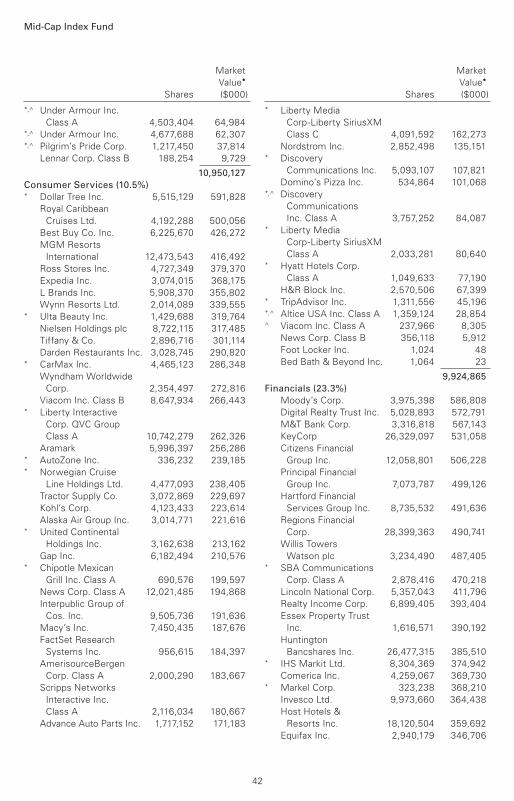
Mid-Cap Index Fund
Market
Value•
Shares ($000)
Market
Value•
Shares ($000)
*,^ Under Armour Inc.
Class A 4,503,404 64,984*,^ Under Armour Inc. 4,677,688 62,307*,^ Pilgrim’s Pride Corp. 1,217,450 37,814
Lennar Corp. Class B 188,254 9,729
10,950,127
Consumer Services (10.5%) * Dollar Tree Inc. 5,515,129 591,828
Royal Caribbean
Cruises Ltd. 4,192,288 500,056
Best Buy Co. Inc. 6,225,670 426,272
MGM Resorts
International 12,473,543 416,492
Ross Stores Inc. 4,727,349 379,370
Expedia Inc. 3,074,015 368,175
L Brands Inc. 5,908,370 355,802
Wynn Resorts Ltd. 2,014,089 339,555* Ulta Beauty Inc. 1,429,688 319,764
Nielsen Holdings plc 8,722,115 317,485
Tiffany & Co. 2,896,716 301,114
Darden Restaurants Inc. 3,028,745 290,820* CarMax Inc. 4,465,123 286,348
Wyndham Worldwide
Corp. 2,354,497 272,816
Viacom Inc. Class B 8,647,934 266,443* Liberty Interactive
Corp. QVC Group
Class A 10,742,279 262,326
Aramark 5,996,397 256,286* AutoZone Inc. 336,232 239,185* Norwegian Cruise
Line Holdings Ltd. 4,477,093 238,405
Tractor Supply Co. 3,072,869 229,697
Kohl’s Corp. 4,123,433 223,614
Alaska Air Group Inc. 3,014,771 221,616* United Continental
Holdings Inc. 3,162,638 213,162
Gap Inc. 6,182,494 210,576* Chipotle Mexican
Grill Inc. Class A 690,576 199,597
News Corp. Class A 12,021,485 194,868
Interpublic Group of
Cos. Inc. 9,505,736 191,636
Macy’s Inc. 7,450,435 187,676
FactSet Research
Systems Inc. 956,615 184,397
AmerisourceBergen
Corp. Class A 2,000,290 183,667
Scripps Networks
Interactive Inc.
Class A 2,116,034 180,667
Advance Auto Parts Inc. 1,717,152 171,183
* Liberty Media
Corp-Liberty SiriusXM
Class C 4,091,592 162,273
Nordstrom Inc. 2,852,498 135,151* Discovery
Communications Inc. 5,093,107 107,821
Domino’s Pizza Inc. 534,864 101,068*,^ Discovery
Communications
Inc. Class A 3,757,252 84,087* Liberty Media
Corp-Liberty SiriusXM
Class A 2,033,281 80,640* Hyatt Hotels Corp.
Class A 1,049,633 77,190
H&R Block Inc. 2,570,506 67,399* TripAdvisor Inc. 1,311,556 45,196*,^ Altice USA Inc. Class A 1,359,124 28,854^ Viacom Inc. Class A 237,966 8,305
News Corp. Class B 356,118 5,912
Foot Locker Inc. 1,024 48
Bed Bath & Beyond Inc. 1,064 23
9,924,865
Financials (23.3%)
Moody’s Corp. 3,975,398 586,808
Digital Realty Trust Inc. 5,028,893 572,791
M&T Bank Corp. 3,316,818 567,143
KeyCorp 26,329,097 531,058
Citizens Financial
Group Inc. 12,058,801 506,228
Principal Financial
Group Inc. 7,073,787 499,126
Hartford Financial
Services Group Inc. 8,735,532 491,636
Regions Financial
Corp. 28,399,363 490,741
Willis Towers
Watson plc 3,234,490 487,405* SBA Communications
Corp. Class A 2,878,416 470,218
Lincoln National Corp. 5,357,043 411,796
Realty Income Corp. 6,899,405 393,404
Essex Property Trust
Inc. 1,616,571 390,192
Huntington
Bancshares Inc. 26,477,315 385,510* IHS Markit Ltd. 8,304,369 374,942
Comerica Inc. 4,259,067 369,730* Markel Corp. 323,238 368,210
Invesco Ltd. 9,973,660 364,438
Host Hotels &
Resorts Inc. 18,120,504 359,692
Equifax Inc. 2,940,179 346,706
42
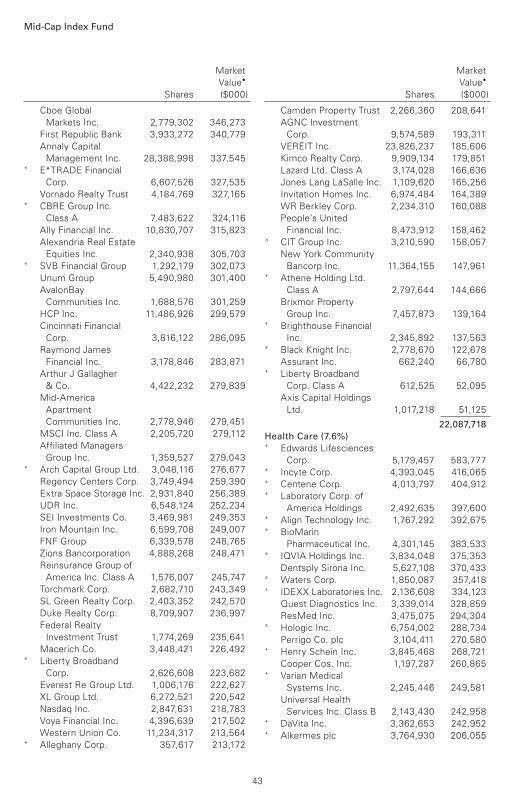
Mid-Cap Index Fund
Market
Value•
Shares ($000)
Market
Value•
Shares ($000)
Cboe Global
Markets Inc. 2,779,302 346,273
First Republic Bank 3,933,272 340,779
Annaly Capital
Management Inc. 28,388,998 337,545* E*TRADE Financial
Corp. 6,607,526 327,535
Vornado Realty Trust 4,184,769 327,165* CBRE Group Inc.
Class A 7,483,622 324,116
Ally Financial Inc. 10,830,707 315,823
Alexandria Real Estate
Equities Inc. 2,340,938 305,703* SVB Financial Group 1,292,179 302,073
Unum Group 5,490,980 301,400
AvalonBay
Communities Inc. 1,688,576 301,259
HCP Inc. 11,486,926 299,579
Cincinnati Financial
Corp. 3,816,122 286,095
Raymond James
Financial Inc. 3,178,846 283,871
Arthur J Gallagher
& Co. 4,422,232 279,839
Mid-America
Apartment
Communities Inc. 2,778,946 279,451
MSCI Inc. Class A 2,205,720 279,112
Affiliated Managers
Group Inc. 1,359,527 279,043* Arch Capital Group Ltd. 3,048,116 276,677
Regency Centers Corp. 3,749,494 259,390
Extra Space Storage Inc. 2,931,840 256,389
UDR Inc. 6,548,124 252,234
SEI Investments Co. 3,469,981 249,353
Iron Mountain Inc. 6,599,708 249,007
FNF Group 6,339,578 248,765
Zions Bancorporation 4,888,268 248,471
Reinsurance Group of
America Inc. Class A 1,576,007 245,747
Torchmark Corp. 2,682,710 243,349
SL Green Realty Corp. 2,403,352 242,570
Duke Realty Corp. 8,709,907 236,997
Federal Realty
Investment Trust 1,774,269 235,641
Macerich Co. 3,448,421 226,492* Liberty Broadband
Corp. 2,626,608 223,682
Everest Re Group Ltd. 1,006,176 222,627
XL Group Ltd. 6,272,521 220,542
Nasdaq Inc. 2,847,631 218,783
Voya Financial Inc. 4,396,639 217,502
Western Union Co. 11,234,317 213,564* Alleghany Corp. 357,617 213,172
Camden Property Trust 2,266,360 208,641
AGNC Investment
Corp. 9,574,589 193,311
VEREIT Inc. 23,826,237 185,606
Kimco Realty Corp. 9,909,134 179,851
Lazard Ltd. Class A 3,174,028 166,636
Jones Lang LaSalle Inc. 1,109,620 165,256
Invitation Homes Inc. 6,974,484 164,389
WR Berkley Corp. 2,234,310 160,088
People’s United
Financial Inc. 8,473,912 158,462^ CIT Group Inc. 3,210,590 158,057
New York Community
Bancorp Inc. 11,364,155 147,961* Athene Holding Ltd.
Class A 2,797,644 144,666
Brixmor Property
Group Inc. 7,457,873 139,164* Brighthouse Financial
Inc. 2,345,892 137,563* Black Knight Inc. 2,778,670 122,678
Assurant Inc. 662,240 66,780* Liberty Broadband
Corp. Class A 612,525 52,095
Axis Capital Holdings
Ltd. 1,017,218 51,125
22,087,718
Health Care (7.6%) * Edwards Lifesciences
Corp. 5,179,457 583,777* Incyte Corp. 4,393,045 416,065* Centene Corp. 4,013,797 404,912* Laboratory Corp. of
America Holdings 2,492,635 397,600* Align Technology Inc. 1,767,292 392,675* BioMarin
Pharmaceutical Inc. 4,301,145 383,533* IQVIA Holdings Inc. 3,834,048 375,353
Dentsply Sirona Inc. 5,627,108 370,433* Waters Corp. 1,850,087 357,418* IDEXX Laboratories Inc. 2,136,608 334,123
Quest Diagnostics Inc. 3,339,014 328,859
ResMed Inc. 3,475,075 294,304* Hologic Inc. 6,754,002 288,734
Perrigo Co. plc 3,104,411 270,580* Henry Schein Inc. 3,845,468 268,721
Cooper Cos. Inc. 1,197,287 260,865* Varian Medical
Systems Inc. 2,245,446 249,581
Universal Health
Services Inc. Class B 2,143,430 242,958* DaVita Inc. 3,362,653 242,952* Alkermes plc 3,764,930 206,055
43
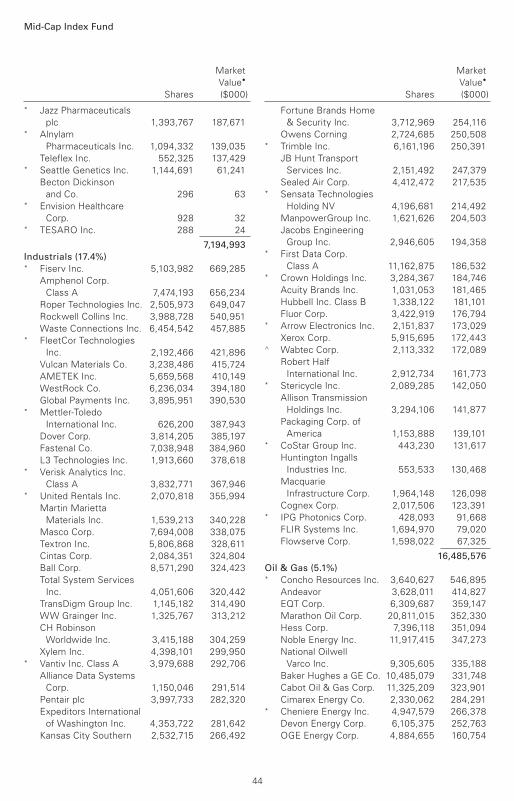
Mid-Cap Index Fund
Market
Value•
Shares ($000)
Market
Value•
Shares ($000)
* Jazz Pharmaceuticals
plc 1,393,767 187,671* Alnylam
Pharmaceuticals Inc. 1,094,332 139,035
Teleflex Inc. 552,325 137,429* Seattle Genetics Inc. 1,144,691 61,241
Becton Dickinson
and Co. 296 63* Envision Healthcare
Corp. 928 32* TESARO Inc. 288 24
7,194,993
Industrials (17.4%) * Fiserv Inc. 5,103,982 669,285
Amphenol Corp.
Class A 7,474,193 656,234
Roper Technologies Inc. 2,505,973 649,047
Rockwell Collins Inc. 3,988,728 540,951
Waste Connections Inc. 6,454,542 457,885* FleetCor Technologies
Inc. 2,192,466 421,896
Vulcan Materials Co. 3,238,486 415,724
AMETEK Inc. 5,659,568 410,149
WestRock Co. 6,236,034 394,180
Global Payments Inc. 3,895,951 390,530* Mettler-Toledo
International Inc. 626,200 387,943
Dover Corp. 3,814,205 385,197
Fastenal Co. 7,038,948 384,960
L3 Technologies Inc. 1,913,660 378,618* Verisk Analytics Inc.
Class A 3,832,771 367,946* United Rentals Inc. 2,070,818 355,994
Martin Marietta
Materials Inc. 1,539,213 340,228
Masco Corp. 7,694,008 338,075
Textron Inc. 5,806,868 328,611
Cintas Corp. 2,084,351 324,804
Ball Corp. 8,571,290 324,423
Total System Services
Inc. 4,051,606 320,442
TransDigm Group Inc. 1,145,182 314,490
WW Grainger Inc. 1,325,767 313,212
CH Robinson
Worldwide Inc. 3,415,188 304,259
Xylem Inc. 4,398,101 299,950* Vantiv Inc. Class A 3,979,688 292,706
Alliance Data Systems
Corp. 1,150,046 291,514
Pentair plc 3,997,733 282,320
Expeditors International
of Washington Inc. 4,353,722 281,642
Kansas City Southern 2,532,715 266,492
Fortune Brands Home
& Security Inc. 3,712,969 254,116
Owens Corning 2,724,685 250,508* Trimble Inc. 6,161,196 250,391
JB Hunt Transport
Services Inc. 2,151,492 247,379
Sealed Air Corp. 4,412,472 217,535* Sensata Technologies
Holding NV 4,196,681 214,492
ManpowerGroup Inc. 1,621,626 204,503
Jacobs Engineering
Group Inc. 2,946,605 194,358* First Data Corp.
Class A 11,162,875 186,532* Crown Holdings Inc. 3,284,367 184,746
Acuity Brands Inc. 1,031,053 181,465
Hubbell Inc. Class B 1,338,122 181,101
Fluor Corp. 3,422,919 176,794* Arrow Electronics Inc. 2,151,837 173,029
Xerox Corp. 5,915,695 172,443^ Wabtec Corp. 2,113,332 172,089
Robert Half
International Inc. 2,912,734 161,773* Stericycle Inc. 2,089,285 142,050
Allison Transmission
Holdings Inc. 3,294,106 141,877
Packaging Corp. of
America 1,153,888 139,101* CoStar Group Inc. 443,230 131,617
Huntington Ingalls
Industries Inc. 553,533 130,468
Macquarie
Infrastructure Corp. 1,964,148 126,098
Cognex Corp. 2,017,506 123,391* IPG Photonics Corp. 428,093 91,668
FLIR Systems Inc. 1,694,970 79,020
Flowserve Corp. 1,598,022 67,325
16,485,576
Oil & Gas (5.1%) * Concho Resources Inc. 3,640,627 546,895
Andeavor 3,628,011 414,827
EQT Corp. 6,309,687 359,147
Marathon Oil Corp. 20,811,015 352,330
Hess Corp. 7,396,118 351,094
Noble Energy Inc. 11,917,415 347,273
National Oilwell
Varco Inc. 9,305,605 335,188
Baker Hughes a GE Co. 10,485,079 331,748
Cabot Oil & Gas Corp. 11,325,209 323,901
Cimarex Energy Co. 2,330,062 284,291* Cheniere Energy Inc. 4,947,579 266,378
Devon Energy Corp. 6,105,375 252,763
OGE Energy Corp. 4,884,655 160,754
44
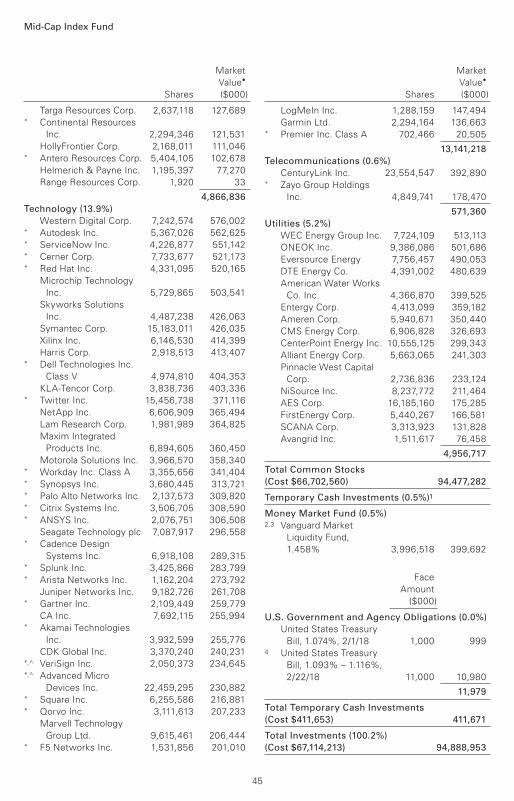
Mid-Cap Index Fund
Market
Value•
Shares ($000)
Market
Value•
Shares ($000)
Targa Resources Corp. 2,637,118 127,689* Continental Resources
Inc. 2,294,346 121,531
HollyFrontier Corp. 2,168,011 111,046* Antero Resources Corp. 5,404,105 102,678
Helmerich & Payne Inc. 1,195,397 77,270
Range Resources Corp. 1,920 33
4,866,836
Technology (13.9%)
Western Digital Corp. 7,242,574 576,002* Autodesk Inc. 5,367,026 562,625* ServiceNow Inc. 4,226,877 551,142* Cerner Corp. 7,733,677 521,173* Red Hat Inc. 4,331,095 520,165
Microchip Technology
Inc. 5,729,865 503,541
Skyworks Solutions
Inc. 4,487,238 426,063
Symantec Corp. 15,183,011 426,035
Xilinx Inc. 6,146,530 414,399
Harris Corp. 2,918,513 413,407* Dell Technologies Inc.
Class V 4,974,810 404,353
KLA-Tencor Corp. 3,838,736 403,336* Twitter Inc. 15,456,738 371,116
NetApp Inc. 6,606,909 365,494
Lam Research Corp. 1,981,989 364,825
Maxim Integrated
Products Inc. 6,894,605 360,450
Motorola Solutions Inc. 3,966,570 358,340* Workday Inc. Class A 3,355,656 341,404* Synopsys Inc. 3,680,445 313,721* Palo Alto Networks Inc. 2,137,573 309,820* Citrix Systems Inc. 3,506,705 308,590* ANSYS Inc. 2,076,751 306,508
Seagate Technology plc 7,087,917 296,558* Cadence Design
Systems Inc. 6,918,108 289,315* Splunk Inc. 3,425,866 283,799* Arista Networks Inc. 1,162,204 273,792
Juniper Networks Inc. 9,182,726 261,708* Gartner Inc. 2,109,449 259,779
CA Inc. 7,692,115 255,994* Akamai Technologies
Inc. 3,932,599 255,776
CDK Global Inc. 3,370,240 240,231*,^ VeriSign Inc. 2,050,373 234,645*,^ Advanced Micro
Devices Inc. 22,459,295 230,882* Square Inc. 6,255,586 216,881* Qorvo Inc. 3,111,613 207,233
Marvell Technology
Group Ltd. 9,615,461 206,444* F5 Networks Inc. 1,531,856 201,010
LogMeIn Inc. 1,288,159 147,494
Garmin Ltd. 2,294,164 136,663* Premier Inc. Class A 702,466 20,505
13,141,218
Telecommunications (0.6%)
CenturyLink Inc. 23,554,547 392,890* Zayo Group Holdings
Inc. 4,849,741 178,470
571,360
Utilities (5.2%)
WEC Energy Group Inc. 7,724,109 513,113
ONEOK Inc. 9,386,086 501,686
Eversource Energy 7,756,457 490,053
DTE Energy Co. 4,391,002 480,639
American Water Works
Co. Inc. 4,366,870 399,525
Entergy Corp. 4,413,099 359,182
Ameren Corp. 5,940,671 350,440
CMS Energy Corp. 6,906,828 326,693
CenterPoint Energy Inc. 10,555,125 299,343
Alliant Energy Corp. 5,663,065 241,303
Pinnacle West Capital
Corp. 2,736,836 233,124
NiSource Inc. 8,237,772 211,464
AES Corp. 16,185,160 175,285
FirstEnergy Corp. 5,440,267 166,581
SCANA Corp. 3,313,923 131,828
Avangrid Inc. 1,511,617 76,458
4,956,717
Total Common Stocks
(Cost $66,702,560) 94,477,282
Temporary Cash Investments (0.5%)1
Money Market Fund (0.5%)2,3 Vanguard Market
Liquidity Fund,
1.458% 3,996,518 399,692
Face
Amount
($000)
U.S. Government and Agency Obligations (0.0%)
United States Treasury
Bill, 1.074%, 2/1/18 1,000 9994 United States Treasury
Bill, 1.093% – 1.116%,
2/22/18 11,000 10,980
11,979
Total Temporary Cash Investments
(Cost $411,653) 411,671
Total Investments (100.2%)
(Cost $67,114,213) 94,888,953
45
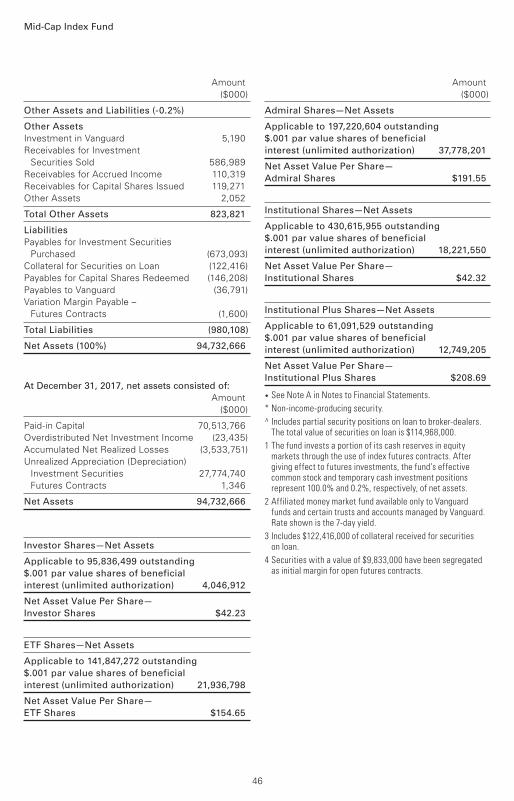
Mid-Cap Index Fund
Amount
($000)
Amount
($000)
Other Assets and Liabilities (-0.2%)
Other Assets
Investment in Vanguard 5,190
Receivables for Investment
Securities Sold 586,989
Receivables for Accrued Income 110,319
Receivables for Capital Shares Issued 119,271
Other Assets 2,052
Total Other Assets 823,821
Liabilities
Payables for Investment Securities
Purchased (673,093)
Collateral for Securities on Loan (122,416)
Payables for Capital Shares Redeemed (146,208)
Payables to Vanguard (36,791)
Variation Margin Payable –
Futures Contracts (1,600)
Total Liabilities (980,108)
Net Assets (100%) 94,732,666
At December 31, 2017, net assets consisted of:
Amount
($000)
Paid-in Capital 70,513,766
Overdistributed Net Investment Income (23,435)
Accumulated Net Realized Losses (3,533,751)
Unrealized Appreciation (Depreciation)
Investment Securities 27,774,740
Futures Contracts 1,346
Net Assets 94,732,666
Investor Shares—Net Assets
Applicable to 95,836,499 outstanding
$.001 par value shares of beneficial
interest (unlimited authorization) 4,046,912
Net Asset Value Per Share—
Investor Shares $42.23
ETF Shares—Net Assets
Applicable to 141,847,272 outstanding
$.001 par value shares of beneficial
interest (unlimited authorization) 21,936,798
Net Asset Value Per Share—
ETF Shares $154.65
Admiral Shares—Net Assets
Applicable to 197,220,604 outstanding
$.001 par value shares of beneficial
interest (unlimited authorization) 37,778,201
Net Asset Value Per Share—
Admiral Shares $191.55
Institutional Shares—Net Assets
Applicable to 430,615,955 outstanding
$.001 par value shares of beneficial
interest (unlimited authorization) 18,221,550
Net Asset Value Per Share—
Institutional Shares $42.32
Institutional Plus Shares—Net Assets
Applicable to 61,091,529 outstanding
$.001 par value shares of beneficial
interest (unlimited authorization) 12,749,205
Net Asset Value Per Share—
Institutional Plus Shares $208.69
• See Note A in Notes to Financial Statements.
* Non-income-producing security.
^ Includes partial security positions on loan to broker-dealers. The total value of securities on loan is $114,968,000.
1 The fund invests a portion of its cash reserves in equity markets through the use of index futures contracts. After giving effect to futures investments, the fund’s effective common stock and temporary cash investment positions represent 100.0% and 0.2%, respectively, of net assets.
2 Affiliated money market fund available only to Vanguard funds and certain trusts and accounts managed by Vanguard. Rate shown is the 7-day yield.
3 Includes $122,416,000 of collateral received for securities on loan.
4 Securities with a value of $9,833,000 have been segregated as initial margin for open futures contracts.
46
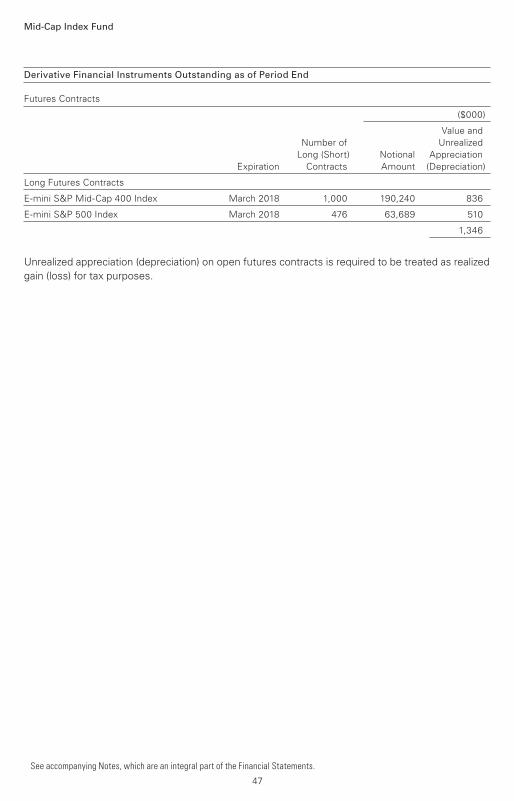
Mid-Cap Index Fund
See accompanying Notes, which are an integral part of the Financial Statements.
Derivative Financial Instruments Outstanding as of Period End
Futures Contracts
($000)
Value and
Number of Unrealized
Long (Short) Notional Appreciation
Expiration Contracts Amount (Depreciation)
Long Futures Contracts
E-mini S&P Mid-Cap 400 Index March 2018 1,000 190,240 836
E-mini S&P 500 Index March 2018 476 63,689 510
1,346
Unrealized appreciation (depreciation) on open futures contracts is required to be treated as realized
gain (loss) for tax purposes.
47
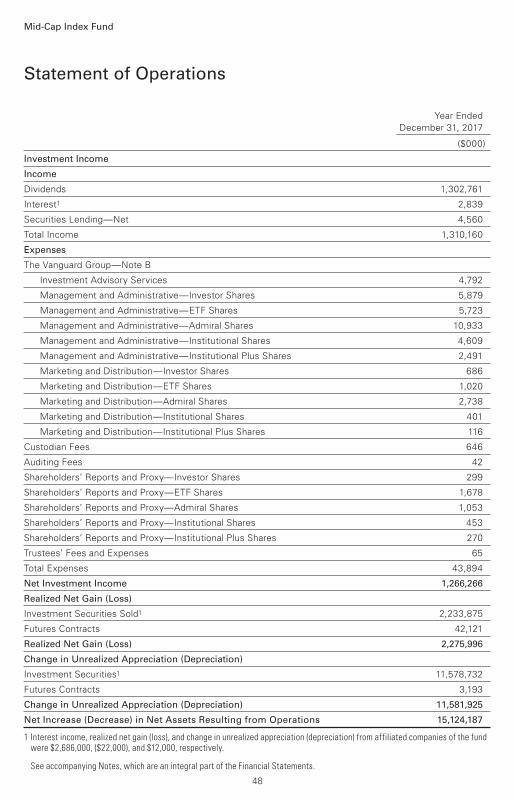
Year Ended
December 31, 2017
($000)
Investment Income
Income
Dividends 1,302,761
Interest1 2,839
Securities Lending—Net 4,560
Total Income 1,310,160
Expenses
The Vanguard Group—Note B
Investment Advisory Services 4,792
Management and Administrative—Investor Shares 5,879
Management and Administrative—ETF Shares 5,723
Management and Administrative—Admiral Shares 10,933
Management and Administrative—Institutional Shares 4,609
Management and Administrative—Institutional Plus Shares 2,491
Marketing and Distribution—Investor Shares 686
Marketing and Distribution—ETF Shares 1,020
Marketing and Distribution—Admiral Shares 2,738
Marketing and Distribution—Institutional Shares 401
Marketing and Distribution—Institutional Plus Shares 116
Custodian Fees 646
Auditing Fees 42
Shareholders’ Reports and Proxy—Investor Shares 299
Shareholders’ Reports and Proxy—ETF Shares 1,678
Shareholders’ Reports and Proxy—Admiral Shares 1,053
Shareholders’ Reports and Proxy—Institutional Shares 453
Shareholders’ Reports and Proxy—Institutional Plus Shares 270
Trustees’ Fees and Expenses 65
Total Expenses 43,894
Net Investment Income 1,266,266
Realized Net Gain (Loss)
Investment Securities Sold1 2,233,875
Futures Contracts 42,121
Realized Net Gain (Loss) 2,275,996
Change in Unrealized Appreciation (Depreciation)
Investment Securities1 11,578,732
Futures Contracts 3,193
Change in Unrealized Appreciation (Depreciation) 11,581,925
Net Increase (Decrease) in Net Assets Resulting from Operations 15,124,187
1 Interest income, realized net gain (loss), and change in unrealized appreciation (depreciation) from affiliated companies of the fund were $2,686,000, ($22,000), and $12,000, respectively.
Statement of Operations
Mid-Cap Index Fund
See accompanying Notes, which are an integral part of the Financial Statements.
48
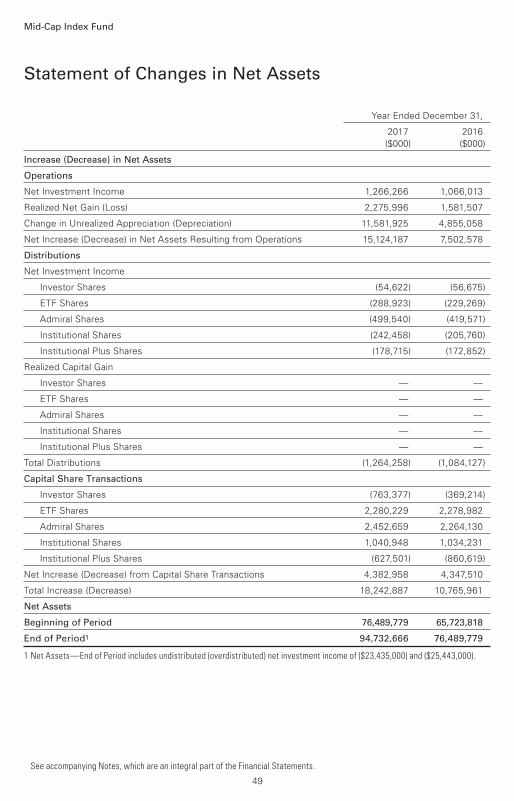
Statement of Changes in Net Assets
Mid-Cap Index Fund
See accompanying Notes, which are an integral part of the Financial Statements.
Year Ended December 31,
2017 2016
($000) ($000)
Increase (Decrease) in Net Assets
Operations
Net Investment Income 1,266,266 1,066,013
Realized Net Gain (Loss) 2,275,996 1,581,507
Change in Unrealized Appreciation (Depreciation) 11,581,925 4,855,058
Net Increase (Decrease) in Net Assets Resulting from Operations 15,124,187 7,502,578
Distributions
Net Investment Income
Investor Shares (54,622) (56,675)
ETF Shares (288,923) (229,269)
Admiral Shares (499,540) (419,571)
Institutional Shares (242,458) (205,760)
Institutional Plus Shares (178,715) (172,852)
Realized Capital Gain
Investor Shares — —
ETF Shares — —
Admiral Shares — —
Institutional Shares — —
Institutional Plus Shares — —
Total Distributions (1,264,258) (1,084,127)
Capital Share Transactions
Investor Shares (763,377) (369,214)
ETF Shares 2,280,229 2,278,982
Admiral Shares 2,452,659 2,264,130
Institutional Shares 1,040,948 1,034,231
Institutional Plus Shares (627,501) (860,619)
Net Increase (Decrease) from Capital Share Transactions 4,382,958 4,347,510
Total Increase (Decrease) 18,242,887 10,765,961
Net Assets
Beginning of Period 76,489,779 65,723,818
End of Period1 94,732,666 76,489,779
1 Net Assets—End of Period includes undistributed (overdistributed) net investment income of ($23,435,000) and ($25,443,000).
49
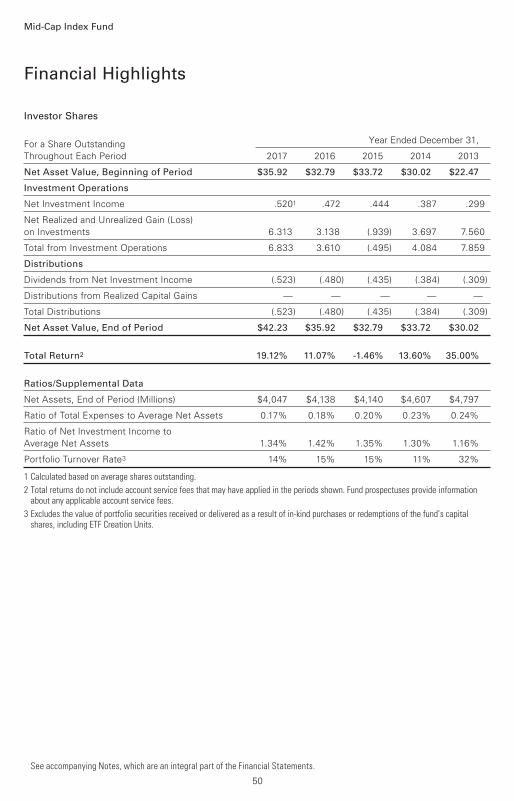
Investor Shares
For a Share Outstanding Year Ended December 31,
Throughout Each Period 2017 2016 2015 2014 2013
Net Asset Value, Beginning of Period $35.92 $32.79 $33.72 $30.02 $22.47
Investment Operations
Net Investment Income .5201 .472 .444 .387 .299
Net Realized and Unrealized Gain (Loss)
on Investments 6.313 3.138 (.939) 3.697 7.560
Total from Investment Operations 6.833 3.610 (.495) 4.084 7.859
Distributions
Dividends from Net Investment Income (.523) (.480) (.435) (.384) (.309)
Distributions from Realized Capital Gains — — — — —
Total Distributions (.523) (.480) (.435) (.384) (.309)
Net Asset Value, End of Period $42.23 $35.92 $32.79 $33.72 $30.02
Total Return2 19.12% 11.07% -1.46% 13.60% 35.00%
Ratios/Supplemental Data
Net Assets, End of Period (Millions) $4,047 $4,138 $4,140 $4,607 $4,797
Ratio of Total Expenses to Average Net Assets 0.17% 0.18% 0.20% 0.23% 0.24%
Ratio of Net Investment Income to
Average Net Assets 1.34% 1.42% 1.35% 1.30% 1.16%
Portfolio Turnover Rate3 14% 15% 15% 11% 32%
1 Calculated based on average shares outstanding.
2 Total returns do not include account service fees that may have applied in the periods shown. Fund prospectuses provide information about any applicable account service fees.
3 Excludes the value of portfolio securities received or delivered as a result of in-kind purchases or redemptions of the fund’s capital shares, including ETF Creation Units.
Financial Highlights
See accompanying Notes, which are an integral part of the Financial Statements.
Mid-Cap Index Fund
50

ETF Shares
For a Share Outstanding Year Ended December 31,
Throughout Each Period 2017 2016 2015 2014 2013
Net Asset Value, Beginning of Period $131.55 $120.07 $123.50 $109.96 $82.33
Investment Operations
Net Investment Income 2.1121 1.877 1.793 1.609 1.255
Net Realized and Unrealized Gain (Loss)
on Investments 23.076 11.510 (3.457) 13.524 27.668
Total from Investment Operations 25.188 13.387 (1.664) 15.133 28.923
Distributions
Dividends from Net Investment Income (2.088) (1.907) (1.766) (1.593) (1.293)
Distributions from Realized Capital Gains — — — — —
Total Distributions (2.088) (1.907) (1.766) (1.593) (1.293)
Net Asset Value, End of Period $154.65 $131.55 $120.07 $123.50 $109.96
Total Return 19.25% 11.23% -1.34% 13.76% 35.15%
Ratios/Supplemental Data
Net Assets, End of Period (Millions) $21,937 $16,544 $12,984 $9,879 $6,728
Ratio of Total Expenses to Average Net Assets 0.05% 0.06% 0.08% 0.09% 0.09%
Ratio of Net Investment Income to
Average Net Assets 1.46% 1.54% 1.47% 1.44% 1.31%
Portfolio Turnover Rate2 14% 15% 15% 11% 32%
1 Calculated based on average shares outstanding.
2 Excludes the value of portfolio securities received or delivered as a result of in-kind purchases or redemptions of the fund’s capital shares, including ETF Creation Units.
Financial Highlights
See accompanying Notes, which are an integral part of the Financial Statements.
Mid-Cap Index Fund
51
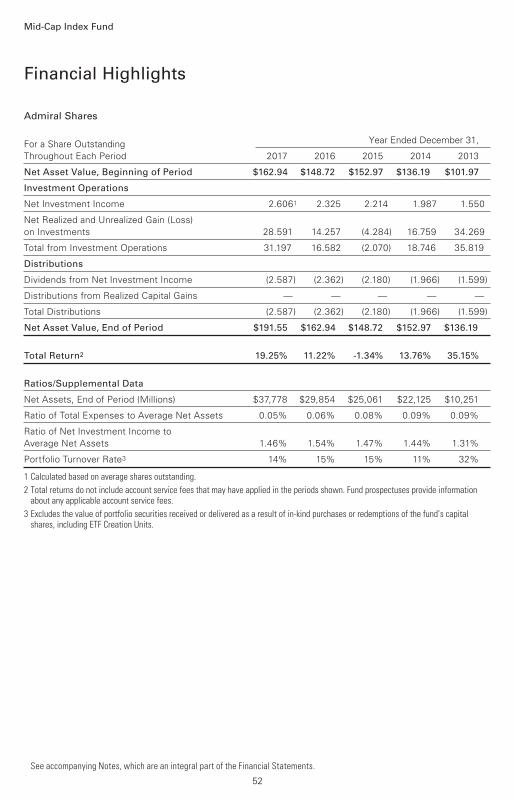
Admiral Shares
For a Share Outstanding Year Ended December 31,
Throughout Each Period 2017 2016 2015 2014 2013
Net Asset Value, Beginning of Period $162.94 $148.72 $152.97 $136.19 $101.97
Investment Operations
Net Investment Income 2.6061 2.325 2.214 1.987 1.550
Net Realized and Unrealized Gain (Loss)
on Investments 28.591 14.257 (4.284) 16.759 34.269
Total from Investment Operations 31.197 16.582 (2.070) 18.746 35.819
Distributions
Dividends from Net Investment Income (2.587) (2.362) (2.180) (1.966) (1.599)
Distributions from Realized Capital Gains — — — — —
Total Distributions (2.587) (2.362) (2.180) (1.966) (1.599)
Net Asset Value, End of Period $191.55 $162.94 $148.72 $152.97 $136.19
Total Return2 19.25% 11.22% -1.34% 13.76% 35.15%
Ratios/Supplemental Data
Net Assets, End of Period (Millions) $37,778 $29,854 $25,061 $22,125 $10,251
Ratio of Total Expenses to Average Net Assets 0.05% 0.06% 0.08% 0.09% 0.09%
Ratio of Net Investment Income to
Average Net Assets 1.46% 1.54% 1.47% 1.44% 1.31%
Portfolio Turnover Rate3 14% 15% 15% 11% 32%
1 Calculated based on average shares outstanding.
2 Total returns do not include account service fees that may have applied in the periods shown. Fund prospectuses provide information about any applicable account service fees.
3 Excludes the value of portfolio securities received or delivered as a result of in-kind purchases or redemptions of the fund’s capital shares, including ETF Creation Units.
Financial Highlights
See accompanying Notes, which are an integral part of the Financial Statements.
Mid-Cap Index Fund
52
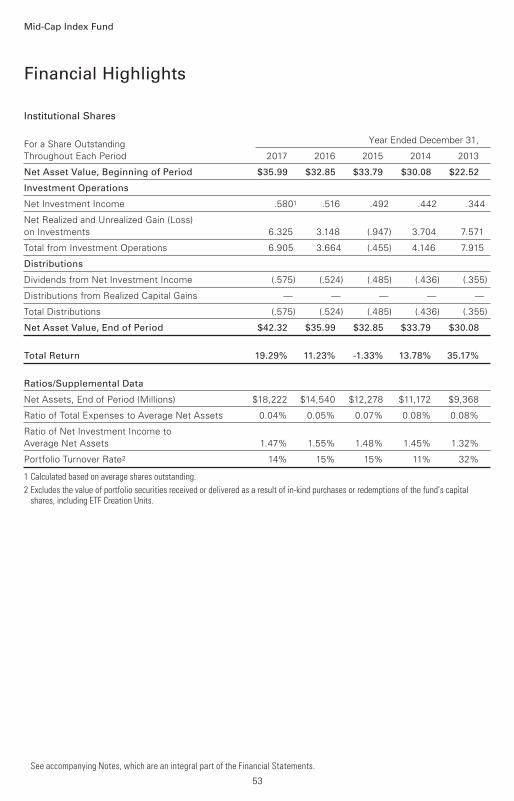
Institutional Shares
For a Share Outstanding Year Ended December 31,
Throughout Each Period 2017 2016 2015 2014 2013
Net Asset Value, Beginning of Period $35.99 $32.85 $33.79 $30.08 $22.52
Investment Operations
Net Investment Income .5801 .516 .492 .442 .344
Net Realized and Unrealized Gain (Loss)
on Investments 6.325 3.148 (.947) 3.704 7.571
Total from Investment Operations 6.905 3.664 (.455) 4.146 7.915
Distributions
Dividends from Net Investment Income (.575) (.524) (.485) (.436) (.355)
Distributions from Realized Capital Gains — — — — —
Total Distributions (.575) (.524) (.485) (.436) (.355)
Net Asset Value, End of Period $42.32 $35.99 $32.85 $33.79 $30.08
Total Return 19.29% 11.23% -1.33% 13.78% 35.17%
Ratios/Supplemental Data
Net Assets, End of Period (Millions) $18,222 $14,540 $12,278 $11,172 $9,368
Ratio of Total Expenses to Average Net Assets 0.04% 0.05% 0.07% 0.08% 0.08%
Ratio of Net Investment Income to
Average Net Assets 1.47% 1.55% 1.48% 1.45% 1.32%
Portfolio Turnover Rate2 14% 15% 15% 11% 32%
1 Calculated based on average shares outstanding.
2 Excludes the value of portfolio securities received or delivered as a result of in-kind purchases or redemptions of the fund’s capital shares, including ETF Creation Units.
Financial Highlights
See accompanying Notes, which are an integral part of the Financial Statements.
Mid-Cap Index Fund
53
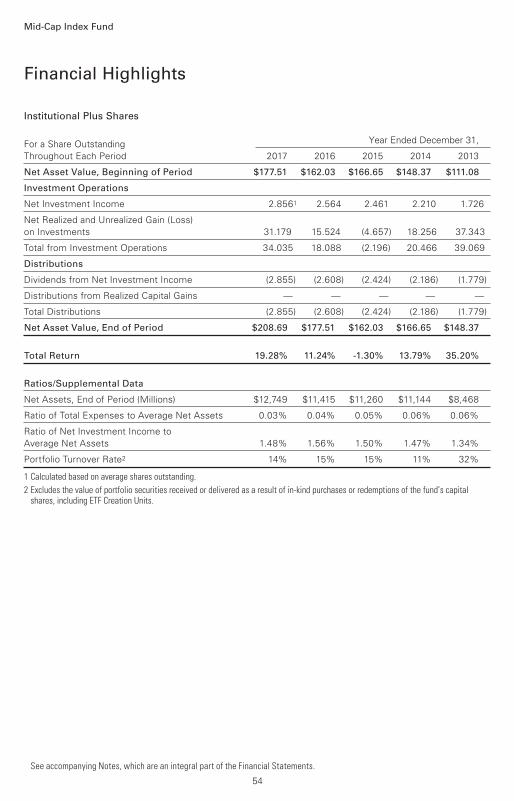
Institutional Plus Shares
For a Share Outstanding Year Ended December 31,
Throughout Each Period 2017 2016 2015 2014 2013
Net Asset Value, Beginning of Period $177.51 $162.03 $166.65 $148.37 $111.08
Investment Operations
Net Investment Income 2.8561 2.564 2.461 2.210 1.726
Net Realized and Unrealized Gain (Loss)
on Investments 31.179 15.524 (4.657) 18.256 37.343
Total from Investment Operations 34.035 18.088 (2.196) 20.466 39.069
Distributions
Dividends from Net Investment Income (2.855) (2.608) (2.424) (2.186) (1.779)
Distributions from Realized Capital Gains — — — — —
Total Distributions (2.855) (2.608) (2.424) (2.186) (1.779)
Net Asset Value, End of Period $208.69 $177.51 $162.03 $166.65 $148.37
Total Return 19.28% 11.24% -1.30% 13.79% 35.20%
Ratios/Supplemental Data
Net Assets, End of Period (Millions) $12,749 $11,415 $11,260 $11,144 $8,468
Ratio of Total Expenses to Average Net Assets 0.03% 0.04% 0.05% 0.06% 0.06%
Ratio of Net Investment Income to
Average Net Assets 1.48% 1.56% 1.50% 1.47% 1.34%
Portfolio Turnover Rate2 14% 15% 15% 11% 32%
1 Calculated based on average shares outstanding.
2 Excludes the value of portfolio securities received or delivered as a result of in-kind purchases or redemptions of the fund’s capital shares, including ETF Creation Units.
Financial Highlights
See accompanying Notes, which are an integral part of the Financial Statements.
Mid-Cap Index Fund
54
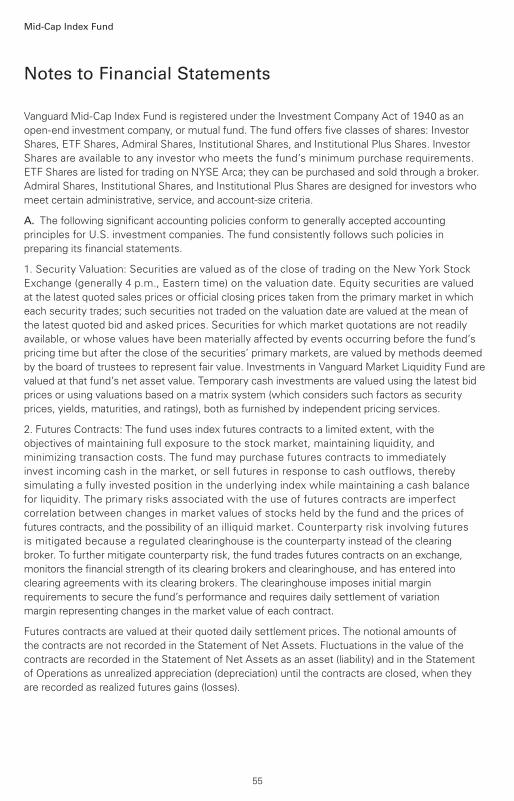
Notes to Financial Statements
Mid-Cap Index Fund
Vanguard Mid-Cap Index Fund is registered under the Investment Company Act of 1940 as an
open-end investment company, or mutual fund. The fund offers five classes of shares: Investor
Shares, ETF Shares, Admiral Shares, Institutional Shares, and Institutional Plus Shares. Investor
Shares are available to any investor who meets the fund’s minimum purchase requirements.
ETF Shares are listed for trading on NYSE Arca; they can be purchased and sold through a broker.
Admiral Shares, Institutional Shares, and Institutional Plus Shares are designed for investors who
meet certain administrative, service, and account-size criteria.
A. The following significant accounting policies conform to generally accepted accounting
principles for U.S. investment companies. The fund consistently follows such policies in
preparing its financial statements.
1. Security Valuation: Securities are valued as of the close of trading on the New York Stock
Exchange (generally 4 p.m., Eastern time) on the valuation date. Equity securities are valued
at the latest quoted sales prices or official closing prices taken from the primary market in which
each security trades; such securities not traded on the valuation date are valued at the mean of
the latest quoted bid and asked prices. Securities for which market quotations are not readily
available, or whose values have been materially affected by events occurring before the fund’s
pricing time but after the close of the securities’ primary markets, are valued by methods deemed
by the board of trustees to represent fair value. Investments in Vanguard Market Liquidity Fund are
valued at that fund’s net asset value. Temporary cash investments are valued using the latest bid
prices or using valuations based on a matrix system (which considers such factors as security
prices, yields, maturities, and ratings), both as furnished by independent pricing services.
2. Futures Contracts: The fund uses index futures contracts to a limited extent, with the
objectives of maintaining full exposure to the stock market, maintaining liquidity, and
minimizing transaction costs. The fund may purchase futures contracts to immediately
invest incoming cash in the market, or sell futures in response to cash outflows, thereby
simulating a fully invested position in the underlying index while maintaining a cash balance
for liquidity. The primary risks associated with the use of futures contracts are imperfect
correlation between changes in market values of stocks held by the fund and the prices of
futures contracts, and the possibility of an illiquid market. Counterparty risk involving futures
is mitigated because a regulated clearinghouse is the counterparty instead of the clearing
broker. To further mitigate counterparty risk, the fund trades futures contracts on an exchange,
monitors the financial strength of its clearing brokers and clearinghouse, and has entered into
clearing agreements with its clearing brokers. The clearinghouse imposes initial margin
requirements to secure the fund’s performance and requires daily settlement of variation
margin representing changes in the market value of each contract.
Futures contracts are valued at their quoted daily settlement prices. The notional amounts of
the contracts are not recorded in the Statement of Net Assets. Fluctuations in the value of the
contracts are recorded in the Statement of Net Assets as an asset (liability) and in the Statement
of Operations as unrealized appreciation (depreciation) until the contracts are closed, when they
are recorded as realized futures gains (losses).
55
Mid-Cap Index Fund
During the year ended December 31, 2017, the fund’s average investments in long and short
futures contracts represented less than 1% and 0% of net assets, respectively, based on the
average of the notional amounts at each quarter-end during the period.
3. Federal Income Taxes: The fund intends to continue to qualify as a regulated investment
company and distribute all of its taxable income. Management has analyzed the fund’s tax
positions taken for all open federal income tax years (December 31, 2014–2017), and has
concluded that no provision for federal income tax is required in the fund’s financial statements.
4. Distributions: Distributions to shareholders are recorded on the ex-dividend date.
5. Securities Lending: To earn additional income, the fund lends its securities to qualified
institutional borrowers. Security loans are subject to termination by the fund at any time, and
are required to be secured at all times by collateral in an amount at least equal to the market value
of securities loaned. Daily market fluctuations could cause the value of loaned securities to be
more or less than the value of the collateral received. When this occurs, the collateral is
adjusted and settled on the next business day. The fund further mitigates its counterparty
risk by entering into securities lending transactions only with a diverse group of prequalified
counterparties, monitoring their financial strength, and entering into master securities lending
agreements with its counterparties. The master securities lending agreements provide that,
in the event of a counterparty’s default (including bankruptcy), the fund may terminate any loans
with that borrower, determine the net amount owed, and sell or retain the collateral up to the
net amount owed to the fund; however, such actions may be subject to legal proceedings. While
collateral mitigates counterparty risk, in the event of a default, the fund may experience delays
and costs in recovering the securities loaned. The fund invests cash collateral received in Vanguard
Market Liquidity Fund, and records a liability in the Statement of Net Assets for the return of the
collateral, during the period the securities are on loan. Securities lending income represents fees
charged to borrowers plus income earned on invested cash collateral, less expenses associated
with the loan. During the term of the loan, the fund is entitled to all distributions made on or in
respect of the loaned securities.
6. Credit Facility: The fund and certain other funds managed by The Vanguard Group (“Vanguard”)
participate in a $3.1 billion committed credit facility provided by a syndicate of lenders pursuant to
a credit agreement that may be renewed annually; each fund is individually liable for its borrowings,
if any, under the credit facility. Borrowings may be utilized for temporary and emergency purposes,
and are subject to the fund’s regulatory and contractual borrowing restrictions. The participating
funds are charged administrative fees and an annual commitment fee of 0.10% of the undrawn
amount of the facility; these fees are allocated to the funds based on a method approved by the
fund’s board of trustees and included in Management and Administrative expenses on the fund’s
Statement of Operations. Any borrowings under this facility bear interest at a rate based upon the
higher of the one-month London Interbank Offered Rate, federal funds effective rate, or overnight
bank funding rate plus an agreed-upon spread.
The fund had no borrowings outstanding at December 31, 2017, or at any time during the period
then ended.
56
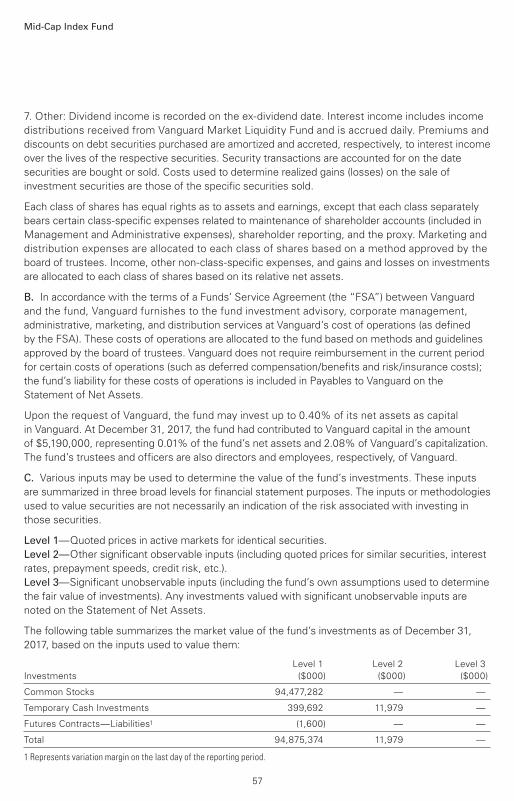
Mid-Cap Index Fund
7. Other: Dividend income is recorded on the ex-dividend date. Interest income includes income
distributions received from Vanguard Market Liquidity Fund and is accrued daily. Premiums and
discounts on debt securities purchased are amortized and accreted, respectively, to interest income
over the lives of the respective securities. Security transactions are accounted for on the date
securities are bought or sold. Costs used to determine realized gains (losses) on the sale of
investment securities are those of the specific securities sold.
Each class of shares has equal rights as to assets and earnings, except that each class separately
bears certain class-specific expenses related to maintenance of shareholder accounts (included in
Management and Administrative expenses), shareholder reporting, and the proxy. Marketing and
distribution expenses are allocated to each class of shares based on a method approved by the
board of trustees. Income, other non-class-specific expenses, and gains and losses on investments
are allocated to each class of shares based on its relative net assets.
B. In accordance with the terms of a Funds’ Service Agreement (the “FSA”) between Vanguard
and the fund, Vanguard furnishes to the fund investment advisory, corporate management,
administrative, marketing, and distribution services at Vanguard’s cost of operations (as defined
by the FSA). These costs of operations are allocated to the fund based on methods and guidelines
approved by the board of trustees. Vanguard does not require reimbursement in the current period
for certain costs of operations (such as deferred compensation/benefits and risk/insurance costs);
the fund’s liability for these costs of operations is included in Payables to Vanguard on the
Statement of Net Assets.
Upon the request of Vanguard, the fund may invest up to 0.40% of its net assets as capital
in Vanguard. At December 31, 2017, the fund had contributed to Vanguard capital in the amount
of $5,190,000, representing 0.01% of the fund’s net assets and 2.08% of Vanguard’s capitalization.
The fund’s trustees and officers are also directors and employees, respectively, of Vanguard.
C. Various inputs may be used to determine the value of the fund’s investments. These inputs
are summarized in three broad levels for financial statement purposes. The inputs or methodologies
used to value securities are not necessarily an indication of the risk associated with investing in
those securities.
Level 1—Quoted prices in active markets for identical securities.
Level 2—Other significant observable inputs (including quoted prices for similar securities, interest
rates, prepayment speeds, credit risk, etc.).
Level 3—Significant unobservable inputs (including the fund’s own assumptions used to determine
the fair value of investments). Any investments valued with significant unobservable inputs are
noted on the Statement of Net Assets.
The following table summarizes the market value of the fund’s investments as of December 31,
2017, based on the inputs used to value them:
Level 1 Level 2 Level 3
Investments ($000) ($000) ($000)
Common Stocks 94,477,282 — —
Temporary Cash Investments 399,692 11,979 —
Futures Contracts—Liabilities1 (1,600) — —
Total 94,875,374 11,979 —
1 Represents variation margin on the last day of the reporting period.
57
58
Mid-Cap Index Fund
D. Distributions are determined on a tax basis and may differ from net investment income and
realized capital gains for financial reporting purposes. Differences may be permanent or temporary.
Permanent differences are reclassified among capital accounts in the financial statements to reflect
their tax character. Temporary differences arise when certain items of income, expense, gain, or
loss are recognized in different periods for financial statement and tax purposes. These differences
will reverse at some time in the future. Differences in classification may also result from the
treatment of short-term gains as ordinary income for tax purposes.
During the year ended December 31, 2017, the fund realized $2,770,245,000 of net capital gains
resulting from in-kind redemptions—in which shareholders exchanged fund shares for securities
held by the fund rather than for cash. Because such gains are not taxable to the fund, and are not
distributed to shareholders, they have been reclassified from accumulated net realized losses to
paid-in capital.
For tax purposes, at December 31, 2017, the fund had $9,821,000 of ordinary income available for
distribution. At December 31, 2017, the fund had available capital losses totaling $3,437,989,000
to offset future net capital gains. Of this amount, $294,968,000 is subject to expiration on
December 31, 2018. Capital losses of $3,143,021,000 realized beginning in fiscal 2011 may be
carried forward indefinitely under the Regulated Investment Company Modernization Act of 2010,
but must be used before any expiring loss carryforwards.
At December 31, 2017, the cost of investment securities for tax purposes was $67,207,433,000.
Net unrealized appreciation of investment securities for tax purposes was $27,681,520,000,
consisting of unrealized gains of $29,407,673,000 on securities that had risen in value since their
purchase and $1,726,153,000 in unrealized losses on securities that had fallen in value since
their purchase.
E. During the year ended December 31, 2017, the fund purchased $21,643,915,000 of
investment securities and sold $17,259,800,000 of investment securities, other than temporary
cash investments. Purchases and sales include $6,558,728,000 and $5,213,929,000, respectively,
in connection with in-kind purchases and redemptions of the fund’s capital shares.
The fund purchased securities from and sold securities to other Vanguard funds or accounts
managed by Vanguard or its affiliates, in accordance with procedures adopted by the board
of trustees in compliance with Rule 17a-7 of the Investment Company Act of 1940. For the year
ended December 31, 2017, such purchases and sales were $655,963,000 and $2,919,879,000,
respectively; these amounts are included in the purchases and sales of investment securities
noted above.
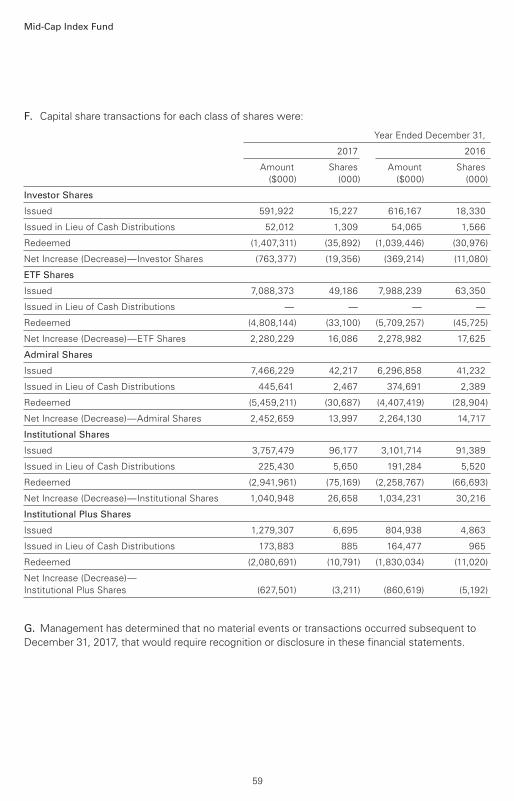
Mid-Cap Index Fund
F. Capital share transactions for each class of shares were:
Year Ended December 31,
2017 2016
Amount Shares Amount Shares
($000) (000) ($000) (000)
Investor Shares
Issued 591,922 15,227 616,167 18,330
Issued in Lieu of Cash Distributions 52,012 1,309 54,065 1,566
Redeemed (1,407,311) (35,892) (1,039,446) (30,976)
Net Increase (Decrease)—Investor Shares (763,377) (19,356) (369,214) (11,080)
ETF Shares
Issued 7,088,373 49,186 7,988,239 63,350
Issued in Lieu of Cash Distributions — — — —
Redeemed (4,808,144) (33,100) (5,709,257) (45,725)
Net Increase (Decrease)—ETF Shares 2,280,229 16,086 2,278,982 17,625
Admiral Shares
Issued 7,466,229 42,217 6,296,858 41,232
Issued in Lieu of Cash Distributions 445,641 2,467 374,691 2,389
Redeemed (5,459,211) (30,687) (4,407,419) (28,904)
Net Increase (Decrease)—Admiral Shares 2,452,659 13,997 2,264,130 14,717
Institutional Shares
Issued 3,757,479 96,177 3,101,714 91,389
Issued in Lieu of Cash Distributions 225,430 5,650 191,284 5,520
Redeemed (2,941,961) (75,169) (2,258,767) (66,693)
Net Increase (Decrease)—Institutional Shares 1,040,948 26,658 1,034,231 30,216
Institutional Plus Shares
Issued 1,279,307 6,695 804,938 4,863
Issued in Lieu of Cash Distributions 173,883 885 164,477 965
Redeemed (2,080,691) (10,791) (1,830,034) (11,020)
Net Increase (Decrease)—
Institutional Plus Shares (627,501) (3,211) (860,619) (5,192)
G. Management has determined that no material events or transactions occurred subsequent to
December 31, 2017, that would require recognition or disclosure in these financial statements.
59
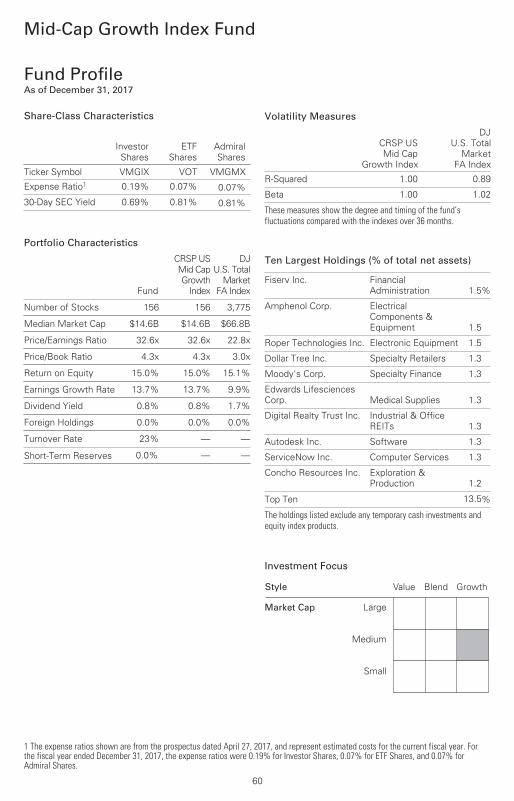
Mid-Cap Growth Index Fund
Fund ProfileAs of December 31, 2017
1 The expense ratios shown are from the prospectus dated April 27, 2017, and represent estimated costs for the current fiscal year. Forthe fiscal year ended December 31, 2017, the expense ratios were 0.19% for Investor Shares, 0.07% for ETF Shares, and 0.07% forAdmiral Shares.
60
Share-Class Characteristics
InvestorShares
ETFShares
AdmiralShares
Ticker Symbol VMGIX VOT VMGMX
Expense Ratio1 0.19% 0.07% 0.07%
30-Day SEC Yield 0.69% 0.81% 0.81%
Volatility Measures
CRSP US
Mid Cap
Growth Index
DJ
U.S. Total
Market
FA Index
R-Squared 1.00 0.89
Beta 1.00 1.02
These measures show the degree and timing of the fund’s fluctuations compared with the indexes over 36 months.
Ten Largest Holdings (% of total net assets)
Fiserv Inc. Financial
Administration 1.5%
Amphenol Corp. Electrical
Components &
Equipment 1.5
Roper Technologies Inc. Electronic Equipment 1.5
Dollar Tree Inc. Specialty Retailers 1.3
Moody's Corp. Specialty Finance 1.3
Edwards Lifesciences
Corp. Medical Supplies 1.3
Digital Realty Trust Inc. Industrial & Office
REITs 1.3
Autodesk Inc. Software 1.3
ServiceNow Inc. Computer Services 1.3
Concho Resources Inc. Exploration &
Production 1.2
Top Ten 13.5%
The holdings listed exclude any temporary cash investments andequity index products.
Investment Focus
Market Cap
Value
Large
Medium
Small
Blend Growth Style
Portfolio Characteristics
Fund
CRSP US
Mid Cap
Growth
Index
DJ
U.S. Total
Market
FA Index
Number of Stocks 156 156 3,775
Median Market Cap $14.6B $14.6B $66.8B
Price/Earnings Ratio 32.6x 32.6x 22.8x
Price/Book Ratio 4.3x 4.3x 3.0x
Return on Equity 15.0% 15.0% 15.1%
Earnings Growth Rate 13.7% 13.7% 9.9%
Dividend Yield 0.8% 0.8% 1.7%
Foreign Holdings 0.0% 0.0% 0.0%
Turnover Rate 23% — —
Short-Term Reserves 0.0% — —

Mid-Cap Growth Index Fund
61
Sector Diversification (% of equity exposure)
Fund
CRSP USMid CapGrowth
Index
DJU.S. Total
MarketFA Index
Basic Materials 1.0% 1.0% 2.7%
Consumer Goods 7.3 7.3 9.0
Consumer Services 10.2 10.2 12.8
Financials 19.9 19.9 20.5
Health Care 11.7 11.7 12.5
Industrials 25.4 25.4 13.2
Oil & Gas 4.6 4.6 5.7
Technology 19.5 19.5 18.7
Telecommunications 0.4 0.4 1.9
Utilities 0.0 0.0 3.0
Sector categories are based on the Industry ClassificationBenchmark (“ICB”), except for the “Other” category (if applicable),which includes securities that have not been provided an ICBclassification as of the effective reporting period.
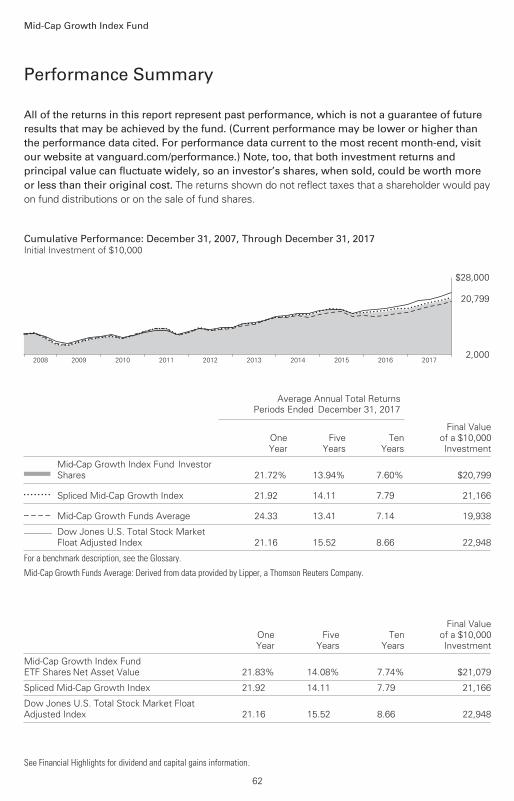
All of the returns in this report represent past performance, which is not a guarantee of future results that may be achieved by the fund. (Current performance may be lower or higher thanthe performance data cited. For performance data current to the most recent month-end, visitour website at vanguard.com/performance.) Note, too, that both investment returns and principal value can fluctuate widely, so an investor’s shares, when sold, could be worth more or less than their original cost. The returns shown do not reflect taxes that a shareholder would pay
on fund distributions or on the sale of fund shares.
Performance Summary
Mid-Cap Growth Index Fund
See Financial Highlights for dividend and capital gains information.
62
Cumulative Performance: December 31, 2007, Through December 31, 2017Initial Investment of $10,000
2017201620152014201320122011201020092008
$28,000
2,000
20,799
Average Annual Total Returns
Periods Ended December 31, 2017
OneYear
FiveYears
TenYears
Final Valueof a $10,000Investment
Mid-Cap Growth Index Fund*InvestorShares 21.72% 13.94% 7.60% $20,799
• • • • • • • • Spliced Mid-Cap Growth Index 21.92 14.11 7.79 21,166
– – – – Mid-Cap Growth Funds Average 24.33 13.41 7.14 19,938________ Dow Jones U.S. Total Stock Market
Float Adjusted Index 21.16 15.52 8.66 22,948
For a benchmark description, see the Glossary.
Mid-Cap Growth Funds Average: Derived from data provided by Lipper, a Thomson Reuters Company.
OneYear
FiveYears
TenYears
Final Valueof a $10,000Investment
Mid-Cap Growth Index FundETF Shares Net Asset Value 21.83% 14.08% 7.74% $21,079
Spliced Mid-Cap Growth Index 21.92 14.11 7.79 21,166
Dow Jones U.S. Total Stock Market FloatAdjusted Index 21.16 15.52 8.66 22,948
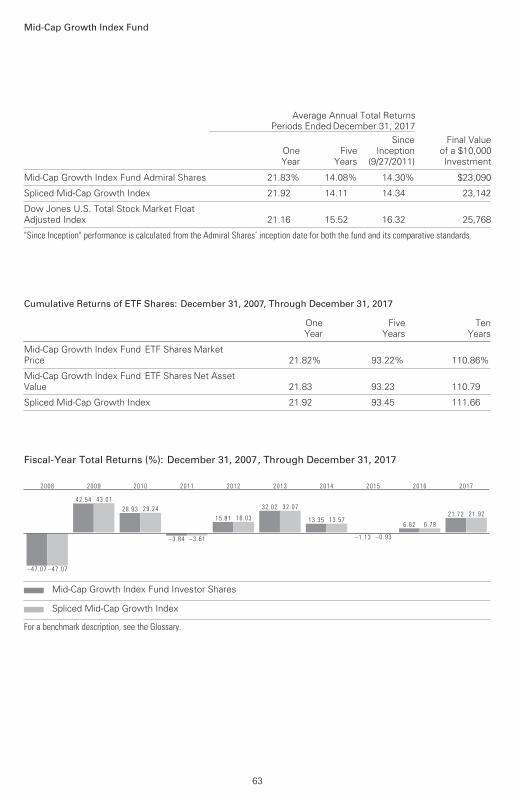
Mid-Cap Growth Index Fund
63
Average Annual Total Returns
Periods Ended December 31, 2017
OneYear
FiveYears
SinceInception
(9/27/2011)
Final Valueof a $10,000Investment
Mid-Cap Growth Index Fund Admiral Shares 21.83% 14.08% 14.30% $23,090
Spliced Mid-Cap Growth Index 21.92 14.11 14.34 23,142
Dow Jones U.S. Total Stock Market Float Adjusted Index 21.16 15.52 16.32 25,768
"Since Inception" performance is calculated from the Admiral Shares’ inception date for both the fund and its comparative standards.
Cumulative Returns of ETF Shares: December 31, 2007, Through December 31, 2017
OneYear
FiveYears
TenYears
Mid-Cap Growth Index Fund ETF Shares MarketPrice 21.82% 93.22% 110.86%
Mid-Cap Growth Index Fund ETF Shares Net AssetValue 21.83 93.23 110.79
Spliced Mid-Cap Growth Index 21.92 93.45 111.66
Fiscal-Year Total Returns (%): December 31, 2007, Through December 31, 2017
–47.07 –47.07
2008
42 .54 43 .01
2009
28 .93 29 .24
2010
–3.84 –3.61
2011
15 .81 16 .03
2012
32 .02 32 .07
2013
13 .35 13 .57
2014
–1.13 –0.93
2015
6 .62 6 .78
2016
21 .72 21 .92
2017
Mid-Cap Growth Index Fund Investor Shares
Spliced Mid-Cap Growth Index
For a benchmark description, see the Glossary.
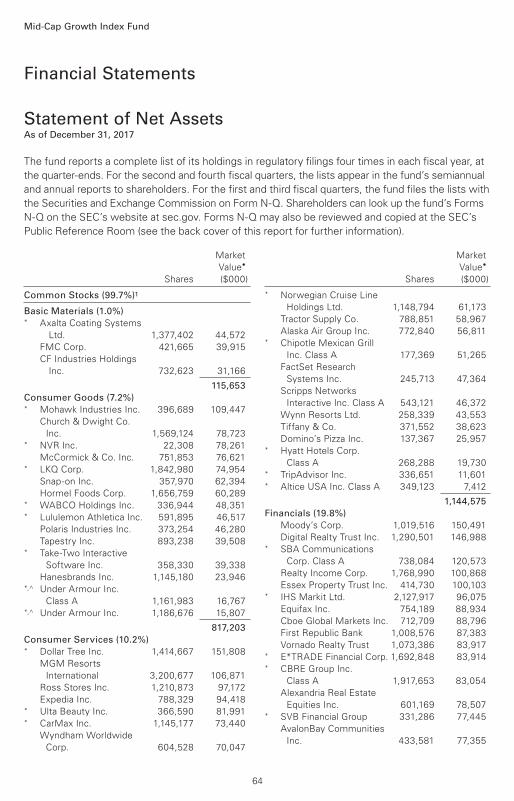
Market
Value•
Shares ($000)
Market
Value•
Shares ($000)
Common Stocks (99.7%)1
Basic Materials (1.0%) * Axalta Coating Systems
Ltd. 1,377,402 44,572
FMC Corp. 421,665 39,915
CF Industries Holdings
Inc. 732,623 31,166
115,653
Consumer Goods (7.2%) * Mohawk Industries Inc. 396,689 109,447
Church & Dwight Co.
Inc. 1,569,124 78,723* NVR Inc. 22,308 78,261
McCormick & Co. Inc. 751,853 76,621* LKQ Corp. 1,842,980 74,954
Snap-on Inc. 357,970 62,394
Hormel Foods Corp. 1,656,759 60,289* WABCO Holdings Inc. 336,944 48,351* Lululemon Athletica Inc. 591,895 46,517
Polaris Industries Inc. 373,254 46,280
Tapestry Inc. 893,238 39,508* Take-Two Interactive
Software Inc. 358,330 39,338
Hanesbrands Inc. 1,145,180 23,946*,^ Under Armour Inc.
Class A 1,161,983 16,767*,^ Under Armour Inc. 1,186,676 15,807
817,203
Consumer Services (10.2%) * Dollar Tree Inc. 1,414,667 151,808
MGM Resorts
International 3,200,677 106,871
Ross Stores Inc. 1,210,873 97,172
Expedia Inc. 788,329 94,418* Ulta Beauty Inc. 366,590 81,991* CarMax Inc. 1,145,177 73,440
Wyndham Worldwide
Corp. 604,528 70,047
* Norwegian Cruise Line
Holdings Ltd. 1,148,794 61,173
Tractor Supply Co. 788,851 58,967
Alaska Air Group Inc. 772,840 56,811* Chipotle Mexican Grill
Inc. Class A 177,369 51,265
FactSet Research
Systems Inc. 245,713 47,364
Scripps Networks
Interactive Inc. Class A 543,121 46,372
Wynn Resorts Ltd. 258,339 43,553
Tiffany & Co. 371,552 38,623
Domino’s Pizza Inc. 137,367 25,957* Hyatt Hotels Corp.
Class A 268,288 19,730* TripAdvisor Inc. 336,651 11,601* Altice USA Inc. Class A 349,123 7,412
1,144,575
Financials (19.8%)
Moody’s Corp. 1,019,516 150,491
Digital Realty Trust Inc. 1,290,501 146,988* SBA Communications
Corp. Class A 738,084 120,573
Realty Income Corp. 1,768,990 100,868
Essex Property Trust Inc. 414,730 100,103* IHS Markit Ltd. 2,127,917 96,075
Equifax Inc. 754,189 88,934
Cboe Global Markets Inc. 712,709 88,796
First Republic Bank 1,008,576 87,383
Vornado Realty Trust 1,073,386 83,917* E*TRADE Financial Corp. 1,692,848 83,914* CBRE Group Inc.
Class A 1,917,653 83,054
Alexandria Real Estate
Equities Inc. 601,169 78,507* SVB Financial Group 331,286 77,445
AvalonBay Communities
Inc. 433,581 77,355
Financial Statements
Statement of Net AssetsAs of December 31, 2017
The fund reports a complete list of its holdings in regulatory filings four times in each fiscal year, at
the quarter-ends. For the second and fourth fiscal quarters, the lists appear in the fund’s semiannual
and annual reports to shareholders. For the first and third fiscal quarters, the fund files the lists with
the Securities and Exchange Commission on Form N-Q. Shareholders can look up the fund’s Forms
N-Q on the SEC’s website at sec.gov. Forms N-Q may also be reviewed and copied at the SEC’s
Public Reference Room (see the back cover of this report for further information).
Mid-Cap Growth Index Fund
64
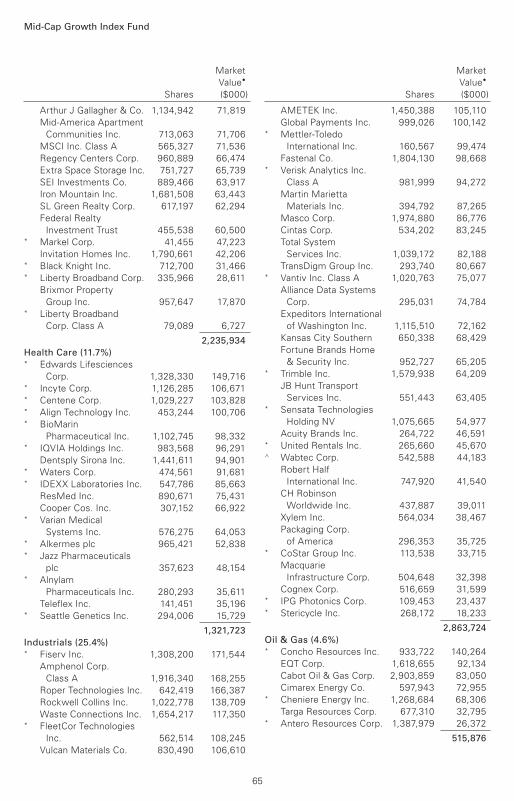
Mid-Cap Growth Index Fund
Market
Value•
Shares ($000)
Market
Value•
Shares ($000)
Arthur J Gallagher & Co. 1,134,942 71,819
Mid-America Apartment
Communities Inc. 713,063 71,706
MSCI Inc. Class A 565,327 71,536
Regency Centers Corp. 960,889 66,474
Extra Space Storage Inc. 751,727 65,739
SEI Investments Co. 889,466 63,917
Iron Mountain Inc. 1,681,508 63,443
SL Green Realty Corp. 617,197 62,294
Federal Realty
Investment Trust 455,538 60,500* Markel Corp. 41,455 47,223
Invitation Homes Inc. 1,790,661 42,206* Black Knight Inc. 712,700 31,466* Liberty Broadband Corp. 335,966 28,611
Brixmor Property
Group Inc. 957,647 17,870* Liberty Broadband
Corp. Class A 79,089 6,727
2,235,934
Health Care (11.7%) * Edwards Lifesciences
Corp. 1,328,330 149,716* Incyte Corp. 1,126,285 106,671* Centene Corp. 1,029,227 103,828* Align Technology Inc. 453,244 100,706* BioMarin
Pharmaceutical Inc. 1,102,745 98,332* IQVIA Holdings Inc. 983,568 96,291
Dentsply Sirona Inc. 1,441,611 94,901* Waters Corp. 474,561 91,681* IDEXX Laboratories Inc. 547,786 85,663
ResMed Inc. 890,671 75,431
Cooper Cos. Inc. 307,152 66,922* Varian Medical
Systems Inc. 576,275 64,053* Alkermes plc 965,421 52,838* Jazz Pharmaceuticals
plc 357,623 48,154* Alnylam
Pharmaceuticals Inc. 280,293 35,611
Teleflex Inc. 141,451 35,196* Seattle Genetics Inc. 294,006 15,729
1,321,723
Industrials (25.4%) * Fiserv Inc. 1,308,200 171,544
Amphenol Corp.
Class A 1,916,340 168,255
Roper Technologies Inc. 642,419 166,387
Rockwell Collins Inc. 1,022,778 138,709
Waste Connections Inc. 1,654,217 117,350* FleetCor Technologies
Inc. 562,514 108,245
Vulcan Materials Co. 830,490 106,610
AMETEK Inc. 1,450,388 105,110
Global Payments Inc. 999,026 100,142* Mettler-Toledo
International Inc. 160,567 99,474
Fastenal Co. 1,804,130 98,668* Verisk Analytics Inc.
Class A 981,999 94,272
Martin Marietta
Materials Inc. 394,792 87,265
Masco Corp. 1,974,880 86,776
Cintas Corp. 534,202 83,245
Total System
Services Inc. 1,039,172 82,188
TransDigm Group Inc. 293,740 80,667* Vantiv Inc. Class A 1,020,763 75,077
Alliance Data Systems
Corp. 295,031 74,784
Expeditors International
of Washington Inc. 1,115,510 72,162
Kansas City Southern 650,338 68,429
Fortune Brands Home
& Security Inc. 952,727 65,205* Trimble Inc. 1,579,938 64,209
JB Hunt Transport
Services Inc. 551,443 63,405* Sensata Technologies
Holding NV 1,075,665 54,977
Acuity Brands Inc. 264,722 46,591* United Rentals Inc. 265,660 45,670^ Wabtec Corp. 542,588 44,183
Robert Half
International Inc. 747,920 41,540
CH Robinson
Worldwide Inc. 437,887 39,011
Xylem Inc. 564,034 38,467
Packaging Corp.
of America 296,353 35,725* CoStar Group Inc. 113,538 33,715
Macquarie
Infrastructure Corp. 504,648 32,398
Cognex Corp. 516,659 31,599* IPG Photonics Corp. 109,453 23,437* Stericycle Inc. 268,172 18,233
2,863,724
Oil & Gas (4.6%) * Concho Resources Inc. 933,722 140,264
EQT Corp. 1,618,655 92,134
Cabot Oil & Gas Corp. 2,903,859 83,050
Cimarex Energy Co. 597,943 72,955* Cheniere Energy Inc. 1,268,684 68,306
Targa Resources Corp. 677,310 32,795* Antero Resources Corp. 1,387,979 26,372
515,876
65
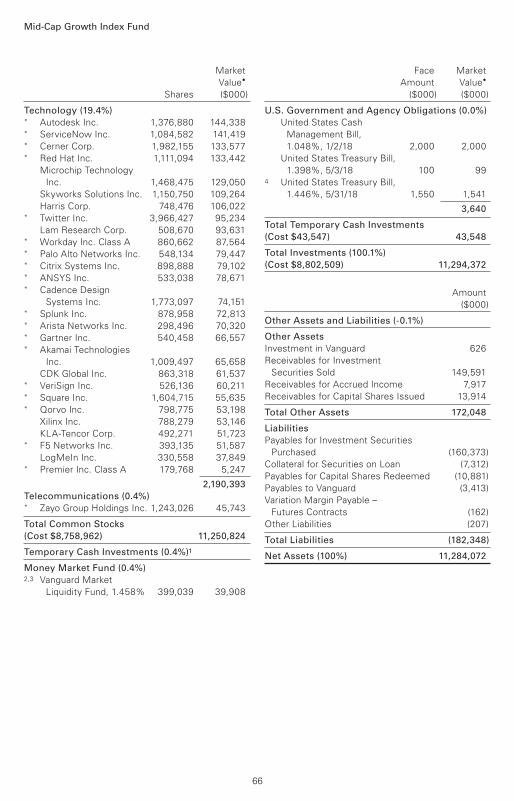
Mid-Cap Growth Index Fund
Market
Value•
Shares ($000)
Face Market
Amount Value•
($000) ($000)
Technology (19.4%) * Autodesk Inc. 1,376,880 144,338* ServiceNow Inc. 1,084,582 141,419* Cerner Corp. 1,982,155 133,577* Red Hat Inc. 1,111,094 133,442
Microchip Technology
Inc. 1,468,475 129,050
Skyworks Solutions Inc. 1,150,750 109,264
Harris Corp. 748,476 106,022* Twitter Inc. 3,966,427 95,234
Lam Research Corp. 508,670 93,631* Workday Inc. Class A 860,662 87,564* Palo Alto Networks Inc. 548,134 79,447* Citrix Systems Inc. 898,888 79,102* ANSYS Inc. 533,038 78,671* Cadence Design
Systems Inc. 1,773,097 74,151* Splunk Inc. 878,958 72,813* Arista Networks Inc. 298,496 70,320* Gartner Inc. 540,458 66,557* Akamai Technologies
Inc. 1,009,497 65,658
CDK Global Inc. 863,318 61,537* VeriSign Inc. 526,136 60,211* Square Inc. 1,604,715 55,635* Qorvo Inc. 798,775 53,198
Xilinx Inc. 788,279 53,146
KLA-Tencor Corp. 492,271 51,723* F5 Networks Inc. 393,135 51,587
LogMeIn Inc. 330,558 37,849* Premier Inc. Class A 179,768 5,247
2,190,393
Telecommunications (0.4%) * Zayo Group Holdings Inc. 1,243,026 45,743
Total Common Stocks
(Cost $8,758,962) 11,250,824
Temporary Cash Investments (0.4%)1
Money Market Fund (0.4%)2,3 Vanguard Market
Liquidity Fund, 1.458% 399,039 39,908
U.S. Government and Agency Obligations (0.0%)
United States Cash
Management Bill,
1.048%, 1/2/18 2,000 2,000
United States Treasury Bill,
1.398%, 5/3/18 100 994 United States Treasury Bill,
1.446%, 5/31/18 1,550 1,541
3,640
Total Temporary Cash Investments
(Cost $43,547) 43,548
Total Investments (100.1%)
(Cost $8,802,509) 11,294,372
Amount
($000)
Other Assets and Liabilities (-0.1%)
Other Assets
Investment in Vanguard 626
Receivables for Investment
Securities Sold 149,591
Receivables for Accrued Income 7,917
Receivables for Capital Shares Issued 13,914
Total Other Assets 172,048
Liabilities
Payables for Investment Securities
Purchased (160,373)
Collateral for Securities on Loan (7,312)
Payables for Capital Shares Redeemed (10,881)
Payables to Vanguard (3,413)
Variation Margin Payable –
Futures Contracts (162)
Other Liabilities (207)
Total Liabilities (182,348)
Net Assets (100%) 11,284,072
66
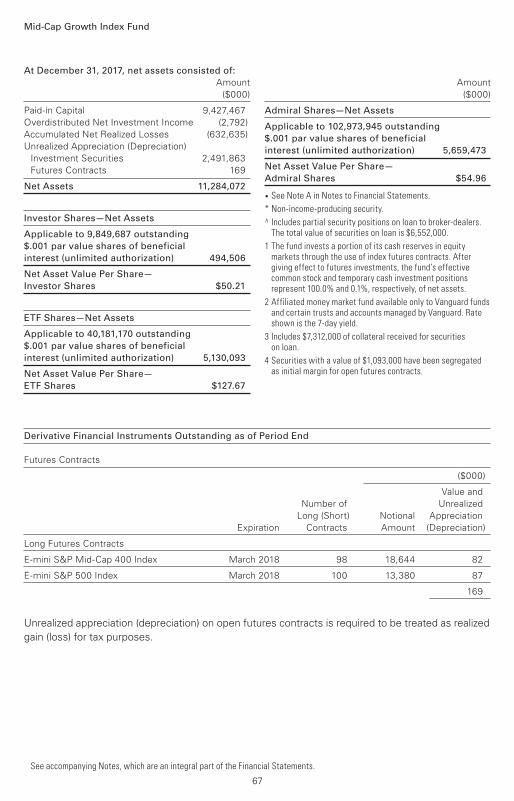
Derivative Financial Instruments Outstanding as of Period End
Futures Contracts
($000)
Value and
Number of Unrealized
Long (Short) Notional Appreciation
Expiration Contracts Amount (Depreciation)
Long Futures Contracts
E-mini S&P Mid-Cap 400 Index March 2018 98 18,644 82
E-mini S&P 500 Index March 2018 100 13,380 87
169
Unrealized appreciation (depreciation) on open futures contracts is required to be treated as realized
gain (loss) for tax purposes.
Mid-Cap Growth Index Fund
At December 31, 2017, net assets consisted of:
Amount
($000)
Amount
($000)
Paid-in Capital 9,427,467
Overdistributed Net Investment Income (2,792)
Accumulated Net Realized Losses (632,635)
Unrealized Appreciation (Depreciation)
Investment Securities 2,491,863
Futures Contracts 169
Net Assets 11,284,072
Investor Shares—Net Assets
Applicable to 9,849,687 outstanding
$.001 par value shares of beneficial
interest (unlimited authorization) 494,506
Net Asset Value Per Share—
Investor Shares $50.21
ETF Shares—Net Assets
Applicable to 40,181,170 outstanding
$.001 par value shares of beneficial
interest (unlimited authorization) 5,130,093
Net Asset Value Per Share—
ETF Shares $127.67
Admiral Shares—Net Assets
Applicable to 102,973,945 outstanding
$.001 par value shares of beneficial
interest (unlimited authorization) 5,659,473
Net Asset Value Per Share—
Admiral Shares $54.96
• See Note A in Notes to Financial Statements.
* Non-income-producing security.
^ Includes partial security positions on loan to broker-dealers. The total value of securities on loan is $6,552,000.
1 The fund invests a portion of its cash reserves in equity markets through the use of index futures contracts. After giving effect to futures investments, the fund’s effective common stock and temporary cash investment positions represent 100.0% and 0.1%, respectively, of net assets.
2 Affiliated money market fund available only to Vanguard funds and certain trusts and accounts managed by Vanguard. Rate shown is the 7-day yield.
3 Includes $7,312,000 of collateral received for securities on loan.
4 Securities with a value of $1,093,000 have been segregated as initial margin for open futures contracts.
See accompanying Notes, which are an integral part of the Financial Statements.
67
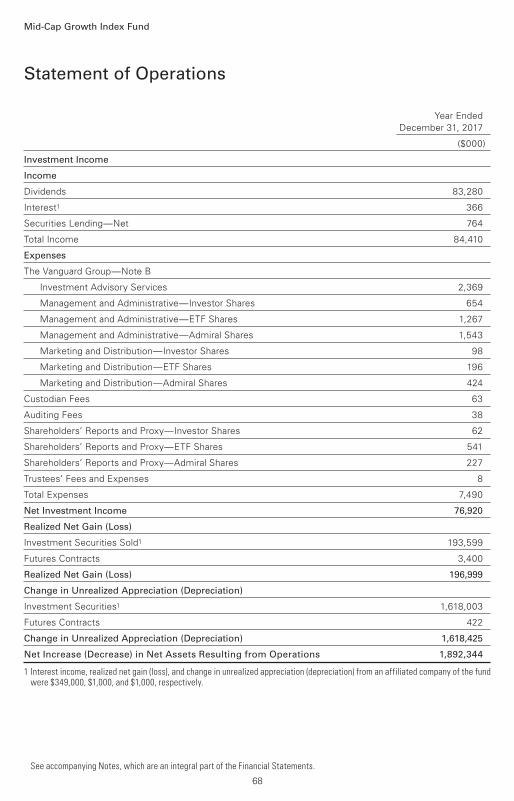
Year Ended
December 31, 2017
($000)
Investment Income
Income
Dividends 83,280
Interest1 366
Securities Lending—Net 764
Total Income 84,410
Expenses
The Vanguard Group—Note B
Investment Advisory Services 2,369
Management and Administrative—Investor Shares 654
Management and Administrative—ETF Shares 1,267
Management and Administrative—Admiral Shares 1,543
Marketing and Distribution—Investor Shares 98
Marketing and Distribution—ETF Shares 196
Marketing and Distribution—Admiral Shares 424
Custodian Fees 63
Auditing Fees 38
Shareholders’ Reports and Proxy—Investor Shares 62
Shareholders’ Reports and Proxy—ETF Shares 541
Shareholders’ Reports and Proxy—Admiral Shares 227
Trustees’ Fees and Expenses 8
Total Expenses 7,490
Net Investment Income 76,920
Realized Net Gain (Loss)
Investment Securities Sold1 193,599
Futures Contracts 3,400
Realized Net Gain (Loss) 196,999
Change in Unrealized Appreciation (Depreciation)
Investment Securities1 1,618,003
Futures Contracts 422
Change in Unrealized Appreciation (Depreciation) 1,618,425
Net Increase (Decrease) in Net Assets Resulting from Operations 1,892,344
1 Interest income, realized net gain (loss), and change in unrealized appreciation (depreciation) from an affiliated company of the fund were $349,000, $1,000, and $1,000, respectively.
Statement of Operations
Mid-Cap Growth Index Fund
See accompanying Notes, which are an integral part of the Financial Statements.
68
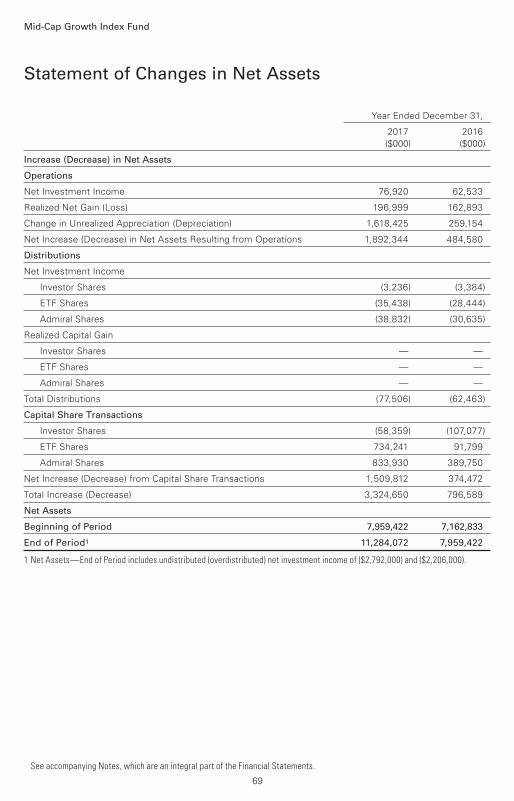
Statement of Changes in Net Assets
Mid-Cap Growth Index Fund
See accompanying Notes, which are an integral part of the Financial Statements.
Year Ended December 31,
2017 2016
($000) ($000)
Increase (Decrease) in Net Assets
Operations
Net Investment Income 76,920 62,533
Realized Net Gain (Loss) 196,999 162,893
Change in Unrealized Appreciation (Depreciation) 1,618,425 259,154
Net Increase (Decrease) in Net Assets Resulting from Operations 1,892,344 484,580
Distributions
Net Investment Income
Investor Shares (3,236) (3,384)
ETF Shares (35,438) (28,444)
Admiral Shares (38,832) (30,635)
Realized Capital Gain
Investor Shares — —
ETF Shares — —
Admiral Shares — —
Total Distributions (77,506) (62,463)
Capital Share Transactions
Investor Shares (58,359) (107,077)
ETF Shares 734,241 91,799
Admiral Shares 833,930 389,750
Net Increase (Decrease) from Capital Share Transactions 1,509,812 374,472
Total Increase (Decrease) 3,324,650 796,589
Net Assets
Beginning of Period 7,959,422 7,162,833
End of Period1 11,284,072 7,959,422
1 Net Assets—End of Period includes undistributed (overdistributed) net investment income of ($2,792,000) and ($2,206,000).
69
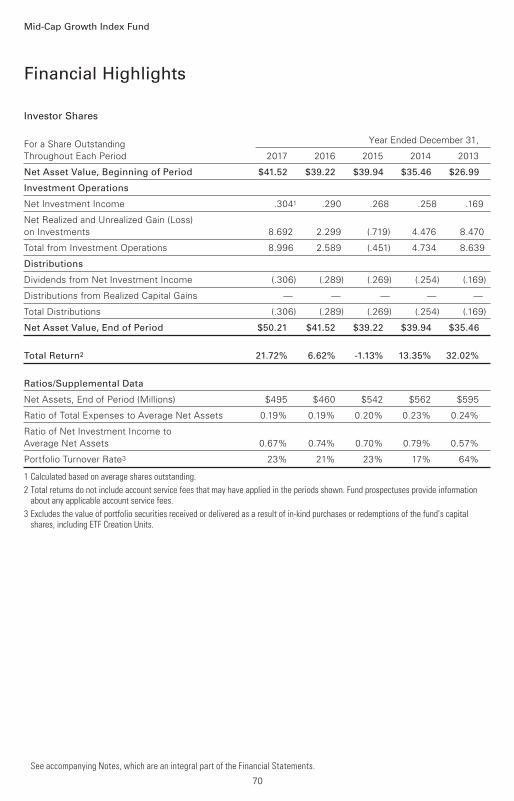
Investor Shares
For a Share Outstanding Year Ended December 31,
Throughout Each Period 2017 2016 2015 2014 2013
Net Asset Value, Beginning of Period $41.52 $39.22 $39.94 $35.46 $26.99
Investment Operations
Net Investment Income .3041 .290 .268 .258 .169
Net Realized and Unrealized Gain (Loss)
on Investments 8.692 2.299 (.719) 4.476 8.470
Total from Investment Operations 8.996 2.589 (.451) 4.734 8.639
Distributions
Dividends from Net Investment Income (.306) (.289) (.269) (.254) (.169)
Distributions from Realized Capital Gains — — — — —
Total Distributions (.306) (.289) (.269) (.254) (.169)
Net Asset Value, End of Period $50.21 $41.52 $39.22 $39.94 $35.46
Total Return2 21.72% 6.62% -1.13% 13.35% 32.02%
Ratios/Supplemental Data
Net Assets, End of Period (Millions) $495 $460 $542 $562 $595
Ratio of Total Expenses to Average Net Assets 0.19% 0.19% 0.20% 0.23% 0.24%
Ratio of Net Investment Income to
Average Net Assets 0.67% 0.74% 0.70% 0.79% 0.57%
Portfolio Turnover Rate3 23% 21% 23% 17% 64%
1 Calculated based on average shares outstanding.
2 Total returns do not include account service fees that may have applied in the periods shown. Fund prospectuses provide information about any applicable account service fees.
3 Excludes the value of portfolio securities received or delivered as a result of in-kind purchases or redemptions of the fund’s capital shares, including ETF Creation Units.
Financial Highlights
See accompanying Notes, which are an integral part of the Financial Statements.
Mid-Cap Growth Index Fund
70
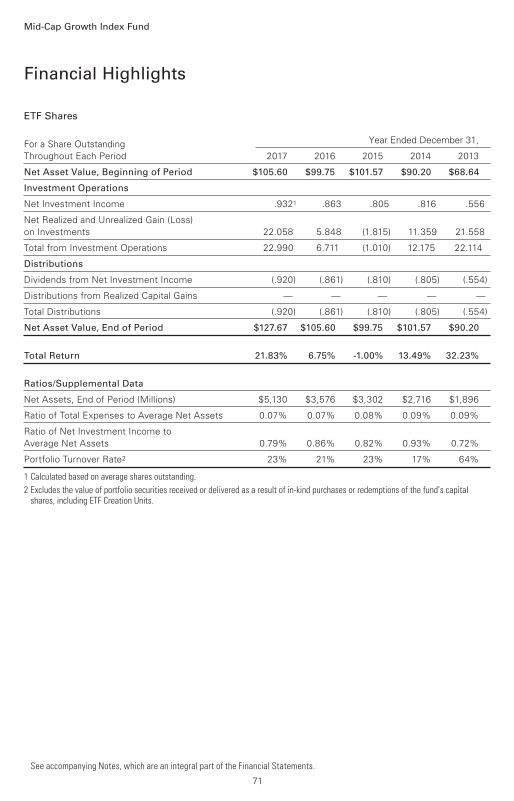
ETF Shares
For a Share Outstanding Year Ended December 31,
Throughout Each Period 2017 2016 2015 2014 2013
Net Asset Value, Beginning of Period $105.60 $99.75 $101.57 $90.20 $68.64
Investment Operations
Net Investment Income .9321 .863 .805 .816 .556
Net Realized and Unrealized Gain (Loss)
on Investments 22.058 5.848 (1.815) 11.359 21.558
Total from Investment Operations 22.990 6.711 (1.010) 12.175 22.114
Distributions
Dividends from Net Investment Income (.920) (.861) (.810) (.805) (.554)
Distributions from Realized Capital Gains — — — — —
Total Distributions (.920) (.861) (.810) (.805) (.554)
Net Asset Value, End of Period $127.67 $105.60 $99.75 $101.57 $90.20
Total Return 21.83% 6.75% -1.00% 13.49% 32.23%
Ratios/Supplemental Data
Net Assets, End of Period (Millions) $5,130 $3,576 $3,302 $2,716 $1,896
Ratio of Total Expenses to Average Net Assets 0.07% 0.07% 0.08% 0.09% 0.09%
Ratio of Net Investment Income to
Average Net Assets 0.79% 0.86% 0.82% 0.93% 0.72%
Portfolio Turnover Rate2 23% 21% 23% 17% 64%
1 Calculated based on average shares outstanding.
2 Excludes the value of portfolio securities received or delivered as a result of in-kind purchases or redemptions of the fund’s capital shares, including ETF Creation Units.
Financial Highlights
See accompanying Notes, which are an integral part of the Financial Statements.
Mid-Cap Growth Index Fund
71
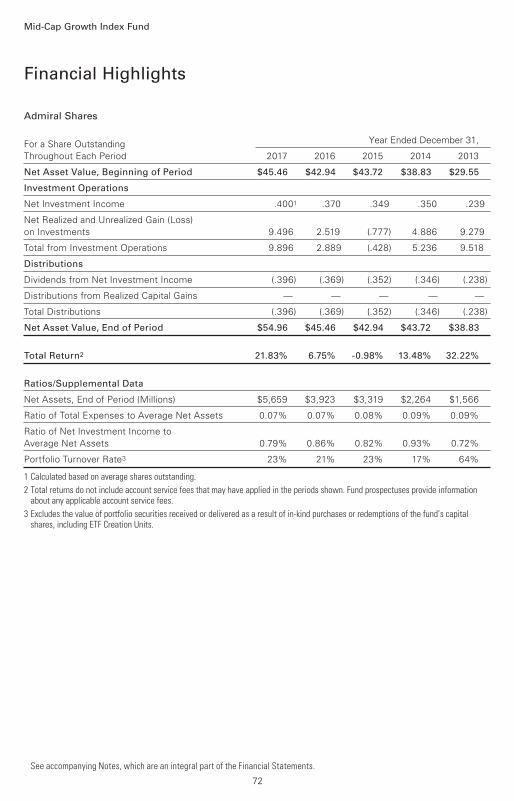
Admiral Shares
For a Share Outstanding Year Ended December 31,
Throughout Each Period 2017 2016 2015 2014 2013
Net Asset Value, Beginning of Period $45.46 $42.94 $43.72 $38.83 $29.55
Investment Operations
Net Investment Income .4001 .370 .349 .350 .239
Net Realized and Unrealized Gain (Loss)
on Investments 9.496 2.519 (.777) 4.886 9.279
Total from Investment Operations 9.896 2.889 (.428) 5.236 9.518
Distributions
Dividends from Net Investment Income (.396) (.369) (.352) (.346) (.238)
Distributions from Realized Capital Gains — — — — —
Total Distributions (.396) (.369) (.352) (.346) (.238)
Net Asset Value, End of Period $54.96 $45.46 $42.94 $43.72 $38.83
Total Return2 21.83% 6.75% -0.98% 13.48% 32.22%
Ratios/Supplemental Data
Net Assets, End of Period (Millions) $5,659 $3,923 $3,319 $2,264 $1,566
Ratio of Total Expenses to Average Net Assets 0.07% 0.07% 0.08% 0.09% 0.09%
Ratio of Net Investment Income to
Average Net Assets 0.79% 0.86% 0.82% 0.93% 0.72%
Portfolio Turnover Rate3 23% 21% 23% 17% 64%
1 Calculated based on average shares outstanding.
2 Total returns do not include account service fees that may have applied in the periods shown. Fund prospectuses provide information about any applicable account service fees.
3 Excludes the value of portfolio securities received or delivered as a result of in-kind purchases or redemptions of the fund’s capital shares, including ETF Creation Units.
Financial Highlights
See accompanying Notes, which are an integral part of the Financial Statements.
Mid-Cap Growth Index Fund
72
Notes to Financial Statements
Mid-Cap Growth Index Fund
Vanguard Mid-Cap Growth Index Fund is registered under the Investment Company Act of 1940
as an open-end investment company, or mutual fund. The fund offers three classes of shares:
Investor Shares, ETF Shares, and Admiral Shares. Investor Shares are available to any investor
who meets the fund’s minimum purchase requirements. ETF Shares are listed for trading on NYSE
Arca; they can be purchased and sold through a broker. Admiral Shares are designed for investors
who meet certain administrative, service, and account-size criteria.
A. The following significant accounting policies conform to generally accepted accounting
principles for U.S. investment companies. The fund consistently follows such policies in
preparing its financial statements.
1. Security Valuation: Securities are valued as of the close of trading on the New York Stock
Exchange (generally 4 p.m., Eastern time) on the valuation date. Equity securities are valued
at the latest quoted sales prices or official closing prices taken from the primary market in which
each security trades; such securities not traded on the valuation date are valued at the mean of
the latest quoted bid and asked prices. Securities for which market quotations are not readily
available, or whose values have been materially affected by events occurring before the fund’s
pricing time but after the close of the securities’ primary markets, are valued by methods deemed
by the board of trustees to represent fair value. Investments in Vanguard Market Liquidity Fund are
valued at that fund’s net asset value. Temporary cash investments are valued using the latest bid
prices or using valuations based on a matrix system (which considers such factors as security
prices, yields, maturities, and ratings), both as furnished by independent pricing services.
2. Futures Contracts: The fund uses index futures contracts to a limited extent, with the objectives
of maintaining full exposure to the stock market, maintaining liquidity, and minimizing
transaction costs. The fund may purchase futures contracts to immediately invest incoming
cash in the market, or sell futures in response to cash outflows, thereby simulating a fully invested
position in the underlying index while maintaining a cash balance for liquidity. The primary risks
associated with the use of futures contracts are imperfect correlation between changes in market
values of stocks held by the fund and the prices of futures contracts, and the possibility of an illiquid
market. Counterparty risk involving futures is mitigated because a regulated clearinghouse is the
counterparty instead of the clearing broker. To further mitigate counterparty risk, the fund trades
futures contracts on an exchange, monitors the financial strength of its clearing brokers and
clearinghouse, and has entered into clearing agreements with its clearing brokers. The
clearinghouse imposes initial margin requirements to secure the fund’s performance and requires
daily settlement of variation margin representing changes in the market value of each contract.
Futures contracts are valued at their quoted daily settlement prices. The notional amounts
of the contracts are not recorded in the Statement of Net Assets. Fluctuations in the value
of the contracts are recorded in the Statement of Net Assets as an asset (liability) and in the
Statement of Operations as unrealized appreciation (depreciation) until the contracts are closed,
when they are recorded as realized futures gains (losses).
During the year ended December 31, 2017, the fund’s average investments in long and short
futures contracts represented less than 1% and 0% of net assets, respectively, based on the
average of the notional amounts at each quarter-end during the period.
73
Mid-Cap Growth Index Fund
3. Federal Income Taxes: The fund intends to continue to qualify as a regulated investment
company and distribute all of its taxable income. Management has analyzed the fund’s tax positions
taken for all open federal income tax years (December 31, 2014–2017), and has concluded that
no provision for federal income tax is required in the fund’s financial statements.
4. Distributions: Distributions to shareholders are recorded on the ex-dividend date.
5. Securities Lending: To earn additional income, the fund lends its securities to qualified institutional
borrowers. Security loans are subject to termination by the fund at any time, and are required to
be secured at all times by collateral in an amount at least equal to the market value of securities
loaned. Daily market fluctuations could cause the value of loaned securities to be more or less than
the value of the collateral received. When this occurs, the collateral is adjusted and settled on the
next business day. The fund further mitigates its counterparty risk by entering into securities
lending transactions only with a diverse group of prequalified counterparties, monitoring their
financial strength, and entering into master securities lending agreements with its counterparties.
The master securities lending agreements provide that, in the event of a counterparty’s default
(including bankruptcy), the fund may terminate any loans with that borrower, determine the net
amount owed, and sell or retain the collateral up to the net amount owed to the fund; however,
such actions may be subject to legal proceedings. While collateral mitigates counterparty risk,
in the event of a default, the fund may experience delays and costs in recovering the securities
loaned. The fund invests cash collateral received in Vanguard Market Liquidity Fund, and records
a liability in the Statement of Net Assets for the return of the collateral, during the period the
securities are on loan. Securities lending income represents fees charged to borrowers plus income
earned on invested cash collateral, less expenses associated with the loan. During the term of the
loan, the fund is entitled to all distributions made on or in respect of the loaned securities.
6. Credit Facility: The fund and certain other funds managed by The Vanguard Group (“Vanguard”)
participate in a $3.1 billion committed credit facility provided by a syndicate of lenders pursuant to
a credit agreement that may be renewed annually; each fund is individually liable for its borrowings,
if any, under the credit facility. Borrowings may be utilized for temporary and emergency purposes,
and are subject to the fund’s regulatory and contractual borrowing restrictions. The participating
funds are charged administrative fees and an annual commitment fee of 0.10% of the undrawn
amount of the facility; these fees are allocated to the funds based on a method approved by the
fund’s board of trustees and included in Management and Administrative expenses on the fund’s
Statement of Operations. Any borrowings under this facility bear interest at a rate based upon the
higher of the one-month London Interbank Offered Rate, federal funds effective rate, or overnight
bank funding rate plus an agreed-upon spread.
The fund had no borrowings outstanding at December 31, 2017, or at any time during the period
then ended.
7. Other: Dividend income is recorded on the ex-dividend date. Interest income includes income
distributions received from Vanguard Market Liquidity Fund and is accrued daily. Premiums and
discounts on debt securities purchased are amortized and accreted, respectively, to interest income
over the lives of the respective securities. Security transactions are accounted for on the date
securities are bought or sold. Costs used to determine realized gains (losses) on the sale of
investment securities are those of the specific securities sold.
74
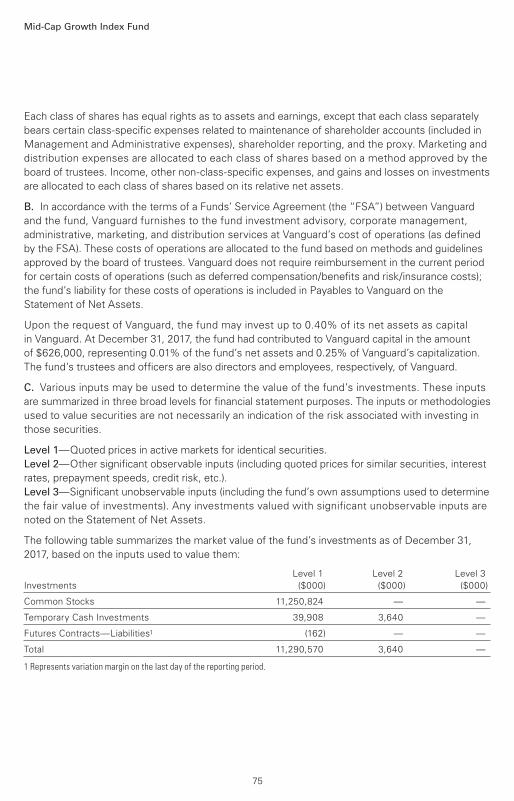
Mid-Cap Growth Index Fund
Each class of shares has equal rights as to assets and earnings, except that each class separately
bears certain class-specific expenses related to maintenance of shareholder accounts (included in
Management and Administrative expenses), shareholder reporting, and the proxy. Marketing and
distribution expenses are allocated to each class of shares based on a method approved by the
board of trustees. Income, other non-class-specific expenses, and gains and losses on investments
are allocated to each class of shares based on its relative net assets.
B. In accordance with the terms of a Funds’ Service Agreement (the “FSA”) between Vanguard
and the fund, Vanguard furnishes to the fund investment advisory, corporate management,
administrative, marketing, and distribution services at Vanguard’s cost of operations (as defined
by the FSA). These costs of operations are allocated to the fund based on methods and guidelines
approved by the board of trustees. Vanguard does not require reimbursement in the current period
for certain costs of operations (such as deferred compensation/benefits and risk/insurance costs);
the fund’s liability for these costs of operations is included in Payables to Vanguard on the
Statement of Net Assets.
Upon the request of Vanguard, the fund may invest up to 0.40% of its net assets as capital
in Vanguard. At December 31, 2017, the fund had contributed to Vanguard capital in the amount
of $626,000, representing 0.01% of the fund’s net assets and 0.25% of Vanguard’s capitalization.
The fund’s trustees and officers are also directors and employees, respectively, of Vanguard.
C. Various inputs may be used to determine the value of the fund’s investments. These inputs
are summarized in three broad levels for financial statement purposes. The inputs or methodologies
used to value securities are not necessarily an indication of the risk associated with investing in
those securities.
Level 1—Quoted prices in active markets for identical securities.
Level 2—Other significant observable inputs (including quoted prices for similar securities, interest
rates, prepayment speeds, credit risk, etc.).
Level 3—Significant unobservable inputs (including the fund’s own assumptions used to determine
the fair value of investments). Any investments valued with significant unobservable inputs are
noted on the Statement of Net Assets.
The following table summarizes the market value of the fund’s investments as of December 31,
2017, based on the inputs used to value them:
Level 1 Level 2 Level 3
Investments ($000) ($000) ($000)
Common Stocks 11,250,824 — —
Temporary Cash Investments 39,908 3,640 —
Futures Contracts—Liabilities1 (162) — —
Total 11,290,570 3,640 —
1 Represents variation margin on the last day of the reporting period.
75
76
Mid-Cap Growth Index Fund
D. Distributions are determined on a tax basis and may differ from net investment income and
realized capital gains for financial reporting purposes. Differences may be permanent or temporary.
Permanent differences are reclassified among capital accounts in the financial statements to reflect
their tax character. Temporary differences arise when certain items of income, expense, gain, or
loss are recognized in different periods for financial statement and tax purposes. These differences
will reverse at some time in the future. Differences in classification may also result from the
treatment of short-term gains as ordinary income for tax purposes.
During the year ended December 31, 2017, the fund realized $345,993,000 of net capital gains
resulting from in-kind redemptions—in which shareholders exchanged fund shares for securities
held by the fund rather than for cash. Because such gains are not taxable to the fund, and are not
distributed to shareholders, they have been reclassified from accumulated net realized losses to
paid-in capital.
For tax purposes, at December 31, 2017, the fund had $202,000 of ordinary income available
for distribution. At December 31, 2017, the fund had available capital losses totaling $613,501,000
to offset future net capital gains. Of this amount, $73,214,000 is subject to expiration on
December 31, 2018. Capital losses of $540,287,000 realized beginning in fiscal 2011 may be
carried forward indefinitely under the Regulated Investment Company Modernization Act of
2010, but must be used before any expiring loss carryforwards.
At December 31, 2017, the cost of investment securities for tax purposes was $8,821,475,000.
Net unrealized appreciation of investment securities for tax purposes was $2,472,897,000,
consisting of unrealized gains of $2,673,340,000 on securities that had risen in value since their
purchase and $200,443,000 in unrealized losses on securities that had fallen in value since their
purchase.
E. During the year ended December 31, 2017, the fund purchased $4,552,216,000 of
investment securities and sold $3,043,236,000 of investment securities, other than temporary
cash investments. Purchases and sales include $1,414,779,000 and $762,834,000, respectively,
in connection with in-kind purchases and redemptions of the fund’s capital shares.
The fund purchased securities from and sold securities to other Vanguard funds or accounts
managed by Vanguard or its affiliates, in accordance with procedures adopted by the board of
trustees in compliance with Rule 17a-7 of the Investment Company Act of 1940. For the year
ended December 31, 2017, such purchases and sales were $402,205,000 and $768,494,000,
respectively; these amounts are included in the purchases and sales of investment securities
noted above.
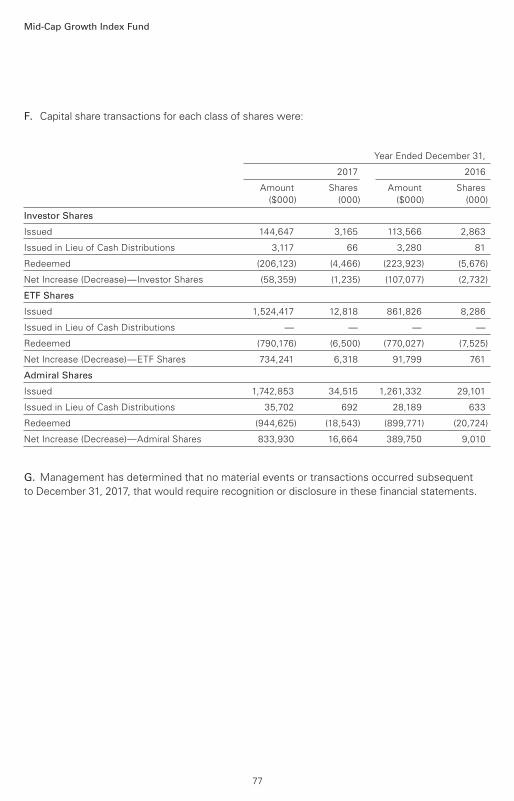
Mid-Cap Growth Index Fund
F. Capital share transactions for each class of shares were:
Year Ended December 31,
2017 2016
Amount Shares Amount Shares
($000) (000) ($000) (000)
Investor Shares
Issued 144,647 3,165 113,566 2,863
Issued in Lieu of Cash Distributions 3,117 66 3,280 81
Redeemed (206,123) (4,466) (223,923) (5,676)
Net Increase (Decrease)—Investor Shares (58,359) (1,235) (107,077) (2,732)
ETF Shares
Issued 1,524,417 12,818 861,826 8,286
Issued in Lieu of Cash Distributions — — — —
Redeemed (790,176) (6,500) (770,027) (7,525)
Net Increase (Decrease)—ETF Shares 734,241 6,318 91,799 761
Admiral Shares
Issued 1,742,853 34,515 1,261,332 29,101
Issued in Lieu of Cash Distributions 35,702 692 28,189 633
Redeemed (944,625) (18,543) (899,771) (20,724)
Net Increase (Decrease)—Admiral Shares 833,930 16,664 389,750 9,010
G. Management has determined that no material events or transactions occurred subsequent
to December 31, 2017, that would require recognition or disclosure in these financial statements.
77
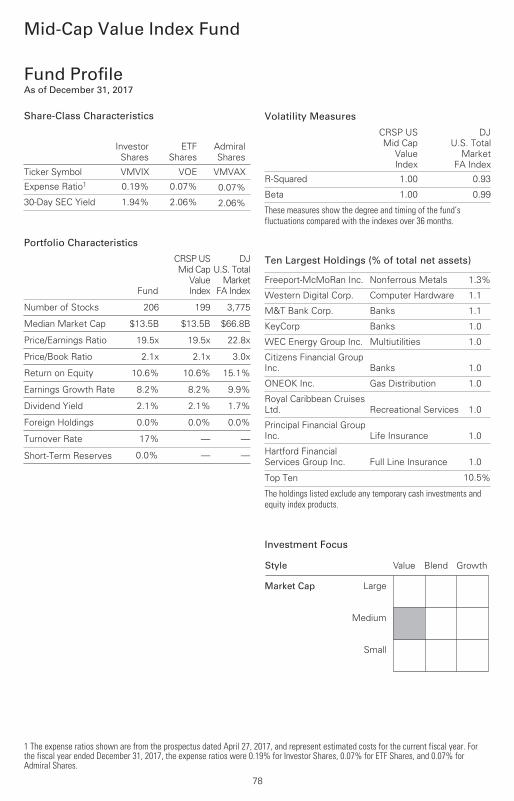
Mid-Cap Value Index Fund
Fund ProfileAs of December 31, 2017
1 The expense ratios shown are from the prospectus dated April 27, 2017, and represent estimated costs for the current fiscal year. Forthe fiscal year ended December 31, 2017, the expense ratios were 0.19% for Investor Shares, 0.07% for ETF Shares, and 0.07% forAdmiral Shares.
78
Share-Class Characteristics
InvestorShares
ETFShares
AdmiralShares
Ticker Symbol VMVIX VOE VMVAX
Expense Ratio1 0.19% 0.07% 0.07%
30-Day SEC Yield 1.94% 2.06% 2.06%
Volatility Measures
CRSP US
Mid Cap
Value
Index
DJ
U.S. Total
Market
FA Index
R-Squared 1.00 0.93
Beta 1.00 0.99
These measures show the degree and timing of the fund’s fluctuations compared with the indexes over 36 months.
Ten Largest Holdings (% of total net assets)
Freeport-McMoRan Inc. Nonferrous Metals 1.3%
Western Digital Corp. Computer Hardware 1.1
M&T Bank Corp. Banks 1.1
KeyCorp Banks 1.0
WEC Energy Group Inc. Multiutilities 1.0
Citizens Financial Group
Inc. Banks 1.0
ONEOK Inc. Gas Distribution 1.0
Royal Caribbean Cruises
Ltd. Recreational Services 1.0
Principal Financial Group
Inc. Life Insurance 1.0
Hartford Financial
Services Group Inc. Full Line Insurance 1.0
Top Ten 10.5%
The holdings listed exclude any temporary cash investments andequity index products.
Investment Focus
Market Cap
Value
Large
Medium
Small
Blend Growth Style
Portfolio Characteristics
Fund
CRSP US
Mid Cap
Value
Index
DJ
U.S. Total
Market
FA Index
Number of Stocks 206 199 3,775
Median Market Cap $13.5B $13.5B $66.8B
Price/Earnings Ratio 19.5x 19.5x 22.8x
Price/Book Ratio 2.1x 2.1x 3.0x
Return on Equity 10.6% 10.6% 15.1%
Earnings Growth Rate 8.2% 8.2% 9.9%
Dividend Yield 2.1% 2.1% 1.7%
Foreign Holdings 0.0% 0.0% 0.0%
Turnover Rate 17% — —
Short-Term Reserves 0.0% — —
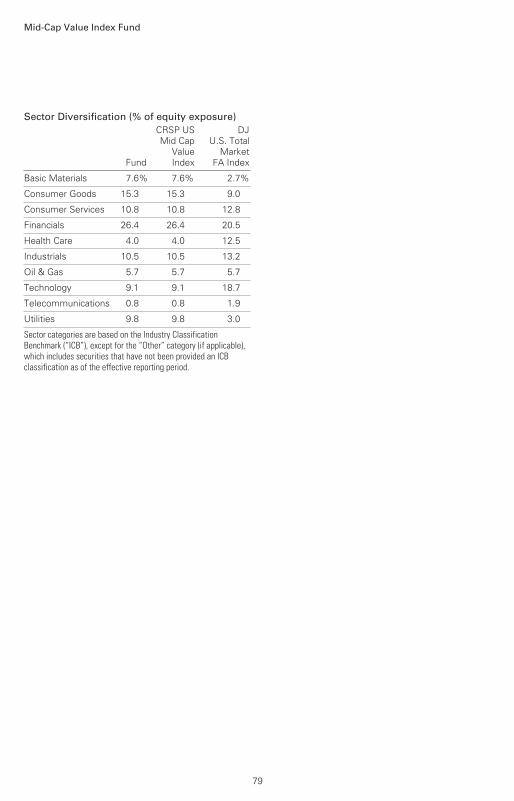
Mid-Cap Value Index Fund
79
Sector Diversification (% of equity exposure)
Fund
CRSP USMid Cap
ValueIndex
DJU.S. Total
MarketFA Index
Basic Materials 7.6% 7.6% 2.7%
Consumer Goods 15.3 15.3 9.0
Consumer Services 10.8 10.8 12.8
Financials 26.4 26.4 20.5
Health Care 4.0 4.0 12.5
Industrials 10.5 10.5 13.2
Oil & Gas 5.7 5.7 5.7
Technology 9.1 9.1 18.7
Telecommunications 0.8 0.8 1.9
Utilities 9.8 9.8 3.0
Sector categories are based on the Industry ClassificationBenchmark (“ICB”), except for the “Other” category (if applicable),which includes securities that have not been provided an ICBclassification as of the effective reporting period.

All of the returns in this report represent past performance, which is not a guarantee of future results that may be achieved by the fund. (Current performance may be lower or higher thanthe performance data cited. For performance data current to the most recent month-end, visitour website at vanguard.com/performance.) Note, too, that both investment returns and principal value can fluctuate widely, so an investor’s shares, when sold, could be worth more or less than their original cost. The returns shown do not reflect taxes that a shareholder would pay
on fund distributions or on the sale of fund shares.
Performance Summary
Mid-Cap Value Index Fund
See Financial Highlights for dividend and capital gains information.
80
Cumulative Performance: December 31, 2007, Through December 31, 2017Initial Investment of $10,000
2017201620152014201320122011201020092008
$31,000
2,000
25,273
Average Annual Total Returns
Periods Ended December 31, 2017
OneYear
FiveYears
TenYears
Final Valueof a $10,000Investment
Mid-Cap Value Index Fund*InvestorShares 16.91% 15.61% 9.71% $25,273
• • • • • • • • Spliced Mid-Cap Value Index 17.12 15.83 9.93 25,776
– – – – Mid-Cap Value Funds Average 12.41 13.47 7.92 21,429________ Dow Jones U.S. Total Stock Market
Float Adjusted Index 21.16 15.52 8.66 22,948
For a benchmark description, see the Glossary.
Mid-Cap Value Funds Average: Derived from data provided by Lipper, a Thomson Reuters Company.
OneYear
FiveYears
TenYears
Final Valueof a $10,000Investment
Mid-Cap Value Index FundETF Shares Net Asset Value 17.05% 15.76% 9.86% $25,609
Spliced Mid-Cap Value Index 17.12 15.83 9.93 25,776
Dow Jones U.S. Total Stock Market FloatAdjusted Index 21.16 15.52 8.66 22,948
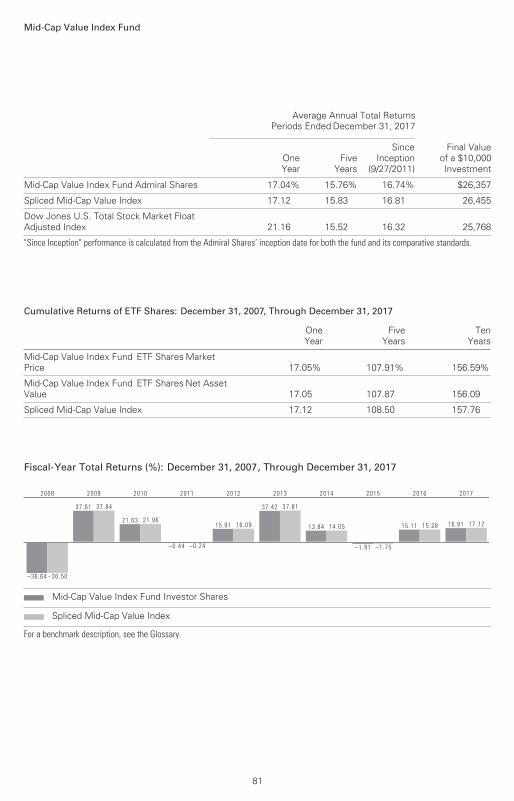
Mid-Cap Value Index Fund
81
Average Annual Total Returns
Periods Ended December 31, 2017
OneYear
FiveYears
SinceInception
(9/27/2011)
Final Valueof a $10,000Investment
Mid-Cap Value Index Fund Admiral Shares 17.04% 15.76% 16.74% $26,357
Spliced Mid-Cap Value Index 17.12 15.83 16.81 26,455
Dow Jones U.S. Total Stock Market Float Adjusted Index 21.16 15.52 16.32 25,768
"Since Inception" performance is calculated from the Admiral Shares’ inception date for both the fund and its comparative standards.
Cumulative Returns of ETF Shares: December 31, 2007, Through December 31, 2017
OneYear
FiveYears
TenYears
Mid-Cap Value Index Fund ETF Shares MarketPrice 17.05% 107.91% 156.59%
Mid-Cap Value Index Fund ETF Shares Net AssetValue 17.05 107.87 156.09
Spliced Mid-Cap Value Index 17.12 108.50 157.76
Fiscal-Year Total Returns (%): December 31, 2007, Through December 31, 2017
–36.64 –36.50
2008
37 .61 37 .84
2009
21 .63 21 .96
2010
–0.44 –0.24
2011
15 .91 16 .09
2012
37 .42 37 .81
2013
13 .84 14 .05
2014
–1.91 –1.75
2015
15 .11 15 .28
2016
16 .91 17 .12
2017
Mid-Cap Value Index Fund Investor Shares
Spliced Mid-Cap Value Index
For a benchmark description, see the Glossary.
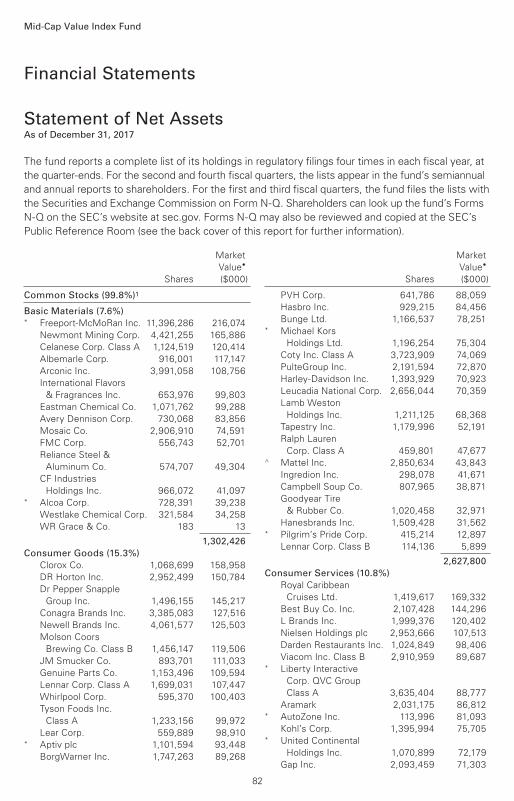
Market
Value•
Shares ($000)
Market
Value•
Shares ($000)
Common Stocks (99.8%)1
Basic Materials (7.6%) * Freeport-McMoRan Inc. 11,396,286 216,074
Newmont Mining Corp. 4,421,255 165,886
Celanese Corp. Class A 1,124,519 120,414
Albemarle Corp. 916,001 117,147
Arconic Inc. 3,991,058 108,756
International Flavors
& Fragrances Inc. 653,976 99,803
Eastman Chemical Co. 1,071,762 99,288
Avery Dennison Corp. 730,068 83,856
Mosaic Co. 2,906,910 74,591
FMC Corp. 556,743 52,701
Reliance Steel &
Aluminum Co. 574,707 49,304
CF Industries
Holdings Inc. 966,072 41,097* Alcoa Corp. 728,391 39,238
Westlake Chemical Corp. 321,584 34,258
WR Grace & Co. 183 13
1,302,426
Consumer Goods (15.3%)
Clorox Co. 1,068,699 158,958
DR Horton Inc. 2,952,499 150,784
Dr Pepper Snapple
Group Inc. 1,496,155 145,217
Conagra Brands Inc. 3,385,083 127,516
Newell Brands Inc. 4,061,577 125,503
Molson Coors
Brewing Co. Class B 1,456,147 119,506
JM Smucker Co. 893,701 111,033
Genuine Parts Co. 1,153,496 109,594
Lennar Corp. Class A 1,699,031 107,447
Whirlpool Corp. 595,370 100,403
Tyson Foods Inc.
Class A 1,233,156 99,972
Lear Corp. 559,889 98,910* Aptiv plc 1,101,594 93,448
BorgWarner Inc. 1,747,263 89,268
PVH Corp. 641,786 88,059
Hasbro Inc. 929,215 84,456
Bunge Ltd. 1,166,537 78,251* Michael Kors
Holdings Ltd. 1,196,254 75,304
Coty Inc. Class A 3,723,909 74,069
PulteGroup Inc. 2,191,594 72,870
Harley-Davidson Inc. 1,393,929 70,923
Leucadia National Corp. 2,656,044 70,359
Lamb Weston
Holdings Inc. 1,211,125 68,368
Tapestry Inc. 1,179,996 52,191
Ralph Lauren
Corp. Class A 459,801 47,677^ Mattel Inc. 2,850,634 43,843
Ingredion Inc. 298,078 41,671
Campbell Soup Co. 807,965 38,871
Goodyear Tire
& Rubber Co. 1,020,458 32,971
Hanesbrands Inc. 1,509,428 31,562* Pilgrim’s Pride Corp. 415,214 12,897
Lennar Corp. Class B 114,136 5,899
2,627,800
Consumer Services (10.8%)
Royal Caribbean
Cruises Ltd. 1,419,617 169,332
Best Buy Co. Inc. 2,107,428 144,296
L Brands Inc. 1,999,376 120,402
Nielsen Holdings plc 2,953,666 107,513
Darden Restaurants Inc. 1,024,849 98,406
Viacom Inc. Class B 2,910,959 89,687* Liberty Interactive
Corp. QVC Group
Class A 3,635,404 88,777
Aramark 2,031,175 86,812* AutoZone Inc. 113,996 81,093
Kohl’s Corp. 1,395,994 75,705* United Continental
Holdings Inc. 1,070,899 72,179
Gap Inc. 2,093,459 71,303
Financial Statements
Statement of Net AssetsAs of December 31, 2017
The fund reports a complete list of its holdings in regulatory filings four times in each fiscal year, at
the quarter-ends. For the second and fourth fiscal quarters, the lists appear in the fund’s semiannual
and annual reports to shareholders. For the first and third fiscal quarters, the fund files the lists with
the Securities and Exchange Commission on Form N-Q. Shareholders can look up the fund’s Forms
N-Q on the SEC’s website at sec.gov. Forms N-Q may also be reviewed and copied at the SEC’s
Public Reference Room (see the back cover of this report for further information).
Mid-Cap Value Index Fund
82
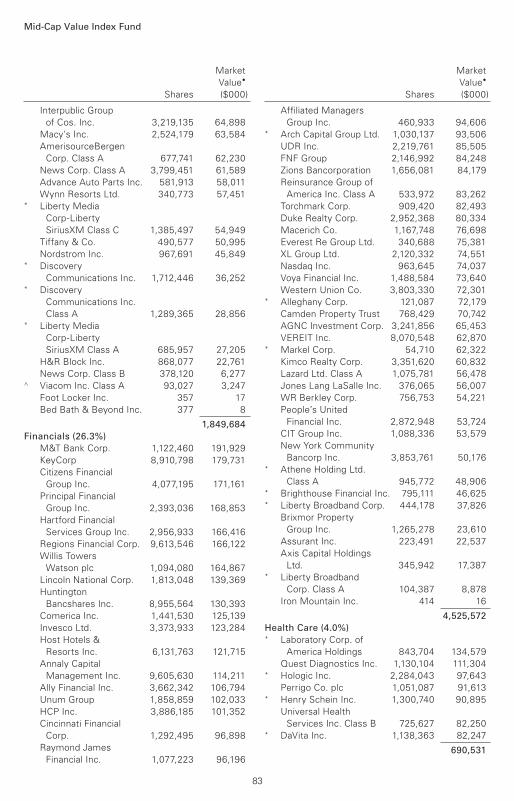
Mid-Cap Value Index Fund
Market
Value•
Shares ($000)
Market
Value•
Shares ($000)
Interpublic Group
of Cos. Inc. 3,219,135 64,898
Macy’s Inc. 2,524,179 63,584
AmerisourceBergen
Corp. Class A 677,741 62,230
News Corp. Class A 3,799,451 61,589
Advance Auto Parts Inc. 581,913 58,011
Wynn Resorts Ltd. 340,773 57,451* Liberty Media
Corp-Liberty
SiriusXM Class C 1,385,497 54,949
Tiffany & Co. 490,577 50,995
Nordstrom Inc. 967,691 45,849* Discovery
Communications Inc. 1,712,446 36,252* Discovery
Communications Inc.
Class A 1,289,365 28,856* Liberty Media
Corp-Liberty
SiriusXM Class A 685,957 27,205
H&R Block Inc. 868,077 22,761
News Corp. Class B 378,120 6,277^ Viacom Inc. Class A 93,027 3,247
Foot Locker Inc. 357 17
Bed Bath & Beyond Inc. 377 8
1,849,684
Financials (26.3%)
M&T Bank Corp. 1,122,460 191,929
KeyCorp 8,910,798 179,731
Citizens Financial
Group Inc. 4,077,195 171,161
Principal Financial
Group Inc. 2,393,036 168,853
Hartford Financial
Services Group Inc. 2,956,933 166,416
Regions Financial Corp. 9,613,546 166,122
Willis Towers
Watson plc 1,094,080 164,867
Lincoln National Corp. 1,813,048 139,369
Huntington
Bancshares Inc. 8,955,564 130,393
Comerica Inc. 1,441,530 125,139
Invesco Ltd. 3,373,933 123,284
Host Hotels &
Resorts Inc. 6,131,763 121,715
Annaly Capital
Management Inc. 9,605,630 114,211
Ally Financial Inc. 3,662,342 106,794
Unum Group 1,858,859 102,033
HCP Inc. 3,886,185 101,352
Cincinnati Financial
Corp. 1,292,495 96,898
Raymond James
Financial Inc. 1,077,223 96,196
Affiliated Managers
Group Inc. 460,933 94,606* Arch Capital Group Ltd. 1,030,137 93,506
UDR Inc. 2,219,761 85,505
FNF Group 2,146,992 84,248
Zions Bancorporation 1,656,081 84,179
Reinsurance Group of
America Inc. Class A 533,972 83,262
Torchmark Corp. 909,420 82,493
Duke Realty Corp. 2,952,368 80,334
Macerich Co. 1,167,748 76,698
Everest Re Group Ltd. 340,688 75,381
XL Group Ltd. 2,120,332 74,551
Nasdaq Inc. 963,645 74,037
Voya Financial Inc. 1,488,584 73,640
Western Union Co. 3,803,330 72,301* Alleghany Corp. 121,087 72,179
Camden Property Trust 768,429 70,742
AGNC Investment Corp. 3,241,856 65,453
VEREIT Inc. 8,070,548 62,870* Markel Corp. 54,710 62,322
Kimco Realty Corp. 3,351,620 60,832
Lazard Ltd. Class A 1,075,781 56,478
Jones Lang LaSalle Inc. 376,065 56,007
WR Berkley Corp. 756,753 54,221
People’s United
Financial Inc. 2,872,948 53,724
CIT Group Inc. 1,088,336 53,579
New York Community
Bancorp Inc. 3,853,761 50,176* Athene Holding Ltd.
Class A 945,772 48,906* Brighthouse Financial Inc. 795,111 46,625* Liberty Broadband Corp. 444,178 37,826
Brixmor Property
Group Inc. 1,265,278 23,610
Assurant Inc. 223,491 22,537
Axis Capital Holdings
Ltd. 345,942 17,387* Liberty Broadband
Corp. Class A 104,387 8,878
Iron Mountain Inc. 414 16
4,525,572
Health Care (4.0%) * Laboratory Corp. of
America Holdings 843,704 134,579
Quest Diagnostics Inc. 1,130,104 111,304* Hologic Inc. 2,284,043 97,643
Perrigo Co. plc 1,051,087 91,613* Henry Schein Inc. 1,300,740 90,895
Universal Health
Services Inc. Class B 725,627 82,250* DaVita Inc. 1,138,363 82,247
690,531
83
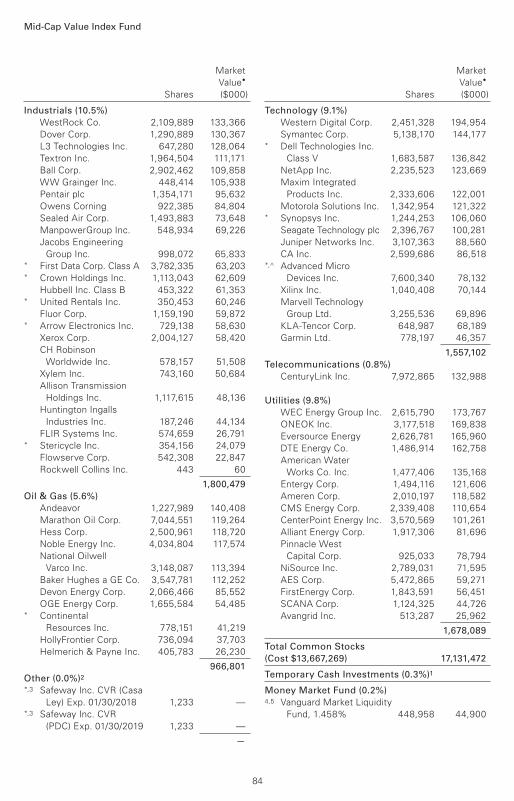
Mid-Cap Value Index Fund
Market
Value•
Shares ($000)
Market
Value•
Shares ($000)
Industrials (10.5%)
WestRock Co. 2,109,889 133,366
Dover Corp. 1,290,889 130,367
L3 Technologies Inc. 647,280 128,064
Textron Inc. 1,964,504 111,171
Ball Corp. 2,902,462 109,858
WW Grainger Inc. 448,414 105,938
Pentair plc 1,354,171 95,632
Owens Corning 922,385 84,804
Sealed Air Corp. 1,493,883 73,648
ManpowerGroup Inc. 548,934 69,226
Jacobs Engineering
Group Inc. 998,072 65,833* First Data Corp. Class A 3,782,335 63,203* Crown Holdings Inc. 1,113,043 62,609
Hubbell Inc. Class B 453,322 61,353* United Rentals Inc. 350,453 60,246
Fluor Corp. 1,159,190 59,872* Arrow Electronics Inc. 729,138 58,630
Xerox Corp. 2,004,127 58,420
CH Robinson
Worldwide Inc. 578,157 51,508
Xylem Inc. 743,160 50,684
Allison Transmission
Holdings Inc. 1,117,615 48,136
Huntington Ingalls
Industries Inc. 187,246 44,134
FLIR Systems Inc. 574,659 26,791* Stericycle Inc. 354,156 24,079
Flowserve Corp. 542,308 22,847
Rockwell Collins Inc. 443 60
1,800,479
Oil & Gas (5.6%)
Andeavor 1,227,989 140,408
Marathon Oil Corp. 7,044,551 119,264
Hess Corp. 2,500,961 118,720
Noble Energy Inc. 4,034,804 117,574
National Oilwell
Varco Inc. 3,148,087 113,394
Baker Hughes a GE Co. 3,547,781 112,252
Devon Energy Corp. 2,066,466 85,552
OGE Energy Corp. 1,655,584 54,485* Continental
Resources Inc. 778,151 41,219
HollyFrontier Corp. 736,094 37,703
Helmerich & Payne Inc. 405,783 26,230
966,801
Other (0.0%)2 *,3 Safeway Inc. CVR (Casa
Ley) Exp. 01/30/2018 1,233 —*,3 Safeway Inc. CVR
(PDC) Exp. 01/30/2019 1,233 —
—
Technology (9.1%)
Western Digital Corp. 2,451,328 194,954
Symantec Corp. 5,138,170 144,177* Dell Technologies Inc.
Class V 1,683,587 136,842
NetApp Inc. 2,235,523 123,669
Maxim Integrated
Products Inc. 2,333,606 122,001
Motorola Solutions Inc. 1,342,954 121,322* Synopsys Inc. 1,244,253 106,060
Seagate Technology plc 2,396,767 100,281
Juniper Networks Inc. 3,107,363 88,560
CA Inc. 2,599,686 86,518*,^ Advanced Micro
Devices Inc. 7,600,340 78,132
Xilinx Inc. 1,040,408 70,144
Marvell Technology
Group Ltd. 3,255,536 69,896
KLA-Tencor Corp. 648,987 68,189
Garmin Ltd. 778,197 46,357
1,557,102
Telecommunications (0.8%)
CenturyLink Inc. 7,972,865 132,988
Utilities (9.8%)
WEC Energy Group Inc. 2,615,790 173,767
ONEOK Inc. 3,177,518 169,838
Eversource Energy 2,626,781 165,960
DTE Energy Co. 1,486,914 162,758
American Water
Works Co. Inc. 1,477,406 135,168
Entergy Corp. 1,494,116 121,606
Ameren Corp. 2,010,197 118,582
CMS Energy Corp. 2,339,408 110,654
CenterPoint Energy Inc. 3,570,569 101,261
Alliant Energy Corp. 1,917,306 81,696
Pinnacle West
Capital Corp. 925,033 78,794
NiSource Inc. 2,789,031 71,595
AES Corp. 5,472,865 59,271
FirstEnergy Corp. 1,843,591 56,451
SCANA Corp. 1,124,325 44,726
Avangrid Inc. 513,287 25,962
1,678,089
Total Common Stocks
(Cost $13,667,269) 17,131,472
Temporary Cash Investments (0.3%)1
Money Market Fund (0.2%)4,5 Vanguard Market Liquidity
Fund, 1.458% 448,958 44,900
84
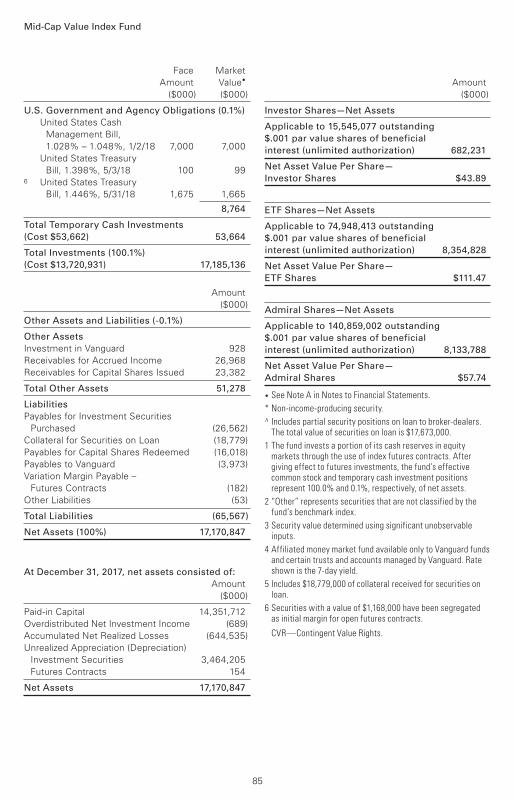
Mid-Cap Value Index Fund
Face Market
Amount Value•
($000) ($000)
Amount
($000)
U.S. Government and Agency Obligations (0.1%)
United States Cash
Management Bill,
1.028% – 1.048%, 1/2/18 7,000 7,000
United States Treasury
Bill, 1.398%, 5/3/18 100 996 United States Treasury
Bill, 1.446%, 5/31/18 1,675 1,665
8,764
Total Temporary Cash Investments
(Cost $53,662) 53,664
Total Investments (100.1%)
(Cost $13,720,931) 17,185,136
Amount
($000)
Other Assets and Liabilities (-0.1%)
Other Assets
Investment in Vanguard 928
Receivables for Accrued Income 26,968
Receivables for Capital Shares Issued 23,382
Total Other Assets 51,278
Liabilities
Payables for Investment Securities
Purchased (26,562)
Collateral for Securities on Loan (18,779)
Payables for Capital Shares Redeemed (16,018)
Payables to Vanguard (3,973)
Variation Margin Payable –
Futures Contracts (182)
Other Liabilities (53)
Total Liabilities (65,567)
Net Assets (100%) 17,170,847
At December 31, 2017, net assets consisted of:
Amount
($000)
Paid-in Capital 14,351,712
Overdistributed Net Investment Income (689)
Accumulated Net Realized Losses (644,535)
Unrealized Appreciation (Depreciation)
Investment Securities 3,464,205
Futures Contracts 154
Net Assets 17,170,847
Investor Shares—Net Assets
Applicable to 15,545,077 outstanding
$.001 par value shares of beneficial
interest (unlimited authorization) 682,231
Net Asset Value Per Share—
Investor Shares $43.89
ETF Shares—Net Assets
Applicable to 74,948,413 outstanding
$.001 par value shares of beneficial
interest (unlimited authorization) 8,354,828
Net Asset Value Per Share—
ETF Shares $111.47
Admiral Shares—Net Assets
Applicable to 140,859,002 outstanding
$.001 par value shares of beneficial
interest (unlimited authorization) 8,133,788
Net Asset Value Per Share—
Admiral Shares $57.74
• See Note A in Notes to Financial Statements.
* Non-income-producing security.
^ Includes partial security positions on loan to broker-dealers. The total value of securities on loan is $17,673,000.
1 The fund invests a portion of its cash reserves in equity markets through the use of index futures contracts. After giving effect to futures investments, the fund’s effective common stock and temporary cash investment positions represent 100.0% and 0.1%, respectively, of net assets.
2 “Other” represents securities that are not classified by the fund’s benchmark index.
3 Security value determined using significant unobservable inputs.
4 Affiliated money market fund available only to Vanguard funds and certain trusts and accounts managed by Vanguard. Rate shown is the 7-day yield.
5 Includes $18,779,000 of collateral received for securities on loan.
6 Securities with a value of $1,168,000 have been segregated as initial margin for open futures contracts.
CVR—Contingent Value Rights.
85
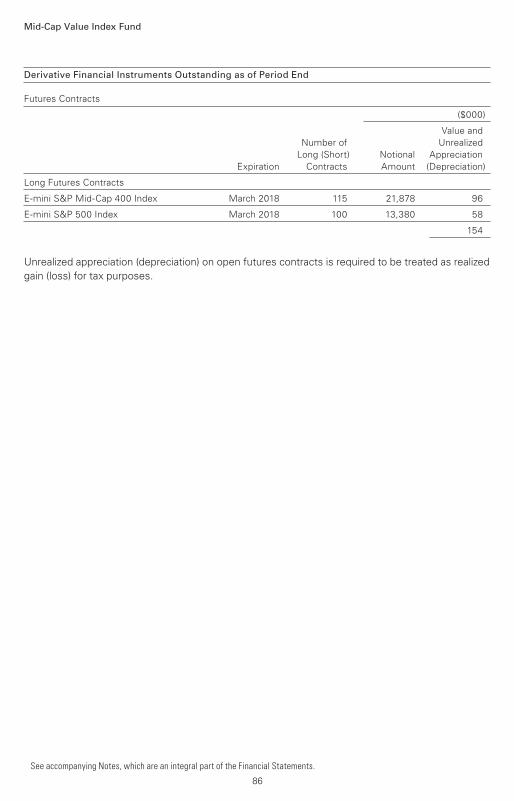
Mid-Cap Value Index Fund
See accompanying Notes, which are an integral part of the Financial Statements.
Derivative Financial Instruments Outstanding as of Period End
Futures Contracts
($000)
Value and
Number of Unrealized
Long (Short) Notional Appreciation
Expiration Contracts Amount (Depreciation)
Long Futures Contracts
E-mini S&P Mid-Cap 400 Index March 2018 115 21,878 96
E-mini S&P 500 Index March 2018 100 13,380 58
154
Unrealized appreciation (depreciation) on open futures contracts is required to be treated as realized
gain (loss) for tax purposes.
86
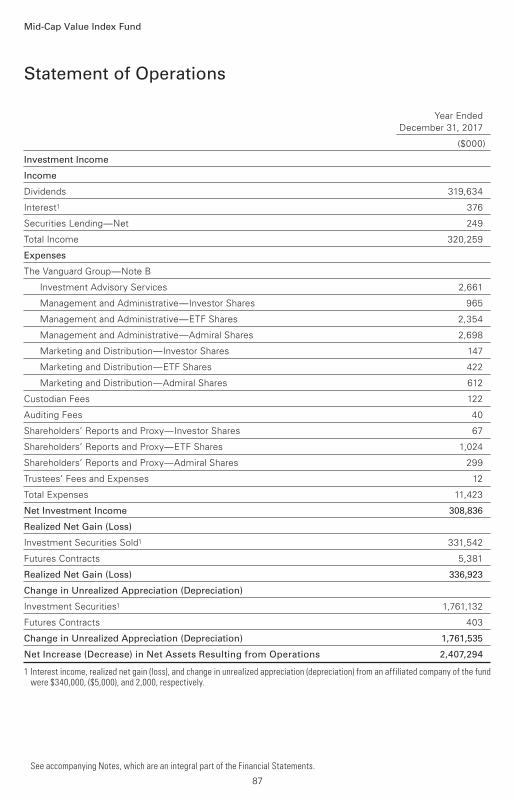
Year Ended
December 31, 2017
($000)
Investment Income
Income
Dividends 319,634
Interest1 376
Securities Lending—Net 249
Total Income 320,259
Expenses
The Vanguard Group—Note B
Investment Advisory Services 2,661
Management and Administrative—Investor Shares 965
Management and Administrative—ETF Shares 2,354
Management and Administrative—Admiral Shares 2,698
Marketing and Distribution—Investor Shares 147
Marketing and Distribution—ETF Shares 422
Marketing and Distribution—Admiral Shares 612
Custodian Fees 122
Auditing Fees 40
Shareholders’ Reports and Proxy—Investor Shares 67
Shareholders’ Reports and Proxy—ETF Shares 1,024
Shareholders’ Reports and Proxy—Admiral Shares 299
Trustees’ Fees and Expenses 12
Total Expenses 11,423
Net Investment Income 308,836
Realized Net Gain (Loss)
Investment Securities Sold1 331,542
Futures Contracts 5,381
Realized Net Gain (Loss) 336,923
Change in Unrealized Appreciation (Depreciation)
Investment Securities1 1,761,132
Futures Contracts 403
Change in Unrealized Appreciation (Depreciation) 1,761,535
Net Increase (Decrease) in Net Assets Resulting from Operations 2,407,294
1 Interest income, realized net gain (loss), and change in unrealized appreciation (depreciation) from an affiliated company of the fund were $340,000, ($5,000), and 2,000, respectively.
Statement of Operations
Mid-Cap Value Index Fund
See accompanying Notes, which are an integral part of the Financial Statements.
87
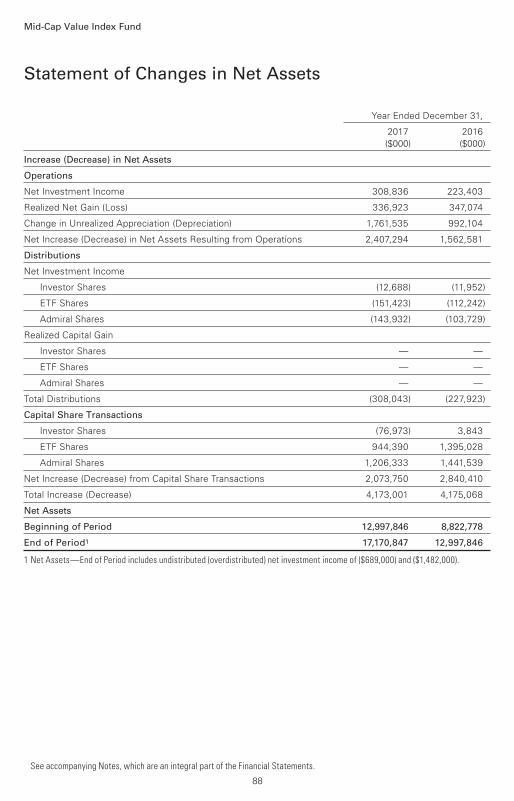
Statement of Changes in Net Assets
Mid-Cap Value Index Fund
See accompanying Notes, which are an integral part of the Financial Statements.
Year Ended December 31,
2017 2016
($000) ($000)
Increase (Decrease) in Net Assets
Operations
Net Investment Income 308,836 223,403
Realized Net Gain (Loss) 336,923 347,074
Change in Unrealized Appreciation (Depreciation) 1,761,535 992,104
Net Increase (Decrease) in Net Assets Resulting from Operations 2,407,294 1,562,581
Distributions
Net Investment Income
Investor Shares (12,688) (11,952)
ETF Shares (151,423) (112,242)
Admiral Shares (143,932) (103,729)
Realized Capital Gain
Investor Shares — —
ETF Shares — —
Admiral Shares — —
Total Distributions (308,043) (227,923)
Capital Share Transactions
Investor Shares (76,973) 3,843
ETF Shares 944,390 1,395,028
Admiral Shares 1,206,333 1,441,539
Net Increase (Decrease) from Capital Share Transactions 2,073,750 2,840,410
Total Increase (Decrease) 4,173,001 4,175,068
Net Assets
Beginning of Period 12,997,846 8,822,778
End of Period1 17,170,847 12,997,846
1 Net Assets—End of Period includes undistributed (overdistributed) net investment income of ($689,000) and ($1,482,000).
88
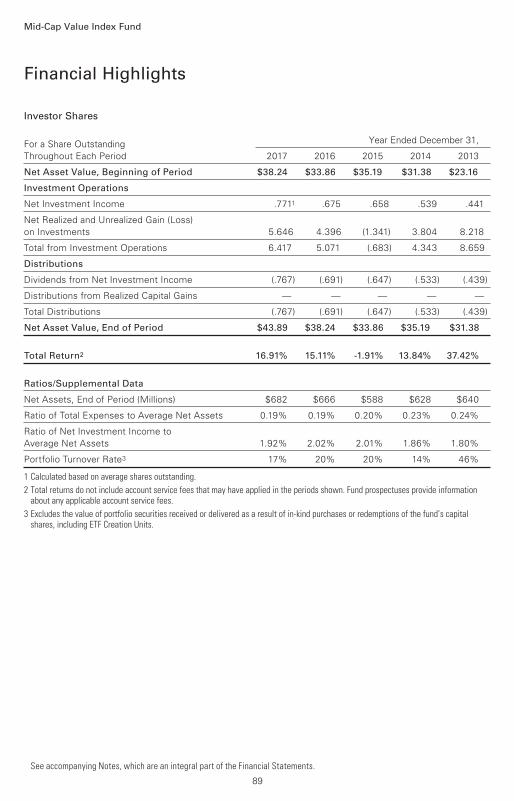
Investor Shares
For a Share Outstanding Year Ended December 31,
Throughout Each Period 2017 2016 2015 2014 2013
Net Asset Value, Beginning of Period $38.24 $33.86 $35.19 $31.38 $23.16
Investment Operations
Net Investment Income .7711 .675 .658 .539 .441
Net Realized and Unrealized Gain (Loss)
on Investments 5.646 4.396 (1.341) 3.804 8.218
Total from Investment Operations 6.417 5.071 (.683) 4.343 8.659
Distributions
Dividends from Net Investment Income (.767) (.691) (.647) (.533) (.439)
Distributions from Realized Capital Gains — — — — —
Total Distributions (.767) (.691) (.647) (.533) (.439)
Net Asset Value, End of Period $43.89 $38.24 $33.86 $35.19 $31.38
Total Return2 16.91% 15.11% -1.91% 13.84% 37.42%
Ratios/Supplemental Data
Net Assets, End of Period (Millions) $682 $666 $588 $628 $640
Ratio of Total Expenses to Average Net Assets 0.19% 0.19% 0.20% 0.23% 0.24%
Ratio of Net Investment Income to
Average Net Assets 1.92% 2.02% 2.01% 1.86% 1.80%
Portfolio Turnover Rate3 17% 20% 20% 14% 46%
1 Calculated based on average shares outstanding.
2 Total returns do not include account service fees that may have applied in the periods shown. Fund prospectuses provide information about any applicable account service fees.
3 Excludes the value of portfolio securities received or delivered as a result of in-kind purchases or redemptions of the fund’s capital shares, including ETF Creation Units.
Financial Highlights
See accompanying Notes, which are an integral part of the Financial Statements.
Mid-Cap Value Index Fund
89

ETF Shares
For a Share Outstanding Year Ended December 31,
Throughout Each Period 2017 2016 2015 2014 2013
Net Asset Value, Beginning of Period $97.12 $85.99 $89.39 $79.73 $58.82
Investment Operations
Net Investment Income 2.1161 1.822 1.785 1.504 1.232
Net Realized and Unrealized Gain (Loss)
on Investments 14.306 11.170 (3.427) 9.647 20.901
Total from Investment Operations 16.422 12.992 (1.642) 11.151 22.133
Distributions
Dividends from Net Investment Income (2.072) (1.862) (1.758) (1.491) (1.223)
Distributions from Realized Capital Gains — — — — —
Total Distributions (2.072) (1.862) (1.758) (1.491) (1.223)
Net Asset Value, End of Period $111.47 $97.12 $85.99 $89.39 $79.73
Total Return 17.05% 15.26% -1.80% 13.98% 37.65%
Ratios/Supplemental Data
Net Assets, End of Period (Millions) $8,355 $6,383 $4,351 $3,407 $2,256
Ratio of Total Expenses to Average Net Assets 0.07% 0.07% 0.08% 0.09% 0.09%
Ratio of Net Investment Income to
Average Net Assets 2.04% 2.14% 2.13% 2.00% 1.95%
Portfolio Turnover Rate2 17% 20% 20% 14% 46%
1 Calculated based on average shares outstanding.
2 Excludes the value of portfolio securities received or delivered as a result of in-kind purchases or redemptions of the fund’s capital shares, including ETF Creation Units.
Financial Highlights
See accompanying Notes, which are an integral part of the Financial Statements.
Mid-Cap Value Index Fund
90

Admiral Shares
For a Share Outstanding Year Ended December 31,
Throughout Each Period 2017 2016 2015 2014 2013
Net Asset Value, Beginning of Period $50.31 $44.54 $46.30 $41.30 $30.47
Investment Operations
Net Investment Income 1.0961 .942 .924 .780 .638
Net Realized and Unrealized Gain (Loss)
on Investments 7.407 5.791 (1.775) 4.994 10.826
Total from Investment Operations 8.503 6.733 (.851) 5.774 11.464
Distributions
Dividends from Net Investment Income (1.073) (.963) (.909) (.774) (.634)
Distributions from Realized Capital Gains — — — — —
Total Distributions (1.073) (.963) (.909) (.774) (.634)
Net Asset Value, End of Period $57.74 $50.31 $44.54 $46.30 $41.30
Total Return2 17.04% 15.26% -1.80% 13.98% 37.66%
Ratios/Supplemental Data
Net Assets, End of Period (Millions) $8,134 $5,949 $3,884 $2,896 $1,753
Ratio of Total Expenses to Average Net Assets 0.07% 0.07% 0.08% 0.09% 0.09%
Ratio of Net Investment Income to
Average Net Assets 2.04% 2.14% 2.13% 2.00% 1.95%
Portfolio Turnover Rate3 17% 20% 20% 14% 46%
1 Calculated based on average shares outstanding.
2 Total returns do not include account service fees that may have applied in the periods shown. Fund prospectuses provide information about any applicable account service fees.
3 Excludes the value of portfolio securities received or delivered as a result of in-kind purchases or redemptions of the fund’s capital shares, including ETF Creation Units.
Financial Highlights
See accompanying Notes, which are an integral part of the Financial Statements.
Mid-Cap Value Index Fund
91
Notes to Financial Statements
Mid-Cap Value Index Fund
Vanguard Mid-Cap Value Index Fund is registered under the Investment Company Act of 1940 as
an open-end investment company, or mutual fund. The fund offers three classes of shares: Investor
Shares, ETF Shares, and Admiral Shares. Investor Shares are available to any investor who meets
the fund’s minimum purchase requirements. ETF Shares are listed for trading on NYSE Arca; they
can be purchased and sold through a broker. Admiral Shares are designed for investors who meet
certain administrative, service, and account-size criteria.
A. The following significant accounting policies conform to generally accepted accounting
principles for U.S. investment companies. The fund consistently follows such policies in preparing
its financial statements.
1. Security Valuation: Securities are valued as of the close of trading on the New York Stock
Exchange (generally 4 p.m., Eastern time) on the valuation date. Equity securities are valued at
the latest quoted sales prices or official closing prices taken from the primary market in which
each security trades; such securities not traded on the valuation date are valued at the mean of
the latest quoted bid and asked prices. Securities for which market quotations are not readily
available, or whose values have been materially affected by events occurring before the fund’s
pricing time but after the close of the securities’ primary markets, are valued by methods deemed
by the board of trustees to represent fair value. Investments in Vanguard Market Liquidity Fund are
valued at that fund’s net asset value. Temporary cash investments are valued using the latest bid
prices or using valuations based on a matrix system (which considers such factors as security
prices, yields, maturities, and ratings), both as furnished by independent pricing services.
2. Futures Contracts: The fund uses index futures contracts to a limited extent, with the objectives
of maintaining full exposure to the stock market, maintaining liquidity, and minimizing
transaction costs. The fund may purchase futures contracts to immediately invest incoming
cash in the market, or sell futures in response to cash outflows, thereby simulating a fully invested
position in the underlying index while maintaining a cash balance for liquidity. The primary risks
associated with the use of futures contracts are imperfect correlation between changes in market
values of stocks held by the fund and the prices of futures contracts, and the possibility of an illiquid
market. Counterparty risk involving futures is mitigated because a regulated clearinghouse is
the counterparty instead of the clearing broker. To further mitigate counterparty risk, the fund
trades futures contracts on an exchange, monitors the financial strength of its clearing brokers
and clearinghouse, and has entered into clearing agreements with its clearing brokers. The
clearinghouse imposes initial margin requirements to secure the fund’s performance and requires
daily settlement of variation margin representing changes in the market value of each contract.
Futures contracts are valued at their quoted daily settlement prices. The notional amounts of
the contracts are not recorded in the Statement of Net Assets. Fluctuations in the value of the
contracts are recorded in the Statement of Net Assets as an asset (liability) and in the Statement
of Operations as unrealized appreciation (depreciation) until the contracts are closed, when they
are recorded as realized futures gains (losses).
During the year ended December 31, 2017, the fund’s average investments in long and short
futures contracts represented less than 1% and 0% of net assets, respectively, based on the
average of the notional amounts at each quarter-end during the period.
92
Mid-Cap Value Index Fund
3. Federal Income Taxes: The fund intends to continue to qualify as a regulated investment company
and distribute all of its taxable income. Management has analyzed the fund’s tax positions taken for
all open federal income tax years (December 31, 2014–2017), and has concluded that no provision
for federal income tax is required in the fund’s financial statements.
4. Distributions: Distributions to shareholders are recorded on the ex-dividend date.
5. Securities Lending: To earn additional income, the fund lends its securities to qualified
institutional borrowers. Security loans are subject to termination by the fund at any time, and
are required to be secured at all times by collateral in an amount at least equal to the market
value of securities loaned. Daily market fluctuations could cause the value of loaned securities
to be more or less than the value of the collateral received. When this occurs, the collateral is
adjusted and settled on the next business day. The fund further mitigates its counterparty risk
by entering into securities lending transactions only with a diverse group of prequalified
counterparties, monitoring their financial strength, and entering into master securities lending
agreements with its counterparties. The master securities lending agreements provide that,
in the event of a counterparty’s default (including bankruptcy), the fund may terminate any loans
with that borrower, determine the net amount owed, and sell or retain the collateral up to the
net amount owed to the fund; however, such actions may be subject to legal proceedings.
While collateral mitigates counterparty risk, in the event of a default, the fund may experience
delays and costs in recovering the securities loaned. The fund invests cash collateral received
in Vanguard Market Liquidity Fund, and records a liability in the Statement of Net Assets for the
return of the collateral, during the period the securities are on loan. Securities lending income
represents fees charged to borrowers plus income earned on invested cash collateral, less
expenses associated with the loan. During the term of the loan, the fund is entitled to all
distributions made on or in respect of the loaned securities.
6. Credit Facility: The fund and certain other funds managed by The Vanguard Group (“Vanguard”)
participate in a $3.1 billion committed credit facility provided by a syndicate of lenders pursuant to
a credit agreement that may be renewed annually; each fund is individually liable for its borrowings,
if any, under the credit facility. Borrowings may be utilized for temporary and emergency purposes,
and are subject to the fund’s regulatory and contractual borrowing restrictions. The participating
funds are charged administrative fees and an annual commitment fee of 0.10% of the undrawn
amount of the facility; these fees are allocated to the funds based on a method approved by the
fund’s board of trustees and included in Management and Administrative expenses on the fund’s
Statement of Operations. Any borrowings under this facility bear interest at a rate based upon the
higher of the one-month London Interbank Offered Rate, federal funds effective rate, or overnight
bank funding rate plus an agreed-upon spread.
The fund had no borrowings outstanding at December 31, 2017, or at any time during the period
then ended.
7. Other: Dividend income is recorded on the ex-dividend date. Interest income includes income
distributions received from Vanguard Market Liquidity Fund and is accrued daily. Premiums and
discounts on debt securities purchased are amortized and accreted, respectively, to interest income
over the lives of the respective securities. Security transactions are accounted for on the date
securities are bought or sold. Costs used to determine realized gains (losses) on the sale of
investment securities are those of the specific securities sold.
93
Mid-Cap Value Index Fund
Each class of shares has equal rights as to assets and earnings, except that each class separately
bears certain class-specific expenses related to maintenance of shareholder accounts (included
in Management and Administrative expenses), shareholder reporting, and the proxy. Marketing
and distribution expenses are allocated to each class of shares based on a method approved by
the board of trustees. Income, other non-class-specific expenses, and gains and losses on
investments are allocated to each class of shares based on its relative net assets.
B. In accordance with the terms of a Funds’ Service Agreement (the “FSA”) between Vanguard
and the fund, Vanguard furnishes to the fund investment advisory, corporate management,
administrative, marketing, and distribution services at Vanguard’s cost of operations (as defined
by the FSA). These costs of operations are allocated to the fund based on methods and guidelines
approved by the board of trustees. Vanguard does not require reimbursement in the current period
for certain costs of operations (such as deferred compensation/benefits and risk/insurance costs);
the fund’s liability for these costs of operations is included in Payables to Vanguard on the
Statement of Net Assets.
Upon the request of Vanguard, the fund may invest up to 0.40% of its net assets as capital in
Vanguard. At December 31, 2017, the fund had contributed to Vanguard capital in the amount
of $928,000, representing 0.01% of the fund’s net assets and 0.37% of Vanguard’s capitalization.
The fund’s trustees and officers are also directors and employees, respectively, of Vanguard.
C. Various inputs may be used to determine the value of the fund’s investments. These inputs are
summarized in three broad levels for financial statement purposes. The inputs or methodologies
used to value securities are not necessarily an indication of the risk associated with investing in
those securities.
Level 1—Quoted prices in active markets for identical securities.
Level 2—Other significant observable inputs (including quoted prices for similar securities, interest
rates, prepayment speeds, credit risk, etc.).
Level 3—Significant unobservable inputs (including the fund’s own assumptions used to determine
the fair value of investments). Any investments valued with significant unobservable inputs are
noted on the Statement of Net Assets.
The following table summarizes the market value of the fund’s investments as of December 31,
2017, based on the inputs used to value them:
Level 1 Level 2 Level 3
Investments ($000) ($000) ($000)
Common Stocks 17,131,472 — —
Temporary Cash Investments 44,900 8,764 —
Futures Contracts—Liabilities1 (182) — —
Total 17,176,190 8,764 —
1 Represents variation margin on the last day of the reporting period.
94
95
Mid-Cap Value Index Fund
D. Distributions are determined on a tax basis and may differ from net investment income and
realized capital gains for financial reporting purposes. Differences may be permanent or temporary.
Permanent differences are reclassified among capital accounts in the financial statements to reflect
their tax character. Temporary differences arise when certain items of income, expense, gain, or
loss are recognized in different periods for financial statement and tax purposes. These differences
will reverse at some time in the future. Differences in classification may also result from the
treatment of short-term gains as ordinary income for tax purposes.
During the year ended December 31, 2017, the fund realized $484,277,000 of net capital gains
resulting from in-kind redemptions—in which shareholders exchanged fund shares for securities
held by the fund rather than for cash. Because such gains are not taxable to the fund, and are not
distributed to shareholders, they have been reclassified from accumulated net realized losses to
paid-in capital.
For tax purposes, at December 31, 2017, the fund had $2,737,000 of ordinary income available
for distribution. At December 31, 2017, the fund had available capital losses totaling $634,867,000
to offset future net capital gains. Of this amount, $4,037,000 is subject to expiration on December
31, 2018. Capital losses of $630,830,000 realized beginning in fiscal 2011 may be carried forward
indefinitely under the Regulated Investment Company Modernization Act of 2010, but must be
used before any expiring loss carryforwards.
At December 31, 2017, the cost of investment securities for tax purposes was $13,730,445,000.
Net unrealized appreciation of investment securities for tax purposes was $3,454,691,000,
consisting of unrealized gains of $3,826,780,000 on securities that had risen in value since
their purchase and $372,089,000 in unrealized losses on securities that had fallen in value
since their purchase.
E. During the year ended December 31, 2017, the fund purchased $5,989,913,000 of investment
securities and sold $3,914,903,000 of investment securities, other than temporary cash
investments. Purchases and sales include $2,079,235,000 and $1,290,889,000, respectively,
in connection with in-kind purchases and redemptions of the fund’s capital shares.
The fund purchased securities from and sold securities to other Vanguard funds or accounts
managed by Vanguard or its affiliates, in accordance with procedures adopted by the board
of trustees in compliance with Rule 17a-7 of the Investment Company Act of 1940. For the year
ended December 31, 2017, such purchases and sales were $613,856,000 and $963,311,000,
respectively; these amounts are included in the purchases and sales of investment securities
noted above.
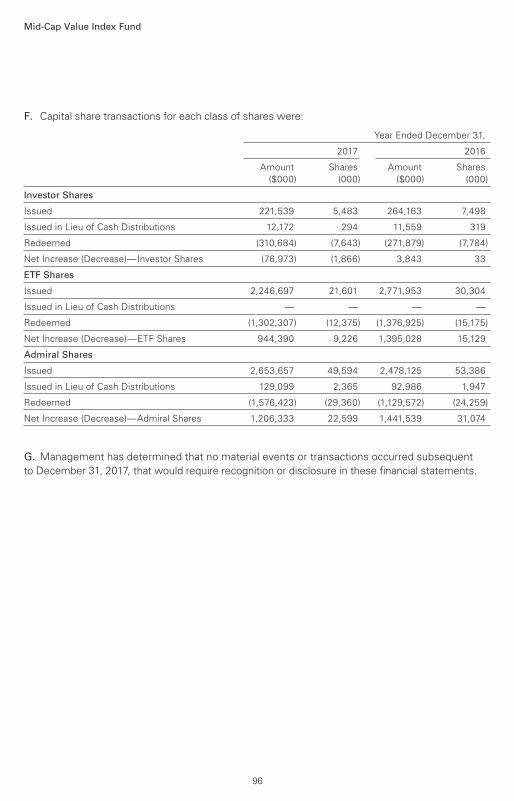
Mid-Cap Value Index Fund
F. Capital share transactions for each class of shares were:
Year Ended December 31,
2017 2016
Amount Shares Amount Shares
($000) (000) ($000) (000)
Investor Shares
Issued 221,539 5,483 264,163 7,498
Issued in Lieu of Cash Distributions 12,172 294 11,559 319
Redeemed (310,684) (7,643) (271,879) (7,784)
Net Increase (Decrease)—Investor Shares (76,973) (1,866) 3,843 33
ETF Shares
Issued 2,246,697 21,601 2,771,953 30,304
Issued in Lieu of Cash Distributions — — — —
Redeemed (1,302,307) (12,375) (1,376,925) (15,175)
Net Increase (Decrease)—ETF Shares 944,390 9,226 1,395,028 15,129
Admiral Shares
Issued 2,653,657 49,594 2,478,125 53,386
Issued in Lieu of Cash Distributions 129,099 2,365 92,986 1,947
Redeemed (1,576,423) (29,360) (1,129,572) (24,259)
Net Increase (Decrease)—Admiral Shares 1,206,333 22,599 1,441,539 31,074
G. Management has determined that no material events or transactions occurred subsequent
to December 31, 2017, that would require recognition or disclosure in these financial statements.
96
To the Board of Trustees of Vanguard Index Funds and Shareholders of Vanguard Extended Market
Index Fund, Vanguard Mid-Cap Index Fund, Vanguard Mid-Cap Growth Index Fund and Vanguard
Mid-Cap Value Index Fund
Opinions on the Financial Statements
We have audited the accompanying statement of net assets—investments summary of Vanguard
Extended Market Index Fund and the statements of net assets of Vanguard Mid-Cap Index Fund,
Vanguard Mid-Cap Growth Index Fund and Vanguard Mid-Cap Value Index Fund (four of the funds
constituting Vanguard Index Funds, hereafter collectively referred to as the “Funds”) as of
December 31, 2017, the related statements of operations for the year ended December 31, 2017,
the statements of changes in net assets for each of the two years in the period ended December
31, 2017, including the related notes, and the financial highlights for each of the periods indicated
therein (collectively referred to as the “financial statements”). In our opinion, the financial
statements present fairly, in all material respects, the financial position of each of the Funds as
of December 31, 2017, the results of each of their operations for the year then ended, the changes
in each of their net assets for each of the two years in the period ended December 31, 2017 and
each of the financial highlights for each of the periods indicated therein in conformity with
accounting principles generally accepted in the United States of America.
Basis for Opinions
These financial statements are the responsibility of the Funds’ management. Our responsibility
is to express an opinion on the Funds’ financial statements based on our audits. We are a public
accounting firm registered with the Public Company Accounting Oversight Board (United States)
(“PCAOB”) and are required to be independent with respect to the Funds in accordance with the
U.S. federal securities laws and the applicable rules and regulations of the Securities and Exchange
Commission and the PCAOB.
We conducted our audits of these financial statements in accordance with the standards of
the PCAOB. Those standards require that we plan and perform the audit to obtain reasonable
assurance about whether the financial statements are free of material misstatement, whether
due to error or fraud.
Our audits included performing procedures to assess the risks of material misstatement of the
financial statements, whether due to error or fraud, and performing procedures that respond to
those risks. Such procedures included examining, on a test basis, evidence regarding the amounts
and disclosures in the financial statements. Our audits also included evaluating the accounting
principles used and significant estimates made by management, as well as evaluating the overall
presentation of the financial statements. Our procedures included confirmation of securities
owned as of December 31, 2017 by correspondence with the custodians and brokers and by
agreement to the underlying ownership records of the transfer agent; when replies were not
received from brokers, we performed other auditing procedures. We believe that our audits
provide a reasonable basis for our opinions.
/s/PricewaterhouseCoopers LLP
Philadelphia, Pennsylvania
February 14, 2018
We have served as the auditor of one or more investment companies in The Vanguard Group
of Funds since 1975.
Report of Independent Registered Public Accounting Firm
97
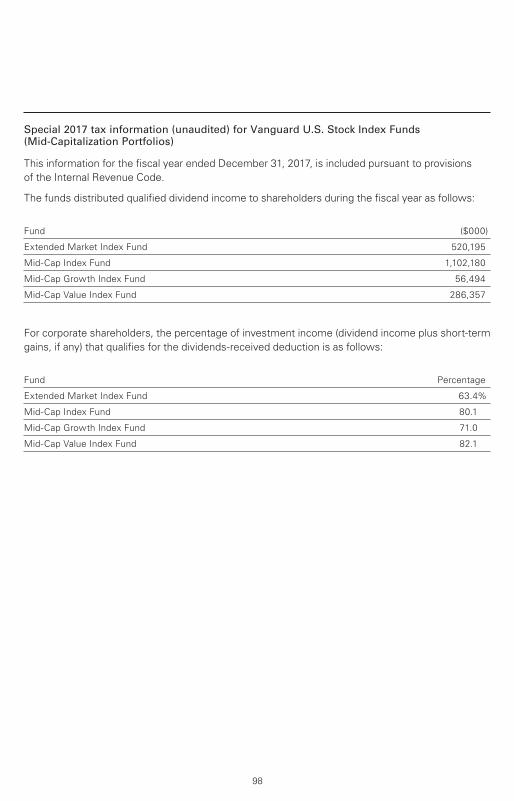
Special 2017 tax information (unaudited) for Vanguard U.S. Stock Index Funds (Mid-Capitalization Portfolios)
This information for the fiscal year ended December 31, 2017, is included pursuant to provisions
of the Internal Revenue Code.
The funds distributed qualified dividend income to shareholders during the fiscal year as follows:
Fund ($000)
Extended Market Index Fund 520,195
Mid-Cap Index Fund 1,102,180
Mid-Cap Growth Index Fund 56,494
Mid-Cap Value Index Fund 286,357
For corporate shareholders, the percentage of investment income (dividend income plus short-term
gains, if any) that qualifies for the dividends-received deduction is as follows:
Fund Percentage
Extended Market Index Fund 63.4%
Mid-Cap Index Fund 80.1
Mid-Cap Growth Index Fund 71.0
Mid-Cap Value Index Fund 82.1
98
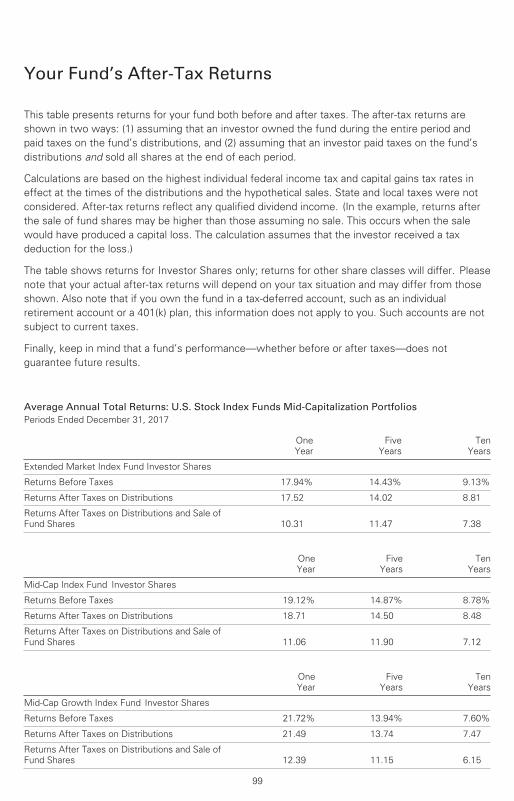
Your Fund’s After-Tax Returns
99
This table presents returns for your fund both before and after taxes. The after-tax returns are
shown in two ways: (1) assuming that an investor owned the fund during the entire period and
paid taxes on the fund’s distributions, and (2) assuming that an investor paid taxes on the fund’s
distributions and sold all shares at the end of each period.
Calculations are based on the highest individual federal income tax and capital gains tax rates in
effect at the times of the distributions and the hypothetical sales. State and local taxes were not
considered. After-tax returns reflect any qualified dividend income. (In the example, returns after
the sale of fund shares may be higher than those assuming no sale. This occurs when the sale
would have produced a capital loss. The calculation assumes that the investor received a tax
deduction for the loss.)
The table shows returns for Investor Shares only; returns for other share classes will differ. Please
note that your actual after-tax returns will depend on your tax situation and may differ from those
shown. Also note that if you own the fund in a tax-deferred account, such as an individual
retirement account or a 401(k) plan, this information does not apply to you. Such accounts are not
subject to current taxes.
Finally, keep in mind that a fund’s performance—whether before or after taxes—does not
guarantee future results.
Average Annual Total Returns: U.S. Stock Index Funds Mid-Capitalization Portfolios Periods Ended December 31, 2017
One
Year
Five
Years
Ten
Years
Extended Market Index Fund Investor Shares
Returns Before Taxes 17.94% 14.43% 9.13%
Returns After Taxes on Distributions 17.52 14.02 8.81
Returns After Taxes on Distributions and Sale of
Fund Shares 10.31 11.47 7.38
One
Year
Five
Years
Ten
Years
Mid-Cap Index Fund Investor Shares
Returns Before Taxes 19.12% 14.87% 8.78%
Returns After Taxes on Distributions 18.71 14.50 8.48
Returns After Taxes on Distributions and Sale of
Fund Shares 11.06 11.90 7.12
One
Year
Five
Years
Ten
Years
Mid-Cap Growth Index Fund Investor Shares
Returns Before Taxes 21.72% 13.94% 7.60%
Returns After Taxes on Distributions 21.49 13.74 7.47
Returns After Taxes on Distributions and Sale of
Fund Shares 12.39 11.15 6.15
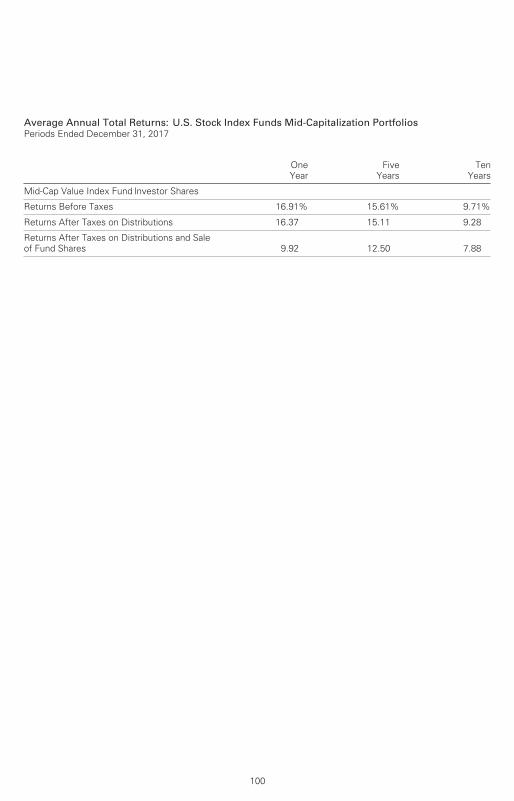
Average Annual Total Returns: U.S. Stock Index Funds Mid-Capitalization Portfolios Periods Ended December 31, 2017
100
One
Year
Five
Years
Ten
Years
Mid-Cap Value Index Fund Investor Shares
Returns Before Taxes 16.91% 15.61% 9.71%
Returns After Taxes on Distributions 16.37 15.11 9.28
Returns After Taxes on Distributions and Sale
of Fund Shares 9.92 12.50 7.88
About Your Fund’s Expenses
101
As a shareholder of the fund, you incur ongoing costs, which include costs for portfolio management,
administrative services, and shareholder reports (like this one), among others. Operating expenses,
which are deducted from a fund’s gross income, directly reduce the investment return of the fund.
A fund’s expenses are expressed as a percentage of its average net assets. This figure is known as
the expense ratio. The following examples are intended to help you understand the ongoing costs (in
dollars) of investing in your fund and to compare these costs with those of other mutual funds. The
examples are based on an investment of $1,000 made at the beginning of the period shown and held
for the entire period.
The accompanying table illustrates your fund’s costs in two ways:
• Based on actual fund return. This section helps you to estimate the actual expenses that you
paid over the period. The ”Ending Account Value“ shown is derived from the fund‘s actual return,
and the third column shows the dollar amount that would have been paid by an investor who started
with $1,000 in the fund. You may use the information here, together with the amount you invested,
to estimate the expenses that you paid over the period.
To do so, simply divide your account value by $1,000 (for example, an $8,600 account value divided
by $1,000 = 8.6), then multiply the result by the number given for your fund under the heading
”Expenses Paid During Period.“
• Based on hypothetical 5% yearly return. This section is intended to help you compare your
fund‘s costs with those of other mutual funds. It assumes that the fund had a yearly return of 5%
before expenses, but that the expense ratio is unchanged. In this case—because the return used is
not the fund’s actual return—the results do not apply to your investment. The example is useful in
making comparisons because the Securities and Exchange Commission requires all mutual funds to
calculate expenses based on a 5% return. You can assess your fund’s costs by comparing this
hypothetical example with the hypothetical examples that appear in shareholder reports of other
funds.
Note that the expenses shown in the table are meant to highlight and help you compare ongoingcosts only and do not reflect transaction costs incurred by the fund for buying and sellingsecurities. Further, the expenses do not include any purchase, redemption, or account servicefees described in the fund prospectus. If such fees were applied to your account, your costswould be higher. Your fund does not carry a “sales load.”
The calculations assume no shares were bought or sold during the period. Your actual costs may
have been higher or lower, depending on the amount of your investment and the timing of any
purchases or redemptions.
You can find more information about the fund’s expenses, including annual expense ratios, in the
Financial Statements section of this report. For additional information on operating expenses and
other shareholder costs, please refer to your fund’s current prospectus.
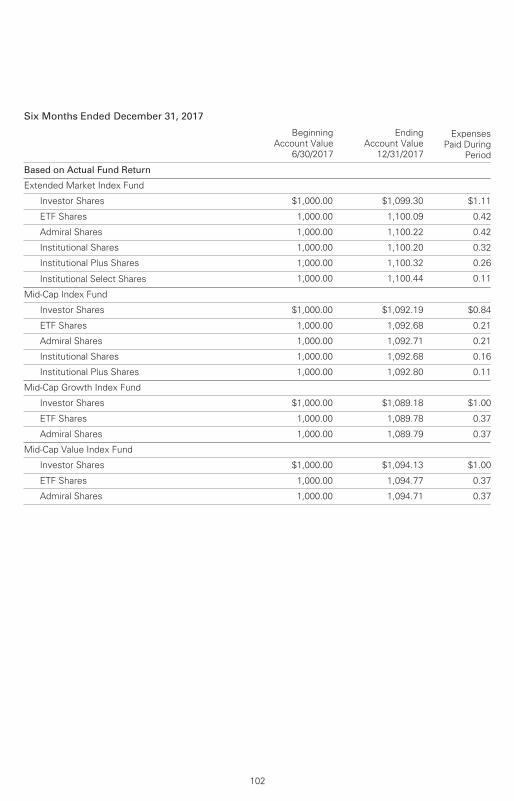
102
Six Months Ended December 31, 2017
Beginning
Account Value
6/30/2017
Ending
Account Value
12/31/2017
Expenses
Paid During
Period
Based on Actual Fund Return
Extended Market Index Fund
Investor Shares $1,000.00 $1,099.30 $1.11
ETF Shares 1,000.00 1,100.09 0.42
Admiral Shares 1,000.00 1,100.22 0.42
Institutional Shares 1,000.00 1,100.20 0.32
Institutional Plus Shares 1,000.00 1,100.32 0.26
Institutional Select Shares 1,000.00 1,100.44 0.11
Mid-Cap Index Fund
Investor Shares $1,000.00 $1,092.19 $0.84
ETF Shares 1,000.00 1,092.68 0.21
Admiral Shares 1,000.00 1,092.71 0.21
Institutional Shares 1,000.00 1,092.68 0.16
Institutional Plus Shares 1,000.00 1,092.80 0.11
Mid-Cap Growth Index Fund
Investor Shares $1,000.00 $1,089.18 $1.00
ETF Shares 1,000.00 1,089.78 0.37
Admiral Shares 1,000.00 1,089.79 0.37
Mid-Cap Value Index Fund
Investor Shares $1,000.00 $1,094.13 $1.00
ETF Shares 1,000.00 1,094.77 0.37
Admiral Shares 1,000.00 1,094.71 0.37
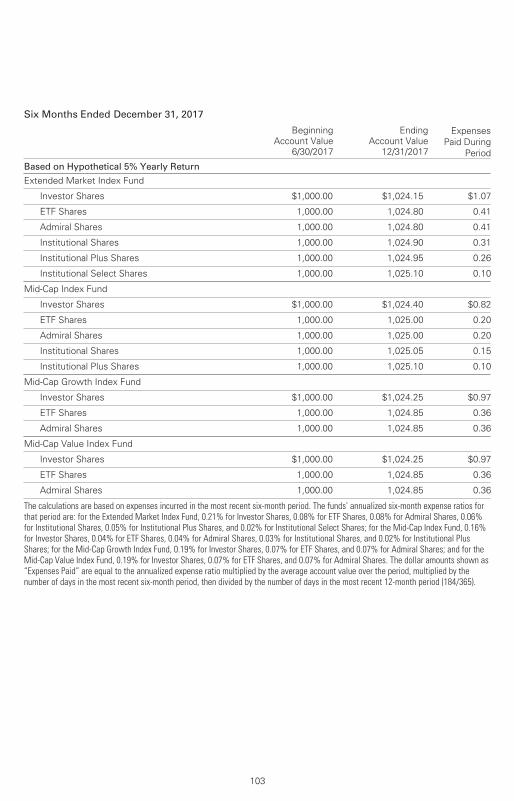
103
Six Months Ended December 31, 2017
Beginning
Account Value
6/30/2017
Ending
Account Value
12/31/2017
Expenses
Paid During
Period
Based on Hypothetical 5% Yearly Return
Extended Market Index Fund
Investor Shares $1,000.00 $1,024.15 $1.07
ETF Shares 1,000.00 1,024.80 0.41
Admiral Shares 1,000.00 1,024.80 0.41
Institutional Shares 1,000.00 1,024.90 0.31
Institutional Plus Shares 1,000.00 1,024.95 0.26
Institutional Select Shares 1,000.00 1,025.10 0.10
Mid-Cap Index Fund
Investor Shares $1,000.00 $1,024.40 $0.82
ETF Shares 1,000.00 1,025.00 0.20
Admiral Shares 1,000.00 1,025.00 0.20
Institutional Shares 1,000.00 1,025.05 0.15
Institutional Plus Shares 1,000.00 1,025.10 0.10
Mid-Cap Growth Index Fund
Investor Shares $1,000.00 $1,024.25 $0.97
ETF Shares 1,000.00 1,024.85 0.36
Admiral Shares 1,000.00 1,024.85 0.36
Mid-Cap Value Index Fund
Investor Shares $1,000.00 $1,024.25 $0.97
ETF Shares 1,000.00 1,024.85 0.36
Admiral Shares 1,000.00 1,024.85 0.36
The calculations are based on expenses incurred in the most recent six-month period. The funds’ annualized six-month expense ratios forthat period are: for the Extended Market Index Fund, 0.21% for Investor Shares, 0.08% for ETF Shares, 0.08% for Admiral Shares, 0.06%for Institutional Shares, 0.05% for Institutional Plus Shares, and 0.02% for Institutional Select Shares; for the Mid-Cap Index Fund, 0.16%for Investor Shares, 0.04% for ETF Shares, 0.04% for Admiral Shares, 0.03% for Institutional Shares, and 0.02% for Institutional PlusShares; for the Mid-Cap Growth Index Fund, 0.19% for Investor Shares, 0.07% for ETF Shares, and 0.07% for Admiral Shares; and for theMid-Cap Value Index Fund, 0.19% for Investor Shares, 0.07% for ETF Shares, and 0.07% for Admiral Shares. The dollar amounts shown as“Expenses Paid” are equal to the annualized expense ratio multiplied by the average account value over the period, multiplied by thenumber of days in the most recent six-month period, then divided by the number of days in the most recent 12-month period (184/365).
Glossary
104
30-Day SEC Yield. A fund’s 30-day SEC yield is derived using a formula specified by the U.S.
Securities and Exchange Commission. Under the formula, data related to the fund’s security
holdings in the previous 30 days are used to calculate the fund’s hypothetical net income for that
period, which is then annualized and divided by the fund’s estimated average net assets over the
calculation period. For the purposes of this calculation, a security’s income is based on its current
market yield to maturity (for bonds), its actual income (for asset-backed securities), or its
projected dividend yield (for stocks). Because the SEC yield represents hypothetical annualized
income, it will differ—at times significantly—from the fund’s actual experience. As a result, the
fund’s income distributions may be higher or lower than implied by the SEC yield.
Beta. A measure of the magnitude of a fund’s past share-price fluctuations in relation to the ups
and downs of a given market index. The index is assigned a beta of 1.00. Compared with a given
index, a fund with a beta of 1.20 typically would have seen its share price rise or fall by 12%
when the index rose or fell by 10%. For this report, beta is based on returns over the past 36
months for both the fund and the index. Note that a fund’s beta should be reviewed in conjunction
with its R-squared (see definition). The lower the R-squared, the less correlation there is between
the fund and the index, and the less reliable beta is as an indicator of volatility.
Dividend Yield. Dividend income earned by stocks, expressed as a percentage of the aggregate
market value (or of net asset value, for a fund). The yield is determined by dividing the amount of
the annual dividends by the aggregate value (or net asset value) at the end of the period. For a
fund, the dividend yield is based solely on stock holdings and does not include any income
produced by other investments.
Earnings Growth Rate. The average annual rate of growth in earnings over the past five years for
the stocks now in a fund.
Equity Exposure. A measure that reflects a fund’s investments in stocks and stock futures. Any
holdings in short-term reserves are excluded.
Expense Ratio. A fund’s total annual operating expenses expressed as a percentage of the fund’s
average net assets. The expense ratio includes management and administrative expenses, but
does not include the transaction costs of buying and selling portfolio securities.
Foreign Holdings. The percentage of a fund represented by securities or depositary receipts of
companies based outside the United States.
Inception Date. The date on which the assets of a fund (or one of its share classes) are first
invested in accordance with the fund’s investment objective. For funds with a subscription period,
the inception date is the day after that period ends. Investment performance is measured from
the inception date.
Median Market Cap. An indicator of the size of companies in which a fund invests; the midpoint
of market capitalization (market price x shares outstanding) of a fund’s stocks, weighted by the
proportion of the fund’s assets invested in each stock. Stocks representing half of the fund’s
assets have market capitalizations above the median, and the rest are below it.
Price/Book Ratio. The share price of a stock divided by its net worth, or book value, per share.
For a fund, the weighted average price/book ratio of the stocks it holds.
105
Price/Earnings Ratio. The ratio of a stock’s current price to its per-share earnings over the past
year. For a fund, the weighted average P/E of the stocks it holds. P/E is an indicator of market
expectations about corporate prospects; the higher the P/E, the greater the expectations for a
company’s future growth.
R-Squared. A measure of how much of a fund’s past returns can be explained by the returns
from the market in general, as measured by a given index. If a fund’s total returns were precisely
synchronized with an index’s returns, its R-squared would be 1.00. If the fund’s returns bore no
relationship to the index’s returns, its R-squared would be 0. For this report, R-squared is based
on returns over the past 36 months for both the fund and the index.
Return on Equity. The annual average rate of return generated by a company during the past five
years for each dollar of shareholder’s equity (net income divided by shareholder’s equity). For a
fund, the weighted average return on equity for the companies whose stocks it holds.
Short-Term Reserves. The percentage of a fund invested in highly liquid, short-term securities
that can be readily converted to cash.
Turnover Rate. An indication of the fund’s trading activity. Funds with high turnover rates incur
higher transaction costs and may be more likely to distribute capital gains (which may be taxable
to investors). The turnover rate excludes in-kind transactions, which have minimal impact on
costs.
Benchmark Information
Spliced Mid-Cap Growth Index: MSCI US Mid Cap Growth Index through April 16, 2013; CRSP
US Mid Cap Growth Index thereafter.
Spliced Mid-Cap Index: S&P MidCap 400 Index through May 16, 2003; MSCI US Mid Cap 450
Index through January 30, 2013; CRSP US Mid Cap Index thereafter.
Spliced Mid-Cap Value Index: MSCI US Mid Cap Value Index through April 16, 2013; CRSP US
Mid Cap Value Index thereafter.
The People Who Govern Your Fund
The trustees of your mutual fund are there to see that the fund is operated and managed in your
best interests since, as a shareholder, you are a part owner of the fund. Your fund’s trustees also
serve on the board of directors of The Vanguard Group, Inc., which is owned by the Vanguard
funds and provides services to them on an at-cost basis.
A majority of Vanguard’s board members are independent, meaning that they have no affiliation
with Vanguard or the funds they oversee, apart from the sizable personal investments they have
made as private individuals. The independent board members have distinguished backgrounds
in business, academia, and public service. Each of the trustees and executive officers oversees
201 Vanguard funds.
Information for each trustee and executive officer of the fund appears below. The mailing address
of the trustees and officers is P.O. Box 876, Valley Forge, PA 19482. More information about the
trustees is in the Statement of Additional Information, which can be obtained, without charge,
by contacting Vanguard at 800-662-7447, or online at vanguard.com.
Interested Trustee1
F. William McNabb III
Born 1957. Trustee Since July 2009. Chairman
of the Board. Principal Occupation(s) During the
Past Five Years and Other Experience: Chairman
of the Board of The Vanguard Group, Inc., and
of each of the investment companies served by
The Vanguard Group, since January 2010; Chief
Executive Officer and Director of The Vanguard
Group and President and Chief Executive Officer
of each of the investment companies served by
The Vanguard Group, since 2008; Director of
Vanguard Marketing Corporation; President of
The Vanguard Group (2008–2017); Managing
Director of The Vanguard Group (1995–2008).
Independent Trustees
Emerson U. Fullwood
Born 1948. Trustee Since January 2008. Principal
Occupation(s) During the Past Five Years and Other
Experience: Executive Chief Staff and Marketing
Officer for North America and Corporate Vice
President (retired 2008) of Xerox Corporation
(document manage ment products and services);
Executive in Residence and 2009–2010
Distinguished Minett Professor at the Rochester
Institute of Technology; Lead Director of SPX
FLOW, Inc. (multi-industry manufacturing);
Director of the United Way of Rochester, the
University of Rochester Medical Center, Monroe
Community College Foundation, North Carolina
A&T University, and Roberts Wesleyan College;
Trustee of the University of Rochester.
Rajiv L. Gupta
Born 1945. Trustee Since December 2001.2
Principal Occupation(s) During the Past Five
Years and Other Experience: Chairman and
Chief Executive Officer (retired 2009) and
President (2006–2008) of Rohm and Haas Co.
(chemicals); Director of Arconic Inc. (diversified
manufacturer), HP Inc. (printer and personal
computer manufacturing), and Delphi Automotive
plc (automotive components); Senior Advisor at
New Mountain Capital.
Amy Gutmann
Born 1949. Trustee Since June 2006. Principal
Occupation(s) During the Past Five Years and
Other Experience: President of the University
of Pennsylvania; Christopher H. Browne
1 Mr. McNabb is considered an “interested person,” as defined in the Investment Company Act of 1940, because he is an officer of the Vanguard funds.
2 December 2002 for Vanguard Equity Income Fund, the Vanguard Municipal Bond Funds, and the Vanguard State Tax-Exempt Funds.
Distinguished Professor of Political Science,
School of Arts and Sciences, and Professor
of Communication, Annenberg School for
Communication, with secondary faculty appoint-
ments in the Department of Philosophy, School
of Arts and Sciences, and at the Graduate School
of Education, University of Pennsylvania; Trustee
of the National Constitution Center.
JoAnn Heffernan Heisen
Born 1950. Trustee Since July 1998. Principal
Occupation(s) During the Past Five Years and
Other Experience: Corporate Vice President
and Member of the Executive Committee
(1997–2008), Chief Global Diversity Officer
(retired 2008), Vice President and Chief
Information Officer (1997–2006), Controller
(1995–1997), Treasurer (1991–1995), and
Assistant Treasurer (1989–1991) of Johnson
& Johnson (pharmaceuticals/medical devices/
consumer products); Director of Skytop Lodge
Corporation (hotels) and the Robert Wood
Johnson Foundation; Member of the Advisory
Board of the Institute for Women’s Leadership
at Rutgers University.
F. Joseph Loughrey
Born 1949. Trustee Since October 2009.
Principal Occupation(s) During the Past Five
Years and Other Experience: President and Chief
Operating Officer (retired 2009) of Cummins Inc.
(industrial machinery); Chairman of the Board of
Hillenbrand, Inc. (specialized consumer services),
Oxfam America, and the Lumina Foundation for
Education; Director of the V Foundation for
Cancer Research; Member of the Advisory
Council for the College of Arts and Letters
and Chair of the Advisory Board to the Kellogg
Institute for International Studies, both at the
University of Notre Dame.
Mark Loughridge
Born 1953. Trustee Since March 2012. Principal
Occupation(s) During the Past Five Years and
Other Experience: Senior Vice President and
Chief Financial Officer (retired 2013) at IBM
(information technology services); Fiduciary
Member of IBM’s Retirement Plan Committee
(2004–2013); Member of the Council on
Chicago Booth.
Scott C. Malpass
Born 1962. Trustee Since March 2012. Principal
Occupation(s) During the Past Five Years and
Other Experience: Chief Investment Officer and
Vice President at the University of Notre Dame;
Assistant Professor of Finance at the Mendoza
College of Business at Notre Dame; Member of
the Notre Dame 403(b) Investment Committee,
the Board of Advisors for Spruceview Capital
Partners, the Board of Catholic Investment
Services, Inc. (investment advisor), and the
Board of Superintendence of the Institute for
the Works of Religion; Chairman of the Board of
TIFF Advisory Services, Inc. (investment advisor).
André F. Perold
Born 1952. Trustee Since December 2004.
Principal Occupation(s) During the Past Five Years
and Other Experience: George Gund Professor of
Finance and Banking, Emeritus at the Harvard
Business School (retired 2011); Chief Investment
Officer and Co-Managing Partner of HighVista
Strategies LLC (private investment firm);
Overseer of the Museum of Fine Arts Boston.
Peter F. Volanakis
Born 1955. Trustee Since July 2009. Principal
Occupation(s) During the Past Five Years and
Other Experience: President and Chief Operating
Officer (retired 2010) of Corning Incorporated
(communications equipment); Chairman of the
Board of Trustees of Colby-Sawyer College;
Member of the Board of Hypertherm, Inc.
(industrial cutting systems, software, and
consumables).
Executive Officers
Glenn Booraem
Born 1967. Investment Stewardship Officer Since
February 2017. Principal Occupation(s) During the
Past Five Years and Other Experience: Principal of
The Vanguard Group, Inc.; Treasurer (2015–2017),
Controller (2010–2015), and Assistant Controller
(2001–2010) of each of the investment companies
served by The Vanguard Group.
Christine M. Buchanan
Born 1970. Treasurer Since November 2017.
Principal Occupation(s) During the Past Five Years
and Other Experience: Principal of The Vanguard
Group, Inc.; Treasurer of each of the investment
companies served by The Vanguard Group;
Global Head of Vanguard Fund Administration
at The Vanguard Group; Partner at KPMG LLP
(2005–2017).
Thomas J. Higgins
Born 1957. Chief Financial Officer Since
September 2008. Principal Occupation(s) During
the Past Five Years and Other Experience: Principal
of The Vanguard Group, Inc.; Chief Financial Officer
of each of the investment companies served by
The Vanguard Group; Treasurer of each of the
investment companies served by The Vanguard
Group (1998–2008).
Peter Mahoney
Born 1974. Controller Since May 2015. Principal
Occupation(s) During the Past Five Years and
Other Experience: Principal of The Vanguard
Group, Inc.; Controller of each of the investment
companies served by The Vanguard Group; Head
of International Fund Services at The Vanguard
Group (2008–2014).
Anne E. Robinson
Born 1970. Secretary Since September 2016.
Principal Occupation(s) During the Past Five Years
and Other Experience: Managing Director of The
Vanguard Group, Inc.; General Counsel of The
Vanguard Group; Secretary of The Vanguard Group
and of each of the investment companies served
by The Vanguard Group; Director and Senior Vice
President of Vanguard Marketing Corporation;
Managing Director and General Counsel of Global
Cards and Consumer Services at Citigroup
(2014–2016); Counsel at American Express
(2003–2014).
Michael Rollings
Born 1963. Finance Director Since November 2017.
Principal Occupation(s) During the Past Five Years
and Other Experience: Managing Director of
The Vanguard Group, Inc.; Director of Vanguard
Marketing Corporation; Treasurer of each of the
investment companies served by The Vanguard
Group (February 2017–November 2017); Executive
Vice President and Chief Financial Officer of
MassMutual Financial Group (2006–2016).
Vanguard Senior Management Team
Mortimer J. Buckley Chris D. McIsaac
Gregory Davis James M. Norris
John James Thomas M. Rampulla
Martha G. King Karin A. Risi
John T. Marcante
Chairman Emeritus and Senior Advisor
John J. Brennan
Chairman, 1996–2009
Chief Executive Officer and President, 1996–2008
Founder
John C. Bogle
Chairman and Chief Executive Officer, 1974–1996
P.O. Box 2600
Valley Forge, PA 19482-2600
Connect with Vanguard® > vanguard.com
Fund Information > 800-662-7447
Direct Investor Account Services > 800-662-2739
Institutional Investor Services > 800-523-1036
Text Telephone for PeopleWho Are Deaf or Hard of Hearing > 800-749-7273
This material may be used in conjunctionwith the offering of shares of any Vanguardfund only if preceded or accompanied bythe fund’s current prospectus.
All comparative mutual fund data are from Lipper, aThomson Reuters Company, or Morningstar, Inc., unlessotherwise noted.
You can obtain a free copy of Vanguard’s proxy votingguidelines by visiting vanguard.com/proxyreporting or bycalling Vanguard at 800-662-2739. The guidelines arealso available from the SEC’s website, sec.gov. Inaddition, you may obtain a free report on how your fundvoted the proxies for securities it owned during the 12months ended June 30. To get the report, visit eithervanguard.com/proxyreporting or sec.gov.
You can review and copy information about your fund atthe SEC’s Public Reference Room in Washington, D.C. Tofind out more about this public service, call the SEC at202-551-8090. Information about your fund is alsoavailable on the SEC’s website, and you can receivecopies of this information, for a fee, by sending arequest in either of two ways: via email addressed [email protected] or via regular mail addressed to thePublic Reference Section, Securities and ExchangeCommission, Washington, DC 20549-1520.
The index is a product of S&P Dow Jones Indices LLC(“SPDJI”), and has been licensed for use by Vanguard. Standard & Poor’s® and S&P® are registeredtrademarks of Standard & Poor’s Financial Services LLC(“S&P”); Dow Jones® is a registered trademark of DowJones Trademark Holdings LLC (“Dow Jones”); S&P®and S&P 500® are trademarks of S&P; and thesetrademarks have been licensed for use by SPDJI andsublicensed for certain purposes by Vanguard. Vanguard product(s) are not sponsored, endorsed, soldor promoted by SPDJI, Dow Jones, S&P, or theirrespective affiliates and none of such parties make anyrepresentation regarding the advisability of investing insuch product(s) nor do they have any liability for anyerrors, omissions, or interruptions of the index.
Source for Bloomberg Barclays indexes: BloombergIndex Services Limited. Copyright 2017, Bloomberg. Allrights reserved.
© 2018 The Vanguard Group, Inc.All rights reserved.Vanguard Marketing Corporation, Distributor.
Q980 022018
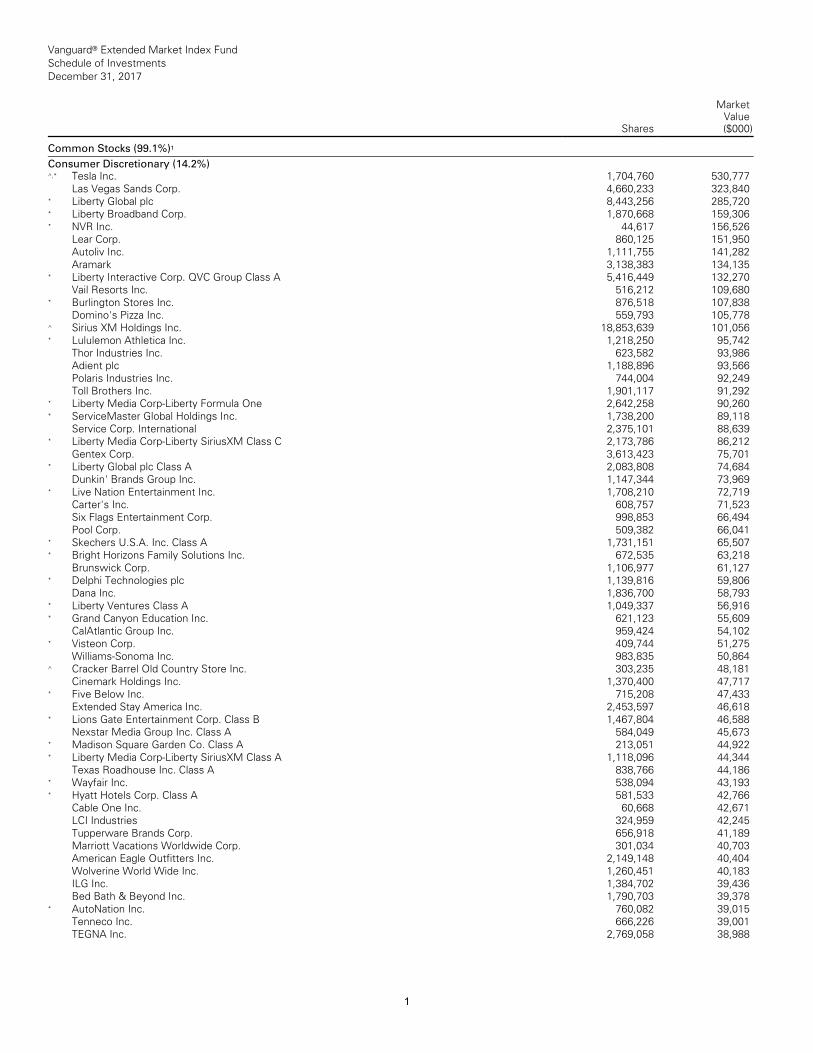
Vanguard® Extended Market Index Fund Schedule of Investments December 31, 2017
Shares
MarketValue($000)
__________________________________________________________________________________________________________________________________________________________________________________________________________________________________________________________________________________________________________________________________________________________________________________________________________________________________________________________________________________________________________________________________________________________________________________________________________________________________________________________________________________________ __________________________________________________________________________________________________________________________________________________________________________________________________________________________________________________________________________________________________________________________________________________________________________________________________________________________________________________________________________________________________________________________________________________________________________________________________________________________________________________________________________________________
Common Stocks (99.1%)1 __________________________________________________________________________________________________________________________________________________________________________________________________________________________________________________________________________________________________________________________________________________________________________________________________________________________________________________________________________________________________________________________________________________________________________________________________________________________________________________________________________________________ __________________________________________________________________________________________________________________________________________________________________________________________________________________________________________________________________________________________________________________________________________________________________________________________________________________________________________________________________________________________________________________________________________________________________________________________________________________________________________________________________________________________
Consumer Discretionary (14.2%)^,* Tesla Inc. 1,704,760 530,777
Las Vegas Sands Corp. 4,660,233 323,840* Liberty Global plc 8,443,256 285,720* Liberty Broadband Corp. 1,870,668 159,306 * NVR Inc. 44,617 156,526
Lear Corp. 860,125 151,950Autoliv Inc. 1,111,755 141,282Aramark 3,138,383 134,135
* Liberty Interactive Corp. QVC Group Class A 5,416,449 132,270 Vail Resorts Inc. 516,212 109,680
* Burlington Stores Inc. 876,518 107,838Domino's Pizza Inc. 559,793 105,778
^ Sirius XM Holdings Inc. 18,853,639 101,056* Lululemon Athletica Inc. 1,218,250 95,742
Thor Industries Inc. 623,582 93,986Adient plc 1,188,896 93,566Polaris Industries Inc. 744,004 92,249Toll Brothers Inc. 1,901,117 91,292
* Liberty Media Corp-Liberty Formula One 2,642,258 90,260 * ServiceMaster Global Holdings Inc. 1,738,200 89,118
Service Corp. International 2,375,101 88,639 * Liberty Media Corp-Liberty SiriusXM Class C 2,173,786 86,212
Gentex Corp. 3,613,423 75,701* Liberty Global plc Class A 2,083,808 74,684
Dunkin' Brands Group Inc. 1,147,344 73,969 * Live Nation Entertainment Inc. 1,708,210 72,719
Carter's Inc. 608,757 71,523Six Flags Entertainment Corp. 998,853 66,494 Pool Corp. 509,382 66,041
* Skechers U.S.A. Inc. Class A 1,731,151 65,507 * Bright Horizons Family Solutions Inc. 672,535 63,218
Brunswick Corp. 1,106,977 61,127* Delphi Technologies plc 1,139,816 59,806
Dana Inc. 1,836,700 58,793* Liberty Ventures Class A 1,049,337 56,916 * Grand Canyon Education Inc. 621,123 55,609
CalAtlantic Group Inc. 959,424 54,102* Visteon Corp. 409,744 51,275
Williams-Sonoma Inc. 983,835 50,864^ Cracker Barrel Old Country Store Inc. 303,235 48,181
Cinemark Holdings Inc. 1,370,400 47,717* Five Below Inc. 715,208 47,433
Extended Stay America Inc. 2,453,597 46,618 * Lions Gate Entertainment Corp. Class B 1,467,804 46,588
Nexstar Media Group Inc. Class A 584,049 45,673 * Madison Square Garden Co. Class A 213,051 44,922 * Liberty Media Corp-Liberty SiriusXM Class A 1,118,096 44,344
Texas Roadhouse Inc. Class A 838,766 44,186 * Wayfair Inc. 538,094 43,193* Hyatt Hotels Corp. Class A 581,533 42,766
Cable One Inc. 60,668 42,671LCI Industries 324,959 42,245Tupperware Brands Corp. 656,918 41,189 Marriott Vacations Worldwide Corp. 301,034 40,703 American Eagle Outfitters Inc. 2,149,148 40,404 Wolverine World Wide Inc. 1,260,451 40,183 ILG Inc. 1,384,702 39,436Bed Bath & Beyond Inc. 1,790,703 39,378
* AutoNation Inc. 760,082 39,015Tenneco Inc. 666,226 39,001TEGNA Inc. 2,769,058 38,988
1
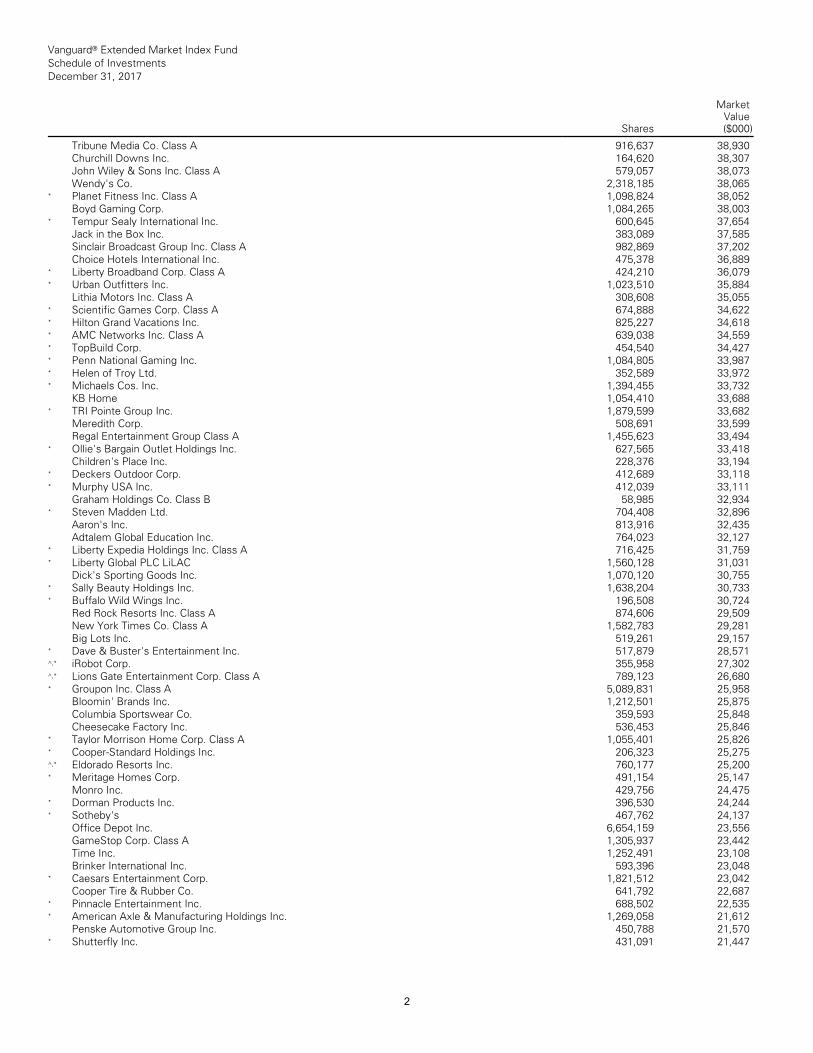
Vanguard® Extended Market Index Fund Schedule of Investments December 31, 2017
Shares
MarketValue($000)
__________________________________________________________________________________________________________________________________________________________________________________________________________________________________________________________________________________________________________________________________________________________________________________________________________________________________________________________________________________________________________________________________________________________________________________________________________________________________________________________________________________________ __________________________________________________________________________________________________________________________________________________________________________________________________________________________________________________________________________________________________________________________________________________________________________________________________________________________________________________________________________________________________________________________________________________________________________________________________________________________________________________________________________________________
Tribune Media Co. Class A 916,637 38,930 Churchill Downs Inc. 164,620 38,307John Wiley & Sons Inc. Class A 579,057 38,073 Wendy's Co. 2,318,185 38,065
* Planet Fitness Inc. Class A 1,098,824 38,052 Boyd Gaming Corp. 1,084,265 38,003
* Tempur Sealy International Inc. 600,645 37,654 Jack in the Box Inc. 383,089 37,585Sinclair Broadcast Group Inc. Class A 982,869 37,202 Choice Hotels International Inc. 475,378 36,889
* Liberty Broadband Corp. Class A 424,210 36,079 * Urban Outfitters Inc. 1,023,510 35,884
Lithia Motors Inc. Class A 308,608 35,055 * Scientific Games Corp. Class A 674,888 34,622 * Hilton Grand Vacations Inc. 825,227 34,618 * AMC Networks Inc. Class A 639,038 34,559 * TopBuild Corp. 454,540 34,427* Penn National Gaming Inc. 1,084,805 33,987 * Helen of Troy Ltd. 352,589 33,972* Michaels Cos. Inc. 1,394,455 33,732
KB Home 1,054,410 33,688* TRI Pointe Group Inc. 1,879,599 33,682
Meredith Corp. 508,691 33,599Regal Entertainment Group Class A 1,455,623 33,494
* Ollie's Bargain Outlet Holdings Inc. 627,565 33,418 Children's Place Inc. 228,376 33,194
* Deckers Outdoor Corp. 412,689 33,118* Murphy USA Inc. 412,039 33,111
Graham Holdings Co. Class B 58,985 32,934 * Steven Madden Ltd. 704,408 32,896
Aaron's Inc. 813,916 32,435Adtalem Global Education Inc. 764,023 32,127
* Liberty Expedia Holdings Inc. Class A 716,425 31,759 * Liberty Global PLC LiLAC 1,560,128 31,031
Dick's Sporting Goods Inc. 1,070,120 30,755 * Sally Beauty Holdings Inc. 1,638,204 30,733 * Buffalo Wild Wings Inc. 196,508 30,724
Red Rock Resorts Inc. Class A 874,606 29,509 New York Times Co. Class A 1,582,783 29,281 Big Lots Inc. 519,261 29,157
* Dave & Buster's Entertainment Inc. 517,879 28,571 ^,* iRobot Corp. 355,958 27,302^,* Lions Gate Entertainment Corp. Class A 789,123 26,680 * Groupon Inc. Class A 5,089,831 25,958
Bloomin' Brands Inc. 1,212,501 25,875Columbia Sportswear Co. 359,593 25,848 Cheesecake Factory Inc. 536,453 25,846
* Taylor Morrison Home Corp. Class A 1,055,401 25,826 * Cooper-Standard Holdings Inc. 206,323 25,275 ^,* Eldorado Resorts Inc. 760,177 25,200* Meritage Homes Corp. 491,154 25,147
Monro Inc. 429,756 24,475* Dorman Products Inc. 396,530 24,244* Sotheby's 467,762 24,137
Office Depot Inc. 6,654,159 23,556GameStop Corp. Class A 1,305,937 23,442 Time Inc. 1,252,491 23,108Brinker International Inc. 593,396 23,048
* Caesars Entertainment Corp. 1,821,512 23,042 Cooper Tire & Rubber Co. 641,792 22,687
* Pinnacle Entertainment Inc. 688,502 22,535 * American Axle & Manufacturing Holdings Inc. 1,269,058 21,612
Penske Automotive Group Inc. 450,788 21,570 * Shutterfly Inc. 431,091 21,447
2
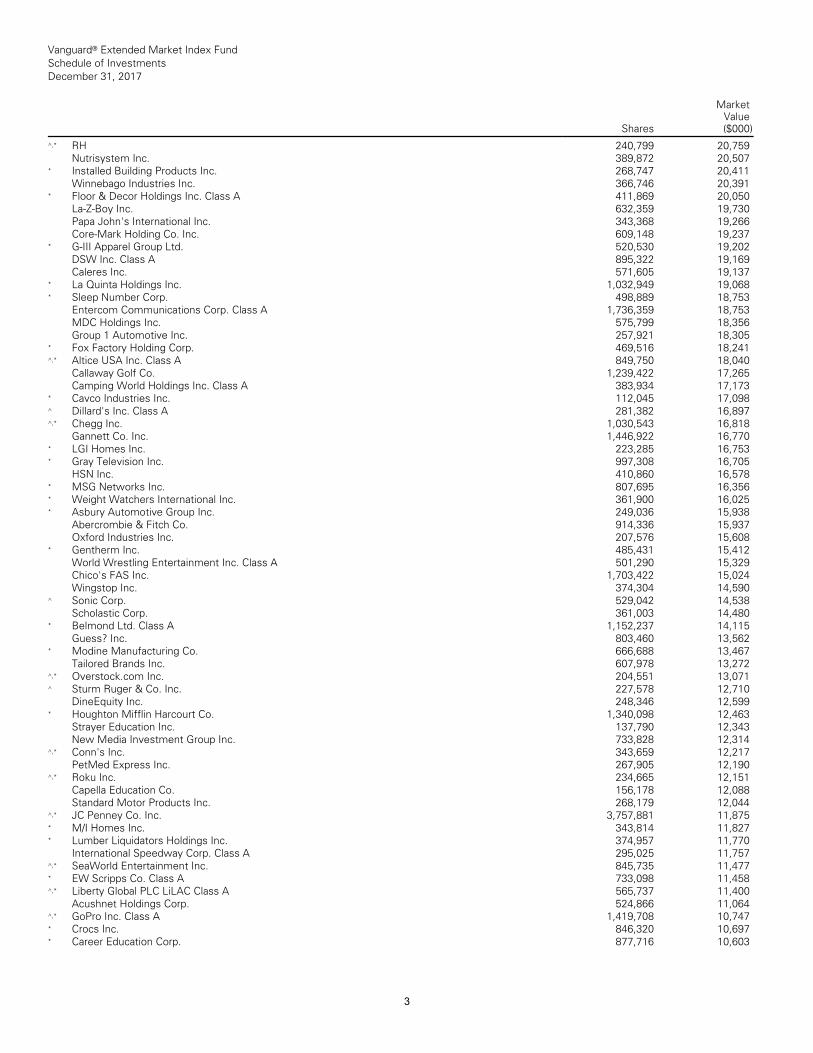
Vanguard® Extended Market Index Fund Schedule of Investments December 31, 2017
Shares
MarketValue($000)
__________________________________________________________________________________________________________________________________________________________________________________________________________________________________________________________________________________________________________________________________________________________________________________________________________________________________________________________________________________________________________________________________________________________________________________________________________________________________________________________________________________________ __________________________________________________________________________________________________________________________________________________________________________________________________________________________________________________________________________________________________________________________________________________________________________________________________________________________________________________________________________________________________________________________________________________________________________________________________________________________________________________________________________________________
^,* RH 240,799 20,759Nutrisystem Inc. 389,872 20,507
* Installed Building Products Inc. 268,747 20,411 Winnebago Industries Inc. 366,746 20,391
* Floor & Decor Holdings Inc. Class A 411,869 20,050 La-Z-Boy Inc. 632,359 19,730Papa John's International Inc. 343,368 19,266 Core-Mark Holding Co. Inc. 609,148 19,237
* G-III Apparel Group Ltd. 520,530 19,202DSW Inc. Class A 895,322 19,169Caleres Inc. 571,605 19,137
* La Quinta Holdings Inc. 1,032,949 19,068* Sleep Number Corp. 498,889 18,753
Entercom Communications Corp. Class A 1,736,359 18,753 MDC Holdings Inc. 575,799 18,356Group 1 Automotive Inc. 257,921 18,305
* Fox Factory Holding Corp. 469,516 18,241 ^,* Altice USA Inc. Class A 849,750 18,040
Callaway Golf Co. 1,239,422 17,265Camping World Holdings Inc. Class A 383,934 17,173
* Cavco Industries Inc. 112,045 17,098^ Dillard's Inc. Class A 281,382 16,897^,* Chegg Inc. 1,030,543 16,818
Gannett Co. Inc. 1,446,922 16,770* LGI Homes Inc. 223,285 16,753* Gray Television Inc. 997,308 16,705
HSN Inc. 410,860 16,578* MSG Networks Inc. 807,695 16,356* Weight Watchers International Inc. 361,900 16,025 * Asbury Automotive Group Inc. 249,036 15,938
Abercrombie & Fitch Co. 914,336 15,937 Oxford Industries Inc. 207,576 15,608
* Gentherm Inc. 485,431 15,412World Wrestling Entertainment Inc. Class A 501,290 15,329 Chico's FAS Inc. 1,703,422 15,024Wingstop Inc. 374,304 14,590
^ Sonic Corp. 529,042 14,538Scholastic Corp. 361,003 14,480
* Belmond Ltd. Class A 1,152,237 14,115Guess? Inc. 803,460 13,562
* Modine Manufacturing Co. 666,688 13,467 Tailored Brands Inc. 607,978 13,272
^,* Overstock.com Inc. 204,551 13,071^ Sturm Ruger & Co. Inc. 227,578 12,710
DineEquity Inc. 248,346 12,599* Houghton Mifflin Harcourt Co. 1,340,098 12,463
Strayer Education Inc. 137,790 12,343New Media Investment Group Inc. 733,828 12,314
^,* Conn's Inc. 343,659 12,217PetMed Express Inc. 267,905 12,190
^,* Roku Inc. 234,665 12,151Capella Education Co. 156,178 12,088Standard Motor Products Inc. 268,179 12,044
^,* JC Penney Co. Inc. 3,757,881 11,875* M/I Homes Inc. 343,814 11,827* Lumber Liquidators Holdings Inc. 374,957 11,770
International Speedway Corp. Class A 295,025 11,757 ^,* SeaWorld Entertainment Inc. 845,735 11,477 * EW Scripps Co. Class A 733,098 11,458 ^,* Liberty Global PLC LiLAC Class A 565,737 11,400
Acushnet Holdings Corp. 524,866 11,064 ^,* GoPro Inc. Class A 1,419,708 10,747* Crocs Inc. 846,320 10,697* Career Education Corp. 877,716 10,603
3
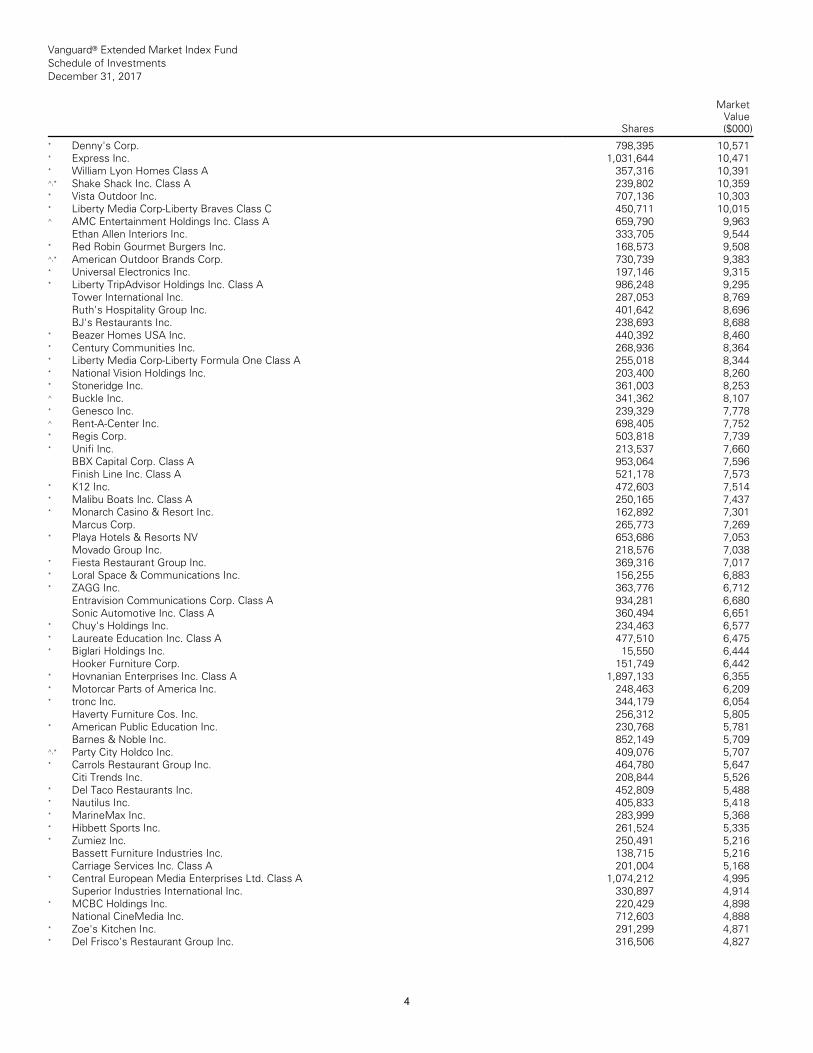
Vanguard® Extended Market Index Fund Schedule of Investments December 31, 2017
Shares
MarketValue($000)
__________________________________________________________________________________________________________________________________________________________________________________________________________________________________________________________________________________________________________________________________________________________________________________________________________________________________________________________________________________________________________________________________________________________________________________________________________________________________________________________________________________________ __________________________________________________________________________________________________________________________________________________________________________________________________________________________________________________________________________________________________________________________________________________________________________________________________________________________________________________________________________________________________________________________________________________________________________________________________________________________________________________________________________________________
* Denny's Corp. 798,395 10,571* Express Inc. 1,031,644 10,471* William Lyon Homes Class A 357,316 10,391 ^,* Shake Shack Inc. Class A 239,802 10,359 * Vista Outdoor Inc. 707,136 10,303* Liberty Media Corp-Liberty Braves Class C 450,711 10,015 ^ AMC Entertainment Holdings Inc. Class A 659,790 9,963
Ethan Allen Interiors Inc. 333,705 9,544 * Red Robin Gourmet Burgers Inc. 168,573 9,508 ^,* American Outdoor Brands Corp. 730,739 9,383 * Universal Electronics Inc. 197,146 9,315 * Liberty TripAdvisor Holdings Inc. Class A 986,248 9,295
Tower International Inc. 287,053 8,769Ruth's Hospitality Group Inc. 401,642 8,696 BJ's Restaurants Inc. 238,693 8,688
* Beazer Homes USA Inc. 440,392 8,460 * Century Communities Inc. 268,936 8,364 * Liberty Media Corp-Liberty Formula One Class A 255,018 8,344 * National Vision Holdings Inc. 203,400 8,260 * Stoneridge Inc. 361,003 8,253^ Buckle Inc. 341,362 8,107* Genesco Inc. 239,329 7,778^ Rent-A-Center Inc. 698,405 7,752* Regis Corp. 503,818 7,739* Unifi Inc. 213,537 7,660
BBX Capital Corp. Class A 953,064 7,596 Finish Line Inc. Class A 521,178 7,573
* K12 Inc. 472,603 7,514* Malibu Boats Inc. Class A 250,165 7,437 * Monarch Casino & Resort Inc. 162,892 7,301
Marcus Corp. 265,773 7,269* Playa Hotels & Resorts NV 653,686 7,053
Movado Group Inc. 218,576 7,038* Fiesta Restaurant Group Inc. 369,316 7,017 * Loral Space & Communications Inc. 156,255 6,883 * ZAGG Inc. 363,776 6,712
Entravision Communications Corp. Class A 934,281 6,680 Sonic Automotive Inc. Class A 360,494 6,651
* Chuy's Holdings Inc. 234,463 6,577* Laureate Education Inc. Class A 477,510 6,475 * Biglari Holdings Inc. 15,550 6,444
Hooker Furniture Corp. 151,749 6,442* Hovnanian Enterprises Inc. Class A 1,897,133 6,355 * Motorcar Parts of America Inc. 248,463 6,209 * tronc Inc. 344,179 6,054
Haverty Furniture Cos. Inc. 256,312 5,805 * American Public Education Inc. 230,768 5,781
Barnes & Noble Inc. 852,149 5,709^,* Party City Holdco Inc. 409,076 5,707* Carrols Restaurant Group Inc. 464,780 5,647
Citi Trends Inc. 208,844 5,526* Del Taco Restaurants Inc. 452,809 5,488 * Nautilus Inc. 405,833 5,418* MarineMax Inc. 283,999 5,368* Hibbett Sports Inc. 261,524 5,335* Zumiez Inc. 250,491 5,216
Bassett Furniture Industries Inc. 138,715 5,216 Carriage Services Inc. Class A 201,004 5,168
* Central European Media Enterprises Ltd. Class A 1,074,212 4,995 Superior Industries International Inc. 330,897 4,914
* MCBC Holdings Inc. 220,429 4,898National CineMedia Inc. 712,603 4,888
* Zoe's Kitchen Inc. 291,299 4,871* Del Frisco's Restaurant Group Inc. 316,506 4,827
4
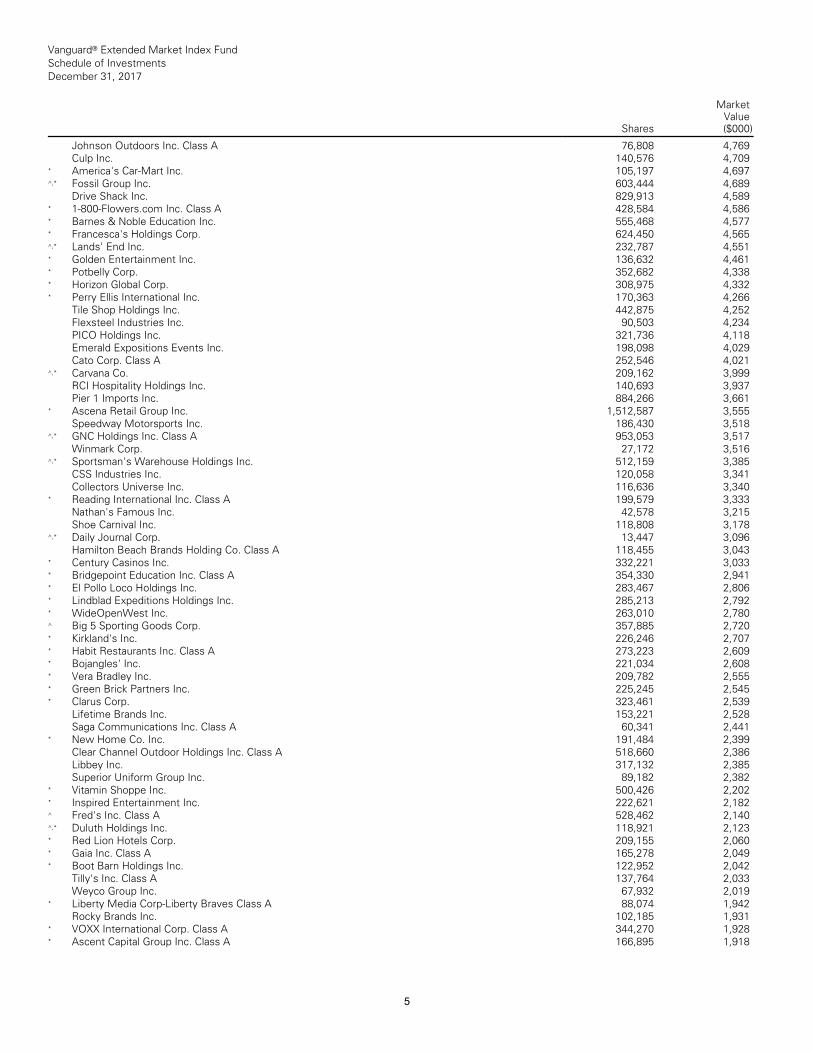
Vanguard® Extended Market Index Fund Schedule of Investments December 31, 2017
Shares
MarketValue($000)
__________________________________________________________________________________________________________________________________________________________________________________________________________________________________________________________________________________________________________________________________________________________________________________________________________________________________________________________________________________________________________________________________________________________________________________________________________________________________________________________________________________________ __________________________________________________________________________________________________________________________________________________________________________________________________________________________________________________________________________________________________________________________________________________________________________________________________________________________________________________________________________________________________________________________________________________________________________________________________________________________________________________________________________________________
Johnson Outdoors Inc. Class A 76,808 4,769 Culp Inc. 140,576 4,709
* America's Car-Mart Inc. 105,197 4,697^,* Fossil Group Inc. 603,444 4,689
Drive Shack Inc. 829,913 4,589* 1-800-Flowers.com Inc. Class A 428,584 4,586 * Barnes & Noble Education Inc. 555,468 4,577 * Francesca's Holdings Corp. 624,450 4,565 ^,* Lands' End Inc. 232,787 4,551* Golden Entertainment Inc. 136,632 4,461 * Potbelly Corp. 352,682 4,338* Horizon Global Corp. 308,975 4,332* Perry Ellis International Inc. 170,363 4,266
Tile Shop Holdings Inc. 442,875 4,252Flexsteel Industries Inc. 90,503 4,234 PICO Holdings Inc. 321,736 4,118Emerald Expositions Events Inc. 198,098 4,029 Cato Corp. Class A 252,546 4,021
^,* Carvana Co. 209,162 3,999RCI Hospitality Holdings Inc. 140,693 3,937 Pier 1 Imports Inc. 884,266 3,661
* Ascena Retail Group Inc. 1,512,587 3,555 Speedway Motorsports Inc. 186,430 3,518
^,* GNC Holdings Inc. Class A 953,053 3,517 Winmark Corp. 27,172 3,516
^,* Sportsman's Warehouse Holdings Inc. 512,159 3,385 CSS Industries Inc. 120,058 3,341Collectors Universe Inc. 116,636 3,340
* Reading International Inc. Class A 199,579 3,333 Nathan's Famous Inc. 42,578 3,215Shoe Carnival Inc. 118,808 3,178
^,* Daily Journal Corp. 13,447 3,096Hamilton Beach Brands Holding Co. Class A 118,455 3,043
* Century Casinos Inc. 332,221 3,033* Bridgepoint Education Inc. Class A 354,330 2,941 * El Pollo Loco Holdings Inc. 283,467 2,806 * Lindblad Expeditions Holdings Inc. 285,213 2,792 * WideOpenWest Inc. 263,010 2,780^ Big 5 Sporting Goods Corp. 357,885 2,720 * Kirkland's Inc. 226,246 2,707* Habit Restaurants Inc. Class A 273,223 2,609 * Bojangles' Inc. 221,034 2,608* Vera Bradley Inc. 209,782 2,555* Green Brick Partners Inc. 225,245 2,545 * Clarus Corp. 323,461 2,539
Lifetime Brands Inc. 153,221 2,528Saga Communications Inc. Class A 60,341 2,441
* New Home Co. Inc. 191,484 2,399Clear Channel Outdoor Holdings Inc. Class A 518,660 2,386 Libbey Inc. 317,132 2,385Superior Uniform Group Inc. 89,182 2,382
* Vitamin Shoppe Inc. 500,426 2,202* Inspired Entertainment Inc. 222,621 2,182 ^ Fred's Inc. Class A 528,462 2,140^,* Duluth Holdings Inc. 118,921 2,123* Red Lion Hotels Corp. 209,155 2,060* Gaia Inc. Class A 165,278 2,049* Boot Barn Holdings Inc. 122,952 2,042
Tilly's Inc. Class A 137,764 2,033Weyco Group Inc. 67,932 2,019
* Liberty Media Corp-Liberty Braves Class A 88,074 1,942 Rocky Brands Inc. 102,185 1,931
* VOXX International Corp. Class A 344,270 1,928 * Ascent Capital Group Inc. Class A 166,895 1,918
5
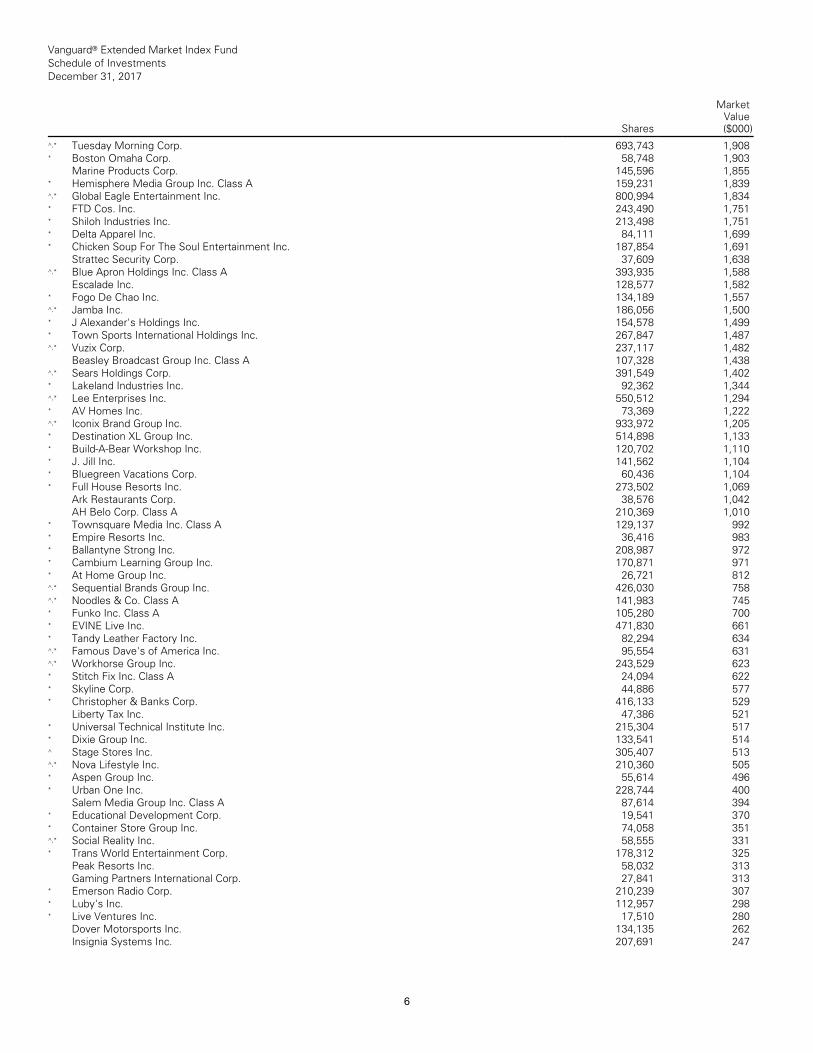
Vanguard® Extended Market Index Fund Schedule of Investments December 31, 2017
Shares
MarketValue($000)
__________________________________________________________________________________________________________________________________________________________________________________________________________________________________________________________________________________________________________________________________________________________________________________________________________________________________________________________________________________________________________________________________________________________________________________________________________________________________________________________________________________________ __________________________________________________________________________________________________________________________________________________________________________________________________________________________________________________________________________________________________________________________________________________________________________________________________________________________________________________________________________________________________________________________________________________________________________________________________________________________________________________________________________________________
^,* Tuesday Morning Corp. 693,743 1,908* Boston Omaha Corp. 58,748 1,903
Marine Products Corp. 145,596 1,855* Hemisphere Media Group Inc. Class A 159,231 1,839 ^,* Global Eagle Entertainment Inc. 800,994 1,834 * FTD Cos. Inc. 243,490 1,751* Shiloh Industries Inc. 213,498 1,751* Delta Apparel Inc. 84,111 1,699* Chicken Soup For The Soul Entertainment Inc. 187,854 1,691
Strattec Security Corp. 37,609 1,638^,* Blue Apron Holdings Inc. Class A 393,935 1,588
Escalade Inc. 128,577 1,582* Fogo De Chao Inc. 134,189 1,557^,* Jamba Inc. 186,056 1,500* J Alexander's Holdings Inc. 154,578 1,499 * Town Sports International Holdings Inc. 267,847 1,487 ^,* Vuzix Corp. 237,117 1,482
Beasley Broadcast Group Inc. Class A 107,328 1,438 ^,* Sears Holdings Corp. 391,549 1,402* Lakeland Industries Inc. 92,362 1,344^,* Lee Enterprises Inc. 550,512 1,294* AV Homes Inc. 73,369 1,222^,* Iconix Brand Group Inc. 933,972 1,205* Destination XL Group Inc. 514,898 1,133 * Build-A-Bear Workshop Inc. 120,702 1,110 * J. Jill Inc. 141,562 1,104* Bluegreen Vacations Corp. 60,436 1,104 * Full House Resorts Inc. 273,502 1,069
Ark Restaurants Corp. 38,576 1,042AH Belo Corp. Class A 210,369 1,010
* Townsquare Media Inc. Class A 129,137 992 * Empire Resorts Inc. 36,416 983* Ballantyne Strong Inc. 208,987 972* Cambium Learning Group Inc. 170,871 971 * At Home Group Inc. 26,721 812^,* Sequential Brands Group Inc. 426,030 758 ^,* Noodles & Co. Class A 141,983 745* Funko Inc. Class A 105,280 700* EVINE Live Inc. 471,830 661* Tandy Leather Factory Inc. 82,294 634 ^,* Famous Dave's of America Inc. 95,554 631 ^,* Workhorse Group Inc. 243,529 623* Stitch Fix Inc. Class A 24,094 622* Skyline Corp. 44,886 577* Christopher & Banks Corp. 416,133 529
Liberty Tax Inc. 47,386 521* Universal Technical Institute Inc. 215,304 517 * Dixie Group Inc. 133,541 514^ Stage Stores Inc. 305,407 513^,* Nova Lifestyle Inc. 210,360 505* Aspen Group Inc. 55,614 496* Urban One Inc. 228,744 400
Salem Media Group Inc. Class A 87,614 394 * Educational Development Corp. 19,541 370 * Container Store Group Inc. 74,058 351 ^,* Social Reality Inc. 58,555 331* Trans World Entertainment Corp. 178,312 325
Peak Resorts Inc. 58,032 313Gaming Partners International Corp. 27,841 313
* Emerson Radio Corp. 210,239 307* Luby's Inc. 112,957 298* Live Ventures Inc. 17,510 280
Dover Motorsports Inc. 134,135 262Insignia Systems Inc. 207,691 247
6
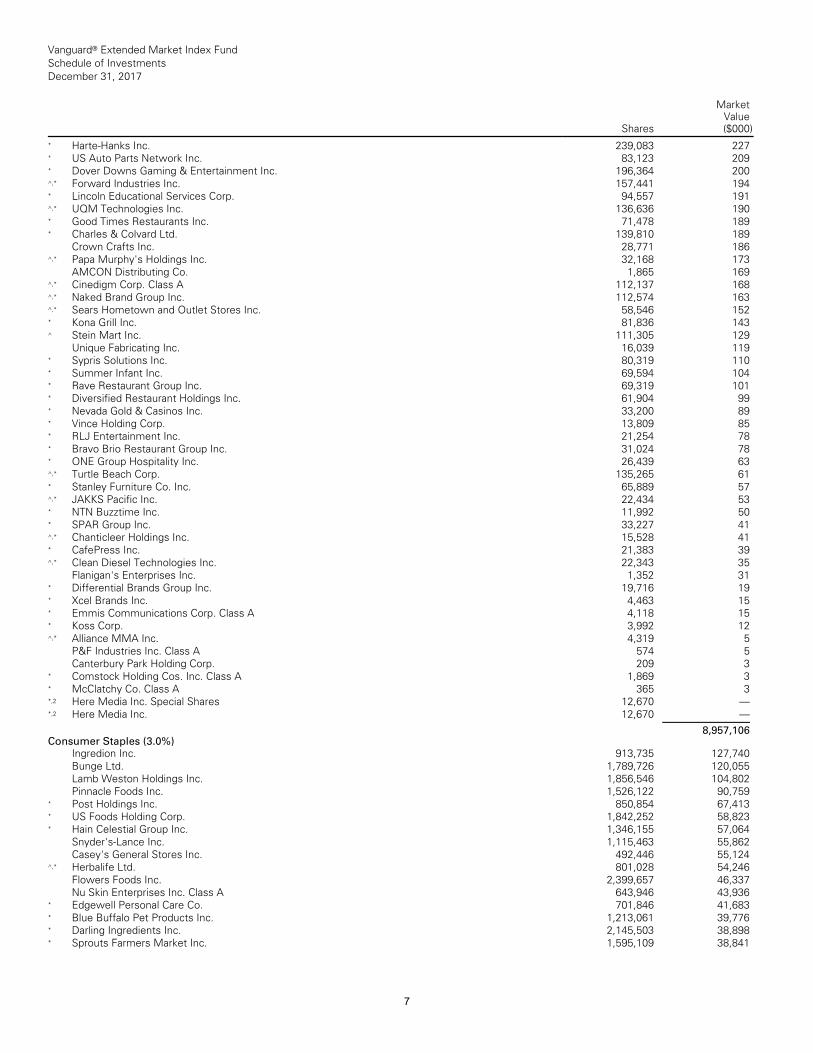
Vanguard® Extended Market Index Fund Schedule of Investments December 31, 2017
Shares
MarketValue($000)
__________________________________________________________________________________________________________________________________________________________________________________________________________________________________________________________________________________________________________________________________________________________________________________________________________________________________________________________________________________________________________________________________________________________________________________________________________________________________________________________________________________________ __________________________________________________________________________________________________________________________________________________________________________________________________________________________________________________________________________________________________________________________________________________________________________________________________________________________________________________________________________________________________________________________________________________________________________________________________________________________________________________________________________________________
* Harte-Hanks Inc. 239,083 227* US Auto Parts Network Inc. 83,123 209 * Dover Downs Gaming & Entertainment Inc. 196,364 200 ^,* Forward Industries Inc. 157,441 194* Lincoln Educational Services Corp. 94,557 191 ^,* UQM Technologies Inc. 136,636 190* Good Times Restaurants Inc. 71,478 189 * Charles & Colvard Ltd. 139,810 189
Crown Crafts Inc. 28,771 186^,* Papa Murphy's Holdings Inc. 32,168 173
AMCON Distributing Co. 1,865 169 ^,* Cinedigm Corp. Class A 112,137 168^,* Naked Brand Group Inc. 112,574 163 ^,* Sears Hometown and Outlet Stores Inc. 58,546 152 * Kona Grill Inc. 81,836 143^ Stein Mart Inc. 111,305 129
Unique Fabricating Inc. 16,039 119* Sypris Solutions Inc. 80,319 110* Summer Infant Inc. 69,594 104* Rave Restaurant Group Inc. 69,319 101 * Diversified Restaurant Holdings Inc. 61,904 99 * Nevada Gold & Casinos Inc. 33,200 89 * Vince Holding Corp. 13,809 85* RLJ Entertainment Inc. 21,254 78* Bravo Brio Restaurant Group Inc. 31,024 78 * ONE Group Hospitality Inc. 26,439 63 ^,* Turtle Beach Corp. 135,265 61* Stanley Furniture Co. Inc. 65,889 57 ^,* JAKKS Pacific Inc. 22,434 53* NTN Buzztime Inc. 11,992 50* SPAR Group Inc. 33,227 41^,* Chanticleer Holdings Inc. 15,528 41 * CafePress Inc. 21,383 39^,* Clean Diesel Technologies Inc. 22,343 35
Flanigan's Enterprises Inc. 1,352 31 * Differential Brands Group Inc. 19,716 19 * Xcel Brands Inc. 4,463 15* Emmis Communications Corp. Class A 4,118 15 * Koss Corp. 3,992 12^,* Alliance MMA Inc. 4,319 5
P&F Industries Inc. Class A 574 5 Canterbury Park Holding Corp. 209 3
* Comstock Holding Cos. Inc. Class A 1,869 3 * McClatchy Co. Class A 365 3*,2 Here Media Inc. Special Shares 12,670 — *,2 Here Media Inc. 12,670 —___________
8,957,106 Consumer Staples (3.0%)
Ingredion Inc. 913,735 127,740Bunge Ltd. 1,789,726 120,055Lamb Weston Holdings Inc. 1,856,546 104,802 Pinnacle Foods Inc. 1,526,122 90,759
* Post Holdings Inc. 850,854 67,413* US Foods Holding Corp. 1,842,252 58,823 * Hain Celestial Group Inc. 1,346,155 57,064
Snyder's-Lance Inc. 1,115,463 55,862Casey's General Stores Inc. 492,446 55,124
^,* Herbalife Ltd. 801,028 54,246Flowers Foods Inc. 2,399,657 46,337Nu Skin Enterprises Inc. Class A 643,946 43,936
* Edgewell Personal Care Co. 701,846 41,683 * Blue Buffalo Pet Products Inc. 1,213,061 39,776 * Darling Ingredients Inc. 2,145,503 38,898* Sprouts Farmers Market Inc. 1,595,109 38,841
7
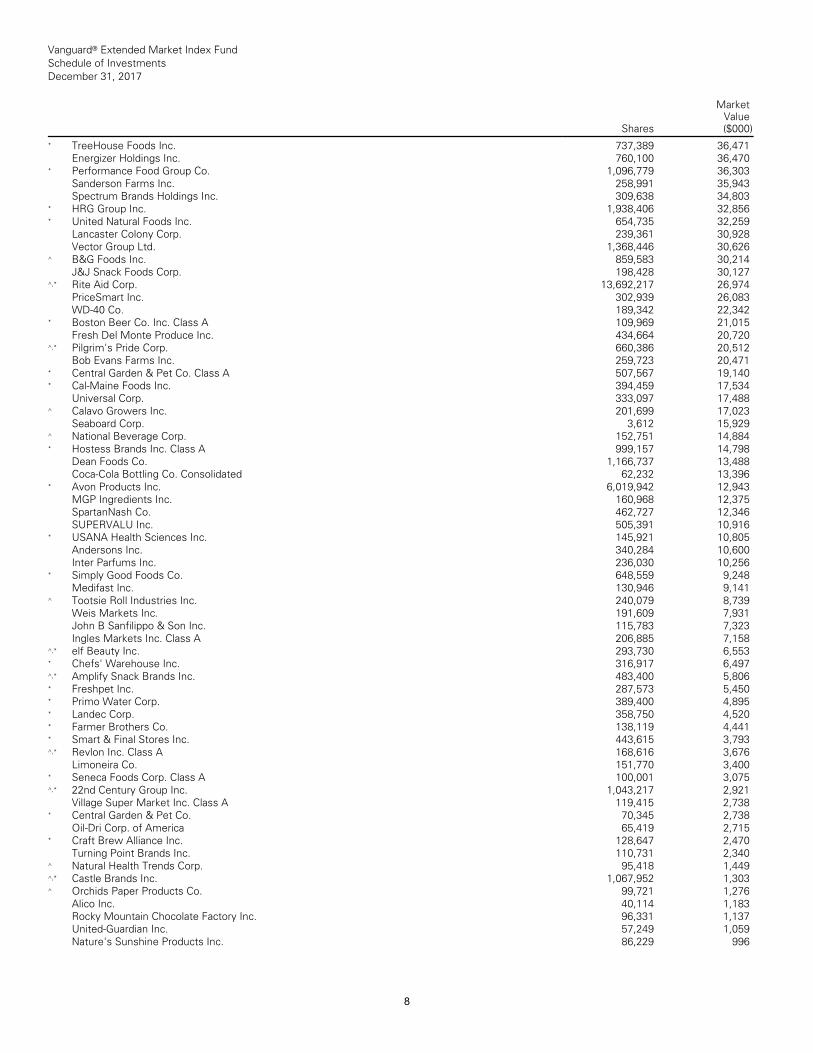
Vanguard® Extended Market Index Fund Schedule of Investments December 31, 2017
Shares
MarketValue($000)
__________________________________________________________________________________________________________________________________________________________________________________________________________________________________________________________________________________________________________________________________________________________________________________________________________________________________________________________________________________________________________________________________________________________________________________________________________________________________________________________________________________________ __________________________________________________________________________________________________________________________________________________________________________________________________________________________________________________________________________________________________________________________________________________________________________________________________________________________________________________________________________________________________________________________________________________________________________________________________________________________________________________________________________________________
* TreeHouse Foods Inc. 737,389 36,471Energizer Holdings Inc. 760,100 36,470
* Performance Food Group Co. 1,096,779 36,303 Sanderson Farms Inc. 258,991 35,943Spectrum Brands Holdings Inc. 309,638 34,803
* HRG Group Inc. 1,938,406 32,856* United Natural Foods Inc. 654,735 32,259
Lancaster Colony Corp. 239,361 30,928Vector Group Ltd. 1,368,446 30,626
^ B&G Foods Inc. 859,583 30,214J&J Snack Foods Corp. 198,428 30,127
^,* Rite Aid Corp. 13,692,217 26,974PriceSmart Inc. 302,939 26,083WD-40 Co. 189,342 22,342
* Boston Beer Co. Inc. Class A 109,969 21,015 Fresh Del Monte Produce Inc. 434,664 20,720
^,* Pilgrim's Pride Corp. 660,386 20,512Bob Evans Farms Inc. 259,723 20,471
* Central Garden & Pet Co. Class A 507,567 19,140 * Cal-Maine Foods Inc. 394,459 17,534
Universal Corp. 333,097 17,488^ Calavo Growers Inc. 201,699 17,023
Seaboard Corp. 3,612 15,929^ National Beverage Corp. 152,751 14,884 * Hostess Brands Inc. Class A 999,157 14,798
Dean Foods Co. 1,166,737 13,488Coca-Cola Bottling Co. Consolidated 62,232 13,396
* Avon Products Inc. 6,019,942 12,943MGP Ingredients Inc. 160,968 12,375SpartanNash Co. 462,727 12,346SUPERVALU Inc. 505,391 10,916
* USANA Health Sciences Inc. 145,921 10,805 Andersons Inc. 340,284 10,600Inter Parfums Inc. 236,030 10,256
* Simply Good Foods Co. 648,559 9,248Medifast Inc. 130,946 9,141
^ Tootsie Roll Industries Inc. 240,079 8,739 Weis Markets Inc. 191,609 7,931John B Sanfilippo & Son Inc. 115,783 7,323 Ingles Markets Inc. Class A 206,885 7,158
^,* elf Beauty Inc. 293,730 6,553* Chefs' Warehouse Inc. 316,917 6,497^,* Amplify Snack Brands Inc. 483,400 5,806 * Freshpet Inc. 287,573 5,450* Primo Water Corp. 389,400 4,895* Landec Corp. 358,750 4,520* Farmer Brothers Co. 138,119 4,441* Smart & Final Stores Inc. 443,615 3,793 ^,* Revlon Inc. Class A 168,616 3,676
Limoneira Co. 151,770 3,400* Seneca Foods Corp. Class A 100,001 3,075 ^,* 22nd Century Group Inc. 1,043,217 2,921
Village Super Market Inc. Class A 119,415 2,738 * Central Garden & Pet Co. 70,345 2,738
Oil-Dri Corp. of America 65,419 2,715 * Craft Brew Alliance Inc. 128,647 2,470
Turning Point Brands Inc. 110,731 2,340 ^ Natural Health Trends Corp. 95,418 1,449 ^,* Castle Brands Inc. 1,067,952 1,303^ Orchids Paper Products Co. 99,721 1,276
Alico Inc. 40,114 1,183Rocky Mountain Chocolate Factory Inc. 96,331 1,137 United-Guardian Inc. 57,249 1,059Nature's Sunshine Products Inc. 86,229 996
8
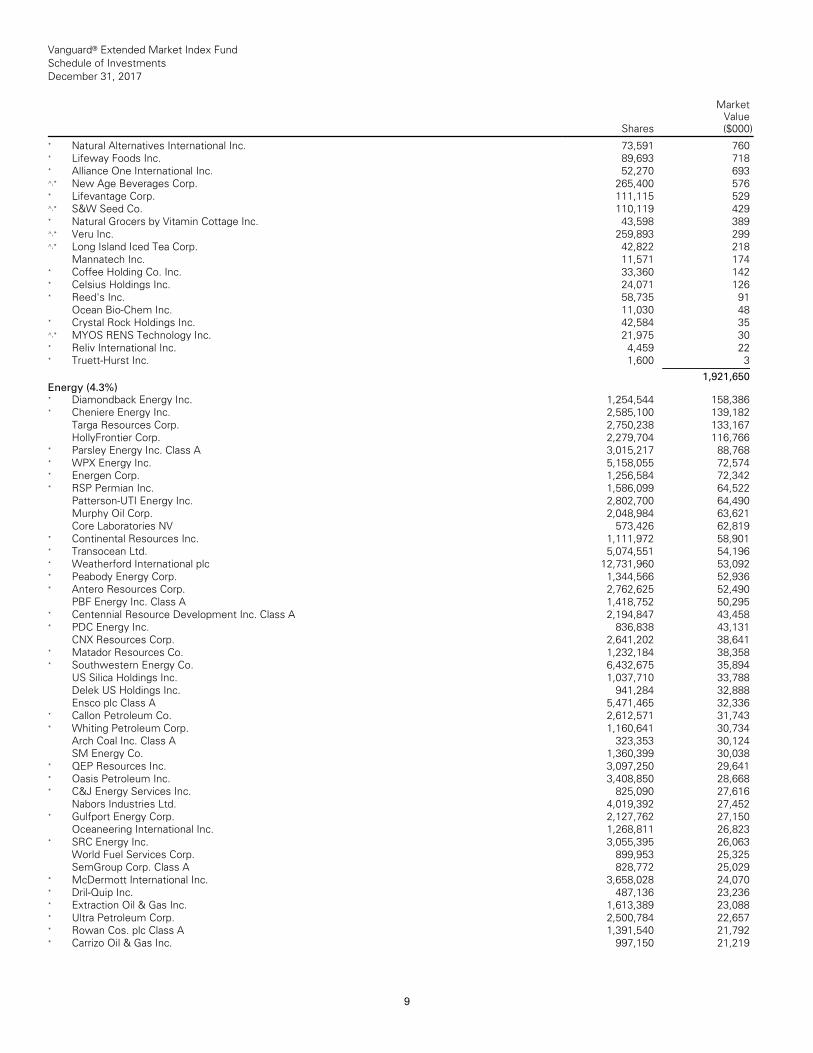
Vanguard® Extended Market Index Fund Schedule of Investments December 31, 2017
Shares
MarketValue($000)
__________________________________________________________________________________________________________________________________________________________________________________________________________________________________________________________________________________________________________________________________________________________________________________________________________________________________________________________________________________________________________________________________________________________________________________________________________________________________________________________________________________________ __________________________________________________________________________________________________________________________________________________________________________________________________________________________________________________________________________________________________________________________________________________________________________________________________________________________________________________________________________________________________________________________________________________________________________________________________________________________________________________________________________________________
* Natural Alternatives International Inc. 73,591 760 * Lifeway Foods Inc. 89,693 718* Alliance One International Inc. 52,270 693 ^,* New Age Beverages Corp. 265,400 576 * Lifevantage Corp. 111,115 529^,* S&W Seed Co. 110,119 429* Natural Grocers by Vitamin Cottage Inc. 43,598 389 ^,* Veru Inc. 259,893 299^,* Long Island Iced Tea Corp. 42,822 218
Mannatech Inc. 11,571 174* Coffee Holding Co. Inc. 33,360 142* Celsius Holdings Inc. 24,071 126* Reed's Inc. 58,735 91
Ocean Bio-Chem Inc. 11,030 48* Crystal Rock Holdings Inc. 42,584 35 ^,* MYOS RENS Technology Inc. 21,975 30 * Reliv International Inc. 4,459 22* Truett-Hurst Inc. 1,600 3___________
1,921,650 Energy (4.3%)* Diamondback Energy Inc. 1,254,544 158,386 * Cheniere Energy Inc. 2,585,100 139,182
Targa Resources Corp. 2,750,238 133,167HollyFrontier Corp. 2,279,704 116,766
* Parsley Energy Inc. Class A 3,015,217 88,768 * WPX Energy Inc. 5,158,055 72,574* Energen Corp. 1,256,584 72,342* RSP Permian Inc. 1,586,099 64,522
Patterson-UTI Energy Inc. 2,802,700 64,490 Murphy Oil Corp. 2,048,984 63,621Core Laboratories NV 573,426 62,819
* Continental Resources Inc. 1,111,972 58,901 * Transocean Ltd. 5,074,551 54,196* Weatherford International plc 12,731,960 53,092 * Peabody Energy Corp. 1,344,566 52,936* Antero Resources Corp. 2,762,625 52,490
PBF Energy Inc. Class A 1,418,752 50,295 * Centennial Resource Development Inc. Class A 2,194,847 43,458 * PDC Energy Inc. 836,838 43,131
CNX Resources Corp. 2,641,202 38,641* Matador Resources Co. 1,232,184 38,358* Southwestern Energy Co. 6,432,675 35,894
US Silica Holdings Inc. 1,037,710 33,788Delek US Holdings Inc. 941,284 32,888Ensco plc Class A 5,471,465 32,336
* Callon Petroleum Co. 2,612,571 31,743* Whiting Petroleum Corp. 1,160,641 30,734
Arch Coal Inc. Class A 323,353 30,124SM Energy Co. 1,360,399 30,038
* QEP Resources Inc. 3,097,250 29,641* Oasis Petroleum Inc. 3,408,850 28,668* C&J Energy Services Inc. 825,090 27,616
Nabors Industries Ltd. 4,019,392 27,452* Gulfport Energy Corp. 2,127,762 27,150
Oceaneering International Inc. 1,268,811 26,823 * SRC Energy Inc. 3,055,395 26,063
World Fuel Services Corp. 899,953 25,325 SemGroup Corp. Class A 828,772 25,029
* McDermott International Inc. 3,658,028 24,070 * Dril-Quip Inc. 487,136 23,236* Extraction Oil & Gas Inc. 1,613,389 23,088 * Ultra Petroleum Corp. 2,500,784 22,657* Rowan Cos. plc Class A 1,391,540 21,792 * Carrizo Oil & Gas Inc. 997,150 21,219
9
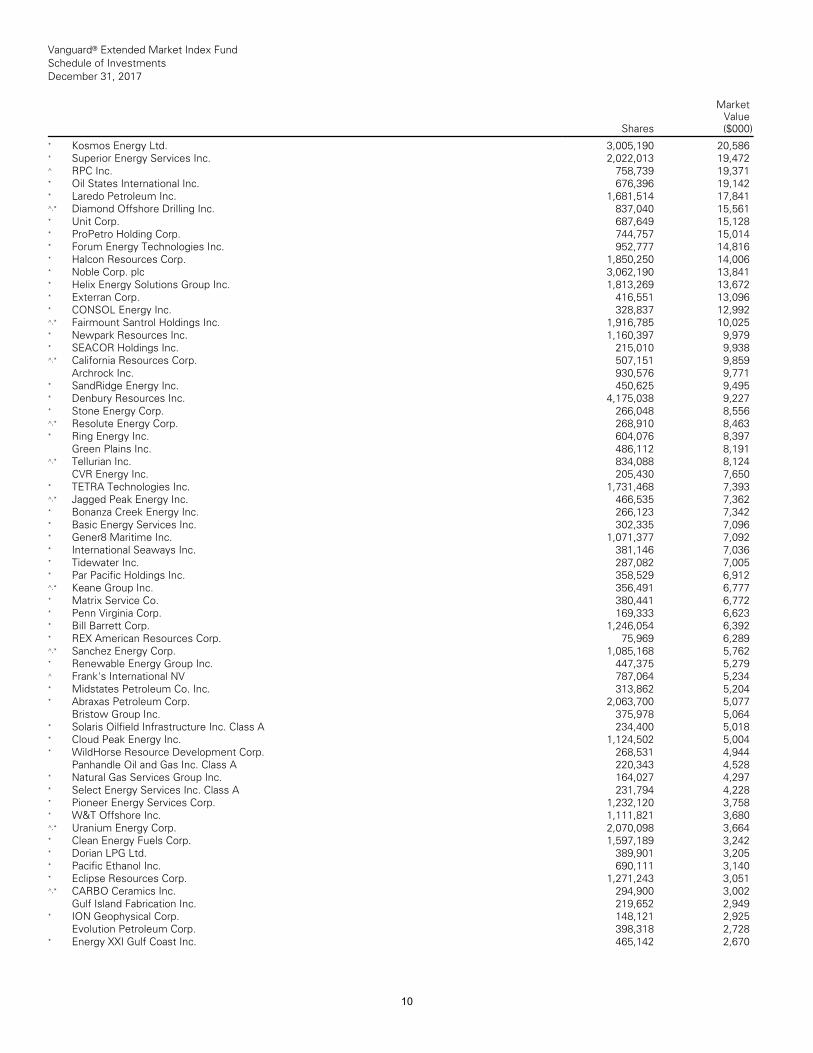
Vanguard® Extended Market Index Fund Schedule of Investments December 31, 2017
Shares
MarketValue($000)
__________________________________________________________________________________________________________________________________________________________________________________________________________________________________________________________________________________________________________________________________________________________________________________________________________________________________________________________________________________________________________________________________________________________________________________________________________________________________________________________________________________________ __________________________________________________________________________________________________________________________________________________________________________________________________________________________________________________________________________________________________________________________________________________________________________________________________________________________________________________________________________________________________________________________________________________________________________________________________________________________________________________________________________________________
* Kosmos Energy Ltd. 3,005,190 20,586* Superior Energy Services Inc. 2,022,013 19,472 ^ RPC Inc. 758,739 19,371* Oil States International Inc. 676,396 19,142 * Laredo Petroleum Inc. 1,681,514 17,841^,* Diamond Offshore Drilling Inc. 837,040 15,561 * Unit Corp. 687,649 15,128* ProPetro Holding Corp. 744,757 15,014* Forum Energy Technologies Inc. 952,777 14,816 * Halcon Resources Corp. 1,850,250 14,006 * Noble Corp. plc 3,062,190 13,841* Helix Energy Solutions Group Inc. 1,813,269 13,672 * Exterran Corp. 416,551 13,096* CONSOL Energy Inc. 328,837 12,992^,* Fairmount Santrol Holdings Inc. 1,916,785 10,025 * Newpark Resources Inc. 1,160,397 9,979 * SEACOR Holdings Inc. 215,010 9,938^,* California Resources Corp. 507,151 9,859
Archrock Inc. 930,576 9,771* SandRidge Energy Inc. 450,625 9,495* Denbury Resources Inc. 4,175,038 9,227 * Stone Energy Corp. 266,048 8,556^,* Resolute Energy Corp. 268,910 8,463* Ring Energy Inc. 604,076 8,397
Green Plains Inc. 486,112 8,191^,* Tellurian Inc. 834,088 8,124
CVR Energy Inc. 205,430 7,650* TETRA Technologies Inc. 1,731,468 7,393 ^,* Jagged Peak Energy Inc. 466,535 7,362 * Bonanza Creek Energy Inc. 266,123 7,342 * Basic Energy Services Inc. 302,335 7,096 * Gener8 Maritime Inc. 1,071,377 7,092* International Seaways Inc. 381,146 7,036 * Tidewater Inc. 287,082 7,005* Par Pacific Holdings Inc. 358,529 6,912 ^,* Keane Group Inc. 356,491 6,777* Matrix Service Co. 380,441 6,772* Penn Virginia Corp. 169,333 6,623* Bill Barrett Corp. 1,246,054 6,392* REX American Resources Corp. 75,969 6,289 ^,* Sanchez Energy Corp. 1,085,168 5,762* Renewable Energy Group Inc. 447,375 5,279 ^ Frank's International NV 787,064 5,234 * Midstates Petroleum Co. Inc. 313,862 5,204 * Abraxas Petroleum Corp. 2,063,700 5,077
Bristow Group Inc. 375,978 5,064* Solaris Oilfield Infrastructure Inc. Class A 234,400 5,018 * Cloud Peak Energy Inc. 1,124,502 5,004* WildHorse Resource Development Corp. 268,531 4,944
Panhandle Oil and Gas Inc. Class A 220,343 4,528 * Natural Gas Services Group Inc. 164,027 4,297 * Select Energy Services Inc. Class A 231,794 4,228 * Pioneer Energy Services Corp. 1,232,120 3,758 * W&T Offshore Inc. 1,111,821 3,680^,* Uranium Energy Corp. 2,070,098 3,664* Clean Energy Fuels Corp. 1,597,189 3,242 * Dorian LPG Ltd. 389,901 3,205* Pacific Ethanol Inc. 690,111 3,140* Eclipse Resources Corp. 1,271,243 3,051 ^,* CARBO Ceramics Inc. 294,900 3,002
Gulf Island Fabrication Inc. 219,652 2,949 * ION Geophysical Corp. 148,121 2,925
Evolution Petroleum Corp. 398,318 2,728 * Energy XXI Gulf Coast Inc. 465,142 2,670
10
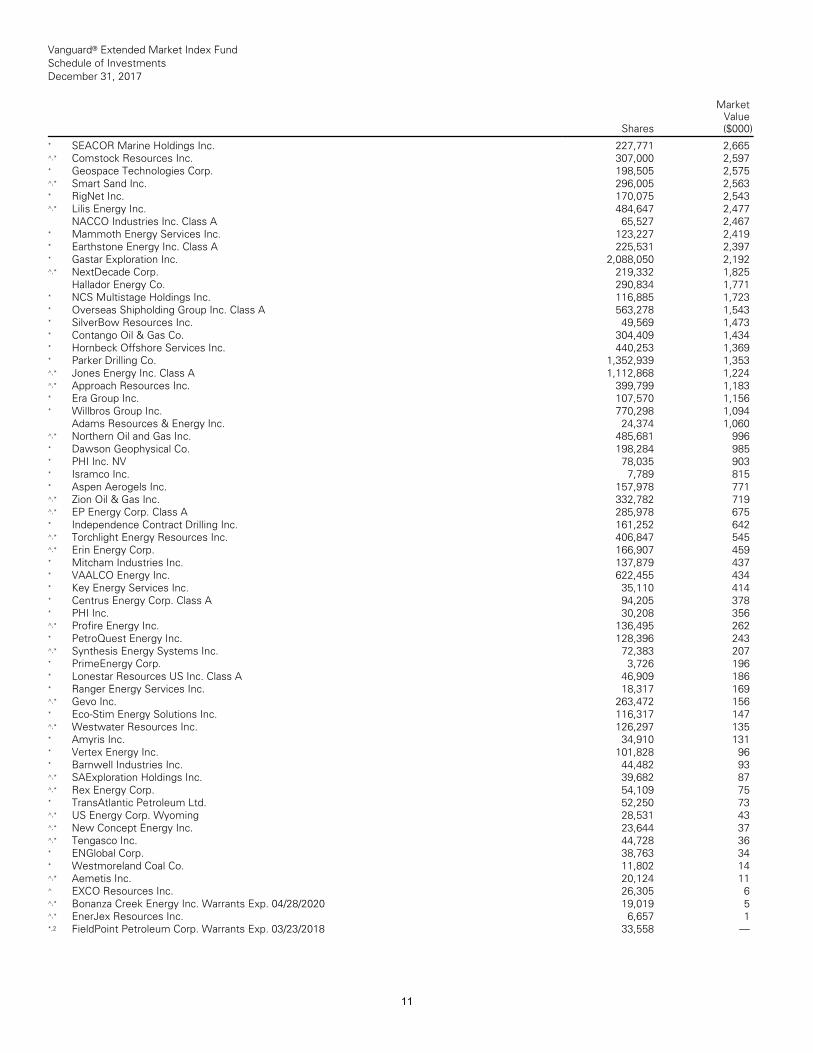
Vanguard® Extended Market Index Fund Schedule of Investments December 31, 2017
Shares
MarketValue($000)
__________________________________________________________________________________________________________________________________________________________________________________________________________________________________________________________________________________________________________________________________________________________________________________________________________________________________________________________________________________________________________________________________________________________________________________________________________________________________________________________________________________________ __________________________________________________________________________________________________________________________________________________________________________________________________________________________________________________________________________________________________________________________________________________________________________________________________________________________________________________________________________________________________________________________________________________________________________________________________________________________________________________________________________________________
* SEACOR Marine Holdings Inc. 227,771 2,665 ^,* Comstock Resources Inc. 307,000 2,597 * Geospace Technologies Corp. 198,505 2,575 ^,* Smart Sand Inc. 296,005 2,563* RigNet Inc. 170,075 2,543^,* Lilis Energy Inc. 484,647 2,477
NACCO Industries Inc. Class A 65,527 2,467 * Mammoth Energy Services Inc. 123,227 2,419 * Earthstone Energy Inc. Class A 225,531 2,397 * Gastar Exploration Inc. 2,088,050 2,192^,* NextDecade Corp. 219,332 1,825
Hallador Energy Co. 290,834 1,771* NCS Multistage Holdings Inc. 116,885 1,723 * Overseas Shipholding Group Inc. Class A 563,278 1,543 * SilverBow Resources Inc. 49,569 1,473 * Contango Oil & Gas Co. 304,409 1,434 * Hornbeck Offshore Services Inc. 440,253 1,369 * Parker Drilling Co. 1,352,939 1,353^,* Jones Energy Inc. Class A 1,112,868 1,224 ^,* Approach Resources Inc. 399,799 1,183 * Era Group Inc. 107,570 1,156* Willbros Group Inc. 770,298 1,094
Adams Resources & Energy Inc. 24,374 1,060 ^,* Northern Oil and Gas Inc. 485,681 996 * Dawson Geophysical Co. 198,284 985 * PHI Inc. NV 78,035 903* Isramco Inc. 7,789 815* Aspen Aerogels Inc. 157,978 771^,* Zion Oil & Gas Inc. 332,782 719^,* EP Energy Corp. Class A 285,978 675 * Independence Contract Drilling Inc. 161,252 642 ^,* Torchlight Energy Resources Inc. 406,847 545 ^,* Erin Energy Corp. 166,907 459* Mitcham Industries Inc. 137,879 437* VAALCO Energy Inc. 622,455 434* Key Energy Services Inc. 35,110 414 * Centrus Energy Corp. Class A 94,205 378 * PHI Inc. 30,208 356^,* Profire Energy Inc. 136,495 262* PetroQuest Energy Inc. 128,396 243^,* Synthesis Energy Systems Inc. 72,383 207 * PrimeEnergy Corp. 3,726 196* Lonestar Resources US Inc. Class A 46,909 186 * Ranger Energy Services Inc. 18,317 169 ^,* Gevo Inc. 263,472 156* Eco-Stim Energy Solutions Inc. 116,317 147 ^,* Westwater Resources Inc. 126,297 135 * Amyris Inc. 34,910 131* Vertex Energy Inc. 101,828 96* Barnwell Industries Inc. 44,482 93^,* SAExploration Holdings Inc. 39,682 87 ^,* Rex Energy Corp. 54,109 75* TransAtlantic Petroleum Ltd. 52,250 73 ^,* US Energy Corp. Wyoming 28,531 43 ^,* New Concept Energy Inc. 23,644 37 ^,* Tengasco Inc. 44,728 36* ENGlobal Corp. 38,763 34* Westmoreland Coal Co. 11,802 14 ^,* Aemetis Inc. 20,124 11^ EXCO Resources Inc. 26,305 6^,* Bonanza Creek Energy Inc. Warrants Exp. 04/28/2020 19,019 5 ^,* EnerJex Resources Inc. 6,657 1*,2 FieldPoint Petroleum Corp. Warrants Exp. 03/23/2018 33,558 —
11
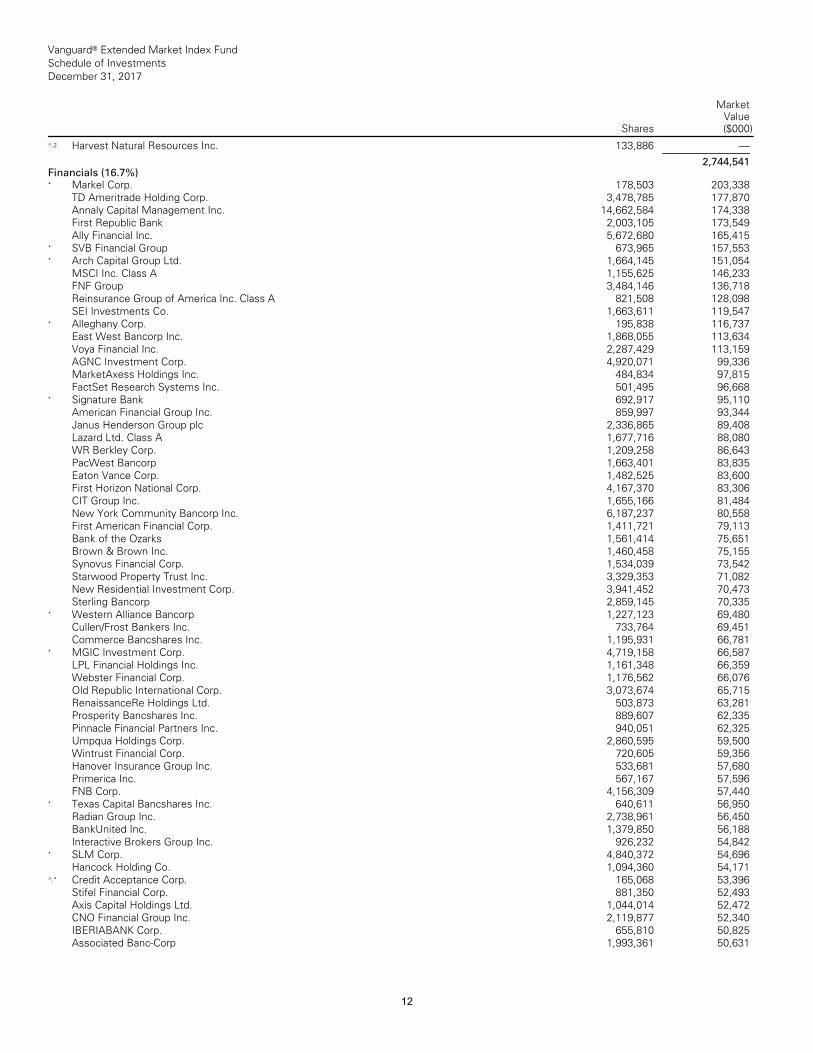
Vanguard® Extended Market Index Fund Schedule of Investments December 31, 2017
Shares
MarketValue($000)
__________________________________________________________________________________________________________________________________________________________________________________________________________________________________________________________________________________________________________________________________________________________________________________________________________________________________________________________________________________________________________________________________________________________________________________________________________________________________________________________________________________________ __________________________________________________________________________________________________________________________________________________________________________________________________________________________________________________________________________________________________________________________________________________________________________________________________________________________________________________________________________________________________________________________________________________________________________________________________________________________________________________________________________________________
^,2 Harvest Natural Resources Inc. 133,886 — ___________2,744,541
Financials (16.7%)* Markel Corp. 178,503 203,338
TD Ameritrade Holding Corp. 3,478,785 177,870 Annaly Capital Management Inc. 14,662,584 174,338 First Republic Bank 2,003,105 173,549Ally Financial Inc. 5,672,680 165,415
* SVB Financial Group 673,965 157,553* Arch Capital Group Ltd. 1,664,145 151,054
MSCI Inc. Class A 1,155,625 146,233FNF Group 3,484,146 136,718Reinsurance Group of America Inc. Class A 821,508 128,098 SEI Investments Co. 1,663,611 119,547
* Alleghany Corp. 195,838 116,737East West Bancorp Inc. 1,868,055 113,634Voya Financial Inc. 2,287,429 113,159AGNC Investment Corp. 4,920,071 99,336 MarketAxess Holdings Inc. 484,834 97,815 FactSet Research Systems Inc. 501,495 96,668
* Signature Bank 692,917 95,110American Financial Group Inc. 859,997 93,344 Janus Henderson Group plc 2,336,865 89,408 Lazard Ltd. Class A 1,677,716 88,080WR Berkley Corp. 1,209,258 86,643PacWest Bancorp 1,663,401 83,835Eaton Vance Corp. 1,482,525 83,600First Horizon National Corp. 4,167,370 83,306 CIT Group Inc. 1,655,166 81,484New York Community Bancorp Inc. 6,187,237 80,558 First American Financial Corp. 1,411,721 79,113 Bank of the Ozarks 1,561,414 75,651Brown & Brown Inc. 1,460,458 75,155Synovus Financial Corp. 1,534,039 73,542Starwood Property Trust Inc. 3,329,353 71,082 New Residential Investment Corp. 3,941,452 70,473 Sterling Bancorp 2,859,145 70,335
* Western Alliance Bancorp 1,227,123 69,480 Cullen/Frost Bankers Inc. 733,764 69,451 Commerce Bancshares Inc. 1,195,931 66,781
* MGIC Investment Corp. 4,719,158 66,587 LPL Financial Holdings Inc. 1,161,348 66,359 Webster Financial Corp. 1,176,562 66,076 Old Republic International Corp. 3,073,674 65,715 RenaissanceRe Holdings Ltd. 503,873 63,281 Prosperity Bancshares Inc. 889,607 62,335 Pinnacle Financial Partners Inc. 940,051 62,325 Umpqua Holdings Corp. 2,860,595 59,500 Wintrust Financial Corp. 720,605 59,356 Hanover Insurance Group Inc. 533,681 57,680 Primerica Inc. 567,167 57,596FNB Corp. 4,156,309 57,440
* Texas Capital Bancshares Inc. 640,611 56,950 Radian Group Inc. 2,738,961 56,450BankUnited Inc. 1,379,850 56,188Interactive Brokers Group Inc. 926,232 54,842
* SLM Corp. 4,840,372 54,696Hancock Holding Co. 1,094,360 54,171
^,* Credit Acceptance Corp. 165,068 53,396 Stifel Financial Corp. 881,350 52,493Axis Capital Holdings Ltd. 1,044,014 52,472 CNO Financial Group Inc. 2,119,877 52,340 IBERIABANK Corp. 655,810 50,825Associated Banc-Corp 1,993,361 50,631
12
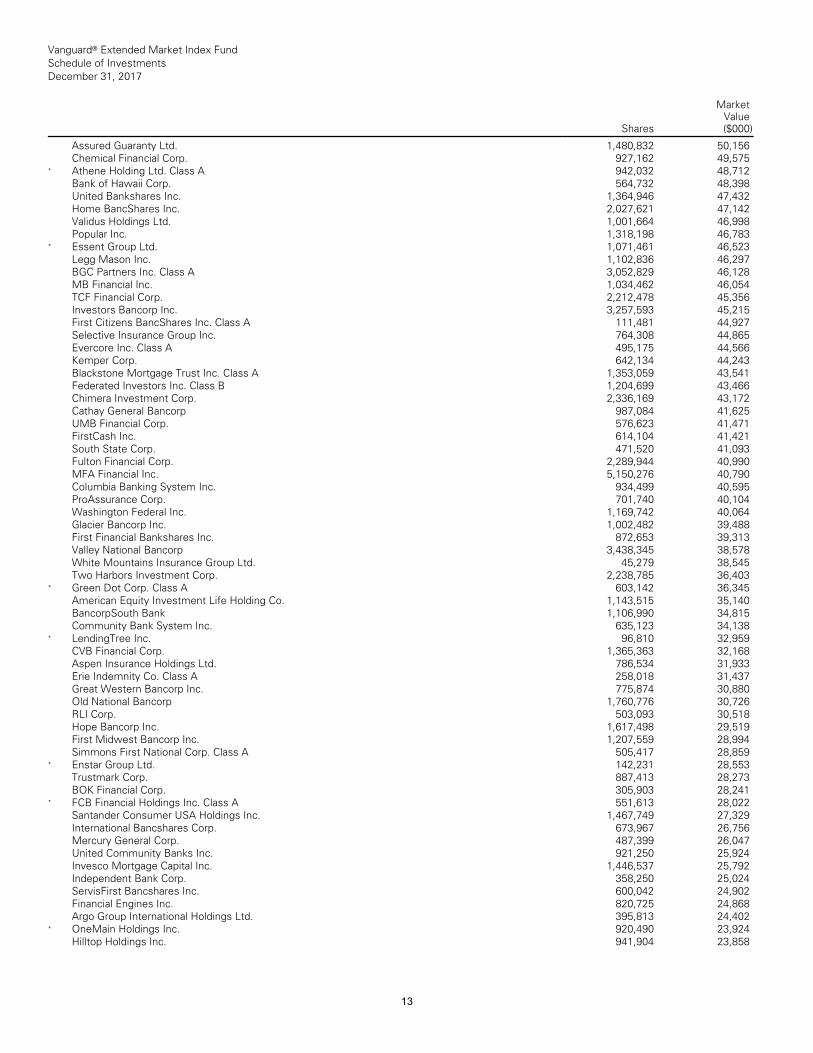
Vanguard® Extended Market Index Fund Schedule of Investments December 31, 2017
Shares
MarketValue($000)
__________________________________________________________________________________________________________________________________________________________________________________________________________________________________________________________________________________________________________________________________________________________________________________________________________________________________________________________________________________________________________________________________________________________________________________________________________________________________________________________________________________________ __________________________________________________________________________________________________________________________________________________________________________________________________________________________________________________________________________________________________________________________________________________________________________________________________________________________________________________________________________________________________________________________________________________________________________________________________________________________________________________________________________________________
Assured Guaranty Ltd. 1,480,832 50,156Chemical Financial Corp. 927,162 49,575
* Athene Holding Ltd. Class A 942,032 48,712 Bank of Hawaii Corp. 564,732 48,398United Bankshares Inc. 1,364,946 47,432Home BancShares Inc. 2,027,621 47,142Validus Holdings Ltd. 1,001,664 46,998Popular Inc. 1,318,198 46,783
* Essent Group Ltd. 1,071,461 46,523Legg Mason Inc. 1,102,836 46,297BGC Partners Inc. Class A 3,052,829 46,128 MB Financial Inc. 1,034,462 46,054TCF Financial Corp. 2,212,478 45,356Investors Bancorp Inc. 3,257,593 45,215First Citizens BancShares Inc. Class A 111,481 44,927 Selective Insurance Group Inc. 764,308 44,865 Evercore Inc. Class A 495,175 44,566Kemper Corp. 642,134 44,243Blackstone Mortgage Trust Inc. Class A 1,353,059 43,541 Federated Investors Inc. Class B 1,204,699 43,466 Chimera Investment Corp. 2,336,169 43,172 Cathay General Bancorp 987,084 41,625 UMB Financial Corp. 576,623 41,471FirstCash Inc. 614,104 41,421South State Corp. 471,520 41,093Fulton Financial Corp. 2,289,944 40,990MFA Financial Inc. 5,150,276 40,790Columbia Banking System Inc. 934,499 40,595 ProAssurance Corp. 701,740 40,104Washington Federal Inc. 1,169,742 40,064 Glacier Bancorp Inc. 1,002,482 39,488First Financial Bankshares Inc. 872,653 39,313 Valley National Bancorp 3,438,345 38,578White Mountains Insurance Group Ltd. 45,279 38,545 Two Harbors Investment Corp. 2,238,785 36,403
* Green Dot Corp. Class A 603,142 36,345 American Equity Investment Life Holding Co. 1,143,515 35,140 BancorpSouth Bank 1,106,990 34,815Community Bank System Inc. 635,123 34,138
* LendingTree Inc. 96,810 32,959CVB Financial Corp. 1,365,363 32,168Aspen Insurance Holdings Ltd. 786,534 31,933 Erie Indemnity Co. Class A 258,018 31,437 Great Western Bancorp Inc. 775,874 30,880 Old National Bancorp 1,760,776 30,726RLI Corp. 503,093 30,518Hope Bancorp Inc. 1,617,498 29,519First Midwest Bancorp Inc. 1,207,559 28,994 Simmons First National Corp. Class A 505,417 28,859
* Enstar Group Ltd. 142,231 28,553Trustmark Corp. 887,413 28,273BOK Financial Corp. 305,903 28,241
* FCB Financial Holdings Inc. Class A 551,613 28,022 Santander Consumer USA Holdings Inc. 1,467,749 27,329 International Bancshares Corp. 673,967 26,756 Mercury General Corp. 487,399 26,047United Community Banks Inc. 921,250 25,924 Invesco Mortgage Capital Inc. 1,446,537 25,792 Independent Bank Corp. 358,250 25,024 ServisFirst Bancshares Inc. 600,042 24,902 Financial Engines Inc. 820,725 24,868Argo Group International Holdings Ltd. 395,813 24,402
* OneMain Holdings Inc. 920,490 23,924Hilltop Holdings Inc. 941,904 23,858
13
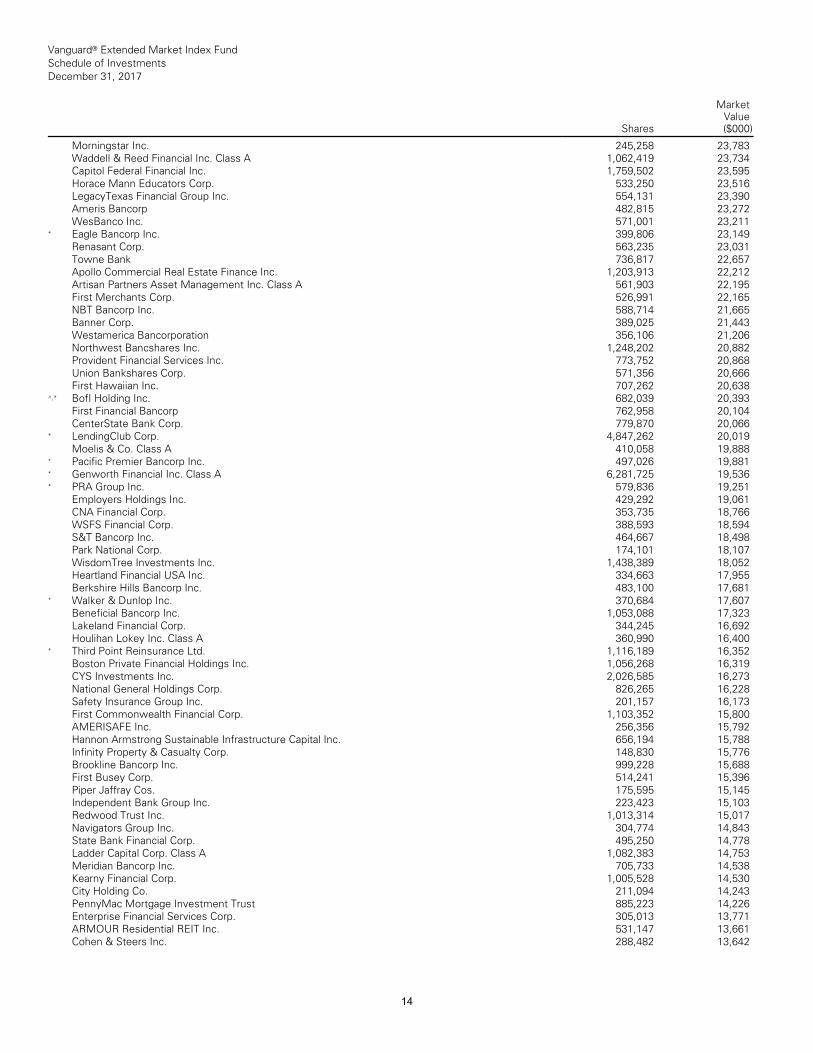
Vanguard® Extended Market Index Fund Schedule of Investments December 31, 2017
Shares
MarketValue($000)
__________________________________________________________________________________________________________________________________________________________________________________________________________________________________________________________________________________________________________________________________________________________________________________________________________________________________________________________________________________________________________________________________________________________________________________________________________________________________________________________________________________________ __________________________________________________________________________________________________________________________________________________________________________________________________________________________________________________________________________________________________________________________________________________________________________________________________________________________________________________________________________________________________________________________________________________________________________________________________________________________________________________________________________________________
Morningstar Inc. 245,258 23,783Waddell & Reed Financial Inc. Class A 1,062,419 23,734 Capitol Federal Financial Inc. 1,759,502 23,595 Horace Mann Educators Corp. 533,250 23,516 LegacyTexas Financial Group Inc. 554,131 23,390 Ameris Bancorp 482,815 23,272WesBanco Inc. 571,001 23,211
* Eagle Bancorp Inc. 399,806 23,149Renasant Corp. 563,235 23,031Towne Bank 736,817 22,657Apollo Commercial Real Estate Finance Inc. 1,203,913 22,212 Artisan Partners Asset Management Inc. Class A 561,903 22,195 First Merchants Corp. 526,991 22,165NBT Bancorp Inc. 588,714 21,665Banner Corp. 389,025 21,443Westamerica Bancorporation 356,106 21,206 Northwest Bancshares Inc. 1,248,202 20,882 Provident Financial Services Inc. 773,752 20,868 Union Bankshares Corp. 571,356 20,666 First Hawaiian Inc. 707,262 20,638
^,* BofI Holding Inc. 682,039 20,393First Financial Bancorp 762,958 20,104CenterState Bank Corp. 779,870 20,066
* LendingClub Corp. 4,847,262 20,019Moelis & Co. Class A 410,058 19,888
* Pacific Premier Bancorp Inc. 497,026 19,881 * Genworth Financial Inc. Class A 6,281,725 19,536 * PRA Group Inc. 579,836 19,251
Employers Holdings Inc. 429,292 19,061 CNA Financial Corp. 353,735 18,766WSFS Financial Corp. 388,593 18,594S&T Bancorp Inc. 464,667 18,498Park National Corp. 174,101 18,107WisdomTree Investments Inc. 1,438,389 18,052 Heartland Financial USA Inc. 334,663 17,955 Berkshire Hills Bancorp Inc. 483,100 17,681
* Walker & Dunlop Inc. 370,684 17,607Beneficial Bancorp Inc. 1,053,088 17,323Lakeland Financial Corp. 344,245 16,692 Houlihan Lokey Inc. Class A 360,990 16,400
* Third Point Reinsurance Ltd. 1,116,189 16,352 Boston Private Financial Holdings Inc. 1,056,268 16,319 CYS Investments Inc. 2,026,585 16,273National General Holdings Corp. 826,265 16,228 Safety Insurance Group Inc. 201,157 16,173 First Commonwealth Financial Corp. 1,103,352 15,800 AMERISAFE Inc. 256,356 15,792Hannon Armstrong Sustainable Infrastructure Capital Inc. 656,194 15,788 Infinity Property & Casualty Corp. 148,830 15,776 Brookline Bancorp Inc. 999,228 15,688First Busey Corp. 514,241 15,396Piper Jaffray Cos. 175,595 15,145Independent Bank Group Inc. 223,423 15,103 Redwood Trust Inc. 1,013,314 15,017Navigators Group Inc. 304,774 14,843State Bank Financial Corp. 495,250 14,778 Ladder Capital Corp. Class A 1,082,383 14,753 Meridian Bancorp Inc. 705,733 14,538Kearny Financial Corp. 1,005,528 14,530City Holding Co. 211,094 14,243PennyMac Mortgage Investment Trust 885,223 14,226 Enterprise Financial Services Corp. 305,013 13,771 ARMOUR Residential REIT Inc. 531,147 13,661 Cohen & Steers Inc. 288,482 13,642
14
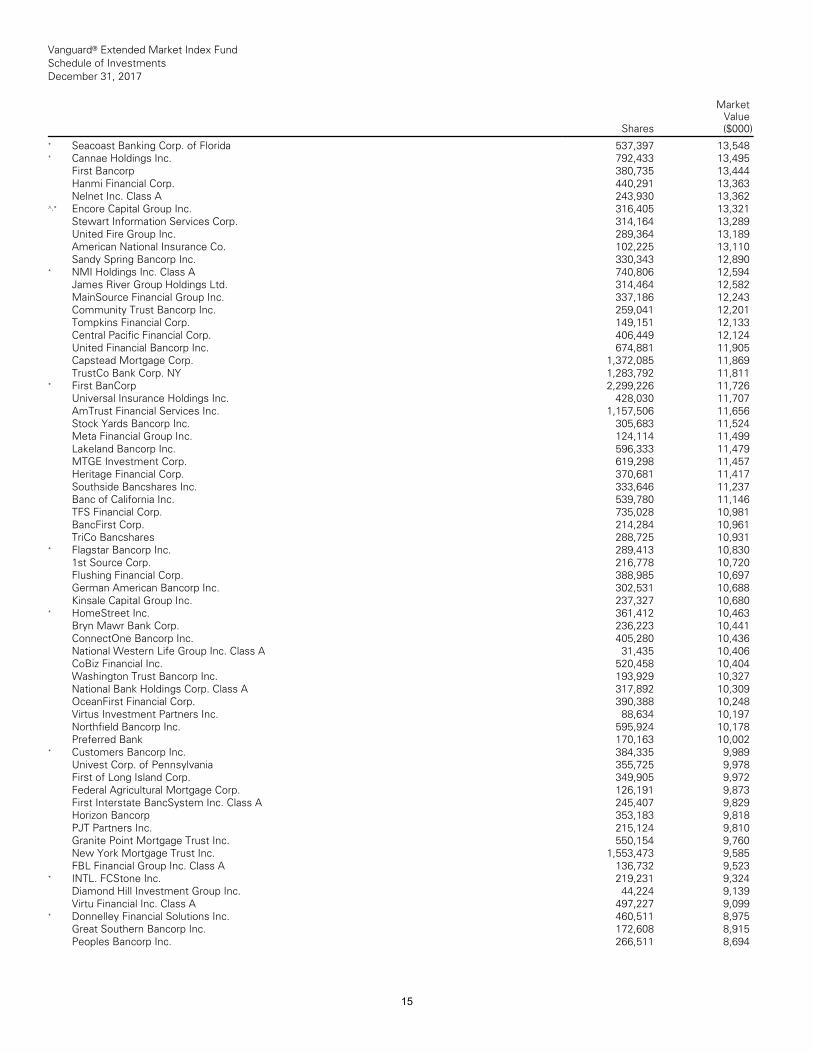
Vanguard® Extended Market Index Fund Schedule of Investments December 31, 2017
Shares
MarketValue($000)
__________________________________________________________________________________________________________________________________________________________________________________________________________________________________________________________________________________________________________________________________________________________________________________________________________________________________________________________________________________________________________________________________________________________________________________________________________________________________________________________________________________________ __________________________________________________________________________________________________________________________________________________________________________________________________________________________________________________________________________________________________________________________________________________________________________________________________________________________________________________________________________________________________________________________________________________________________________________________________________________________________________________________________________________________
* Seacoast Banking Corp. of Florida 537,397 13,548 * Cannae Holdings Inc. 792,433 13,495
First Bancorp 380,735 13,444Hanmi Financial Corp. 440,291 13,363Nelnet Inc. Class A 243,930 13,362
^,* Encore Capital Group Inc. 316,405 13,321 Stewart Information Services Corp. 314,164 13,289 United Fire Group Inc. 289,364 13,189American National Insurance Co. 102,225 13,110 Sandy Spring Bancorp Inc. 330,343 12,890
* NMI Holdings Inc. Class A 740,806 12,594 James River Group Holdings Ltd. 314,464 12,582 MainSource Financial Group Inc. 337,186 12,243 Community Trust Bancorp Inc. 259,041 12,201 Tompkins Financial Corp. 149,151 12,133 Central Pacific Financial Corp. 406,449 12,124 United Financial Bancorp Inc. 674,881 11,905 Capstead Mortgage Corp. 1,372,085 11,869 TrustCo Bank Corp. NY 1,283,792 11,811
* First BanCorp 2,299,226 11,726Universal Insurance Holdings Inc. 428,030 11,707 AmTrust Financial Services Inc. 1,157,506 11,656 Stock Yards Bancorp Inc. 305,683 11,524 Meta Financial Group Inc. 124,114 11,499 Lakeland Bancorp Inc. 596,333 11,479MTGE Investment Corp. 619,298 11,457 Heritage Financial Corp. 370,681 11,417Southside Bancshares Inc. 333,646 11,237 Banc of California Inc. 539,780 11,146TFS Financial Corp. 735,028 10,981BancFirst Corp. 214,284 10,961TriCo Bancshares 288,725 10,931
* Flagstar Bancorp Inc. 289,413 10,8301st Source Corp. 216,778 10,720Flushing Financial Corp. 388,985 10,697German American Bancorp Inc. 302,531 10,688 Kinsale Capital Group Inc. 237,327 10,680
* HomeStreet Inc. 361,412 10,463Bryn Mawr Bank Corp. 236,223 10,441ConnectOne Bancorp Inc. 405,280 10,436 National Western Life Group Inc. Class A 31,435 10,406 CoBiz Financial Inc. 520,458 10,404Washington Trust Bancorp Inc. 193,929 10,327 National Bank Holdings Corp. Class A 317,892 10,309 OceanFirst Financial Corp. 390,388 10,248 Virtus Investment Partners Inc. 88,634 10,197 Northfield Bancorp Inc. 595,924 10,178Preferred Bank 170,163 10,002
* Customers Bancorp Inc. 384,335 9,989 Univest Corp. of Pennsylvania 355,725 9,978 First of Long Island Corp. 349,905 9,972 Federal Agricultural Mortgage Corp. 126,191 9,873 First Interstate BancSystem Inc. Class A 245,407 9,829 Horizon Bancorp 353,183 9,818PJT Partners Inc. 215,124 9,810Granite Point Mortgage Trust Inc. 550,154 9,760 New York Mortgage Trust Inc. 1,553,473 9,585 FBL Financial Group Inc. Class A 136,732 9,523
* INTL. FCStone Inc. 219,231 9,324Diamond Hill Investment Group Inc. 44,224 9,139 Virtu Financial Inc. Class A 497,227 9,099
* Donnelley Financial Solutions Inc. 460,511 8,975 Great Southern Bancorp Inc. 172,608 8,915 Peoples Bancorp Inc. 266,511 8,694
15
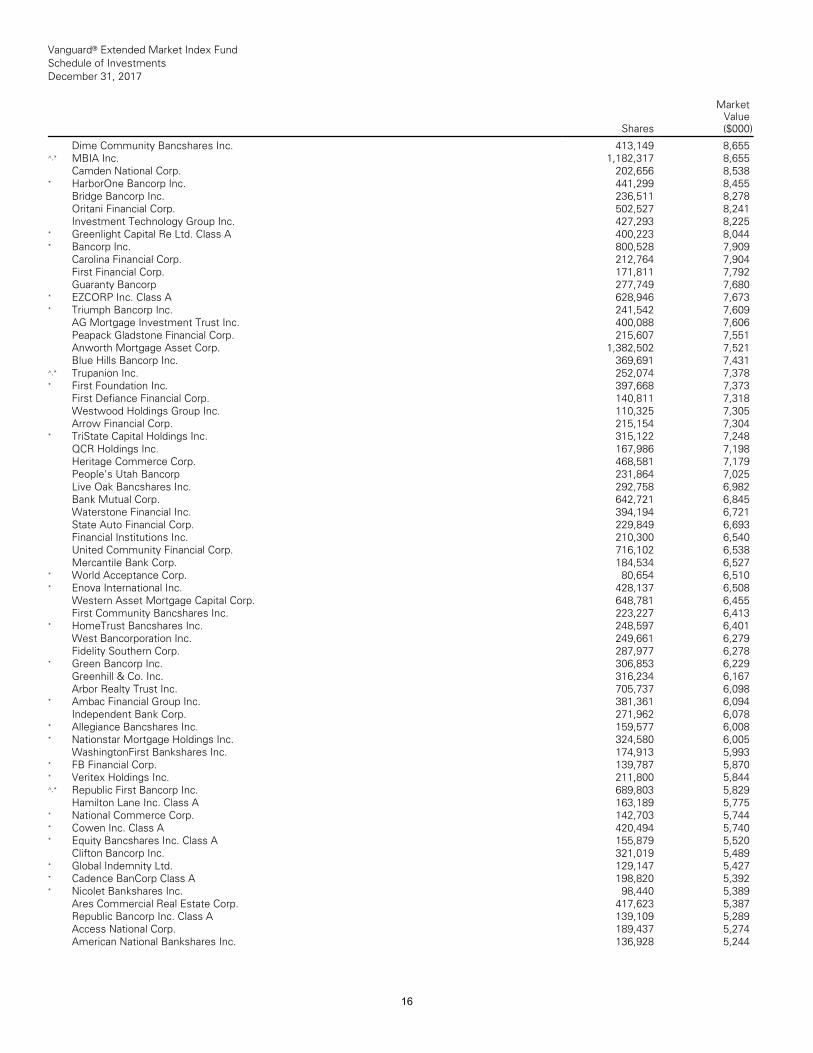
Vanguard® Extended Market Index Fund Schedule of Investments December 31, 2017
Shares
MarketValue($000)
__________________________________________________________________________________________________________________________________________________________________________________________________________________________________________________________________________________________________________________________________________________________________________________________________________________________________________________________________________________________________________________________________________________________________________________________________________________________________________________________________________________________ __________________________________________________________________________________________________________________________________________________________________________________________________________________________________________________________________________________________________________________________________________________________________________________________________________________________________________________________________________________________________________________________________________________________________________________________________________________________________________________________________________________________
Dime Community Bancshares Inc. 413,149 8,655 ^,* MBIA Inc. 1,182,317 8,655
Camden National Corp. 202,656 8,538* HarborOne Bancorp Inc. 441,299 8,455
Bridge Bancorp Inc. 236,511 8,278Oritani Financial Corp. 502,527 8,241Investment Technology Group Inc. 427,293 8,225
* Greenlight Capital Re Ltd. Class A 400,223 8,044 * Bancorp Inc. 800,528 7,909
Carolina Financial Corp. 212,764 7,904First Financial Corp. 171,811 7,792Guaranty Bancorp 277,749 7,680
* EZCORP Inc. Class A 628,946 7,673* Triumph Bancorp Inc. 241,542 7,609
AG Mortgage Investment Trust Inc. 400,088 7,606 Peapack Gladstone Financial Corp. 215,607 7,551 Anworth Mortgage Asset Corp. 1,382,502 7,521 Blue Hills Bancorp Inc. 369,691 7,431
^,* Trupanion Inc. 252,074 7,378* First Foundation Inc. 397,668 7,373
First Defiance Financial Corp. 140,811 7,318 Westwood Holdings Group Inc. 110,325 7,305 Arrow Financial Corp. 215,154 7,304
* TriState Capital Holdings Inc. 315,122 7,248 QCR Holdings Inc. 167,986 7,198Heritage Commerce Corp. 468,581 7,179 People's Utah Bancorp 231,864 7,025Live Oak Bancshares Inc. 292,758 6,982 Bank Mutual Corp. 642,721 6,845Waterstone Financial Inc. 394,194 6,721 State Auto Financial Corp. 229,849 6,693 Financial Institutions Inc. 210,300 6,540 United Community Financial Corp. 716,102 6,538 Mercantile Bank Corp. 184,534 6,527
* World Acceptance Corp. 80,654 6,510 * Enova International Inc. 428,137 6,508
Western Asset Mortgage Capital Corp. 648,781 6,455 First Community Bancshares Inc. 223,227 6,413
* HomeTrust Bancshares Inc. 248,597 6,401 West Bancorporation Inc. 249,661 6,279 Fidelity Southern Corp. 287,977 6,278
* Green Bancorp Inc. 306,853 6,229Greenhill & Co. Inc. 316,234 6,167Arbor Realty Trust Inc. 705,737 6,098
* Ambac Financial Group Inc. 381,361 6,094 Independent Bank Corp. 271,962 6,078
* Allegiance Bancshares Inc. 159,577 6,008 * Nationstar Mortgage Holdings Inc. 324,580 6,005
WashingtonFirst Bankshares Inc. 174,913 5,993 * FB Financial Corp. 139,787 5,870* Veritex Holdings Inc. 211,800 5,844^,* Republic First Bancorp Inc. 689,803 5,829
Hamilton Lane Inc. Class A 163,189 5,775 * National Commerce Corp. 142,703 5,744 * Cowen Inc. Class A 420,494 5,740* Equity Bancshares Inc. Class A 155,879 5,520
Clifton Bancorp Inc. 321,019 5,489* Global Indemnity Ltd. 129,147 5,427* Cadence BanCorp Class A 198,820 5,392 * Nicolet Bankshares Inc. 98,440 5,389
Ares Commercial Real Estate Corp. 417,623 5,387 Republic Bancorp Inc. Class A 139,109 5,289 Access National Corp. 189,437 5,274American National Bankshares Inc. 136,928 5,244
16
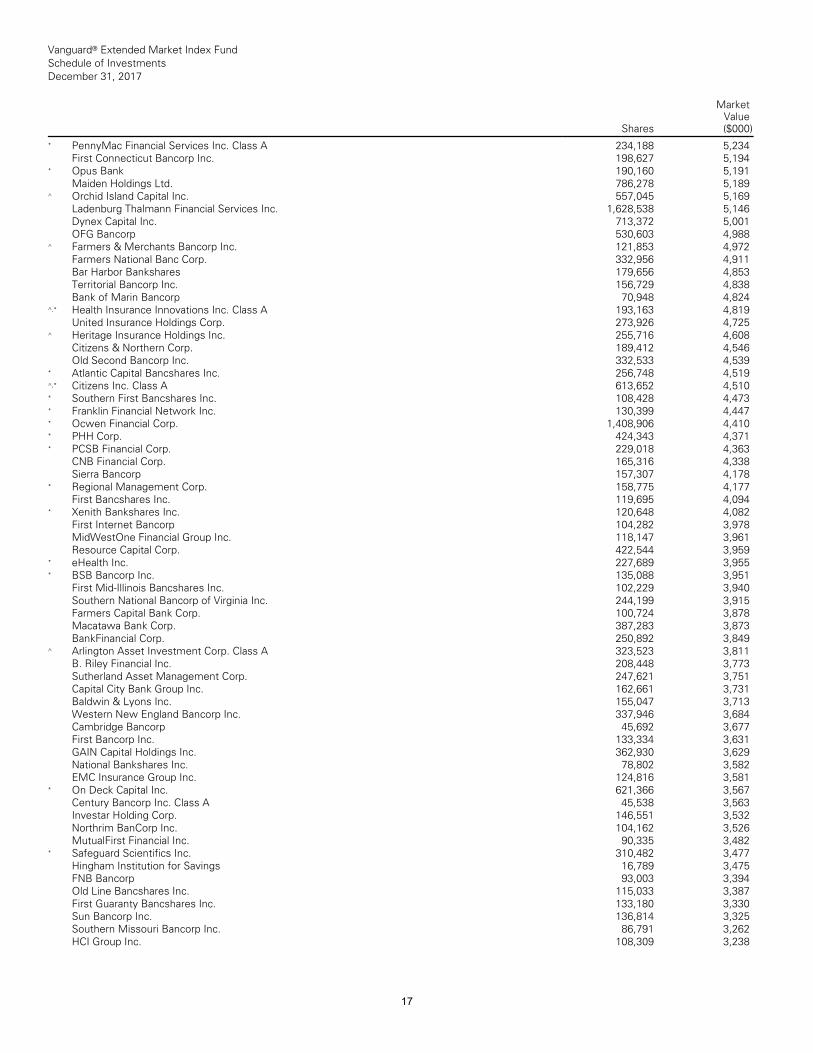
Vanguard® Extended Market Index Fund Schedule of Investments December 31, 2017
Shares
MarketValue($000)
__________________________________________________________________________________________________________________________________________________________________________________________________________________________________________________________________________________________________________________________________________________________________________________________________________________________________________________________________________________________________________________________________________________________________________________________________________________________________________________________________________________________ __________________________________________________________________________________________________________________________________________________________________________________________________________________________________________________________________________________________________________________________________________________________________________________________________________________________________________________________________________________________________________________________________________________________________________________________________________________________________________________________________________________________
* PennyMac Financial Services Inc. Class A 234,188 5,234 First Connecticut Bancorp Inc. 198,627 5,194
* Opus Bank 190,160 5,191Maiden Holdings Ltd. 786,278 5,189
^ Orchid Island Capital Inc. 557,045 5,169 Ladenburg Thalmann Financial Services Inc. 1,628,538 5,146 Dynex Capital Inc. 713,372 5,001OFG Bancorp 530,603 4,988
^ Farmers & Merchants Bancorp Inc. 121,853 4,972 Farmers National Banc Corp. 332,956 4,911 Bar Harbor Bankshares 179,656 4,853Territorial Bancorp Inc. 156,729 4,838Bank of Marin Bancorp 70,948 4,824
^,* Health Insurance Innovations Inc. Class A 193,163 4,819 United Insurance Holdings Corp. 273,926 4,725
^ Heritage Insurance Holdings Inc. 255,716 4,608 Citizens & Northern Corp. 189,412 4,546 Old Second Bancorp Inc. 332,533 4,539
* Atlantic Capital Bancshares Inc. 256,748 4,519 ^,* Citizens Inc. Class A 613,652 4,510* Southern First Bancshares Inc. 108,428 4,473 * Franklin Financial Network Inc. 130,399 4,447 * Ocwen Financial Corp. 1,408,906 4,410* PHH Corp. 424,343 4,371* PCSB Financial Corp. 229,018 4,363
CNB Financial Corp. 165,316 4,338Sierra Bancorp 157,307 4,178
* Regional Management Corp. 158,775 4,177 First Bancshares Inc. 119,695 4,094
* Xenith Bankshares Inc. 120,648 4,082First Internet Bancorp 104,282 3,978MidWestOne Financial Group Inc. 118,147 3,961 Resource Capital Corp. 422,544 3,959
* eHealth Inc. 227,689 3,955* BSB Bancorp Inc. 135,088 3,951
First Mid-Illinois Bancshares Inc. 102,229 3,940 Southern National Bancorp of Virginia Inc. 244,199 3,915 Farmers Capital Bank Corp. 100,724 3,878 Macatawa Bank Corp. 387,283 3,873BankFinancial Corp. 250,892 3,849
^ Arlington Asset Investment Corp. Class A 323,523 3,811 B. Riley Financial Inc. 208,448 3,773Sutherland Asset Management Corp. 247,621 3,751 Capital City Bank Group Inc. 162,661 3,731 Baldwin & Lyons Inc. 155,047 3,713Western New England Bancorp Inc. 337,946 3,684 Cambridge Bancorp 45,692 3,677First Bancorp Inc. 133,334 3,631GAIN Capital Holdings Inc. 362,930 3,629 National Bankshares Inc. 78,802 3,582 EMC Insurance Group Inc. 124,816 3,581
* On Deck Capital Inc. 621,366 3,567Century Bancorp Inc. Class A 45,538 3,563 Investar Holding Corp. 146,551 3,532Northrim BanCorp Inc. 104,162 3,526MutualFirst Financial Inc. 90,335 3,482
* Safeguard Scientifics Inc. 310,482 3,477 Hingham Institution for Savings 16,789 3,475 FNB Bancorp 93,003 3,394Old Line Bancshares Inc. 115,033 3,387 First Guaranty Bancshares Inc. 133,180 3,330 Sun Bancorp Inc. 136,814 3,325Southern Missouri Bancorp Inc. 86,791 3,262 HCI Group Inc. 108,309 3,238
17
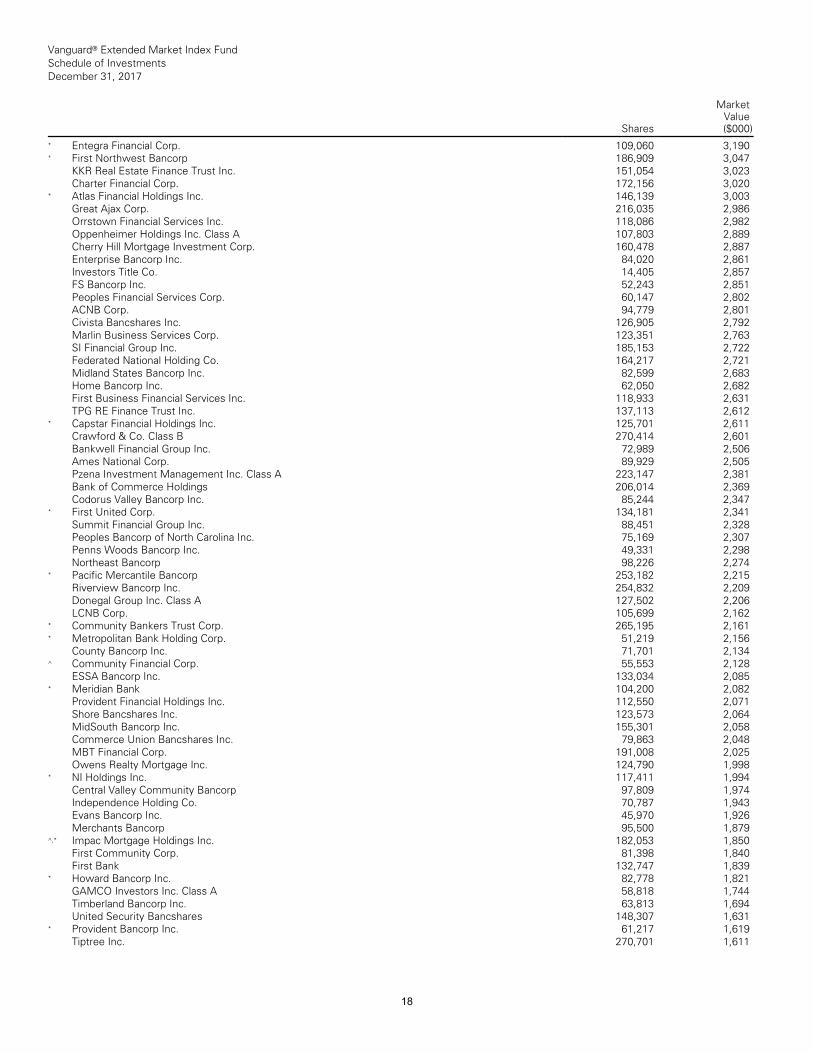
Vanguard® Extended Market Index Fund Schedule of Investments December 31, 2017
Shares
MarketValue($000)
__________________________________________________________________________________________________________________________________________________________________________________________________________________________________________________________________________________________________________________________________________________________________________________________________________________________________________________________________________________________________________________________________________________________________________________________________________________________________________________________________________________________ __________________________________________________________________________________________________________________________________________________________________________________________________________________________________________________________________________________________________________________________________________________________________________________________________________________________________________________________________________________________________________________________________________________________________________________________________________________________________________________________________________________________
* Entegra Financial Corp. 109,060 3,190* First Northwest Bancorp 186,909 3,047
KKR Real Estate Finance Trust Inc. 151,054 3,023 Charter Financial Corp. 172,156 3,020
* Atlas Financial Holdings Inc. 146,139 3,003 Great Ajax Corp. 216,035 2,986Orrstown Financial Services Inc. 118,086 2,982 Oppenheimer Holdings Inc. Class A 107,803 2,889 Cherry Hill Mortgage Investment Corp. 160,478 2,887 Enterprise Bancorp Inc. 84,020 2,861Investors Title Co. 14,405 2,857FS Bancorp Inc. 52,243 2,851Peoples Financial Services Corp. 60,147 2,802 ACNB Corp. 94,779 2,801Civista Bancshares Inc. 126,905 2,792Marlin Business Services Corp. 123,351 2,763 SI Financial Group Inc. 185,153 2,722Federated National Holding Co. 164,217 2,721 Midland States Bancorp Inc. 82,599 2,683 Home Bancorp Inc. 62,050 2,682First Business Financial Services Inc. 118,933 2,631 TPG RE Finance Trust Inc. 137,113 2,612
* Capstar Financial Holdings Inc. 125,701 2,611 Crawford & Co. Class B 270,414 2,601Bankwell Financial Group Inc. 72,989 2,506 Ames National Corp. 89,929 2,505Pzena Investment Management Inc. Class A 223,147 2,381 Bank of Commerce Holdings 206,014 2,369 Codorus Valley Bancorp Inc. 85,244 2,347
* First United Corp. 134,181 2,341Summit Financial Group Inc. 88,451 2,328 Peoples Bancorp of North Carolina Inc. 75,169 2,307 Penns Woods Bancorp Inc. 49,331 2,298 Northeast Bancorp 98,226 2,274
* Pacific Mercantile Bancorp 253,182 2,215 Riverview Bancorp Inc. 254,832 2,209Donegal Group Inc. Class A 127,502 2,206 LCNB Corp. 105,699 2,162
* Community Bankers Trust Corp. 265,195 2,161 * Metropolitan Bank Holding Corp. 51,219 2,156
County Bancorp Inc. 71,701 2,134^ Community Financial Corp. 55,553 2,128
ESSA Bancorp Inc. 133,034 2,085* Meridian Bank 104,200 2,082
Provident Financial Holdings Inc. 112,550 2,071 Shore Bancshares Inc. 123,573 2,064MidSouth Bancorp Inc. 155,301 2,058Commerce Union Bancshares Inc. 79,863 2,048 MBT Financial Corp. 191,008 2,025Owens Realty Mortgage Inc. 124,790 1,998
* NI Holdings Inc. 117,411 1,994Central Valley Community Bancorp 97,809 1,974 Independence Holding Co. 70,787 1,943 Evans Bancorp Inc. 45,970 1,926Merchants Bancorp 95,500 1,879
^,* Impac Mortgage Holdings Inc. 182,053 1,850 First Community Corp. 81,398 1,840First Bank 132,747 1,839
* Howard Bancorp Inc. 82,778 1,821GAMCO Investors Inc. Class A 58,818 1,744 Timberland Bancorp Inc. 63,813 1,694 United Security Bancshares 148,307 1,631
* Provident Bancorp Inc. 61,217 1,619Tiptree Inc. 270,701 1,611
18
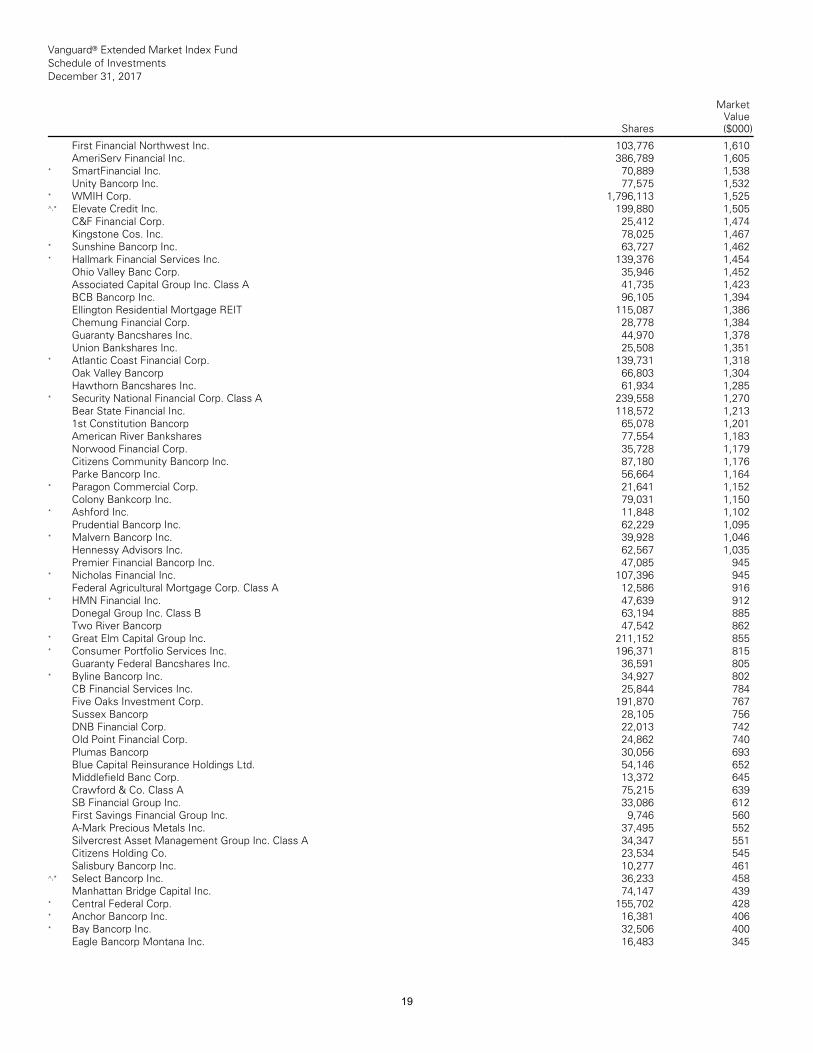
Vanguard® Extended Market Index Fund Schedule of Investments December 31, 2017
Shares
MarketValue($000)
__________________________________________________________________________________________________________________________________________________________________________________________________________________________________________________________________________________________________________________________________________________________________________________________________________________________________________________________________________________________________________________________________________________________________________________________________________________________________________________________________________________________ __________________________________________________________________________________________________________________________________________________________________________________________________________________________________________________________________________________________________________________________________________________________________________________________________________________________________________________________________________________________________________________________________________________________________________________________________________________________________________________________________________________________
First Financial Northwest Inc. 103,776 1,610 AmeriServ Financial Inc. 386,789 1,605
* SmartFinancial Inc. 70,889 1,538Unity Bancorp Inc. 77,575 1,532
* WMIH Corp. 1,796,113 1,525^,* Elevate Credit Inc. 199,880 1,505
C&F Financial Corp. 25,412 1,474Kingstone Cos. Inc. 78,025 1,467
* Sunshine Bancorp Inc. 63,727 1,462* Hallmark Financial Services Inc. 139,376 1,454
Ohio Valley Banc Corp. 35,946 1,452Associated Capital Group Inc. Class A 41,735 1,423 BCB Bancorp Inc. 96,105 1,394Ellington Residential Mortgage REIT 115,087 1,386 Chemung Financial Corp. 28,778 1,384 Guaranty Bancshares Inc. 44,970 1,378 Union Bankshares Inc. 25,508 1,351
* Atlantic Coast Financial Corp. 139,731 1,318 Oak Valley Bancorp 66,803 1,304Hawthorn Bancshares Inc. 61,934 1,285
* Security National Financial Corp. Class A 239,558 1,270 Bear State Financial Inc. 118,572 1,213 1st Constitution Bancorp 65,078 1,201 American River Bankshares 77,554 1,183 Norwood Financial Corp. 35,728 1,179 Citizens Community Bancorp Inc. 87,180 1,176 Parke Bancorp Inc. 56,664 1,164
* Paragon Commercial Corp. 21,641 1,152 Colony Bankcorp Inc. 79,031 1,150
* Ashford Inc. 11,848 1,102Prudential Bancorp Inc. 62,229 1,095
* Malvern Bancorp Inc. 39,928 1,046Hennessy Advisors Inc. 62,567 1,035Premier Financial Bancorp Inc. 47,085 945
* Nicholas Financial Inc. 107,396 945Federal Agricultural Mortgage Corp. Class A 12,586 916
* HMN Financial Inc. 47,639 912Donegal Group Inc. Class B 63,194 885 Two River Bancorp 47,542 862
* Great Elm Capital Group Inc. 211,152 855 * Consumer Portfolio Services Inc. 196,371 815
Guaranty Federal Bancshares Inc. 36,591 805 * Byline Bancorp Inc. 34,927 802
CB Financial Services Inc. 25,844 784 Five Oaks Investment Corp. 191,870 767 Sussex Bancorp 28,105 756DNB Financial Corp. 22,013 742Old Point Financial Corp. 24,862 740 Plumas Bancorp 30,056 693Blue Capital Reinsurance Holdings Ltd. 54,146 652 Middlefield Banc Corp. 13,372 645Crawford & Co. Class A 75,215 639SB Financial Group Inc. 33,086 612First Savings Financial Group Inc. 9,746 560 A-Mark Precious Metals Inc. 37,495 552 Silvercrest Asset Management Group Inc. Class A 34,347 551 Citizens Holding Co. 23,534 545Salisbury Bancorp Inc. 10,277 461
^,* Select Bancorp Inc. 36,233 458Manhattan Bridge Capital Inc. 74,147 439
* Central Federal Corp. 155,702 428* Anchor Bancorp Inc. 16,381 406* Bay Bancorp Inc. 32,506 400
Eagle Bancorp Montana Inc. 16,483 345
19
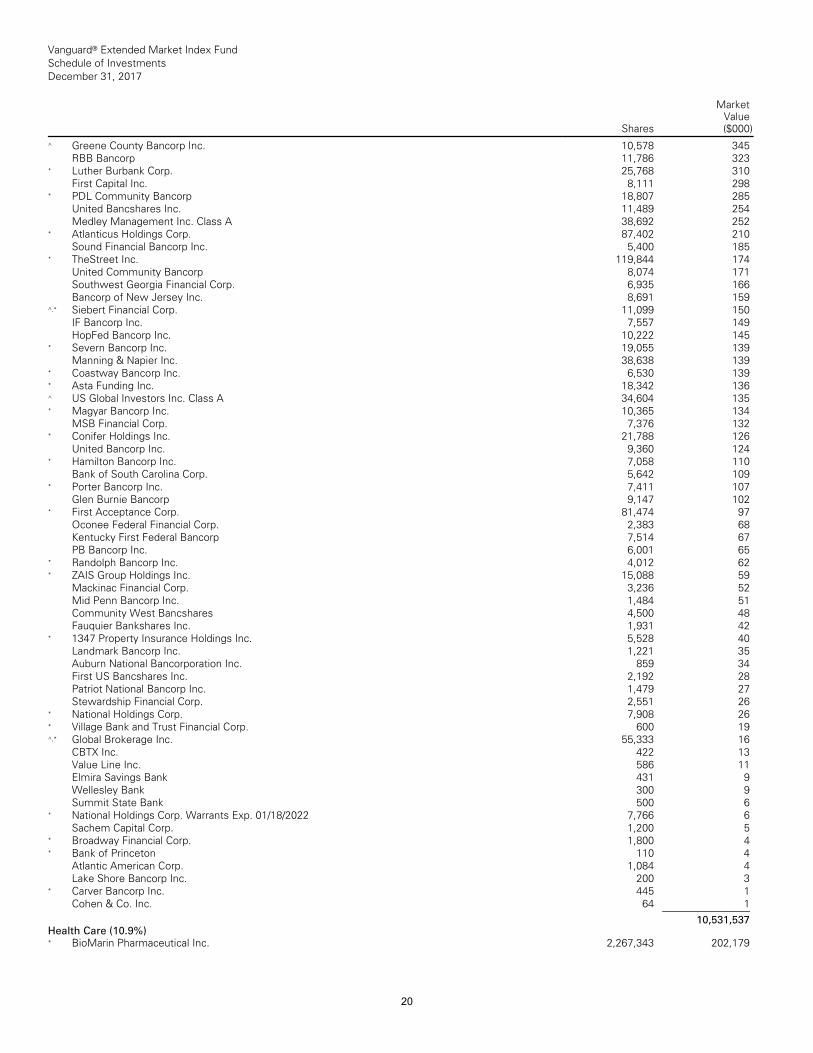
Vanguard® Extended Market Index Fund Schedule of Investments December 31, 2017
Shares
MarketValue($000)
__________________________________________________________________________________________________________________________________________________________________________________________________________________________________________________________________________________________________________________________________________________________________________________________________________________________________________________________________________________________________________________________________________________________________________________________________________________________________________________________________________________________ __________________________________________________________________________________________________________________________________________________________________________________________________________________________________________________________________________________________________________________________________________________________________________________________________________________________________________________________________________________________________________________________________________________________________________________________________________________________________________________________________________________________
^ Greene County Bancorp Inc. 10,578 345 RBB Bancorp 11,786 323
* Luther Burbank Corp. 25,768 310First Capital Inc. 8,111 298
* PDL Community Bancorp 18,807 285 United Bancshares Inc. 11,489 254Medley Management Inc. Class A 38,692 252
* Atlanticus Holdings Corp. 87,402 210 Sound Financial Bancorp Inc. 5,400 185
* TheStreet Inc. 119,844 174United Community Bancorp 8,074 171 Southwest Georgia Financial Corp. 6,935 166 Bancorp of New Jersey Inc. 8,691 159
^,* Siebert Financial Corp. 11,099 150IF Bancorp Inc. 7,557 149HopFed Bancorp Inc. 10,222 145
* Severn Bancorp Inc. 19,055 139Manning & Napier Inc. 38,638 139
* Coastway Bancorp Inc. 6,530 139* Asta Funding Inc. 18,342 136^ US Global Investors Inc. Class A 34,604 135 * Magyar Bancorp Inc. 10,365 134
MSB Financial Corp. 7,376 132* Conifer Holdings Inc. 21,788 126
United Bancorp Inc. 9,360 124* Hamilton Bancorp Inc. 7,058 110
Bank of South Carolina Corp. 5,642 109 * Porter Bancorp Inc. 7,411 107
Glen Burnie Bancorp 9,147 102* First Acceptance Corp. 81,474 97
Oconee Federal Financial Corp. 2,383 68 Kentucky First Federal Bancorp 7,514 67 PB Bancorp Inc. 6,001 65
* Randolph Bancorp Inc. 4,012 62* ZAIS Group Holdings Inc. 15,088 59
Mackinac Financial Corp. 3,236 52 Mid Penn Bancorp Inc. 1,484 51Community West Bancshares 4,500 48 Fauquier Bankshares Inc. 1,931 42
* 1347 Property Insurance Holdings Inc. 5,528 40 Landmark Bancorp Inc. 1,221 35Auburn National Bancorporation Inc. 859 34 First US Bancshares Inc. 2,192 28 Patriot National Bancorp Inc. 1,479 27 Stewardship Financial Corp. 2,551 26
* National Holdings Corp. 7,908 26* Village Bank and Trust Financial Corp. 600 19 ^,* Global Brokerage Inc. 55,333 16
CBTX Inc. 422 13Value Line Inc. 586 11Elmira Savings Bank 431 9Wellesley Bank 300 9Summit State Bank 500 6
* National Holdings Corp. Warrants Exp. 01/18/2022 7,766 6 Sachem Capital Corp. 1,200 5
* Broadway Financial Corp. 1,800 4 * Bank of Princeton 110 4
Atlantic American Corp. 1,084 4Lake Shore Bancorp Inc. 200 3
* Carver Bancorp Inc. 445 1Cohen & Co. Inc. 64 1___________
10,531,537 Health Care (10.9%)* BioMarin Pharmaceutical Inc. 2,267,343 202,179
20
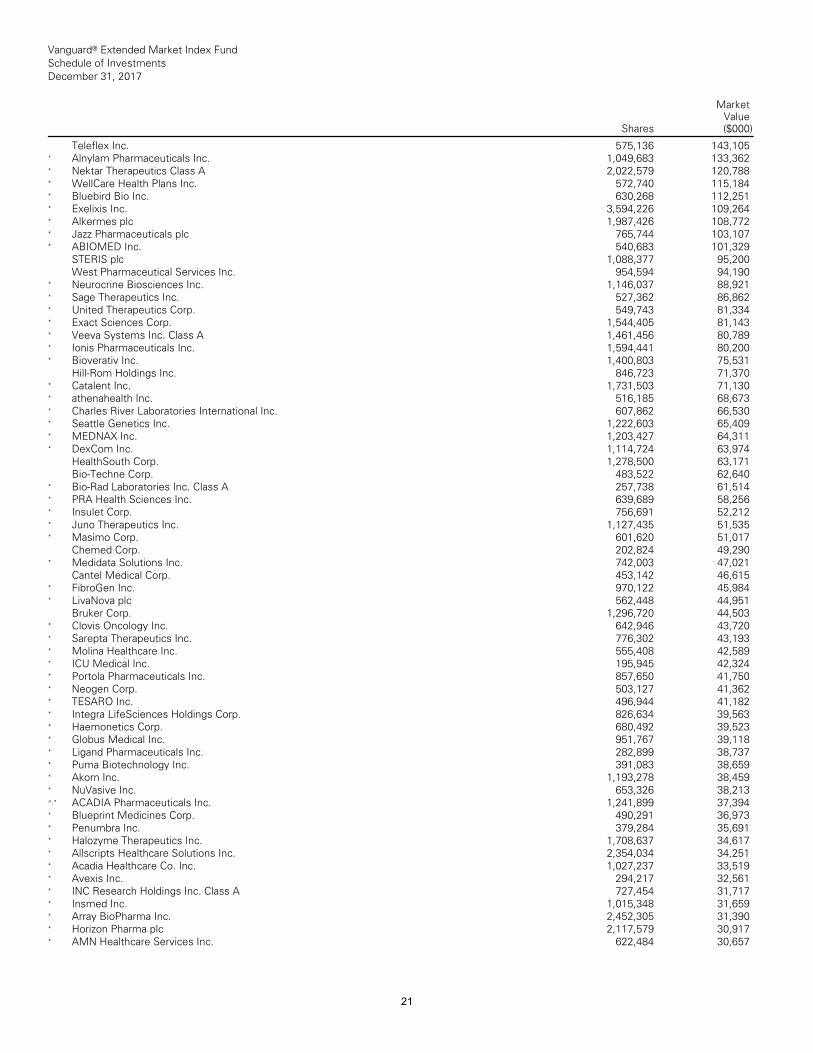
Vanguard® Extended Market Index Fund Schedule of Investments December 31, 2017
Shares
MarketValue($000)
__________________________________________________________________________________________________________________________________________________________________________________________________________________________________________________________________________________________________________________________________________________________________________________________________________________________________________________________________________________________________________________________________________________________________________________________________________________________________________________________________________________________ __________________________________________________________________________________________________________________________________________________________________________________________________________________________________________________________________________________________________________________________________________________________________________________________________________________________________________________________________________________________________________________________________________________________________________________________________________________________________________________________________________________________
Teleflex Inc. 575,136 143,105* Alnylam Pharmaceuticals Inc. 1,049,683 133,362 * Nektar Therapeutics Class A 2,022,579 120,788 * WellCare Health Plans Inc. 572,740 115,184 * Bluebird Bio Inc. 630,268 112,251* Exelixis Inc. 3,594,226 109,264* Alkermes plc 1,987,426 108,772* Jazz Pharmaceuticals plc 765,744 103,107 * ABIOMED Inc. 540,683 101,329
STERIS plc 1,088,377 95,200West Pharmaceutical Services Inc. 954,594 94,190
* Neurocrine Biosciences Inc. 1,146,037 88,921 * Sage Therapeutics Inc. 527,362 86,862* United Therapeutics Corp. 549,743 81,334 * Exact Sciences Corp. 1,544,405 81,143* Veeva Systems Inc. Class A 1,461,456 80,789 * Ionis Pharmaceuticals Inc. 1,594,441 80,200 * Bioverativ Inc. 1,400,803 75,531
Hill-Rom Holdings Inc. 846,723 71,370* Catalent Inc. 1,731,503 71,130* athenahealth Inc. 516,185 68,673* Charles River Laboratories International Inc. 607,862 66,530 * Seattle Genetics Inc. 1,222,603 65,409* MEDNAX Inc. 1,203,427 64,311* DexCom Inc. 1,114,724 63,974
HealthSouth Corp. 1,278,500 63,171Bio-Techne Corp. 483,522 62,640
* Bio-Rad Laboratories Inc. Class A 257,738 61,514 * PRA Health Sciences Inc. 639,689 58,256 * Insulet Corp. 756,691 52,212* Juno Therapeutics Inc. 1,127,435 51,535* Masimo Corp. 601,620 51,017
Chemed Corp. 202,824 49,290* Medidata Solutions Inc. 742,003 47,021
Cantel Medical Corp. 453,142 46,615* FibroGen Inc. 970,122 45,984* LivaNova plc 562,448 44,951
Bruker Corp. 1,296,720 44,503* Clovis Oncology Inc. 642,946 43,720* Sarepta Therapeutics Inc. 776,302 43,193 * Molina Healthcare Inc. 555,408 42,589* ICU Medical Inc. 195,945 42,324* Portola Pharmaceuticals Inc. 857,650 41,750 * Neogen Corp. 503,127 41,362* TESARO Inc. 496,944 41,182* Integra LifeSciences Holdings Corp. 826,634 39,563 * Haemonetics Corp. 680,492 39,523* Globus Medical Inc. 951,767 39,118* Ligand Pharmaceuticals Inc. 282,899 38,737 * Puma Biotechnology Inc. 391,083 38,659 * Akorn Inc. 1,193,278 38,459* NuVasive Inc. 653,326 38,213^,* ACADIA Pharmaceuticals Inc. 1,241,899 37,394 * Blueprint Medicines Corp. 490,291 36,973 * Penumbra Inc. 379,284 35,691* Halozyme Therapeutics Inc. 1,708,637 34,617 * Allscripts Healthcare Solutions Inc. 2,354,034 34,251 * Acadia Healthcare Co. Inc. 1,027,237 33,519 * Avexis Inc. 294,217 32,561* INC Research Holdings Inc. Class A 727,454 31,717 * Insmed Inc. 1,015,348 31,659* Array BioPharma Inc. 2,452,305 31,390* Horizon Pharma plc 2,117,579 30,917* AMN Healthcare Services Inc. 622,484 30,657
21
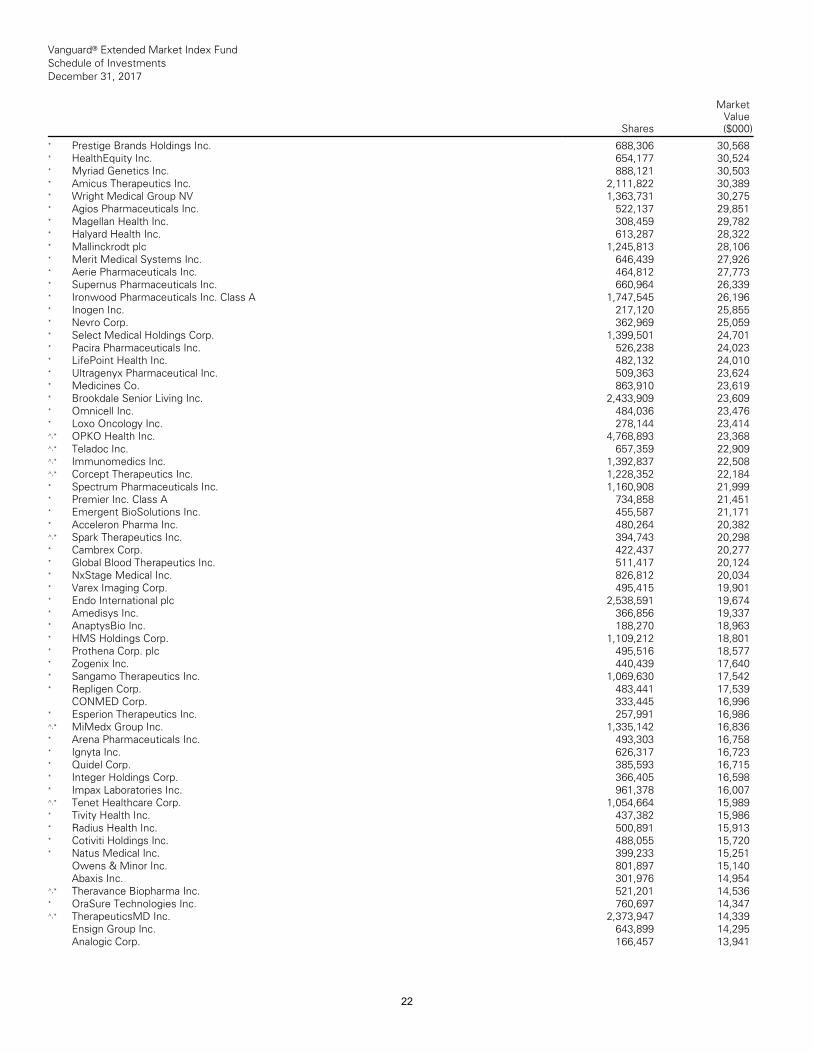
Vanguard® Extended Market Index Fund Schedule of Investments December 31, 2017
Shares
MarketValue($000)
__________________________________________________________________________________________________________________________________________________________________________________________________________________________________________________________________________________________________________________________________________________________________________________________________________________________________________________________________________________________________________________________________________________________________________________________________________________________________________________________________________________________ __________________________________________________________________________________________________________________________________________________________________________________________________________________________________________________________________________________________________________________________________________________________________________________________________________________________________________________________________________________________________________________________________________________________________________________________________________________________________________________________________________________________
* Prestige Brands Holdings Inc. 688,306 30,568 * HealthEquity Inc. 654,177 30,524* Myriad Genetics Inc. 888,121 30,503* Amicus Therapeutics Inc. 2,111,822 30,389 * Wright Medical Group NV 1,363,731 30,275 * Agios Pharmaceuticals Inc. 522,137 29,851 * Magellan Health Inc. 308,459 29,782* Halyard Health Inc. 613,287 28,322* Mallinckrodt plc 1,245,813 28,106* Merit Medical Systems Inc. 646,439 27,926 * Aerie Pharmaceuticals Inc. 464,812 27,773 * Supernus Pharmaceuticals Inc. 660,964 26,339 * Ironwood Pharmaceuticals Inc. Class A 1,747,545 26,196 * Inogen Inc. 217,120 25,855* Nevro Corp. 362,969 25,059* Select Medical Holdings Corp. 1,399,501 24,701 * Pacira Pharmaceuticals Inc. 526,238 24,023 * LifePoint Health Inc. 482,132 24,010* Ultragenyx Pharmaceutical Inc. 509,363 23,624 * Medicines Co. 863,910 23,619* Brookdale Senior Living Inc. 2,433,909 23,609 * Omnicell Inc. 484,036 23,476* Loxo Oncology Inc. 278,144 23,414^,* OPKO Health Inc. 4,768,893 23,368^,* Teladoc Inc. 657,359 22,909^,* Immunomedics Inc. 1,392,837 22,508^,* Corcept Therapeutics Inc. 1,228,352 22,184 * Spectrum Pharmaceuticals Inc. 1,160,908 21,999 * Premier Inc. Class A 734,858 21,451* Emergent BioSolutions Inc. 455,587 21,171 * Acceleron Pharma Inc. 480,264 20,382^,* Spark Therapeutics Inc. 394,743 20,298* Cambrex Corp. 422,437 20,277* Global Blood Therapeutics Inc. 511,417 20,124 * NxStage Medical Inc. 826,812 20,034* Varex Imaging Corp. 495,415 19,901* Endo International plc 2,538,591 19,674* Amedisys Inc. 366,856 19,337* AnaptysBio Inc. 188,270 18,963* HMS Holdings Corp. 1,109,212 18,801* Prothena Corp. plc 495,516 18,577* Zogenix Inc. 440,439 17,640* Sangamo Therapeutics Inc. 1,069,630 17,542 * Repligen Corp. 483,441 17,539
CONMED Corp. 333,445 16,996* Esperion Therapeutics Inc. 257,991 16,986 ^,* MiMedx Group Inc. 1,335,142 16,836* Arena Pharmaceuticals Inc. 493,303 16,758 * Ignyta Inc. 626,317 16,723* Quidel Corp. 385,593 16,715* Integer Holdings Corp. 366,405 16,598* Impax Laboratories Inc. 961,378 16,007^,* Tenet Healthcare Corp. 1,054,664 15,989* Tivity Health Inc. 437,382 15,986* Radius Health Inc. 500,891 15,913* Cotiviti Holdings Inc. 488,055 15,720* Natus Medical Inc. 399,233 15,251
Owens & Minor Inc. 801,897 15,140Abaxis Inc. 301,976 14,954
^,* Theravance Biopharma Inc. 521,201 14,536 * OraSure Technologies Inc. 760,697 14,347 ^,* TherapeuticsMD Inc. 2,373,947 14,339
Ensign Group Inc. 643,899 14,295Analogic Corp. 166,457 13,941
22
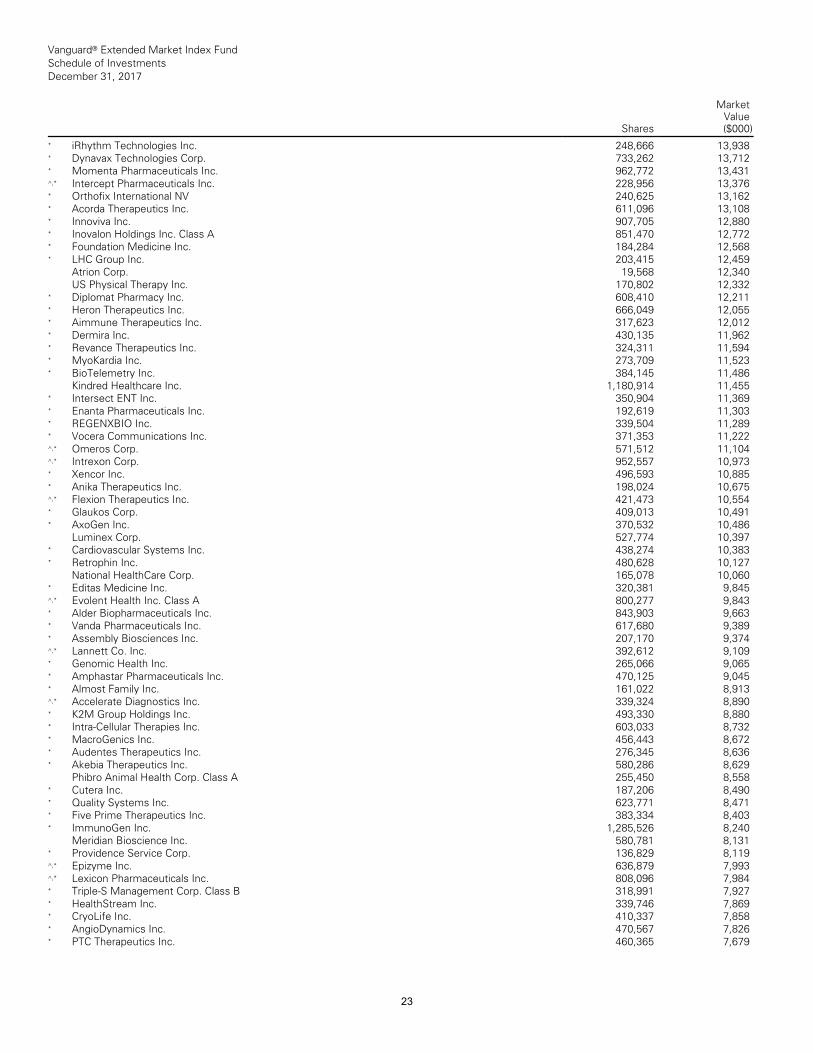
Vanguard® Extended Market Index Fund Schedule of Investments December 31, 2017
Shares
MarketValue($000)
__________________________________________________________________________________________________________________________________________________________________________________________________________________________________________________________________________________________________________________________________________________________________________________________________________________________________________________________________________________________________________________________________________________________________________________________________________________________________________________________________________________________ __________________________________________________________________________________________________________________________________________________________________________________________________________________________________________________________________________________________________________________________________________________________________________________________________________________________________________________________________________________________________________________________________________________________________________________________________________________________________________________________________________________________
* iRhythm Technologies Inc. 248,666 13,938 * Dynavax Technologies Corp. 733,262 13,712 * Momenta Pharmaceuticals Inc. 962,772 13,431 ^,* Intercept Pharmaceuticals Inc. 228,956 13,376 * Orthofix International NV 240,625 13,162 * Acorda Therapeutics Inc. 611,096 13,108 * Innoviva Inc. 907,705 12,880* Inovalon Holdings Inc. Class A 851,470 12,772 * Foundation Medicine Inc. 184,284 12,568 * LHC Group Inc. 203,415 12,459
Atrion Corp. 19,568 12,340US Physical Therapy Inc. 170,802 12,332
* Diplomat Pharmacy Inc. 608,410 12,211* Heron Therapeutics Inc. 666,049 12,055 * Aimmune Therapeutics Inc. 317,623 12,012 * Dermira Inc. 430,135 11,962* Revance Therapeutics Inc. 324,311 11,594 * MyoKardia Inc. 273,709 11,523* BioTelemetry Inc. 384,145 11,486
Kindred Healthcare Inc. 1,180,914 11,455* Intersect ENT Inc. 350,904 11,369* Enanta Pharmaceuticals Inc. 192,619 11,303 * REGENXBIO Inc. 339,504 11,289* Vocera Communications Inc. 371,353 11,222 ^,* Omeros Corp. 571,512 11,104^,* Intrexon Corp. 952,557 10,973* Xencor Inc. 496,593 10,885* Anika Therapeutics Inc. 198,024 10,675^,* Flexion Therapeutics Inc. 421,473 10,554 * Glaukos Corp. 409,013 10,491* AxoGen Inc. 370,532 10,486
Luminex Corp. 527,774 10,397* Cardiovascular Systems Inc. 438,274 10,383 * Retrophin Inc. 480,628 10,127
National HealthCare Corp. 165,078 10,060 * Editas Medicine Inc. 320,381 9,845^,* Evolent Health Inc. Class A 800,277 9,843 * Alder Biopharmaceuticals Inc. 843,903 9,663 * Vanda Pharmaceuticals Inc. 617,680 9,389 * Assembly Biosciences Inc. 207,170 9,374 ^,* Lannett Co. Inc. 392,612 9,109* Genomic Health Inc. 265,066 9,065* Amphastar Pharmaceuticals Inc. 470,125 9,045 * Almost Family Inc. 161,022 8,913^,* Accelerate Diagnostics Inc. 339,324 8,890 * K2M Group Holdings Inc. 493,330 8,880 * Intra-Cellular Therapies Inc. 603,033 8,732 * MacroGenics Inc. 456,443 8,672* Audentes Therapeutics Inc. 276,345 8,636 * Akebia Therapeutics Inc. 580,286 8,629
Phibro Animal Health Corp. Class A 255,450 8,558 * Cutera Inc. 187,206 8,490* Quality Systems Inc. 623,771 8,471* Five Prime Therapeutics Inc. 383,334 8,403 * ImmunoGen Inc. 1,285,526 8,240
Meridian Bioscience Inc. 580,781 8,131 * Providence Service Corp. 136,829 8,119 ^,* Epizyme Inc. 636,879 7,993^,* Lexicon Pharmaceuticals Inc. 808,096 7,984 * Triple-S Management Corp. Class B 318,991 7,927 * HealthStream Inc. 339,746 7,869* CryoLife Inc. 410,337 7,858* AngioDynamics Inc. 470,567 7,826* PTC Therapeutics Inc. 460,365 7,679
23
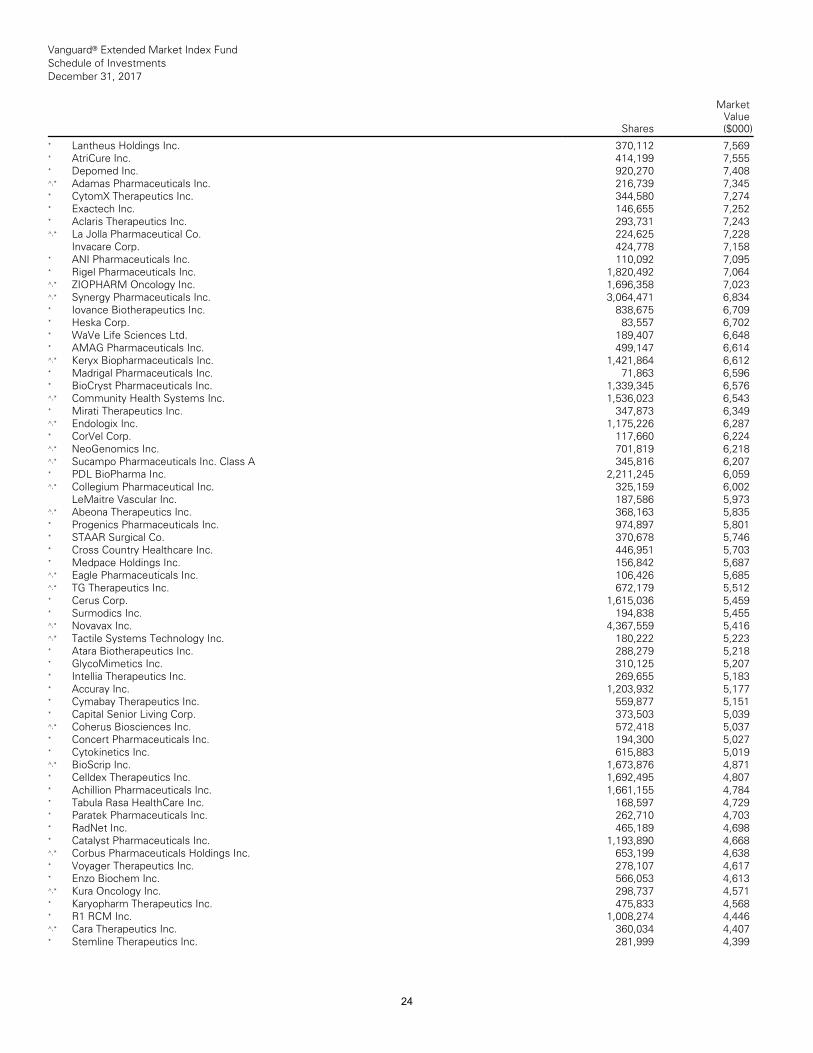
Vanguard® Extended Market Index Fund Schedule of Investments December 31, 2017
Shares
MarketValue($000)
__________________________________________________________________________________________________________________________________________________________________________________________________________________________________________________________________________________________________________________________________________________________________________________________________________________________________________________________________________________________________________________________________________________________________________________________________________________________________________________________________________________________ __________________________________________________________________________________________________________________________________________________________________________________________________________________________________________________________________________________________________________________________________________________________________________________________________________________________________________________________________________________________________________________________________________________________________________________________________________________________________________________________________________________________
* Lantheus Holdings Inc. 370,112 7,569* AtriCure Inc. 414,199 7,555* Depomed Inc. 920,270 7,408^,* Adamas Pharmaceuticals Inc. 216,739 7,345 * CytomX Therapeutics Inc. 344,580 7,274 * Exactech Inc. 146,655 7,252* Aclaris Therapeutics Inc. 293,731 7,243 ^,* La Jolla Pharmaceutical Co. 224,625 7,228
Invacare Corp. 424,778 7,158* ANI Pharmaceuticals Inc. 110,092 7,095 * Rigel Pharmaceuticals Inc. 1,820,492 7,064 ^,* ZIOPHARM Oncology Inc. 1,696,358 7,023 ^,* Synergy Pharmaceuticals Inc. 3,064,471 6,834 * Iovance Biotherapeutics Inc. 838,675 6,709 * Heska Corp. 83,557 6,702* WaVe Life Sciences Ltd. 189,407 6,648 * AMAG Pharmaceuticals Inc. 499,147 6,614 ^,* Keryx Biopharmaceuticals Inc. 1,421,864 6,612* Madrigal Pharmaceuticals Inc. 71,863 6,596 * BioCryst Pharmaceuticals Inc. 1,339,345 6,576 ^,* Community Health Systems Inc. 1,536,023 6,543 * Mirati Therapeutics Inc. 347,873 6,349^,* Endologix Inc. 1,175,226 6,287* CorVel Corp. 117,660 6,224^,* NeoGenomics Inc. 701,819 6,218^,* Sucampo Pharmaceuticals Inc. Class A 345,816 6,207 * PDL BioPharma Inc. 2,211,245 6,059^,* Collegium Pharmaceutical Inc. 325,159 6,002
LeMaitre Vascular Inc. 187,586 5,973^,* Abeona Therapeutics Inc. 368,163 5,835 * Progenics Pharmaceuticals Inc. 974,897 5,801 * STAAR Surgical Co. 370,678 5,746* Cross Country Healthcare Inc. 446,951 5,703 * Medpace Holdings Inc. 156,842 5,687^,* Eagle Pharmaceuticals Inc. 106,426 5,685 ^,* TG Therapeutics Inc. 672,179 5,512* Cerus Corp. 1,615,036 5,459* Surmodics Inc. 194,838 5,455^,* Novavax Inc. 4,367,559 5,416^,* Tactile Systems Technology Inc. 180,222 5,223 * Atara Biotherapeutics Inc. 288,279 5,218 * GlycoMimetics Inc. 310,125 5,207* Intellia Therapeutics Inc. 269,655 5,183 * Accuray Inc. 1,203,932 5,177* Cymabay Therapeutics Inc. 559,877 5,151 * Capital Senior Living Corp. 373,503 5,039 ^,* Coherus Biosciences Inc. 572,418 5,037 * Concert Pharmaceuticals Inc. 194,300 5,027 * Cytokinetics Inc. 615,883 5,019^,* BioScrip Inc. 1,673,876 4,871* Celldex Therapeutics Inc. 1,692,495 4,807 * Achillion Pharmaceuticals Inc. 1,661,155 4,784 * Tabula Rasa HealthCare Inc. 168,597 4,729 * Paratek Pharmaceuticals Inc. 262,710 4,703 * RadNet Inc. 465,189 4,698* Catalyst Pharmaceuticals Inc. 1,193,890 4,668 ^,* Corbus Pharmaceuticals Holdings Inc. 653,199 4,638 * Voyager Therapeutics Inc. 278,107 4,617 * Enzo Biochem Inc. 566,053 4,613^,* Kura Oncology Inc. 298,737 4,571* Karyopharm Therapeutics Inc. 475,833 4,568 * R1 RCM Inc. 1,008,274 4,446^,* Cara Therapeutics Inc. 360,034 4,407* Stemline Therapeutics Inc. 281,999 4,399
24
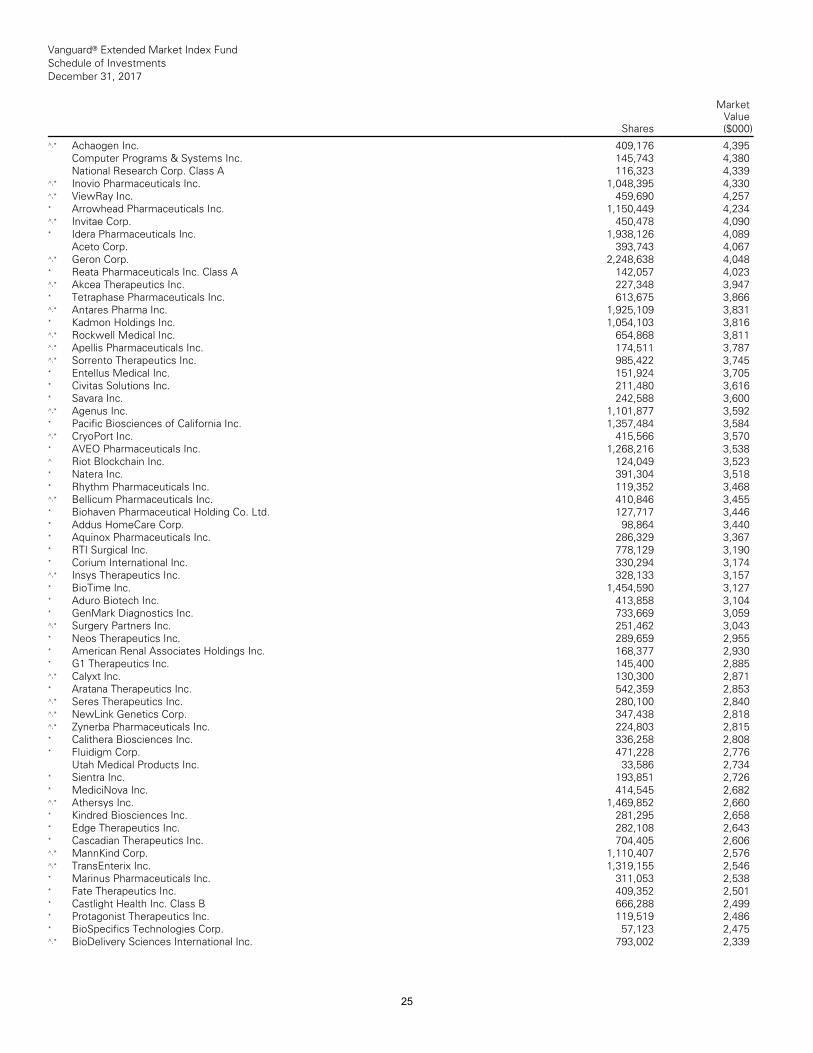
Vanguard® Extended Market Index Fund Schedule of Investments December 31, 2017
Shares
MarketValue($000)
__________________________________________________________________________________________________________________________________________________________________________________________________________________________________________________________________________________________________________________________________________________________________________________________________________________________________________________________________________________________________________________________________________________________________________________________________________________________________________________________________________________________ __________________________________________________________________________________________________________________________________________________________________________________________________________________________________________________________________________________________________________________________________________________________________________________________________________________________________________________________________________________________________________________________________________________________________________________________________________________________________________________________________________________________
^,* Achaogen Inc. 409,176 4,395Computer Programs & Systems Inc. 145,743 4,380 National Research Corp. Class A 116,323 4,339
^,* Inovio Pharmaceuticals Inc. 1,048,395 4,330 ^,* ViewRay Inc. 459,690 4,257* Arrowhead Pharmaceuticals Inc. 1,150,449 4,234 ^,* Invitae Corp. 450,478 4,090* Idera Pharmaceuticals Inc. 1,938,126 4,089
Aceto Corp. 393,743 4,067^,* Geron Corp. 2,248,638 4,048* Reata Pharmaceuticals Inc. Class A 142,057 4,023 ^,* Akcea Therapeutics Inc. 227,348 3,947 * Tetraphase Pharmaceuticals Inc. 613,675 3,866 ^,* Antares Pharma Inc. 1,925,109 3,831* Kadmon Holdings Inc. 1,054,103 3,816^,* Rockwell Medical Inc. 654,868 3,811^,* Apellis Pharmaceuticals Inc. 174,511 3,787 ^,* Sorrento Therapeutics Inc. 985,422 3,745 * Entellus Medical Inc. 151,924 3,705* Civitas Solutions Inc. 211,480 3,616* Savara Inc. 242,588 3,600^,* Agenus Inc. 1,101,877 3,592* Pacific Biosciences of California Inc. 1,357,484 3,584 ^,* CryoPort Inc. 415,566 3,570* AVEO Pharmaceuticals Inc. 1,268,216 3,538 ^ Riot Blockchain Inc. 124,049 3,523* Natera Inc. 391,304 3,518* Rhythm Pharmaceuticals Inc. 119,352 3,468 ^,* Bellicum Pharmaceuticals Inc. 410,846 3,455 * Biohaven Pharmaceutical Holding Co. Ltd. 127,717 3,446 * Addus HomeCare Corp. 98,864 3,440 * Aquinox Pharmaceuticals Inc. 286,329 3,367 * RTI Surgical Inc. 778,129 3,190* Corium International Inc. 330,294 3,174 ^,* Insys Therapeutics Inc. 328,133 3,157* BioTime Inc. 1,454,590 3,127* Aduro Biotech Inc. 413,858 3,104* GenMark Diagnostics Inc. 733,669 3,059 ^,* Surgery Partners Inc. 251,462 3,043* Neos Therapeutics Inc. 289,659 2,955* American Renal Associates Holdings Inc. 168,377 2,930 * G1 Therapeutics Inc. 145,400 2,885^,* Calyxt Inc. 130,300 2,871* Aratana Therapeutics Inc. 542,359 2,853 ^,* Seres Therapeutics Inc. 280,100 2,840^,* NewLink Genetics Corp. 347,438 2,818 ^,* Zynerba Pharmaceuticals Inc. 224,803 2,815 * Calithera Biosciences Inc. 336,258 2,808 * Fluidigm Corp. 471,228 2,776
Utah Medical Products Inc. 33,586 2,734 * Sientra Inc. 193,851 2,726* MediciNova Inc. 414,545 2,682^,* Athersys Inc. 1,469,852 2,660* Kindred Biosciences Inc. 281,295 2,658 * Edge Therapeutics Inc. 282,108 2,643* Cascadian Therapeutics Inc. 704,405 2,606 ^,* MannKind Corp. 1,110,407 2,576^,* TransEnterix Inc. 1,319,155 2,546* Marinus Pharmaceuticals Inc. 311,053 2,538 * Fate Therapeutics Inc. 409,352 2,501* Castlight Health Inc. Class B 666,288 2,499 * Protagonist Therapeutics Inc. 119,519 2,486 * BioSpecifics Technologies Corp. 57,123 2,475 ^,* BioDelivery Sciences International Inc. 793,002 2,339
25
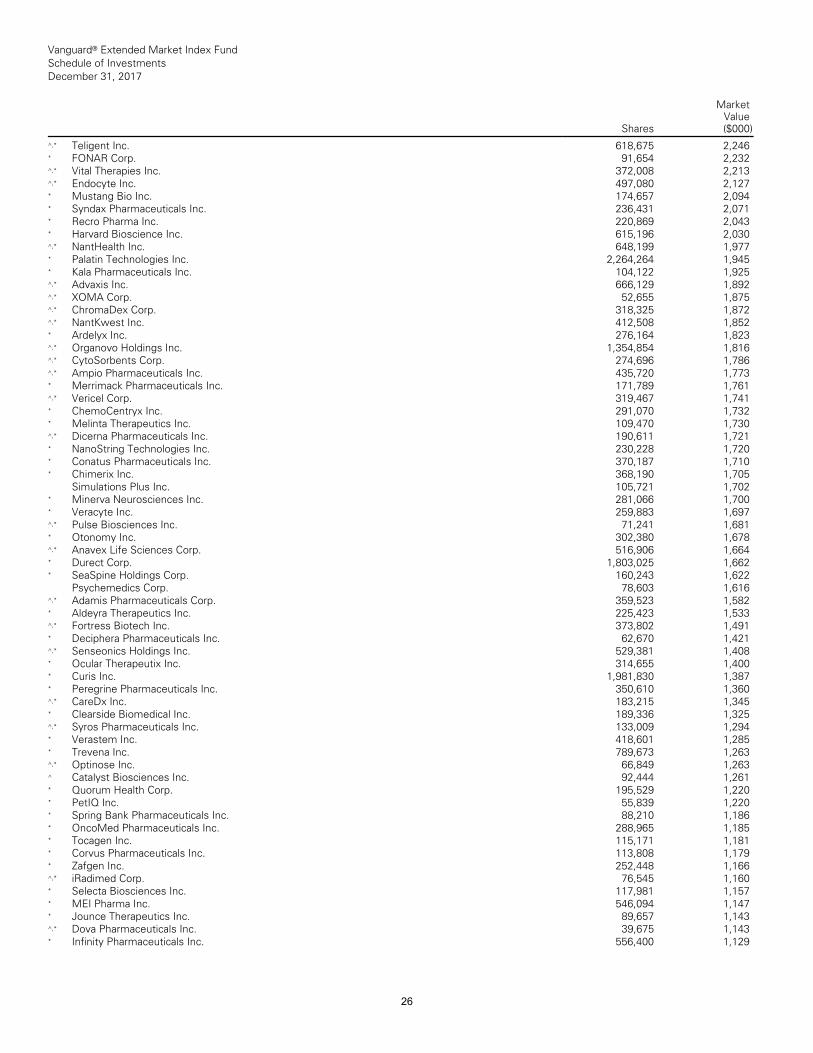
Vanguard® Extended Market Index Fund Schedule of Investments December 31, 2017
Shares
MarketValue($000)
__________________________________________________________________________________________________________________________________________________________________________________________________________________________________________________________________________________________________________________________________________________________________________________________________________________________________________________________________________________________________________________________________________________________________________________________________________________________________________________________________________________________ __________________________________________________________________________________________________________________________________________________________________________________________________________________________________________________________________________________________________________________________________________________________________________________________________________________________________________________________________________________________________________________________________________________________________________________________________________________________________________________________________________________________
^,* Teligent Inc. 618,675 2,246* FONAR Corp. 91,654 2,232^,* Vital Therapies Inc. 372,008 2,213^,* Endocyte Inc. 497,080 2,127* Mustang Bio Inc. 174,657 2,094* Syndax Pharmaceuticals Inc. 236,431 2,071 * Recro Pharma Inc. 220,869 2,043* Harvard Bioscience Inc. 615,196 2,030^,* NantHealth Inc. 648,199 1,977* Palatin Technologies Inc. 2,264,264 1,945 * Kala Pharmaceuticals Inc. 104,122 1,925 ^,* Advaxis Inc. 666,129 1,892^,* XOMA Corp. 52,655 1,875^,* ChromaDex Corp. 318,325 1,872^,* NantKwest Inc. 412,508 1,852* Ardelyx Inc. 276,164 1,823^,* Organovo Holdings Inc. 1,354,854 1,816^,* CytoSorbents Corp. 274,696 1,786^,* Ampio Pharmaceuticals Inc. 435,720 1,773* Merrimack Pharmaceuticals Inc. 171,789 1,761 ^,* Vericel Corp. 319,467 1,741* ChemoCentryx Inc. 291,070 1,732* Melinta Therapeutics Inc. 109,470 1,730 ^,* Dicerna Pharmaceuticals Inc. 190,611 1,721 * NanoString Technologies Inc. 230,228 1,720 * Conatus Pharmaceuticals Inc. 370,187 1,710 * Chimerix Inc. 368,190 1,705
Simulations Plus Inc. 105,721 1,702* Minerva Neurosciences Inc. 281,066 1,700 * Veracyte Inc. 259,883 1,697^,* Pulse Biosciences Inc. 71,241 1,681* Otonomy Inc. 302,380 1,678^,* Anavex Life Sciences Corp. 516,906 1,664 * Durect Corp. 1,803,025 1,662* SeaSpine Holdings Corp. 160,243 1,622
Psychemedics Corp. 78,603 1,616^,* Adamis Pharmaceuticals Corp. 359,523 1,582 * Aldeyra Therapeutics Inc. 225,423 1,533 ^,* Fortress Biotech Inc. 373,802 1,491* Deciphera Pharmaceuticals Inc. 62,670 1,421 ^,* Senseonics Holdings Inc. 529,381 1,408 * Ocular Therapeutix Inc. 314,655 1,400* Curis Inc. 1,981,830 1,387* Peregrine Pharmaceuticals Inc. 350,610 1,360 ^,* CareDx Inc. 183,215 1,345* Clearside Biomedical Inc. 189,336 1,325 ^,* Syros Pharmaceuticals Inc. 133,009 1,294 * Verastem Inc. 418,601 1,285* Trevena Inc. 789,673 1,263^,* Optinose Inc. 66,849 1,263^ Catalyst Biosciences Inc. 92,444 1,261 * Quorum Health Corp. 195,529 1,220* PetIQ Inc. 55,839 1,220* Spring Bank Pharmaceuticals Inc. 88,210 1,186 * OncoMed Pharmaceuticals Inc. 288,965 1,185 * Tocagen Inc. 115,171 1,181* Corvus Pharmaceuticals Inc. 113,808 1,179 * Zafgen Inc. 252,448 1,166^,* iRadimed Corp. 76,545 1,160* Selecta Biosciences Inc. 117,981 1,157 * MEI Pharma Inc. 546,094 1,147* Jounce Therapeutics Inc. 89,657 1,143 ^,* Dova Pharmaceuticals Inc. 39,675 1,143 * Infinity Pharmaceuticals Inc. 556,400 1,129
26
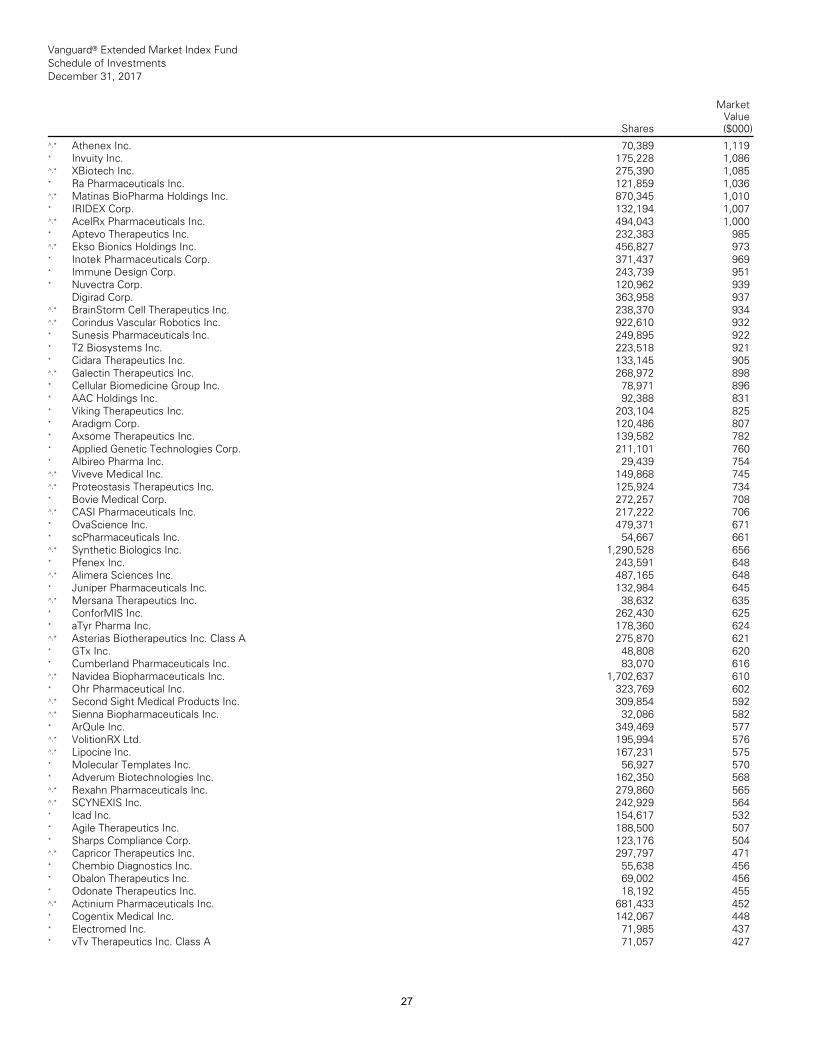
Vanguard® Extended Market Index Fund Schedule of Investments December 31, 2017
Shares
MarketValue($000)
__________________________________________________________________________________________________________________________________________________________________________________________________________________________________________________________________________________________________________________________________________________________________________________________________________________________________________________________________________________________________________________________________________________________________________________________________________________________________________________________________________________________ __________________________________________________________________________________________________________________________________________________________________________________________________________________________________________________________________________________________________________________________________________________________________________________________________________________________________________________________________________________________________________________________________________________________________________________________________________________________________________________________________________________________
^,* Athenex Inc. 70,389 1,119* Invuity Inc. 175,228 1,086^,* XBiotech Inc. 275,390 1,085* Ra Pharmaceuticals Inc. 121,859 1,036 ^,* Matinas BioPharma Holdings Inc. 870,345 1,010 * IRIDEX Corp. 132,194 1,007^,* AcelRx Pharmaceuticals Inc. 494,043 1,000 * Aptevo Therapeutics Inc. 232,383 985 ^,* Ekso Bionics Holdings Inc. 456,827 973 * Inotek Pharmaceuticals Corp. 371,437 969 * Immune Design Corp. 243,739 951* Nuvectra Corp. 120,962 939
Digirad Corp. 363,958 937^,* BrainStorm Cell Therapeutics Inc. 238,370 934 ^,* Corindus Vascular Robotics Inc. 922,610 932 * Sunesis Pharmaceuticals Inc. 249,895 922 * T2 Biosystems Inc. 223,518 921* Cidara Therapeutics Inc. 133,145 905 ^,* Galectin Therapeutics Inc. 268,972 898 * Cellular Biomedicine Group Inc. 78,971 896 * AAC Holdings Inc. 92,388 831* Viking Therapeutics Inc. 203,104 825* Aradigm Corp. 120,486 807* Axsome Therapeutics Inc. 139,582 782 * Applied Genetic Technologies Corp. 211,101 760 * Albireo Pharma Inc. 29,439 754^,* Viveve Medical Inc. 149,868 745^,* Proteostasis Therapeutics Inc. 125,924 734 * Bovie Medical Corp. 272,257 708^,* CASI Pharmaceuticals Inc. 217,222 706 * OvaScience Inc. 479,371 671* scPharmaceuticals Inc. 54,667 661^,* Synthetic Biologics Inc. 1,290,528 656* Pfenex Inc. 243,591 648^,* Alimera Sciences Inc. 487,165 648* Juniper Pharmaceuticals Inc. 132,984 645 ^,* Mersana Therapeutics Inc. 38,632 635 * ConforMIS Inc. 262,430 625* aTyr Pharma Inc. 178,360 624^,* Asterias Biotherapeutics Inc. Class A 275,870 621 * GTx Inc. 48,808 620* Cumberland Pharmaceuticals Inc. 83,070 616 ^,* Navidea Biopharmaceuticals Inc. 1,702,637 610 * Ohr Pharmaceutical Inc. 323,769 602 ^,* Second Sight Medical Products Inc. 309,854 592 ^,* Sienna Biopharmaceuticals Inc. 32,086 582 * ArQule Inc. 349,469 577^,* VolitionRX Ltd. 195,994 576^,* Lipocine Inc. 167,231 575* Molecular Templates Inc. 56,927 570 * Adverum Biotechnologies Inc. 162,350 568 ^,* Rexahn Pharmaceuticals Inc. 279,860 565 ^,* SCYNEXIS Inc. 242,929 564* Icad Inc. 154,617 532* Agile Therapeutics Inc. 188,500 507* Sharps Compliance Corp. 123,176 504 ^,* Capricor Therapeutics Inc. 297,797 471 * Chembio Diagnostics Inc. 55,638 456 * Obalon Therapeutics Inc. 69,002 456 * Odonate Therapeutics Inc. 18,192 455 ^,* Actinium Pharmaceuticals Inc. 681,433 452 * Cogentix Medical Inc. 142,067 448* Electromed Inc. 71,985 437* vTv Therapeutics Inc. Class A 71,057 427
27
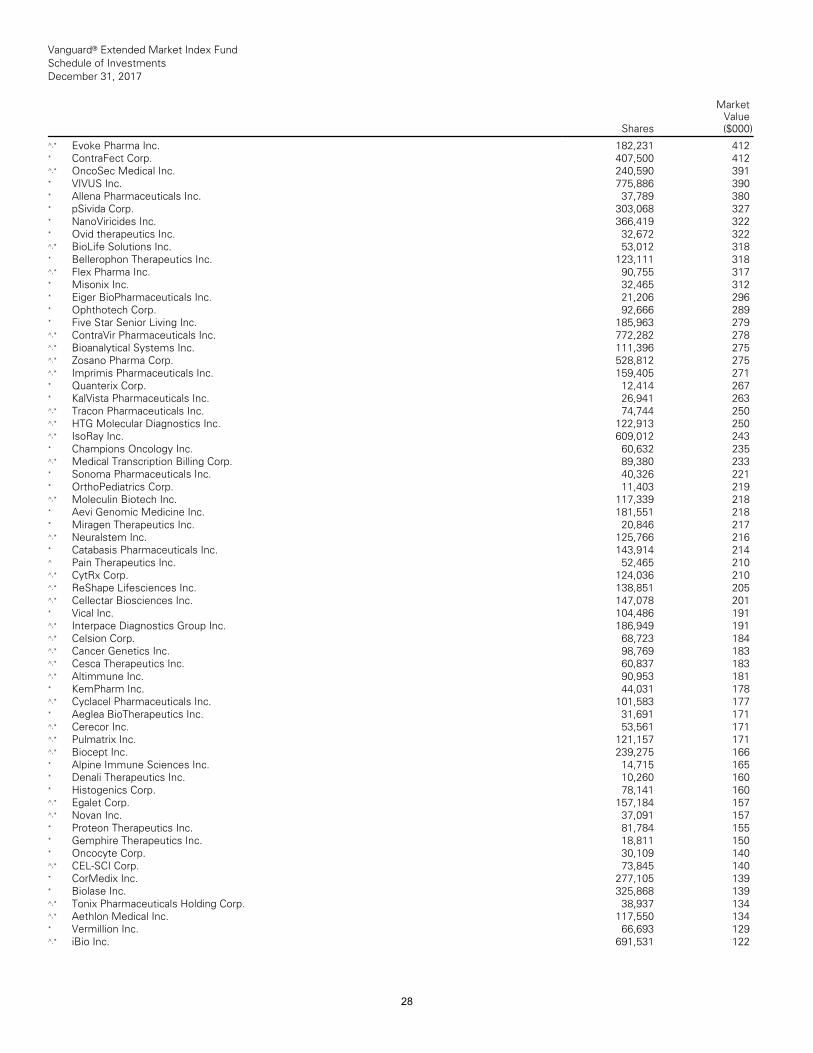
Vanguard® Extended Market Index Fund Schedule of Investments December 31, 2017
Shares
MarketValue($000)
__________________________________________________________________________________________________________________________________________________________________________________________________________________________________________________________________________________________________________________________________________________________________________________________________________________________________________________________________________________________________________________________________________________________________________________________________________________________________________________________________________________________ __________________________________________________________________________________________________________________________________________________________________________________________________________________________________________________________________________________________________________________________________________________________________________________________________________________________________________________________________________________________________________________________________________________________________________________________________________________________________________________________________________________________
^,* Evoke Pharma Inc. 182,231 412* ContraFect Corp. 407,500 412^,* OncoSec Medical Inc. 240,590 391* VIVUS Inc. 775,886 390* Allena Pharmaceuticals Inc. 37,789 380 * pSivida Corp. 303,068 327* NanoViricides Inc. 366,419 322* Ovid therapeutics Inc. 32,672 322^,* BioLife Solutions Inc. 53,012 318* Bellerophon Therapeutics Inc. 123,111 318 ^,* Flex Pharma Inc. 90,755 317* Misonix Inc. 32,465 312* Eiger BioPharmaceuticals Inc. 21,206 296 * Ophthotech Corp. 92,666 289* Five Star Senior Living Inc. 185,963 279 ^,* ContraVir Pharmaceuticals Inc. 772,282 278 ^,* Bioanalytical Systems Inc. 111,396 275 ^,* Zosano Pharma Corp. 528,812 275^,* Imprimis Pharmaceuticals Inc. 159,405 271 * Quanterix Corp. 12,414 267* KalVista Pharmaceuticals Inc. 26,941 263 ^,* Tracon Pharmaceuticals Inc. 74,744 250 ^,* HTG Molecular Diagnostics Inc. 122,913 250 ^,* IsoRay Inc. 609,012 243* Champions Oncology Inc. 60,632 235 ^,* Medical Transcription Billing Corp. 89,380 233 * Sonoma Pharmaceuticals Inc. 40,326 221 * OrthoPediatrics Corp. 11,403 219^,* Moleculin Biotech Inc. 117,339 218* Aevi Genomic Medicine Inc. 181,551 218 * Miragen Therapeutics Inc. 20,846 217 ^,* Neuralstem Inc. 125,766 216* Catabasis Pharmaceuticals Inc. 143,914 214 ^ Pain Therapeutics Inc. 52,465 210^,* CytRx Corp. 124,036 210^,* ReShape Lifesciences Inc. 138,851 205 ^,* Cellectar Biosciences Inc. 147,078 201 * Vical Inc. 104,486 191^,* Interpace Diagnostics Group Inc. 186,949 191 ^,* Celsion Corp. 68,723 184^,* Cancer Genetics Inc. 98,769 183^,* Cesca Therapeutics Inc. 60,837 183 ^,* Altimmune Inc. 90,953 181* KemPharm Inc. 44,031 178^,* Cyclacel Pharmaceuticals Inc. 101,583 177 * Aeglea BioTherapeutics Inc. 31,691 171 ^,* Cerecor Inc. 53,561 171^,* Pulmatrix Inc. 121,157 171^,* Biocept Inc. 239,275 166* Alpine Immune Sciences Inc. 14,715 165 * Denali Therapeutics Inc. 10,260 160 * Histogenics Corp. 78,141 160^,* Egalet Corp. 157,184 157^,* Novan Inc. 37,091 157* Proteon Therapeutics Inc. 81,784 155 * Gemphire Therapeutics Inc. 18,811 150 * Oncocyte Corp. 30,109 140^,* CEL-SCI Corp. 73,845 140* CorMedix Inc. 277,105 139* Biolase Inc. 325,868 139^,* Tonix Pharmaceuticals Holding Corp. 38,937 134 ^,* Aethlon Medical Inc. 117,550 134* Vermillion Inc. 66,693 129^,* iBio Inc. 691,531 122
28
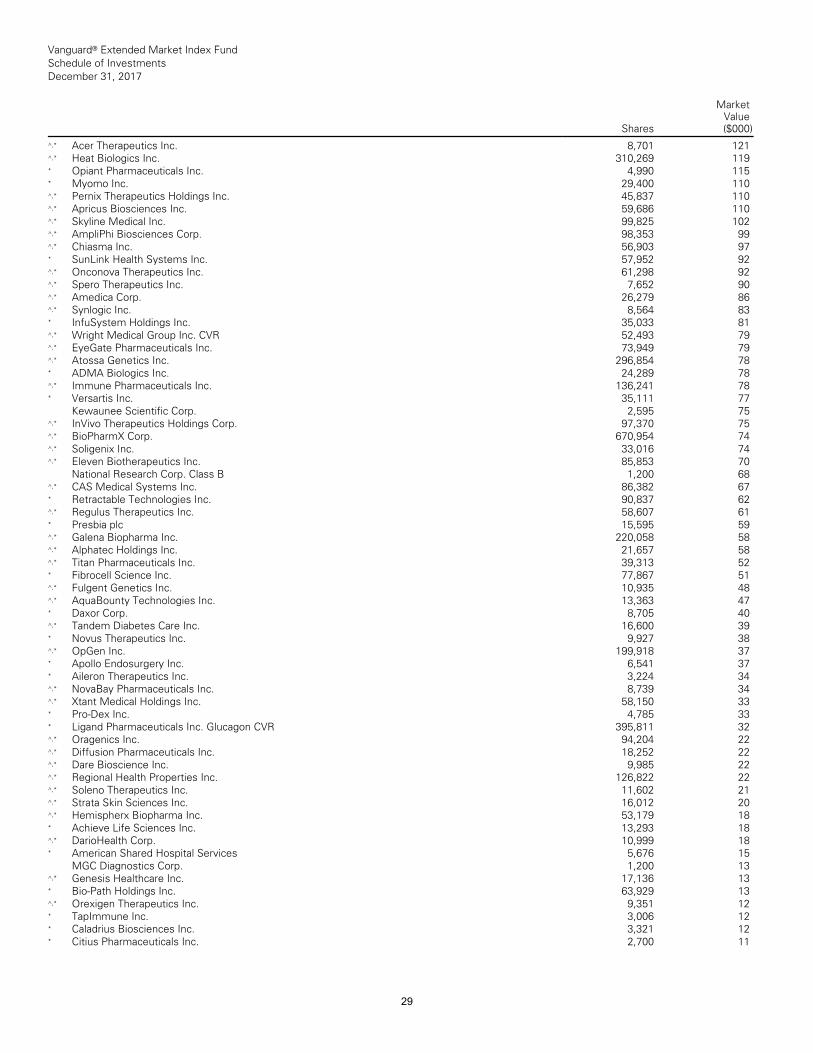
Vanguard® Extended Market Index Fund Schedule of Investments December 31, 2017
Shares
MarketValue($000)
__________________________________________________________________________________________________________________________________________________________________________________________________________________________________________________________________________________________________________________________________________________________________________________________________________________________________________________________________________________________________________________________________________________________________________________________________________________________________________________________________________________________ __________________________________________________________________________________________________________________________________________________________________________________________________________________________________________________________________________________________________________________________________________________________________________________________________________________________________________________________________________________________________________________________________________________________________________________________________________________________________________________________________________________________
^,* Acer Therapeutics Inc. 8,701 121^,* Heat Biologics Inc. 310,269 119* Opiant Pharmaceuticals Inc. 4,990 115 * Myomo Inc. 29,400 110^,* Pernix Therapeutics Holdings Inc. 45,837 110 ^,* Apricus Biosciences Inc. 59,686 110 ^,* Skyline Medical Inc. 99,825 102^,* AmpliPhi Biosciences Corp. 98,353 99 ^,* Chiasma Inc. 56,903 97* SunLink Health Systems Inc. 57,952 92 ^,* Onconova Therapeutics Inc. 61,298 92 ^,* Spero Therapeutics Inc. 7,652 90^,* Amedica Corp. 26,279 86^,* Synlogic Inc. 8,564 83* InfuSystem Holdings Inc. 35,033 81 ^,* Wright Medical Group Inc. CVR 52,493 79 ^,* EyeGate Pharmaceuticals Inc. 73,949 79 ^,* Atossa Genetics Inc. 296,854 78* ADMA Biologics Inc. 24,289 78^,* Immune Pharmaceuticals Inc. 136,241 78 * Versartis Inc. 35,111 77
Kewaunee Scientific Corp. 2,595 75 ^,* InVivo Therapeutics Holdings Corp. 97,370 75 ^,* BioPharmX Corp. 670,954 74^,* Soligenix Inc. 33,016 74^,* Eleven Biotherapeutics Inc. 85,853 70
National Research Corp. Class B 1,200 68 ^,* CAS Medical Systems Inc. 86,382 67 * Retractable Technologies Inc. 90,837 62 ^,* Regulus Therapeutics Inc. 58,607 61 * Presbia plc 15,595 59^,* Galena Biopharma Inc. 220,058 58^,* Alphatec Holdings Inc. 21,657 58^,* Titan Pharmaceuticals Inc. 39,313 52 * Fibrocell Science Inc. 77,867 51^,* Fulgent Genetics Inc. 10,935 48^,* AquaBounty Technologies Inc. 13,363 47 * Daxor Corp. 8,705 40^,* Tandem Diabetes Care Inc. 16,600 39 * Novus Therapeutics Inc. 9,927 38 ^,* OpGen Inc. 199,918 37* Apollo Endosurgery Inc. 6,541 37 * Aileron Therapeutics Inc. 3,224 34 ^,* NovaBay Pharmaceuticals Inc. 8,739 34 ^,* Xtant Medical Holdings Inc. 58,150 33 * Pro-Dex Inc. 4,785 33* Ligand Pharmaceuticals Inc. Glucagon CVR 395,811 32 ^,* Oragenics Inc. 94,204 22^,* Diffusion Pharmaceuticals Inc. 18,252 22 ^,* Dare Bioscience Inc. 9,985 22^,* Regional Health Properties Inc. 126,822 22 ^,* Soleno Therapeutics Inc. 11,602 21 ^,* Strata Skin Sciences Inc. 16,012 20 ^,* Hemispherx Biopharma Inc. 53,179 18 * Achieve Life Sciences Inc. 13,293 18 ^,* DarioHealth Corp. 10,999 18* American Shared Hospital Services 5,676 15
MGC Diagnostics Corp. 1,200 13^,* Genesis Healthcare Inc. 17,136 13* Bio-Path Holdings Inc. 63,929 13^,* Orexigen Therapeutics Inc. 9,351 12 * TapImmune Inc. 3,006 12* Caladrius Biosciences Inc. 3,321 12 * Citius Pharmaceuticals Inc. 2,700 11
29
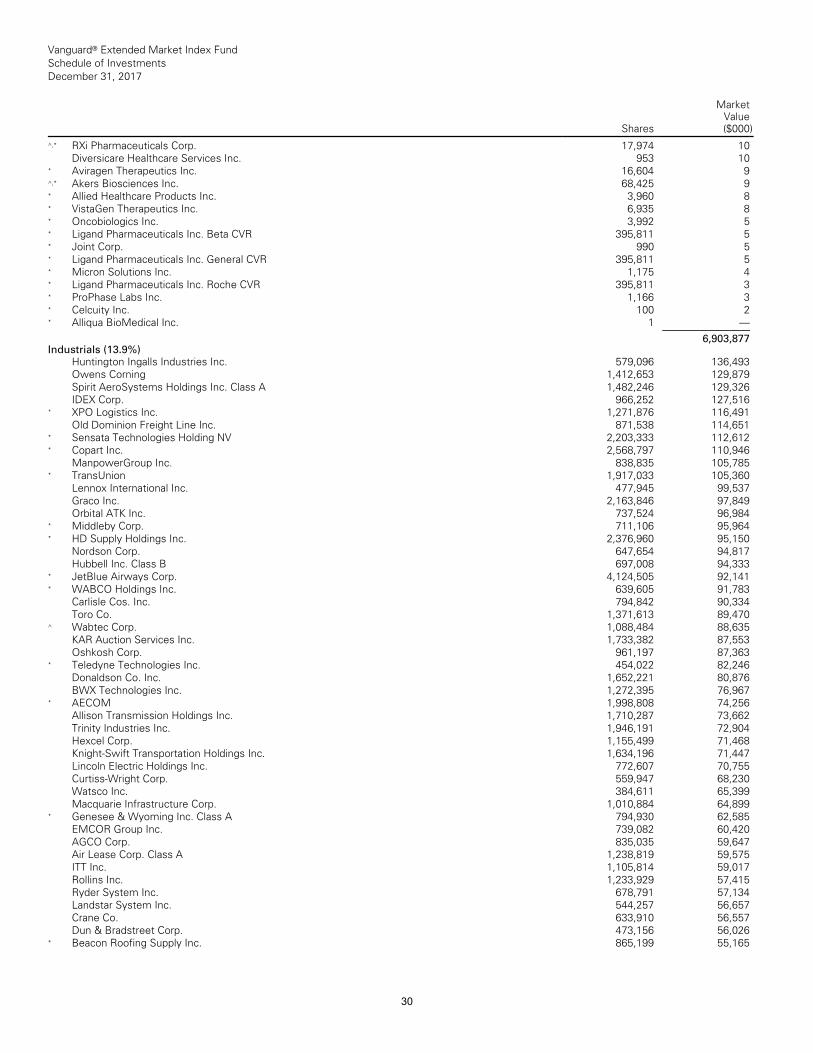
Vanguard® Extended Market Index Fund Schedule of Investments December 31, 2017
Shares
MarketValue($000)
__________________________________________________________________________________________________________________________________________________________________________________________________________________________________________________________________________________________________________________________________________________________________________________________________________________________________________________________________________________________________________________________________________________________________________________________________________________________________________________________________________________________ __________________________________________________________________________________________________________________________________________________________________________________________________________________________________________________________________________________________________________________________________________________________________________________________________________________________________________________________________________________________________________________________________________________________________________________________________________________________________________________________________________________________
^,* RXi Pharmaceuticals Corp. 17,974 10 Diversicare Healthcare Services Inc. 953 10
* Aviragen Therapeutics Inc. 16,604 9 ^,* Akers Biosciences Inc. 68,425 9* Allied Healthcare Products Inc. 3,960 8 * VistaGen Therapeutics Inc. 6,935 8 * Oncobiologics Inc. 3,992 5* Ligand Pharmaceuticals Inc. Beta CVR 395,811 5 * Joint Corp. 990 5* Ligand Pharmaceuticals Inc. General CVR 395,811 5 * Micron Solutions Inc. 1,175 4* Ligand Pharmaceuticals Inc. Roche CVR 395,811 3 * ProPhase Labs Inc. 1,166 3* Celcuity Inc. 100 2* Alliqua BioMedical Inc. 1 —___________
6,903,877 Industrials (13.9%)
Huntington Ingalls Industries Inc. 579,096 136,493 Owens Corning 1,412,653 129,879Spirit AeroSystems Holdings Inc. Class A 1,482,246 129,326 IDEX Corp. 966,252 127,516
* XPO Logistics Inc. 1,271,876 116,491Old Dominion Freight Line Inc. 871,538 114,651
* Sensata Technologies Holding NV 2,203,333 112,612 * Copart Inc. 2,568,797 110,946
ManpowerGroup Inc. 838,835 105,785* TransUnion 1,917,033 105,360
Lennox International Inc. 477,945 99,537 Graco Inc. 2,163,846 97,849Orbital ATK Inc. 737,524 96,984
* Middleby Corp. 711,106 95,964* HD Supply Holdings Inc. 2,376,960 95,150
Nordson Corp. 647,654 94,817Hubbell Inc. Class B 697,008 94,333
* JetBlue Airways Corp. 4,124,505 92,141* WABCO Holdings Inc. 639,605 91,783
Carlisle Cos. Inc. 794,842 90,334Toro Co. 1,371,613 89,470
^ Wabtec Corp. 1,088,484 88,635KAR Auction Services Inc. 1,733,382 87,553 Oshkosh Corp. 961,197 87,363
* Teledyne Technologies Inc. 454,022 82,246 Donaldson Co. Inc. 1,652,221 80,876BWX Technologies Inc. 1,272,395 76,967
* AECOM 1,998,808 74,256Allison Transmission Holdings Inc. 1,710,287 73,662 Trinity Industries Inc. 1,946,191 72,904Hexcel Corp. 1,155,499 71,468Knight-Swift Transportation Holdings Inc. 1,634,196 71,447 Lincoln Electric Holdings Inc. 772,607 70,755 Curtiss-Wright Corp. 559,947 68,230Watsco Inc. 384,611 65,399Macquarie Infrastructure Corp. 1,010,884 64,899
* Genesee & Wyoming Inc. Class A 794,930 62,585 EMCOR Group Inc. 739,082 60,420AGCO Corp. 835,035 59,647Air Lease Corp. Class A 1,238,819 59,575ITT Inc. 1,105,814 59,017Rollins Inc. 1,233,929 57,415Ryder System Inc. 678,791 57,134Landstar System Inc. 544,257 56,657Crane Co. 633,910 56,557Dun & Bradstreet Corp. 473,156 56,026
* Beacon Roofing Supply Inc. 865,199 55,165
30
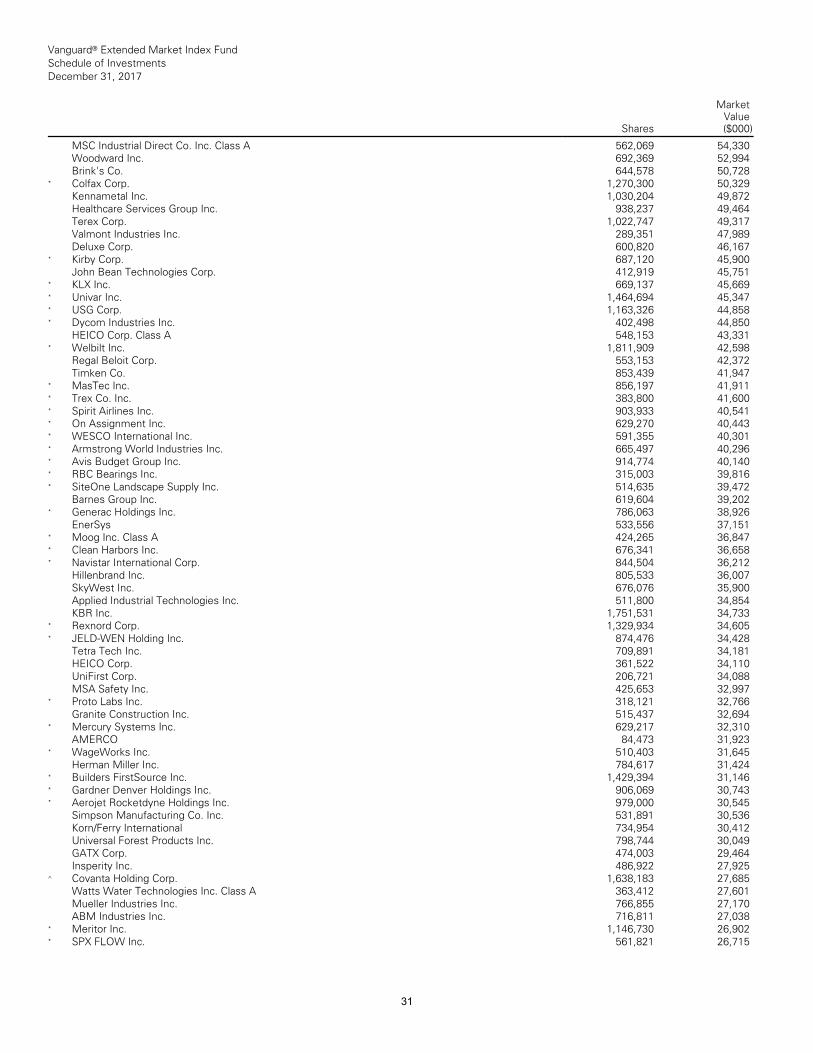
Vanguard® Extended Market Index Fund Schedule of Investments December 31, 2017
Shares
MarketValue($000)
__________________________________________________________________________________________________________________________________________________________________________________________________________________________________________________________________________________________________________________________________________________________________________________________________________________________________________________________________________________________________________________________________________________________________________________________________________________________________________________________________________________________ __________________________________________________________________________________________________________________________________________________________________________________________________________________________________________________________________________________________________________________________________________________________________________________________________________________________________________________________________________________________________________________________________________________________________________________________________________________________________________________________________________________________
MSC Industrial Direct Co. Inc. Class A 562,069 54,330 Woodward Inc. 692,369 52,994Brink's Co. 644,578 50,728
* Colfax Corp. 1,270,300 50,329Kennametal Inc. 1,030,204 49,872Healthcare Services Group Inc. 938,237 49,464 Terex Corp. 1,022,747 49,317Valmont Industries Inc. 289,351 47,989Deluxe Corp. 600,820 46,167
* Kirby Corp. 687,120 45,900John Bean Technologies Corp. 412,919 45,751
* KLX Inc. 669,137 45,669* Univar Inc. 1,464,694 45,347* USG Corp. 1,163,326 44,858* Dycom Industries Inc. 402,498 44,850
HEICO Corp. Class A 548,153 43,331* Welbilt Inc. 1,811,909 42,598
Regal Beloit Corp. 553,153 42,372Timken Co. 853,439 41,947
* MasTec Inc. 856,197 41,911* Trex Co. Inc. 383,800 41,600* Spirit Airlines Inc. 903,933 40,541* On Assignment Inc. 629,270 40,443* WESCO International Inc. 591,355 40,301 * Armstrong World Industries Inc. 665,497 40,296 * Avis Budget Group Inc. 914,774 40,140* RBC Bearings Inc. 315,003 39,816* SiteOne Landscape Supply Inc. 514,635 39,472
Barnes Group Inc. 619,604 39,202* Generac Holdings Inc. 786,063 38,926
EnerSys 533,556 37,151* Moog Inc. Class A 424,265 36,847* Clean Harbors Inc. 676,341 36,658* Navistar International Corp. 844,504 36,212
Hillenbrand Inc. 805,533 36,007SkyWest Inc. 676,076 35,900Applied Industrial Technologies Inc. 511,800 34,854 KBR Inc. 1,751,531 34,733
* Rexnord Corp. 1,329,934 34,605* JELD-WEN Holding Inc. 874,476 34,428
Tetra Tech Inc. 709,891 34,181HEICO Corp. 361,522 34,110UniFirst Corp. 206,721 34,088MSA Safety Inc. 425,653 32,997
* Proto Labs Inc. 318,121 32,766Granite Construction Inc. 515,437 32,694
* Mercury Systems Inc. 629,217 32,310AMERCO 84,473 31,923
* WageWorks Inc. 510,403 31,645Herman Miller Inc. 784,617 31,424
* Builders FirstSource Inc. 1,429,394 31,146 * Gardner Denver Holdings Inc. 906,069 30,743 * Aerojet Rocketdyne Holdings Inc. 979,000 30,545
Simpson Manufacturing Co. Inc. 531,891 30,536 Korn/Ferry International 734,954 30,412Universal Forest Products Inc. 798,744 30,049 GATX Corp. 474,003 29,464Insperity Inc. 486,922 27,925
^ Covanta Holding Corp. 1,638,183 27,685Watts Water Technologies Inc. Class A 363,412 27,601 Mueller Industries Inc. 766,855 27,170ABM Industries Inc. 716,811 27,038
* Meritor Inc. 1,146,730 26,902* SPX FLOW Inc. 561,821 26,715
31
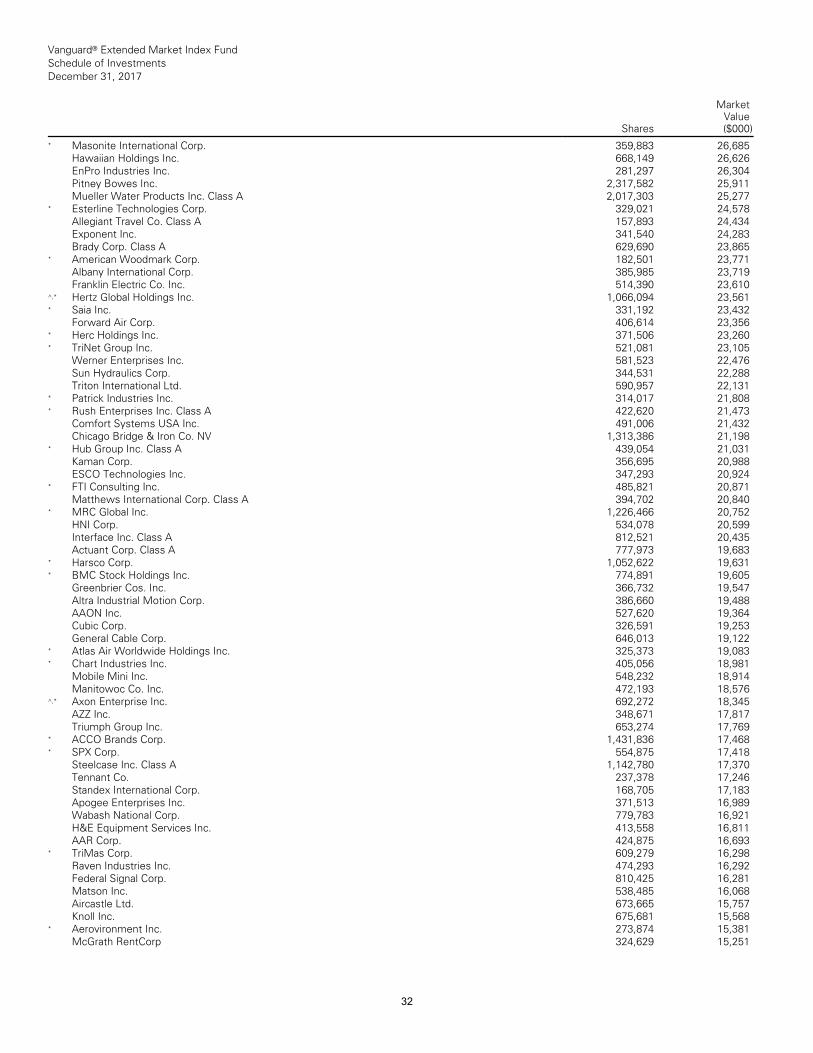
Vanguard® Extended Market Index Fund Schedule of Investments December 31, 2017
Shares
MarketValue($000)
__________________________________________________________________________________________________________________________________________________________________________________________________________________________________________________________________________________________________________________________________________________________________________________________________________________________________________________________________________________________________________________________________________________________________________________________________________________________________________________________________________________________ __________________________________________________________________________________________________________________________________________________________________________________________________________________________________________________________________________________________________________________________________________________________________________________________________________________________________________________________________________________________________________________________________________________________________________________________________________________________________________________________________________________________
* Masonite International Corp. 359,883 26,685 Hawaiian Holdings Inc. 668,149 26,626EnPro Industries Inc. 281,297 26,304Pitney Bowes Inc. 2,317,582 25,911Mueller Water Products Inc. Class A 2,017,303 25,277
* Esterline Technologies Corp. 329,021 24,578 Allegiant Travel Co. Class A 157,893 24,434 Exponent Inc. 341,540 24,283Brady Corp. Class A 629,690 23,865
* American Woodmark Corp. 182,501 23,771 Albany International Corp. 385,985 23,719 Franklin Electric Co. Inc. 514,390 23,610
^,* Hertz Global Holdings Inc. 1,066,094 23,561 * Saia Inc. 331,192 23,432
Forward Air Corp. 406,614 23,356* Herc Holdings Inc. 371,506 23,260* TriNet Group Inc. 521,081 23,105
Werner Enterprises Inc. 581,523 22,476 Sun Hydraulics Corp. 344,531 22,288Triton International Ltd. 590,957 22,131
* Patrick Industries Inc. 314,017 21,808* Rush Enterprises Inc. Class A 422,620 21,473
Comfort Systems USA Inc. 491,006 21,432 Chicago Bridge & Iron Co. NV 1,313,386 21,198
* Hub Group Inc. Class A 439,054 21,031Kaman Corp. 356,695 20,988ESCO Technologies Inc. 347,293 20,924
* FTI Consulting Inc. 485,821 20,871Matthews International Corp. Class A 394,702 20,840
* MRC Global Inc. 1,226,466 20,752HNI Corp. 534,078 20,599Interface Inc. Class A 812,521 20,435Actuant Corp. Class A 777,973 19,683
* Harsco Corp. 1,052,622 19,631* BMC Stock Holdings Inc. 774,891 19,605
Greenbrier Cos. Inc. 366,732 19,547Altra Industrial Motion Corp. 386,660 19,488 AAON Inc. 527,620 19,364Cubic Corp. 326,591 19,253General Cable Corp. 646,013 19,122
* Atlas Air Worldwide Holdings Inc. 325,373 19,083 * Chart Industries Inc. 405,056 18,981
Mobile Mini Inc. 548,232 18,914Manitowoc Co. Inc. 472,193 18,576
^,* Axon Enterprise Inc. 692,272 18,345AZZ Inc. 348,671 17,817Triumph Group Inc. 653,274 17,769
* ACCO Brands Corp. 1,431,836 17,468* SPX Corp. 554,875 17,418
Steelcase Inc. Class A 1,142,780 17,370Tennant Co. 237,378 17,246Standex International Corp. 168,705 17,183 Apogee Enterprises Inc. 371,513 16,989 Wabash National Corp. 779,783 16,921H&E Equipment Services Inc. 413,558 16,811 AAR Corp. 424,875 16,693
* TriMas Corp. 609,279 16,298Raven Industries Inc. 474,293 16,292Federal Signal Corp. 810,425 16,281Matson Inc. 538,485 16,068Aircastle Ltd. 673,665 15,757Knoll Inc. 675,681 15,568
* Aerovironment Inc. 273,874 15,381McGrath RentCorp 324,629 15,251
32
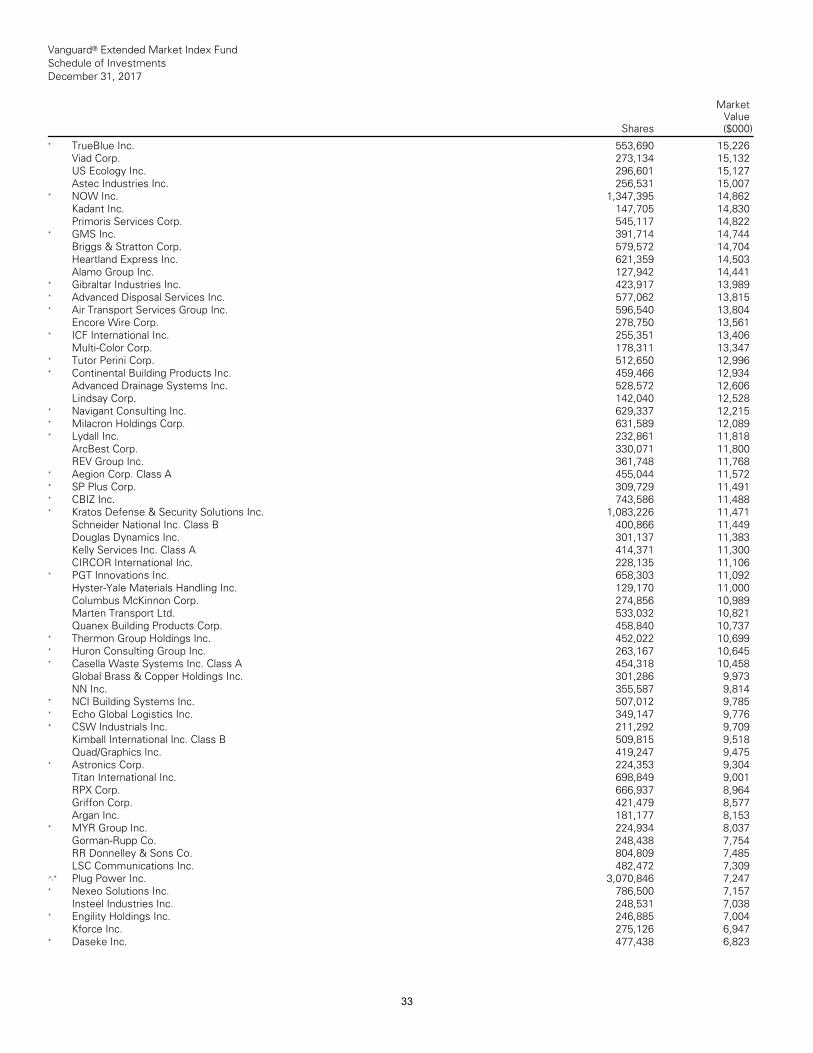
Vanguard® Extended Market Index Fund Schedule of Investments December 31, 2017
Shares
MarketValue($000)
__________________________________________________________________________________________________________________________________________________________________________________________________________________________________________________________________________________________________________________________________________________________________________________________________________________________________________________________________________________________________________________________________________________________________________________________________________________________________________________________________________________________ __________________________________________________________________________________________________________________________________________________________________________________________________________________________________________________________________________________________________________________________________________________________________________________________________________________________________________________________________________________________________________________________________________________________________________________________________________________________________________________________________________________________
* TrueBlue Inc. 553,690 15,226Viad Corp. 273,134 15,132US Ecology Inc. 296,601 15,127Astec Industries Inc. 256,531 15,007
* NOW Inc. 1,347,395 14,862Kadant Inc. 147,705 14,830Primoris Services Corp. 545,117 14,822
* GMS Inc. 391,714 14,744Briggs & Stratton Corp. 579,572 14,704Heartland Express Inc. 621,359 14,503Alamo Group Inc. 127,942 14,441
* Gibraltar Industries Inc. 423,917 13,989* Advanced Disposal Services Inc. 577,062 13,815 * Air Transport Services Group Inc. 596,540 13,804
Encore Wire Corp. 278,750 13,561* ICF International Inc. 255,351 13,406
Multi-Color Corp. 178,311 13,347* Tutor Perini Corp. 512,650 12,996* Continental Building Products Inc. 459,466 12,934
Advanced Drainage Systems Inc. 528,572 12,606 Lindsay Corp. 142,040 12,528
* Navigant Consulting Inc. 629,337 12,215 * Milacron Holdings Corp. 631,589 12,089 * Lydall Inc. 232,861 11,818
ArcBest Corp. 330,071 11,800REV Group Inc. 361,748 11,768
* Aegion Corp. Class A 455,044 11,572* SP Plus Corp. 309,729 11,491* CBIZ Inc. 743,586 11,488* Kratos Defense & Security Solutions Inc. 1,083,226 11,471
Schneider National Inc. Class B 400,866 11,449 Douglas Dynamics Inc. 301,137 11,383Kelly Services Inc. Class A 414,371 11,300 CIRCOR International Inc. 228,135 11,106
* PGT Innovations Inc. 658,303 11,092Hyster-Yale Materials Handling Inc. 129,170 11,000 Columbus McKinnon Corp. 274,856 10,989 Marten Transport Ltd. 533,032 10,821Quanex Building Products Corp. 458,840 10,737
* Thermon Group Holdings Inc. 452,022 10,699 * Huron Consulting Group Inc. 263,167 10,645 * Casella Waste Systems Inc. Class A 454,318 10,458
Global Brass & Copper Holdings Inc. 301,286 9,973 NN Inc. 355,587 9,814
* NCI Building Systems Inc. 507,012 9,785 * Echo Global Logistics Inc. 349,147 9,776 * CSW Industrials Inc. 211,292 9,709
Kimball International Inc. Class B 509,815 9,518 Quad/Graphics Inc. 419,247 9,475
* Astronics Corp. 224,353 9,304Titan International Inc. 698,849 9,001RPX Corp. 666,937 8,964Griffon Corp. 421,479 8,577Argan Inc. 181,177 8,153
* MYR Group Inc. 224,934 8,037Gorman-Rupp Co. 248,438 7,754RR Donnelley & Sons Co. 804,809 7,485 LSC Communications Inc. 482,472 7,309
^,* Plug Power Inc. 3,070,846 7,247* Nexeo Solutions Inc. 786,500 7,157
Insteel Industries Inc. 248,531 7,038* Engility Holdings Inc. 246,885 7,004
Kforce Inc. 275,126 6,947* Daseke Inc. 477,438 6,823
33
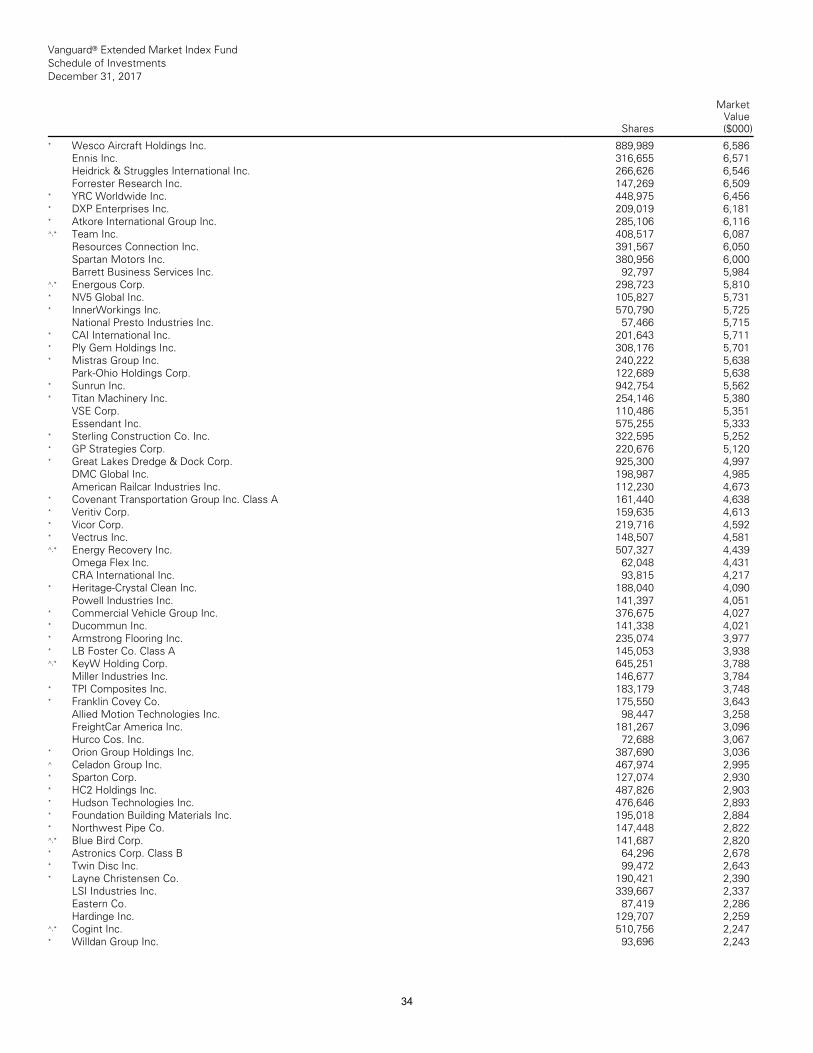
Vanguard® Extended Market Index Fund Schedule of Investments December 31, 2017
Shares
MarketValue($000)
__________________________________________________________________________________________________________________________________________________________________________________________________________________________________________________________________________________________________________________________________________________________________________________________________________________________________________________________________________________________________________________________________________________________________________________________________________________________________________________________________________________________ __________________________________________________________________________________________________________________________________________________________________________________________________________________________________________________________________________________________________________________________________________________________________________________________________________________________________________________________________________________________________________________________________________________________________________________________________________________________________________________________________________________________
* Wesco Aircraft Holdings Inc. 889,989 6,586 Ennis Inc. 316,655 6,571Heidrick & Struggles International Inc. 266,626 6,546 Forrester Research Inc. 147,269 6,509
* YRC Worldwide Inc. 448,975 6,456* DXP Enterprises Inc. 209,019 6,181* Atkore International Group Inc. 285,106 6,116 ^,* Team Inc. 408,517 6,087
Resources Connection Inc. 391,567 6,050 Spartan Motors Inc. 380,956 6,000Barrett Business Services Inc. 92,797 5,984
^,* Energous Corp. 298,723 5,810* NV5 Global Inc. 105,827 5,731* InnerWorkings Inc. 570,790 5,725
National Presto Industries Inc. 57,466 5,715 * CAI International Inc. 201,643 5,711* Ply Gem Holdings Inc. 308,176 5,701* Mistras Group Inc. 240,222 5,638
Park-Ohio Holdings Corp. 122,689 5,638 * Sunrun Inc. 942,754 5,562* Titan Machinery Inc. 254,146 5,380
VSE Corp. 110,486 5,351Essendant Inc. 575,255 5,333
* Sterling Construction Co. Inc. 322,595 5,252 * GP Strategies Corp. 220,676 5,120* Great Lakes Dredge & Dock Corp. 925,300 4,997
DMC Global Inc. 198,987 4,985American Railcar Industries Inc. 112,230 4,673
* Covenant Transportation Group Inc. Class A 161,440 4,638 * Veritiv Corp. 159,635 4,613* Vicor Corp. 219,716 4,592* Vectrus Inc. 148,507 4,581^,* Energy Recovery Inc. 507,327 4,439
Omega Flex Inc. 62,048 4,431CRA International Inc. 93,815 4,217
* Heritage-Crystal Clean Inc. 188,040 4,090 Powell Industries Inc. 141,397 4,051
* Commercial Vehicle Group Inc. 376,675 4,027 * Ducommun Inc. 141,338 4,021* Armstrong Flooring Inc. 235,074 3,977* LB Foster Co. Class A 145,053 3,938^,* KeyW Holding Corp. 645,251 3,788
Miller Industries Inc. 146,677 3,784* TPI Composites Inc. 183,179 3,748* Franklin Covey Co. 175,550 3,643
Allied Motion Technologies Inc. 98,447 3,258 FreightCar America Inc. 181,267 3,096Hurco Cos. Inc. 72,688 3,067
* Orion Group Holdings Inc. 387,690 3,036 ^ Celadon Group Inc. 467,974 2,995* Sparton Corp. 127,074 2,930* HC2 Holdings Inc. 487,826 2,903* Hudson Technologies Inc. 476,646 2,893 * Foundation Building Materials Inc. 195,018 2,884 * Northwest Pipe Co. 147,448 2,822^,* Blue Bird Corp. 141,687 2,820* Astronics Corp. Class B 64,296 2,678* Twin Disc Inc. 99,472 2,643* Layne Christensen Co. 190,421 2,390
LSI Industries Inc. 339,667 2,337Eastern Co. 87,419 2,286Hardinge Inc. 129,707 2,259
^,* Cogint Inc. 510,756 2,247* Willdan Group Inc. 93,696 2,243
34
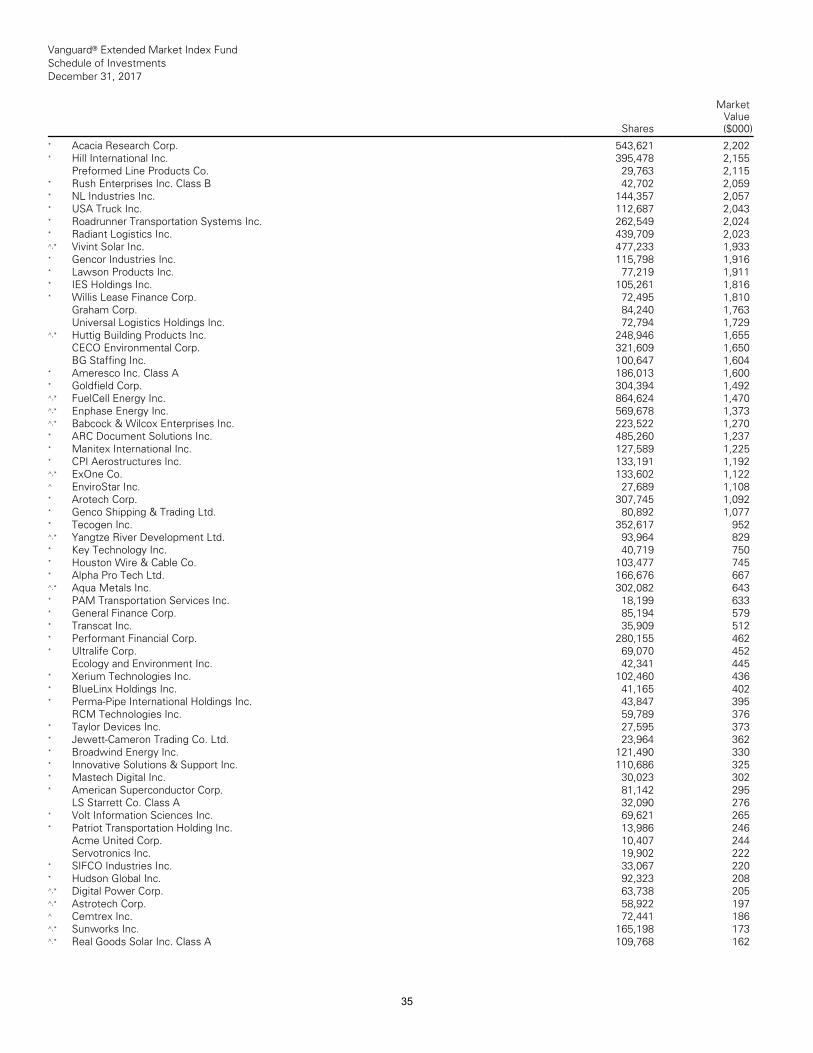
Vanguard® Extended Market Index Fund Schedule of Investments December 31, 2017
Shares
MarketValue($000)
__________________________________________________________________________________________________________________________________________________________________________________________________________________________________________________________________________________________________________________________________________________________________________________________________________________________________________________________________________________________________________________________________________________________________________________________________________________________________________________________________________________________ __________________________________________________________________________________________________________________________________________________________________________________________________________________________________________________________________________________________________________________________________________________________________________________________________________________________________________________________________________________________________________________________________________________________________________________________________________________________________________________________________________________________
* Acacia Research Corp. 543,621 2,202* Hill International Inc. 395,478 2,155
Preformed Line Products Co. 29,763 2,115 * Rush Enterprises Inc. Class B 42,702 2,059 * NL Industries Inc. 144,357 2,057* USA Truck Inc. 112,687 2,043* Roadrunner Transportation Systems Inc. 262,549 2,024 * Radiant Logistics Inc. 439,709 2,023^,* Vivint Solar Inc. 477,233 1,933* Gencor Industries Inc. 115,798 1,916* Lawson Products Inc. 77,219 1,911* IES Holdings Inc. 105,261 1,816* Willis Lease Finance Corp. 72,495 1,810
Graham Corp. 84,240 1,763Universal Logistics Holdings Inc. 72,794 1,729
^,* Huttig Building Products Inc. 248,946 1,655 CECO Environmental Corp. 321,609 1,650 BG Staffing Inc. 100,647 1,604
* Ameresco Inc. Class A 186,013 1,600* Goldfield Corp. 304,394 1,492^,* FuelCell Energy Inc. 864,624 1,470^,* Enphase Energy Inc. 569,678 1,373^,* Babcock & Wilcox Enterprises Inc. 223,522 1,270 * ARC Document Solutions Inc. 485,260 1,237 * Manitex International Inc. 127,589 1,225 * CPI Aerostructures Inc. 133,191 1,192^,* ExOne Co. 133,602 1,122^ EnviroStar Inc. 27,689 1,108* Arotech Corp. 307,745 1,092* Genco Shipping & Trading Ltd. 80,892 1,077 * Tecogen Inc. 352,617 952^,* Yangtze River Development Ltd. 93,964 829 * Key Technology Inc. 40,719 750* Houston Wire & Cable Co. 103,477 745 * Alpha Pro Tech Ltd. 166,676 667^,* Aqua Metals Inc. 302,082 643* PAM Transportation Services Inc. 18,199 633 * General Finance Corp. 85,194 579* Transcat Inc. 35,909 512* Performant Financial Corp. 280,155 462 * Ultralife Corp. 69,070 452
Ecology and Environment Inc. 42,341 445 * Xerium Technologies Inc. 102,460 436 * BlueLinx Holdings Inc. 41,165 402* Perma-Pipe International Holdings Inc. 43,847 395
RCM Technologies Inc. 59,789 376* Taylor Devices Inc. 27,595 373* Jewett-Cameron Trading Co. Ltd. 23,964 362 * Broadwind Energy Inc. 121,490 330* Innovative Solutions & Support Inc. 110,686 325 * Mastech Digital Inc. 30,023 302* American Superconductor Corp. 81,142 295
LS Starrett Co. Class A 32,090 276* Volt Information Sciences Inc. 69,621 265 * Patriot Transportation Holding Inc. 13,986 246
Acme United Corp. 10,407 244Servotronics Inc. 19,902 222
* SIFCO Industries Inc. 33,067 220* Hudson Global Inc. 92,323 208^,* Digital Power Corp. 63,738 205^,* Astrotech Corp. 58,922 197^ Cemtrex Inc. 72,441 186^,* Sunworks Inc. 165,198 173^,* Real Goods Solar Inc. Class A 109,768 162
35
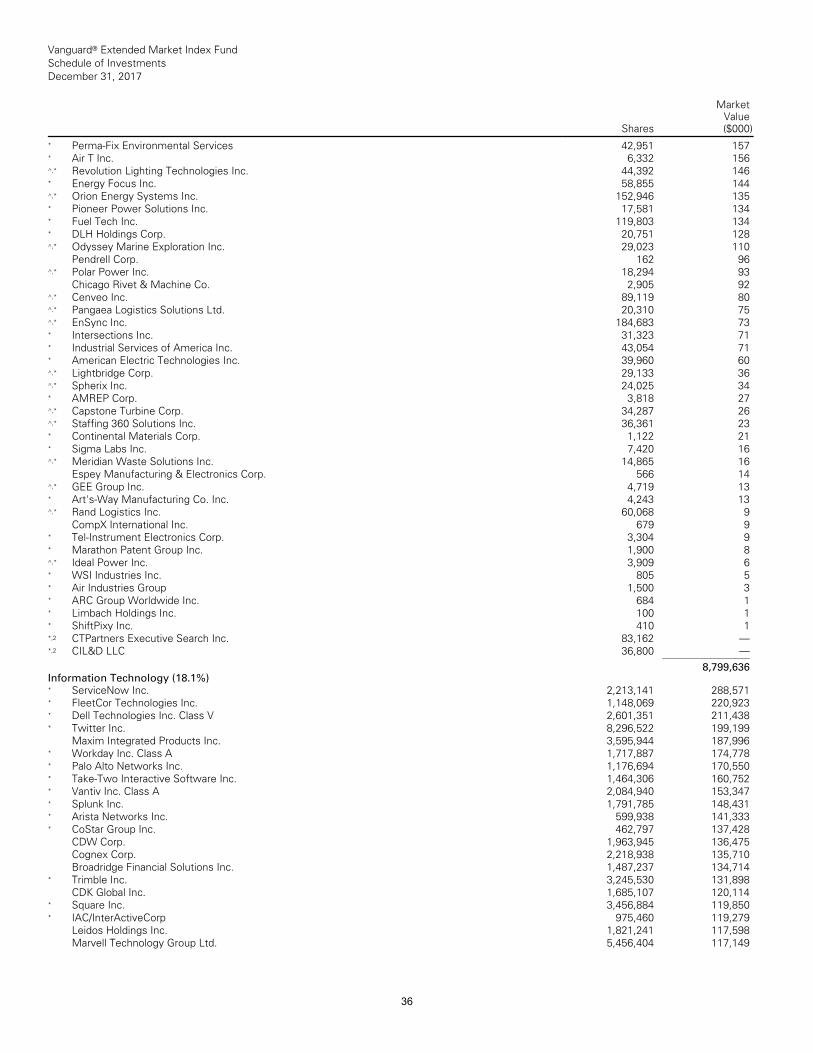
Vanguard® Extended Market Index Fund Schedule of Investments December 31, 2017
Shares
MarketValue($000)
__________________________________________________________________________________________________________________________________________________________________________________________________________________________________________________________________________________________________________________________________________________________________________________________________________________________________________________________________________________________________________________________________________________________________________________________________________________________________________________________________________________________ __________________________________________________________________________________________________________________________________________________________________________________________________________________________________________________________________________________________________________________________________________________________________________________________________________________________________________________________________________________________________________________________________________________________________________________________________________________________________________________________________________________________
* Perma-Fix Environmental Services 42,951 157 * Air T Inc. 6,332 156^,* Revolution Lighting Technologies Inc. 44,392 146 * Energy Focus Inc. 58,855 144^,* Orion Energy Systems Inc. 152,946 135 * Pioneer Power Solutions Inc. 17,581 134 * Fuel Tech Inc. 119,803 134* DLH Holdings Corp. 20,751 128^,* Odyssey Marine Exploration Inc. 29,023 110
Pendrell Corp. 162 96^,* Polar Power Inc. 18,294 93
Chicago Rivet & Machine Co. 2,905 92 ^,* Cenveo Inc. 89,119 80^,* Pangaea Logistics Solutions Ltd. 20,310 75 ^,* EnSync Inc. 184,683 73* Intersections Inc. 31,323 71* Industrial Services of America Inc. 43,054 71 * American Electric Technologies Inc. 39,960 60 ^,* Lightbridge Corp. 29,133 36^,* Spherix Inc. 24,025 34* AMREP Corp. 3,818 27^,* Capstone Turbine Corp. 34,287 26^,* Staffing 360 Solutions Inc. 36,361 23 * Continental Materials Corp. 1,122 21 * Sigma Labs Inc. 7,420 16^,* Meridian Waste Solutions Inc. 14,865 16
Espey Manufacturing & Electronics Corp. 566 14 ^,* GEE Group Inc. 4,719 13* Art's-Way Manufacturing Co. Inc. 4,243 13 ^,* Rand Logistics Inc. 60,068 9
CompX International Inc. 679 9 * Tel-Instrument Electronics Corp. 3,304 9 * Marathon Patent Group Inc. 1,900 8 ^,* Ideal Power Inc. 3,909 6* WSI Industries Inc. 805 5* Air Industries Group 1,500 3* ARC Group Worldwide Inc. 684 1 * Limbach Holdings Inc. 100 1* ShiftPixy Inc. 410 1*,2 CTPartners Executive Search Inc. 83,162 — *,2 CIL&D LLC 36,800 —___________
8,799,636 Information Technology (18.1%)* ServiceNow Inc. 2,213,141 288,571* FleetCor Technologies Inc. 1,148,069 220,923 * Dell Technologies Inc. Class V 2,601,351 211,438 * Twitter Inc. 8,296,522 199,199
Maxim Integrated Products Inc. 3,595,944 187,996 * Workday Inc. Class A 1,717,887 174,778* Palo Alto Networks Inc. 1,176,694 170,550* Take-Two Interactive Software Inc. 1,464,306 160,752 * Vantiv Inc. Class A 2,084,940 153,347* Splunk Inc. 1,791,785 148,431* Arista Networks Inc. 599,938 141,333* CoStar Group Inc. 462,797 137,428
CDW Corp. 1,963,945 136,475Cognex Corp. 2,218,938 135,710Broadridge Financial Solutions Inc. 1,487,237 134,714
* Trimble Inc. 3,245,530 131,898CDK Global Inc. 1,685,107 120,114
* Square Inc. 3,456,884 119,850* IAC/InterActiveCorp 975,460 119,279
Leidos Holdings Inc. 1,821,241 117,598Marvell Technology Group Ltd. 5,456,404 117,149
36
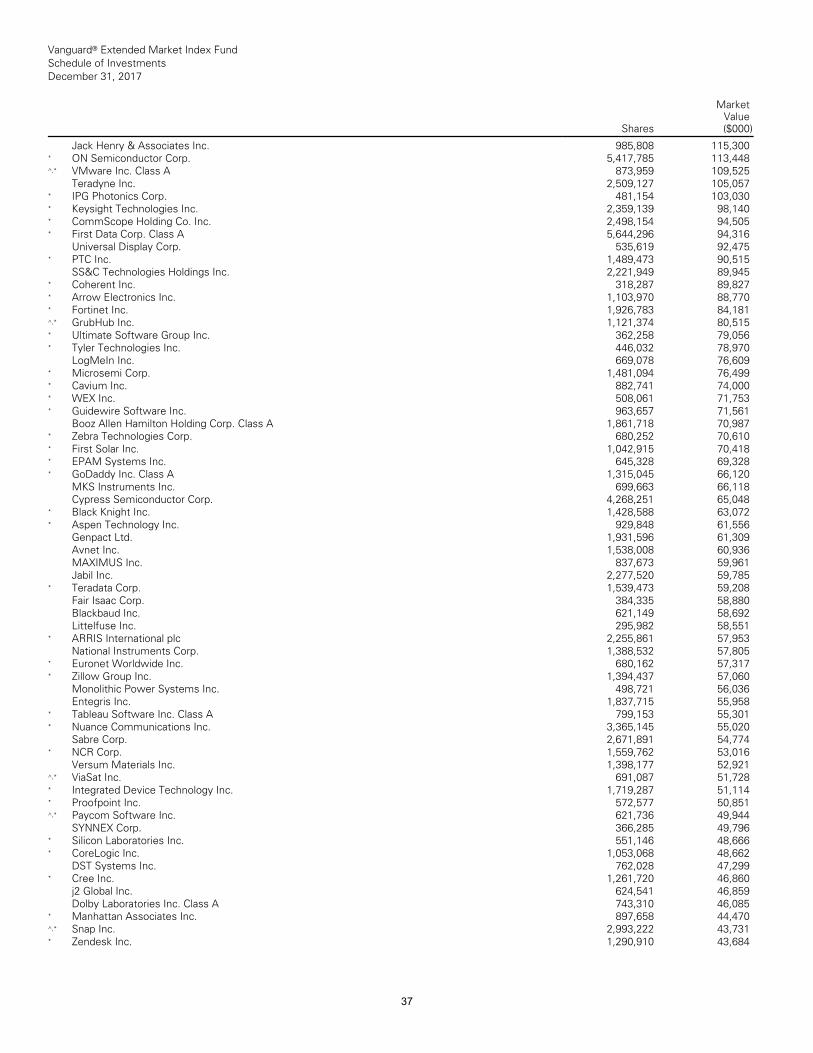
Vanguard® Extended Market Index Fund Schedule of Investments December 31, 2017
Shares
MarketValue($000)
__________________________________________________________________________________________________________________________________________________________________________________________________________________________________________________________________________________________________________________________________________________________________________________________________________________________________________________________________________________________________________________________________________________________________________________________________________________________________________________________________________________________ __________________________________________________________________________________________________________________________________________________________________________________________________________________________________________________________________________________________________________________________________________________________________________________________________________________________________________________________________________________________________________________________________________________________________________________________________________________________________________________________________________________________
Jack Henry & Associates Inc. 985,808 115,300 * ON Semiconductor Corp. 5,417,785 113,448 ^,* VMware Inc. Class A 873,959 109,525
Teradyne Inc. 2,509,127 105,057* IPG Photonics Corp. 481,154 103,030* Keysight Technologies Inc. 2,359,139 98,140 * CommScope Holding Co. Inc. 2,498,154 94,505 * First Data Corp. Class A 5,644,296 94,316
Universal Display Corp. 535,619 92,475* PTC Inc. 1,489,473 90,515
SS&C Technologies Holdings Inc. 2,221,949 89,945 * Coherent Inc. 318,287 89,827* Arrow Electronics Inc. 1,103,970 88,770* Fortinet Inc. 1,926,783 84,181^,* GrubHub Inc. 1,121,374 80,515* Ultimate Software Group Inc. 362,258 79,056 * Tyler Technologies Inc. 446,032 78,970
LogMeIn Inc. 669,078 76,609* Microsemi Corp. 1,481,094 76,499* Cavium Inc. 882,741 74,000* WEX Inc. 508,061 71,753* Guidewire Software Inc. 963,657 71,561
Booz Allen Hamilton Holding Corp. Class A 1,861,718 70,987 * Zebra Technologies Corp. 680,252 70,610 * First Solar Inc. 1,042,915 70,418* EPAM Systems Inc. 645,328 69,328* GoDaddy Inc. Class A 1,315,045 66,120
MKS Instruments Inc. 699,663 66,118Cypress Semiconductor Corp. 4,268,251 65,048
* Black Knight Inc. 1,428,588 63,072* Aspen Technology Inc. 929,848 61,556
Genpact Ltd. 1,931,596 61,309Avnet Inc. 1,538,008 60,936MAXIMUS Inc. 837,673 59,961Jabil Inc. 2,277,520 59,785
* Teradata Corp. 1,539,473 59,208Fair Isaac Corp. 384,335 58,880Blackbaud Inc. 621,149 58,692Littelfuse Inc. 295,982 58,551
* ARRIS International plc 2,255,861 57,953National Instruments Corp. 1,388,532 57,805
* Euronet Worldwide Inc. 680,162 57,317* Zillow Group Inc. 1,394,437 57,060
Monolithic Power Systems Inc. 498,721 56,036 Entegris Inc. 1,837,715 55,958
* Tableau Software Inc. Class A 799,153 55,301 * Nuance Communications Inc. 3,365,145 55,020
Sabre Corp. 2,671,891 54,774* NCR Corp. 1,559,762 53,016
Versum Materials Inc. 1,398,177 52,921^,* ViaSat Inc. 691,087 51,728* Integrated Device Technology Inc. 1,719,287 51,114 * Proofpoint Inc. 572,577 50,851^,* Paycom Software Inc. 621,736 49,944
SYNNEX Corp. 366,285 49,796* Silicon Laboratories Inc. 551,146 48,666 * CoreLogic Inc. 1,053,068 48,662
DST Systems Inc. 762,028 47,299* Cree Inc. 1,261,720 46,860
j2 Global Inc. 624,541 46,859Dolby Laboratories Inc. Class A 743,310 46,085
* Manhattan Associates Inc. 897,658 44,470 ^,* Snap Inc. 2,993,222 43,731* Zendesk Inc. 1,290,910 43,684
37
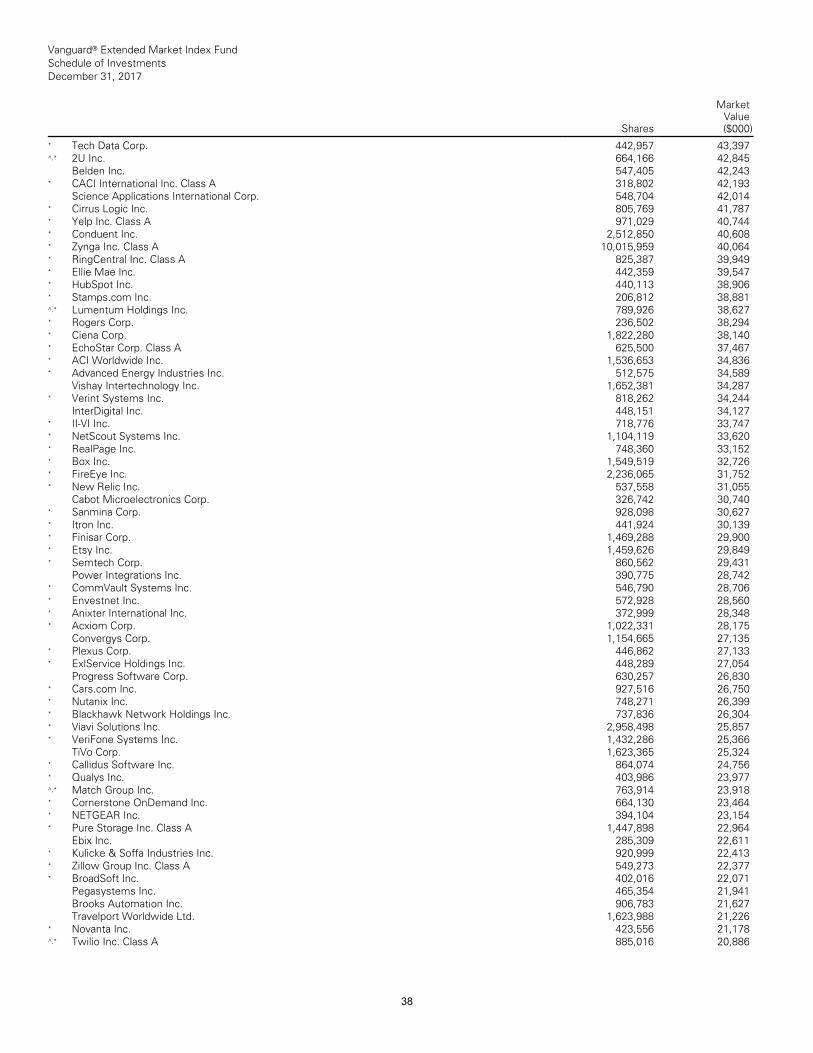
Vanguard® Extended Market Index Fund Schedule of Investments December 31, 2017
Shares
MarketValue($000)
__________________________________________________________________________________________________________________________________________________________________________________________________________________________________________________________________________________________________________________________________________________________________________________________________________________________________________________________________________________________________________________________________________________________________________________________________________________________________________________________________________________________ __________________________________________________________________________________________________________________________________________________________________________________________________________________________________________________________________________________________________________________________________________________________________________________________________________________________________________________________________________________________________________________________________________________________________________________________________________________________________________________________________________________________
* Tech Data Corp. 442,957 43,397^,* 2U Inc. 664,166 42,845
Belden Inc. 547,405 42,243* CACI International Inc. Class A 318,802 42,193
Science Applications International Corp. 548,704 42,014 * Cirrus Logic Inc. 805,769 41,787* Yelp Inc. Class A 971,029 40,744* Conduent Inc. 2,512,850 40,608* Zynga Inc. Class A 10,015,959 40,064* RingCentral Inc. Class A 825,387 39,949 * Ellie Mae Inc. 442,359 39,547* HubSpot Inc. 440,113 38,906* Stamps.com Inc. 206,812 38,881^,* Lumentum Holdings Inc. 789,926 38,627 * Rogers Corp. 236,502 38,294* Ciena Corp. 1,822,280 38,140* EchoStar Corp. Class A 625,500 37,467* ACI Worldwide Inc. 1,536,653 34,836* Advanced Energy Industries Inc. 512,575 34,589
Vishay Intertechnology Inc. 1,652,381 34,287 * Verint Systems Inc. 818,262 34,244
InterDigital Inc. 448,151 34,127* II-VI Inc. 718,776 33,747* NetScout Systems Inc. 1,104,119 33,620* RealPage Inc. 748,360 33,152* Box Inc. 1,549,519 32,726* FireEye Inc. 2,236,065 31,752* New Relic Inc. 537,558 31,055
Cabot Microelectronics Corp. 326,742 30,740 * Sanmina Corp. 928,098 30,627* Itron Inc. 441,924 30,139* Finisar Corp. 1,469,288 29,900* Etsy Inc. 1,459,626 29,849* Semtech Corp. 860,562 29,431
Power Integrations Inc. 390,775 28,742* CommVault Systems Inc. 546,790 28,706 * Envestnet Inc. 572,928 28,560* Anixter International Inc. 372,999 28,348 * Acxiom Corp. 1,022,331 28,175
Convergys Corp. 1,154,665 27,135* Plexus Corp. 446,862 27,133* ExlService Holdings Inc. 448,289 27,054
Progress Software Corp. 630,257 26,830 * Cars.com Inc. 927,516 26,750* Nutanix Inc. 748,271 26,399* Blackhawk Network Holdings Inc. 737,836 26,304 * Viavi Solutions Inc. 2,958,498 25,857* VeriFone Systems Inc. 1,432,286 25,366
TiVo Corp. 1,623,365 25,324* Callidus Software Inc. 864,074 24,756* Qualys Inc. 403,986 23,977^,* Match Group Inc. 763,914 23,918* Cornerstone OnDemand Inc. 664,130 23,464 * NETGEAR Inc. 394,104 23,154* Pure Storage Inc. Class A 1,447,898 22,964
Ebix Inc. 285,309 22,611* Kulicke & Soffa Industries Inc. 920,999 22,413 * Zillow Group Inc. Class A 549,273 22,377 * BroadSoft Inc. 402,016 22,071
Pegasystems Inc. 465,354 21,941Brooks Automation Inc. 906,783 21,627Travelport Worldwide Ltd. 1,623,988 21,226
* Novanta Inc. 423,556 21,178^,* Twilio Inc. Class A 885,016 20,886
38
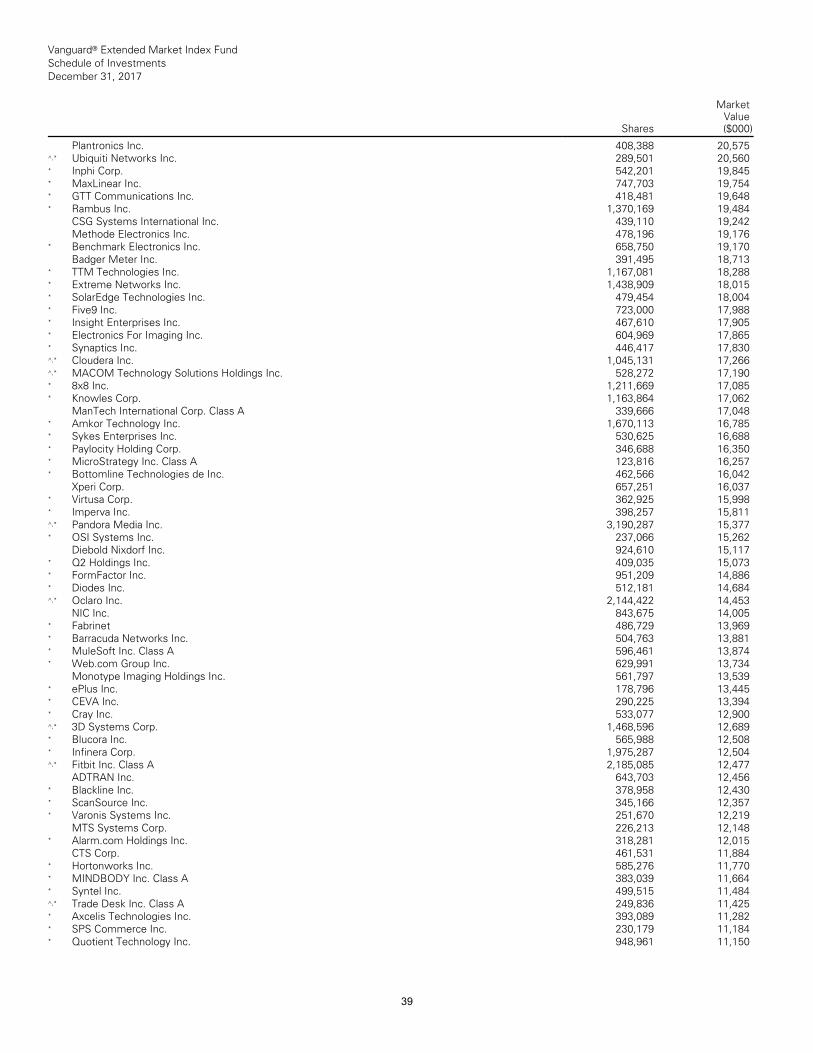
Vanguard® Extended Market Index Fund Schedule of Investments December 31, 2017
Shares
MarketValue($000)
__________________________________________________________________________________________________________________________________________________________________________________________________________________________________________________________________________________________________________________________________________________________________________________________________________________________________________________________________________________________________________________________________________________________________________________________________________________________________________________________________________________________ __________________________________________________________________________________________________________________________________________________________________________________________________________________________________________________________________________________________________________________________________________________________________________________________________________________________________________________________________________________________________________________________________________________________________________________________________________________________________________________________________________________________
Plantronics Inc. 408,388 20,575^,* Ubiquiti Networks Inc. 289,501 20,560* Inphi Corp. 542,201 19,845* MaxLinear Inc. 747,703 19,754* GTT Communications Inc. 418,481 19,648 * Rambus Inc. 1,370,169 19,484
CSG Systems International Inc. 439,110 19,242 Methode Electronics Inc. 478,196 19,176
* Benchmark Electronics Inc. 658,750 19,170 Badger Meter Inc. 391,495 18,713
* TTM Technologies Inc. 1,167,081 18,288* Extreme Networks Inc. 1,438,909 18,015* SolarEdge Technologies Inc. 479,454 18,004 * Five9 Inc. 723,000 17,988* Insight Enterprises Inc. 467,610 17,905* Electronics For Imaging Inc. 604,969 17,865 * Synaptics Inc. 446,417 17,830^,* Cloudera Inc. 1,045,131 17,266^,* MACOM Technology Solutions Holdings Inc. 528,272 17,190 * 8x8 Inc. 1,211,669 17,085* Knowles Corp. 1,163,864 17,062
ManTech International Corp. Class A 339,666 17,048 * Amkor Technology Inc. 1,670,113 16,785* Sykes Enterprises Inc. 530,625 16,688* Paylocity Holding Corp. 346,688 16,350* MicroStrategy Inc. Class A 123,816 16,257 * Bottomline Technologies de Inc. 462,566 16,042
Xperi Corp. 657,251 16,037* Virtusa Corp. 362,925 15,998* Imperva Inc. 398,257 15,811^,* Pandora Media Inc. 3,190,287 15,377* OSI Systems Inc. 237,066 15,262
Diebold Nixdorf Inc. 924,610 15,117* Q2 Holdings Inc. 409,035 15,073* FormFactor Inc. 951,209 14,886* Diodes Inc. 512,181 14,684^,* Oclaro Inc. 2,144,422 14,453
NIC Inc. 843,675 14,005* Fabrinet 486,729 13,969* Barracuda Networks Inc. 504,763 13,881 * MuleSoft Inc. Class A 596,461 13,874* Web.com Group Inc. 629,991 13,734
Monotype Imaging Holdings Inc. 561,797 13,539 * ePlus Inc. 178,796 13,445* CEVA Inc. 290,225 13,394* Cray Inc. 533,077 12,900^,* 3D Systems Corp. 1,468,596 12,689* Blucora Inc. 565,988 12,508* Infinera Corp. 1,975,287 12,504^,* Fitbit Inc. Class A 2,185,085 12,477
ADTRAN Inc. 643,703 12,456* Blackline Inc. 378,958 12,430* ScanSource Inc. 345,166 12,357* Varonis Systems Inc. 251,670 12,219
MTS Systems Corp. 226,213 12,148* Alarm.com Holdings Inc. 318,281 12,015
CTS Corp. 461,531 11,884* Hortonworks Inc. 585,276 11,770* MINDBODY Inc. Class A 383,039 11,664 * Syntel Inc. 499,515 11,484^,* Trade Desk Inc. Class A 249,836 11,425 * Axcelis Technologies Inc. 393,089 11,282 * SPS Commerce Inc. 230,179 11,184* Quotient Technology Inc. 948,961 11,150
39
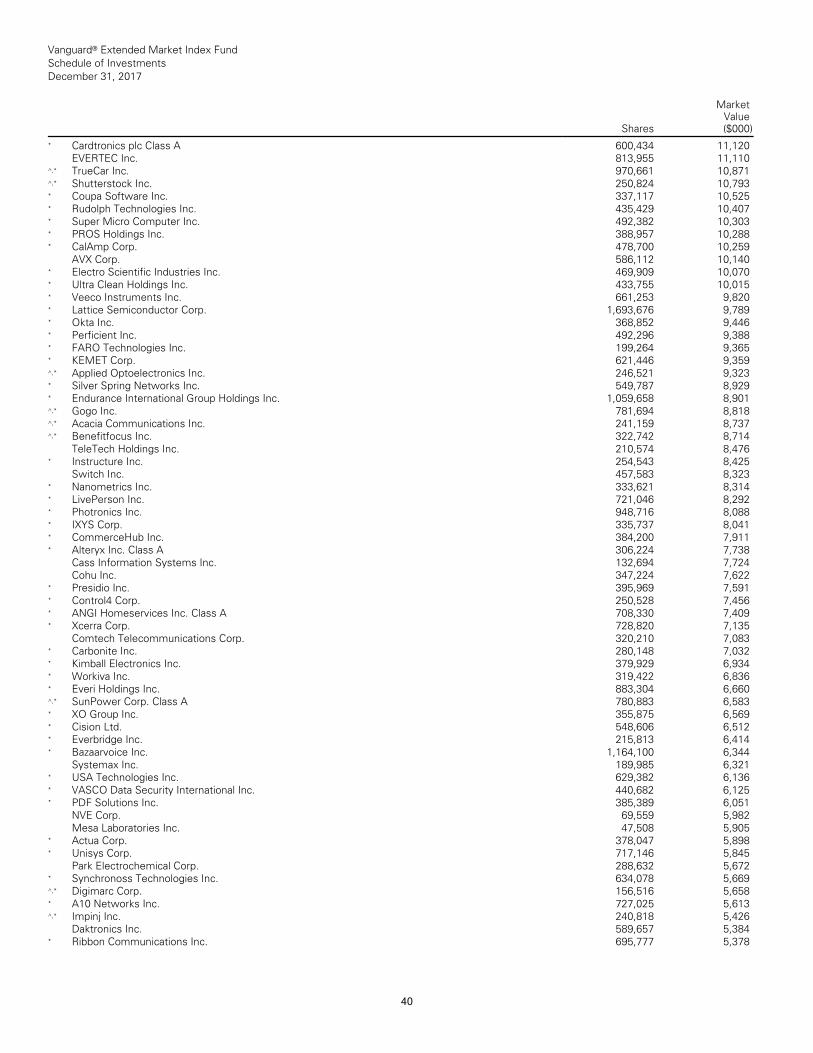
Vanguard® Extended Market Index Fund Schedule of Investments December 31, 2017
Shares
MarketValue($000)
__________________________________________________________________________________________________________________________________________________________________________________________________________________________________________________________________________________________________________________________________________________________________________________________________________________________________________________________________________________________________________________________________________________________________________________________________________________________________________________________________________________________ __________________________________________________________________________________________________________________________________________________________________________________________________________________________________________________________________________________________________________________________________________________________________________________________________________________________________________________________________________________________________________________________________________________________________________________________________________________________________________________________________________________________
* Cardtronics plc Class A 600,434 11,120 EVERTEC Inc. 813,955 11,110 ^,* TrueCar Inc. 970,661 10,871 ^,* Shutterstock Inc. 250,824 10,793 * Coupa Software Inc. 337,117 10,525 * Rudolph Technologies Inc. 435,429 10,407 * Super Micro Computer Inc. 492,382 10,303 * PROS Holdings Inc. 388,957 10,288 * CalAmp Corp. 478,700 10,259 AVX Corp. 586,112 10,140 * Electro Scientific Industries Inc. 469,909 10,070 * Ultra Clean Holdings Inc. 433,755 10,015 * Veeco Instruments Inc. 661,253 9,820 * Lattice Semiconductor Corp. 1,693,676 9,789 * Okta Inc. 368,852 9,446 * Perficient Inc. 492,296 9,388 * FARO Technologies Inc. 199,264 9,365 * KEMET Corp. 621,446 9,359 ^,* Applied Optoelectronics Inc. 246,521 9,323 * Silver Spring Networks Inc. 549,787 8,929 * Endurance International Group Holdings Inc. 1,059,658 8,901 ^,* Gogo Inc. 781,694 8,818 ^,* Acacia Communications Inc. 241,159 8,737 ^,* Benefitfocus Inc. 322,742 8,714 TeleTech Holdings Inc. 210,574 8,476 * Instructure Inc. 254,543 8,425 Switch Inc. 457,583 8,323 * Nanometrics Inc. 333,621 8,314 * LivePerson Inc. 721,046 8,292 * Photronics Inc. 948,716 8,088 * IXYS Corp. 335,737 8,041 * CommerceHub Inc. 384,200 7,911 * Alteryx Inc. Class A 306,224 7,738 Cass Information Systems Inc. 132,694 7,724 Cohu Inc. 347,224 7,622 * Presidio Inc. 395,969 7,591 * Control4 Corp. 250,528 7,456 * ANGI Homeservices Inc. Class A 708,330 7,409 * Xcerra Corp. 728,820 7,135 Comtech Telecommunications Corp. 320,210 7,083 * Carbonite Inc. 280,148 7,032 * Kimball Electronics Inc. 379,929 6,934 * Workiva Inc. 319,422 6,836 * Everi Holdings Inc. 883,304 6,660 ^,* SunPower Corp. Class A 780,883 6,583 * XO Group Inc. 355,875 6,569 * Cision Ltd. 548,606 6,512 * Everbridge Inc. 215,813 6,414 * Bazaarvoice Inc. 1,164,100 6,344 Systemax Inc. 189,985 6,321 * USA Technologies Inc. 629,382 6,136 * VASCO Data Security International Inc. 440,682 6,125 * PDF Solutions Inc. 385,389 6,051 NVE Corp. 69,559 5,982 Mesa Laboratories Inc. 47,508 5,905 * Actua Corp. 378,047 5,898 * Unisys Corp. 717,146 5,845 Park Electrochemical Corp. 288,632 5,672 * Synchronoss Technologies Inc. 634,078 5,669 ^,* Digimarc Corp. 156,516 5,658 * A10 Networks Inc. 727,025 5,613 ^,* Impinj Inc. 240,818 5,426 Daktronics Inc. 589,657 5,384 * Ribbon Communications Inc. 695,777 5,378
40
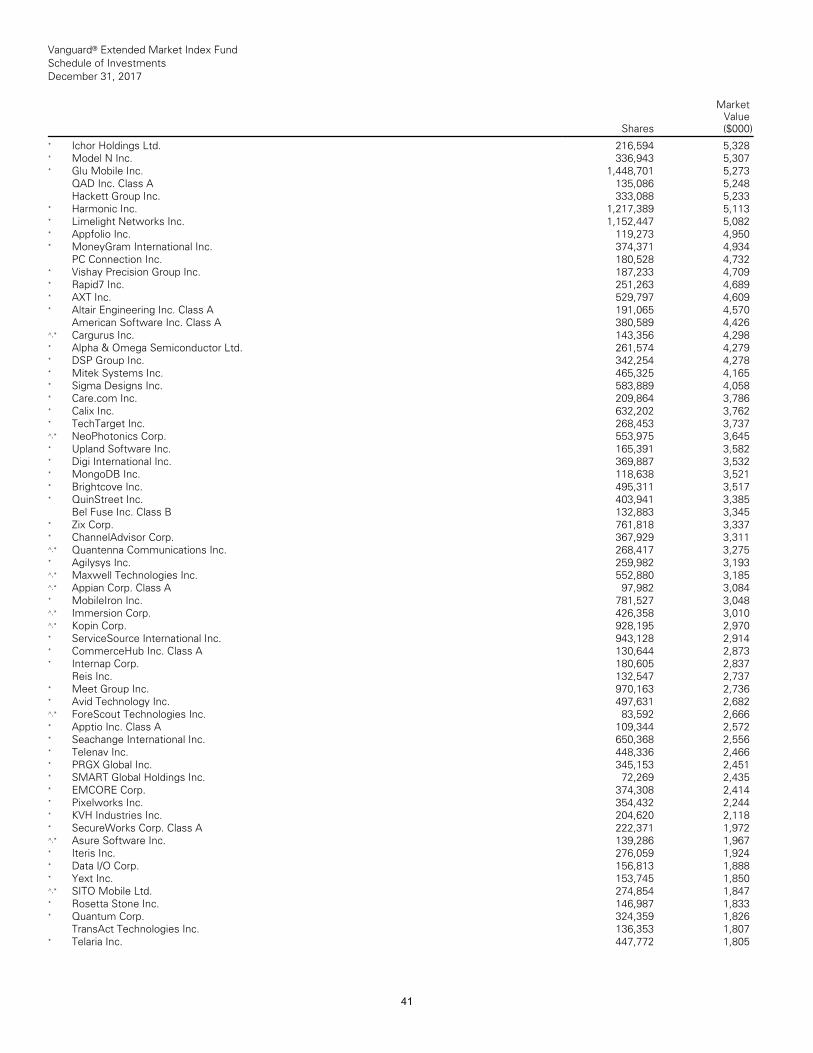
Vanguard® Extended Market Index Fund Schedule of Investments December 31, 2017
Shares
MarketValue($000)
__________________________________________________________________________________________________________________________________________________________________________________________________________________________________________________________________________________________________________________________________________________________________________________________________________________________________________________________________________________________________________________________________________________________________________________________________________________________________________________________________________________________ __________________________________________________________________________________________________________________________________________________________________________________________________________________________________________________________________________________________________________________________________________________________________________________________________________________________________________________________________________________________________________________________________________________________________________________________________________________________________________________________________________________________
* Ichor Holdings Ltd. 216,594 5,328 * Model N Inc. 336,943 5,307 * Glu Mobile Inc. 1,448,701 5,273 QAD Inc. Class A 135,086 5,248 Hackett Group Inc. 333,088 5,233 * Harmonic Inc. 1,217,389 5,113 * Limelight Networks Inc. 1,152,447 5,082 * Appfolio Inc. 119,273 4,950 * MoneyGram International Inc. 374,371 4,934 PC Connection Inc. 180,528 4,732 * Vishay Precision Group Inc. 187,233 4,709 * Rapid7 Inc. 251,263 4,689 * AXT Inc. 529,797 4,609 * Altair Engineering Inc. Class A 191,065 4,570 American Software Inc. Class A 380,589 4,426 ^,* Cargurus Inc. 143,356 4,298 * Alpha & Omega Semiconductor Ltd. 261,574 4,279 * DSP Group Inc. 342,254 4,278 * Mitek Systems Inc. 465,325 4,165 * Sigma Designs Inc. 583,889 4,058 * Care.com Inc. 209,864 3,786 * Calix Inc. 632,202 3,762 * TechTarget Inc. 268,453 3,737 ^,* NeoPhotonics Corp. 553,975 3,645 * Upland Software Inc. 165,391 3,582 * Digi International Inc. 369,887 3,532 * MongoDB Inc. 118,638 3,521 * Brightcove Inc. 495,311 3,517 * QuinStreet Inc. 403,941 3,385 Bel Fuse Inc. Class B 132,883 3,345 * Zix Corp. 761,818 3,337 * ChannelAdvisor Corp. 367,929 3,311 ^,* Quantenna Communications Inc. 268,417 3,275 * Agilysys Inc. 259,982 3,193 ^,* Maxwell Technologies Inc. 552,880 3,185 ^,* Appian Corp. Class A 97,982 3,084 * MobileIron Inc. 781,527 3,048 ^,* Immersion Corp. 426,358 3,010 ^,* Kopin Corp. 928,195 2,970 * ServiceSource International Inc. 943,128 2,914 * CommerceHub Inc. Class A 130,644 2,873 * Internap Corp. 180,605 2,837 Reis Inc. 132,547 2,737 * Meet Group Inc. 970,163 2,736 * Avid Technology Inc. 497,631 2,682 ^,* ForeScout Technologies Inc. 83,592 2,666 * Apptio Inc. Class A 109,344 2,572 * Seachange International Inc. 650,368 2,556 * Telenav Inc. 448,336 2,466 * PRGX Global Inc. 345,153 2,451 * SMART Global Holdings Inc. 72,269 2,435 * EMCORE Corp. 374,308 2,414 * Pixelworks Inc. 354,432 2,244 * KVH Industries Inc. 204,620 2,118 * SecureWorks Corp. Class A 222,371 1,972 ^,* Asure Software Inc. 139,286 1,967 * Iteris Inc. 276,059 1,924 * Data I/O Corp. 156,813 1,888 * Yext Inc. 153,745 1,850 ^,* SITO Mobile Ltd. 274,854 1,847 * Rosetta Stone Inc. 146,987 1,833 * Quantum Corp. 324,359 1,826 TransAct Technologies Inc. 136,353 1,807 * Telaria Inc. 447,772 1,805
41
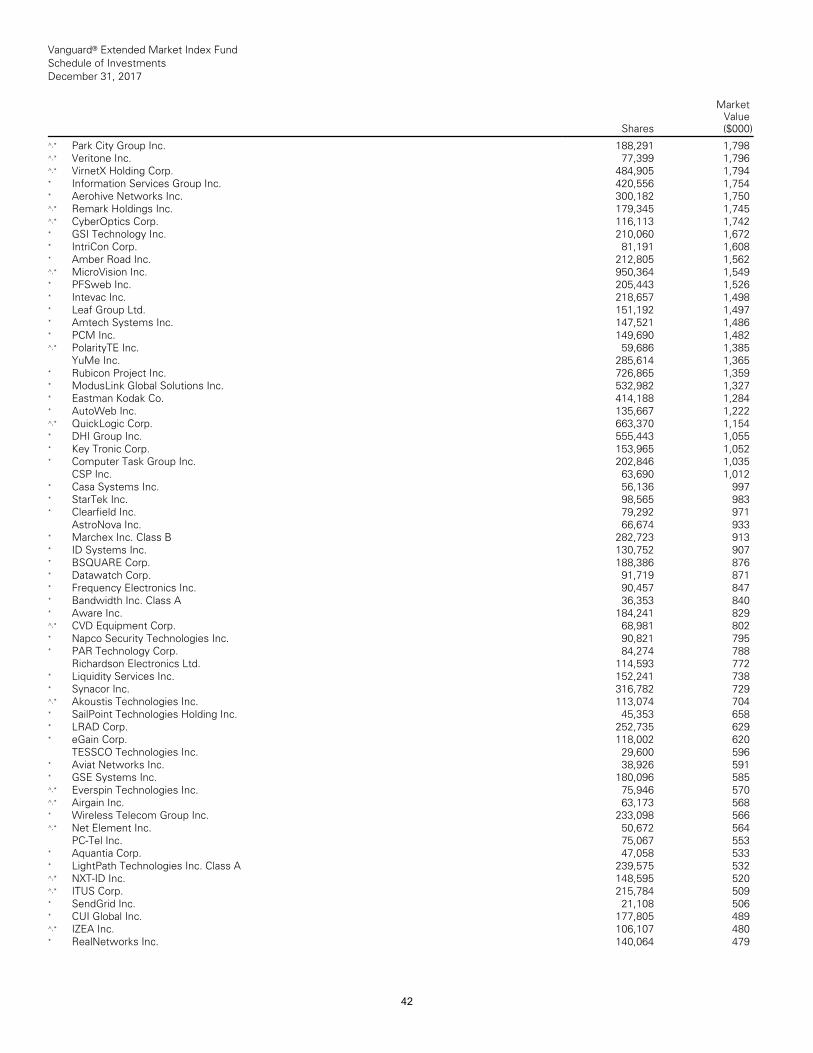
Vanguard® Extended Market Index Fund Schedule of Investments December 31, 2017
Shares
MarketValue($000)
__________________________________________________________________________________________________________________________________________________________________________________________________________________________________________________________________________________________________________________________________________________________________________________________________________________________________________________________________________________________________________________________________________________________________________________________________________________________________________________________________________________________ __________________________________________________________________________________________________________________________________________________________________________________________________________________________________________________________________________________________________________________________________________________________________________________________________________________________________________________________________________________________________________________________________________________________________________________________________________________________________________________________________________________________
^,* Park City Group Inc. 188,291 1,798 ^,* Veritone Inc. 77,399 1,796 ^,* VirnetX Holding Corp. 484,905 1,794 * Information Services Group Inc. 420,556 1,754 * Aerohive Networks Inc. 300,182 1,750 ^,* Remark Holdings Inc. 179,345 1,745 ^,* CyberOptics Corp. 116,113 1,742 * GSI Technology Inc. 210,060 1,672 * IntriCon Corp. 81,191 1,608 * Amber Road Inc. 212,805 1,562 ^,* MicroVision Inc. 950,364 1,549 * PFSweb Inc. 205,443 1,526 * Intevac Inc. 218,657 1,498 * Leaf Group Ltd. 151,192 1,497 * Amtech Systems Inc. 147,521 1,486 * PCM Inc. 149,690 1,482 ^,* PolarityTE Inc. 59,686 1,385 YuMe Inc. 285,614 1,365 * Rubicon Project Inc. 726,865 1,359 * ModusLink Global Solutions Inc. 532,982 1,327 * Eastman Kodak Co. 414,188 1,284 * AutoWeb Inc. 135,667 1,222 ^,* QuickLogic Corp. 663,370 1,154 * DHI Group Inc. 555,443 1,055 * Key Tronic Corp. 153,965 1,052 * Computer Task Group Inc. 202,846 1,035 CSP Inc. 63,690 1,012 * Casa Systems Inc. 56,136 997 * StarTek Inc. 98,565 983 * Clearfield Inc. 79,292 971 AstroNova Inc. 66,674 933 * Marchex Inc. Class B 282,723 913 * ID Systems Inc. 130,752 907 * BSQUARE Corp. 188,386 876 * Datawatch Corp. 91,719 871 * Frequency Electronics Inc. 90,457 847 * Bandwidth Inc. Class A 36,353 840 * Aware Inc. 184,241 829 ^,* CVD Equipment Corp. 68,981 802 * Napco Security Technologies Inc. 90,821 795 * PAR Technology Corp. 84,274 788 Richardson Electronics Ltd. 114,593 772 * Liquidity Services Inc. 152,241 738 * Synacor Inc. 316,782 729 ^,* Akoustis Technologies Inc. 113,074 704 * SailPoint Technologies Holding Inc. 45,353 658 * LRAD Corp. 252,735 629 * eGain Corp. 118,002 620 TESSCO Technologies Inc. 29,600 596 * Aviat Networks Inc. 38,926 591 * GSE Systems Inc. 180,096 585 ^,* Everspin Technologies Inc. 75,946 570 ^,* Airgain Inc. 63,173 568 * Wireless Telecom Group Inc. 233,098 566 ^,* Net Element Inc. 50,672 564 PC-Tel Inc. 75,067 553 * Aquantia Corp. 47,058 533 * LightPath Technologies Inc. Class A 239,575 532 ^,* NXT-ID Inc. 148,595 520 ^,* ITUS Corp. 215,784 509 * SendGrid Inc. 21,108 506 * CUI Global Inc. 177,805 489 ^,* IZEA Inc. 106,107 480 * RealNetworks Inc. 140,064 479
42
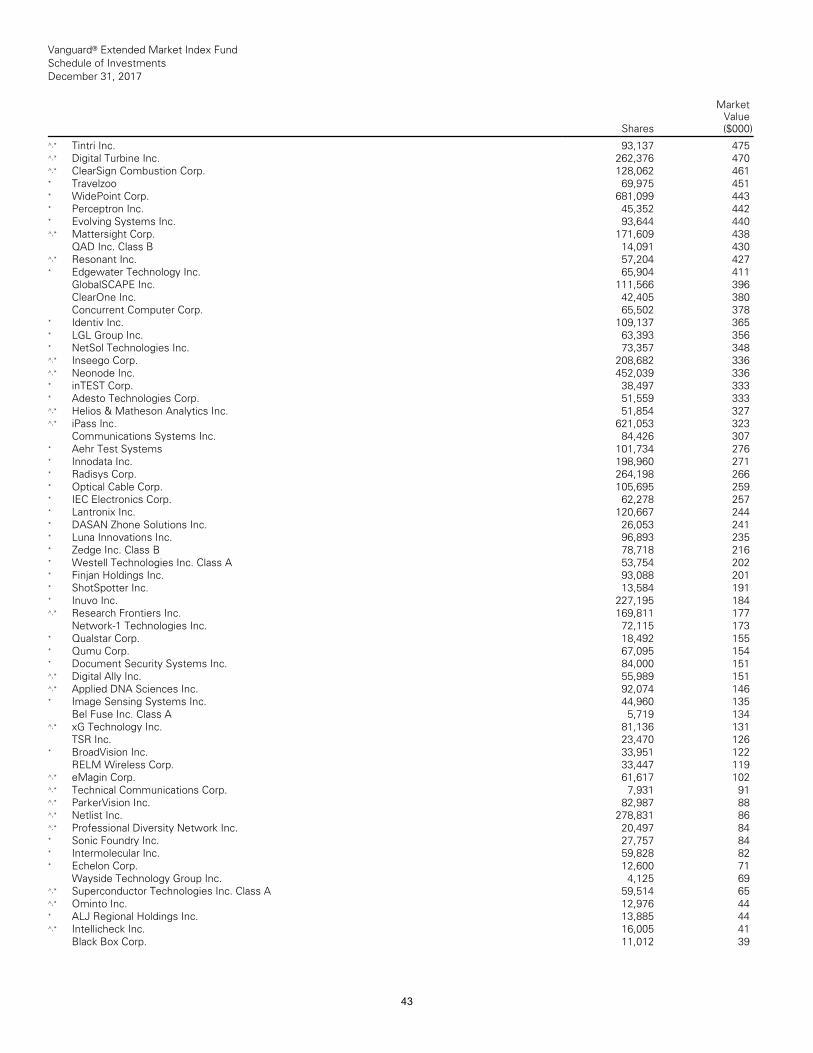
Vanguard® Extended Market Index Fund Schedule of Investments December 31, 2017
Shares
MarketValue($000)
__________________________________________________________________________________________________________________________________________________________________________________________________________________________________________________________________________________________________________________________________________________________________________________________________________________________________________________________________________________________________________________________________________________________________________________________________________________________________________________________________________________________ __________________________________________________________________________________________________________________________________________________________________________________________________________________________________________________________________________________________________________________________________________________________________________________________________________________________________________________________________________________________________________________________________________________________________________________________________________________________________________________________________________________________
^,* Tintri Inc. 93,137 475 ^,* Digital Turbine Inc. 262,376 470 ^,* ClearSign Combustion Corp. 128,062 461 * Travelzoo 69,975 451 * WidePoint Corp. 681,099 443 * Perceptron Inc. 45,352 442 * Evolving Systems Inc. 93,644 440 ^,* Mattersight Corp. 171,609 438 QAD Inc. Class B 14,091 430 ^,* Resonant Inc. 57,204 427 * Edgewater Technology Inc. 65,904 411 GlobalSCAPE Inc. 111,566 396 ClearOne Inc. 42,405 380 Concurrent Computer Corp. 65,502 378 * Identiv Inc. 109,137 365 * LGL Group Inc. 63,393 356 * NetSol Technologies Inc. 73,357 348 ^,* Inseego Corp. 208,682 336 ^,* Neonode Inc. 452,039 336 * inTEST Corp. 38,497 333 * Adesto Technologies Corp. 51,559 333 ^,* Helios & Matheson Analytics Inc. 51,854 327 ^,* iPass Inc. 621,053 323 Communications Systems Inc. 84,426 307 * Aehr Test Systems 101,734 276 * Innodata Inc. 198,960 271 * Radisys Corp. 264,198 266 * Optical Cable Corp. 105,695 259 * IEC Electronics Corp. 62,278 257 * Lantronix Inc. 120,667 244 * DASAN Zhone Solutions Inc. 26,053 241 * Luna Innovations Inc. 96,893 235 * Zedge Inc. Class B 78,718 216 * Westell Technologies Inc. Class A 53,754 202 * Finjan Holdings Inc. 93,088 201 * ShotSpotter Inc. 13,584 191 * Inuvo Inc. 227,195 184 ^,* Research Frontiers Inc. 169,811 177 Network-1 Technologies Inc. 72,115 173 * Qualstar Corp. 18,492 155 * Qumu Corp. 67,095 154 * Document Security Systems Inc. 84,000 151 ^,* Digital Ally Inc. 55,989 151 ^,* Applied DNA Sciences Inc. 92,074 146 * Image Sensing Systems Inc. 44,960 135 Bel Fuse Inc. Class A 5,719 134 ^,* xG Technology Inc. 81,136 131 TSR Inc. 23,470 126 * BroadVision Inc. 33,951 122 RELM Wireless Corp. 33,447 119 ^,* eMagin Corp. 61,617 102 ^,* Technical Communications Corp. 7,931 91 ^,* ParkerVision Inc. 82,987 88 ^,* Netlist Inc. 278,831 86 ^,* Professional Diversity Network Inc. 20,497 84 * Sonic Foundry Inc. 27,757 84 * Intermolecular Inc. 59,828 82 * Echelon Corp. 12,600 71 Wayside Technology Group Inc. 4,125 69 ^,* Superconductor Technologies Inc. Class A 59,514 65 ^,* Ominto Inc. 12,976 44 * ALJ Regional Holdings Inc. 13,885 44 ^,* Intellicheck Inc. 16,005 41 Black Box Corp. 11,012 39
43
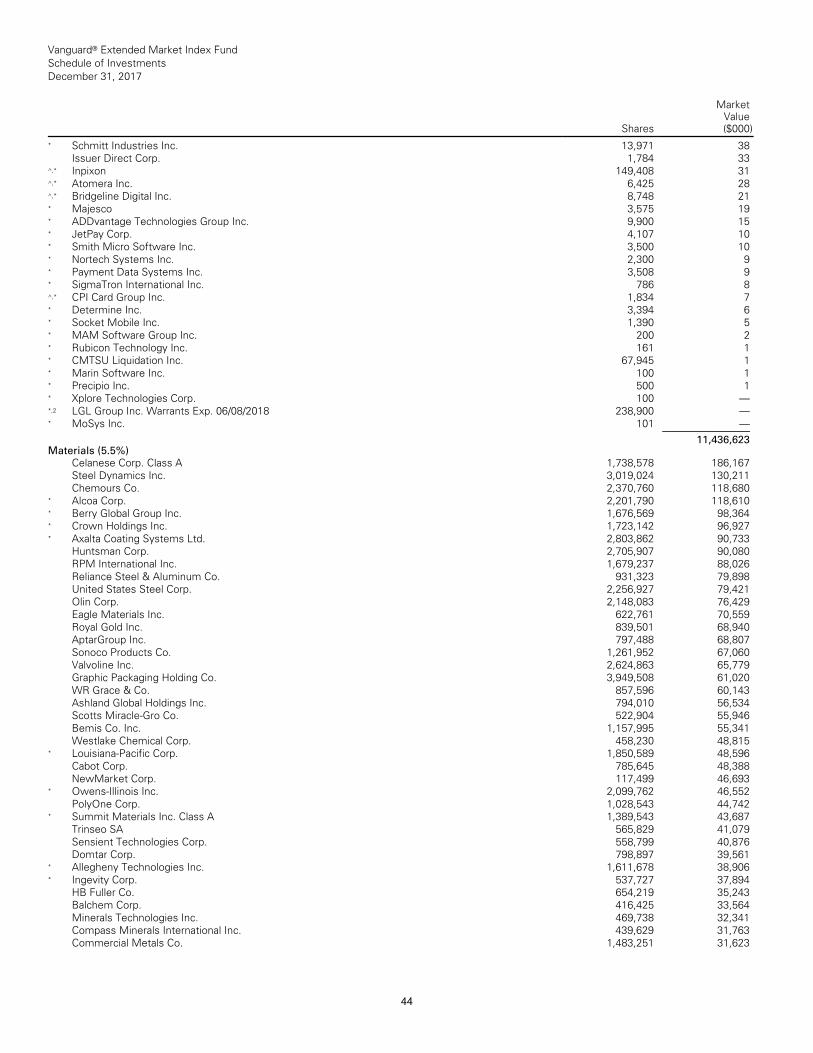
Vanguard® Extended Market Index Fund Schedule of Investments December 31, 2017
Shares
MarketValue($000)
__________________________________________________________________________________________________________________________________________________________________________________________________________________________________________________________________________________________________________________________________________________________________________________________________________________________________________________________________________________________________________________________________________________________________________________________________________________________________________________________________________________________ __________________________________________________________________________________________________________________________________________________________________________________________________________________________________________________________________________________________________________________________________________________________________________________________________________________________________________________________________________________________________________________________________________________________________________________________________________________________________________________________________________________________
* Schmitt Industries Inc. 13,971 38 Issuer Direct Corp. 1,784 33 ^,* Inpixon 149,408 31 ^,* Atomera Inc. 6,425 28 ^,* Bridgeline Digital Inc. 8,748 21 * Majesco 3,575 19 * ADDvantage Technologies Group Inc. 9,900 15 * JetPay Corp. 4,107 10 * Smith Micro Software Inc. 3,500 10 * Nortech Systems Inc. 2,300 9 * Payment Data Systems Inc. 3,508 9 * SigmaTron International Inc. 786 8 ^,* CPI Card Group Inc. 1,834 7 * Determine Inc. 3,394 6 * Socket Mobile Inc. 1,390 5 * MAM Software Group Inc. 200 2 * Rubicon Technology Inc. 161 1 * CMTSU Liquidation Inc. 67,945 1 * Marin Software Inc. 100 1 * Precipio Inc. 500 1 * Xplore Technologies Corp. 100 — *,2 LGL Group Inc. Warrants Exp. 06/08/2018 238,900 — * MoSys Inc. 101 — ___________ 11,436,623 Materials (5.5%)
Celanese Corp. Class A 1,738,578 186,167 Steel Dynamics Inc. 3,019,024 130,211 Chemours Co. 2,370,760 118,680 * Alcoa Corp. 2,201,790 118,610 * Berry Global Group Inc. 1,676,569 98,364 * Crown Holdings Inc. 1,723,142 96,927 * Axalta Coating Systems Ltd. 2,803,862 90,733 Huntsman Corp. 2,705,907 90,080 RPM International Inc. 1,679,237 88,026 Reliance Steel & Aluminum Co. 931,323 79,898 United States Steel Corp. 2,256,927 79,421 Olin Corp. 2,148,083 76,429 Eagle Materials Inc. 622,761 70,559 Royal Gold Inc. 839,501 68,940 AptarGroup Inc. 797,488 68,807 Sonoco Products Co. 1,261,952 67,060 Valvoline Inc. 2,624,863 65,779 Graphic Packaging Holding Co. 3,949,508 61,020 WR Grace & Co. 857,596 60,143 Ashland Global Holdings Inc. 794,010 56,534 Scotts Miracle-Gro Co. 522,904 55,946 Bemis Co. Inc. 1,157,995 55,341 Westlake Chemical Corp. 458,230 48,815 * Louisiana-Pacific Corp. 1,850,589 48,596 Cabot Corp. 785,645 48,388 NewMarket Corp. 117,499 46,693 * Owens-Illinois Inc. 2,099,762 46,552 PolyOne Corp. 1,028,543 44,742 * Summit Materials Inc. Class A 1,389,543 43,687 Trinseo SA 565,829 41,079 Sensient Technologies Corp. 558,799 40,876 Domtar Corp. 798,897 39,561 * Allegheny Technologies Inc. 1,611,678 38,906 * Ingevity Corp. 537,727 37,894 HB Fuller Co. 654,219 35,243 Balchem Corp. 416,425 33,564 Minerals Technologies Inc. 469,738 32,341 Compass Minerals International Inc. 439,629 31,763 Commercial Metals Co. 1,483,251 31,623
44
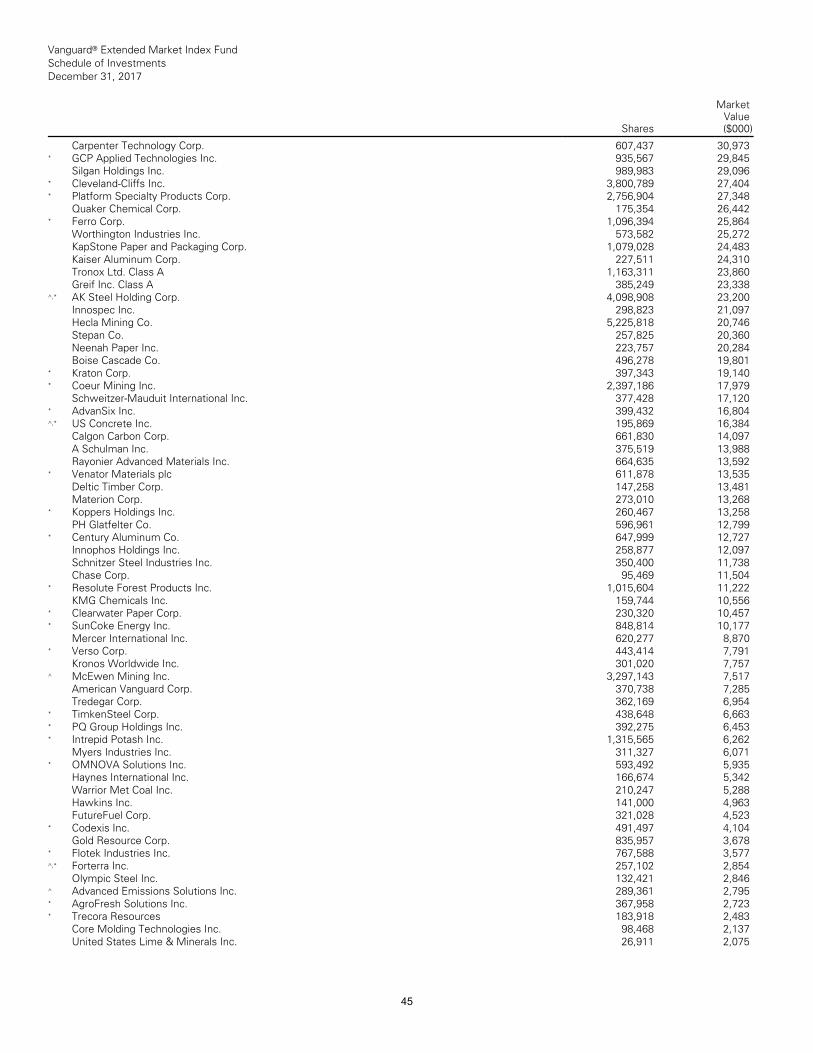
Vanguard® Extended Market Index Fund Schedule of Investments December 31, 2017
Shares
MarketValue($000)
__________________________________________________________________________________________________________________________________________________________________________________________________________________________________________________________________________________________________________________________________________________________________________________________________________________________________________________________________________________________________________________________________________________________________________________________________________________________________________________________________________________________ __________________________________________________________________________________________________________________________________________________________________________________________________________________________________________________________________________________________________________________________________________________________________________________________________________________________________________________________________________________________________________________________________________________________________________________________________________________________________________________________________________________________
Carpenter Technology Corp. 607,437 30,973 * GCP Applied Technologies Inc. 935,567 29,845 Silgan Holdings Inc. 989,983 29,096 * Cleveland-Cliffs Inc. 3,800,789 27,404 * Platform Specialty Products Corp. 2,756,904 27,348 Quaker Chemical Corp. 175,354 26,442 * Ferro Corp. 1,096,394 25,864 Worthington Industries Inc. 573,582 25,272 KapStone Paper and Packaging Corp. 1,079,028 24,483 Kaiser Aluminum Corp. 227,511 24,310 Tronox Ltd. Class A 1,163,311 23,860 Greif Inc. Class A 385,249 23,338 ^,* AK Steel Holding Corp. 4,098,908 23,200 Innospec Inc. 298,823 21,097 Hecla Mining Co. 5,225,818 20,746 Stepan Co. 257,825 20,360 Neenah Paper Inc. 223,757 20,284 Boise Cascade Co. 496,278 19,801 * Kraton Corp. 397,343 19,140 * Coeur Mining Inc. 2,397,186 17,979 Schweitzer-Mauduit International Inc. 377,428 17,120 * AdvanSix Inc. 399,432 16,804 ^,* US Concrete Inc. 195,869 16,384 Calgon Carbon Corp. 661,830 14,097 A Schulman Inc. 375,519 13,988 Rayonier Advanced Materials Inc. 664,635 13,592 * Venator Materials plc 611,878 13,535 Deltic Timber Corp. 147,258 13,481 Materion Corp. 273,010 13,268 * Koppers Holdings Inc. 260,467 13,258 PH Glatfelter Co. 596,961 12,799 * Century Aluminum Co. 647,999 12,727 Innophos Holdings Inc. 258,877 12,097 Schnitzer Steel Industries Inc. 350,400 11,738 Chase Corp. 95,469 11,504 * Resolute Forest Products Inc. 1,015,604 11,222 KMG Chemicals Inc. 159,744 10,556 * Clearwater Paper Corp. 230,320 10,457 * SunCoke Energy Inc. 848,814 10,177 Mercer International Inc. 620,277 8,870 * Verso Corp. 443,414 7,791 Kronos Worldwide Inc. 301,020 7,757 ^ McEwen Mining Inc. 3,297,143 7,517 American Vanguard Corp. 370,738 7,285 Tredegar Corp. 362,169 6,954 * TimkenSteel Corp. 438,648 6,663 * PQ Group Holdings Inc. 392,275 6,453 * Intrepid Potash Inc. 1,315,565 6,262 Myers Industries Inc. 311,327 6,071 * OMNOVA Solutions Inc. 593,492 5,935 Haynes International Inc. 166,674 5,342 Warrior Met Coal Inc. 210,247 5,288 Hawkins Inc. 141,000 4,963 FutureFuel Corp. 321,028 4,523 * Codexis Inc. 491,497 4,104 Gold Resource Corp. 835,957 3,678 * Flotek Industries Inc. 767,588 3,577 ^,* Forterra Inc. 257,102 2,854 Olympic Steel Inc. 132,421 2,846 ^ Advanced Emissions Solutions Inc. 289,361 2,795 * AgroFresh Solutions Inc. 367,958 2,723 * Trecora Resources 183,918 2,483 Core Molding Technologies Inc. 98,468 2,137 United States Lime & Minerals Inc. 26,911 2,075
45
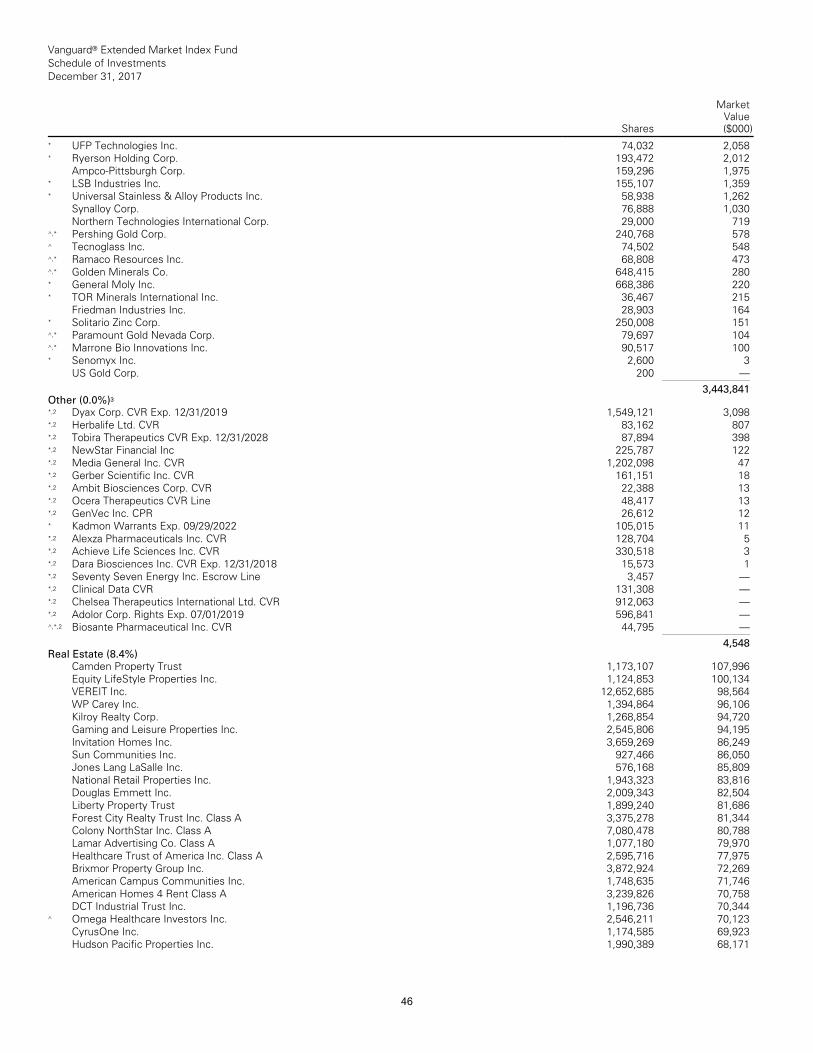
Vanguard® Extended Market Index Fund Schedule of Investments December 31, 2017
Shares
MarketValue($000)
__________________________________________________________________________________________________________________________________________________________________________________________________________________________________________________________________________________________________________________________________________________________________________________________________________________________________________________________________________________________________________________________________________________________________________________________________________________________________________________________________________________________ __________________________________________________________________________________________________________________________________________________________________________________________________________________________________________________________________________________________________________________________________________________________________________________________________________________________________________________________________________________________________________________________________________________________________________________________________________________________________________________________________________________________
* UFP Technologies Inc. 74,032 2,058 * Ryerson Holding Corp. 193,472 2,012 Ampco-Pittsburgh Corp. 159,296 1,975 * LSB Industries Inc. 155,107 1,359 * Universal Stainless & Alloy Products Inc. 58,938 1,262 Synalloy Corp. 76,888 1,030 Northern Technologies International Corp. 29,000 719 ^,* Pershing Gold Corp. 240,768 578 ^ Tecnoglass Inc. 74,502 548 ^,* Ramaco Resources Inc. 68,808 473 ^,* Golden Minerals Co. 648,415 280 * General Moly Inc. 668,386 220 * TOR Minerals International Inc. 36,467 215 Friedman Industries Inc. 28,903 164 * Solitario Zinc Corp. 250,008 151 ^,* Paramount Gold Nevada Corp. 79,697 104 ^,* Marrone Bio Innovations Inc. 90,517 100 * Senomyx Inc. 2,600 3 US Gold Corp. 200 — ___________ 3,443,841 Other (0.0%)3
*,2 Dyax Corp. CVR Exp. 12/31/2019 1,549,121 3,098 *,2 Herbalife Ltd. CVR 83,162 807 *,2 Tobira Therapeutics CVR Exp. 12/31/2028 87,894 398 *,2 NewStar Financial Inc 225,787 122 *,2 Media General Inc. CVR 1,202,098 47 *,2 Gerber Scientific Inc. CVR 161,151 18 *,2 Ambit Biosciences Corp. CVR 22,388 13 *,2 Ocera Therapeutics CVR Line 48,417 13 *,2 GenVec Inc. CPR 26,612 12 * Kadmon Warrants Exp. 09/29/2022 105,015 11 *,2 Alexza Pharmaceuticals Inc. CVR 128,704 5 *,2 Achieve Life Sciences Inc. CVR 330,518 3 *,2 Dara Biosciences Inc. CVR Exp. 12/31/2018 15,573 1 *,2 Seventy Seven Energy Inc. Escrow Line 3,457 — *,2 Clinical Data CVR 131,308 — *,2 Chelsea Therapeutics International Ltd. CVR 912,063 — *,2 Adolor Corp. Rights Exp. 07/01/2019 596,841 — ^,*,2 Biosante Pharmaceutical Inc. CVR 44,795 — ___________ 4,548 Real Estate (8.4%)
Camden Property Trust 1,173,107 107,996 Equity LifeStyle Properties Inc. 1,124,853 100,134 VEREIT Inc. 12,652,685 98,564 WP Carey Inc. 1,394,864 96,106 Kilroy Realty Corp. 1,268,854 94,720 Gaming and Leisure Properties Inc. 2,545,806 94,195 Invitation Homes Inc. 3,659,269 86,249 Sun Communities Inc. 927,466 86,050 Jones Lang LaSalle Inc. 576,168 85,809 National Retail Properties Inc. 1,943,323 83,816 Douglas Emmett Inc. 2,009,343 82,504 Liberty Property Trust 1,899,240 81,686 Forest City Realty Trust Inc. Class A 3,375,278 81,344 Colony NorthStar Inc. Class A 7,080,478 80,788 Lamar Advertising Co. Class A 1,077,180 79,970 Healthcare Trust of America Inc. Class A 2,595,716 77,975 Brixmor Property Group Inc. 3,872,924 72,269 American Campus Communities Inc. 1,748,635 71,746 American Homes 4 Rent Class A 3,239,826 70,758 DCT Industrial Trust Inc. 1,196,736 70,344 ^ Omega Healthcare Investors Inc. 2,546,211 70,123 CyrusOne Inc. 1,174,585 69,923 Hudson Pacific Properties Inc. 1,990,389 68,171
46
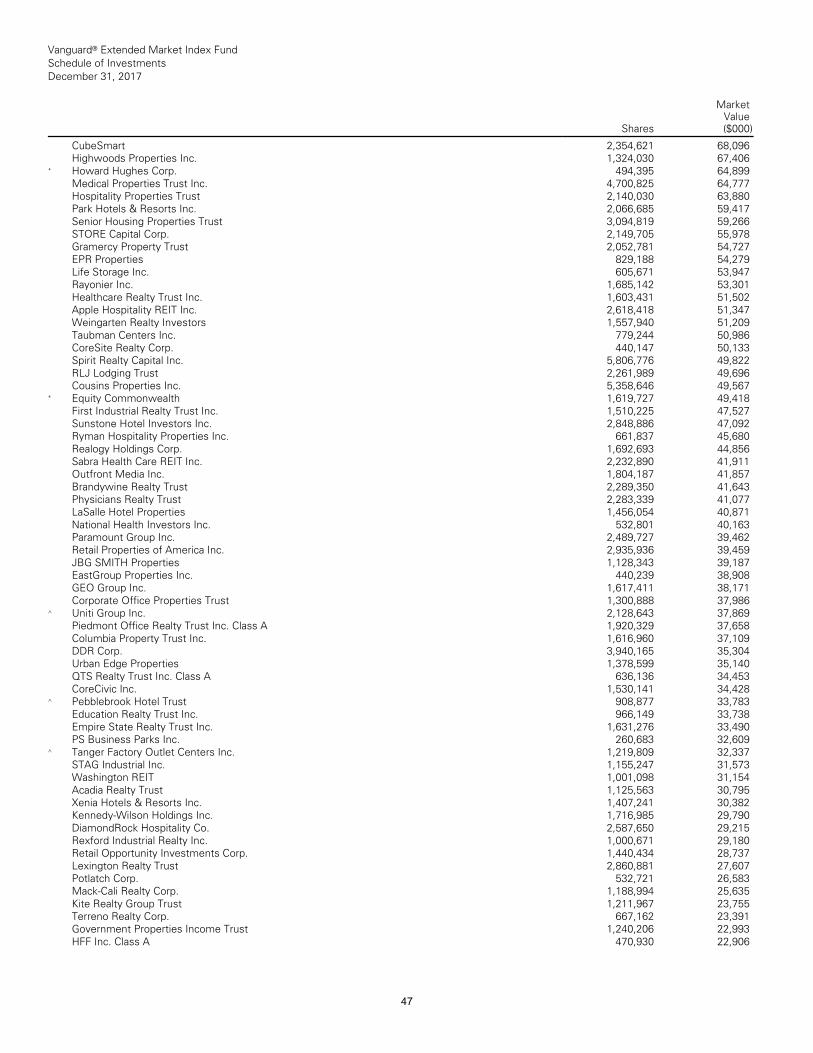
Vanguard® Extended Market Index Fund Schedule of Investments December 31, 2017
Shares
MarketValue($000)
__________________________________________________________________________________________________________________________________________________________________________________________________________________________________________________________________________________________________________________________________________________________________________________________________________________________________________________________________________________________________________________________________________________________________________________________________________________________________________________________________________________________ __________________________________________________________________________________________________________________________________________________________________________________________________________________________________________________________________________________________________________________________________________________________________________________________________________________________________________________________________________________________________________________________________________________________________________________________________________________________________________________________________________________________
CubeSmart 2,354,621 68,096 Highwoods Properties Inc. 1,324,030 67,406 * Howard Hughes Corp. 494,395 64,899 Medical Properties Trust Inc. 4,700,825 64,777 Hospitality Properties Trust 2,140,030 63,880 Park Hotels & Resorts Inc. 2,066,685 59,417 Senior Housing Properties Trust 3,094,819 59,266 STORE Capital Corp. 2,149,705 55,978 Gramercy Property Trust 2,052,781 54,727 EPR Properties 829,188 54,279 Life Storage Inc. 605,671 53,947 Rayonier Inc. 1,685,142 53,301 Healthcare Realty Trust Inc. 1,603,431 51,502 Apple Hospitality REIT Inc. 2,618,418 51,347 Weingarten Realty Investors 1,557,940 51,209 Taubman Centers Inc. 779,244 50,986 CoreSite Realty Corp. 440,147 50,133 Spirit Realty Capital Inc. 5,806,776 49,822 RLJ Lodging Trust 2,261,989 49,696 Cousins Properties Inc. 5,358,646 49,567 * Equity Commonwealth 1,619,727 49,418 First Industrial Realty Trust Inc. 1,510,225 47,527 Sunstone Hotel Investors Inc. 2,848,886 47,092 Ryman Hospitality Properties Inc. 661,837 45,680 Realogy Holdings Corp. 1,692,693 44,856 Sabra Health Care REIT Inc. 2,232,890 41,911 Outfront Media Inc. 1,804,187 41,857 Brandywine Realty Trust 2,289,350 41,643 Physicians Realty Trust 2,283,339 41,077 LaSalle Hotel Properties 1,456,054 40,871 National Health Investors Inc. 532,801 40,163 Paramount Group Inc. 2,489,727 39,462 Retail Properties of America Inc. 2,935,936 39,459 JBG SMITH Properties 1,128,343 39,187 EastGroup Properties Inc. 440,239 38,908 GEO Group Inc. 1,617,411 38,171 Corporate Office Properties Trust 1,300,888 37,986 ^ Uniti Group Inc. 2,128,643 37,869 Piedmont Office Realty Trust Inc. Class A 1,920,329 37,658 Columbia Property Trust Inc. 1,616,960 37,109 DDR Corp. 3,940,165 35,304 Urban Edge Properties 1,378,599 35,140 QTS Realty Trust Inc. Class A 636,136 34,453 CoreCivic Inc. 1,530,141 34,428 ^ Pebblebrook Hotel Trust 908,877 33,783 Education Realty Trust Inc. 966,149 33,738 Empire State Realty Trust Inc. 1,631,276 33,490 PS Business Parks Inc. 260,683 32,609 ^ Tanger Factory Outlet Centers Inc. 1,219,809 32,337 STAG Industrial Inc. 1,155,247 31,573 Washington REIT 1,001,098 31,154 Acadia Realty Trust 1,125,563 30,795 Xenia Hotels & Resorts Inc. 1,407,241 30,382 Kennedy-Wilson Holdings Inc. 1,716,985 29,790 DiamondRock Hospitality Co. 2,587,650 29,215 Rexford Industrial Realty Inc. 1,000,671 29,180 Retail Opportunity Investments Corp. 1,440,434 28,737 Lexington Realty Trust 2,860,881 27,607 Potlatch Corp. 532,721 26,583 Mack-Cali Realty Corp. 1,188,994 25,635 Kite Realty Group Trust 1,211,967 23,755 Terreno Realty Corp. 667,162 23,391 Government Properties Income Trust 1,240,206 22,993 HFF Inc. Class A 470,930 22,906
47
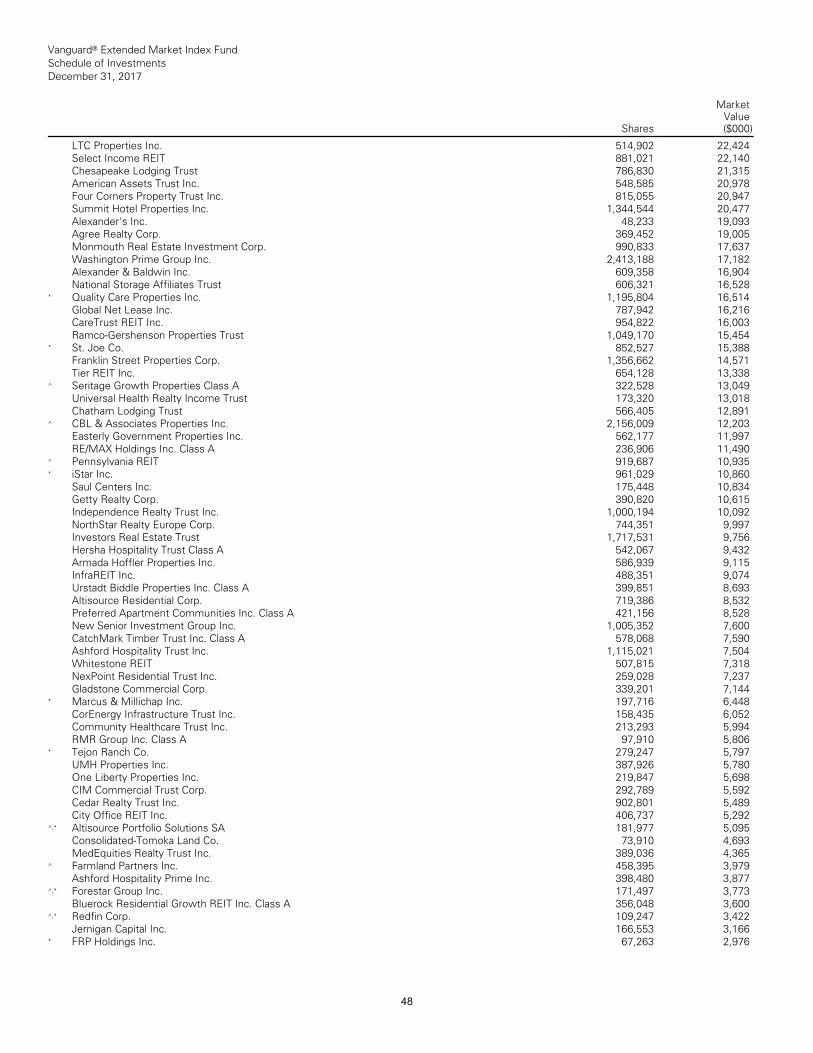
Vanguard® Extended Market Index Fund Schedule of Investments December 31, 2017
Shares
MarketValue($000)
__________________________________________________________________________________________________________________________________________________________________________________________________________________________________________________________________________________________________________________________________________________________________________________________________________________________________________________________________________________________________________________________________________________________________________________________________________________________________________________________________________________________ __________________________________________________________________________________________________________________________________________________________________________________________________________________________________________________________________________________________________________________________________________________________________________________________________________________________________________________________________________________________________________________________________________________________________________________________________________________________________________________________________________________________
LTC Properties Inc. 514,902 22,424 Select Income REIT 881,021 22,140 Chesapeake Lodging Trust 786,830 21,315 American Assets Trust Inc. 548,585 20,978 Four Corners Property Trust Inc. 815,055 20,947 Summit Hotel Properties Inc. 1,344,544 20,477 Alexander's Inc. 48,233 19,093 Agree Realty Corp. 369,452 19,005 Monmouth Real Estate Investment Corp. 990,833 17,637 Washington Prime Group Inc. 2,413,188 17,182 Alexander & Baldwin Inc. 609,358 16,904 National Storage Affiliates Trust 606,321 16,528 * Quality Care Properties Inc. 1,195,804 16,514 Global Net Lease Inc. 787,942 16,216 CareTrust REIT Inc. 954,822 16,003 Ramco-Gershenson Properties Trust 1,049,170 15,454 * St. Joe Co. 852,527 15,388 Franklin Street Properties Corp. 1,356,662 14,571 Tier REIT Inc. 654,128 13,338 ^ Seritage Growth Properties Class A 322,528 13,049 Universal Health Realty Income Trust 173,320 13,018 Chatham Lodging Trust 566,405 12,891 ^ CBL & Associates Properties Inc. 2,156,009 12,203 Easterly Government Properties Inc. 562,177 11,997 RE/MAX Holdings Inc. Class A 236,906 11,490 ^ Pennsylvania REIT 919,687 10,935 * iStar Inc. 961,029 10,860 Saul Centers Inc. 175,448 10,834 Getty Realty Corp. 390,820 10,615 Independence Realty Trust Inc. 1,000,194 10,092 NorthStar Realty Europe Corp. 744,351 9,997 Investors Real Estate Trust 1,717,531 9,756 Hersha Hospitality Trust Class A 542,067 9,432 Armada Hoffler Properties Inc. 586,939 9,115 InfraREIT Inc. 488,351 9,074 Urstadt Biddle Properties Inc. Class A 399,851 8,693 Altisource Residential Corp. 719,386 8,532 Preferred Apartment Communities Inc. Class A 421,156 8,528 New Senior Investment Group Inc. 1,005,352 7,600 CatchMark Timber Trust Inc. Class A 578,068 7,590 Ashford Hospitality Trust Inc. 1,115,021 7,504 Whitestone REIT 507,815 7,318 NexPoint Residential Trust Inc. 259,028 7,237 Gladstone Commercial Corp. 339,201 7,144 * Marcus & Millichap Inc. 197,716 6,448 CorEnergy Infrastructure Trust Inc. 158,435 6,052 Community Healthcare Trust Inc. 213,293 5,994 RMR Group Inc. Class A 97,910 5,806 * Tejon Ranch Co. 279,247 5,797 UMH Properties Inc. 387,926 5,780 One Liberty Properties Inc. 219,847 5,698 CIM Commercial Trust Corp. 292,789 5,592 Cedar Realty Trust Inc. 902,801 5,489 City Office REIT Inc. 406,737 5,292 ^,* Altisource Portfolio Solutions SA 181,977 5,095 Consolidated-Tomoka Land Co. 73,910 4,693 MedEquities Realty Trust Inc. 389,036 4,365 ^ Farmland Partners Inc. 458,395 3,979 Ashford Hospitality Prime Inc. 398,480 3,877 ^,* Forestar Group Inc. 171,497 3,773 Bluerock Residential Growth REIT Inc. Class A 356,048 3,600 ^,* Redfin Corp. 109,247 3,422 Jernigan Capital Inc. 166,553 3,166 * FRP Holdings Inc. 67,263 2,976
48
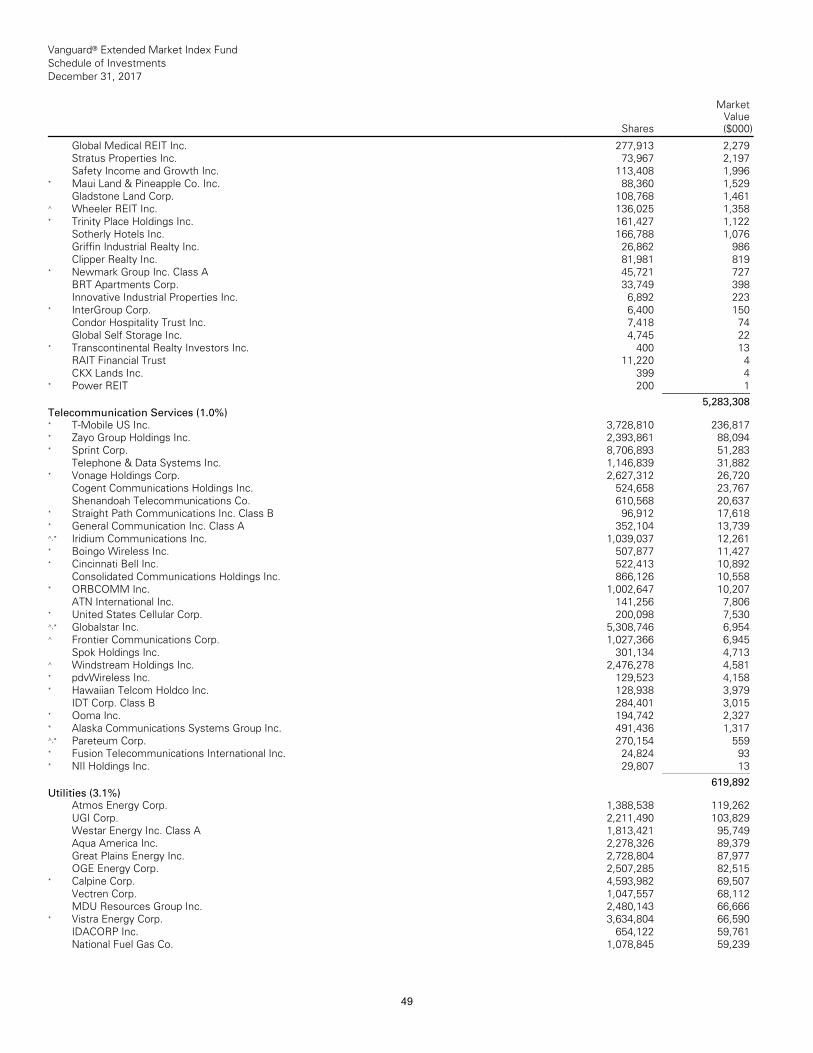
Vanguard® Extended Market Index Fund Schedule of Investments December 31, 2017
Shares
MarketValue($000)
__________________________________________________________________________________________________________________________________________________________________________________________________________________________________________________________________________________________________________________________________________________________________________________________________________________________________________________________________________________________________________________________________________________________________________________________________________________________________________________________________________________________ __________________________________________________________________________________________________________________________________________________________________________________________________________________________________________________________________________________________________________________________________________________________________________________________________________________________________________________________________________________________________________________________________________________________________________________________________________________________________________________________________________________________
Global Medical REIT Inc. 277,913 2,279 Stratus Properties Inc. 73,967 2,197 Safety Income and Growth Inc. 113,408 1,996 * Maui Land & Pineapple Co. Inc. 88,360 1,529 Gladstone Land Corp. 108,768 1,461 ^ Wheeler REIT Inc. 136,025 1,358 * Trinity Place Holdings Inc. 161,427 1,122 Sotherly Hotels Inc. 166,788 1,076 Griffin Industrial Realty Inc. 26,862 986 Clipper Realty Inc. 81,981 819 * Newmark Group Inc. Class A 45,721 727 BRT Apartments Corp. 33,749 398 Innovative Industrial Properties Inc. 6,892 223 * InterGroup Corp. 6,400 150 Condor Hospitality Trust Inc. 7,418 74 Global Self Storage Inc. 4,745 22 * Transcontinental Realty Investors Inc. 400 13 RAIT Financial Trust 11,220 4 CKX Lands Inc. 399 4 * Power REIT 200 1 ___________ 5,283,308 Telecommunication Services (1.0%)
* T-Mobile US Inc. 3,728,810 236,817 * Zayo Group Holdings Inc. 2,393,861 88,094 * Sprint Corp. 8,706,893 51,283 Telephone & Data Systems Inc. 1,146,839 31,882 * Vonage Holdings Corp. 2,627,312 26,720 Cogent Communications Holdings Inc. 524,658 23,767 Shenandoah Telecommunications Co. 610,568 20,637 * Straight Path Communications Inc. Class B 96,912 17,618 * General Communication Inc. Class A 352,104 13,739 ^,* Iridium Communications Inc. 1,039,037 12,261 * Boingo Wireless Inc. 507,877 11,427 * Cincinnati Bell Inc. 522,413 10,892 Consolidated Communications Holdings Inc. 866,126 10,558 * ORBCOMM Inc. 1,002,647 10,207 ATN International Inc. 141,256 7,806 * United States Cellular Corp. 200,098 7,530 ^,* Globalstar Inc. 5,308,746 6,954 ^ Frontier Communications Corp. 1,027,366 6,945 Spok Holdings Inc. 301,134 4,713 ^ Windstream Holdings Inc. 2,476,278 4,581 * pdvWireless Inc. 129,523 4,158 * Hawaiian Telcom Holdco Inc. 128,938 3,979 IDT Corp. Class B 284,401 3,015 * Ooma Inc. 194,742 2,327 * Alaska Communications Systems Group Inc. 491,436 1,317 ^,* Pareteum Corp. 270,154 559 * Fusion Telecommunications International Inc. 24,824 93 * NII Holdings Inc. 29,807 13 ___________ 619,892 Utilities (3.1%)
Atmos Energy Corp. 1,388,538 119,262 UGI Corp. 2,211,490 103,829 Westar Energy Inc. Class A 1,813,421 95,749 Aqua America Inc. 2,278,326 89,379 Great Plains Energy Inc. 2,728,804 87,977 OGE Energy Corp. 2,507,285 82,515 * Calpine Corp. 4,593,982 69,507 Vectren Corp. 1,047,557 68,112 MDU Resources Group Inc. 2,480,143 66,666 * Vistra Energy Corp. 3,634,804 66,590 IDACORP Inc. 654,122 59,761 National Fuel Gas Co. 1,078,845 59,239
49
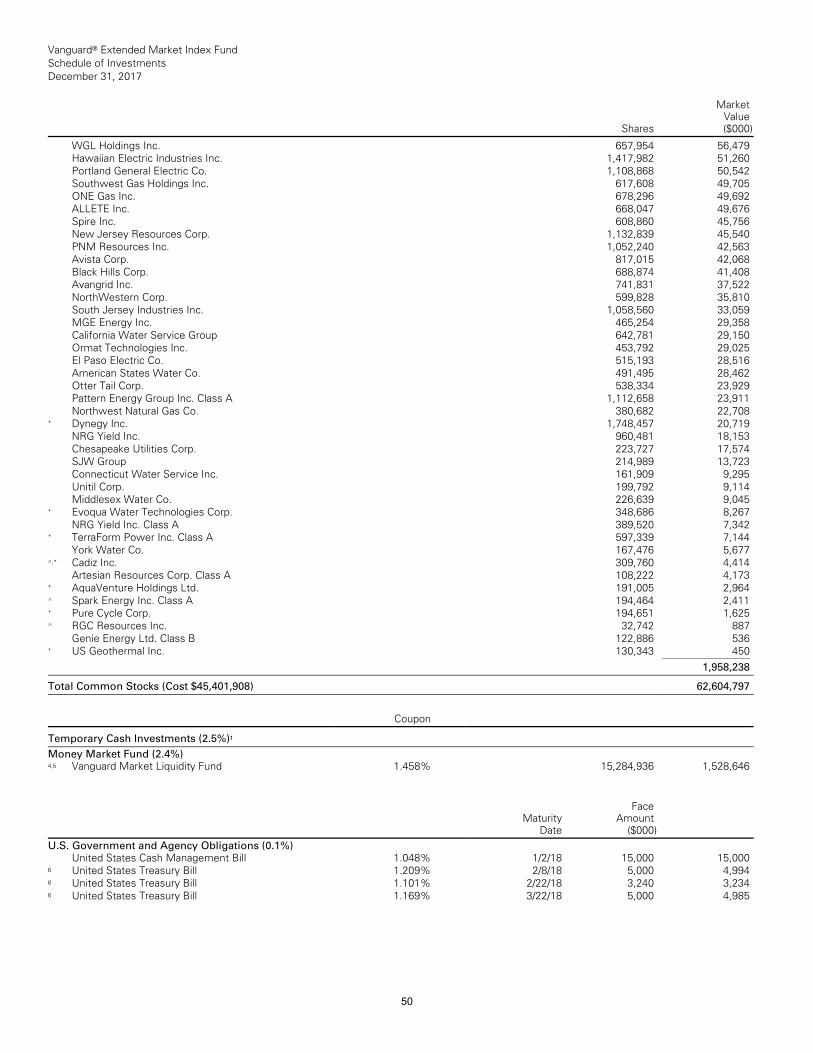
Vanguard® Extended Market Index Fund Schedule of Investments December 31, 2017
Shares
MarketValue($000)
__________________________________________________________________________________________________________________________________________________________________________________________________________________________________________________________________________________________________________________________________________________________________________________________________________________________________________________________________________________________________________________________________________________________________________________________________________________________________________________________________________________________ __________________________________________________________________________________________________________________________________________________________________________________________________________________________________________________________________________________________________________________________________________________________________________________________________________________________________________________________________________________________________________________________________________________________________________________________________________________________________________________________________________________________
WGL Holdings Inc. 657,954 56,479 Hawaiian Electric Industries Inc. 1,417,982 51,260 Portland General Electric Co. 1,108,868 50,542 Southwest Gas Holdings Inc. 617,608 49,705 ONE Gas Inc. 678,296 49,692 ALLETE Inc. 668,047 49,676 Spire Inc. 608,860 45,756 New Jersey Resources Corp. 1,132,839 45,540 PNM Resources Inc. 1,052,240 42,563 Avista Corp. 817,015 42,068 Black Hills Corp. 688,874 41,408 Avangrid Inc. 741,831 37,522 NorthWestern Corp. 599,828 35,810 South Jersey Industries Inc. 1,058,560 33,059 MGE Energy Inc. 465,254 29,358 California Water Service Group 642,781 29,150 Ormat Technologies Inc. 453,792 29,025 El Paso Electric Co. 515,193 28,516 American States Water Co. 491,495 28,462 Otter Tail Corp. 538,334 23,929 Pattern Energy Group Inc. Class A 1,112,658 23,911 Northwest Natural Gas Co. 380,682 22,708 * Dynegy Inc. 1,748,457 20,719 NRG Yield Inc. 960,481 18,153 Chesapeake Utilities Corp. 223,727 17,574 SJW Group 214,989 13,723 Connecticut Water Service Inc. 161,909 9,295 Unitil Corp. 199,792 9,114 Middlesex Water Co. 226,639 9,045 * Evoqua Water Technologies Corp. 348,686 8,267 NRG Yield Inc. Class A 389,520 7,342 * TerraForm Power Inc. Class A 597,339 7,144 York Water Co. 167,476 5,677 ^,* Cadiz Inc. 309,760 4,414 Artesian Resources Corp. Class A 108,222 4,173 * AquaVenture Holdings Ltd. 191,005 2,964 ^ Spark Energy Inc. Class A 194,464 2,411 * Pure Cycle Corp. 194,651 1,625 ^ RGC Resources Inc. 32,742 887 Genie Energy Ltd. Class B 122,886 536 * US Geothermal Inc. 130,343 450 ___________ 1,958,238 __________________________________________________________________________________________________________________________________________________________________________________________________________________________________________________________________________________________________________________________________________________________________________________________________________________________________________________________________________________________________________________________________________________________________________________________________________________________________________________________________________________________ __________________________________________________________________________________________________________________________________________________________________________________________________________________________________________________________________________________________________________________________________________________________________________________________________________________________________________________________________________________________________________________________________________________________________________________________________________________________________________________________________________________________
Total Common Stocks (Cost $45,401,908) 62,604,797 __________________________________________________________________________________________________________________________________________________________________________________________________________________________________________________________________________________________________________________________________________________________________________________________________________________________________________________________________________________________________________________________________________________________________________________________________________________________________________________________________________________________ __________________________________________________________________________________________________________________________________________________________________________________________________________________________________________________________________________________________________________________________________________________________________________________________________________________________________________________________________________________________________________________________________________________________________________________________________________________________________________________________________________________________
Coupon __________________________________________________________________________________________________________________________________________________________________________________________________________________________________________________________________________________________________________________________________________________________________________________________________________________________________________________________________________________________________________________________________________________________________________________________________________________________________________________________________________________________ __________________________________________________________________________________________________________________________________________________________________________________________________________________________________________________________________________________________________________________________________________________________________________________________________________________________________________________________________________________________________________________________________________________________________________________________________________________________________________________________________________________________
Temporary Cash Investments (2.5%)1 __________________________________________________________________________________________________________________________________________________________________________________________________________________________________________________________________________________________________________________________________________________________________________________________________________________________________________________________________________________________________________________________________________________________________________________________________________________________________________________________________________________________ __________________________________________________________________________________________________________________________________________________________________________________________________________________________________________________________________________________________________________________________________________________________________________________________________________________________________________________________________________________________________________________________________________________________________________________________________________________________________________________________________________________________
Money Market Fund (2.4%)
4,5 Vanguard Market Liquidity Fund 1.458% 15,284,936 1,528,646
Maturity
Date
FaceAmount
($000) __________________________________________________________________________________________________________________________________________________________________________________________________________________________________________________________________________________________________________________________________________________________________________________________________________________________________________________________________________________________________________________________________________________________________________________________________________________________________________________________________________________________ __________________________________________________________________________________________________________________________________________________________________________________________________________________________________________________________________________________________________________________________________________________________________________________________________________________________________________________________________________________________________________________________________________________________________________________________________________________________________________________________________________________________
U.S. Government and Agency Obligations (0.1%)
United States Cash Management Bill 1.048% 1/2/18 15,000 15,000 6 United States Treasury Bill 1.209% 2/8/18 5,000 4,994 6 United States Treasury Bill 1.101% 2/22/18 3,240 3,234 6 United States Treasury Bill 1.169% 3/22/18 5,000 4,985
50
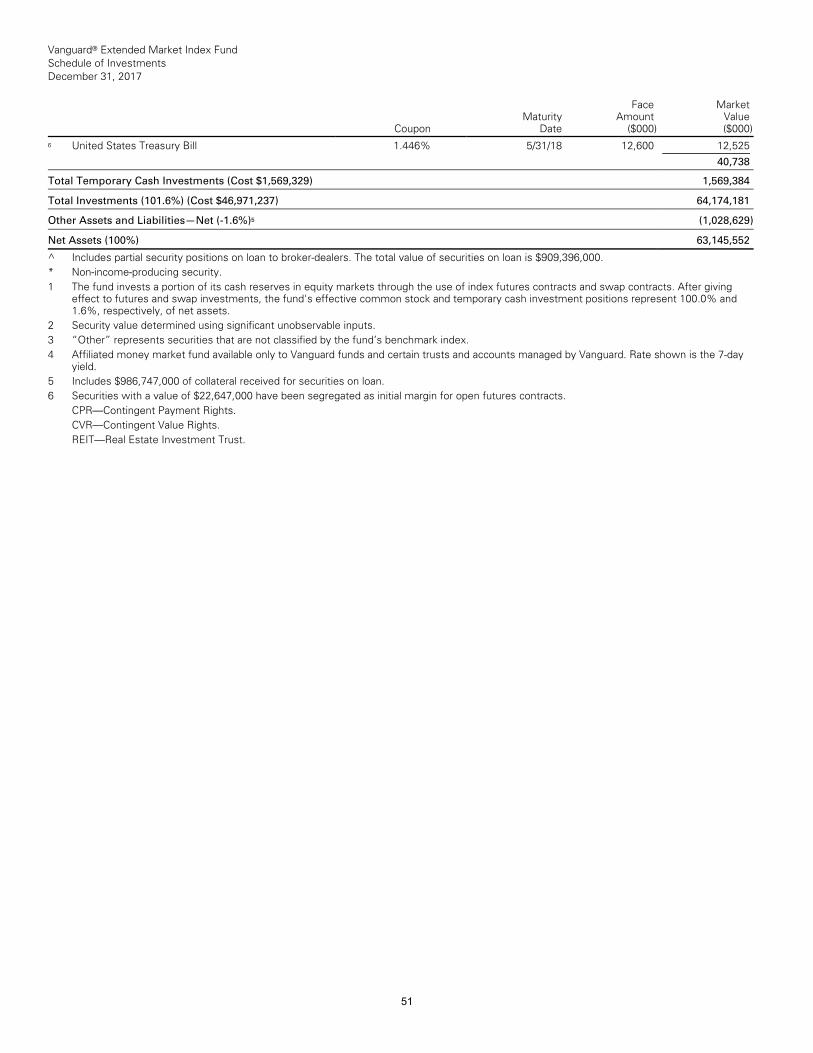
Vanguard® Extended Market Index Fund Schedule of Investments December 31, 2017
Coupon Maturity
Date
FaceAmount
($000)
MarketValue($000)
__________________________________________________________________________________________________________________________________________________________________________________________________________________________________________________________________________________________________________________________________________________________________________________________________________________________________________________________________________________________________________________________________________________________________________________________________________________________________________________________________________________________ __________________________________________________________________________________________________________________________________________________________________________________________________________________________________________________________________________________________________________________________________________________________________________________________________________________________________________________________________________________________________________________________________________________________________________________________________________________________________________________________________________________________
6 United States Treasury Bill 1.446% 5/31/18 12,600 12,525 ___________40,738
__________________________________________________________________________________________________________________________________________________________________________________________________________________________________________________________________________________________________________________________________________________________________________________________________________________________________________________________________________________________________________________________________________________________________________________________________________________________________________________________________________________________ __________________________________________________________________________________________________________________________________________________________________________________________________________________________________________________________________________________________________________________________________________________________________________________________________________________________________________________________________________________________________________________________________________________________________________________________________________________________________________________________________________________________
Total Temporary Cash Investments (Cost $1,569,329) 1,569,384 __________________________________________________________________________________________________________________________________________________________________________________________________________________________________________________________________________________________________________________________________________________________________________________________________________________________________________________________________________________________________________________________________________________________________________________________________________________________________________________________________________________________ __________________________________________________________________________________________________________________________________________________________________________________________________________________________________________________________________________________________________________________________________________________________________________________________________________________________________________________________________________________________________________________________________________________________________________________________________________________________________________________________________________________________
Total Investments (101.6%) (Cost $46,971,237) 64,174,181 __________________________________________________________________________________________________________________________________________________________________________________________________________________________________________________________________________________________________________________________________________________________________________________________________________________________________________________________________________________________________________________________________________________________________________________________________________________________________________________________________________________________ __________________________________________________________________________________________________________________________________________________________________________________________________________________________________________________________________________________________________________________________________________________________________________________________________________________________________________________________________________________________________________________________________________________________________________________________________________________________________________________________________________________________
Other Assets and Liabilities—Net (-1.6%)5 (1,028,629) __________________________________________________________________________________________________________________________________________________________________________________________________________________________________________________________________________________________________________________________________________________________________________________________________________________________________________________________________________________________________________________________________________________________________________________________________________________________________________________________________________________________ __________________________________________________________________________________________________________________________________________________________________________________________________________________________________________________________________________________________________________________________________________________________________________________________________________________________________________________________________________________________________________________________________________________________________________________________________________________________________________________________________________________________
Net Assets (100%) 63,145,552 __________________________________________________________________________________________________________________________________________________________________________________________________________________________________________________________________________________________________________________________________________________________________________________________________________________________________________________________________________________________________________________________________________________________________________________________________________________________________________________________________________________________ __________________________________________________________________________________________________________________________________________________________________________________________________________________________________________________________________________________________________________________________________________________________________________________________________________________________________________________________________________________________________________________________________________________________________________________________________________________________________________________________________________________________
^ Includes partial security positions on loan to broker-dealers. The total value of securities on loan is $909,396,000. * Non-income-producing security.1 The fund invests a portion of its cash reserves in equity markets through the use of index futures contracts and swap contracts. After giving
effect to futures and swap investments, the fund's effective common stock and temporary cash investment positions represent 100.0% and 1.6%, respectively, of net assets.
2 Security value determined using significant unobservable inputs. 3 “Other” represents securities that are not classified by the fund’s benchmark index. 4 Affiliated money market fund available only to Vanguard funds and certain trusts and accounts managed by Vanguard. Rate shown is the 7-day
yield. 5 Includes $986,747,000 of collateral received for securities on loan. 6 Securities with a value of $22,647,000 have been segregated as initial margin for open futures contracts.
CPR—Contingent Payment Rights. CVR—Contingent Value Rights. REIT—Real Estate Investment Trust.
51

© 2018 The Vanguard Group, Inc. All rights reserved. Vanguard Marketing Corporation, Distributor. SNA980 022018