Embed Size (px)
Citation preview

1
The fillet of a rock on the Moon: Cohesion and size dependent abrasion rates from topographic diffusion, LRO/NAC and Apollo images
O. Rüsch1 and C. Wöhler2
1. Institut für Planetologie, Westfälische Wilhelms Universität Münster, Münster, Germany2. Image Analysis Group, Technical University of Dortmund, Dortmund, Germany
Submitted to: Icarus, August 31, 2021
Contact details: Dr. Ottaviano Rüsch Institut für Planetologie Westfälische Wilhelms Universität Münster Wilhelm-Klemm-Straße 10 48149 Münster Germany Email: ottaviano.ruesch (at) uni-muenster.de
Abstract The efficiency of regolith production is key in understanding the properties of airless
surfaces. Debris aprons, of fillets, around rocks are an ubiquitous morphology on many surfaces
without atmosphere, which origin and evolution are largely unknown. Here we show that fillet
originates from the juxtaposed rock under abrasion and that rocks of different cohesion have
fillets with distinct morphological evolution. Thus, a fillet around a rock allows to disentangle
rock cohesion from its surface exposure age. By combing topographic diffusion modeling with
images of blocks of known age on the Moon we find abrasion rates for cm-sized boulders
similar to regional rates (0.2 mm/Myr), whereas for 10-m sized blocks the rate is two order of
magnitude higher (20 mm/Myr). Rates for instances of rocks of higher strength are reduced by
~50%. Fillets around lunar rocks are consistent with abrasion by isotropic micrometeoroid
bombardment.
1. Introduction
Planetary geology of proximity is the area of research that we refer to for investigations
of features observable, in theory and in practice, by the naked human eye on a planetary surface,
i.e., features from the millimeter to a thousand meter. Up to now, data acquired directly by
humans in this spatial domain is limited to the Apollo missions on the Moon. Orbiting
spacecraft at low altitude, however, are providing an increasingly higher volume of data in this
spatial range. A ubiquitous geological feature of proximity is the block (1˗100 m) and the
smaller boulder (0.1˗1 m) (Bruno and Ruban, 2017). By investigating the evolution of these

2
features after their formation, either by impact ejecta or mass wasting, it is possible to better
comprehend how regolith evolves with time, e.g., the type and rate of erosion processes and
their interplay with the physical and compositional nature of the surface (e.g., Hörz et al., 1977).
The concept of this article is to gain insights from single instances of this feature (i.e.,
“a rock” as in McDonnell et al., 1977) and not by analyzing an entire population. We choose
to concentrate on panchromatic reflected radiation from surfaces in the visible wavelength
range. By working with this range, one has access to the highest ground sampling resolution:
the resolution being a function of the acquisition time of an orbiting camera and thus controlled
by the power of the incoming radiation at the sensor. A drawback of panchromatic light is the
challenge of extracting compositional information, a much aimed and critical knowledge. Using
the radiation outside the visible wavelengths is the common approach to infer the composition.
However, the physical description of the topography and associated modeling is achieved better
by harvesting visible images, for example to estimate the age of single craters (e.g., Fassett and
Thomson, 2014, Richardson et al., 2020). Here we take an approach similar to that of Fassett
and Thomson (2014) to extract age and material strength information from observations of
blocks. We focus on blocks of the Moon because of the wealth of information available in terms
of their age (in particular surface exposure ages by returned samples) and observations by
Apollo astronauts, unmanned landers and Lunar Reconnaissance Orbiter Camera/Narrow
Angle Camera (LROC/NAC) (Robinson et al., 2010) images.
The evolution of blocks on the lunar surface is controlled by meteoroid impacts that lead
to two morphologically distinct effects: abrasion (e.g., Shoemaker et al., 1970; Gault et al.,
1972; Hörz et al., 1974) and shattering (e.g., Hörz et al., 1975a; Hörz, 1977). Shattering, or
fragmentation, of lunar blocks was recently described in morphological terms by Ruesch et al.
(2020) and literature therein. Here we focus only on erosion by abrasion. This type of process
has received relatively little attention in the past due to the fact that erosion by shattering is a
more efficient erosive process for blocks (Hörz et al., 1975a). Abrasion, however, is the process
responsible for a characteristic lunar morphology, the fillet, an embankment of fine-grained
material around rocks (Figure 1) (Shoemaker et al., 1969). A review of the literature reveals
that rocks with fillets, sometime identifiable only as “mounds”, are ubiquitous features on
bodies larger than several km like Phobos (e.g. Thomas et al., 2000), 433 Eros (e.g., Thomas et
al. 2001, Dombard et al., 2010), 4 Vesta (Schroeder et al., 2021), 1 Ceres (Schroeder et al.,
2021), 21 Lutetia (Küpper et al., 2012), Mercury (Kreslavsky et al., 2021), and potentially on
243 Ida (Fig. 9d in Sullivan et al., 1996). As it was suggested during the Apollo era (Swann et
al., 1972), we shall see that the morphometry of the fillet is a useful diagnostic tool. In this work

3
we aim to model the three–dimensional topographic evolution of a block due to abrasion in
order to (i) attempt to disentangle temporal and compositional effects, (ii) determine erosion
rates of blocks, and (iii) provide simulated images to enable photo-geological interpretation and
mapping of blocks under varying stages of erosion. Throughout this study we differentiate
between the meaning of the terms “block” and “rock”. We use the term “block” to refer to the
whole rock-fillet feature. The term “rock” is used to refer to the consolidated material from
which the fillet is produced.
2. Methods
2.1 Modeling of topographic diffusion for a block
2.1.1 The diffusion approximation
Micrometeorite bombardment is responsible for the abrasion of block on the lunar
surface (e.g., Shoemaker et al., 1970a; Gault et al., 1972; Hörz et al., 1974, 1977, 2020).
Additional processes, such as thermal stresses due to diurnal temperature variations (Molaro
and Byrne, 2012) and seismic shaking (Schultz and Gault, 1975) might contribute to their
erosion but their importance appears subordinate to meteoroid impacts (e.g., Ruesch et al.,
2020). We thus consider micrometeorite bombardment alone in this study. Each micrometeorite
impact excavates and melts a very small amount of rock material and deposits a fraction of it
around the pit (e.g., Hörz et al., 1975b, Morrison and Clanton, 1979; Loeffler et al., 2008;
Harries et al., 2016). This repeated process takes place at a spatial scale much smaller than the
rock itself and can be described with the diffusion equation (e.g., Soderblom, 1970; Craddock
and Howard, 2000; Howard, 2007). This approach has been used by Fassett and Thompson
(2014) to model the topographic evolution of large craters with gentle slopes due to
micrometeorite bombardment. Here we follow the same approach for the topography of blocks.
As we shall see, the diffusion equation allows us to efficiently model the topographic evolution
of a block. The topographically steep edges of a rock represent non-ideal conditions (not a
gentle slope) for the applicability of the diffusion approach. However, vertical slopes are only
present at the beginning of the simulation period. The diffusion equation requires that the flux
of material is proportional to the topographic gradient and that any change in material flux
results in an increase or decrease in elevation (e.g., Pelletier, 2008). In one dimension, it can be
expressed with the second-order differential equation: !"!# = " !!"
!$! (eq. 1)

4
with h the elevation above the surrounding, x the distance and t time. As in Fassett and
Thompson (2014), we use k to denote the diffusivity coefficient. The equation is solved with
the Alternating-Direction-Implicit method (e.g., Pelletier, 2008).
2.1.2 Diffusion applied to blocks
Proximity observations by the Apollo astronauts have revealed that rocks can partially
or completely be surrounded by an embankment of fine-grained material, often in an apron
configuration, termed fillet (e.g., Muehlberger et al., 1972). The fillet has an onlap contact with
the juxtaposing rock and decrease in thickness away from the rock (Figure 2a). Apollo era
literature (e.g., Swann et al., 1971, 1972, Muehlberger et al., 1972) reports that fillets form by
accumulation of material abraded away from the adjacent rock and by the ballistic interception
of ejecta from distant large impacts due to the rock topography acting as shield. Although we
cannot exclude the latter process, it is clear from a visual investigation of blocks of the same
age and same nearby context that that the former is the dominant process (Figure 1). In addition,
we do not consider rocks near or on sloping terrains that could accumulate loose material on
their uphill side (e.g., Swann et al., 1972). Thus, we only consider fillets built up by
accumulation of material from the juxtaposing rock. In this context, primary factors responsible
for the fillet coverage and morphology were reported to be (i) coherence or friability of the
rock, (ii) the original shape of the rock upon reaching its current location, and (iii) the surface
exposure age (Swann et al., 1972). Coherence and exposure age are set as variables in the model
developed here. To simplify comparisons, the rock shape at the start of the simulation is set
constant for all runs with the three axes of a rectangular cuboid a, b and c (a>b>c) defined as
b/a=0.8 and c/a=0.54. These ratios are mean values observed for lunar blocks (Demidov and
Basilevsky, 2014) and are similar to the shape of fragments produced by impact shattering (e.g.,
Michikami et al., 2016). In additional runs, topographic variations are introduced in the top face
of the rectangular cuboid to assess the role of rock shape irregularities.
The coupling between rock erosion and fillet deposition is performed with two major
requirements that are detailed further below: (i) the mass of material eroded from the rock by
diffusion is deposited right outside the initial rock boundary and is responsible to build up the
fillet deposit; (ii) the fillet deposit that is juxtaposed to the rock is composed of loose particles,
i.e., has lower density and higher diffusivity than the rock.
The mass of material eroded from the rock is defined by letting the topography of the
rock diffuse (Figure 3). All mass that after diffusion is located behind the original boundary of
the rock is classified as eroded. Apollo astronaut images shows that most of the material eroded

5
from the rock is deposited at the rock-fillet boundary (Figure 2b). This observation justifies the
relatively simple assumption of material deposition right off the edge of the original rock
(Figure 3). In three dimensions, the flow rate of eroded material is not constant around the
boundary of the rock. The amount of deposited material at a given location along the rock
boundary is thus set proportional to the flow rate at that location. The topography of the rock-
fillet system is a combination of the diffused rock and diffused fillet: within the original
boundary of the rock the topography is determined by the diffused rock, whereas outside the
original boundary of the rock the topography corresponds to the diffused fillet (Figure 3).
2.1.2 Model with two diffusivity coefficients
Upon comparison of Apollo astronaut observations with a rock-fillet topography
diffused with the same diffusivity coefficient for both fillet and rock sections the mismatch (not
shown) between model and observation is evident. The mean slope of the fillet section is
observed to be considerably lower than the slope within the abraded rock section. This is the
observation that justifies the use of two distinct diffusivity coefficient: one for the rock section
(krock) and one for the fillet section (kfillet). Because the mean slope of the fillet is lower than the
rock section, the coefficient for the fillet section needs to be higher than for the rock. The higher
fillet diffusivity is probably related to its unconsolidated nature compared to the solid rock. For
consistency, the density of the fillet section is defined as half of that of the rock. The resulting
volume increase is used when the eroded mass is deposited right outside the block to build up
the fillet.
At a mature erosional stage, Apollo astronaut images show that fillet material onlaps the
rock (Figure 2a). This feature is implemented in the numerical code by allowing the rock
boundary to move inwards at any location where the fillet becomes higher than the rock. The
inward migration stops at a new boundary where the rock has a higher elevation than the fillet.
The code solves the diffusion equation with the Alternating-Direction-Implicit method (e.g.,
Pelletier, 2008) at a time step of 5 kyr and for each point of a 300x300 points spatial grid.
Smaller time steps (down to 0.5 ky) have been tested and do not change the topographic results.
In order to match modeled and observed topographic profiles (section 3.2.1) the
parameter space of diffusivity coefficients is explored by calculating profiles from rock
diffusvity krock = 2x10⁻¹⁰ to krock = 6x10⁻⁴ and fillet diffusivity kfillet = 3x10⁻⁸ to kfillet = 5x10⁻²
(m2/kyr). There are only very limited images that can be used for reliable measurement of the
morphometry of rocks with fillet and for which the surface exposure age is known. Although
filleted rocks are abundant in Apollo astronaut observations, for reliable slope measurements

6
we used only images where the pointing direction of the camera was perpendicular to a vertical
plane across the center of the rock. These instances are listed in Table 1. These topographic
profiles were modeled with three constraints: the initial model rock width was set equal to the
observed rock width, the initial rock height to width ratio was set to 0.54, and, if available, the
exposure age was set to the radiometric exposure age of the rock samples. The parameter krock
and kfillet were set as free parameters. The fitting criteria were (i) the fillet height / rock height
ratio, (ii) fillet slope, and (iii) final rock height / width ratio.
2.2 Derivation of artificial images
Additional testing of the model was performed using LRO/NAC images. Ideally, the
straightforward testing would have seen the comparison of the digital terrain model (DTM)
obtained with the method above with the topography extracted from LRO/NAC stereo images.
However, production of a block topography from NAC images is hindered by the relatively few
pixels resolving it, the high slopes of its sides, and by the strong albedo contrast to the
surroundings. We found that the blocks examined in this study are too small to be reconstructed
reliably by the NAC-based stereo topographic maps. Shape from shading, a method used to
extract small scale features, relies on spatially homogeneous albedo (e.g., Kirk et al., 2003) or
a well-characterized albedo pattern, possibly at lower spatial resolution (Grumpe and Wöhler,
2014). As neither of the two holds true for blocks, the shape from shading technique is
challenging to apply here. Therefore, instead of extracting topography from NAC images, we
used the model topography to produce artificial images and perform the comparison on an
image–to–image basis rather than between topographic profiles. Artificial images were
produced from the DTM with the following steps:
(i) Calculation of illuminated and shadowed facets according to ray tracing.
(ii) Calculation of the surface reflectance assuming a Lambertian (diffuse) reflectance
behavior, where albedo of the block was set to twice the albedo of the regolith and the fillet (in
comparison, Bandfield et al. (2011) set the block albedo to 1.5 times the regolith and fillet
albedo, but we found that a factor of 2 leads to more realistic rendered images).
(iii) To approximate the properties of the NAC camera system (Robinson et al., 2010;
Malin et al., 2007), a point-spread function (PSF) was applied. The PSF was assumed to be of
gaussian shape with a full width at half-maximum of 2 pixels in both vertical and horizontal
direction.
Artificial images were produced with a wide range of diffusivity values, i.e., krock
ranging from 1x10⁻⁵ to 6x10⁻⁴ m2 kyr-1 and kfillet ranging from 2x10⁻⁴ to 1x10-03 m2 kyr-1.

7
The LRO/NAC dataset in the area around crater Byrgius A was visually searched for
blocks with a major axis of 20±5 m, of roughly cubic shape, and observed at an incidence angle
of 55-65º with a ground sampling interval less than 0.7 m/pixel. Where possible, blocks were
selected if consistently oriented as in the artificial images with respect to the Sun azimuth and
if resting on flat, horizontal terrain without additional topographic features (craters, ridges,
smaller blocks). Such criteria allowed meaningful comparison with the blocks modeled in the
artificial images. Blocks formed as ejecta by the Byrgius A impact crater were selected for their
surface exposure age of 47±14 Myr (Morota et al., 2009), that is sufficiently old for blocks to
have developed fillet, and sufficiently young for enough blocks to have survived catastrophic
disruption (e.g., Basilevsky et al., 2013). The block major axis of 20±5 m is sufficiently long
to recognize morphological properties in NAC images and sufficiently small to have abundant
instances in the NAC dataset. NAC images are affected by an artifact that introduces a slight
blurring particularly visible between boundaries (Hamm et al., 2016). This so-called “echo”
effect occurs only over a very short spatial scale (three pixels) so that it was not necessary to
apply a correction to reduce it.
Even if care was taken to select blocks with consistent shapes and without large
additional features nearby, the images contain complex scenes, i.e., show nearby tiny rock
fragments and small impact craters, and shadows by nearby topography. Thus, the scene
complexity and variation hampered an automated procedure and the analysis had to be
performed visually. The comparison between the artificial and actual images was based in
relative terms and focused on the following morphologies:
• The extent of the fillet away from the rock.
• The shape in planar view of the boundary between fillet and surrounding
regolith.
• The type of boundary between fillet and surrounding regolith (e.g, gradual,
abrupt).
• The size and shape of the fillet’s shadow adjacent to the rock’s shadow.
2.3 Size-dependent diffusivity coefficients
As shown in studies of large crater diffusion (Fassett et al., 2018), the coefficient of
diffusivity is size-dependent. The larger the feature of interest (e.g., crater, block), the larger is
the meteoroid projectile that can abrade it without completely shattering it. The benchmark
blocks in Table 1 were used to extrapolate the rock and fillet diffusivity coefficients as a
function of size.

8
3. Results
3.1 Topographic profiles and morphometry
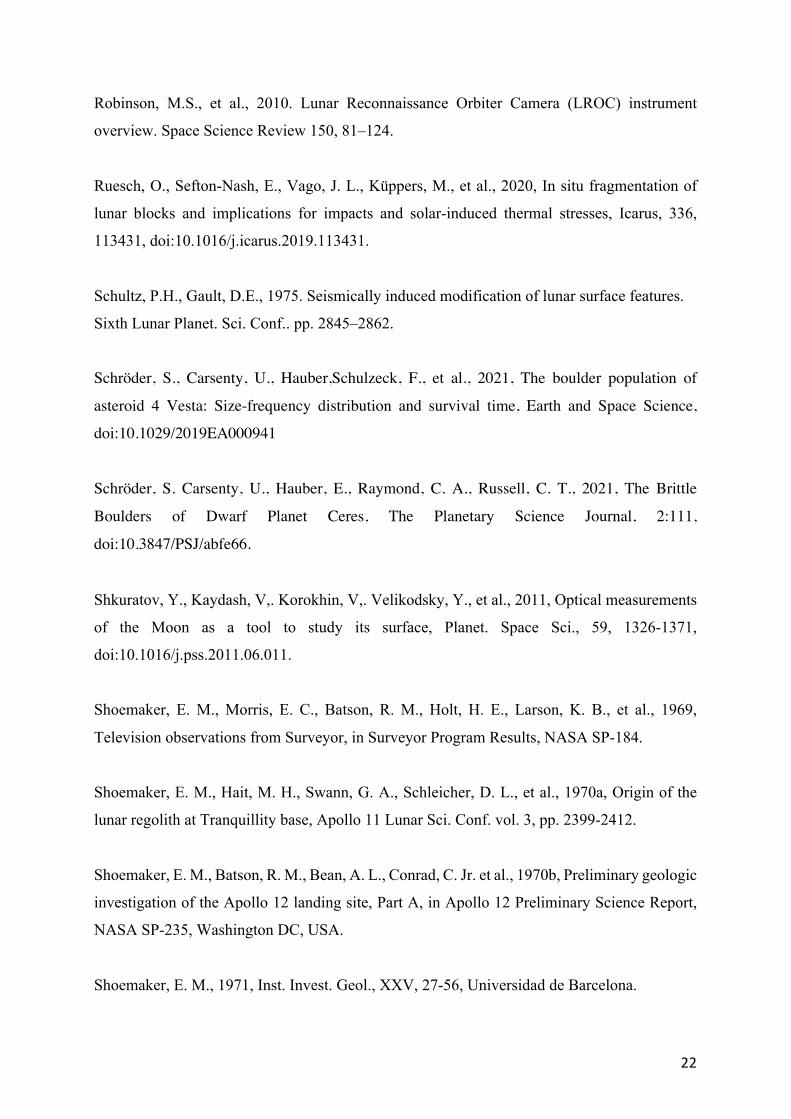
The topographic profiles across the abraded blocks (Figure 4 and 5) shows that independent of
the rock age, the height of the fillet at the contact with the rock is determined by the rock
coefficient of diffusivity. Considerable changes of the fillet height with time occurs only when
the fillet starts to overlap and eventually self-buries the rock. This trend is shown with
morphological parameters in Figure 6a. Clearly, the relative height of the fillet at the contact
with the rock increases as the rock diffusivity increases, i.e., as the rock strength decreases.
This relative height increase of the fillet is not due to a decrease of the rock height. In fact,
Figure 6b shows that the rock height to width ratio remains constant for a wide range of rock
diffusivities. Only for very high rock diffusivities, i.e. very weak rocks, and after considerable
surface residence time (>~100 Myr), the height of the rock decreases considerably.
While the ratio between fillet height and block height remains largely constant with exposure
age, the slope of the fillet decreases with time (Figures 4, 5 and 6). The effect played by the
size of the initial rock is minimal for sizes in the range 10 cm to 2 m, and start to be significant
for friable rocks of size around 10 m (Figure 7). Visual investigation of the modeled topographic profiles (Figures 4 and 5) reveals that
the height distribution as a function of distance from the center of a rock of radius rrock can be
approximated, albeit roughly, with two exponential functions:
ℎ(0 < ' ≤ )rock) = ℎrock + )rock)rock*∆,-,
,-.rock
(eq.2)
ℎ(' > )rock) = ℎfillet )rock,& +,-)rock∆, ,
-.fillet (eq.3)
with h and d as the height and distance expressed in meters, respectively. The parameter hrock is
the height of the rock at its center, hfillet the height of the fillet at the boundary to the rock, and
∆' is the distance incremental. For future applications, we provide sets of parameter values that
describe a range of morphological stages of abraded blocks (Table 2).
The effects due to an initial topography deviating from that of a rectangular cuboid are
shown in Figure 8. Two blocks are simulated with the same irregular base in planar view, i.e.,
variable angles between vertical faces (>=90 degrees). The first block was set with a constant
height (10.8 m) at the beginning of the run (Figure 8a and b). The second block was initialized

9
with irregular elevations (6.4 – 13.0 m) (Figure 8c and d). The initial differences of the top face
of the two blocks are still recognizable at 50 Myr (Figure 8a and d). The slope map of the first
block shows that the fillet slope is homogeneously distributed with some irregularities on the
top right portion (Figure 8b) and identifiable on the second block (Figure 8d). The fillet of the
second block is not homogeneously distributed around the rock and is skewed toward the top
right. The mean height and slope of the fillet at the boundary to the rock are lower for the second
block compared to the first (lower by ~0.5 m and a few degrees).
3.2 Calibration of coefficients with images of blocks of known age.
3.2.1 Use of proximity optical images
The blocks that were imaged in ideal conditions by Apollo astronauts are shown in the left-
hand side panels of Figure 9 and listed in Table 1. The topographic profiles of these blocks
were extracted manually and are plotted on the right-hand side panels of Figure 9. On the same
diagrams we show the modeled profiles. The topography of Geophone rock was reproduced
with modeled morphological parameters within 20% of the actual values (Figure 10) and with
the exposure age close to the radiometrically dated sample (Fig. 4a) (Arvidson et al., 1976).
The rounded shape of the rock section of Geophone rock is similar between model and
observation, although it is not possible to know whether this feature formed by micrometeoroid
abrasion or was already present upon block emplacement. Generally, the exact topography is
not reproduced because the rocks originally have complex shapes, i.e., not flat topped, that are
not taken into account in the modeling. Block “1005” is located close to the rim of Cone crater
so that its exposure age could be identified with the age of the crater itself, ~26 Myr (Arvidson
et al., 1975). No fragments from block “1005” were sampled by Astronauts to confirm this age,
however. The shape of block “1005” was reproduced with the exposure age similar to its
inferred age, ~30 Myr. Block “Large mound” was sampled with several different fragments by
Apollo astronauts and two radiometric ages are possible: ~50 Myr or 303±18Myr (Stettler et
al., 1973; Marti and Lugmair, 1971). The topographic modeling was achieved only with an
exposure age of ~300 Myr (Fig. 4e). Block “1006” lies, like block “1005”, near the rim of Cone
crater so that an exposure age of ~26 Myr could be suggested. Like block “1005”, it has not
been sampled and there are no radiometric ages for it. Contrary to the case of block “1005”,
however, it was not possible to reproduce the mound-like topography of block “1006” with an
exposure age of 20–30 Myr. Only with a much older exposure age of ~190 Myr the
morphological parameters were within 20% of the actual values (Figure 10).

10
3.2.2 Use of orbital optical images
We compared the dataset of artificial images covering a wide range of diffusivity values
with actual instances of blocks with visible fillet at the crater rim of Byrgius A (Figure 11).
This comparison is performed for specific block properties (size, shape, age) and observational
conditions (illumination angle) as described in the method section. Only a handful of instances
conformal to the required properties were identified (Figure 11).
3.2.2.1 Fillet diffusivity coefficient
We find that artificial images with fillet diffusivity between 2x10⁻⁴ m2 kyr-1 and 4x10⁻⁴
m2 kyr-1 present the morphological characteristics (Figure 11d, e, f, m, n, o) identifiable in
actual images (Figure 11g, h, i, j, k, l). Artificial images with fillet diffusivity lower than ~2x10-
4 (m2 kyr-1) have (i) fillets with a sharp boundary with the juxtaposing regolith and (ii) spread
away from the mother rock only over a short distance, i.e., less than half the rock minor axis
(Figure 11a, b, c). Such configuration of fillet is not observed. Artificial images with fillet
diffusivity higher than ~4x10⁻⁴ m2 kyr-1 differ from the actual images because (i) there is a
smooth transition between fillet and juxtaposing regolith (Figure 11p, q, r) and (ii) once fully
buried, the underlying rock is mostly erased and its shape is not recognizeable. The latter
characteristic can be seen in Figure 11i and l, where the underlying rock shape is identified with
a flat-topped mound. In Figure 11f the square-based rock shape is not recognizeable because of
the very high values of kfillet and krock.
3.2.2.2 Rock diffusivity coefficient
With fillet diffusivity of 4x10⁻⁴ m2 kyr-1, we find that the diffusivity values for the rock
(krock) can vary between 2x10⁻⁵ and <4x10⁻⁴ m2 kyr-1 to reproduce actual morphologies. A rock
diffusivity lower than 2x10⁻⁵ m2 kyr-1 does not develop fillet material sufficiently fast to build
a fillet relief consistent with the observational dataset, i.e., the fillet has a smooth boundary to
the juxtaposing regolith and has a low topographic relief that does not produce a shadow. The
upper limit (<4x10⁻⁴ m2 kyr-1) is defined by one of the assumptions of the model presented in
section 2.1.2.
With a fillet diffusivity of 2x10⁻⁴ m2 kyr-1, we find that krock values in the range 2x10⁻⁵
to <2x10⁻⁴ m2 kyr-1 are sufficient to reproduce the actual images of the filleted blocks. Again,
krock values lower than 2x10⁻⁵ m2 kyr-1 produce too little fillet material, and as a consequence
the characteristic fillet morphology does not develop. It is to be noted that we focused our

11
survey at Byrgius A on filleted blocks, so that we cannot exclude the presence of few very
blocks of high strength that do not have a surrounding fillet. Such blocks would have krock <
2x10⁻⁵ m2 kyr-1. The abundance of this type of block would be low, however, as most blocks at
Byrgius A have a spatially resolved fillet.
With the range of values of krock and kfillet constrained as explained above and valid for
20 m sized blocks, we produced artificial images every 10 Myr of exposure age (Figure 12).
After the first ~10 Myr, the morphology of a filleted block observable from orbit is strongly
dependent on the krock value rather than on the surface exposure age.
3.2.3 Size-dependent diffusivity coefficients
In the previous section, using Apollo astronaut photographs and LROC/NAC images we
modeled and derived diffusivity coefficients (krock, kfillet) for a total of seven instances of blocks
for which an estimate of the surface exposure age is available (Table 1). These instances cover
a range of block widths from 2 to 20 m. The relation between diffusivity coefficients and block
size is assumed to follow a power law, similar to the size-dependence of the diffusivity of
craters proposed by Fassett et al. (2018). With such assumption the relation can be derived as
follow:
krock_high_strength = 3x10⁻⁸ a2.16 (eq. 4)
krock_low_strength = 6x10⁻⁷ a1.7 (eq. 5)
kfillet = 2x10⁻⁶ a1.83 (eq. 6)
with a as the major axis of the block. For krock_high_strength the coefficients calculated for
Geophone Rock, Apollo 17 (Figure 9a) and blocks at Byrgius A (Figure 11) were used. For
krock_low_strength the coefficients were taken from Block 1005, near B3 station, Apollo 14 (Figure
9b) and from blocks at Byrgius A (Figure 11n). For kfillet the coefficients are from Geophone
Rock, Block 1005 and a block at Byrgius A (Figure 11m, n). These relationships are
representative for lunar rocks although they are not endmembers. This means that more
cohesive and more friable rocks likely exist on the lunar surface than the two cases presented
here.
3.3 Abrasion rates
With equations (2)-(4) we model the diffusion of blocks for a range of block sizes and
calculate their abrasion rate for the first 100 My of surface exposure. The abrasion rate is

12
defined as the volume of rock material lost after diffusion for a given exposed area and a given
exposure period. The abrasion rates as a function of surface exposure age and size are presented
in Figure 12 and reported in Table 3. Clearly, the abrasion rate is neither uniform in time nor in
space, i.e., diffusion is stronger on the edges of the rock. Figure 12 shows that the time needed
for self-burial is inversely proportional to the size because the abrasion rate is higher for larger
blocks.
4. Discussion
4.1 Morphological parameters
The distinct variation with time of the ratio fillet height / block height and of the fillet
slope allows to disentangle the effect of rock strength (diffusivity) from the surface exposure
age. Theoretically, for given block dimensions (three major axes), simple morphological
parameters (Figure 6) are sufficient to provide information on block strength and residence
time. Demidov and Basilevsky (2014) reported that the height to maximum diameter ratio of
small rocks in the range 10 cm to 2 m observable in Apollo and Lunokhod-1 and 2 images is
relatively uniform across many sites with a mean value of 0.54 ± 0.03. This observation is
explained by the fact that micrometeoroid abrasion and possibly other processes are not able to
change sufficiently the shapes of rocks (Demidov and Basilevsky, 2014) before catastrophic
disruption of the rocks occurs by a larger meteoroid hit (Hörz et al., 1975a; 1977; McDonnell
et al., 1977). Our modeling results (Figure 6b) support this interpretation.
Irregularities on the top right portion of the fillet of the two blocks are possibly due to
the large angle between two faces in planar view (Figure 8b and d). It can be seen that the fillet
deposit of the second block was controlled by the topography of the rock. Considerable fillet
material was deposited at the termini of a gentle sloping area of the rock. The fillet closest to
the highest elevation (“peak”) of the rock (orange in Figure 8c), instead, did not grow and
diffuse as much. Overall, topographic differences at the beginning of the simulations lead to
minor differences in fillet slope and height compared to the range produced by variations in the
coefficients of diffusivity and exposure time (Figure 6). The results indicate that the two mound-like blocks (Large mound and block “1006”)
require an old exposure age for their topography to be reproduced. Such mounds could represent
rare blocks that never experienced shattering by a large meteoroid and which topography has
been controlled only by abrasion. It remains to be explained why at the Apollo 12 landing site
two such mounds were observed very close to each other (“Large mound” and “Small mound”,

13
Shoemaker et al., 1970b). It is possible that both two nearby blocks survived catastrophic
shattering for a long period. Alternatively, their close proximity might suggest a
compositionally controlled evolution, i.e., they might represent young blocks of very friable
material. Our findings support the former option.
4.2 Abrasion rates and compositionally dependent block evolution
Abrasion rates have been reported in the literature from estimates of returned samples
as well as from modeling efforts. Our abrasion rate estimates (Table 3, Figure 13) for low-
strength rock (0.2 mm/My) is similar to previous numerical modeling (0.4 mm/My) as well as
with analysis of returned Apollo samples for a 10 cm rock (0.3 mm/My, Crozaz et al., 1971).
Our estimate for high-strength rock (0.07 mm/My) is within the range of previous modeling
(Hörz et al., 1975; Ashworth and McDonnell, 1973), although it is lower than the minimum
estimate from Apollo samples for a 10 cm rock (Table 3). We note that there is a great
variability of abrasion rates reported in the literature (an order of magnitude) that can be
attributed to different techniques and the inherently variable strength of rocks. The fact that our
upper estimate falls within the range of other studies and of returned samples confirms the
validity of our rates. One reason for the difference between our lower estimate (high-strength
rock) and the Apollo samples is that our estimate is a mean for the entire rock after 100 My
whereas the Apollo measurements were taken on discrete sections of the returned samples. In
addition, the higher rates for the returned samples might be due to their shorter surface exposure
age with respect to our 100 My calculation. We find an abrasion rate in the range 0.4˗0.9
mm/My (hard and weak rock) in the first 10 My for a rock 10 cm in size. A section of sample
12063 of similar size has been reported to have an abrasion rate of 0.7 mm/My with an exposure
age of <1.6 My (Crozaz et al., 1971). We therefore conclude that there is reasonable agreement
between the abrasion rates we report and previous estimations.
The dependency of the topography on the rock coefficient of diffusivity (krock)
exemplified by the evolution of block morphologies as observable from orbit (Figure 12)
demonstrates that rock strength plays a major role in the efficiency of micrometeoroid abrasion.
Basilevsky et al. (2013) noted the same dependency on material strength for the case of
catastrophic shattering and rock abundances. Therefore, because both abrasion and shattering
are strongly dependent on rock material strength, rock abundances cannot always be interpreted
in terms of surface exposure age alone. In the first 100–200 Myr, before most (99%) rocks are
destroyed by catastrophic shattering, both exposure age and material strength should be
considered to explain a certain population of blocks. In the light of this dependence on material

14
strength, we note that the generally higher abundance of blocks and thinner regolith on the
maria relative to the highlands could be partially explained by a difference in material strength,
and not only by an age difference. O’Brien and Byrne (2021) estimated a coefficient of diffusivity for regolith of 0.1
m2/Myr for a surface area less than 8 m, i.e., subject to impact craters smaller than 8 m. This
value is very close to the diffusivity of 0.09 m2/Myr for a feature of 8 m in size calculated with
eq. (6) presented above.
Contrary to the coefficient of diffusivity, abrasion rates do not always increase with
increasing spatial scale because abrasion rates are a function of the coefficient of diffusivity
and initial topographic gradient. As suggested by Fassett and Thompson (2014), we find that at
the local scale the surface is more dynamic than at regional scale. For example, a 1 m and a 10
m wide block experience degradation at a rate of 0.8 mm/Myr and 9 mm/Myr, respectively.
The mean erosion rate at large scale (kms wide area) has been estimated at 0.4 mm/Myr (Fassett
and Thomson, 2014) and at 0.2 mm/Myr (Craddock and Howard, 2000), similar to the rate of
cm-sized rocks.
The rates reported for 1 m and 10 m wide blocks, i.e., 0.8 mm/Myr and 9 mm/Myr,
refers to rock material of relatively high strength. These rates increase by a factor 2 for rocks
of lower strength (higher krock).
4.3 Self-burial
The graph of Figure 12 suggests that about 600 My are needed for blocks to be
completely eroded by abrasion only. Before complete abrasion occurs, however, the modeled
profiles (Figure 4) show that self-burial occurs by fillet onlap. This means that if catastrophic
disruption does not occur, the next major morphological event that happens to a rock is self-
burial rather than complete abrasion. Self-burial by the fillet occurs between 100 and 200 My
for a 5 m sized rock. After self-burial, the layer of fine particles above the rock can act as a
shield from micrometeoroids. Thus, unless the protective layer of fines is not disrupted by a
sufficiently large micrometeoroid, the rock will not be subject to further erosion. In general, the
presence of intact rocks within the regolith (e.g., Thompson et al., 1974; Ghent et al., 2016;
Wei et al., 2020) can be explained by burial from nearby crater ejecta blankets. The self-burial
mechanism presented here could be an additional process to explain the presence of subsurface
rocks and the complex history of the Apollo samples involving multiple episodes of surface
exposure, flipping and burial (e.g., Fleischer et al., 1971). We note that the reverse process can

15
be observed on the central peak of large craters (or other exhumation area) where regolith cover
is slowly removed from rocks (e.g., Greenhagen et al., 2016).
4.4 Model limitations
Although the model developed here allows to understand the morphologies of lunar blocks and
boulders, the comparison of the model outputs, i.e., profiles and artificial images, with actual
observations reveals the complex shapes of actual lunar rocks. The most frequent shape of
blocks can be approximated by a rectangular cuboid, however, variation exists in the values of
the three major axes. For example, the c/a ratio has been reported to vary between 0.49 and 0.58
(Demidov and Basilevsky, 2014). Added complexity occurs where the fillet starts to cover part
of the rock. Apollo reports show that the fillet material can be deposited on top of the undulating
rock shape well before it reaches the top of the rock (Swann et al., 1972). In this condition, part
of the rock would be protected from abrasion, and as a consequence the diffusion of the rock-
fillet system would be modified.
5. Conclusions
We investigated the morphology and topography of single instances of blocks on the lunar
surface. We concentrated on blocks whose erosion history has been controlled by
micrometeoroid abrasion without shattering. Morphologically, these blocks consist of the actual
rock component surrounded by a particulate depositional apron, i.e., the fillet. The outcomes of
this study can be summarized as follows:
• Modeling of lunar block abrasion by diffusion with two coefficients of diffusivity for
the rock and fillet sections is sufficient to reproduce the main morphometrical
characteristics of blocks, namely the height of the fillet with respect to the height of the
rock and the fillet slope.
• The height of a fillet at the contact with the rock is proportional to the rock friability,
whereas the slope of the fillet is controlled mainly by the surface exposure age, with a
reduction in steepness with time. In low resolution orbital images of airless surfaces,
rocks with fillets can be identified by a bright halo around a rock and by the fillet
shadows. A map of such features would provide geographical information on the
petrology and exposure age of blocks, for example around large impact craters.
• For the first time, lunar abrasion rates are provided as a function of rock size, rock
diffusivity (proxy for rock strength) and surface exposure time. These rates were derived

16
by coupling the diffusion model to the morphometry of blocks for which the age is
known. The new abrasion rates are in agreement with previous estimates and Apollo
samples. Rock abrasion rates increase with rock size. For cm-sized rocks the rates are
similar to regional scale erosion rates (0.2 mm/Myr), whereas for 10 m-sized rocks the
rates are two order of magnitude higher.
• The topography of a block, and thus its abrasion history, are strongly dependent on rock
strength. For rocks of the same size, same age and different strength, the abrasion rate
can vary by at least 50 %. Therefore, lunar rock abundances should be interpreted in
terms of surface exposure age as well as material strength.
• Fillet development leads to self-burial of rocks. Self-burial is reached before complete
abrasion of the rock by micrometeoroids alone. On the average, however, catastrophic
disruption by a relatively large meteoroid occurs before self-burial. Where catastrophic
disruption does not occur, self-burial is an additional mechanism to explain the presence
of subsurface rocks within the regolith.
• In future lunar exploration activities, time-of-flight cameras that allow to reconstruct
the three-dimensional shape of blocks independent of the illumination conditions might
be used for surface proximity observations to estimate the age and rheology/mineralogy
of blocks and smaller boulders. 6. Acknowledgment
O.R. is financially supported by a Sofja Kovalevskaja Award of the Alexander von Humboldt
foundation. The authors are grateful to Kay Wohlfarth for providing his raytracing code used
in the construction of the artificial images in Figures 11 and 12. Discussion of the Apollo 12
mounds geology with Wajiha Iqbal is acknowledged.
7. Author contributions
O.R. conceived the study, developed the numerical model and wrote the manuscript draft. C.W.
contributed to the development of the concepts, produced the artificial images and edited the
manuscript. Both authors discussed and interpreted the results.
8. Data availability
LROC/NAC images are available through the Planetary Data Systems Geosciences node
(https://pds-geos-ciences.wustl.edu/missions/lro/), and the LROC website

17
(https://www.lroc.asu.edu/archive). Apollo images used in this study are available at the Apollo
Lunar Surface Journal website (https://history.nasa.gov/alsj/main.html).
9. References
Arvidson, R., Crozaz, G., Drozd, R. J., Hohenberg, C. M., Morgan, C. J., 1975, Cosmic ray
exposure ages of features and events at the apollo landing sites, The Moon 13, 259-276.
Arvidson R., Drozd R., Guiness E., Hohenberg C., Morgan C., Morrison R. and Oberbeck V.
1976, Cosmic ray exposure ages of Apollo 17 samples and the age of Tycho, Proc. 7th Lunar
Sci. Conf. 2817-2832.
Ashworth, D. G., and McDonnell, J. A. M., 1973, Lunar surface micro-erosion related to
interplanetary dust particle distributions, Space Res. XIII, 1071-1083.
Bandfield, J. L., Ghent, R. R., Vasavada, A. R., Paige, D. A., et al., 2011, Lunar surface rock
abundance and regolith fines temperatures derived from LRO Diviner Radiometer data, J.
Geophys. Res., 116, E00H02, doi:10.1029/2011JE003866.
Basilevsky, A.T., Head, J.W., Hoerz, F., 2013, Survival times of meter-sized boulders on the
surface of the Moon. Planetary and Space Science 89 (118–12).
Bruno, D.E., Ruban, D.A., 2017. Something more than boulders: a geological comment on the
nomenclature of megaclasts on extraterrestrial bodies. Planet. and Space Sci 135, 37–42.
Craddock, R. A., & Howard, A. D., 2000, Simulated degradation of lunar impact craters and a
new method for age dating farside mare deposits. Journal of Geophysical Research: Planets,
105(E8), 20387–20401. doi:10.1029/1999je001099.
Crozaz, G., Walker, R., Woolum, D., 1971, Nuclear track studies of dynamic surface processes
on the moon and the constancy of solar activity, 2nd Lunar Sci. Conf., 3, pp. 2543-2558.
Demidov, N. E., Basilevsky, A. T., 2014, Height-to-diameter ratios of moon rocks from
analysis of Lunokhod-1 and -2 and Apollo 11-17 panoramas and LROC NAC images, Solar
Sys. Res. 48, 5, pp. 324-329.

18
Dombard, A. J., Barnouin, O. S., Prockter, L. M., Thomas, P. C., Boulders and ponds on the
Asteroid 433 Eros, Icarus, 210, doi:10.1016/j.icarus.2010.07.006.
Drozd, R. J., Hohenberg, C. M., Morgan, C. J., Podosek, F. A., Wroge, M. L., 1977, Cosmic-
ray exposure history at Taurus-Littrow, In: 8th Lunar Science Conference, Houston, Texas, pp.
3027-3043.
Dziura, M., et al., 3D reconstruction in orbital proximity operations, (2017), IEEE Aerospace
conference, doi:10.1109/AERO.2017.7943679.
Fassett, C. I., and Thomson, B. J., 2014, Crater degradation on the lunar maria: Topographic
diffusion and the rate of erosion on the Moon, J. Geophys. Res., 119, 2255-2271,
doi:10.1002/2014JE004698.
Fassett, C. I., Minto, D. A., Thomson, B. J., Hirabayashi, M., Watters, W. A., 2018, Re-analysis
of observations of craters degradation on the lunar maria accounting for anomalous diffusion,
49th Lunar Planet. Sci. Conf., abstract no. 1502.
Fleischer, R. L., Hart, H. R., Comstock, G. M., Evwaraye, A. O., 1971, The particle track record
of the Ocean of Storms, 2nd Lunar Sci. Conf., 3, pp. 2559-2568.
Gault, D. E., Hoerz, F., Hartung, J. B., 1972, Effects of microcratering on the lunar surface, 3rd
Lunar Sci. Conf., 3, pp. 2713-2734.
Ghent, R. R., Carter, L. M., Bandfield, J. L., Tai Udovicic, C. J., Campbell, B. A., 2016, Lunar
crater ejecta : Physical properties revealed by radar and thermal infrared observations, Icarus,
273, 182-195, doi :10.1016/j.icarus.2015.12.014.
Gomez Martinez, H., et al., 2017, Pose estimation and tracking of non-cooperative rocket
bodies using Time-of-Flight cameras, Acta Astronautica. doi:10.1016/j.actaastro.2017.07.002.

19
Greenhagen, B. T., Neish, C. D., Williams, J.-P., Cahill, J. T. S., et al., 2016, Origin of the
anomalously rocky appearance of Tsiolkovskiy crater, Icarus, 273, 237-257,
doi:10.1016/j.icarus.2016.02.041.
Grumpe, A., and Wöhler, C., 2014, Recovery of elevation from estimated gradient fields
constrained by digital elevation maps of lower lateral resolution, ISPRS J. Photogram. Remot.
Sens., 94, 37-54, doi:10.1016/j.isprsjprs.2014.04.011.
Humm, D. C., Tschimmel, M., Brylow, S. M., Mahanti, P., et al., 2016, Flight calibration of
the LROC narrow angle camera, Space Sci. Rev., 200, 431–473, doi:10.1007/s11214-015-
0201-8
Harries, D., Yakame, S., Karouji, Y., Uesugi, M., Langenhorst, F., 2016, Secondary
submicrometer impact cratering on the surface of asteroid 25143 Itokawa, Earth and Planet.
Sci. Lett. 450, 337-345, doi:10.1016/j.epsl.2016.06.033
Hörz, F., Schneider, E., Hill, R. E., 1974, Micrometeoroid abrasion of lunar rocks : A monte
carlo simulation, 5th Lunar Conf., 3, pp. 2397-2412.
Hörz, F., Schneider, E., Gault, D.E., Hartung, J.B., Brownlee, D.E., 1975a, Catastrophic rupture
of lunar rocks: a Monte Carlo simulation. The Moon 13, 235–258.
Hörz, F., Brownlee, D. E., Fechtig, H., Hartung, J. B., et al., 1975b, Lunar microcraters:
Implications for the micrometeoroid complex, Planet. Space Sci., 23, 151-172.
Hörz, F., 1977, Impact cratering and regolith dynamics, Phys. Chem. Earth, 10, pp. 3-15,
Hörz, F., Basilevsky, A. T., Head, J. W., Cintala, M. J., 2020, Erosion of lunar surface rocks by
impact processes: A synthesis, Plant. Space Sci., 194, 105105, doi:10.1016/j.pss.2020.105105.
Howard, A. D., 2007, Simulating the development of Martian highland landscapes through the
interaction of impact cratering, fluvial erosion, and variable hydrologic forcing.
Geomorphology, 91(3-4), 332–363. doi:10.1016/j.geomorph.2007.04.017.

20
Kirk, R. L., Howington‐Kraus, E., Redding, B., Galuszka, D., Hare, T. M., Archinal, B.
A., Soderblom, L. A., and Barrett, J. M., 2003, High‐resolution topomapping of candidate
MER landing sites with Mars Orbiter Camera narrow‐angle images, J. Geophys. Res., 108,
8088, doi:10.1029/2003JE002131.
Kreslavsky, M. A., Zharkova, A. Y., Head, J. W., Gritsevich, M. I., 2021, Boulders on Mercury,
Icarus, 369, doi:10.1016/j.icarus.2021.114628.
Küppers, M., Moissl, R., Vincent, J.-B., Besse, S., Hviid, S.F., Carry, B., Grieger, B., Sierks,
H., Keller, H. U., Marchi, S., and the OSIRIS team, 2012, Boulders on Lutetia, Planetary and
Space Science 66, 71–78.
Loeffler, M. J., Baragiola, R. A., Murayama, M., 2008, Laboratory simulations of redeposition
of impact ejecta on mineral surfaces, Icarus, 196, 285-292, doi:10.1016/j.icarus.2008.02.021.
Malin, M. C., Bell, J. J. III, Cantor, B. A., Caplinger, M. A., et al., 2007, Context camera
investigation on board the Mars Reconnaissance Orbiter, J. Geophys. Res., 112, E05S04,
doi:10.1029/2006JE002808.
Marti K. and Lugmair G.W., 1971, Kr81-Kr and Kr-Ar40 ages, cosmic-ray spallation products
and neutron effects in lunar samples from Oceanus Procellarum. Proc. 2nd Lunar Sci. Conf.
1591-1605.
McDonnell, J. A. M., Ashworth, D. G., Flavill, R. P., Carey, W. C., et al., 1977, The
characterization of lunar surface impact erosion and solar wind sputter process on the lunar
surface, Phil. Trans. R. Soc. Lond. A., 285, 303-308.
Michikami, T., Hagermann, A., Kadokawa, T., Yoshida, A., et al., 2016, Fragment shapes in
impact experiments ranging from cratering to catastrophic disruption, Icarus, 264, 316-330, doi:
10.1016/j.icarus.2015.09.038
Molaro, J., and Byrne, S., 2012, Rates of temperature change of airless landscapes and
implications for thermal stress weathering, J. Geophys. Res., 117, E10011,
doi:10.1029/2012JE004138.

21
Morota, T., et al., 2009, Formation age of the lunar crater Giordano Bruno, Met. and Planet.
Sci. 44, nr. 8, 1115–1120.
Morrison, D.A., and Clanton, U. S., 1979, Properties of microcraters and cosmic dust of less
than 1000 A dimensions, Proc. Lunar Planet. Sci. Conf. 10, 1649-1663.
Muehlberger, W. R., Batson, R. M., Boudette, E. L., Duke, C. M., et al., 1972, Preliminary
geologic investigations of the Apollo 16 landing site, in Apollo 16 Preliminary science report,
NASA SP-315, Washington DC, USA.
Neukum, G., 1973, Lunar Science IV, Abstracts, p. 558-560, Lunar Sci. Inst., Houston, TX,
USA.
Neukum, G.,1984. Meteorite bombardment and dating of planetary surfaces. National
Aeronautics and Space Administration, Thesis — February 1983, Washington, DC.
Translatedinto English of “Meteoriten bombardement und Datierung Planetarer Oberflaechen”
Munich, February 1983, pp.1–186.
Neukum, G., Ivanov, B.A., 1994, Crater size distributions and impact probabilities on Earth
from lunar, terrestrial-planet, and asteroid cratering data, In: Gehrels, T., Matthews, M. S.,
Schumann, A. (Eds.), Hazards due to Comets and Asteroids, Space Science Series, 1994,
University of Arizona Press, Tucson, AZ, p.359.
O’Brien, P., and Byrne, S., 2021, Physical and Chemical Evolution of Lunar Mare Regolith,
JGR planets 126, 2, doi:10.1029/2020JE006634.
Pelletier, J. D., 2008, Quantitative modeling of earth surface processes, Cambridge University
Press, Cambridge, UK.
Richardson, J. E., Steckloff, J. K., Minton, D. A., 2020, Impact-produced seismic shaking and
regolith growth on asteroids 433 Eros, 2867 Stein, 25143 Itokawa, Icarus, 347, 113811,
doi :10.1016/j.icarus.2020.113811.
22
Robinson, M.S., et al., 2010. Lunar Reconnaissance Orbiter Camera (LROC) instrument
overview. Space Science Review 150, 81–124.
Ruesch, O., Sefton-Nash, E., Vago, J. L., Küppers, M., et al., 2020, In situ fragmentation of
lunar blocks and implications for impacts and solar-induced thermal stresses, Icarus, 336,
113431, doi:10.1016/j.icarus.2019.113431.
Schultz, P.H., Gault, D.E., 1975. Seismically induced modification of lunar surface features.
Sixth Lunar Planet. Sci. Conf.. pp. 2845–2862.
Schröder, S., Carsenty, U., Hauber,Schulzeck, F., et al., 2021, The boulder population of
asteroid 4 Vesta: Size-frequency distribution and survival time, Earth and Space Science,
doi:10.1029/2019EA000941
Schröder, S. Carsenty, U., Hauber, E., Raymond, C. A., Russell, C. T., 2021, The Brittle
Boulders of Dwarf Planet Ceres, The Planetary Science Journal, 2:111,
doi:10.3847/PSJ/abfe66.
Shkuratov, Y., Kaydash, V,. Korokhin, V,. Velikodsky, Y., et al., 2011, Optical measurements
of the Moon as a tool to study its surface, Planet. Space Sci., 59, 1326-1371,
doi:10.1016/j.pss.2011.06.011.
Shoemaker, E. M., Morris, E. C., Batson, R. M., Holt, H. E., Larson, K. B., et al., 1969,
Television observations from Surveyor, in Surveyor Program Results, NASA SP-184.
Shoemaker, E. M., Hait, M. H., Swann, G. A., Schleicher, D. L., et al., 1970a, Origin of the
lunar regolith at Tranquillity base, Apollo 11 Lunar Sci. Conf. vol. 3, pp. 2399-2412.
Shoemaker, E. M., Batson, R. M., Bean, A. L., Conrad, C. Jr. et al., 1970b, Preliminary geologic
investigation of the Apollo 12 landing site, Part A, in Apollo 12 Preliminary Science Report,
NASA SP-235, Washington DC, USA.
Shoemaker, E. M., 1971, Inst. Invest. Geol., XXV, 27-56, Universidad de Barcelona.

23
Soderblom, L. A., 1970, A model for small-impact erosion applied to the lunar surface, J.
Geophys. Res., 75, 14.
Stettler A., Eberhardt Peter, Geiss J., Grogler N. and Maurer P., 1973, Ar39-Ar40 ages and Ar37-Ar38 exposure ages of lunar rocks. Proc. 4th Lunar Sci. Conf. 1865-1888. Sullivan, R. et al., 1996. Geology of 243 Ida. Icarus 120 (1), 119–139,
doi:10.1006/icar.1996.0041.
Swann, G. A., Bailey, N. G., Batson, R. M., Eggleton, R. E., et al. 1971, Preliminary geologic
investigations of the Apollo 14 landing site, in Apollo 14 Preliminary science report, NASA
SP-272, Washington DC, USA.
Swann, G. A., Bailey, N. G., Batson, R. M., Freeman, V. L., et al. 1972, Preliminary geologic
investigations of the Apollo 15 landing site, in Apollo 15 Preliminary science report, NASA
SP-289, Washington DC, USA.
Thomas, P. C., Veverka, J., Sullivan, R., Simonelli, D. P., et al. 2000, Phobos: Regolith and
ejecta blocks investigated with Mars Orbiter Camera images, JGR, 105, E6, p. 15,091-15,106.
Thomas, P. C., Joseph, J., Garcich, B., Veverrka, J., et al., 2002, Eros: Shape, Topography, and
Slope Processes, Icarus, 155, 18-37, doi:10.1006/icar.2001.6755.
Thompson, T. W., Masursky, H., Shorthill, R. W., Tyler G. L., Zisk, S. H., 1974, A comparison
of infrared, radar, and geologic mapping of lunar craters, The Moon, 10, 87-117.
Wei, G., Byrne, S., Li, X., Hu, G., 2020, Lunar surface and buried rock abundance retrieved
from Chang’E-2 microwave and Diviner data, Planet. Sci. J., 1:56, doi :10.3847/PSJ/abb2a8.

(1)
(2)
(1)
(2)
Figure 1. (a, b) Examples of distinctmorphologies for lunar blocks of approximatelythe same size and the same surface exposureage. (a) Blocks near the rim of North RayCrater exposed for 50 My, NAC imageM175179080LR. (b) Blocks near the rim ofByrgius A crater, exposed for 47±14 My, NACimage M1129909561RC. In both images, theblocks labeled (1) and (2) have about the samesize. Blocks labeled (1) are surrounded andpartially embedded by unconsolidated material(fillet). The blocks labeled (2) display novisible fillet. In (b), the cluster of rocks labelled(3) is likely a shattered block as described inRuesch et al. (2020). (c) Example of filletmorphologies of different development stagesaround blocks on near-Earth asteroid (433)Eros. NEAR mission image M0157415638F3.
a
b
c
(1)
(2)
20 m
20 m
20 m
(3)

Figure 2. Examples of the morphological properties of fillets around rocks with rounded edges. In (a),arrow 1 points to the onlap contact of the fillet onto the rock. Arrows 2 and 3 point to the decreasingthickness of the fillet away from the rock, exposed by an astronaut footprint. Ejecta of nearby craterPlum may have contributed to fillet accumulation. Entire height of gnomon is 62 cm. In (b), the arrowpoints to the accumulation of fillet right at the contact with the rock. (a) AS16-114-18413. (b) AS12-48-7062.
5 cm
1
2
3
a b

t=0
t=1
t=2
Figure 3. Vertical section of a modelledblock illustrating how erosion is simulated.An initial block topography (here a square intwo dimensions) has a boundary indicated bydashed lines. The block material is subject todiffusion with a diffusion coefficient kblock.The block material that diffuses behind theboundary is considered to representunconsolidated fillet material. Fillet materialis deposited right outside the boundary and isallowed to diffuse with a diffusion coefficientkfillet. When and where the fillet material hasthe same height as the block at the boundary,the boundary is shifted inwards at thesubsequent iteration: this enables the fillet toonlap the block.
krock kfilletkfillet
t=3
Figure 4. Models of topographic profiles for rocks with surface exposure agesfrom 10 My to 100 My. Red and blue lines indicate block and fillet profiles,respectively. (a) Block of krock=2.0E-5 m2/ky. (b) Block of krock=2.0E-4 m2/ky.Both blocks have fillet diffusivity kfillet=4.0E-4 m2/kr, initial width of 20 m andinitial height/width ratio of 0.54.
b
a

Figure 5. Same as Figure 4 for 5 m blocks. Models of topographic profiles for rocks withsurface exposure ages from 10 My to 100 My. Red and blue lines indicate actual block andfillet profiles, respectively. (a) Block of krock=1.0E-6 m2/ky. (b) Block of krock= 5.0E-6m2/ky. Both blocks have fillet diffusivity kfillet=3.0E-5 m2/kr, initial width of 5 m andinitial height/width ratio of 0.54.
b
a

Figure 6. (a) Morphological parameters measured on modeled blocks 2 m in size with kfillet=6x10⁻⁶ m2 ky-1. Thesimulated tracks start at the top at a surface exposure age of 10 Myr, the time interval between subsequent points is 10Myr. Trends due to increasing exposure age and increasing strength (different color) can be disentangled. (b) Samemodels as in (a) with different morphological parameters showing how the height of a block is largely insensitive todiffusion (abrasion) expect for very weak rock material (high krock).
ba
increasing strength
increasing age
increasing strength
increasing age
fillet height / block height fillet height / block height
bloc
k he
ight
/ bl
ock
wid
th
fille
t slo
pe (d
egre
e)

Figure 7. Morphological parameters as inFigure 6 for different initial rock sizes. (a,b) 10cm wide rocks. (c,d) 1 m wide rocks. (e,f) 10 mwide rocks. Blue and red lines denotes high andlow strength rocks, respectively. The simulatedtracks are 100 Myr long and start at the top at anage of 10 Myr. The time interval betweensubsequent points is 10 Myr.
ba
dc
fe
fillet height / block height
bloc
k he
ight
/ bl
ock
wid
th
fille
t slo
pe (d
egre
e)
fillet height / block height
fille
t slo
pe (d
egre
e)fil
let s
lope
(deg
ree)
bloc
k he
ight
/ bl
ock
wid
thbl
ock
heig
ht /
bloc
k w
idth

Figure 8. Effects of an uneven top faceof a block. (a, b) Elevation and slopemaps for a block with an initially flattop side. (c, d) Elevation and slopemaps of a block with initially irregularheights. Blocks have the sameproperties (50 My age, krock=1.94E-05m2/ky, kfillet=4.77E-04 m2/ky) asidefrom the initial top face topography.Contours lines are each m in elevationmaps and each degree in slope maps.For clarity, the slope within the rocksection is not shown in b, d.
a b
c d

Figure 9. Comparison of topographicprofiles between observed and modelledblocks. (a,c,e,g) are Apollo astronautimages. (b,d,f,h) are the correspondingtopographic profiles (in black) andmodels (in red). The blocks in theseexamples are of different sizes andsurface exposure ages (Table 1). Modelparameters are given in Table 1. (a)AS17-147-22561HR, (c) AS14-68-9432HR, (e) AS12-46-6793HR, (g)AS14-68-9432HR.
a
c
e
g
b
d
f
h
“Geophone rock”
“1005”
“Large mound”
“1006”

Figure 10. Scatterplots of parameter values from observed and modeled topographic profiles shown in Figure 8.(a) Ratio of height of rock to width of rock. (b) Ratio of maximum height of fillet to maximum height of rock.(c) Fillet slope calculated for the first third of the fillet profile starting from the rock-fillet boundary. The datapoint with uncertainty bar represents block “1005” with an asymmetric profile. The dashed lines represent the20% deviation from the bisection line.

Figure 11: Comparison between LROC/NAC observations at Byrgius A crater rim (g,h,i,j,k,l) and simulated images (a,b,c,d,e,f,m,n,o,p,q,r). The coefficient ofdiffusivity of the fillet increases in the artificial images from left to right. The coefficient of diffusivity for the rock increases from top to bottom. The morphology of theactual fillets and rocks (g,h,i,j,k,l) is reproduced by panels (d,e,f) and (m,n,o). The panels (a,b,c) and (p,q,r) have slightly different morphologies, e.g., sharpness andshape of the fillet-regolith boundary, extension of fillet away from the rock. Observed blocks are 20-3+6 m in width and ~47±14 Myr in age. Modelled blocks are 20 min width and 50 Myr in age. (a,b,c): kfillet =5E-05 (m2/kyr), (d,e,f): kfillet = 2.0E-04 (m2/kyr). (g,h,i): Byrgius A. (j,k,l): Brygius A, (m,n,o): kfillet = 4.0E-04 (m2/kyr).(p,q,r): kfillet = 6.0E-04 (m2/kyr). Incidence angle is at 60° in artificial images and in the range 54°–67° in the NAC images. g,j,h: NAC image M145047737L. k: NACimage M1354540887R i, l: NAC image M1265236990R. Illumination is from the right in all images.

Figure 12. Morphological evolution of blocks from 10 to 100 My (left to right) of surface exposure age as seen with artificialorbital images with 60° incidence angle. Block friability increases from top to bottom. Fillet diffusivity coefficient constant at4E-4 m2/ky. Blocks have a rectangular base with the largest axis 20 m in length.
Exposure age (My)R
ock
diffu
sivi
ty (m
2 /ky)

Figure 13. (a) Abrasion rate for a one meter wide rock of high (blue) and low (red) strength as a function of surfaceexposure age. The abrasion rate is calculated each 10 My. (b) Mean abrasion rates after 100 My of surface exposure for arock of high (blue) and weak (red) strength as a function of rock size. See text for a description of initial rock shape.
ba

Table 1. Measured properties and model parameters for blocks shown in Figure 9 and 11. All blocks are modelled with a square base. The ageof Byrgius A crater is presented in Morota et al. (2009) using superimposed crater size-frequency distributions and the chronology function ofNeukum (1984) and Neukum and Ivanov (1994).
Shown in figure
Block name and location
Width estimate
(m)
Age estimate (Myr)
Exposure age and type of estimate
Model block width (m)
Model initial
height/width ratio
Model exposure age (My)
Model Krock
(m2/kyr)
Model Kfillet
(m2/kyr)
Fig. 9a, b Geophone rock, Geophone
station, A17
4± 0.1 106±4 Sampling: sample 70135 (Arvidson
et al., 1975; Drozdet al., 1977)
5 0.54 100 1.0E-06 3.0E-05
Fig. 9c, d 1005, near B3 station, A14
2± 0.1 26 Inferred: Cone crater formation (Arvidson et al.,
1975)
2 0.54 30 2.0E-06 6.0E-06
Fig. 9e, f Large Mound, near ALSEP station, A12
2± 0.1 50 or 303±18
Sampling: sample 12008 or 12021
2 0.54 300 1.0E-06 6.0E-06
Fig. 9g, h 1006, near B3 station, A14
2± 0.1 26 Inferred: Cone crater formation (Arvidson et al.,
1975)
2 0.54 190 2.0E-06 6.0E-06
Fig. 11 g,m
24.27 S / 64.07 W
25±1 47±14 Byrgius A (Morota et al., 2009)
20 0.54 50 7.0E-05 4.0E-04
Fig. 11 h,n
24.23 S /64.02 W
18±1 47±14 Byrgius A (Morotaet al., 2009)
20 0.54 50 1.0E-04 4.0E-04

Table 2. Parameter values for equations (2) and (3) to describe the topography ofabraded rocks with fillet. The names of the sets are qualitative. These parameters arevalid to model rocks in cm to m scale.
Parameter “Young, high strength”
“Old, high strength”
“Young, low strength”
“Old, low strength”
hrock rrock*1.08 rrock*1.08 rrock*1.08 rrock*0.87
hfillet hrock*0.25 hrock*0.25 hrock*0.55 hrock*0.55
!!"#$ 0.05 0.10 0.17 0.17
!%&''() 1.1 0.15 0.4 0.1
s 0 2 1.7 2

Reference Rock size Single particle abrasion (mm/My)
Approach
Shoemaker (1971) 1-10 cm diameter 1.4-2.1 Numerical modeling, constant flux over the entire mare history (3.9 Gy)
Shoemaker (1971) 1-10 cm diameter 0.041-0.062 Numerical modeling, best estimate for the recent erosion rate (last few My).
Gault et al. (1972) 10 cm diameter 1.8 Numerical modeling
Ashworth and McDonnell (1973)
10 cm diameter 0.1-0.01 -
Neukum (1973) unspecified dimension 1 Numerical modeling
Hörz et al. (1974) 6 cm diameter, crystalline 0.4-0.6 Numerical modeling
Crozaz et al. (1971) ~9 cm wide (e.g, crystalline sample 12063)
0.3-1 Analysis of apollo samples
This study 10 cm wide, high strength 0.07 Numerical modeling. Mean value after 100 My.
This study 10 cm wide, low strength 0.2 Numerical modeling. Mean value after 100 My.
Table 3. Summary of abrasion rates reported in the literature and in this study based on numerical modeling and returned apollo samples.