Embed Size (px)
Citation preview


Part I
Problems of Biosphere Evolutionand Origin of Life
On Important Stages of Geosphere
and Biosphere Evolution
N. L. Dobretsov, N. A. Kolchanov, and V. V. Suslov
Abstract The necessary conditions for the existence of protein–nucleic acid life
are the presence of liquid water, some protection against high-amplitude tem-
perature jumps and cosmic factors (these may be the atmosphere and or a thick
layer of water or same rocks) and the accessibility of biogenes, which are
macroelements and microelements. Two geosphere-related canalizing vectors
of biosphere evolution can be discerned. One is associated with an irreversible
cooling and oxygenation of the planet and the associated complex pattern of
interplaying endogenous cycles, which affect climates as well as the amount and
composition of the biogenes in the ‘‘liquid water zone.’’ Change of the convec-
tion mode in the mantle between 3 and 2 Byr ago had the most important
implications for the biosphere: the formation of plate tectonics (a deep ocean
and continents), enrichment of the chemical composition of the effusive mate-
rial and the ‘‘plume dropper,’’ which changes the oceanic-to-continental area
ratio and the mantle-to-island-arc volcanism intensity ratio every 30 Myr. The
World Ocean operates as a homeostatic system: it tempers climates, distributes
biogene concentrations evenly over the globe and provides the hydrosphere
with direct biogene supply from the mantle, which is how the second vector of
biosphere evolution is set. Life is a homeostatic system too—not due to a
tremendously high buffer’s capacity, but due to high rates of chemical reactions
and a special program (the genome), which warrants autonomy from the
environment. Reduction in methane concentrations and increase in atmo-
spheric O2 in the course of the Earth’s geological evolution caused the extinc-
tion of chemotrophic ecosystems. Autotrophic photosynthesis provided the
biosphere with a source of energy that was not associated with the geosphere
and helped the biosphere for the first time to gain independence (autonomiza-
tion) from the geosphere. As a result, the biosphere develops a solid film of life
spread out over the continents, pelagic and abyssal zones, and the geosphere
N. L. DobretsovInstitute of Geology and Mineralogy, SB, RAS, Novosibirsk, Russiae-mail: [email protected]
N. Dobretsov et al. (eds.), Biosphere Origin and Evolution.� Springer 2008
3

supplemented its geochemical cycles with biogeochemical ones which are com-
parable, if not by the mass of the matter involved, by annual balance.
The necessary condition for the existence of DNA/RNA/protein-based life
is the presence of liquid water, an atmosphere and the accessibility of bio-
genes: macroelements (O, C, H, N, Ca, P, S, K, Mg, as well as Si and Al) and
microelements (Fe, Ni, Mn, W, Mo, V, Zn, Cu, Co, Se, Cr) in the form of
soluble substances. It was not before these conditions were established in the
course of the Earth’s evolution that the biosphere could start or, if it is of
cosmic origin, resume its evolution. Due to gravitational separation, the
primary material began to arrange itself into a crust enriched in light elements
and a core, into which heavy elements had been migrating. The process of
separation of the metal core into a stand-alone entity played an important
role in the Earth’s temperature dynamics: it is responsible for the meltdown of
the mantle and crust at the Earth’s earliest, moon-like stage (4.6–4 Byr ago).
The heat accumulated during that process accounts for �35% of the Earth’s
current total, a major portion of which dissipates and is lost into space, and a
minor portion of which is accumulated by the biota and is in part preserved in
dead fossil organic matter (in particular, caustobiolites, including hydrocar-
bons, are nothing else than the preserved portion of the Earth’s thermal
energy). The heat provided by the solidification of the Earth’s growing
inner core composed of a solid iron–nickel alloy with some diamond admix-
tures accounts for additional 15%, the growth of the outer core accounts for
additional 10–15% (this is due to separation of Fe and Ni from the mantle)
and radioactive decay accounts for the rest (Trubitsin, Rykov, 2001). The
inner core grows due to the material coming from the outer liquid metal core.
The outer liquid core supports the magnetic field, the vanguard protection
network of the biosphere, and plays an important role in heat transfer in the
Earth’s interior. Over 4.5 billion years, the average mantle temperature
dropped from 3000 to 2100 8C, and the heat flow reduced. The curve q(t)
(Fig.1A) allows the integral heat losses to be estimated as
Q ¼Z4:6
0
S0qðtÞdt
Given the hot Earth model and assuming that the Earth’s area, S0, has been
subject to little variation, we obtain an estimate for the heat lost over the first
150 million years: 9% of the total heat lost over the Earth’s history (6% per 100
million years). Over 650 million years that followed and were associated with an
intensive separation of the core and intensive one-layeredmantle convection, the
heat loss amounted to 28 % (or 4.3 % per 100 million years). Over 1.1 billion
years that followed andwere associated with the separation of a liquid core from
4 N. L. Dobretsov et al.
a solid core and one-layered mantle convection, the heat loss amounted to 26%(2.5 % per 100 million years). Over the period between 2.6 and 1.2 billion yearsassociated with the transition to two-layered mantle convection and a reductionin the rate of core solidification, the heat loss amounted to 17% (the heat lossrate reduced to 1.3 % per 100 million years). Finally, over the past 1.2 billionyears, which are associated with two-layered mantle convection and a slow-paced core solidification with periodic faster-paced laps, the heat loss amountedto 11% (0.9% per 100 million years) (Dobretsov, Kirdyashkin, 1998). Thus,irreversible trends in the Earth’s evolution are its cooling, which proceeds withperiodic variations on the background of total slowdown (Tajika, Matsui, 1992,Dobretsov, Kovalenko, 1995), and change of the ratio between the mobile andbound oxygen in rocks and the atmosphere,1 which have resulted in rockoxidation and atmosphere oxygenation (Dobretsov and Chumakov, 2001). Asa result of the cooling, the moon-like stage of the Earth’s history gave way to thenuclear one. As long ago as 4.3–4.2 Byr, the Earth had a thin crust, sufficientlycool (no hotter than 100 8C) for the formation of the hydrosphere. This time isdeduced from findings of corroded zircon grains (de Laeter and Trendall, 2002).The first traces of life, probably, prokaryotic, are recorded in 3.8–3.7 Byr oldrocks of earthly origin (Schidlowski, 1988). Hence, at least since that time, twoconjugated systems existed: the biosphere and the geosphere, and geosphereevolution determines the direction of irreversible evolution (Fig. 1).
There are two aspects to the concept of evolution: (1) the process of de novoformation of an archetype2 (biologically speaking, phylogenesis); and (2) theprocess of the canalized (pre-programmed) individual development of an exist-ing archetype (biologically speaking, ontogenesis). Discussion of the possiblerelevance of ontogenesis and phylogenesis to geology was started by V.I.Vernadsky, E.S. Fedorov and Grigoryev D.P., but reasoning has never beenperfected into any scientific concept (Grigoryev, 1956; Rundkvist, 1968;Rundkvist et al., 1971; Izokh, 1978), except for those occasional events inwhich the concepts of ontogenesis and phylogenesis have been applied toanalyze the genesis of mineral and ore associations. It was proposed to applythe concept of the phylogenesis of minerals (ore bodies, parageneses, mineralspecies and others) to the geological processes that span over time and space
1 It should be noted that before photosynthesis, rock oxidation was determined mainly byhydrogen dissipation, directly depending on the Earth’s temperature. Thermochemical degra-dation ofmobile hydrogen-containing compounds is accompanied by dissipation of hydrogenand binding of oxygen to metals (in particular, to iron, to generate magnetite crystals).Photosynthesis is also degradation of hydrogen-containing compounds (hydrogen sulfide inthe anoxic bacterial photosynthesis and water in oxygenic photosynthesis by cyanobacteriaand plants). Therefore, since the beginning of photosynthesis, metals have been oxidized bybiogenic oxygen as well.2 The archetype is assumed to be a set of traits and characters that make a particular group ofmembers, or individuals, that share them stand alone as a species among all the others groups(Grigoryev, 1956; Liubischev, 1982).
Important Stages of Geosphere and Biosphere Evolution 5

intervals considerably (by a factor of in excess of dozens) exceeding both the age
of any particular ore body and all the room it has ever required (Rundkvist et
al., 1971). These processes shape environments so that the development of
particular ore bodies can only go the way it does. Here the canalization is
obviously very much similar to that in biology; however, the mechanisms
underlying it are quite different.3 In biology, the canalization of ontogenesis is
largely performed by a program made in the form of a special structure, the
genome (Kolchanov et al., 2003). This mechanism of canalization ‘‘from inside’’
rather than ‘‘from outside’’ allowed the biological forms to embark upon a
course of development independent of the rule of the environment (Shmalgau-
zen, 1968) and eventually to form an independent vector of biosphere evolution.By saying ‘‘a code,’’ wemean any type of monomer context that carries, within
a polymer, information, the significance of which for a particular function is set
not directly, but bymatching rules. Is there anything like the genome in geological
bodies? The lattice not only has a program to carry but a function to perform.The
first step toward the emergence of the code in the course of evolutionwas perhaps
associated with the formation of the feedback between two functional structures
like these. Feedback sets matching rules. For instance, the structure of the
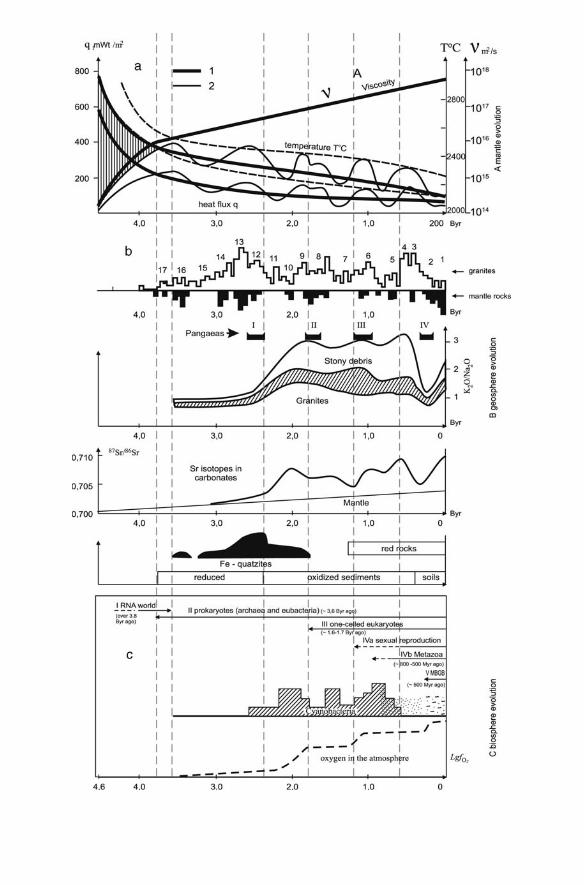
Fig. 1 The evolution of the mantle (a), the geosphere (b) and the biosphere (c). (a) Thecalculated variations in the mean temperature, heat flux and viscosity of the mantle afterTajika and Matsui (1992) (bold line), and variations in temperature and heat flux afterDobretsov and Kovalenko (1995) (fine lines), reflecting the processes of Earth’s total cooling(no matter what initial state) and convection slowdown as viscosity grows. Periodical first-order variations for temperature and heat flux are comparable with max and min for granites(see 1b). (b) The most important indices of geosphere evolution: upper row—histograms forthe granite age distribution (gray bars) and mantle rock age distribution (blue bars) in theEarth’s crust; digits—the most important endogenous cycles reflected by the max for granites;middle row—K2O/Na2O ratio in granites, compared to the emergence of the supercontinentsPangaea I, Pangaea II, Pangaea III, Pangaea IV; lower row—variation of Sr isotope concen-trations in carbonate sediments (Condie, 1989, refined after Semikhatov, 1993) on the back-ground of the typical signals of oxidation and continental emergence: the crust-widedistribution of ferruginous quartzites, red rocks, reduced and oxidized sediments and soils(Zavarzin, 2003a). (c) Biosphere evolution: upper row—biosphere evolution milestones; mid-dle row—the age-related distribution of cyanobacteria (Zavarzin, 2001); lower row—atmo-spheric oxygen evolution (Rozanov, 2006)
3 Different as canalization is in biology and geology, this process uncovers common develop-mental features, such as the geogenetic law (evolutionary parallelism at all levels), which issimilar to the biogenetic law (ontogenesis is a reduction of phylogenesis), and von Baer’s lawof corresponding stages (Izokh, 1978; Rundkvist, 1968). At the same time, because of a highlevel of environmentally independent development of biological forms, no analogy to thecorollary to the geogenetic law can be drawn (ontogenesis sets pattern for future pylogenesis).What there is is only a less strict version of the law of homologous series (Vavilov, 1967) andCope’s rule of a less specialized ancestor (Shmalgauzen, 1968).
Important Stages of Geosphere and Biosphere Evolution 7

minerals formed by aluminosilicate clays is a multiplicity of stacked layers which
are stabilized (asDNA andRNA) by stacking interactions. The layers could onlygrow laterally, where they were washed by the nutrient solution. In a flow system
composed of many microchannels, on whose walls aluminosilicates grow, themost long-lived (‘‘fit’’) are the stacks of layers that do not clog the microchannelsand are not taken away with the solution (Cairns-Smith, 2005). The ‘‘phenotype’’
of that system, sensing the signal from the environment (nutrient solution satura-tion), is the ion exchange properties; the ‘‘genotype’’ of the system is the putting
together of the layers maintained by stacking interactions. Matching rules existbetween these two characteristics; therefore, it is possible that the earliest codewas not linear, but conformational and it still is present in modern organisms like
prions and the stacking interactions of DNA and RNA.A linear polymer can affordmanymore conformational rearrangements. The
discovery of the spontaneous enzyme-free recombination of RNA oligonucleo-
tides (Chetverin, 1999) provides an insight into how the RNA world couldemerge from short oligonucleotides abiogenically synthesized on montmorillo-nite. SELEX experiments demonstrated that an RNA molecule ensembles with
enzyme activities sufficient to provide for the process of self-reproduction of anRNA matrix entirely: from nucleotide synthesis (Unrau and Bartel, 1998) toRNA polynucleotide synthesis on an RNA matrix (Johnston et al., 2001) can
be obtained by selection from among a pool of random RNA polymers.As montmorillonite dries and wets, natural selex in RNA colonies, which
apparently were the earliest co-evolving cell-free ensembles, is a possibility4
(Chetverin, 1999) (Fig. 2). The evolution of such ensembles was acceleratedbecause they could share RNA molecules through the air even at long distances
(Chetverina and Chetverin, 1993).The working structures of ribozymes are loops, linked by many complemen-
tary pairs of nucleotides. These loops are conservative, because for them to
undergo rearrangements, more than one mutation should occur (Aleshin andPetrov, 2003). By contrast, for a protein enzyme to change functions, one or twomutations replacing one or two amino acid radicals in the active center are
enough5 (Ivanisenko et al., 2005). Therefore, refusal of performing functions by
4 Without going into panspermy (see Hoover ‘‘Comets, Carbonaceous Meteorites, and theOrigin of the Biosphere’’ in this book), we hold that it is oligonucleotides that can (forexample, frozen into ice of whatever kind (Chyba and McDonald, 1995)) survive travelingin the outer space. Upon entering a favorable environment, these oligonucleotides startreproducing life.5 For the information on the origin and evolution of the triplet genetic code, which is beyondthe scope of this paper, the reader is referred to the article by Zhouravlev et al. ‘‘Evolution ofthe Translation Termination System in Eukaryotes’’ in this book. The membrane, whichisolated the cell from the environment, may have emerged in the RNA world. Experimentsrevealed RNAmolecules that bind to phospholipid layers by arranging them into vesicles andmodulating the permeability of such vesicles, which is the required condition for their stability(see Lutay et al. ‘‘RNA World: First Steps Towards Functional Molecules’’ in this book).
8 N. L. Dobretsov et al.

the systems that use the triplet code allows such systems to change functions rather
easily, whichmakes these systems extremely flexible from the evolutionary point of
view. The protein–nucleic life is more responsive to environmental change than the
RNA world. It is advantageous, from the evolutionary point of view, that the
enzymes be proteins and that the conserved processes associated with genome
functioning be run by RNA structures (rRNA and regulatory RNA).Montmorillonite and other aluminosilicate derivatives are able to adsorb the
ions of metal biogenes (see above) and the most primitive organic matter
(amino acids, peptides, sugars) and organic molecules, clay minerals are cap-
able of arranging them into complex ordered molecular ensembles (are they the
ancestors to the active centers of enzymes?). Being the product of the weath-
ering of magmatic rocks, clay minerals may be enriched with phosphor and
sulfur (Ferris, 2005; Hazen, 2005). Thus, the key chemicals of life (nucleic
acids, amino acids, biogenes metals, biogenes non-metals, water) are spatially
united in montmorillonite from weathering crust, which facilitates their co-
evolution and suggests a ‘‘clay-silicon cradle’’ for life. J.D. Bernall proposed the
word ‘‘equilibrosphere’’ for the predecessor to the biosphere, that is, a sphere in
which pre-biological evolution might be under way (Bernal, 1967); also, he
made the point that this is a spatial region in which, for some physical and
chemical reasons, liquid, solid and/or gas phases may come in contact. This is
the only kind of sphere in which matter exchange could start and go on.So, how could the evolution of the geosphere set the vector of the evolution
of life? Gravitational separation had elements separated: heavy elements would
leave the liquid water zone for the core zone, light elements would largely be
Fig. 2 Scenario of the basic stages of climate evolution, earth’s crust evolution and biosphereevolution
Important Stages of Geosphere and Biosphere Evolution 9

concentrated in cratonic crust. Access of biogenes to the hydrosphere is limitedby the rate of continental rock weathering, the intensity of volcanism, whichbrings back part of the elements that have migrated to the mantle and core, andthe water solubility of biogenic compounds, which depends on water tempera-ture and pH. At present, biogene enrichment of the ‘‘life zone’’ is due to aglobal endogenous cycle associated with plate tectonics. The scale of oceanicvolcanism associated with either sea floor spreading (the birth of new crust) atmid-oceanic ridges or the subduction of core plated in island arcs is about 10times the scale of continental volcanism (Lisitsin, 1980, 2001). Importantly, therespective environments, to which these two kinds of volcanism are confined,are quite different. All the processes associated with oceanic volcanism arerunning in the medium of a natural electrolyte, marine water, at temperaturesof up to 400 8C and pressures of 30,000–50,000 kPa on the ocean floor. Passingin through a network of cracks and getting heated up to 300–400 8C by hotrocks, marine water transforms into a high-temperature fluid, which leachesbasalts of a large group of elements (including Fe, Mn, Zn, Cu), and so theybecome part of the solution. The total amount of water entering the WorldOcean’s hydrothermal system per unit time is �5.7 thousand tons per second:geologically speaking, the entire World Ocean’s water passes through thehydrotherms just instantly, over 3–8 Myr (Lisitsyn, 1993). Another pathwayof the endogenous cycle is associated with the volcanic activity of the island arcsin the subduction zones, where the biogenes coming from continental crustoccur either in volcanic products or in the mantle. Crust recycling takes from 60to 600 Myr to complete (Dobretsov and Kirdyashkin, 1998). The endogenouscycle is supplemented with an exogenous cycle associated with the transfer ofgases and dispersed effusive material from the lithosphere, through the atmo-sphere, to the Earth’s crust and the hydrosphere. Both cycles contribute com-parably; a low capacity of the exogenous cycle is compensated for by a rapidturnover. Both cycles can operate only at a certain regime of convection cells inthe upper and lower mantles. At the current figure for heat flow, the lowermantle cells take �400–570 Myr to complete the cycle, which is comparablewith the Wilson cycles (‘‘from Pangaea to Pangaea’’). The upper mantle cellstake 30–60 Myr to complete the cycle, which is comparable with or divisible bythe cycles of magnetic inversions (the so-called Stille and Bertram cycles)6 andthe duration of paleontological periods distinguished by typical faunas (Dobret-sov and Chumakov, 2001; Dobretsov and Kovalenko, 1995).
It should be noted that the Raley and Prandtl numbers rather than theReynolds number control thermochemical gravitational convection. For theArchaean, the Rayleigh number (Ra)7 for the lower mantle is estimated to be
6 Even assuming convection mantle-wide, the cycling time remains the same.7 Ra = �g�Tl3/a�, � is the coefficient of volumetric expansion, g is the acceleration ofgravity, �T is the superadiabatic difference in the mantle, l is mantle thickness, a is thermaldiffusivity and � is dynamic viscosity.
10 N. L. Dobretsov et al.

Ra =108–109. Studies of the conditions of emergence of turbulent thermalgravitational convection in a horizontal layer heated from below and cooledfrom above showed that the turbulent mode of free convection occurs atRa > 106, not depending on the Prandtl number at Pr >100. Thus, in theRiphean and Hadean (before 3 Byr ago), the convection was fast-paced andconstantly turbulent, and themodern plate tectonics could not exist. At present,Ra for the lower mantle varies from 5 � 105 to 3 � 106, and the flow in cells isnon-steady or clearly turbulent (Dobretsov et al., 2001).
Intensive volcanism largely associated with the chemically depleted uppermantle was unable to provide biogene supply, but it contributed to the crato-nization of the crust (Fig. 1). In a variety of areas of the Earth’s surface, 4.0–3.9Byr old continental type rocks have been found . Khain (2003) opines that bythe beginning of the Late Archaean (3.0 Byr ago) strong, heat-resistant con-tinental crust plates had formed in large numbers, but small in size. Those plateswere separated by basins with floors composed of oceanic type crust. As early as2.5 Byr ago, change of the convection mode in the mantle gave rise to the firstsupercontinent in the Pangaea series, and a new, continental–oceanic stage ofthe crust evolution began 2.0 Byr ago (Fig. 1b, 2). This stage was characterizedby the modern type of plate tectonics with a deep ocean and continents,enrichment of the chemical composition of acidic effusive and granitic rocksand a ‘‘plume dropper’’ (see below). These events had profound consequencesfor the biosphere evolution.
The migrating biogenes can be held captive in the liquid water zone andjumps in their concentration can be avoided, if there is a more or less limitedcycle of chemical reactions and a buffer’s capacity high enough for thoseelements to circulate within. The World Ocean, this still operating powerfulthermostat and stabilizer of the chemical composition of the atmosphere andthe upper part of the Earth’s crust, was the system that could keep thingsgoing. The invariability of the chemical content of the ocean is supported bythe cooperation of this hydrothermal chemical reactor and the supply ofcarbonates and other compounds of weathering products supplied by con-tinental waters. Thus, the World Ocean is one of the most important exchangesystems for the Earth’s main spheres. The fact that the chemical content of theoceans has remained invariable at least over the past 1 Byr (see below)indicates that this global exchange system is ancient; this is also yet anotherpiece of evidence, which supports the hypothesis that the ancient WorldOcean was deep and defies the hypothesis that ancient oceans were shallow.The invariance of the amount and the chemical content of the World Oceanwater suggests that the World Ocean’s depth has been mostly invariant, withcyclic and evolutionary fluctuations not exceeding 30% (Dobretsov et al.,2001; Khain, 2003).
As modern plate tectonics came to the scene, not only was a hydrothermaloceanic reactor built, but also, more importantly, the chemical content of theeffusive rocks changed, which is well indicated by the change in K2O/Na2Oratio (Fig. 1b). It was about 3 Byr ago that the rocks in the tholeiite and calc-
Important Stages of Geosphere and Biosphere Evolution 11
alkali series, low in K and Na, were replaced by magmatic associations in thesubalkali and alkali series. In the paleontological record, that was at about thesame time when the growth of the biodiversity of the earliest prokaryoticsystems occurred (3–2.5 Byr ago) and the eukaryotes emerged (3–2.7 Byrago); molecular phylogeny also puts the emergence of eukaryotes at 2.7 Byrago and the emergence of cyanobacteria at 2.5 Byr ago (paleontologists opinethat cyanobacteria had emerged earlier; however, 2.5 Byr ago is when the role ofthose organisms in the biosphere became important) (Fig. 1c, 2). Mantleenrichment processes could be under way due to the recycling of crustal mate-rial; however, this does not explain the emergence of potassium-rich sial�1.8–1.2 Byr ago, when the crustal rocks were rapidly enriched in K, and Nabecame part of the solution, the marine water, the chemical content of whichhas since remained invariable. The emergence of potassium-rich sial is a mys-tery. What can be said at the moment is that a large-scale commitment of thelower mantle, enriched in many elements, to the endogenous cycle was a factor.Increased mantle viscosity should have initiated a rearrangement in the globalmantle convection. Since this system is extremely slow responsive, the rearran-gement should have occurred in a saltation-like manner, that is, convectionslowdowns would alternate with releases of the heat accumulated in the core,which rapidly (on a geological scale) gave birth to a series of plumes (it ispossible that convection, for some short period of time, went mantle-wide andthen again specific to separate mantle layers). That could co-occur with anactive formation of magmatic rocks after a more or less calm period 2.5-2 Byrago (Fig. 1a, b).
The global change in the K/Na ratio affected the biosphere. The veryexistence of a closed lipid membrane-enabled cell would have been impossible,if it had not been for the molecular pumps: the cell would have been torn apartby the osmotic pressure (Polevoy, 1985). The key role in the photochemicalsystem of the plants is played by the proton pump, which is the only feature theyhave perfected: the K/Na ratio in the modern plants is comparable with that inthe geosphere. The heterotrophs had to adapt themselves to the environment(potassium prevails over sodium even compared to the geospheric ratio (Nato-chin, 2005)); however, the evolution of the K/Na pump promoted a fast-pacedevolution of the nervous system (by the molecular clock, animals and plantsdiverged �1500 Myr ago, animals and fungi diverged �1208 Myr ago (Hedgesand Kumar, 2003, 2004)).
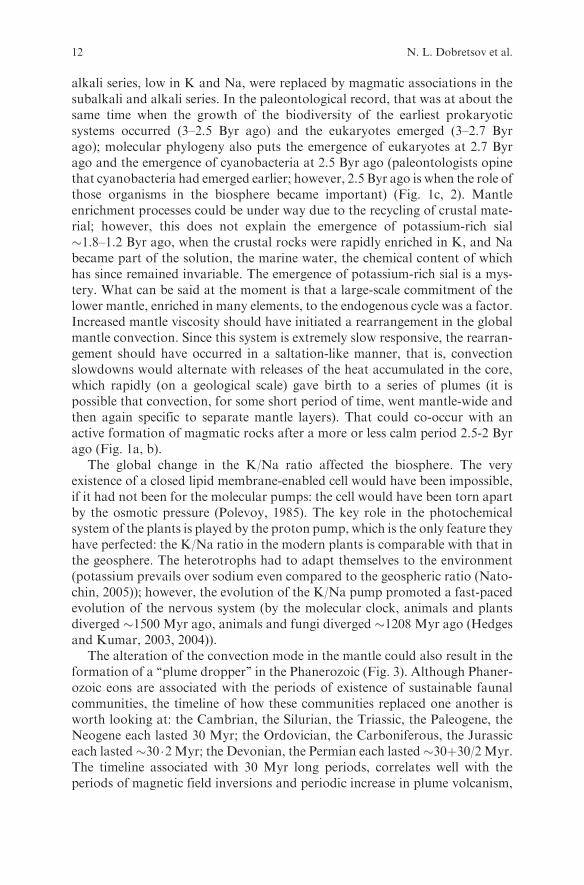
The alteration of the convection mode in the mantle could also result in theformation of a ‘‘plume dropper’’ in the Phanerozoic (Fig. 3). Although Phaner-ozoic eons are associated with the periods of existence of sustainable faunalcommunities, the timeline of how these communities replaced one another isworth looking at: the Cambrian, the Silurian, the Triassic, the Paleogene, theNeogene each lasted 30 Myr; the Ordovician, the Carboniferous, the Jurassiceach lasted�30 �2Myr; the Devonian, the Permian each lasted�30þ30/2Myr.The timeline associated with 30 Myr long periods, correlates well with theperiods of magnetic field inversions and periodic increase in plume volcanism,
12 N. L. Dobretsov et al.

commonly followed by increasing island-arc volcanism. As shown by calcula-
tions, the periodic pattern of volcanism can be explained by the suggestion that
the rate of heat transfer in the outer liquid core is not compensated by convec-
tion in the lower mantle (the Rayleigh number for the outer liquid core in the
Phanerozoic is Ra=1018, and in the mantle, 5� 105–3� 106). The overheat of
the outer core enhances the instability of its flows. Mantle vortex funnels arise
and roam about the core–mantle boundary of the liquid core under the influ-
ence of the Coriolis force, like sunspots (Kirdyashkin and Dobretsov, 2001).
Thermochemical plums are separated in the mantle funnels, where a chemical
dope reducing the melting temperature of the mantle matter is supplied, and
generate hotspots similar to the Hawaii one, with effusion of liquid lavas
enriched in biogenic elements. The chemical dope reducing the mantle matter
melting temperature can be formed, for example, by the reaction of hydrogen
and/or methane with iron-containing minerals of the lower mantle, such as
perovskite and magnesiowustite. Gas release increases with the overheat of the
outer core. As a series of such plumes is separated from the core–mantle
Fig. 3 Biodiversity in motion according to J.J. Sepkoski (Sepkoski, 1994; Sepkoski, 1996).Moments of high taxons fixation in paleontology according to S.V. Rozhvoz (Rozhnov,2005). Circles stand for plume droppers
Important Stages of Geosphere and Biosphere Evolution 13
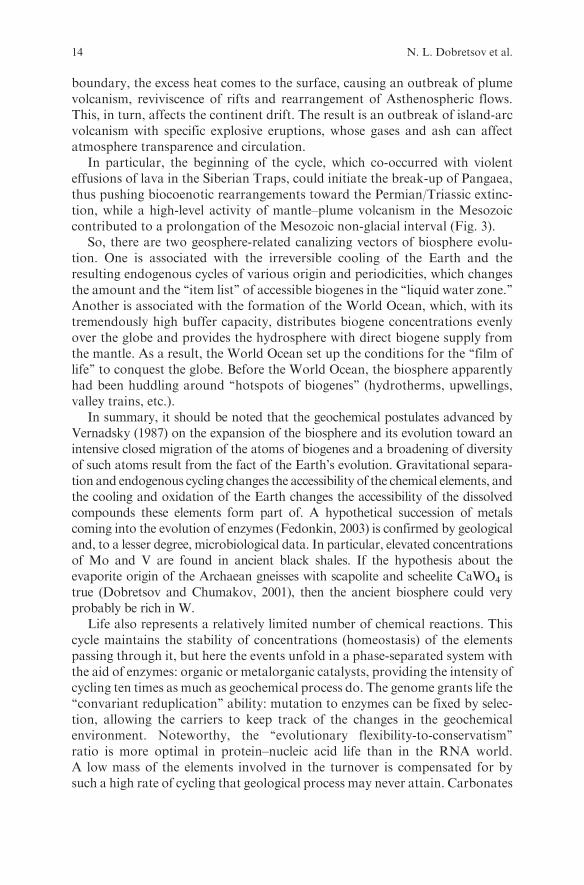
boundary, the excess heat comes to the surface, causing an outbreak of plumevolcanism, reviviscence of rifts and rearrangement of Asthenospheric flows.This, in turn, affects the continent drift. The result is an outbreak of island-arcvolcanism with specific explosive eruptions, whose gases and ash can affectatmosphere transparence and circulation.
In particular, the beginning of the cycle, which co-occurred with violenteffusions of lava in the Siberian Traps, could initiate the break-up of Pangaea,thus pushing biocoenotic rearrangements toward the Permian/Triassic extinc-tion, while a high-level activity of mantle–plume volcanism in the Mesozoiccontributed to a prolongation of the Mesozoic non-glacial interval (Fig. 3).
So, there are two geosphere-related canalizing vectors of biosphere evolu-tion. One is associated with the irreversible cooling of the Earth and theresulting endogenous cycles of various origin and periodicities, which changesthe amount and the ‘‘item list’’ of accessible biogenes in the ‘‘liquid water zone.’’Another is associated with the formation of the World Ocean, which, with itstremendously high buffer capacity, distributes biogene concentrations evenlyover the globe and provides the hydrosphere with direct biogene supply fromthe mantle. As a result, the World Ocean set up the conditions for the ‘‘film oflife’’ to conquest the globe. Before the World Ocean, the biosphere apparentlyhad been huddling around ‘‘hotspots of biogenes’’ (hydrotherms, upwellings,valley trains, etc.).
In summary, it should be noted that the geochemical postulates advanced byVernadsky (1987) on the expansion of the biosphere and its evolution toward anintensive closed migration of the atoms of biogenes and a broadening of diversityof such atoms result from the fact of the Earth’s evolution. Gravitational separa-tion and endogenous cycling changes the accessibility of the chemical elements, andthe cooling and oxidation of the Earth changes the accessibility of the dissolvedcompounds these elements form part of. A hypothetical succession of metalscoming into the evolution of enzymes (Fedonkin, 2003) is confirmed by geologicaland, to a lesser degree, microbiological data. In particular, elevated concentrationsof Mo and V are found in ancient black shales. If the hypothesis about theevaporite origin of the Archaean gneisses with scapolite and scheelite CaWO4 istrue (Dobretsov and Chumakov, 2001), then the ancient biosphere could veryprobably be rich in W.
Life also represents a relatively limited number of chemical reactions. Thiscycle maintains the stability of concentrations (homeostasis) of the elementspassing through it, but here the events unfold in a phase-separated system withthe aid of enzymes: organic or metalorganic catalysts, providing the intensity ofcycling ten times as much as geochemical process do. The genome grants life the‘‘convariant reduplication’’ ability: mutation to enzymes can be fixed by selec-tion, allowing the carriers to keep track of the changes in the geochemicalenvironment. Noteworthy, the ‘‘evolutionary flexibility-to-conservatism’’ratio is more optimal in protein–nucleic acid life than in the RNA world.A low mass of the elements involved in the turnover is compensated for bysuch a high rate of cycling that geological process may never attain. Carbonates
14 N. L. Dobretsov et al.

contain 0.6 ��1023 g of carbon, while the biosphere only 0.5 ��1018 g, and thatis why the carbon cycle is first of all the carbonate cycle (Dobretsov andKovalenko, 1995; Tajika and Matsui, 1992). Nevertheless, the high rates ofbiogeochemical cycling make its Corg annual balance comparable with that inthe carbonate cycle, although their respective absolute values are 10,000-folddifferent. A high rate of biogeochemical cycles was the first mechanism inhelping the biosphere to gain autonomy from the geosphere. That mechanismwas best used by bacteria. Various estimates put the microbial biomass at50–90% of the Earth’s total (Vinogradov, 2004; Zavarzin, 2003a). This figureincludes not only terrestrial bacteria, symbiotic eukaryotic bacteria, soil bac-teria, nanoplankton and other bacteria inhabiting the ocean, but also prokar-yotes living in such extreme biotopes as hydrotherms, salt and soda lakes andeven archaea in nuclear reactors. The prokaryotes control the main biogeniccycles and this, in combination with a tremendously large total prokaryoticbiomass, allows the microbes to shape the environment ‘‘from outside’’ like thegeological bodies do (see Zavarzin ‘‘Microbial Biosphere’’ in this book). Thisabrogates the need for further adaptive evolution in prokaryotes. The genomebegan to play a regulatory and a repairing function, supporting adaptivedynamics (species balance) in the prokaryotic communities and restoration ofthese communities wherever they were adversely affected (by volcanism, glacia-tions and later eating-up by eukaryotes). Molecular phylogeny has made aninteresting point: all the known energy-producing enzyme systems appearedvery early, at the dawn of evolution, from a common ancestor (Castresana andMoreira, 1999), which seems to be a miracle. It is more likely that there is nosuch thing as a common ancestral organism—the ‘‘common ancestor’’ is abiogeocoenosis (Zavarzin, 2001; see Zavarzin ‘‘Microbial Biosphere’’ in thisbook), and the elements developing in various parts of its enzyme systems werelater dispensed among taxa by horizontal transfer, so popular with the prokar-yotes (Shestakov, 2005). That is, the main enzyme systems may have evolved byrecombination. This scenario is also supported by that surprising fact thatamong the modern prokaryotes the highest levels of diversity and the bestbalance of biogeochemical cycles (and, therefore, stability) are features ofmixed archaean/eubacterial communities: methanogenic archaea interact withfermenting bacteria, hydrolytic clostridia interact with dissipatrophic spiro-chete, spirochete interact with sulfate-reducing proteobacteria (Zavarzin,2001). Thus, the evolution of prokaryotes is quite different from the evolutionas per Darwin (Fig. 2).
With the advent of photosynthesis, the second and most important mechan-ism of gaining autonomy from the geosphere, the biosphere gained access to asource of energy that was not associated with the geosphere, and for the firsttime set its own, biotic vector of evolution, which prepared the geochemicalsettings (in particular, the ozone layer) suitable for life to come to the continentsand to continue expansion. There is an opinion that oxygenic photosynthesiscould be older than 3.5–3.3 Byr, and some enzyme systems even more. How-ever, any calculations using themolecular clock with only single key genes of the
Important Stages of Geosphere and Biosphere Evolution 15
photosynthetic machinery dealt with make little sense. These genes could haveexisted long before photosynthesis and they performed other functions, forexample, synthesis of protective pigments against sunrays or/and active oxygenof non-biogenic origin, by water photolysis. What is required is molecular-genetic calculations for many key genes for photosynthesis at a time, includingconsideration to their co-adaptive evolution.
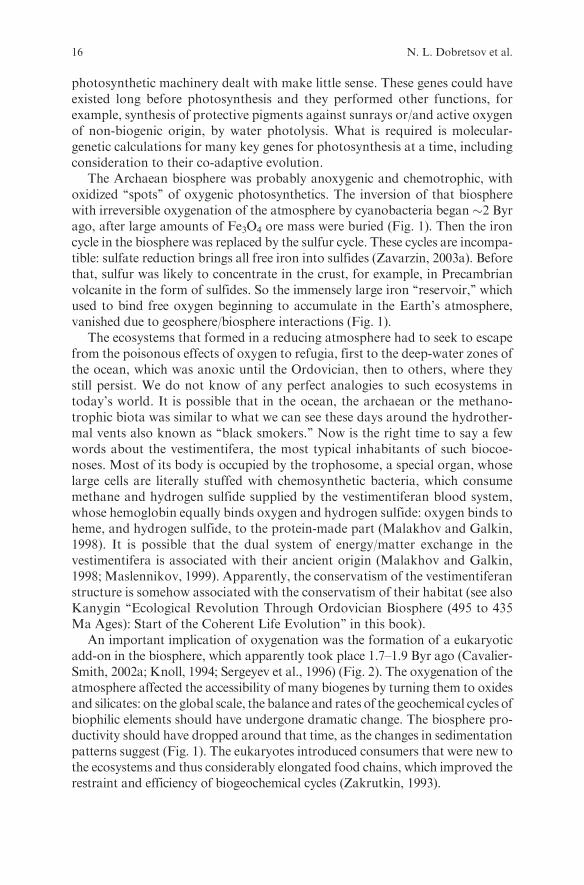
The Archaean biosphere was probably anoxygenic and chemotrophic, withoxidized ‘‘spots’’ of oxygenic photosynthetics. The inversion of that biospherewith irreversible oxygenation of the atmosphere by cyanobacteria began �2 Byrago, after large amounts of Fe3O4 ore mass were buried (Fig. 1). Then the ironcycle in the biosphere was replaced by the sulfur cycle. These cycles are incompa-tible: sulfate reduction brings all free iron into sulfides (Zavarzin, 2003a). Beforethat, sulfur was likely to concentrate in the crust, for example, in Precambrianvolcanite in the form of sulfides. So the immensely large iron ‘‘reservoir,’’ whichused to bind free oxygen beginning to accumulate in the Earth’s atmosphere,vanished due to geosphere/biosphere interactions (Fig. 1).
The ecosystems that formed in a reducing atmosphere had to seek to escapefrom the poisonous effects of oxygen to refugia, first to the deep-water zones ofthe ocean, which was anoxic until the Ordovician, then to others, where theystill persist. We do not know of any perfect analogies to such ecosystems intoday’s world. It is possible that in the ocean, the archaean or the methano-trophic biota was similar to what we can see these days around the hydrother-mal vents also known as ‘‘black smokers.’’ Now is the right time to say a fewwords about the vestimentifera, the most typical inhabitants of such biocoe-noses. Most of its body is occupied by the trophosome, a special organ, whoselarge cells are literally stuffed with chemosynthetic bacteria, which consumemethane and hydrogen sulfide supplied by the vestimentiferan blood system,whose hemoglobin equally binds oxygen and hydrogen sulfide: oxygen binds toheme, and hydrogen sulfide, to the protein-made part (Malakhov and Galkin,1998). It is possible that the dual system of energy/matter exchange in thevestimentifera is associated with their ancient origin (Malakhov and Galkin,1998; Maslennikov, 1999). Apparently, the conservatism of the vestimentiferanstructure is somehow associated with the conservatism of their habitat (see alsoKanygin ‘‘Ecological Revolution Through Ordovician Biosphere (495 to 435Ma Ages): Start of the Coherent Life Evolution’’ in this book).
An important implication of oxygenation was the formation of a eukaryoticadd-on in the biosphere, which apparently took place 1.7–1.9 Byr ago (Cavalier-Smith, 2002a; Knoll, 1994; Sergeyev et al., 1996) (Fig. 2). The oxygenation of theatmosphere affected the accessibility of many biogenes by turning them to oxidesand silicates: on the global scale, the balance and rates of the geochemical cycles ofbiophilic elements should have undergone dramatic change. The biosphere pro-ductivity should have dropped around that time, as the changes in sedimentationpatterns suggest (Fig. 1). The eukaryotes introduced consumers that were new tothe ecosystems and thus considerably elongated food chains, which improved therestraint and efficiency of biogeochemical cycles (Zakrutkin, 1993).
16 N. L. Dobretsov et al.

The main mechanism of reproduction in prokaryotes is through fission.They possess some analogies to sexual reproduction: conjugation, transfor-mation and transduction; but these are only triggered as backup processes incritical environmental situations, when all else fails (Prozorov, 2002). There-fore, the ‘‘sexual process’’ in the prokaryotes is only casually associated withreproduction, and, as far as the prokaryotes are concerned, there is no suchthing as sexual reproduction in the sense it exists in the eukaryotes. Bycontrast, in most eukaryotes, reproduction is necessarily preceded by DNAfragment exchange in the form of a sexual process (Cavalier-Smith, 2002b) asthe main mechanism for generating diversity. Non-sexual reproduction, whichoccurs in some eukaryotic groups, is only optional and serves either to rapidlyincrease the biomass (parthenogenesis in plant louses, vegetative propagationin plants) or to raise the probability of reproduction in special conditions,when chances of meeting a partner are low (parthenogenesis in lizards,apomixis in plants) (Ruvinsky, 1991; Vasilyev et al., 1983). Thus, the sexualprocess has since some time become not only the leading mechanism ofreproduction in the eukaryotes but also one of the major factors of speciation,for it gave birth to self-contained endogamous species (Ruvinsky, 1991;Starobogatov, 1985). It is possible that many-celled eukaryotes, most ofwhich are self-contained endogamous species, appeared due to that importantrole of sexual reproduction in speciation (Starobogatov, 1985). Thus, 1.7–1.9Byr ago is the most important period of time in the development of biodi-versity (Fig. 2). The genome size increased from 104–105 to 109–1010 bpfollowing transition from prokaryotes to eukaryotes, and the gene numberincreased from 470 (Mycoplasma genitalium) to 30–40 thousand (many-celledeukaryotes). However, while the organizational complexity of the bacteriagenerally correlates with the genome size and gene number, the eukaryoticsituation tells a different story, for there is no correlation between theirorganizational complexity, genome size or gene number. In the insects,which are noted for the highest level of biodiversity on the Earth, and in theamphibians, which have the lowest level of biodiversity among the verte-brates, genome size fluctuations never exceed 100-fold. At the same time,Drosophila melanogaster numbers 13,600 genes, while Caenorhabditis elegans,which is a more primitive organism, 19,000. Surprisingly, the man and the fishfugu have about the same number of genes, 30,000–40,000 (Carroll, 2001; Taftand Mattick, 2003). It looks like we face a fundamental biological law, whichpredetermined the evolution of the prokaryotes, whose progress from certainpoint on became dependent on the genome size, and the evolution of theeukaryotes, in which this dependence at certain point was abolished, perhaps,because of a complex organization and regulation of the genome.
In conclusion, the reader is invited to a general schematic for the evolution ofthe biosphere and critical biological innovations in the Precambrian–Phaner-ozoic. There are five most important stages to it: (1) Archaean, throughoutwhich the prokaryotes dominated, and the environments were all reducing(probably, with some occasional spots of oxidation); (2) Proterozoic,
Important Stages of Geosphere and Biosphere Evolution 17
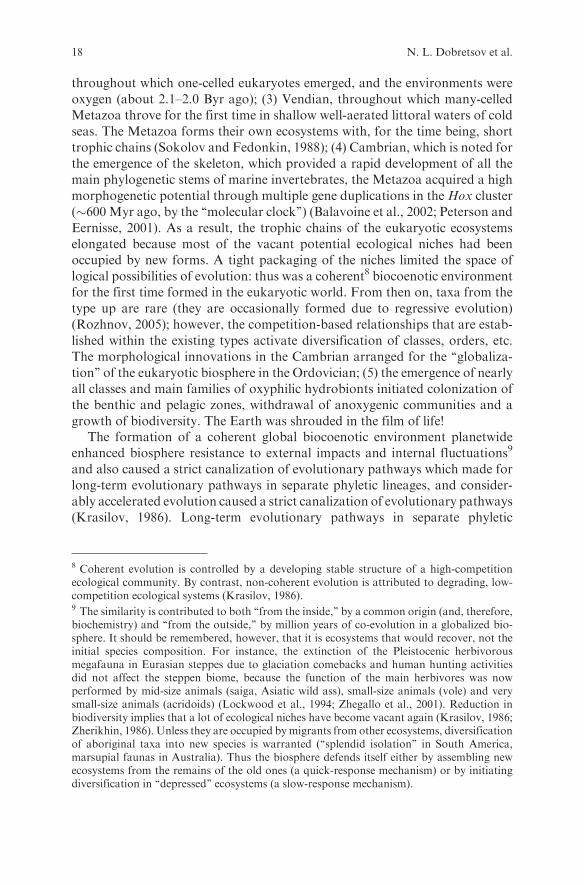
throughout which one-celled eukaryotes emerged, and the environments wereoxygen (about 2.1–2.0 Byr ago); (3) Vendian, throughout which many-celledMetazoa throve for the first time in shallow well-aerated littoral waters of coldseas. The Metazoa forms their own ecosystems with, for the time being, shorttrophic chains (Sokolov and Fedonkin, 1988); (4) Cambrian, which is noted forthe emergence of the skeleton, which provided a rapid development of all themain phylogenetic stems of marine invertebrates, the Metazoa acquired a highmorphogenetic potential through multiple gene duplications in theHox cluster(�600 Myr ago, by the ‘‘molecular clock’’) (Balavoine et al., 2002; Peterson andEernisse, 2001). As a result, the trophic chains of the eukaryotic ecosystemselongated because most of the vacant potential ecological niches had beenoccupied by new forms. A tight packaging of the niches limited the space oflogical possibilities of evolution: thus was a coherent8 biocoenotic environmentfor the first time formed in the eukaryotic world. From then on, taxa from thetype up are rare (they are occasionally formed due to regressive evolution)(Rozhnov, 2005); however, the competition-based relationships that are estab-lished within the existing types activate diversification of classes, orders, etc.The morphological innovations in the Cambrian arranged for the ‘‘globaliza-tion’’ of the eukaryotic biosphere in the Ordovician; (5) the emergence of nearlyall classes and main families of oxyphilic hydrobionts initiated colonization ofthe benthic and pelagic zones, withdrawal of anoxygenic communities and agrowth of biodiversity. The Earth was shrouded in the film of life!
The formation of a coherent global biocoenotic environment planetwideenhanced biosphere resistance to external impacts and internal fluctuations9
and also caused a strict canalization of evolutionary pathways which made forlong-term evolutionary pathways in separate phyletic lineages, and consider-ably accelerated evolution caused a strict canalization of evolutionary pathways(Krasilov, 1986). Long-term evolutionary pathways in separate phyletic
8 Coherent evolution is controlled by a developing stable structure of a high-competitionecological community. By contrast, non-coherent evolution is attributed to degrading, low-competition ecological systems (Krasilov, 1986).9 The similarity is contributed to both ‘‘from the inside,’’ by a common origin (and, therefore,biochemistry) and ‘‘from the outside,’’ by million years of co-evolution in a globalized bio-sphere. It should be remembered, however, that it is ecosystems that would recover, not theinitial species composition. For instance, the extinction of the Pleistocenic herbivorousmegafauna in Eurasian steppes due to glaciation comebacks and human hunting activitiesdid not affect the steppen biome, because the function of the main herbivores was nowperformed by mid-size animals (saiga, Asiatic wild ass), small-size animals (vole) and verysmall-size animals (acridoids) (Lockwood et al., 1994; Zhegallo et al., 2001). Reduction inbiodiversity implies that a lot of ecological niches have become vacant again (Krasilov, 1986;Zherikhin, 1986). Unless they are occupied bymigrants from other ecosystems, diversificationof aboriginal taxa into new species is warranted (‘‘splendid isolation’’ in South America,marsupial faunas in Australia). Thus the biosphere defends itself either by assembling newecosystems from the remains of the old ones (a quick-response mechanism) or by initiatingdiversification in ‘‘depressed’’ ecosystems (a slow-response mechanism).
18 N. L. Dobretsov et al.
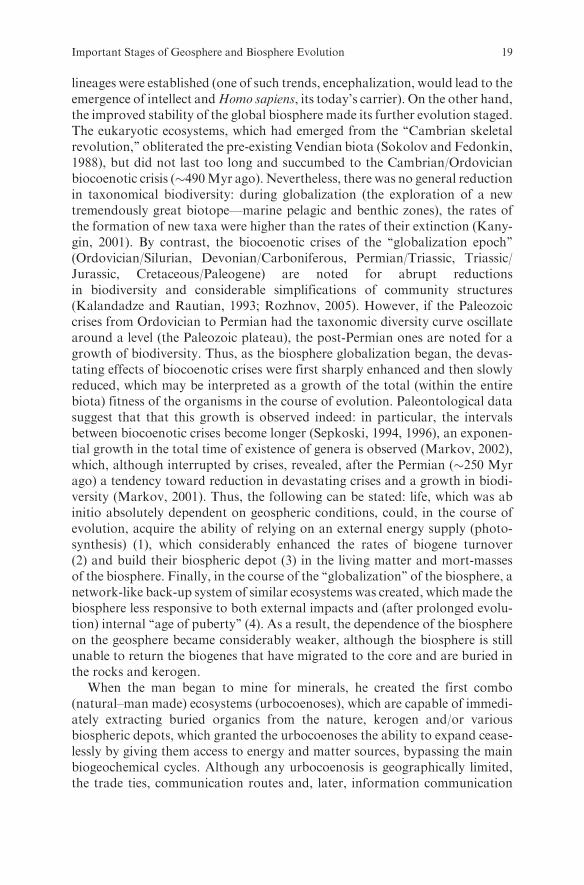
lineages were established (one of such trends, encephalization, would lead to theemergence of intellect andHomo sapiens, its today’s carrier). On the other hand,the improved stability of the global biosphere made its further evolution staged.The eukaryotic ecosystems, which had emerged from the ‘‘Cambrian skeletalrevolution,’’ obliterated the pre-existing Vendian biota (Sokolov and Fedonkin,1988), but did not last too long and succumbed to the Cambrian/Ordovicianbiocoenotic crisis (�490Myr ago). Nevertheless, there was no general reductionin taxonomical biodiversity: during globalization (the exploration of a newtremendously great biotope—marine pelagic and benthic zones), the rates ofthe formation of new taxa were higher than the rates of their extinction (Kany-gin, 2001). By contrast, the biocoenotic crises of the ‘‘globalization epoch’’(Ordovician/Silurian, Devonian/Carboniferous, Permian/Triassic, Triassic/Jurassic, Cretaceous/Paleogene) are noted for abrupt reductionsin biodiversity and considerable simplifications of community structures(Kalandadze and Rautian, 1993; Rozhnov, 2005). However, if the Paleozoiccrises from Ordovician to Permian had the taxonomic diversity curve oscillatearound a level (the Paleozoic plateau), the post-Permian ones are noted for agrowth of biodiversity. Thus, as the biosphere globalization began, the devas-tating effects of biocoenotic crises were first sharply enhanced and then slowlyreduced, which may be interpreted as a growth of the total (within the entirebiota) fitness of the organisms in the course of evolution. Paleontological datasuggest that that this growth is observed indeed: in particular, the intervalsbetween biocoenotic crises become longer (Sepkoski, 1994, 1996), an exponen-tial growth in the total time of existence of genera is observed (Markov, 2002),which, although interrupted by crises, revealed, after the Permian (�250 Myrago) a tendency toward reduction in devastating crises and a growth in biodi-versity (Markov, 2001). Thus, the following can be stated: life, which was abinitio absolutely dependent on geospheric conditions, could, in the course ofevolution, acquire the ability of relying on an external energy supply (photo-synthesis) (1), which considerably enhanced the rates of biogene turnover(2) and build their biospheric depot (3) in the living matter and mort-massesof the biosphere. Finally, in the course of the ‘‘globalization’’ of the biosphere, anetwork-like back-up system of similar ecosystems was created, which made thebiosphere less responsive to both external impacts and (after prolonged evolu-tion) internal ‘‘age of puberty’’ (4). As a result, the dependence of the biosphereon the geosphere became considerably weaker, although the biosphere is stillunable to return the biogenes that have migrated to the core and are buried inthe rocks and kerogen.
When the man began to mine for minerals, he created the first combo(natural–man made) ecosystems (urbocoenoses), which are capable of immedi-ately extracting buried organics from the nature, kerogen and/or variousbiospheric depots, which granted the urbocoenoses the ability to expand cease-lessly by giving them access to energy and matter sources, bypassing the mainbiogeochemical cycles. Although any urbocoenosis is geographically limited,the trade ties, communication routes and, later, information communication
Important Stages of Geosphere and Biosphere Evolution 19

systems (frommost ancient, that is, letters, to modern, that is electronics-based)
allow it to gain control of dozens of times as vast territories (Braudel, 1990). In
this respect, an urbocoenosis is similar to the communities of migrating ani-
mals, but there is a difference, too: potentially, it has no limitations in the form
of either geographical barriers or the mass of the matter being transported or
transportation rates. Technical progress is the only barrier-setting factor to
each stage of human evolution. Throughout the New Era, the urbocoenoses are
gradually sneaking away from the control of the biogeocoenoses and are
trapped within and settle on the surface of a geographic sphere which is, on
Zavarzin’s suggestion, known as the cacosphere (from the Greek kakos—
worthless, of a bad nature, destructive) (Zavarzin, 2003b). Naming it ‘‘the
cacosphere,’’ Zavarzin assumes all the man-made biogeocoenoses, whose typi-
cal features are low taxonomic diversity, loss or misfunction of regulatory
associations and a low degree of closure (associated with both misfunction of
biocoenotic associations and a large amounts of matter transported from the
lithosphere in bypass of biogeochemical cycles). Since the degree of closure is
low, the cacosphere is unable to support itself and is prone to self-contamina-
tion, hence the need for self-decontamination biospheric mechanisms (first
of all, bacterial filters of soils, water bodies and woods) and/or dump sites
(Zavarzin, 2003b). A low taxonomic and biocoenotic diversity and an expo-
nential growth of the cacosphere are the factors that together make it somewhat
questionable that the cacosphere will ever be able to evolve independently,
always improving the total fitness, for so long as the biosphere has been
evolving since the Cambrian: hundreds of millions of years. Over a similar
span of time, the external resources that support the cacosphere (soils, woods,
and accessible minerals) would be depleted, and the way the cacosphere has
gone global over the past 80 years leaves no hope for exploration of new areas or
resources: believing that the Cambrian/Ordovician situation (a crisis which did
not end up with total extinction) would ensue again makes little sense.
Acknowledgment We acknowledge our gratitude to A.Yu. Rozanov and A.V. Kanyginfor fruitful discussion and to A.V. Kharkevich of the IC&G for his design work. We are indebt to V. Filonenko for translating this manuscript from Russian into English. This work issupported by the Russian Foundation for Basic Research (No. 04-01-00458, 05-04-49068,05-07-90274, 06-04-49556) and the Program of the Presidium of RAS ‘‘Biosphere Origin andEvolution.’’
References
Aleshin, V.V. and Petrov, N.B. (2003) Conditionally neutral characters. Priroda 12, 25–34(in Russ.).
Balavoine, G., de Rosa, R. and Adoutte, A. (2002) Hox clusters and bilaterian phylogeny.Mol. Phylogenet. Evol. 24. 366–373.
Bernal, J.D. (1967) The Origin of Life. World, New York.
20 N. L. Dobretsov et al.

Braudel, F. (1990) LaMediterranee et le monde mediterraneen a l’epoque de Philippe II, tome2: Destins collectifs et mouvements d’ensemble. Armand Colin, Paris.
Cairns-Smith, A.G. (2005) Sketches for a mineral genetic material. Elements 1, 157–161.Carroll, S.B. (2001) Chance and necessity; the evolution of morphological complexity and
diversity. Nature 409, 1102–1109.Castresana, J. and Moreira, D. (1999) Respiratory chains in the last common ancestor of
living organisms. J. Mol. Evol. 49, 453–460.Cavalier-Smith, T. (2002a) The phagotrophic origin of eucaryotes and phylogenetic classifi-
cation of Protozoa. Int. J. Syst. Evol. Microbiol. 52, 297–354.Cavalier-Smith, T. (2002b) Origins of the machinery of recombination and sex. Heredity 88,
125–141.Chetverin, A.B. (1999) The puzzle of RNA recombination. FEBS Lett. 460, 1–5.Chetverina, H.V. and Chetverin, A.B. (1993) Cloning of RNA molecules in vitro. NAR 21,
2349–2353.Chyba, C.F. andMcDonald, G.D. (1995) The origin of life in the solar system: current issues.
Annu. Rev. Earth Planet. Sci. 23, 215–249.Condie, K.C. (1989) Plate Tectonics and Crustal Evolution. Pergamon Press, Oxford.Dobretsov, N.L. and Chumakov, N.N. (2001) Global periodical variations in litologspheric
and biospheric evolution. In: N.L. Dobretsov and N.I. Kovalenko (Eds), GlobalEnvironmental Changes. SO RAN, filial GEO, Novosibirsk, pp. 11–26 (in Russ.).
Dobretsov, N.L. and Kirdyashkin, A.G. (1998) Assessment of global matter exchangebetween the Earth’s layers: comparing geological and theoretical data. Geol. Geofiz. 39,1269–1279 (in Russ.).
Dobretsov, N.L. andKovalenko, N.I. (1995) Global environmental changes. Geol. Geofiz. 36,7–30 (in Russ.).
Dobretsov,N.L.,KirdyashkinA.G. andKirdyashkin, A.A. (2001)DepthGeodynamics.Geya,Novosibirsk (in Russ.).
Fedonkin,M.A. (2003). The origin of theMetazoa in the light of the Proterozoic fossil record.Paleontological Research 7, 9–41.
Ferris, J.P. (2005) Mineral catalysis and prebiotic synthesis: montmorillonite-catalyzed for-mation of RNA. Elements 1, 145–149.
Grigoryev,D.P. (1956) Further insights intomineralogical objects; minerals as perA.K. Boldyrev.Zap. Vses. Mineral. O-va. 85, 463–471 (in Russ.).
Hazen, R.M. (2005) Genesis: rocks, minerals and the geochemical origin of life. Elements 1,135–137.
Hedges, S.B. and Kumar, S. (2003) Genomic clocks and evolutionary timescales. TrendsGenet. 19, 200–206.
Hedges, S.B. and Kumar, S. (2004) Precision of molecular time estimates. Trends Genet. 20,242–247.
Ivanisenko, V.A., Pintus, S.S., Grigorovich, D.A. and Kolchanov, N.A. (2005) PDBSite: adatabase of the 3D structure of protein functional sites. NAR 33, D183–D187.
Izokh, E.P. (1978) Assessment of the Ore-Bearing Capacity of Granitoid Formations with aView to Making Predictions. Nedra, Moscow (in Russ.).
Johnston, W.K., Unrau, P.J., Lawrence, M.S., Glasner, M.E. and Bartel, D.P. (2001) RNA-catalyzed RNA polimerization: accurate and general RNA-templated primer extension.Science 292, 1319–1325.
Kalandadze, N.N. and Rautian, A.S. (1993) Symptomatology of ecological crises. Stratigr.Geol. korrel. 1, 3–8 (in Russ.).
Kanygin, A.V. (2001) The Ordovician explosive divergence of the earth’s organic realm:causes and effects of the biosphere evolution. Russ. Geol. Geophis. 42, 599–633.
Khain, V.E. (2003)Main Challenges inModern Geology. NauchnyyMir,Moscow (in Russ.).Kirdyashkin, A.G. and Dobretsov, N.L. (2001) The effects of the structure of convective
flows and plume flows in the Earth’s mantle on the periodicity of endogenous
Important Stages of Geosphere and Biosphere Evolution 21
processes. In: N.L. Dobretsov and N.I. Kovalenko (Eds), Global EnvironmentalChanges. SO RAN, filial GEO, Novosibirsk, pp. 27–41 (in Russ.).
Knoll, A.H. (1994)Neoproterozoic evolution and environmental change. In: S. Bengtson (Ed.),Early Life on Earth. Columbia Univ. Press, New York, pp. 439–449.
Kolchanov, N.A., Suslov, V.V. and Shumny, V.K. (2003) Molecular evolution of geneticsystems. Paleontol. J. 37, 617–629.
Krasilov, V.A. (1986) Unsolved Problems of Evolution Theory. FERSAS SSSR, Vladivistok(in Russ.).
de Laeter, J.R. and Trendall, A.F. (2002) The oldest rocks: the Western Australian connec-tion. J. R. S. West. Aust. 85, 153-160.
Lisitsyn, A.P. (1980) The history of oceanic volcanism. In: A.S. Monin and A.P. Lisitsyn(Eds), The Geological History of the Ocean. Nauka, Moscow, pp. 278–319 (in Russ.).
Lisitsyn, A.P. (1993) Hydrothermal systems of the World Ocean as a supplier of endogenousmatter In: A.P. Lisitsyn (Ed.), Hydrothermal Systems and Sediment Formations ofMid-oceanic Ridges. Nauka, Moscow, pp. 147–247 (in Russ.).
Lisitsyn, A.P. (2001) The lithology of lithospheric plates. Geol. Geofiz. 42, 522–559 (in Russ.).Liubischev, A.A. (1982) On the Form, Systematics and Evolution of Organisms. Nauka,
Moscow (in Russ.).Lockwood, J.A., Bomar, C.R., Williams, S.E., Dodd, J.L., Quan, M. and Li, H. (1993) Insect
ecology on the Asian and North American steppes: striking differences and remarkablesimilarities. In: Li Bo (Ed.), Proceedings of the International Symposium on GrasslandResources. August, 1993. Agricultural Scientech Press, Beijing, pp. 513–527.
Malakhov, V.V. and Galkin, S.V. (1998) The Vestimentifera: Acoelic Invertebrates of theDeep. KMK, Moscow (in Russ.).
Markov, A.V. (2001) Dynamics of the marine faunal diversity in the Phanerozoic: a newapproach. Paleontol. J. 35, 1–9.
Markov, A.V. (2002) Mechanisms responsible for the increase in the taxonomic diversity inthe Phanerozoic Marine Biota. Paleontol. J. 36, 121–130.
Maslennikov, V.V. (1999) Sedimentogenesis, Halmyrolysis and the Ecology of PyritiferousPaleohydrothermal Fields: a South Urals Case. Geotur, Miass (in Russ.).
Natochin, Yu.V. (2005.) The role of sodium ions as a stimulus for the evolution of cells andmulticellular animals. Paleonotol. J. 39, 358–363.
Peterson, K.J. and Eernisse, D.J. (2001) Animal phylogeny and the ancestry of bilaterians:inferences from morphology and 18S rDNA gene sequences. Evol. Dev. 3, 170–205.
Polevoy, V.V. (1985) The living state of the cell. In: V.V. Polevoy andYu.I.Maslov (Eds), TheEvolution of Function in Plants. LGU, Leningrad, pp. 36–45 (in Russ.),
Prozorov, A.A. (2002) Altruism in the bacterial world? Uspekhi Sovremennoy Biol. 122,403–413 (in Russ.).
Rozanov, A.Yu. (2006) Precambrian geobiology. Paleontol. J. 40, S434–S443.Rozhnov, S.V. (2005) Morphological patterns in the formation and evolution of higher taxa of
echinodermata. In: E.I. Vorobjeva and B.R. Striganova (Eds), Evolutionary Factors of theFormation ofAnimal LifeDiversity.KMKScientific Press,Moscow, pp. 156–170 (inRuss.).
Rundkvist, D.V. (1968) Issues in mineral research. Zap. Vses. Mineral. O-va. 97, 191–209(in Russ.).
Rundkvist, D.V., Denisenko, V.K. and Pavlova, I.G. (1971) Greisen Deposits (Ontogenesisand Phylogenesis). Nedra, Moscow (in Russ.).
Ruvinsky, A.O. (1991) Sex, meiosis and progressive evolution. In: V.K. Shumny,N.A.KolchanovandA.O.Ruvinsky (Eds), Problems ofGenetics andEvolutional Theory.Nauka,Novosibirsk,pp. 214–228 (in Russ.).
Schidlowski, M. (1988) A 3,800 million-year old record of life from carbon in sedimentaryrocks. Nature 333, 313–318.
Semikhatov, M.A. (1993) The most recent scales for general division of the Precambrian: acomparison. Stratigr. Geol. korrel. 1, 6–16 (in Russ.).
22 N. L. Dobretsov et al.

Sepkoski, J.J. (1994) Limits to randomness in paleobiologic models: the case of Phanerozoicspecies diversity. Acta Palaeontol. Polon. 38, 175–198.
Sepkoski, J.J. (1996.) Patterns of Phanerozoic extinction: a perspective from global data bases.In: O.H.Walliser (Ed.), Global Events and Event Stratigraphy. Springer, Berlin, pp. 35–51.
Sergeyev, V.N., Noll, E.H. and Zavarzin, G.A. (1996) The first three billion years of life: fromprokaryotes to eukaryotes. Priroda 6, 54–67 (in Russ.).
Shestakov, S.V. (2005) Contribution of genomics to investigation of prokaryotic evolution.In: A. Yu Rozanov and V.N. Snytnikov (Eds) Proceedings of the International Workshopon Biosphere Origin and Evolution. IC SB RAS, Novosibirsk, pp. 24–25.
Shmalgauzen, I.I. (1968) Evolutionary Factors (Stabilizing Selection Theory). Nauka,Moscow (in Russ.).
Sokolov, B.S. and Fedonkin, M.A. (1988.) Modern Paleontology. Nedra, Moscow (in Russ.).Starobogatov, Ya.I. (1985.) Aspects of Speciation. VINITI, Moscow (in Russ.).Taft, R.J. and Mattick, J.S. (2003) Increasing biological complexity is positively correlated
with the relative genome-wide expansion of non-protein-coding DNA sequences. GenomeBiol. 5. P1. Epub.
Tajika, E. andMatsui, N. (1992) Evolution of terrestrial proto-CO2-atmosphere coupled withthermal history of Earth. Earth Planet. Sci. Lett. 113, 251–266.
Trubitsin, V.P. and Rykov V.V. (2001) Numerical models of mantle convection’s evolution:In: N.L. Dobretsov andN.I. Kovalenko (Eds), Global Environmental Changes. SORAN,filial GEO, Novosibirsk, pp. 42–55 (in Russ.).
Unrau, P.J. and Bartel, D.P. (1998) RNA-catalyzed nucleotide synthesis. Nature 395,260–263.
Vasilyev, V.P., Vasilyeva, E.D. and Osipov, A.G (1983). First evidence favoring the mainhypothesis of net-like speciation. Dokl. AN SSSR 271, 1009–1012 (in Russ.).
Vavilov, N.I. (1967) The law of homologous series in the inheritance of variability. In:I.A.Rappoport (Ed.), Selection from the Works of N.I. Vavilov, Vol.1. Nauka,Leningrad, pp. 7–61 (in Russ.).
Vernadsky, V.I. (1987) The Chemical Composition of the Earth and its Surroundings. Nauka,Moscow (in Russ.).
Vinogradov, M.E. (2004) Biological Productivity of Oceanic Ecosystems. Nauka, Moscow(in Russ.).
Zakrutkin, V.E. (1993) On the scale of organic matter accumulation in the Precambrian andPhanerozoic. In: A.Yu. Rozanov (Ed.), Problemy Doantropogennoy Evoliutsii Biosfery.Nauka, Moscow, pp. 202–212 (in Russ.).
Zavarzin, G.A. (2001) Formation of biosphere. Vestnik RAS 71, 988–1001 (in Russ.).Zavarzin, G.A. (2003a) Lectures on Natural Resource Microbiology. Nauka, Moscow
(in Russ.).Zavarzin, G.A. (2003b) The antipode of the noosphere. Vestnik RAS 73, 627–636 (in Russ.).Zhegallo, V.I., Kalandadze, N.N., Kuznetosva, T.V. and Rautian, A.S. (2001) The fate of
megafauna in the Late Anthropogene. In: The Mammoth and its Neighborhood:200 Years of Research. Geos, Moscow, pp. 287–306 (in Russ.).
Zherikhin, V.V. (1986) Biocoenotic regulation of evolution. Paleontol. Zh. 1, 3–12 (in Russ.).
Important Stages of Geosphere and Biosphere Evolution 23

Microbial Biosphere
G. A. Zavarzin
Abstract Evolution of prokaryotic biosphere is considered from the systempoint of view. It starts with the appearance of first organisms, the�3.5 Ga datemakes a border between the observed and imagined biosphere. Prokaryoticcommunity dominated from Archaean to Mesoproterozoic. Prokaryotes makea sustainable community due to the cooperative action of specialized forms.The main route for establishing community is made by trophic links. Structureof the trophic links in prokaryotic community making a trophic network is aninvariant, with secondary adaptive deviations. Material balance is the ultimaterequirement for a long living self-supporting system. The system of biogeo-spheric cycles is dictated by the constancy of biomass composition establishingquantitative ratio between Corg:Norg:Porg. Biospheric processes are driven bythe Corg-cycle. Carbon assimilation is limited by the illuminated moist surfacepopulated by producers, and this means that the Corg-production remainswithin an order of magnitude of 102 Gt/yr. Evolution of the prime producersmakes a stem for evolution of the biospheric–geospheric system but cyanobac-teria integrated as chloroplasts remain to be its driving force. Decomposition oforganic compounds is performed by organotrophic destructors, anaerobicbeing less effective. Destructors determine the residual Corg accumulation.Recalcitrant Corg remaining in the sedimentary record is equilibrated by O2
and other oxidized compounds such as Fe-oxides or sulfates. The geosphericand biotic interactions include both direct and biotically mediated processes;the most important is the weathering–sedimentation pathway. The prokaryoticcommunity makes a sustainable frame into which all other more complex formsof life fit in. That makes the prokaryotic biosphere a permanent essence of thewhole system. New actors might come in and substitute for functional compo-nents only when they fit to the existing system. Evolution of the large system isadditive rather than substitutive. ‘‘All originated from cyano-bacterialcommunity’’ – is the slogan.
G. A. ZavarzinWinogradsky Institute of Microbiology, Russian Academy of Sciences, Moscow, Russiae-mail: [email protected]
N. Dobretsov et al. (eds.), Biosphere Origin and Evolution.� Springer 2008
25
1 Introduction
Coming-into-being of the biosphere begins with appearance of the first
organisms. All preceding events do not fall into the concept of the biosphere.Habitability precedes habitation. The Earth entering the corridor of habit-ability depends from both astronomical and planetary factors (Franck andZavarzin, 2004). This implies the primacy of geospheric conditions. Linkbetween geospheric and biospheric processes is realized by the system of
biogeochemical cycles propulsed by the coupling with the cycle of organiccarbon. The system of biogeochemical cycles was realized by activity ofprokaryotic microorganisms. Development of the biosphere via cyclingmechanisms needs functional diversity of actors and cannot be reduced tothe single common ancestor. Evolution of the biosphere cannot be substituted
for by the evolution of biota.The organic carbon cycle is initiated by the primary producers and could
be quantified in grams of Corg. This is why the evolution of the biospheredepends primarily on the evolution of photoautotrophic organisms, which, inturn, depend on the availability of the Sun light, and to some extent onchemosynthetic microorganisms, which depend on endogenic redox reactionsin the geosphere. Evolution of the biospheric–geospheric system as a whole
can be described as biogeochemical succession, driven by the incompletebalance in the production–destruction cycle and coupled to direct andmediated cycles. Since everything new for its establishment should be installedinto already existing, the subsequent evolution of biota ought to be mountedinto the frames of the prokaryotic biosphere. In this sense the evolution is
additive, not substitutive. Substitution of components occurs inside the func-tional niche within the sustainable system. Since new system is installed intoexisting, old should be retained. The prokaryotic biosphere is a permanentconstituent of the biosphere
The cyanobacterial community represents an entity with almost closedcycles, destructors being responsible for regenerative recycling of biogenicelements. General principles of the functional organization of the biosphere
can be studied on the autonomous microbial communities in extreme envir-onment. That is why it is possible to reveal the functional structure of theprokaryotic biosphere by means of studying extant relict microbial commu-nities in extreme habitats, devoid of non-prokaryotic producers andconsumers.
Practically, this means that interactions in the primitive biosphere can be
studied actualistically with cyano-bacterial mat (Swiss ‘‘Matte’’) as a testsystem, where ‘‘cyano-’’ refers to the main prime producers and ‘‘-bacterial’’ –to the prokaryotic destructors. This system can be described chemically by thetrophic substrate–product interactions.
The prokaryotic biosphere is complete and sustainable, values confirmed byits being a permanent basis of biotic system throughout the geological history.
26 G. A. Zavarzin
Post-prokaryotic evolution of the biosphere has as its prerequisite successional
changes, caused by accumulation of the products due to the incomplete destruc-
tion, the leading is stoichiometric pair Corg of the kerogen and oxygen intro-
duced into the atmosphere, and consumed mainly for the formation of sulfates
and iron oxides.Evolution of biota proceeded within the meta-sustainable biosphere due to
the rising of organisms complexity with limitation of possibilities for their
versatility. The primary photosynthetic unit—cyanobacterium—was integrated
into new entities and reductively transformed into chloroplasts. Subsequent
evolution of prime producers occurred in the frames of cyto-morphological
complication aimed at creation of appropriate physical environment for photo-
synthetic units. Deformation of the entirely prokaryotic biosphere is manifested
by appearance of phagotrophy—nutrition by particles—based on cytology of
protists and than multicellular metazoans like conspicuously symbiotic para-
zoans as spongy or, probably, archaeociates. The next step, zootrophy, repre-
sents variations on the theme ‘‘bowel with gonads’’ based on intestinal
microbiota in a tubular chemostate-like structure.The trophic approach to the evolution of biota unifies the biological and
geological concepts in terms of chemical units. It gives possibility for the
system to approach the Earth’s biosphere, which evolves from its pioneering
state by the coupled interactions in the serial quasistable states. This approach
needs understanding of the system of interlinked events within unity of time
and space rather than their order. The evolution, understood as a sequential
order, does not explain everything as evolutionists claim it. The philosophical
reason for persistent mis-comprehension is concentration on the singular
instead of multiple in the Abendlandische Phylosophie (Heidegger, 1984).
The interaction of bio- and geospheric systems is better understood with
landscape in mind as A. Humboldt suggested it in XIX and V.N. Sukachev
in XX century (biogeocoenosis principle). The aim of this work is not a
comprehensive review with extensive bibliography but an attempt to have a
frame for the system approach based on balances. Quatatis indicate on the
subjects where I have my own experience. Priorities in the study are dictated
by masses of material involved in the processes and turnover rates for
reservoirs.For the geospheric–biospheric system, the functional traits of its components
are of primary importance. As a consequence, the virtual world of ribosomal
phylogeny remains out of scope as well as ‘‘RNA-world.’’ The present-day
‘‘sunflower’’ topology of prokaryotic phylogeny makes it difficult to
represent evolution in old-fashioned ‘‘order’’ (Woese, 2004). Functional
morpho-physiological traits, which are needed for the system analysis, do not
correlate with the phylogenetic position and representatives of various phylo-
genetic lineages might have similar functions. An empirical rule, as I found, is
that trophically interact phylogenetically distantly related organisms, con-
structing a cooperative functional entity.
Microbial Biosphere 27
2 Limits for Actualistic Principle
To what extent the actualistic principle is applicable for the study of EarlyProterozoic and Archaen biosphere? This is the question, which should betaken into consideration each time. The greatest limitation is the composition
of the present day atmosphere and the ocean equilibrated with it. Both ofthem are products of the biosphere. The simplest approach is that theatmosphere was formed by endogenic degazation and transformed by bac-teria and photochemical processes. The bacterial community is particularlyspecialized in transformation of gaseous compounds and its cooperativeaction suffices to the transformation of the chemical composition of theatmosphere except inert gases (Zavarzin, 1984). It can be stated as anempirical evidence that the atmosphere of contemporaneous type was formedby cooperative action of the prokaryotic biota already in existence muchearlier 2 Ga. There was no significant accumulation of oxygen until 2.4 Gaas it is concluded from various geochemical indicators, which does notexclude acting sources of O2, which was scavenging from the atmosphere.That is the approximate date when the actualistic principle could be appliedwith some degree of certainty. Reconstruction of the Archean environment ismore problematic. Did the iron-dominated cycles characterize it? What wasthe form of sulfur?
The history of the biosphere is the history of organic carbon. There is firmevidence that sedimentary organic carbon has biotic origin. Biologicallymediated carbon isotope fractionation persisted over 3.5 if not 3.8 Ga, earlydeviation of 13C/12C ratio in Isua is interpreted as a result of high-temperaturemetamorphism (Schidlowski, 2002). The history of biota remains uninterruptedfrom that time with the autotrophic assimilation of CO2 as the main incomeinto the biogeochemical system. Organic carbon in biomass makes a minordynamic reservoir leading to recalcitrant forms from humus to kerogen anddispersed reduced carbon of sedimentary rocks. Kerogen was balanced byoxygen in the Earth’s system.
The origin of the Archean atmosphere supposes two sources: a remnant ofprimordial atmosphere, as it is indicated by depletion of rare gases from thecosmic ratio, and continuous degazation, as volcanic exhalations indicate it.The source of water remains enigmatic, including supposed transport bycomets. It is assumed that the prebiotic atmosphere was neither reductive, nooxidative with N2, H2O, and some CH4. It should contain also products ofphotochemical reactions. Two main sources of photochemical transformationshould be considered: photochemical reactions of water vapor with productionof hydroxyls and photochemical reactions of methane with possibleproduction of various C-compounds. Could they serve as a source for organo-trophic bacteria? It should be noted that fears about the lethal UV are not inaccordance with presumed high iron content in Achaean water since iron servesas a perfect shield for 220–270 nm UV (Phoenix et al., 2001).
28 G. A. Zavarzin

The traditional view on the early atmosphere is based on CO2- dominatedatmosphere and wollastonit equilibrium CaSiO3 þ CO2 $ CaCO3 þ SiO2 asgeologically most important CO2-sink (e.g. Schwartzman, 1999 and literaturethere). Calcium and magnesium carbonate deposits in conjunction with weath-ering and remnant clay minerals formation provide an evidence for the mainroute of mineral deposits evolution in sedimentary record. Carbonates areobvious reservoirs of the atmospheric CO2 sink produced in an essentiallysubaerial process. The other pathway is subaqueous carbonatization of basalts,which was characteristic for the ancient ocean hydrochemistry (for review seeWestall, 2003). Salinity and sulfate content of the Archaean ocean might bemost different from the recent waters (Melezhik et al., 2005). Carbonates areresponsible for the neutral environment on the Earth’s surface. The geologicalcontext for early life should be based on paleogeographic mosaic, large portionsof protocontinental blocks were actually submerged.
Biota–geosphere feedback was expressed first by the change of the chemicalcomposition of the atmosphere as the small dynamic reservoir with the sub-stitution of O2 for CO2 and transition to oxidative state. Presently it is supposedthat there was methane-rich atmosphere during 2.8–2.6 Ga and at the sameperiod oxygenic photosynthesis evolved. Great oxidation occurred during2.2–2.0 period as it is represented by jatulian deposits in Karelia (Melezhiket al., 1988). BIF formation ceased at 1.8 Ga after their presence since 3.5 Ga.About 1.9 Ga or even earlier eukaryotes appeared with coming to dominancearound 1.2–1 Ga.
3 Relict Microbial Communities
A pragmatic assumption is that the prebiotic atmosphere was like gas streamsfrom volcanoes. However, which kind of volcano? Gaseous emissions fromvolcanoes of border islands like Kuryls and Kamchatka coming to the surfaceare influenced by thermal transformation of overlaying sedimentary depositswith injection of meteoric water and air in gas stream. The composition ofemissions is close to the thermodynamic equilibrium. Submarine vents undergoeven stronger influence of convective exchange with the deep water of themodern sulfate-rich ocean. May be a better example of ancient microbialcommunity is the deep subterranean habitat where water comes into equili-brium with porous rocks. The presence of the prokaryotic life in the hydro-thermal environment is stated for 3.3–3.5 Ga Barberton sediments (Westallet al., 2001). Two types of extant microbial biogeocoenoses are related toendogenous exhalations.
Hydrogenotrophic chemosynthetic microbes represent the first type. Thesemicrobes use H2 produced by reduction of water by superheated iron ofigneous rocks with partial oxidation of iron. An immediate consequence isthat these organisms include hyperthermophiles that develop over the zone of
Microbial Biosphere 29

condensation of the vapor of hydrothermal fluids at approximately 100 8C. Thetrophic problem in H2-rich environment is the access to an oxidant. There aretwo possible oxidants: CO2 and S0, which give trophic niche for methanogenicarchaea by the reaction 4H2 þ CO2 = CH4 þ 2H2O and sulfur reducingsulfidogenic archaea: H2 þ S0 = H2S. A large number of hyperthemophilesof these types were described by group of C. Stteter and other students (forreview see Bonch-Osmolovskaya et al., 2004). Sulfate-reducing Archaeoglobuscould acquire this ability in the sulfate-rich environment of recent hydrotherms.Another possibility is fermentation of organic substances by Desulfurococcus-type organotrophs, which need elimination of excessive H2 by reaction with S0(‘‘S-dependent archaea’’) or simply by the gas stream. At present the source oforganic compounds seems to be boiled biomass transported by convectivestream in shallow-water hydrotherms. The product of incomplete reductionof CO2–carbon monoxide—might be oxidized by water: CO þ H2O = CO2 þH2 by extensively studied now Carboxydothermus, which was the first repre-sentative of a novel group of anaerobic lithotrophic eubacteria (Svetlichnyet al., 1991). Of course, H2 escaping to the surface is oxidized by thermophileswith different growth temperature ranges (Miroshnichenko, 2004). In modernO2- environment H2 can be oxidized by extremely thermophilic ‘‘Knallgasbak-terien’’ likeHydrogenobacter, Calderobacterium, Aquifex and it should be notedthat, phylogenetically, they are among the most deep-branching eubacteria.The question is if ‘‘molecular clock’’ for thermophiles are adjusted to the samepath of time as for other creatures? Below-the-ground biogeocoenosis may beconsidered as the oldest persisting relict, especially in porous space of cratonsbecause of presumably changing composition of the oceanic water. The pro-blem for scaling-up activity of methanogenic and sulfidogenic ancient microbescomes from the need to close biogeochemical cycle by oxidation of CH4 with itsstrong greenhouse effect. Large-scale photochemical production of organiccompounds from CH4 in anoxic atmosphere washed out from the atmospherecould make a source of nutrition for anaerobic microbial community, a possi-bility, which as far as I know, was not yet explored. Excessive H2S does notmake such a problem for the atmosphere since it might be bound by iron,presumably present in the ancient ocean; however no geological evidences forsuch type of ancient sedimentary iron sulfide depositions are reported—ironremains as oxides. Studies of microbiota from deep drills to about 3 km untilnow gave the same types of microbes, which are known from volcanoic regionsand thermal vents (Bonch-Osmolovskaya et al., 2004). If estimation of subter-ranean microbiota in 1030 organisms (Whitman et al., 1998) is correct, then wecan assume that life did not develop numerically.
Oxidized iron, remaining from H2O reduction, might be reduced to magne-tite by thermophilic iron-reducing bacteria (FeRB) (Slobodkin et al., 1995) orto siderite. Magnetite is formed by thermophiles under high pCO2, excess ofFe(OH)3, and the absence of organic colloids, while siderite is formed underhigh pCO2, limited iron hydroxide, the presence of utilizable organic com-pounds (Zavarzina, 2004). The iron cycle driven by geochemical reactions at
30 G. A. Zavarzin

high temperatures seems to be the key process for Archean–Early Proterozoic.
Is it possible to consider the period before accumulation of sulfate in the ocean
and sulfate reducers as a period of biospheric ‘‘iron cycle’’? Iron cycle catalyzed
by long known oxidative ‘‘iron bacteria’’ and reductive ferric reducers compre-
hensively studied by D. Lovley represents a possibility for microbial life in the
Archean–Early Proterozoic. Anaerobic production of Fe(III) by phototrophs,
which is known both for cyanobacteria and anoxygenic non-sulfur bacteria,
could serve as an oxidant (Widdel, 1993). Banded Iron Formations (BIFs) make
an existing evidence for the possibility of such hypothetical cycle. The iron cycle
is compatible neither to sulfur cycle nor to the present type oxygen cycle.
Phototrophic microbial actors for all three possibilities, that is Fe, S, O are in
hands. Even patches of appropriate extant communities are found somewhere.
To what extent these possibilities of anoxygenic prime producers are consistent
to Archaen–Paleoproterozoic d13C � –25% kerogen accumulation record?Another type of hydrothermal environment on the Earth’s surface leads us
to the stem of biospheric evolution. Low temperature, approximately less than
658C, hydrotherms characterized by CO2 stream (‘‘mophetes’’) are inhabited by
moderately thermophilic cyanobacterial communities dominated by mat-form-
ing cyanobacteria likeMastigocladus laminosus andPhormidium laminosum, the
species epithet indicates the structure of community. Studied by Brock (1986)
group in Yellowstone and by our group in Kamchatka and Kuryls (Zavarzin
et al., 1989) indicate that thermophilic cyanobacterial communities seem to be
trophically complete with closed cycles. In addition to cyanobacterial prime
producers they include various thermophilic organotrophs, which comprise
trophic chains leading to methanogens and sulfate reducers. In methanogenic
trophic chain thermophilic acetogens and acetoclastic methanogens as
Metanosaeta (formerly Methanothrix) thermoacetophila are present. However,
thermophilic methanotrophs are remarkably absent here, biogenic oxidation of
methane starts at lower temperature. The sulfur cycle is initiated by thermo-
philic sulfate reducing Thermodesulfobacterium, which represents a separate
phylogenetic lineage, but functionally is equivalent to conventional desulfovi-
bria. Oxidation of H2S is mediated by various thionic bacteria with spectacular
streamers of Thermothrix capable of oxidizing H2S into S0 aerobically and of
reducing sulfur in anaerobic conditions. Excessive sulfur is oxidized outside the
cyanobacterial community by extremely acidophilic aerobic microbial associa-
tions, which are the main producers of sulfuric acid and initiate geochemical
events resulting in rock-leaching by sulfuric acid and acid iron-bearing streams
ending with limonite deposition. Highly acidophilic microbial communities that
include both thermophilic archaea and/or mesophilic eubacteria are most
characteristic for the thermal fields marked by snow-white clays in place of
weathered lava rocks. Aerobic sulfur oxidizers are mighty producers of sulfuric
acid. However, it should be left outside the present discussion since these
communities are oxygen dependent. In anoxic environment anaerobic produc-
tion of sulfates is performed by phototrophic sulfur bacteria (see Gorlenko,
Microbial Biosphere 31

here) and it is tempting to imagine ‘‘purple palaeoocean.’’ Sulfur dependentphototrophs are absent at elevated temperature.
The thermophilic cyano-bacterial community that develops in CO2
dominated mophetes represents an actualistic example of how gaseous exhala-tions were transformed into modern type atmosphere. The photosynthesizingcyanobacterial community, studied both in situ or in vitro, exposed under thelight to volcanic exhalations or their imitates in the laboratory transformscomposition of gases into air-like mixture with about 25% of O2 , which isthe upper limit. Remarkably, methane behaves here as an inert gas—it is notoxidized by the community (Gerasimenko and Zavarzin, 1982). The question isscaling up of the process: cyanobacterial communities in hydrotherms on theday-surface represent local sites. Is it possible to extend the application ofresults to the ancient Earth’s surface? Landscape of what kind and extensionis needed for such extrapolation?
3.1 Formation of Landscape in Prokaryotic Biosphere
Let us define landscape as an entity of biota and geographic environment, largeenough to consider it as uniform. Landscapes are classified hierarchically fromlarge climatic and orographic zones to small elementary habitats. The Earth’ssurface never was as uniform as well-mixed atmosphere, even ocean with itsbays and border seas can be considered as more uniform in comparison to theterrestrial environment. There was always a mosaic of environments during thehistory of Earth’s surface. Generalist gross approach of homogenic environ-ment on Earth during certain period of geological time is entirely unacceptablefor microbiologist whose objects live in microhabitats, and some landscapescould serve as refugia even for ‘‘Snow-ball’’ events. The reason is that microbesare easily disseminated by wind in aerosols including non-habitable surfaceslike Antarctic, which makes the statement doubtful that biosphere is every-where where life forms are found. The biosphere is where microbes are activelyinvolved in the geochemical processes. Microbes have a short life cycle and thatmakes adaptive dynamics with the change of species, not adaptation, the mainmechanism for formation of microbiogeocoenoses. Landscapes, which couldhave global influence, should have large enough moist Sun-illuminated surfacefor accommodation of chlorophyll containing photoautotrophic prime produ-cers. Since assimilation of CO2 is proportional to the active chlorophyll and wetsurface was approximately the same during the Earth’s history it is realistic toaccept the present annual production of 1018 grams Corg as approximatelyconstant value within the order of magnitude for the biosphere of modern type.
Ocean of course represents the largest wet surface. At present it producesabout a half of primary production. For the prokaryotic biosphere, cyanobac-terial picoplankton is of primary importance. Quantitatively, it delivers aquarter of present annual global Corg production. Was ocean a cradle of life?
32 G. A. Zavarzin

There are certain limitations in discussing the role of the Archaean ocean as acontinuous body of water since our understanding of its chemistry and geo-graphy is most illusive. Of course it worked as a sink for deposits, its surface wasin dynamic equilibrium with the atmosphere, and most probably its bottomrepresented the main route for volcanic degazation. However, the ocean is toolarge for being a cradle. Life could not be concentrated there. The distances,except for veils in stagnant zones, limit interactions between organisms.Another drawback of the microbial evolution in the ocean is the permanencyof physical and chemical conditions: there is no need to change and adaptationfacilities are oriented to restrictive evolution. Nevertheless the presumed role ofancient cyanobacterial picoplankton as the possible source of oxygen seems tobe undisputable. It is the source large enough for oxidation of iron in BandedIron Formations and it is able to produce enough Corg to reduce part of it intomagnetite by anaerobic dissimilatory iron reducers. At least two known limita-tions for cyanobacterial picoplankton of nowadays were absent: limitation byiron and limitation by filtrating zooplankton which keeps the concentrationlevel below 105 cells/ml, but cyanophagy with threshold about 104 could exist.The presence of this type of cyanobacteria is not yet proved by paleontology. Itwould be quite difficult to identify minute 0.5–0.8 � 0.7–1.6 �m2 coccoid cellsof Prochlorococcus morphotype as microfossils of cyanobacteria. In this casethe time gap between BIF and first undisputable trichomic cyanobacteria(Sergeev, 2006; Sergeev et al., 2002) as O2-producers might be illusive. Is itpossible to consider nannoplankters in the limited by biogens contemporary‘‘blue ocean’’ as remnants of an ancient community?
Amphibial landscapes look most promising as a cradle for microbiota.Exchange between the gaseous, water, and solid phases occurs here most easily.These landscapes with shallow water of marine or lacustrine origin usuallyrepresent concentration of life with strong aerobic–anaerobic interaction.They are densely populated by diverse microbiota. This facilitates trophicinteraction between microorganisms. Such landscapes are unstable and pro-mote diversification and adaptive changes both for subaqual and subaerialdevelopment. Shallow deposits of continental slope contains spectacularevidences of the ancient microbial life.
Terrestrial plains of humid climatic zones, which are now occupied bymeadows and forests, seem to be an appropriate environment for cyanobacter-ial mats. Nowadays there are only patches ofmats in ephemeral bodies of water,puddles on the ground. These sites are immediately occupied by oscillatoriancyanobacteria. Nostocacean dominates in a drier climate. Production of Corg bysoil cyanobacteria is highly variable but considerable. This is an indication tothe possibility of the ancient subaerial terrestrial life, which is not as yetsupported by the data from paleontologists or geologists. The crucial pointfor these habitats is the formation of water proof bottom under the mat eitherby calmatation from allochtonous deposits or, that is much more promising, bymicrobially mediated transformation of lithogenic minerals into clays withsmectites as the most suitable ground material.
Microbial Biosphere 33
It brings us to the most crucial problem of weathering in Proterozoic. Since itwas stated by Retallack (1990) and confirmed by many other observations,Precambrian soil profiles are considered to be much the same as at present. InRussian usage since pioneering works of B.B. Polynov the term humified soilsensu stricto differs from mineral ‘‘weathered rock’’ while English usage is soilsensu lato. The mechanism of chemical weathering includes substitution formetals in initial minerals by protons retaining Si-Al backbone stabilized in clayminerals. Acid in question is mainly carbonic acid and the process representsthe main sink for CO2 with carbonates as the synthesized end product and claysin the rest. Weathering was reviewed with emphasis on kinetics at high tem-perature and it was stated that this process is too slow at mild temperatures (seeSchwartzman, 1999). Additional kinetic factor is needed. Formation of claysoccurs very rapidly on thermal fields not only in the streams of hydrothermalsteam but mainly due to the intervention of acid-forming bacteria at mildtemperatures (Karpov et al. 1984). Cations are transported in the humid climatezone to the sea by run-off or accumulated in the depositional basins of endor-heic arid regions. In this case soda lakes are formed.
To my understanding, scavenging of CO2 from the atmosphere is essentiallysubaerial process, while endogenic generation of CO2 most probably occursmainly via deep-sea subaqual degazation. If so, the ocean was netto-source ofatmospheric CO2, while moist terrestrial subaerial surface represented netto-sink. In this case soda lakes of endorheic regions and its biota are relevant to theglobal scavenging of atmospheric CO2.
There are two main problems for weathering at mild temperatures. The firstis the concentration of carbon, which takes place during autotrophic assimila-tion and is followed by the release of CO2 locally in the sites of decomposition ofdead biomass (‘‘mortmass’’). Organic acids might be produced as additionalstrong leaching agent. Decomposition of organic matter makes the mainmechanism of leaching. Another problem is transformation of inert CO2 intocarbonic acid as a leaching species. The chemical process is drastically enhancedby enzyme carbonic anhydrase (CA): CO2þH2O þ CA$ [CO2–CA–H2O]$HCO3
–þHþ þCA, which is universally present in living cells to transport CO2
in and out of the cells. The only report on extracellular CA known to me is itslocation in glycocalix of halophilic Microcoleus (Kuprriianova et al., 2004).
The illuminated wet surface indicates shallowwater bodies as preferable sitesfor cyanobacterial community.What does shallowmean? Limited by the photiczone? Being more restricted, let us define such an area as an amphibial land-scape, where the solid and liquid phases are in approximate ratio 1:5 and aneasy exchange with the atmosphere is available. Two types of amphibiallandscapes come immediately into mind: marine or thalassic and terrestrial orathalassic. As examples of the thalassic type lagoons, tidal flats, sabkhas,marshes, German ‘‘Watte’’ of different kinds with spectacular microbial‘‘Farbstreifbandsandwatt’’ can be mentioned. For athalassic types ombro-trophic bogs as autonomous, and swamps as subordinate type, lakes and drylakes as accumulating sites, takyrs on peneplaine come into mind. All of them
34 G. A. Zavarzin

are quite diverse. Thalassic amphibial landscapes are particularly important forepicontinental seas that developed in thalassocratic epochs on the passivemargin of continents. Epicontinental (epeiric) seas are the beloved sites forboth paleontologists and sedimentologists. Geochemically, marine and terres-trial landscapes differ in domination of chlorine in marine environment(‘‘halite-ocean’’) and bicarbonate in terrestrial waters (‘‘soda continent’’).Transport of aerosols, which is important for terrestrial environment, is usuallyforgotten. Alkaliphilic microbial community of soda lakes was studied in detailand its trophic system is now being described (Zavarzin, 1993 Zavarzin, 2006,Alkaliphilic microbial communities, 2007).
The landscape is a receptacle for both microbiota and products of microbialactivity. The landscape is changed under the influence of microbiota. Thevisible landscape extends for microbiota by an invisible landscape of intersti-cional porous waters and mineral surfaces. Due to SEM studies it is clear nowthat all surfaces are covered by biofilms (see Fossil and Recent Biofilms, 2004).The problem is to establish to what extent biofilms are causative agents ofparticular geochemical transformations. The surface of minerals is covered byorgano-mineral cutanae originating from the soil solution. Pedogenic mineralsare transformed accordingly to the thermodynamic equilibrium withmicrobially modified soil solution, both by dissolution and by precipitation.Interaction of microbes with the solid surface, including direct or mediatedcatabolic processes, still remains an obscure field. Microbes, as iron-oxidizers,for example, at the first step produce disperse amorphous insolublecompounds, ferrihydrite in this case, which is stabilized during early diagenesisinto magnetite or siderite in the order of dynamic of crystallization (Zavarzina,2004). In the colloid environment electrostatic interactions dominate. Coagula-tion of mineral colloids is an important process not only for purification ofpotable water in water supply systems but also as a large-scale natural process,designated as A. Lysitcin’s ‘‘marginal filter.’’
Texture of deposits is modified due to the colloid matrix formed bymicrobes,and biofilms lead to multilayered laminated structure as in stromatolites. Theprocess can be simulated in the laboratory when cyanobacterial film developson sediments. When new portion of sediment covers the surface, part ofcyanobacteria (hormogonia) move to the surface. As an exotic example ofsuch a process, diurnal layers of Phormidium laminosum in thermal spring inUzon, Kamchatka with layers of colloid sulfur can be observed. In a large scalethe same process takes place with carbonate precipitates in evaporative envir-onment. For alkaliphilic communities of Central Asia and halophilic commu-nities of marine-dependent Satonda lake, the role of glycocalix in carbonatelamination and deposition was argued by Arp (1999).
Formation of landscape on macrolevel is illustrated by the well-knownformation of stromatolites. It includes the formation of reefs as biogerms inhydrodynamically active outer slope, the formation of lagoons and tidal flatsleading to carbonate platforms as described by Grotzinger (1989). The outerline of biogerms protects the shallow plane from hydrodynamic impacts.
Microbial Biosphere 35

Cyanobacteria develop here in hard ground, protected by mineral crust frommechanical stresses as opposed to the soft ground (Sergeev, 2006). It is impor-tant to interpret this total event as an evaporative process: carbonate depositsare formed as evaporites on the shallow or dry surface due to degazation of CO2
from bicarbonate solution and rising concentration of dissolved solids to thebeginning of carbonates precipitation (more than 10-fold concentration oversaturation index).
For microbiologist this means that a moderately halophilic communityshould dominate the habitat. The halophilic community is not an exoticassemblage of extremophiles but a component of the evaporative environmentwhere chemical sedimentogenesis occurs. Diagenesis in the sites of chemicalsedimentation involves a halophilic microbial community, moderately halophi-lic for the early stages of precipitation and extremely halophilic for formation ofevaporites. This community differs both from marine and freshwater commu-nities. Nowadays Microcoleus chthonoplastes mats dominate most of thesehaline environments. A new biofilm up to 2 mm thick develops on the layersof older and dead cells as a kind of multilayered cyano-bacterial ‘‘peat.’’ Sites ofchemical sedimentation and cementation might serve for burial of allochtonousmicrobiota, brought in both by water currents and by wind. These dispersedremnants differ from aborigenal biophilms formed by halophilic microorgan-isms. A large renewed reservoir for chemical precipitation obviously should bebelow the precipitation point.
Stromatolites correlate with dolomite and magnesite formation epochs.Their formation occurred within carbonate provinces, being restricted by thephotic zone. It was supposed that the decline of stromatolites after 2 Ga on theFennoscandian shield occurred due to transformation of the landscape withnumerous shallow-water lakes saturated with Ca and Mg carbonates as terres-trial basins, devoid from sulfates, to a deep-water sea during ‘‘oceanization’’ ofthe region (Melezhik et al., 1997, 2001), but now formation of sulfates, eitherlocal or marine, is recognized. The high productivity, which is known for inlandbodies of water with high mineral content, coupled to the partial suppression ofdecomposition due to the limitation in closing sulfur cycle could be the causeof carbon-rich shungite formation.
There is an old idea that carbonates are deposited by the photoautotrophicactivity due to the rise of pH. In this case the ratio Corg:Ccarb� 1:1 should be asfor corals and Halimeda lime formation. However, in our experiments withalkaliphilic cyanobacteriaMicrocoleus it was found that living photosynthesiz-ing bacteria do not precipitate carbonates even under chemically favorableconditions of pH. By contrast, the mineral deposits encrust rapidly the deadbacteria turning the sheaths into microfossils, ‘‘sarcophagus.’’ This observationexcludes photosynthesis as the driving force of lithification in the caseunder study but makes an emphasis on the role of glycocalix as the site fornucleation. This is in accordance with the observations in situ by Arp (1999).The reason for the difference between functions of glycocalixes in living anddead cyanobacteria might be the presence of CA in the former, since CA serves
36 G. A. Zavarzin

as bicarbonate ion producing mechanism (Kuprriianova et al., 2004), prevent-ing carbonatization. On the other hand, production of CO2 from bicarbonatestimulates formation of carbonate-ion needed for Ca precipitation. A possiblerole of CO2 volatilization in warm water should be considered.
3.2 Trophic Structure of Cyano-bacterial Community
Cyano-bacterial communities are the most persistent components of the mod-ern type biosphere. Persistence is guarantied by almost closed cycles of biogenicelements. Light makes an ultimate energy source; for early stages of biosphereevolution the lower Sun luminosity and different spectral transparency of theatmosphere should be considered. Volatile compounds such as CO2 areconsumed from the atmosphere. Waste compounds such as O2 and mineralsformed in biotically mediated reactions—the list should be specially consideredby geologists since it includes not only typomorphic minerals as Ca and Mgcarbonates, iron and manganese oxides but also clays—make the driving forcefor the geochemical succession in sedimentary record. The autonomous com-munity has approximately closed cycles of productive and destructive branches;the latter is sometimes called ‘‘regenerative cycle.’’
The trophic structure follows the Winogradsky’s rule: each naturalcompound has its specific microbial consumer. If chemical compounds arelisted in one column, then in another column corresponding consumers shouldbe listed. Producers have constant composition of biomass with the atomic ratioclose to Corg:Norg:Porg � 106:16:1 and approximately the same bulk composi-tion of aminoacids, nucleotides, lipids, carbohydrates. The difference is mainlyin storage compounds and structural components. The chemical diversity,which makes a ground for chemotaxonomy, deals mainly with minor com-pounds and is out of scope in our gross scale. Similarity in chemical composi-tion leads to involvement of similar trophic groups of destructors, which havetheir trivial designations according to the substrates consumed and productsformed. The system is complete. Philosophical generalization formulated byWinogradsky was that ‘‘the circle of Life’’ represents ‘‘one huge organism.’’
The trivial functional classification of bacteria, elaborated in its general linesat the end of XIX century by Winogradsky, Beijerinck and their followers, iswhat is needed for practical use in natural sciences. There are groups likephotoautotrophs divided into conventional oxygenic and microbial anoxy-genic, proteolytic and saccharolytic, aerobic and fermentering decomposers,anaerobic methanogens and sulfidogens. That makes their firm knowledgeneeded to each natural scientist. Detalization leads to the number of otherfunctional groups, which make the basis of general microbiology. The func-tional trophic structure is much the same for different microbial communities inspite of diversity of their habitats. It gives a possibility to predict organismsfrom missing links in the graph of trophic network. The trophic structure may
Microbial Biosphere 37

be treated as a systemic invariable throughout the history of the biosphere.Each of these functional groups contains a lot of representatives adjusted tospecial habitat. Bacteriologists know more than 2� 104 molecular clones (ribo-types) from which less than 6000 species are validated. Diversity of knownmicroorganisms started to expand extremely fast when molecular methodscame into wide use with description of taxa by the methods ofdiscrete mathematics. Cladistic tree graph nowadays does not represent anyacceptable topology for the microbial diversity, which is presented now forprokaryotes by a set of multiple radiating phila (Woese, 2004). My old under-standing is that the microbial diversity is best represented by combinatorialmatrix (Zavarzin, 1974).
The functional trophic structure for different microbial communities isorganized toward the universal lines. The general scheme of trophic networkin prokaryotic community includes groups of prime producers, aerobic hydro-lytics and dissipotrophs (organisms utilizing low molecular weight compoundsdissipating from the places of origin), anaerobic microorganisms starting withparticulated organic matter (POC) sinking through oxicline created by deple-tion of O2 by aerobes. The anaerobic pathway is started by hydrolytics, whichdecompose insoluble cell wall constituents, fermentative dissipotrophs likespirochaete, syntrophic associations decomposing non-fermentable fatty acidsin conjunction with hydrogen-scavenging lithotrophs, represented by sulfatereducing bacteria (SRB) or methanogens. The cycle is closed by aerobic gas-consuming methanotrophs and sulfide-oxidizing bacteria, which protect theiranaerobic benefactress from oxygen. As a variant, the trophic loop is closed byanaerobic anoxygenic phototrophic bacteria, responsible for purple layers onthe illuminated surfaces. Their development is most pronounced inmineral-richwater and even in brines. The trophic network is spatially organized in benthiccyano-bacterial mats with their regular structure of similar architecture. Theupper layer up to 2 mm is occupied by cyanobacteria, followed by white sulfuroxidizers, below are purples, and in the bottom is black mud with sulfidogens.The structure is repetitive due to the burial. It was studied in hypersalinelagoons andmany times reviewed (Microbial mats, 1989, 1994; Biostabilizationof sediments, 1994; Fossil and recent biofilms, 2003). Mat is considered as thepredecessor of stromatolites, which represent a large-scale geological evidencefor domination of these type of cyano-bacterial communities duringProterozoic.
Of special interest is the same structure of mats in soda lakes, which representan extreme case of the terrestrial athalassic environment (Gerasimenko andOrleanski, 2004; Arp, 1999). This biocoenosis has come to attention onlyrecently and representatives of many functional groups have been isolatedand described during last decade (for review: Alkaliphilic microbial commu-nities, 2007). Most of the isolated alkaliphilic bacteria belong to new genera(Zavarzin et al., 1999; Zavarzin and Zhilina, 2000). Since soda lakes are theend basins they may be considered as some kind of natural lysimetrs forwatershed and weathering thereof in continental environment. Architecture of
38 G. A. Zavarzin

cyano-bacterial mats follows the principle of construction of phototrophiccommunity on solid surface which could be traced up to the moss cover as inSphagnum-bog with 5 cm of green layer, 5–10 cm of decomposing ‘‘white moss’’and peat below. Young offspring’s grow on dead bodies of the parents. Thisstyle of architecture ceases with vascular plants cover, which ‘‘switch in’’ theevapotranspiration and principally changes the atmospheric hydrological cycleon the terrestrial surfaces.
More important is the fact that cyano-bacterial community is autonomousthat leads to its persistence on the Earth. It is the most persistent biocoenosis onthe Earth’s surface. Chemical cycles of essential elements are closed within thecommunity. The cyano-bacterial community is sufficient to catalyze all biogeo-chemical cycles (Zavarzin, 2003a,b). One exception should be taken inmind: thecyano-bacterial community works as a sink for phosphorus when it is respon-sible for the formation of phosphorite deposits. Anaerobic remobilization ofphosphates seems to be not sufficient to close the phosphorus cycle (for over-view see: Keasling et al., 2000). The cyano-bacterial community is sustainable asa complete system.
The role of biotically mediated reactions in the prokaryotic biosphere is stillunclear. There are only examples of microbial participation in diagenetic pro-cesses, guesses about weathering but no full-scale picture, which needs moregeological and geochemical knowledge on early Corg-cycle. The pendulum ofinterpretation of stromatolites as organo-sedimentary structures based oncyano-bacterial activity swing up to the interpretation of formation of laminaebased mainly on inorganic evaporative precipitation followed by rapid coloni-zation of the surface by biofilms responsible for the texture of the rock.Formation of dolostones and magnesite deposits, which correlate with high13C-content carbonates, are ascribed to playa evaporative environment of highbioproductivity. The most important fact is the pronounced negative correla-tion between Corg-poor carbonates depositions with Fe(III) as indicator ofoxidative status and rich Corg deposits of fine sediments in anaerobic highlyproductive non-marine basins (Melezhik et al., 1988, 2001). Let us keep inmind:spatially separated from photosynthetic production anaerobic decompositionprocesses, which became to be responsible for netto-oxidative state of the entiregeochemical system, favor misbalance of O2/Corg. Paradoxically anaerobescreated oxidative state due to the incomplete oxidation and accumulation ofreduced carbon. What was the role of microbially mediated processes trans-forming the chemical environment?
The skeleton-forming ability came into action beginning from the appear-ance of Protists. With the development of radiolarians, diatoms, spongy Sibecame involved in the biological cycle and became a limiting element in theocean; Sr is used by acantharians. But the main change is in Ca-recycle, whichcame totally under the biotic control in the skeleton forming CaCO3 ability andbiotically mediated dissolution during weathering in the biosphere.
As a result of completeness of biogeochemical cycles in the prokaryoticbiosphere all subsequent evolution of biota is submerged into the essential
Microbial Biosphere 39
trophic structure created by prokaryotes. Sustainable development retains whathas been created before. Everything new can survive if it fits to the old, alreadyexisting. The evolution of biota is rather additive than substituitive at least inthe functional aspect. That gives a general explanation why primitive, I shouldprefer to use word ‘‘pioneer,’’ organisms remain and proliferate in spite ofgrowing biodiversity of seemingly fittest more complex organisms. The line ofpartial substitution of prime producers from cyanobacteria by protists, bymulticellular algae, by mosses, by vascular plants makes the backbone for theevolution of biota and to lesser extent to the geochemistry of the biosphere dueto the full-scale Corg production in each moment. In feedbacks it gives newpossibilities to microbes mainly in regenerative cycles. As a slogan we can state:‘‘we all came from the cyanobacterial community.’’
References
Alkaliphilic Microbial Communities (2007) Trudy Winogradsky Institute of microbiology,vol. 14 (Russ.).
Arp, G. (1999) Calcification of non-marine cyanobacterial biofilms (USA, PR China, Indo-nesia, Germany)—Implications for the interpretaion of fossil microbialites. DissertationGottingen, 1999 (delivered by the courtesy of the author).
Arp, G., Reimer, A. and Reitner, J. (1999) Calcification in cyanobacterial biofilms of alkalinesalt lakes. Eur. J. Phycol. 34, 393–403.
Bonch-Osmolovskaya, E.A., Miroshnichenko, M.L., Sokolova, T.G. and Slobodkin, A.I.(2004) Thermophilic microbial communities: new physiological groups, new habitats.Proceedings of Winogradsky Inst. Microbiol., Moscow, Nauka Publ., vol. 12, pp. 29–40(Russ.).
Brock, T.D. (1986) Thermophiles. General, molecular, and appliedmicrobiology.Wiley, NewYork, 316 p.
Ehrenreich, A. and Widdel, F. (1994) Phototrophic oxidation of ferrous minerals—a newaspect in the redox microbiology of iron pp. 393–402. Microbial mats: structure, develop-ment and environmental significance. In: L.J. and P. Caumette (Eds), Springer-Verlag,Berlin, NATO ASI Ser., v. G., vol. 35.
Fossil andRecent Biofilms. (2003)A natural history of life onEarth. In:W.E.Krumbein,D.M.Paterson and G.A. Zavarzin (Eds), Kluwer Ac. Press, Dordrecht, 482 pp.
Franck, S.A. and Zavarzin, G.A. (2003) What are the necessary conditions for origin of lifeand subsequent planetary life-support systems? In: H.J. Schellenhuber, P.J. Crutzen, W.C.Clark, M. Claussen and H. Held (Eds), Dahlem Konferenzien 91. Earth System Analysisfor Sustainability. MIT Press, Cambridge Massachusetts, London UK, pp. 74–90.
Gerasimenko, L.M. and Orleansky, V.K. (2004) Actualistic paleontology of cyanobacteria.Proceedings of Winogradsky Inst. Microbio., Moscow, Nauka Publ. vol. 12, pp. 80–108,(Russ.).
Gerasimenko, L.M. and Zavarzin, G.A. (1982) Metabolism of H2, CO2, O2, CH4 in cyano-bacterial communities. Microbiologia 51, 718–722 (Russ.).
Grotzinger, J.P. (1989), Facies and evolution of Precambrian carbonate depositional sys-tems: Emergence of the modern platform archetype. In: P. Crevello, R. Sarg, J.F. Readand J.L. Wilson (Eds), Controls on Carbonate Platform and Basin Development: SEPMSpecial Publications, no. 44, pp. 79–104.
Heidegger, M. (1984) Was heißt Denken? Vorlesung Wintersemestr 1951/52. Philipp Reclamjun. Stuttgart, 80 p.
40 G. A. Zavarzin

Karpov, G.A., Eroschev-Shakh, V.A. and Zavarzin, G.A. (1984) Role of biogenic factor information of environment for the zone of argillization in the contemporary hydrothermalsystems and solfataric fields. Volcanol. Seismol. 2, 64–74.
Keasling, J.D., van Dien, S.J., Trelstaad, P., Renninger, N. and McMahon, K. (2000)Application of polyphosphate metabolism to environmental and biotechnological pro-blems. Biokhimia 65, 394–404 (and other papers in this special issue).
Knoll, A.H. Life on a young planet. The first three Billion years of evolution on earth 2003Princton Univ. Press, 277p.
Kuprriianova, E.V., Markelova, A.G., Lebedeva, N.V., Gerasimenko, L.M., Zavarzin, G.A.and Pronina, N.A. (2004) Carbonic anhydrase of the alkaliphilic cyanobacterium Micro-coleus chthonoplastes. Microbiology 73, 307–311.
Melezhik, V.A., Basalaev, A.A., Predovsky, A.A. et al. (1988) Carbanaceous deposits of earlystages of the Earth’s evolution (Geochemistry and conditions of accumulation on theBaltic shield) Leningrad, ‘‘Nauka,’’ 200 p. (Russ.).
Melezhik, V.A., Fallick, A.E., Makarikhin, V.V. and Lyubtsov, V.V. (1997) Links betweenPaleoproterozoic paleogeography and rise and decline of stromatolites: FennoscandianShield. Precambrian Res., 82, 311–348.
Melezhik, V.A., Fallick, A.E., Medvedev, P.V. and Makarikhin, V.V. (2001) Paleoproter-ozoic magnesite: lithological and isotopic evidence for playa/sabkha environments. Sedi-mentology 48, 379–397.
Melezhik, V.A., Fallick, A.E., Rychanchick, D.V. and Kuznetzov, A.B. (2005) Paleoproter-ozoic evaporites in Fennoscandia: implications foe seawater sulphate, the raise of atmo-spheric oxygen and local amplification of the d13C excurse/Terra Nova 17, 141–148.
Microbial Mats (1989) Physiological ecology of benthic microbial communities. Y. Cohenand E. Rosenberg (Eds), ASM, Washington, DC, 494 p.
Microbial Mats (1994) Structure, development and environmental significance. In: L.J. Staland P. Caumette (Eds), NATO ASI ser., v.G Ecological sciences. Springer-Verlag, Berlin,vol. 35, pp. 443–452, 463 p.
Miroshnichenko,M.L. (2004) Thermophilic microbial communities of deep-sea hydrotherms.Rev. Microbiol. 73, 5–18.
Phoenix, V.R., Konhauser, K.O., Adams, D.G. and Botrell, S.H. (2001) Role of biominer-alzation as an ultraviolet shield: implications for Achaean life. Geology 29(9), 823–826.
Retallack, G.J. (1990) Soils of the Past: An Introduction to Paleopedology. Unwyn Hyman,Boston.
Schidlowski, M. (2002) Sedimentary carbon isotope archives as recorders of early life:implications for extraterrestrial scenarios. In: G. Palyi, C. Zucchi and L. Caglioti (Eds),Fundamentals of Life, Elsevier, pp. 308–329.
Schwartzman, D.W. (1999) Life, temperature, and the Earth: the self-organizing biosphere.Columbia University Press, New York, 241 p.
Sergeev, V.N. (2006) Precambrian Microfossils in cherts: their paleobiology, classificationand biostratigraphic usefulness. Transactions of the Geological institute, vol. 567,Moscow GEOS, 280 p.
Sergeev, V.N., Gerasimenko, L.M. and Zavarzin, G.A. (2002) Proterozoic history and presentstate of cyanobacteria. Mikrobiologia 71(6), 725–740.
Slobodkin, A.I., Eroschew-Shakh, V.A., Kostrikina, N.A., Lavrushin, V. Yu., Dayniak, L.G.and Zavarzin, G.A. (1995) Formation of magnetite by thermophilic anaerobic microor-ganisms. Dokladi AN SSSR 345, 694–697 (Russ.).
Svetlichny, V.A., Sokolova, T.G., Gerchardt, M., Ringpfeil, M., Kostrikina, N.A. andZavarzin, G.A. (1991) Carboxydothermus hydrogenoformans gen.nov., sp.nov. a newCO-utilizing thermophilic anaerobic bacterium from hydrothermal environments ofKunashir Island. System. Appl. Microbiol. 14, 254–260.
Westall, F. (2003) The geological context for the origin of life and themineral signatures of fossillife. In: B. Bachier et al. (Eds), The Traces of Life and the Origin of Life. Springer-Verlag, .
Microbial Biosphere 41
Westall, F., de Witt, M.J., de Ronde, J. and Gerneke, D. (2001) Early Archean fossil bacteriaand biofilms in hydrothermally-influenced sediments from the Barberton greenstone belt,South Africa. Precambrian Res. 106, 93–116.
Whitman, W.D., Coleman, D.C. and Wiebe, W.J. (1998) Prokaryotes: the unseen majority.PNAS 95(12), 6578–6583.
Widdel, F. (1993) In: L.C. Stal and P. Caumette (Eds), NATO ASI ser.G Ecological sciences.Springer-Verlag, Berlin, vol. 35, 463 p.
Woese, C.R. (2004) A new biology for a new century. Microbiol. Mol. Biol. Rev. 68(2),173–186.
Zavarzina, D.G. (2004) Formation ofmagnetite and siderite by thermophilic Fe(III)-reducingbacteria. Paleontol. J. 38(6), 585–589.
Zavarzin, G.A. (1974) Phenotypic systematics of bacteria: the space of logic possibilities.Nauka, Moscow, 143 pp.
Zavarzin, G.A. (1984) Bacteria and the composition of the atmosphere. Nauka, Moscow,192 p. (Russ.).
Zavarzin, G.A. (1993) Epicontinental soda lakes as supposed relict biotopes for the formationof terrestrial biota. Microbiologia 62(5), 789–800.
Zavarzin, G.A. (2003a) Diversity of cyanobacterial mats. In: W.E. Krumbein, D.M. Patersonand G.A.Zavarzin (Eds), Fossil and Recent Biofilms. A Natural History of Life on Earth.Kluver Academic Publishers, Dordrecht, pp. 141–150.
Zavarzin, G.A. (2003b) Coming-into-being of the system of biogeochemical cycles. Paleon-tological J. 6, 16–24.
Zavarzin, G.A. (2003c) Lectures in environmental microbiology. Nauka, Moscow, 348p. (Russ.).
Zavarzin, G.A. (2006) Alkaliphilic microbial community as an analog of terrestrial biota inProterozoic. In: Evolution of the Biosphere and Biodiversity. KMK-Press, Moscow,pp. 97–120 (Russ.).
Zavarzin, G.A. and Zhilina, T.N. (2000) Anaerobic chemotrophic alkaliphiles. In:J. Seckbach (Ed.) Journey to Diverse Microbial Worlds, Kluwer Academic Publishers.The Netherlands, pp. 191–208.
Zavarzin, G.A., Gerasimenko, L.M. and Zhilina, T.N. (1993) Cyanobacterial communities inhypersaline lagoons of lake Sivash. Microbiologia 62(6), 579–599.
Zavarzin, G.A, Karpov, G.A., Gorlenko, V.M., Golovacheva, R.S., Gerasimenko, L.M.,Bonch-Osmolovskaja, E.A. and Orleanski, V.C. (1989) Calderic Microorganisms. Nauka,Moscow, 121p. (Russ.).
Zavarzin, G.A., Zhilina, T.N. and Kevbrin, V.V. (1999) The alkaliphilic microbial commu-nity and its functional diversity. Microbiologia 68(5), 503–521 (Engl.).
42 G. A. Zavarzin

Part II
Prebiological Stages of Evolution and RNAWorld on the Earth and in the Space

Astrocatalysis Hypothesis for Origin
of Life Problem
V. N. Snytnikov
Abstract Analysis of the available natural science data has allowed theastrocatalysis hypothesis to be formulated. The hypothesis indicates thepre-planetary circumstellar disk as the most probable time and place ofthe primary abiogenic synthesis of prebiotic organic substances from simplemolecules along with the ‘‘RNA world’’ and the life origin. The sequence ofself-organization stages that gave rise to the Earth biosphere is determined.Results of computational experiments with supercomputers are used to deter-mine conditions of abiogenic organic compounds in the Earth’s biosphere. Inhandling the problem of the origins of the Earth’s biosphere, it is necessary toestablish and study the role of abiogenic synthesis of prebiotic compounds inthe sequence of key stages of the self-organization of matter. The sequence is theevolution of the surroundings from the point of Big Bang towards organic lifeand further to humans.
1 Evolution of the Surroundings and the Life Origin
A large body of data on the evolution of the universe has been accumulatedin the modern natural science. The universe, along with its time, space andmatter, emerged in the Big Bang 13.7 billion years ago. The inflation andannihilation stages determined the baryons’ mass as equal to 4% of a totalof gravitating matter in the universe. The baryons exist primarily as free Hand He. Stars that emerged in the next stage of the universe’s self-organiza-tion and evolution comprise, in modern estimations, a mass of the order of10% of a total of the baryon mass. The stellar nucleosynthesis providedemergence of no more than 2% of chemical elements heavier than He, mostof them being carbon, oxygen and nitrogen. Composing molecules by theseelements favored the formation of next generation long-living stars in
V. N. SnytnikovBoreskov Institute of Catalysis, Novosibirsk and Novosibirsk State University Russia
N. Dobretsov et al. (eds.), Biosphere Origin and Evolution.� Springer 2008
45

molecular clouds. These stars could form along with their protoplanet disks;the disk was of the order of 0.1 of the protostar in mass. The disk aroundthe Sun, one of these stars that emerged approximately 4.56 billion yearsago in the Milky Way galaxy, evolved into a planet system. The system’smass is about 10–3 of the Sun’s mass, and the Earth’s mass equals ca. 10–3
of the planet system’s mass. The natural processes on the Earth gave rise tothe organic biological life with the mass of about 10–10 of the planet’s mass.Evolution of the Earth’s biosphere took no less than 3.8–3.9 billion years.There are trophic chains in the biosphere, part of them being related togeochemical matter cycles on the Earth’s surface. No more than 10% ofbase products leave from the stable trophic chains.
It is seen from the available data that the evolution of matter is basedon the emergence of a new attribute carrier at each self-organization stagewith the mass smaller than 10–1 of the initial system’s mass. There is noreason to consider that the chemical and prebiological stages of the life andbiosphere origins on the Earth are principally different, in terms of generalself-organization laws, from speciation in biology or nucleosynthesis of heavyelements in astrophysics. Hence, we shall treat the problem of abiogenicsynthesis of complex prebiotic compounds as a stage of the self-organizationprocess.
The identified and above-mentioned stages of matter’s evolution allow usto understand when and where the life originates in the universe and on theEarth. When? Not earlier than first stars emerged in the universe becausethere were no chemical life elements—carbon, oxygen, nitrogen—but onlyhydrogen and helium. Where? Life on Earth originated in the Solar systemduring the earliest, the very mysterious 600 million years after the initialpoint of the system formation. If otherwise, there would be some mechan-ism to transfer huge masses of biological compounds from planet to planetor from star to star (on the Earth, this would be no less than 2.5 � 1018 gof carbon comprised in the dry biological matter). Such a transfer seemsvery doubtful in the evolution of stars and processes in the interstellarmedium.
While studying abiogenic synthesis of first organic substances on theEarth, the prime question to be answered is if this is a planetary(the Oparin–Holdein hypothesis) or cosmic (the Arrhenius or ‘‘panspermia’’hypothesis) problem. It is shown (Snytnikov, 2006) that there may be nomore than several self-organization steps in the chemical stage of the evolu-tion from simple chemical compounds, such as CH2O or NH3, towards the‘‘RNA world’’ and then to the biosphere. This conclusion, along with avail-able biogeochemical data (Zavarzin, 2000), makes the Oparin hypothesisdoubtful but leads to suppose that ‘‘the life origin is definitely displaced tothe space’’ (Zavarzin, 2000). At the same time, the idea of ‘‘panspermia’’ ofthe eternal life existence and its transfer from star to star (Warmflash andWeiss, 2005) also disagrees with the above-mentioned natural science results.Among the probable solutions of the problem is an assumption that the
46 V. N. Snytnikov
abiogenic synthesis of primary organic matter for the Earth’s biosphereoccurred during pre-planetary evolution of the Solar system at the‘‘astrocatalysis’’ stage (Snytnikov, 2006).
2 Astrophysics and Planetology
Let us consider the protostar–protoplanet stage of the Solar system formationthat is dated back to 4.56 billion years using the chronological label based on thecontent of products of plutonium and aluminum decay. Original isotopes ofthese elements in the nature are generated by supernova explosion that stimu-lates the process of star formation in molecular clouds.
In modern concepts (Syunyaev, 1986), a protostar starts forming in a coldmolecular cloud with the elemental composition characteristic of their occur-rence in the space. Elements heavier than helium are the dust components.The formation process goes along with the development of the Jeansgravitational instability towards gravitational matter collapse into nucleiof future protostars. At the last stage of the evolution of gravitationalinstability, the star formation zone is broken down. The formed stars mayescape the zone and disconnect from one another. The stage of protostarformation at the gravitational collapse takes up to hundred thousand years.During this time, dust falling on the equatorial plane along with theentrained gas gives rise to the formation of a protoplanet accretion diskturning round the nucleus. The matter comes through the gas–dust disktowards the nucleus to increase the mass. As soon as the protostar massreaches ca. 0.1 of the Solar mass, thermonuclear reactions are ignited in thedeep that are favored by the presence of carbon and other elements. Radiantenergy is supplied from the protostar surface into the protoplanet disk andthe parental molecular cloud to raise the temperature of the surroundingmatter.
When the protostar mass becomes comparable to the Solar mass, the increas-ing radiation and stellar wind throw the surrounding matter away to make thestar visible in the optical region. This is the finish of the stage of star formationand existence of the protoplanet gas–dust disk. The matter comparable in masswith the star may be transferred through the protoplanet disk. A star withSolar-like mass is formed during the time of the order of a million years; theestimated diameter of the protoplanet disk around a Solar-type star is 100–200AU. In some astrophysical models (Makalkin, 2003), the gas temperaturereaches 100–200 K at the Jupiter’s orbit and 1000 K at the Earth’s orbit at apressure more than 10–4 bar. Protoplanets and primary stellar clustering bodiesemerge in the disk under these conditions.
The stage of star formation and emergence of protoplanets with the cloudof primary bodies is followed by a comparatively long (of the order of
Astrocatalysis Hypothesis for Origin of Life Problem 47
60 million years in the Solar system) stage of planet formation throughcollisions with the primary bodies. At this stage, the disk and internal planetslose the predominant gas components (hydrogen and helium), while themolecular cloud is destructed or the star escapes it. The final state at thisstage is a young Solar system with the disk remnants such as planets withsatellites, disk structures like rings of Saturn, Uranium and other remoteplanets.
The loss of hydrogen and helium in the Solar system, space bombardment,degassing and differentiation of Earth’s matter, tidal effects and other physico-chemical processes led to the next stage of self-organization related to theemergence of the Earth crust during geologically non-documented 600 millionyears. The last documented 3.9 billion years are the stage of the Earth’sgeobiological evolution to form the present biosphere, as well as lithosphere,atmosphere and hydrosphere.
3 Astrocatalysis, ‘‘RNA World’’ and Life Origin
Let us discuss in more detail how protoplanets and stellar clustering bodiesdevelop at the stage of star formation and existence of a protoplanet gas–dust disk.
In the molecular cloud, dust particles are 0.1 mm in characteristic dia-meter and have a multilayer structure (Levasseur-Regourd, 2004). Theirinternal nucleus of ca. 10 nm in size consists of refractory inorganic com-pounds of silicon, magnesium and iron (the elements following nitrogen,carbon and oxygen in abundance). The nucleus is covered by condensedorganic compounds and hydrides of nitrogen, carbon, oxygen, in particularwater, in the order corresponding to their volatility. While moving from theprotoplanet disk periphery towards the protostar by spiral or more intricatetrajectories, the dust particles successively lose the volatile components upontemperature rise to uncover the inorganic nucleus, the particles and heavyorganic compounds accumulated in the accretion disk due to a very strongcentrifugal effect with respect to hydrogen and helium as gas carriers.Earth’s and meteorite-originated compounds of iron and silicon at theratio approximately similar to their space abundance were used to demon-strate experimentally (Khasin and Snytnikov, 2005) a good catalytic activityof the nanoparticles in the Fischer–Tropsch synthesis. Note that the classicalindustrial catalyst for this reaction is iron supported on silica. However,these compositions are also active to synthesize ammonia from hydrogenand nitrogen and cyan hydride (the latter is in the presence of methane).Carbon monoxide, which follows hydrogen and helium in abundance in thespace, reacts with hydrogen to give paraffin hydrocarbons, including high-boiling heavy compounds, olefins, alcohols, water:
48 V. N. Snytnikov

2nþ 1ð ÞH2 þ nCO! CnH2nþ2 þ nH2O;
2nH2 þ nCO! CnH2n þ nH2O;
2nH2 þ nCO! CnH2nþ2Oþ n� 1ð ÞH2O:
As complex hydrocarbons are formed on the particle’s surface, the dustparticles start easily adhering to one another like plasticine clots. This is a
kind of ‘‘snow ball’’ adhesion to result in an increase of the bodies in size upto 1–10 m. The bodies not smaller than these in size start moving around theprotostar; they move at relative space speed higher than the sonic speeds in
condensed matter and rarely collide with one another. The collisions underthese conditions result in disintegration and destruction of the bodies.
The absence of the collision mechanism for bodies’ enlargement to several
hundred kilometers was the principal obstacle in the earlier scenarios of planetorigin (Safronov, 1969). To handle this problem, we have suggested another
putative mechanism based on the development of gravitational instability ina two-phase system of gas and solid bodies larger than 1 m in diameter(Snytnikov et al., 2002). The number of these bodies in the Solar system can
be estimated using the planet masses corrected for the gas component quan-tity of giant gaseous planets. Let us estimate the characteristic Jeans length for
gas: l�1J ¼ 4pGmg�:g�Tg;lJ�4� 1012 cm per 1 AU=1.5� 1013 cm. When
gas alone is in the disk, the development of gravitational instability at this
characteristic length is strongly hindered due to high temperatures Tg andoriented orbital speed of the gas orbiting at the protostar (�g is the density of
gas with average molecular mass mg, G is the gravitation constant). Again, theinstability cannot develop in clustering bodies in the absence of gas. Thereason is high relative speeds <V> of the bodies, which are close in quantity
to their orbital speeds round the protostar. However, when bodies of moder-ate mass mp move in a decelerating gas, the difference between their relative
speeds <V> decreases down to mp5V42 � Tg at the identical orbital speed.As the body’s mass mp increases, the effective Jeans length lpg can decrease
considerably. Within the given speed range, the decrease occurs at the ratiomg
�mp
� �1=2:
l�2pg ¼ 4pGmg�:g�Tg þ 8pGmpN:p
�5V42 � 8pGmpN:p
�Tg ;
lpg lJ � ðmg�:g m2pNpÞ1=2 � 10ðmg mpÞ1=2:
...
where Np is the number of bodies in unit volume. When the Jeans length lpgequals some critical quantity, which is smaller or comparable tothe circumstellar disk thickness, conditions emerge again for gravitational
Astrocatalysis Hypothesis for Origin of Life Problem 49

self-compression of the medium to favor the collective body clustering. Thenewly formed clusters are comparable to the protostar in size.
Computational experiments using supercomputers (Snytnikov, 2006)revealed the matter clustering which results from the development of instability.The formed clusters are comparable in size to the protostar. Namely thegravitational instability regions are the sites of nucleating large (many kilo-meters in size) primary bodies and protoplanets (Snytnikov et al., 1996).
The gravitation field causes an increase in the pressure of the main compo-nents of gas—hydrogen and helium—in the clusters during their formation. Thepressure is sometimes higher than dozens of atmospheres depending on thedistance from the protostar. The high pressures provide high absolute contentsof oxygen, nitrogen, carbon compounds and non-volatile substances in theclusters. However, while hydrogen and helium are highly thermoconductive,their high pressure means moderate temperatures. Helium and hydrogen, whenin the proportion larger than 20%, provide the energy supply to endothermicreactions and heat withdrawal from exothermic reactions. At the same time, theclusters contain a mobile solid phase of bodies with the catalytically activesurface. Hence, there exist conditions in some clusters for operation of achemical reactor similar to industrial catalysts with a fluidized catalyst bed(Boreskov, 2003). This is one of the most effective but complex operationreactors. The space reactor was close in pressure and reactant temperatures tolab-scale high-pressure catalytic reactors. These reactors are effectively used forabiogenic synthesis of organic compounds (ammonia, hydrogen cyanide,hydrocarbons, alcohols, aldehydes water, and other simple and complex com-pounds) in reductive media. Fragments of these compounds are detected now incomets. The process traces can be found in meteorites and asteroids, on planet’ssatellites and in the objects that did not undergo a geological evolution. Whilethe times of chemical reactions of organic syntheses are usually no longer thanhours or days under normal conditions, the chemical evolution rates (Parmon,2002) at that stage were determined by the rates of reactant feeding to thereaction zone. Hence, they were very fast, of the order of several years. Pre-sumably, the ‘‘RNA world’’ existed under those conditions.
This conclusion follows from analysis of conditions of emergences of pri-mordial species (Spirin, 2005). For example, as Spirin states, the ‘‘RNA world’’needs ‘‘drying-up pools’’ (water shortage but not excess), the presence of mag-nesium, wet clay surfaces, periodical intensive mixing of substances from dif-ferent pools. These are conditions that occur in the space-fluidized catalystreactor. There, the meter-sized bodies consist (in accordance to the spaceabundance of elements) of silica, magnesia and iron oxide. Water is formedon the porous body surfaces through the above-mentioned synthesis of primarycarbon-containing compounds due to catalytic properties of these composi-tions. When the bodies escape the favorable synthesis regions, water and othervolatile compounds are evolved but high-molecular compounds rest on thebodies. When the bodies re-enter the regions with the favorable conditions,water is formed again on the surface, penetrates deep into the porous bodies and
50 V. N. Snytnikov
intensifies the internal mass transfer. The merging, collision and intensivemixing of bodies at the stage of development of gravitational instability makethe mechanism of blending of colonies of RNA and other compounds. ‘‘Sys-tematic evolution through exponential enrichment’’ (Spirin, 2005) happens tothe bodies. That the evolving matter in the space reactor is larger by manyorders of magnitude than the Earth and the primordial bodies are formedinitially from space dust nanoparticles are of principal importance. The totalsurface area, both internal and external, of the bodies built up by the nanopar-ticles is so large and diversified that, undoubtedly, it allows active centers withcatalytic properties appropriate for any synthesis to be formed. The mosteffective organic compounds—autocatalysts—can be preferably and com-monly used due to the intense mass exchange under conditions of this reactor.In other words, ‘‘the colonies with most active and most complimentary RNAmolecules grow faster than others’’ (Spirin, 2005). The high pressure (dozens ormore atmospheres) of hydrogen and helium as carriers of different substances isa distinctive feature of the space reactor. It seems like the primordial SELEX ispreferable to study under these conditions. In addition, excess water emerged atlater stages upon enlargement of the bodies and shrinkage of their internalsurface areas. Probably excess water as an effective solvent destroyed the ‘‘RNAworld’’ in the enlarged bodies. Only those RNA molecules and their colonieswhich managed to create membranes for not only abating but also employingthe aqueous medium appeared suitable for further evolution. The world ofprimitive monocellulars, primeval species and the life was created.
The author is unaware of the conditions on the Earth or in the present Solarsystem which would resemble the pre-planetary conditions of the ‘‘RNAworld’’in the space reactor. However, primordial monocellular remnants may be keptin pores and fissures very deeply in the Earth’s crust at high pressures and innon-oxygen media. Of some interest in this connection may be microorganismsthat occur in porous rocks in dry regions at high temperatures or at tempera-tures below the melting point of ice. But the works to discover traces ofmicroorganism colonies in meteorites are of most importance (Gerasimenkoet al., 1999). If the results of these studies are confirmed, they will be an evidenceof life origins at the pre-planetary stage in the Solar system. The further periodsof time may then be considered as the struggle of living species for existenceunder conditions of disastrous changes in the external conditions, includingplanet formation, due to amplification of their organization and creation of anorganisms community—biosphere—while the overwhelming portion of thesynthesized primordial organic substances was lost.
Further evolution of matter in the cluster with the reactor for chemicalsynthesis is evident enough. As the cluster of organic compounds increased inmass, it could collapse into amatter clot confined by gravitation, Van derWaalsor chemical forces, planetesimals or protoplanets. These processes, each with itsspecific features, could propagate progressively from the Sun’s proximity to theperiphery. In the Sun’s proximity, the clusters and bodies moved to losehydrogen, helium and light organic compounds under the action of solar
Astrocatalysis Hypothesis for Origin of Life Problem 51

wind and radiation. The rates of gas lost decreased in the regions of the OortCloud, remote cold planets and Jupiter. Then the protoplanets accumulatedother bodies and participated in different processes to transform into planetsand to enter the eon of geological or, if under suitable conditions, geobiologicalevolution. In the primary synthesis zone, most of the organic compounds andmethane transferred to the Sun and drove away to the space. However, heavyand complex organic compounds were in huge concentrations and could sur-vive further disasters and be the basis for originating and feeding to thebiological community.
While density clusters—‘‘life sources’’—emerge at the Venus’ orbit, the med-ium temperature defines the conditions of evaporation of water and organiccompounds. At the Mars’ orbits, the low gravitation field and comparativelylow temperatures favor sublimation and loss of organic compounds and waterto the surrounding space. Probably, the conditions at the Earth’s orbits favorthe losses of the reductive atmosphere (hydrogen and helium) but hold waterand other gases. In further considerations, it is important to determine theprobable ‘‘zone of life expansion’’ in the Solar system. In particular, doesMars fall into this zone? The result will be checked using automated spacestations.
4 Conclusions
The conditions of the ‘‘space catalytic reactor’’ in a protoplanet disk were mostappropriate for abiogenic synthesis of primordial organic compounds. That wasa fluidized solid-phase reactor containing a reductive hydrogen–heliumatmosphere at the pressure of less or more than 10 atm. The solid ‘‘granules’’were of the order of 1–10 m. The solid phase consisted mainly of SiO2–MgO–Fe.The solid phase exposed a vast catalytically active surface where water and othercompounds were condensed at some distance from the protostar. At differenttime periods, the reactor was as large as hundreds to dozens times of the Sundiameter. Energy was supplied to the reactor zone by the protostar radiation towarm up the surface of the protoplanet disk. The zone of synthesis by exothermicreaction was cooled by hydrogen and helium. The existence time of the reactorfor synthesis of chemical compounds was ca. 10 years. The chemical final statemeant high-molecular organic compounds, H2O and other element hydrides,probably, the ‘‘RNA world.’’ The physical final state was emergence of bodiesof many kilometers in size in the reductive atmosphere. The number of such ‘‘lifesources’’ as the reactor for synthesis of chemical compounds and the ‘‘RNAworld’’ depended on specific features of the development of gravitational instabil-ity in the two-phase medium of the disk. At the early stages of the gravitationalinstability, there might be several ‘‘sources’’ or more. Hence, synthesis ofcomplex organic compounds directly initiated the formation of primary bodies.Protoplanets were the result of simultaneous confluence of numerous bodies
52 V. N. Snytnikov

upon development of collective gravitational instability. Catalytic processes gaverise to the planet formation.
Acknowledgment The studies were supported by Programs of the Presidium of the RussianAcademy of Sciences N 8-12 ‘‘Origin and Evolution of Biosphere’’ and ‘‘Origin and Evolutionof Stars and Galaxies,’’ projects NSh-6526.2006.3 and RNT.2.1.1.1969 of the Ministry ofEducation and Science of the Russian Federation.
The author is grateful to academician V. Parmon and the corresponding member of RAS,A. Rosanov, for their assistance to him and the team of his colleagues from the researchinstitute of the Siberian branch of the Russian Academy of Sciences.
References
Boreskov, G.K. (2003) Heterogeneous Catalysis. Nova Science Publishers, New York.Gerasimenko, L.M., Hoover, R.B., Rozanov, A.Yu., Zhegallo, E.A. and Zhmur, S.I. (1999)
Bacterial paleontology and studies of carbonaceous chondrites. Paleontol. J. 33(4), 439.Khasin, A.A. and Snytnikov, V.N. (2005) Peculiarities of the product composition of the
Fischer–Tropsch synthesis over the meteorite Tsarev material. Abstracts, InternationalWorkshop Biosphere Origin and Evolution, Novosibirsk, Russia, June 26–29,pp. 158–159.
Levasseur-Regourd, A.C. (2004) Cometary dust unveiled. Science 304(5678), pp. 1762–1763.Makalkin, A.B. (2003) Problems of protoplanet disks evolution. In: M.Ya. Marova, Sovre-
mennye problemy Mekhaniki I Fiziki Kosmosa: K 70-letiyu. Fizmatlit, Moscow,pp. 402–446.
Parmon, V.N. (2002). The origin of life: the prebiotic phase. Herald Russ. Acad. Sci. (VestnikRossiiskoi Akademii Nauk) 72(6), 592.
Safronov, V.S. (1969) Evolution of Protoplanetary Cloud and the Origin of the Earth andPlanets. Nauka, Moscow, Russia, English translation, NASA TTF-667, 1972.
Snytnikov, V.N. (2006) Astrocatalysis as the first step of geobiological processes. In:A.Yu. Rozanov, Evoluzsiya biosfery I bioraznoobraziya: K 70-letiyu. KMK, Moscow,pp. 49–59.
Snytnikov, V.N., Vshivkov, V.A. and Parmon, V.N. (1996) Solar nebula as a global reactorfor synthesis of prebiotic molecules. 11th International Conference on the Origin of Life,Orleans, France, July 5–12, p. 65.
Snytnikov, V.N., Dudnikova, G., Gleaves, J., et al. (2002) Space chemical reactor of proto-planetary disk. J. Adv. Space Res. 30(6), 1461–1467.
Spirin, A.S. (2005) Origin, possible forms of being, and size of the primeval organisms.Paleontol. J. 39(4), 364.
Syunyaev, R.A. (red.) (1986) Fizika kosmosa: malen’kaja e’nciklopedija. Moscow, Russia,783 pp.
Warmflash, D. andWeiss, B. (2005, November) Did life come from another world? ScientificAmerican.
Zavarzin, G.A. (2000). The non-Darwinian domain of evolution. Herald Russ. Acad. Sci.(Vestnik Rossiiskoi Akademii Nauk) 70(3), 252.
Astrocatalysis Hypothesis for Origin of Life Problem 53

Comets, Carbonaceous Meteorites and the Origin
of the Biosphere
R. B. Hoover
Abstract Evidence for indigenous microfossils in carbonaceous meteorites sug-gests that the paradigm of the endogenous origin of life on Earth should bereconsidered. It is now widely accepted that comets and carbonaceous meteor-ites played an important role in the delivery of water, organics and life-criticalbiogenic elements to the early Earth and facilitated the origin and evolution ofthe Earth’s biosphere. However, the detection of embedded microfossils andmats in carbonaceous meteorites implies that comets and meteorites may haveplayed a direct role in the delivery of intact microorganisms and that the bio-sphere may extend far into the cosmos. Recent space observations have foundthe nuclei of comets to have very low albedos (�0.03) and these jet-blacksurfaces can become very hot (T � 400 K) near perihelion. This chapter reviewsrecent observational data on comets and suggests that liquid water pools couldexist in cavities and fissures between the internal ices and rocks and the exteriorcarbonaceous crust. The presence of light and liquidwater near the surface of thenucleus enhances the possibility that comets could harbor prokaryotic extremo-philes (e.g., cyanobacteria, sulfur bacteria and archaea) capable of growth over awide range of temperatures. The hypothesis that comets are the parent bodies ofthe CI1 and the CM2 carbonaceous meteorites is advanced. Electron micro-scopy images will be presented showing forms interpreted as indigenous micro-fossils embedded in freshly fractured interior surfaces of the Orgueil (CI1) andMurchison (CM2) meteorites. The size range and morphological characteristicsof these forms are consistent with known representatives of morphotypes of allfive subsections (orders) of Phylum Cyanobacteria. Energy dispersive X-rayspectroscopy (EDS) elemental data show that the forms in the meteorites haveanomalous C/N and C/S as compared with modern extremophiles and cyano-bacteria. These images and spectral data indicate that the clearly biogenic andembedded remains cannot be interpreted as recent biological contaminants andtherefore are indigenous microfossils in the meteorites.
R. B. HooverAstrobiology Laboratory, NASA/NSSTC, Huntsville, AL, USAe-mail: [email protected]
N. Dobretsov et al. (eds.), Biosphere Origin and Evolution.� Springer 2008
55

1 Introduction
The origin and extent of the biosphere and the temporal and spatial distribution
of life represent the most profound and fundamental problems of the rapidlyemerging multidisciplinary field of astrobiology. Astrobiologists are concernedwith the origin and the distribution of life and seek answers to the questions:
Is life on Earth endogenous or exogenous?Is life restricted to Earth or is life a Cosmic imperative?
The recent discovery that microbial extremophiles thrive in hot rocks deepwithin the Earth’s crust (Frederickson and Onstott, 1996) and in hydrothermalfluids of deep-sea vents has established that the deep, hot biosphere first
proposed by Thomas Gold does indeed exist (Gold, 1992). The detection ofviable, cryopreserved microorganisms in deep ice cores from the CentralAntarctic Ice Sheet (Abyzov, 1993; Abyzov et al., 2004), ancient permafrost
(Gilichinsky et al., 1992) and in deep marine sediments has confirmed theexistence and established the significance of the deep cold biosphere. It is nowknown that the vast deep, cold biosphere (cryosphere) contains the majority ofthe prokaryotic cells on Earth (Whitman et al., 1998). Cell counts indicate that
the deep-sea sub-seafloor sediments harbor 1.3� 1029 cells which representmore than 50% of all prokaryotic cells on Earth (Schippers et al., 2005). Ithas been shown that the living component of the Earth’s biosphere is comprised
primarily of prokaryotic chemoautotrophs and chemolithotrophs of the deep(hot and cold) biosphere rather than more obvious larger multicellular eukar-yotes (plants and animals) that are more popularly recognized as ‘‘life.’’ Thecomposition and the spatial and temporal distribution of the biosphere of our
planet is profoundly different than that which was widely accepted only a fewdecades ago as based on the pioneering work of Vernadsky (1926, 1998).
Chemical and molecular biomarkers indicate that life appeared very early(�3.8 Ga) on the primitive Earth (Schidlowski, 1988, 2001). The majority of theearliest definitively recognizablemicrofossils in ancient Earth rocks have sizes and
detailed morphological features that are virtually indistinguishable from moderncyanobacteria and filamentous prokaryotes of benthic mats and hydrothermalvent communities (Rasmussen, 2000; Walsh and Lowe, 1985). Fossils from the
2.15 Ga Belcher Group, Canada (Hofmann, 1976), were sufficiently well pre-served as to be recognized as members of an extant clade of endolithic cyano-bacteria. These ancient colonial microfossils exhibited recognizable packaging ofcells within a mucilage envelope and the surface of the colony was considered to
have been darkened by pigmentation and the forms were interpreted as micro-fossils of cyanobacteria. The fossil forms were designated Eoentophysallis toreflect their similarity to living representatives of the genus Entophysallis (Knoll
and Golubic, 1992). The colonial habit within a carbonaceous envelope is impor-tant for the recognition of the air biogenicity, since spherical forms are producedby many physical processes and clearly abiotic forms resembling cocci or
56 R. B. Hoover
diplococci are present in lunar dust (Storrie-Lombardi et al., 2006). Carotenoids,chlorophyll and other pigments are common in cyanobacteria where they play acrucial role in photosynthesis and protection of the internal cells from UVradiation (Castenholz and Garcia-Pichel, 2000; Hoiczyk and Hansel, 2000).
Filamentous cyanobacteria and sulfur bacteria have far more distinctive andunambiguously biological morphologies than the coccoidal forms (even whenthe coccoidal forms are in colonial assemblages). Many of the filamentouscyanobacteria have sheaths and exhibit polarized filaments that taper or havedistinctive basal and apical termini. The precise sizes and shapes of the cellswithin the filaments are often of definitive diagnostic value when combined withother morphological features of the organism. Compared with other bacteriaand archaea, filamentous cyanobacteria are often very large and exhibit com-plex, unambiguous and recognizable morphological characteristics that histori-cally have formed the basis for their taxonomy. The filaments may be a simplelinear chain of cells (trichome) that is often ensheathed within a mucilaginouspolysaccharide envelope that is variously called the sheath, capsule, or glyco-calyx depending upon the consistency of the mucilage or slime. Filamentouscyanobacteria often possess distinctive differentiated cellular structures fornitrogen fixation (basal or intercalary heterocysts) and reproduction (hormo-gonia, baeocytes, akinetes and spores). Sheaths that envelope trichomes can bethick, thin, laminated or unlaminated, uniseriate (with one trichome), multi-seriate (containing two or more trichomes). The filaments can also exhibitdifferent types of false or true branching. Cyanobacterial sheaths are extracel-lular fibrillar carbohydrates and complex polysaccharides. Taphonomic studieshave shown that the sheaths of cyanobacteria are better preserved in the fossilrecord, in preference to their peptidoglycan-rich walls of the cyanobacterialcells (Bartley, 1996). Bacterial paleontology studies have established that fossilbacteria and cyanobacteria can be extremely well preserved in a wide variety ofProterozoic and Archaean rocks and carbonaceous meteorites (Hoover andRozanov, 2005; Zhegallo et al., 2000).
The morphological characteristics of cyanobacteria have remained phenom-enally stable since they first appeared on Earth over 3 billion years ago.Ruedemann (1918) was the first to observe ‘‘arrested evolution’’ when herecognized many hundred million year old fossils that were morphologicallyindistinguishable from their modern analogs. This phenomenon was termed‘‘bradytely’’ (Simpson, 1944). Schopf (1987) introduced the term ‘‘hypobrady-tely’’ to ‘‘refer to the exceptionally low rate of evolutionary change exhibited bycyanobacterial taxa, morphospecies that show little or no evident change overmany hundreds of millions of years and commonly over more than one or eventwo thousand million years’’ (Schopf, 1992). Knoll and Golubic (1992, p. 453)noted ‘‘Essentially all of the salient morphological features used in the taxo-nomic classification of living cyanobacteria can be observed in well-preservedmicrofossils.’’ The similarity of size and detailed morphological characteristicsare so great that names of fossil cyanobacteria are often formed by adding theprefixes (palaeo-, eo-) or the suffixes (-opsis, -ites) to the genus name of the
Comets, Carbonaceous Meteorites and Biosphere Origin 57
modern morphological counterpart (e.g., Palaeolyngbya, Palaeopleurocapsa,Eomicrocoleus; Oscillatoriopsis, etc.). Over 40 genera of fossil cyanobacteriahave been named using this convention (Schopf, 2000).
2 Comets, Meteorites, and the Origin and Distribution of Life
Comets and carbonaceous meteorites are some of the most interesting bodies ofthe solar system. Evidence continues to mount that the CI and CM meteoritesare fragments of cometary nuclei with most of the volatiles removed (Ehren-freund et al., 2001; Hoover, 2006a) and that these meteorites contain themineralized remains of indigenous microfossils of cyanobacteria and prokar-yotic mats (Hoover, 1997, 2006b; Zhmur et al., 1997). Therefore comets andcarbonaceous meteorites may have played a crucial role in the origin andevolution of the biosphere and the distribution of life throughout the cosmos.It is generally accepted that the volatiles of the nuclei of comets are primordialices that condensed on carbonaceous material and mineral dust grains in theproto-solar nebula (far away from the hot central region) during the formationof the solar system. The ‘‘dirty snowball’’ model was first advanced by FredWhipple (1950) who also recognized the close relationship between comets andmeteors (Whipple, 1951, 1963). Comets do not develop comae or tails until theycome closer to the Sun than the orbit of Jupiter (�5 AU) where solar radiationheats the nucleus to a temperature in excess of 200 K. Beyond this ‘‘snow line’’the volatiles are solidified and the coma and tail disappears and the comet lookslike an asteroid. It is a widely accepted hypothesis that although comets are richin water ice, their porosity is so great the water ice sublimes directly to watervapor without transition through the liquid phase. The widely accepted hypoth-esis that liquid water cannot exist on comets has led to the conclusion that theymust be sterile, since metabolism and active growth of all known life formsappears to be predicated upon the presence of liquid water. However, the phasediagram shows that the transition of ice into liquid water will occur wheneverthe temperature exceeds 273K as long as the pressure exceeds 6.1 millibars.Spontaneous flaring and the eruption of geyser-like jets from comets Halley andTemple 1 indicate pressures in excess of 6.1 millibars (and hence liquid water)can occur in cometary nuclei.
Impacts of comets, meteorites and asteroids during the Hadean deliveredwater and ice to the Earth and Mars and may have played a significant role inthe formation of early oceans of our planet (Delsemme, 1997). The deuteriumto hydrogen ratio for water molecules of comets Halley, Hale–Bopp andHyakutake was found to be of an order of magnitude higher than the D/Hratios for Saturn, Jupiter and the interstellar medium but the D/H ratios notonly overlap the Earth’s oceans (1.6 � 10–4) but they are also consistent withthe values found for the indigenous water of the carbonaceous meteorites(Delsemme, 1998; Eberhardt et al., 1987). Chyba and Sagan (1997) pointed
58 R. B. Hoover

out that the cometary delivery of bulk of the Earth’s oceans is quantitativelyconsistent with the Earth deriving its inventory of carbon from comets aswell. Comets arrive from the volatile-rich outer regions of the solar system,which led to the suggestion that comets delivered pre-biotic organic moleculesalong with water and carbon to the inner planets (Oro, 1961; Oro, Mills, andLazcano, 1995).
The concept that comets are sterile continues to be widely held eventhough recent discoveries have shown that living microorganisms exist inice (Abyzov, 1993; Abyzov et al., 2004; Pikuta et al., 2005) and that thesurface of a comet nucleus becomes hot within the orbit of Mars (1.5 AU).Hoyle and Wickramasinghe (1980) argued that comets might periodicallydeliver intact and possibly yet viable microorganisms to Earth and otherbodies of the solar system. Hoover et al. (1986) advanced the hypothesis thatdiatoms, bacteria and other microorganisms could live in ice and waterbeneath the organic-rich carbonaceous crusts of comets. Consequentlycomets could thereby have played a crucial role in the origin of life onEarth as well as in the distribution of life throughout the cosmos.
Spacecraft observations of comet P/Halley in March 1986 provided impor-tant data about the nature, behavior, surface temperature and chemicalcomposition of the comet nucleus and coma. The Vega Dust Mass Spectro-meter found the Halley nucleus material to have a composition similar tocarbonaceous meteorites with water as the primary volatile (75–80%). TheVega 1 IR spectrometers found the dayside surface of the 16 � 8 � 8 kmnucleus of comet Halley at perihelion was astonishingly hot (T �400 K)(Emerich et al., 1987). ESA’s Giotto spacecraft determined the Halley nucleuswas one of the darkest objects in the solar system with an albedo � 0.03, thatis comparable to CI and CM carbonaceous meteorites and P- and D- classasteroids (Hiroi et al., 2004). An inert black crust may build up as comets loseice, and dust and carbonaceous materials concentrate on the surface (Wallisand Wickramasinghe, 1991; Wickramasinghe and Hoyle, 1999). Giottoobtained spectacular images from 600 km showing the full contour of Halley’sjet-black nucleus as two very bright geyser-like jets of water vapor, dust andice particles were being ejected. Giotto measured the D/H ratio of the water ofcomet Halley at 5.5 � 10–4 which is similar to seawater (1.5 � 10–4); carbo-naceous meteorites (�1.4–6.2 � 10–4) but very different from the D/H ratio ofJupiter (1.5–3.5 � 10–5); diffuse interstellar medium (1.5 � 10–5) and proto-solar nebula (2.1 � 10–5) (Eberhardt et al., 1987). Evidence for microfossils inCI and CM carbonaceous meteorites may be interpreted as supporting thehypothesis that comets were the parent bodies of these meteorites (Hoover,2006a,b; Hoover et al., 2004, Hoover and Pikuta, 2004).
Sunshine et al. (2006) found exposed regions of water ice on the surface ofcomet Temple 1 at 1.5 AU (near the orbit of Mars). Their measurementsindicated the temperature was slightly above 273 K (melting temperature ofwater ice) over a large area of the surface of the nucleus with the maximum of330 K in the hottest regions exposed to direct sunlight. Infrared spectra of
Comets, Carbonaceous Meteorites and Biosphere Origin 59
comet Temple 1 as observed by the Deep Impact spacecraft showed a tremen-dous increase in the 3.2 mm CH–X band when compared with the 3.2 mm H2
band and the 4.25 mmCO2 band indicating a strong surge of material with highorganic content from the inner regions of the nucleus. These observationsprovide additional evidence in support of the hypothesis that liquid water canexist on cometary nuclei (Sheldon and Hoover, 2006). Hence, cyanobacterialand prokaryotic mats could form within regimes between a semipermeablecarbonaceous crust and the interior ice where pressure and temperature para-meters allow liquid water films or pools to exist.
3 Microfossils of Cyanobacteria in the Orgueil
and Murchison Meteorites
High-resolution scanning electron microscopy imaging of meteorites andliving and fossil cyanobacteria and microbial extremophiles has been carriedout at the Astrobiology Laboratory of the NASA/Marshall Space FlightCenter (MSFC) and the National Space Science and Technology Center(NSSTC). This research employed the ElectroScan environmental scanningelectron microscope (ESEM) and the FEI Quanta 600 FEG and Hitachi S-4100 field emission scanning electron microscopes (FESEM) operating withsecondary and backscattered electron detectors. Uncoated, freshly fractured,interior surfaces of meteorites, proterozoic rocks, Vostok ice, living and fossilcyanobacteria and other prokaryotic and eukaryotic extremophiles werestudied. All these instruments have energy dispersive X-ray spectroscopy(EDS) systems capable of obtaining quantitative elemental composition(spot and 2D X-ray maps) for elements with atomic number above boron.Several thousand images and EDS spectra have been produced during thepast decade
Mineralized and embedded remains of clearly biogenic, large, filamentousforms have been found in all of the CI1 (Orgueil, Alais, Ivuna); CIUngrouped (Tagish Lake); CM2 (Murchison, Murray, Mighei, Nogoya)and some CO3 (Rainbow, DAG 749) and CV3 (Efremovka) meteoritesthat have been investigated. Similar forms were not detected in studies atNASA/MSFC of the CV3 (Allende); CK5 (Karoonda); L4 (Barratta; Nikols-koye); L/LL6 (Holbrook); Diogenites (Tatahouine); Nakhlites (Nakhla;Lafayette) or Nickel/Iron (Antarctic) meteorites studied. The CI and CMcarbonaceous meteorites contain a large number of complex and embeddedcoccoidal and filamentous forms consistent in size, shape and morphologywith known species of cyanobacteria, sulfur bacteria and other morphologi-cally convergent prokaryotes. Many of the forms are clearly embedded in themeteorite rock matrix and have C/N and C/S ratios dramatically differentfrom those measured in living and dead cyanobacteria, prokaryotic
60 R. B. Hoover

extremophiles and eukaryotes (fungi, diatoms, wood and moss). Conse-quently, many of these complex and recognizable filaments have been inter-preted as indigenous microfossils of cyanobacteria in the meteorites ratherthan recent microbial contaminants (Hoover, 2006a, 1997; Hoover andRozanov, 2005; Hoover et al., 2004; Zhmur et al., 1997). Representativesof all five orders of cyanobacteria recognized by Castenholz and Waterbury(1989) (corresponding to Sections I–V of Boone et al., 2001) have beenfound embedded in the carbonaceous meteorites and a few examples arepresented herein.
3.1 Morphotypes of Cyanobacteria in Carbonaceous Meteorites
Coccoidal and nanometric scale spherical microstructures have been found in allthe meteorites studied. Since simple spheres can be produced by many abioticmechanisms most of the spherical forms found in the meteorites were notconsidered to be unambiguously biological in origin and therefore they werenot interpreted as microfossils. Unicellular Chroococcalean cyanobacteria (e.g.,Synechococcus, Gloeothece, Gloeocapsa) reproduce by binary fission. Eventhough coccoidal forms can be abiotic, the forms shown in Fig. 1 are encapsu-lated within a carbonaceous sheath and they are interpreted as being biogenic inorigin (Gerasimenko et al., 1999). These forms exhibit the appropriate sizes andsize ranges of morphotypes of cyanobacteria of the Order Chrococcales, such asare found encased within carbonaceous sheaths (Fig. 1a and b) or as colonialassemblages in carbon-rich mucilage envelopes (Fig. 1c). Other irregular orpolygonal coccoidal forms have been found in pseudofilaments encapsulatedwithin carbonaceous sheaths such as unicellular members of the OrderPleurocapsales. Representatives of this Order reproduce by multiple fissionyielding ‘‘baeocytes’’ of diverse sizes such as are seen in Fig. 1d.
By far the most abundant and recognizable microfossils found in the carbonac-eous meteorites are morphotypes of filamentous non-heterocystous cyanobacteriathat divide in only one plane. These are the cyanobacteria that belong to the OrderOscillatoriales (Section III of the Bacteriological Code). Morphotypes interpretedas representative of species of the genera Oscillatoria, Spirulina, Arthrospira,Microcoleus, Phormidium, Lyngbya and Plectonema have all been encountered inthe Orgueil meteorite. Microfossils of Oscillatorialean cyanobacteria are shown inFig. 1e fromMurchison and Fig. 1f from the Orgueil meteorite.
The most complex and highly distinctive are the Nostocalean cyanobacteria.Examples of these in the meteorites include the morphotype of filamentousNostoc sp. with emergent hormogonia and hollow empty sheath (Fig. 1g) in theMurchison CM2 meteorite. Figure 1h shows the funnel-shaped apical regionsof three almost completely embedded filaments beside a thin embedded benthicmat of several tapered filaments that are attached to the Orgueil meteorite rockmatrix. These smooth bulbous structures are interpreted as basal heterocysts,
Comets, Carbonaceous Meteorites and Biosphere Origin 61

which are well known in modern cyanobacteria of the family Rivulariaceae.
These forms are consistent with size, morphology and ecological habit with
modern morphotypes of Calothrix spp. Figure 1i shows a morphotype of a
Fig. 1 Well-preserved mineralized microfossils of morphotypes of all five orders of Cyano-bacteriaceae (Chroococcales (a–c); Pleurocapsales (d); Oscillatoriales (e, f); Nostocales (g, h);and Stigonematales (i)) embedded in freshly fractured interior surfaces of theMurchison CM2(a, e, g) and the Orgueil CI1 (b, c, d, f, h, i) carbonaceous meteorites
62 R. B. Hoover
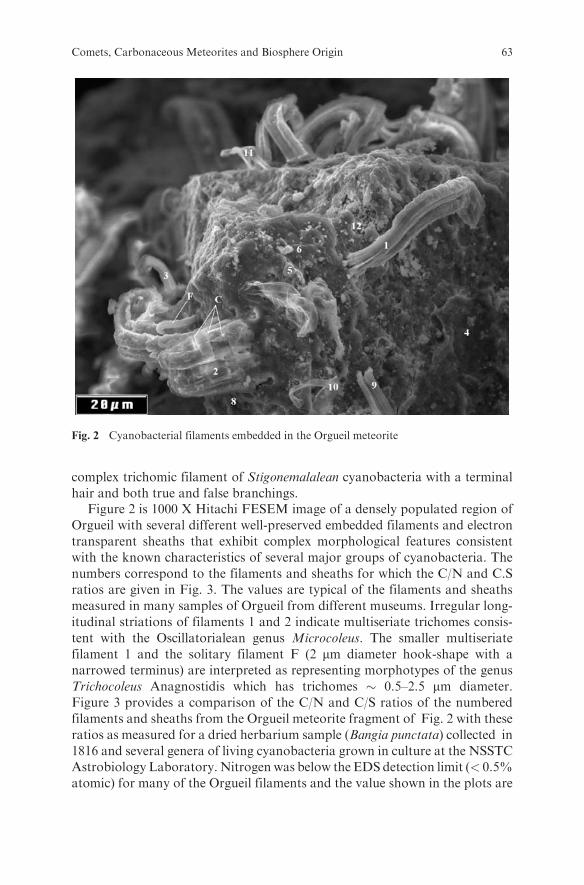
complex trichomic filament of Stigonemalalean cyanobacteria with a terminalhair and both true and false branchings.
Figure 2 is 1000 X Hitachi FESEM image of a densely populated region ofOrgueil with several different well-preserved embedded filaments and electrontransparent sheaths that exhibit complex morphological features consistentwith the known characteristics of several major groups of cyanobacteria. Thenumbers correspond to the filaments and sheaths for which the C/N and C.Sratios are given in Fig. 3. The values are typical of the filaments and sheathsmeasured in many samples of Orgueil from different museums. Irregular long-itudinal striations of filaments 1 and 2 indicate multiseriate trichomes consis-tent with the Oscillatorialean genus Microcoleus. The smaller multiseriatefilament 1 and the solitary filament F (2 mm diameter hook-shape with anarrowed terminus) are interpreted as representing morphotypes of the genusTrichocoleus Anagnostidis which has trichomes � 0.5–2.5 mm diameter.Figure 3 provides a comparison of the C/N and C/S ratios of the numberedfilaments and sheaths from the Orgueil meteorite fragment of Fig. 2 with theseratios as measured for a dried herbarium sample (Bangia punctata) collected in1816 and several genera of living cyanobacteria grown in culture at the NSSTCAstrobiology Laboratory. Nitrogen was below the EDS detection limit (< 0.5%atomic) for many of the Orgueil filaments and the value shown in the plots are
Fig. 2 Cyanobacterial filaments embedded in the Orgueil meteorite
Comets, Carbonaceous Meteorites and Biosphere Origin 63

lower limit. The 1816 filament and living cyanobacteria had Nitrogen levels inthe the range of 3–15% (atomic) but Sulfur levels often below the (< 0.5 %)detection limit and the C/S ratios represent lower limits vor the living forms.Sulfur was always present (often at astonishingly high values) in the Orgueilfilaments resulting in extremely low C/S ratios. The dramatically different C/Nand C/S plots permit the Orgueil filaments to be readily distinguished frommodern biological materials. Hence, recent contaminants can be ruled out andthese filaments are interpreted as representing indigenous microfossils ofcyanobacteria ormorphologically convergent trichomic prokaryotes embeddedin the carbonaceous meteorite matrix.
4 Conclusions
The discovery of indigenous microfossils of cyanobacteria in carbonaceousmeteorites clearly indicates that the biosphere of Earth is open rather thanclosed. The possibility that biological matter has been transferred into spaceby the impact of large comets and asteroids onto shallow marine sedimentsmust be considered as well as the possibility that terrestrial microbial extremo-philes arrived on Earth during the Hadean bombardment from other regimes ofthe cosmos. The images provided in Figs. 1 and 2 are unambiguously biologicalin nature. These filaments, sheaths and mats are clearly recognizable as asso-ciated with morphotypes of highly distinctive and well-known polarized anddifferentiated benthic filamentous cyanobacteria. The Orgueil meteorite isimmediately destroyed by contact with liquid water (Cloez, 1864, Hoover,2006b). It is impossible that these photosynthetic microorganisms (whichrequire liquid water to grow and a water/substrate interface in order to formmats) could have constructed the observed mats and benthic ecological
Fig. 3 Comparison of C/N and C/S ratios of the numbered Orgueil meteorite filaments andsheaths (from Fig. 2) with a filament in an 1816 herbarium sample and living cyanobacteriagrown in culture at the NSSTC Astrobiology Laboratory
64 R. B. Hoover

consortia within the dry black Orgueil rocks subsequent to the arrival of theOrgueil meteorite on Earth. Furthermore, there are dramatic differencesbetween the C/N and C/S ratios of the Orgueil filaments and sheaths thanthose found in living cyanobacteria and old dead forms encountered in herbar-ium material. Therefore it is concluded that the indigenous microfossils ofcyanobacteria found in the CI and CM carbonaceous meteorites provide strongevidence that the biosphere is open and is not restricted to the planet Earth.
Acknowledgment I express gratitude to Gregory Jerman and James Coston of NASA/MSFCfor electron microscopy support and William Birch, Victoria Museum (Murchison); PaulSipiera, DupontMeteorite Collection (Orgueil, Ivuna); Martine Rossignol-Strick and ClaudePerron, Musee Nationale d’Histoire Naturelle, Paris (Orgueil) for the meteorite samples usedin this research. I also thank Elena V. Pikuta, NSSTC for cultures of extremophiles and AlexeiYu. Rozanov, N. C. Wickramasinghe, Max Wallis, Academician Georgi Zavarzin, Acade-mician Erik Galimov, Rosemarie Rippka, Ludmilla Gerasimenko and the late Sir Fred Hoylefor many helpful discussions regarding cyanobacteria, bacterial paleontology, comets andcarbonaceous meteorites.
References
Abyzov, S.S. (1993) Microorganisms in the Antarctic ice. In: E.I. Friedman (Ed.), AntarcticMicrobiology. Wiley-Liss, New York, pp. 265–296.
Abyzov, S.S., Hoover, R.B., Imura, S., Mitskevich, I., Naganuma, T., Poglazova, M. andIvanov, M.V. (2004) Use of different methods for discovery of ice-entrapped microorgan-isms in ancient layers of the Antarctic glacier. Adv. Space Res., Cospar 33, 1222–1230.
A’Hearn,M.F., Belton,M. J. S., Delamere,W.A.,Kissel, J., Klaasen,K. P., McFadden, L.A.,Meech, K. J., Melosh, H. J., Schultz, P. H., Sunshine, J. M., Thomas, P. C., Veverka, J.,Yeomans, D. K., Baca, M. W., Busko, I., Crockett, C. J., Collins, S. M., Desnoyer, M.,Eberhardy, C. A., Ernst, A. M., Farnham, T. L., Feaga, L., Groussin, O., Hampton, D.,Ipatov, S. I., Li, J. –Y., Lindler, D., Lisse, C. M., Mastrodemos, N., Owen, Jr., N. M.,Richardson, J. E., Wellnitz, D. D., and White, R. L., (2005). Deep Impact: ExcavatingComet Tempel 1, Science 310 258–264.
Bartley, J.K. (1996) Actualistic taphonomy of cyanobacteria: implications for the Precam-brian fossil record. Palaios 11, 571–586.
Boone, D. R., Castenholz, R. W., Garrity, G. M. Eds. (2001) Bergey’s Manual of SystematicBacteriology. Volume One. The Archaea and the Deeply Branching and PhototrophicBacteria. Springer-Verlage, New York, N.Y., pp. 473–600.
Castenholz, R.W. and Garcia-Pichel, F. (2000) Cyanobacterial response to EV-radiation. In:B.A. Whitton andM. Potts (Eds), The Ecology of Cyanobacteria: Their Diversity in Timeand Space. Kluwer Academic Publishers, Dordrecht, pp. 591–611.
Castenholz, R. and Waterbury, J. B. (1989) Introduction to Cyanobacteria. In: N. R. Kriegand J. G. Holt (eds.), Bergey’s Manual of Systematic Bacteriology. Vol. 3 Williams andWilkens, pp. 1710–1728.
Chyba, C.F. and Sagan, C. (1997) Comets as a source of prebiotic molecules for the earlyEarth. In: P.J. Thomas, C.F. Chyba and C.P. McKay (Eds), Comets and the Origin andEvolution of Life. Springer-Verlag, New York, pp. 147–168.
Cloez, S. (1864) Note sur la composition chimique de la pierre meteorique d Orgueil. Compt.Rend. Acad. Sci., Paris 58, 986–988.
Comets, Carbonaceous Meteorites and Biosphere Origin 65

Delsemme A.H. (1997) The origin of the atmosphere and of the oceans. In: P.J. Thomas, C.F.Chyba and C.P. McKay (Eds), Comets and the Origin and Evolution of Life. Springer-Verlag, New York, pp. 29–67.
Delsemme, A.H. (1998) The deuterium enrichment observed in recent comets is consistentwith the cometary origin of seawater. Planet. Space Sci. 47, 25–131.
Eberhardt, P., Dolder, U., Schulte, W., Krankowsky, D., Lammerzahl, P., Berthelier, J.J.,Woweries, J., Stubbemann, U., Hodges, R.R., Hoffman, J.H. and Illiano, J.M. (1987) TheD/H ratio in water from comet P/Halley. Astron. Astrophys. 187, 435–437.
Ehrenfreund, P., Glavin, D.P., Botta, O., Cooper, G., Bada, J. (2001) Extraterrestrial aminoacids in Orgueil and Ivuna: tracing the parent body of CI type carbonaceous chondrites.Proc. Natl Acad. Sci. 98, 2138–2141.
Emerich, C., Lamarre, J.M.,Moroz, V.I., Combes,M., Sanko,N.F.,Nikolsky,Y.V.,Rocard, F.,Gispert, R., Coron, N., Bibring, J.P., Encrenaz, T. and Crovisier, J. (1987) Temperature andsize of the nucleus of comet P/Halley deduced from IKS infrared Vega 1 measurements.Astron. Astrophys. 187, 839–842.
Frederickson, J.K. andOnstott, T.C. (1996)Microbes deep inside theEarth. Sci.Am. 275, 68–73.Gerasimenko, L.M., Hoover, R.B., Rozanov, A.Yu., Zhegallo, E.A. and Zhmur, S.I.
(1999) Bacterial paleontology and studies of carbonaceous chondrites. Paleontol. J. 33,439–459.
Gilichinsky, D.A., Vorobyova, E.A., Erokhina, L.G., Fedorov-Davydov, D.G. andChaikovskaya, N.R. (1992) Long-term preservation of microbial ecosystems in perma-frost. Adv. Space Res. 12, 255–263.
Gold, T. (1992) The deep, hot biosphere. Proc. Natl Acad. Sci. 89, 6045–6049.Hiroi, T., Pieters, C.M., Rutherford, M.J., Zolensky, M.E., Sasaki, S., Ueda, Y. and
Miyamoto, M. (2004) What are the P-type asteroids made of? Lunar Planet Sci. XXXV,1616.
Hofmann, H.J. (1976) Precambrian microflora, Belcher Islands, Canada: significance andsystematics. J. Palaeontol. 50, 1040–1073.
Hoiczyk, E. and Hansel, A. (2000) Cyanobacterial cell walls: news from an unusual prokar-yotic envelope. J. Bacteriol. 182, 1191–1199.
Hoover, R.B. (1997) Meteorites, microfossils and exobiology. SPIE 3111, 115–136.Hoover, R.B., Hoyle, F., Wallis, M.K., and Wickramasinghe, N.C., (1986) ‘‘Can Diatoms
Live on Cometary Ice?’’ in Asteroids, Comets and Meteors II., Proceedings of Meeting atAstronomical Observatory of Uppsala University, June, 1985, (C. I. Lagerkvist, Ed.),pp. 359–352.
Hoover, R.B. (2006a) Comets, asteroids, meteorites, and the origin of the biosphere. SPIE6309, 63090J 1–12.
Hoover, R.B. (2006b) Fossils of prokaryotic microorganisms in the Orgueil meteorite. In:R.B. Hoover, A.Yu. Rozanov and G.V. Levin (Eds), Instruments, Methods and Mis-sions for Astrobiology, IX. SPIE, 6309, 02 1-17.
Hoover, R.B. and Pikuta, E.V. (2004) Microorganisms on comets, Europa, and the polar icecaps of Mars. SPIE 5163, 191–202.
Hoover, R.B. and Rozanov, A.Yu. (2005)Microfossils, biominerals and chemical biomarkersin meteorites. In: R.B. Hoover, R. Paepe and A.Yu. Rozanov (Eds), Perspectives inAstrobiology, Vol. 366 NATO Science Series: Life and Behavioural Sciences. IOS Press,The Netherlands, pp. 1–18.
Hoover, R.B., Hoyle, F., Wickramasinghe, N.C., Hoover, M.J. and Al-Mufti, S. (1986)Diatoms onEarth, comets, Europa and in interstellar space. EarthMoonPlanets 35, 19–45.
Hoover, R.B., Pikuta, E.V., Wickramasinghe, N.C., Wallis, M.K. and Sheldon, R.B. (2004)Astrobiology of comets. SPIE 5555, 93–106.
Hoyle, F. and Wickramasinghe, N.C. (1980) Comets—a vehicle for panspermia.In:C. Ponnaperuma (Ed.), Comets and the Origin of Life. Reidel, Dordrecht, pp.222–239.
66 R. B. Hoover

Knoll, A. H. and Golubic, S. (1992) Proterozoic and living cyanobacteria. In: M. Schidlowski,S. Golubic and M.M. Kimberley (Eds), Early Organic Evolution: Implications for Mineraland Energy Resources. Springer, Berlin, pp. 450–462.
Oro, J. (1961). Comets and the formation of biochemical compounds on the primitive Earth.Nature 190, 389–390.
Oro J., Mills, T. and Lazcano, A. (1995). Comets and life in the Universe. Adv. Space Res. 15,81–90.
Rasmussen, B. (2000) Filamentous microfossils in a 3,235-million-year-old volcanogenicmassive sulphide deposit. Nature 405, 767–679.
Ruedemann, R. (1918) The paleontology of arrested evolution. N.Y. State Mus. Bull. 196,107–134.
Schidlowski, M. (1988) A 3,800 million-year-old record of life from carbon in sedimentaryrocks. Nature 333, 313–318.
Schidlowski, M. (2001) Carbon isotopes as biogeochemical recorders of life over 3.8 Ga ofEarth history: evolution of a concept. Precambr. Res. 106, 117–134.
Schippers, A, Neretin, L.N., Kallmeyer, J., Ferdelman, T.G., Cragg, B.A., Parkes, R.J. andJorgensen, B.B. (2005) Prokaryotic cells of the deep sub-seafloor biosphere identified asliving bacteria. Nature 433, 861–864.
Schopf, J.W. (1987) ‘‘Hypobradytely’’: Comparison of rates of Precambrian and PhanerozoicEvolution, J. Vertebr. Paleontol. 7, Suppl. 3, 25.
Schopf, J.W. (1992). Tempo and Mode of Proterozoic Evolution in: The Proterozoic Bio-sphere, A multidisciplinary study, (Schopf, J.W. and Klein, C., eds.) Cambridge UniversityPress, New York, p. 596.
Schopf, J.W. (2000). The fossil record: tracing the roots of the cyanobacterial lineage. In:B.A. Whitton and M. Potts (Eds), The Ecology of Cyanobacteria: Their Diversity inTime and Space. Kluwer Academic Publishers, Dordrecht, The Netherlands, pp. 13–35.
Sheldon, R.B. and Hoover, R.B. (2006) Evidence for liquid water on comets. SPIE 5906,5906OE 1–19.
Simpson, G.G. (1944) Tempo and Mode in Evolution. Columbia Univ. Press, New York,pp. 1–237.
Sunshine, J.M., A’Hearn, M.F., Groussin, O., Li, J.-Y., Belton, M.J.S., Delamere, W.A.,Kissel, J., Klaasen, K.P., McFadden, L.A., Meech, K.J., Melosh, H.J., Schultz, P.H.,Thomas, P.C., Veverka, J., Yeomans, D.K., Busko, I.C., Desnoyer, M., Farnham, T.L.Feaga, L.M., Hampton, D.L., Lindler, D.J., Lisse, C.M. and Wellnitz, D.D. (2006)Exposed water ice deposits on the surface of Comet 9P/Tempel 1. Science 311,1453–1455.
Storrie-Lombardi, M.C., Hoover, R.B., Abbas, M., Jerman, G., Coston, J., and Fisk, M.(2006). Probabilistic classification of elemental abundance distributions in Nakhla andApollo 17 lunar dust samples, SPIE 6309, 630906:1–12.
Vernadsky, V.I. (1926) Biosfera, Leningrad, Nauka, pp. 1–24.Vernadsky, V.I. (1998) The Biosphere (Translation by D.B. Langmuir, Revised and Anno-
tated by M.A.S. McMenamin). Copernicus, New York, pp. 1–192.Wallis, M.K. and Wickramasinghe, N.C. (1991) Structural evolution of cometary surfaces.
Space Sci. Rev. 56, 93–97.Walsh, M.M. and Lowe, D.R. (1985) Filamentous microfossils from the 3,500-Myr-old
Onverwacht Group, Barberton Mountain Land, South Africa. Nature 314, 530–532.Whipple, F.L. (1950) A comet model. I. The acceleration of comet Enke. Astrophys. J. 111,
134–141.Whipple, F.L. (1951) A comet model. II. Physical relations for comets and meteors. Astro-
phys. J. 113, 464–474.
Comets, Carbonaceous Meteorites and Biosphere Origin 67

Whipple, F.L. (1963) On the structure of the cometary nucleus. In: B.M. Middlehurst andG.P. Kuiper (Eds), The Moon, Meteorites, and Comets. Univ. of Chicago Press,Chicago, pp. 639–664.
Whitman, W.B., Coleman, D.C. and Wiebe, W.J. (1998) Prokaryotes: the unseen majority.Proc. Natl Acad. Sci. USA 95, 6578–6583.
Wickramasinghe, N.C. and Hoyle, F. (1999) Infrared radiation from comet Hale–Bopp.Astrophys. Space Sci. 268, 379–381.
Zhegallo, E.A., Rozanov, A.Yu., Ushatinskaya, G.T., Hoover, R.B., Gerasimenko, L.M. andRagozina, A.L. (2000) Atlas of Microorganisms from Ancient Phosphorites of Khub-sughul (Mongolia), NASA/TP 209901 (In English and Russian), pp. 1–167.
Zhmur, S.I., Rozanov, A.Yu. and Gorlenko, V.M. (1997). Lithified remnants of microorgan-isms in carbonaceous chondrites. Geochem. Int. 35(1), 58–60.
68 R. B. Hoover

Hierarchical Scale-Free Representation of
Biological Realm—Its Origin and Evolution
Y. N. Zhuravlev and V. A. Avetisov
Abstract In this work we develop the concept of biological referents to analyzethe origin of complexity of biological systems. The concept, as we demonstrate,can be formalized by classes of the objects which constitute hierarchic scale-freepatterning at different levels of biological complexity. By this reason,ultrametric relationships between these classes are assumed to be relevant tothe referent representation. To explore this idea, we realize particular formali-zation of the referent concept including construction of objects and classes,construction of ultrametric space of classes, and description of the ultrametricspace by a field of p-adic numbers. We discuss how a notation ‘‘evolution’’ canbe introduced through ultrametric formalism. An example of ultrametricevolutionary equations is presented. Finally, we demonstrate that differentaspects of the origin and evolution of the Biosphere (such as macroevolutionand development) being verified in the frame of the referent concept acquirenew contours and interpretations.
1 Introduction
Description of evolution of any system is based upon a ‘‘dynamic paradigm’’presupposing formalization of such notions as ‘‘system,’’ ‘‘state of system,’’ and‘‘control function’’ which specifies the ‘‘dynamical law’’ and governs dynamic(evolutionary) trajectories. At first sight, all these notions could be somehowdefined with respect to the biological realm. However, it must be mentionedthat physical description of systems’ dynamics is based upon well-definedprimary elements (e.g., elementary particles, atoms, molecules, etc.) which con-stitute a system and do not transform during the evolution of the system itself.At any instant, the system is completely represented by subsets of the given set
Y. N. ZhuravlevInstitute of Biology and Soil Science, Russian Academy of Sciences, Far Eastern Branch,Vladivostok, Russiae-mail: [email protected]
N. Dobretsov et al. (eds.), Biosphere Origin and Evolution.� Springer 2008
69

of primary elements, and only by them. By contrast, the question concerningexistence of something like a ‘‘primary element’’ of the biological realm remainsto be open, moreover, it is not perfectly understood if it is possible to define‘‘primary elements’’ of the living nature using the reduction principle as used byphysical description of objects and processes in the ‘‘non-living’’ nature.
Nonetheless, let us assume for a moment that primary elements of thebiological realm are somehow definable. In this case the biological evolutioncould be presented as temporal variation of subsets of primary elements andtheir interrelations presenting a current system state. Following the dynamicparadigm, to describe the evolution it is necessary to introduce also a controlfunction, i.e. a system potential. In physical systems, the potential is, forexample, the energy getting minimized. It could be determined on the basisof ‘‘standard’’ (fundamental) interrelations well-established for physical‘‘primary elements.’’ In the biological world, it is not yet possible to find suchan equivalent. Nor it is possible to define, more or less satisfactory, biological‘‘fundamental interrelations’’ and that optimization principle which governs thebiological evolution. Consequently, an application of the dynamic paradigmfor a description of the biological evolution in the form in which this paradigmexists in physics is complicated by the ambiguity of definition of all mainnotions necessary for that.
It has developed historically that the formation of evolutionary ideas inbiology was tightly connected to the species concept (Vorontsov, 1999). Lateron, the place of the species concept was taken up by the population concept(Mayr, 1984). But are these categories able to claim for the role of the primarybiological elements?
During recent decades, many researchers have expressed dissatisfaction withcurrent evolutionary views. Based on the species concept, the synthetic theoryof evolution (STE) dominates this field (Dobzhansky, 1937; Mayr, 1984), whileas many as 20 (and perhaps even more) species concepts have been suggested(see the review in Hey (2001) and the list of species concepts provided byMayden (1997)). In reality, the STE is the most detailed modern theory ofevolution that claims to embrace the entire biological realm; however, its depthand logic appear to be insufficient in terms of integrating the many differentareas of evolutionary research. As documented in many previous publications(long lists of such papers can be found in the following: Gould, 2002; Mayrand Provine, 1980; Vorontsov, 1999; however, also see counterarguments inAyala, 2000; McShea, 2004, and many others), some important aspects ofevolution are not included in the evolutionary synthesis. Notably missing isany consideration of the patterns and processes of evolution among micro-organisms, the problem of mass extinction, and the apparent rapidity of majorradiations.
Scientific progress has led to the identification of further problems with thespecies concept. Recently, Sites and Marshall (2003), after comparing ninemethods of species delimiting, concluded that speciation processes create‘‘fuzzy’’ boundaries, and that all methods will occasionally fail or contradict
70 Y. N. Zhuravlev, V. A. Avetisov

each other. It has been stated that ‘‘the species problem is the long-standingfailure of biologists to agree on how we should identify species and how weshould define the word ‘species’ ’’ (Hey, 2001, p. 326). A number of authorsagree that the word ‘‘species’’ means only a ‘‘category’’ in the taxonomichierarchy; i.e., this term only has any sense in a classificatory context. Similarly,Dupre (2002, p. 428) proposed ‘‘that we should reserve the term species for thebasic units of classification.’’ However, nobody has proposed anything new tooperate in the dynamic world; accordingly, 4 years ago it was noted that: ‘‘Thestudy of evolution now stands at a point comparable with that in the 1930s’’(Carrol, 2002, p. 912).
Presumably, the situation can be explained by the existence of fundamentalmethodological biases in a number of general concepts that underlie evolutionaryviews.Nevertheless, it seems obvious that a single additional concept of species orpaper criticizing the STE will not prove to be decisive in this regard. We need anewworldview and a new organization of our knowledge; perhaps even, as statedbyPoli (2001, p. 281), the ‘‘modification of themetaphysics implicit in a large partof contemporary science and philosophy.’’
Thus, it is necessary to admit: (1) that the categories of species and popula-tion, being mostly frequently used in evolutionary constructions, do not suit forthe role of the primary biological elements; (2) that primary biological elementsare far from being so simple as the physical ones, and (3) that different ‘‘primaryelements’’ correspond to different levels of biological systems’ organization.With account for that, we have formulated a concept of biological referents, inaccordance to which the sought ‘‘primary’’ (but not simple) elements of thebiological realm are presented by the referents. Being organized in variousconfigurations, these referents determine the structure of life and its parts,whereas their interactions with each other and with environments determinethe processes that are generally interpreted as the evolution of life.
2 Identification of Referents
Many biologists and philosophers, including M. Conrad, S. Salthe, andH. Pattee (e.g., Eldredge and Salthe, 1984; Pattee, 1995; and the detailed reviewin Rocha, 2001) have appealed to the terms reference and referent, but nosystematic analysis of the biological realm has been undertaken on this basis.
The referent concept accepted here is based on the definition from theAmerican Heritage Dictionary that considers a referent as: 1. Something thatrefers, especially a linguistic item in its capacity of referring to a meaning.2. Something referred to.
We will restrict this chapter to the consideration of physically tangiblereferents and attempt to show that, in contrast to the species concept, thereferent concept is capable of answering the following questions: (1) ‘‘whatdoes the word ‘referent’ mean,’’ and (2) ‘‘how should we identify referents?’’
Hierarchical Scale-Free Representation of Biological Realm 71
Moreover, the term ‘‘referent’’ can be used in a description of the total diversityof the systems and structures that represent the existing biological realm;however, before reaching this goal, we must clarify many points.
As the dictionary definition is too broad to be used in the field of materialreferents of life structure, it is modified as follows:
A referent is the simplest element of a certain set of elements that can beconsidered as a basic element of the set.
Following this definition, the material world as a whole and any individualsubdivision of this world can be considered as a referent. This definitionremains too broad but it is suitable for the purpose of this chapter.
The clearest referents are organisms; however, even these referents requirevery careful consideration, as all biological referents are neither strictly dis-crete nor identical. Cells are referents when they are individual organisms;however, the cells that make up the tissue of a multicellular organism are onlyparts of this organism, yet, only the organism is a referent that belongs to thehigher level. Generally, we cannot consider, for example, a muscle as a set ofcells because neither the muscle nor its cells are discrete and individualentities. Genes can be considered as referents because of their discrete nature;however, to be consistent with the above definition, we must endow geneswith the capability to form sets. This problem will be discussed further in thefollowing subsection.
If we accept Koestler’s (1967) holon concept, then holons of the same levelcan be considered as referents in a given holonic set; however, it should be madeclear that while every holon set is constructed of referents, there are manyreferent sets that are not holonic in nature. The significant difference betweenholons and referents is that holonic interactions between sub-elements in aholonic set are assigned in advance, whereas the nature of referents in a certainset can be predefined only in the context of the set under consideration; it maydiffer in other contexts. Any referent can simultaneously be a member of two ormore sets or any sequence, thus demonstrating the universal, all-penetratingcapability of the referent concept. Moreover, this property of referents makesthem capable of creating the biological realm in all its diversity of structures andinterconnections. One can conclude that the concept of referents is moreuniversal than the species concept because of its applicability to any level ofbiological complexity.
2.1 Defining Sets of Referents
According to the above definition of a referent, there are no referents that arecommon to all of the levels of biological complexity, whereas it is possible todistinguish a number of groups of referents or sets of referents that correspondto the levels of complexity and that define the number of such levels. Theproblem of the apportionment of the levels of biological complexity is far
72 Y. N. Zhuravlev, V. A. Avetisov

from trivial (Haken, 1988 (2005, p. 24)), and different researchers use differentnumbers of transitions or levels. Thus, Smith and Szathmary (1995) indicatedeight main transitions in evolution, while Michod and Herron (2006) indicatedonly six. As there is no criterion for the assignment of the levels of complexity,the number of levels is generally defined arbitrarily. As a general guideline,some investigators use the assumption that the levels of biological complexitymust be separated in terms of their endogenous cycle rates by one or moreorders of magnitude (Salthe, 2004). As the idea of endogenous cycle rates israther vague, we decided to use an interval of a certain number of orders ofmagnitude to obtain the lowest number of levels of complexity.
As units of matter, referents can be characterized by number, size, andconnections, thereby enabling us to define the sets of referents using any ofthese three characteristics. We start with a definition in terms of size, as it isknown that any increase in differentiation is dependent upon size (Changiziet al., 2002). If we take a molecule as a unit of a certain size, it is possible tocalculate that one simple gene contains about 103–4 of such units (e.g., about 400nucleotides are required for the coding of the 118 amino acids that constitute amolecule of the structural protein of the tobacco mosaic virus). The simplest cellcontains approximately 3 � 102 genes (e.g.,Mycoplasma genitalium, which cangrow and divide under laboratory conditions (Hutchinson et al., 1999), prob-ably possesses between 265 and 350 genes). However, as many as 3 � 104 geneswere identified in the human genome (Claverie, 2001). Most vertebrate animalorganisms consist of about 1010–13 cells, while an average European stateconsists of approximately 107–8 human beings.
Thus, the size difference between referents of different levels represents anumber of orders of magnitude; and a definition on the basis of size provides atrivial result: all of the referents can be subdivided into five groups: molecules,genes, unicellular organisms, multicellular organisms, and communities oforganisms. However, as we will see later in the text, the contents of these groupsare far from trivial.
A definition on the basis of numbers is more difficult, especially for mole-cules and genes. The number of genes is difficult to estimate, especially whengenes are considered as referents of gene sets. This problem stems from ourtradition of considering genes as units at a certain loci of DNA; we then transferthe same terminology to extra-chromosomal genetic elements. According to thedefinition of a referent provided above, we are unable to indicate the genes-referents and sets of genes-referents among ‘‘traditional’’ genes.We are unawareof examples of genes that currently exist independently, and not all researchersagree that such genes existed in the past. Therefore, we face a choice: either weconsider genes as referents and admit to their autonomy to some degree, or weexclude the possibility of their autonomy and reject the reality of a gene level ofreferent complexity. The second alternative appears to be nonsense; however,the first option also requires caution.
One can assert that genes are discrete and thereby autonomous; numerousexperiments in transgenesis provide the best evidence of gene autonomy.
Hierarchical Scale-Free Representation of Biological Realm 73

However, this evidence is deficient: such discrete genes cannot form sets of
genes. To invest the genes with the capability of set-forming, we must consider
the genes as certain pre-organismal units. As a case in point of the (past)
existence of such forms of life, we can consider recent viruses, plasmids, and
similar entities, as they possess a certain autonomy even without being true
organisms; however, this action creates a new domain of genetic units that is
located between true organisms and a pre-biotic form of evolution. This
domain is absent from the most widely known three-domain-based tree of
life (Woese, 1998, 2002; Cavalier-Smith, 2004, and many others). Neverthe-
less, some of scientists with Forterre at the head (see Zimmer, 2006, p. 870)
believe that ‘‘Maybe each of these viruses is a remnant of domain that has
disappeared.’’ This view is in good agreement with the fact that, after mole-
cules, viruses are the most abundant non-cellular entities on Earth (Drake
et al., 2001; Forterre, personal communication 2005; Wommack and Colwell,
2000; Zimmer, 2006). Despite a lack of metabolic apparatus, viruses never-
theless undergo evolution that in some respect is identical to that of some
‘‘true’’ organisms (Noda et al., 2006). The completion of the sequencing of the
Mimivirus genome enables the proposition that this virus lineage could have
emerged prior to the individualization of cellular organisms (Suhre et al.,
2005). Given this understanding, the genes form the sets of genes and repre-
sent the level of gene complexity.Providing ‘‘pre-organismal genes’’ with autonomy and segregating viruses,
phages, viroids, and plasmids into a separate domain, we must consider that
autonomous ‘‘pre-organismal genes’’ existed during the early period of biological
evolution and at that time differed dramatically from recent non-organismal
units that are the result of a billion years of evolution. We must also distinguish
these autonomous units from true genes that are now fused to produce the joined
genomes of organisms, whereby they lost most of their autonomy because they
belong to higher level.This idea appears strange in terms of viruses and plasmids, but a similar
consideration appears self-evident when we consider molecules that existed at
the time of the transition from chemical to biological evolution. As these
molecules are also absent today, we are unable to state that ‘‘these molecules
were precursors of these genes’’; therefore, the problem of estimating the
numbers of molecules–referents also exists.Further defining on the basis of numbers will reveal the fact that the number
of organisms is 2–4 (ormuchmore) orders of magnitude less than the number of
genes. A similar ratio holds true for organisms and societies, as the number of
parts is always greater within a more inclusive whole. Although defining on the
basis of numbers is not so evident as defining on the basis of sizes, it produces
the same referent sets.Assuming that these five meta-sets of referents correspond to at least five
levels of biological complexity, we will attempt to construct the five-level model
of the biological realm.
74 Y. N. Zhuravlev, V. A. Avetisov

3 Referents and Hierarchy of Complexity
3.1 From a Linnaean Hierarchy to the Hierarchy of Complexity
The notion that the biological realm is organized hierarchically was quicklyassimilated by biologists, as biological systems with a hierarchical architecturewere assumed to evolve more rapidly, enable greater stability, and thus befavored by natural selection (Koestler, 1967; Pattee, 1970; Simon, 1962).
Numerous attempts were made to present an accurate picture of thehierarchy of the living world and to show the different types of such a hierarchy.The main results of these investigations were (1) an understanding of thehierarchical structure of many evolutionary systems, (2) the concepts of their‘‘levels’’ of organization, and (3) the rough classification of hierarchies intostructural (constitutive) and functional (associative and control) types (e.g., seeMayr, 1984; Pattee, 1995; Valentine andMay, 1996). Thus, Eldredge and Salthe(1984) considered two types of parallel and partly overlapping hierarchies: one(genealogical) comprising genes, chromosomes, organisms, demes, species, andmonophyletic taxa, and the other (economic or ecological) dealing withmolecules, organelles, cells, tissues, organs, organ systems, organisms, popula-tions, and certain ecological units.
A new wave of interest in hierarchical structures in biology has developed inrecent decades. Recently, the very detail of the sequence, from a molecule togene, nucleus, cell, and so on, right up to species, was constructed to capture theessence of the biological hierarchy (Korn, 2002). However, many additional(and non-universal) explanations were required to understand the novel originimplicit in such a hierarchy (Korn, 2005). At the same time, Gould (2002)proclaimed the need for a hierarchy in which the units are individuals,physically nested one within another. This type of hierarchy is partly related tothe hierarchies of (McShea, 2001; Simon, 1962; Valentine and May, 1996);however, Gould rejected the idea of the dual nature of a biological hierarchyand proposed a single hierarchy of individuals that included genes, cells, multi-cellular organisms, demes, species, and higher monophyletic taxa (Gould, 2002).In his review of Gould’s book, McShea (2004) emphasized difficulties with theidentification of individuals and emphasized that many biological objects, suchas ecological associations ranging frommicrobial mats to ecosystem-scale units,are missing in Gould’s schema. McShea (2001) proposed the use of differenthierarchical constructions in accordance with research programs. This kind ofpluralism is somewhat similar to the pluralism of Ereshefsky (2001) in hisinterpretation of species concepts, but the pluralistic approach is the only wayto conceal our inability to find an adequate solution to the problem. In any case,either ‘‘structural’’ or ‘‘economic,’’ or even ‘‘pluralist’’ types of presentations ofhierarchies, produced surprisingly limited additional knowledge of life complex-ity. As a result, the biological theory has no clear and valid criterion to use inidentifying the levels of the hierarchy of life.
Hierarchical Scale-Free Representation of Biological Realm 75

Simultaneously, different researchers began to call for new ideas for recon-
structing the architecture of life complexity. Thus, it was stated that life systems
and subsystems gravitate toward the level or stratum organization, and can be
described in terms of the holon concept (Honma et al., 1998). A rather long
discussion followed the proposal to segregate two components in the hierarch-
ical structure of organisms: (1) a number of levels when entities are nested
within entities; and (2) a degree of individuation of the top-level entity (for
relevant references, see McShea, 2001; Santelices, 2004; Valentine, 2003; Wu
and David, 2002).A simple complexity pyramid composed of the various molecular
components of the cell (genes, RNAs, proteins, and metabolites) was presented
to introduce the idea of network organization in the cell hierarchy (Oltvai and
Barabasi, 2002). Notably, as declared in the title of the paper, ‘‘Life’s complex-
ity pyramid,’’ the authors avoided a description of species and higher taxa levels
in life’s complexity. It is necessary to draw attention to the fact that a species is
an important element ofmany hierarchical constructions, and this might lead to
the failure of reconstructions. Despite the fact that the species concept operates
successfully and possesses the power of prediction inmany fields of evolutionary
biology, it contains serious weaknesses, and onemight anticipate the appearance
of a new worldview that incorporates all of the achievements of the STE and
numerous phenomena that are currently outside the realm of this concept
(Vorontsov, 1999). To achieve this goal, it is necessary to revise our views of
the structure of the biological realm in respect of the central position of the
species (Fig. 1a). This revision, which we call for, does not involve the complete
rejection of all of the species concept-based knowledge and achievements;
instead, it is aimed at the reorganization of factual material to construct a new
and less contradictory structure of the biological realm. The essence of such a
reorganization is the use of the referent concept and referents as the basic
Fig. 1 Two logics ofdescriptions of biologicalrealm: species-definedschema with the species inthe central position (a) andreferent-defined down-upschema (b)
76 Y. N. Zhuravlev, V. A. Avetisov

elements of more complex sets that comprise all of the divisions and subdivisions
of the biological realm (Fig. 1b)
3.2 Two Directions in the Architecture of Complexity
Many researchers have refuted the idea that the main evolutionary transitions
occur in a linear sequence (McShea, 2001;McShea and Changizi, 2003;Michod,
1997; Michod and Herron, 2006; Turchin, 1977, and numerous references
therein). Valentine (2000) reconsidered the simple and well-established fact that
relatively few genes are needed to generate high levels of morphological complex-
ity, and emphasized that such a complexity is generated in a combinatorial way,
whereby each gene is used many times in many different combinations. Woese
(1998, 2002) repeatedly turned to the idea of a collective mode of cellular
evolution by considering that the diversity of cellular designs evolve simulta-
neously. Woese also emphasized that ‘‘only global invention arising in a diverse
collection of primitive entities is capable of providing the requisite novelty’’
(Woese, 2002, p. 8746).However, no biologist has attempted to apply these ideas to the entire diversity
of the biological realm or to locate the layers of complexity on the basis of their
structural, combinatorial, and emergent connections.To make such a presentation in the context of referent conception, we first
constructed a model with two (up-ward and orthogonal) directions in the
architecture of complexity. This model includes five levels of complexity that
correspond to sets of referents discussed earlier (Sect. 2.1). We concentrate on
the three central levels because the lowest and highest levels can be partly
associated with chemical and social types of evolution that demand special
considerations. The model also shows two main trends (divergence and
convergence) that are involved in the formation of biological complexity. The
processes of divergence (multiplication, mixing, and differentiation) produce
the diversity of referents of lower level of complexity (LLC), while those of
convergence (recombination and integration) create referents of higher level
of complexity (HLC). The model is required to satisfy the following conditions.
1. The common structural elements of referents are present at all levels ofcomplexity and thus ensure succession and continuity.
2. The architecture of the model permits multiplication, mixing, and differen-tiation at every level of complexity to produce the material required for bothdiversity and integration.
3. The integration of referents of the LLC (rather than direct gradualtransition) enables the transition between two adjacent levels of complexityto be accompanied via an increase in complexity.
4. Both forward and backward transitions between the levels have correspond-ing thresholds that control the probability of transitions.
Hierarchical Scale-Free Representation of Biological Realm 77
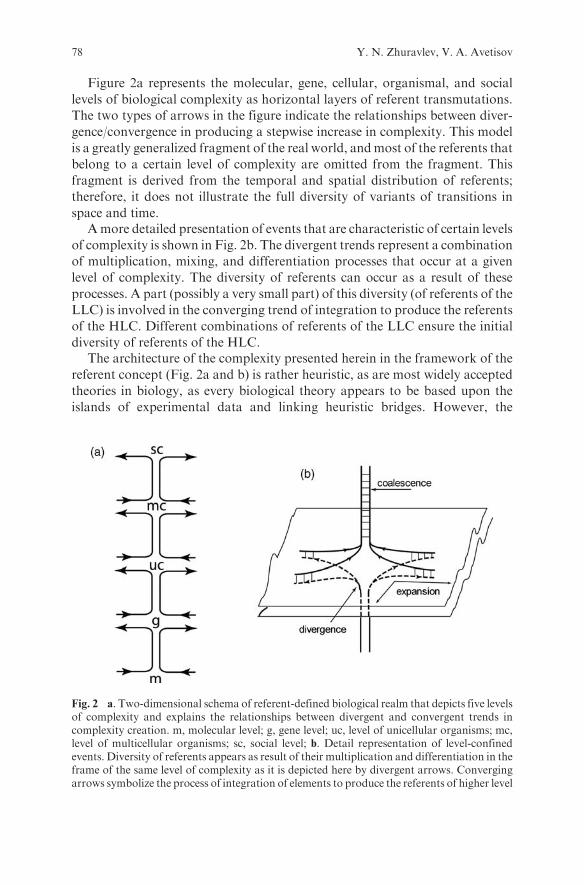
Figure 2a represents the molecular, gene, cellular, organismal, and social
levels of biological complexity as horizontal layers of referent transmutations.
The two types of arrows in the figure indicate the relationships between diver-
gence/convergence in producing a stepwise increase in complexity. This model
is a greatly generalized fragment of the real world, andmost of the referents that
belong to a certain level of complexity are omitted from the fragment. This
fragment is derived from the temporal and spatial distribution of referents;
therefore, it does not illustrate the full diversity of variants of transitions in
space and time.Amore detailed presentation of events that are characteristic of certain levels
of complexity is shown in Fig. 2b. The divergent trends represent a combination
of multiplication, mixing, and differentiation processes that occur at a given
level of complexity. The diversity of referents can occur as a result of these
processes. A part (possibly a very small part) of this diversity (of referents of the
LLC) is involved in the converging trend of integration to produce the referents
of the HLC. Different combinations of referents of the LLC ensure the initial
diversity of referents of the HLC.The architecture of the complexity presented herein in the framework of the
referent concept (Fig. 2a and b) is rather heuristic, as are most widely accepted
theories in biology, as every biological theory appears to be based upon the
islands of experimental data and linking heuristic bridges. However, the
Fig. 2 a. Two-dimensional schema of referent-defined biological realm that depicts five levelsof complexity and explains the relationships between divergent and convergent trends incomplexity creation. m, molecular level; g, gene level; uc, level of unicellular organisms; mc,level of multicellular organisms; sc, social level; b. Detail representation of level-confinedevents. Diversity of referents appears as result of their multiplication and differentiation in theframe of the same level of complexity as it is depicted here by divergent arrows. Convergingarrows symbolize the process of integration of elements to produce the referents of higher level
78 Y. N. Zhuravlev, V. A. Avetisov

referent concept is broader than the STE paradigm because it includes amassiveamount of data on microorganisms and non-organismal units that remainbeyond the scope of the STE.
The core of our concept refers to those elements whose reality has been provenor can be proven. Important processes proposed for divergent/convergenttrends, such as multiplication, mixing, differentiation, and integration, havebeen demonstrated in numerous experiments, and many can be observed withthe naked eye. Of course, the integration is most intriguing because the novelty(as an acknowledged source of complexity) has its origin in the integration.Therefore, the referent concept states that the novelty emerges as a new entitydue to the re-association of pre-existing entities. Some roots of this idea can befound in Alexander’ publication (Alexander, 1920), while integration in dynamicsystems was foretold by Turchin (1977), and many striking examples of integra-tion in biology have been known for a long time: lichens of symbiotic origin(Schwendener, 1869), corals (see the references in Hatcher, 1997), eukaryoticorganisms (Kozo-Poljansky, 1925; for a more comprehensive recent review, seeCavalier-Smith, 2004), allopolyploids and polyploid complexes in higher plants(see the review by Stebbins, 1950), and the multiple nature of the karyotypes(see the review by Ayala and Colluzi, 2005). Additional proof of integrationcan be found in the steadily increasing volume of information regarding theintrogression of mtDNA in animals (Arnold, 1997; Harrison, 1990), as well asevidence of the reorganization and fusion of chromosomes in the Arabidopsisgenome (Schoof et al., 2002) and other data on genome fusion and lateral genetransfer in the origin of eukaryotes that has been recently demonstrated anddiscussed (Omelchenko et al., 2003; Rivera and Lake, 2004; Simonson et al.,2005). Evidence for the chimerical origin of genetic code has been discussedelsewhere (Zhuravlev, 2002).
Taken together, these data supports the idea that the succession of level-specificevents prescribed by the referent concept was important in the development ofbiological systems on Earth.
3.3 Transition Thresholds and the Irreversibility of Transition
In Fig. 2a, we used vast meta-sets to obtain the minimal number of layers ofcomplexity that was desirable for the primary description. We also expectedthat in such generalized layers of complexity, the criterion for level segregationwould be found. In fact, a clear structural difference between levels was found inthis study; however, one further criterion related to the transition thresholdmust be considered here. It is of a probabilistic nature, and the value of thethreshold is expected to increase during differentiation because of the intuitiveexpectation that the deepest differentiation produces the referents separatedby the highest threshold. The integration of such divergent referents is related tothe task of overcoming significant thresholds.
Hierarchical Scale-Free Representation of Biological Realm 79

Let us make this evident via the example of transition from the gene level tothe organismal level. Consider the transition that is represented by the integra-tion (fusion) of five genes that each consist of 30 nucleotides that correspond tofive very simple proteins of about 10 amino acid residues. The probability of theorigin of unique sequences of nucleotides, p, (inverse value of the number ofrealizations) for every gene (in the context of genetic code) will be 4–30 for everyseparate gene (R1–R5); however, for a fusion of five genes, we have the productpfus:
pfus ¼Y5i¼1
p ¼ 4�5�30
The value 4–150 is vanishingly small. To overcome such a combinatorialthreshold, a specific strategy of transition is required. We consider that thisstrategy actually exists because such combinatorially inconceivable transitionshave been realized in terrestrial life.
It is necessary to emphasize that the probability of accomplishing reversetransitions out of the HLC references into the initial configuration of the LLCreferents is also vanishingly small, as this transition requires the selection of aspecific initial configuration from a combinatorially huge number of alterna-tives. Even if some examples of recapitulation are established, the reversetransformation is commonly simply impossible when a significant part of theLLC traits are lost after integration and differentiation at the HLC level. Theevidence of the occurrence of such losses during referent transmutations can beobtained from the example of the very complicated fate of mitochondrial genesthat originated within the �-proteobacteria. A number of ancestral bacterialgenes have now been transferred from the mitochondrial to the nuclear genomeat very specific conditions that appear to be irreproducible today (Anderssonet al., 2003). The recent finding that sequence loss and cellular simplification arecommon modes of evolution (Kurland et al., 2006) can also be interpreted asevidence of such irreversibility.
The evidence of the irreversibility of transition discussed above is in closeagreement with the thesis that ‘‘macroevolution is more than repeated rounds ofmicroevolution’’ (for a history of this topic, see Erwin, 2000).
4 Formalization of the Referent Representation
4.1 Space of the Referent Signs
On the basis of the above-described ideas, we are going to construct such adescription of referents in which sets of signs characterizing low-level referentsare embedded into a set of signs characterizing high-level referents. A hierarchyof such embeddings will correspond to the hierarchy of referents.
80 Y. N. Zhuravlev, V. A. Avetisov

Let us introduce N sets of symbols, Si, i = 1,. . .,N, each of those includesp symbols si;k 2 Si; k ¼ 0; 1; :::; p� 1 ( p is a prime number, for furtherconvenience). Let each symbol si,k be interpreted as a sign of a referent of thelevel i. Let us introduce pN of sequences of symbols X ¼ s0:::s�;k:::sN;k
� � xð Þbeing
read left to right, where s0 complements the symbol sets Si, i.e., it is common forall symbol sequences X.
Let us introduce a hierarchy of partitions of the set {X} to subsetsR�;k; 0 � � � N, so that each subset R�,k includes all sequences coinciding(from the left) up to the symbol s�,k, inclusive, and only these ones. The R�,ksubsets make up a nesting hierarchy, R�þ1;k � R�;k;[R�þ1;k ¼ R�;k. Let thehierarchy of the R�,k subsets be matched to the hierarchy of referents accordingto the following rule. Let us match the referent of the ‘‘zero level’’ to the R0-setconsisting of all pN sequences with the common (the first from the left) sign s0and matching, therefore, a space of the referent signs. The set R0 is a conjuga-tion of p non-intersecting subsets R1,k, k = 0,1,. . .,p–1, each of pN-1 sequenceswith two coinciding signs: s0 and s1. Let us match to each of p subsets R1,k thereferent of the first level. Then, let us match each of the R1,k subsets as aconjugation of p non-intersecting subsets R2,k, each including pN-2 sequences,and let us match to each of p2 subsets R2,k the referents of the second level.Further, let us continue this partitioning procedure until the level � = N onwhich each subset RN,k includes only one sequence. Thus, the sequences of thelength N being the carriers of total sets of referent signs are associated with themost ‘‘complex’’ referents whose description demands for the largest set ofindividual signs. Referents of the lower level are identified by smaller sets ofindividual signs.
A class of objects (sequences) constructed in this way forms a space ofreferent signs (a RS-space) with a topology of embeddings. On the RS-space,a metrics could be introduced and defined as follows: a distance d(X,Y) betweensequencesX andY which coincide left up to the symbol s�;k� inclusive is equal topN–�. The introduced distance satisfies to the strong triangular inequality,d X;Yð Þ � max d X;Zð Þ; d X;Zð Þf g, and consequently, the RS-space is anultrametric space by construction. In the RS-space, there is an ultrametricsphere of the radius pN–� corresponding to each referent of the � -level.
For numerical description of the RS-space, let us use the field of p-adicnumbers, Qp, which is natural for ultrametric spaces. Each element of thequotient set Qp
�B� ðB� ¼ x : jxj � pN��ð Þ, i.e., an ultrametric sphere of radius
pN–�, is matched to the particular referent of the level � (Fig. 3).
4.2 Evolutionary Equation
The evolutionary equation on the RS-space is constructed by the following way.Let us assume that the evolution of referents, i.e., variation of their distributionin the space of referent signs, is performed by means of ‘‘reproduction’’ of
Hierarchical Scale-Free Representation of Biological Realm 81
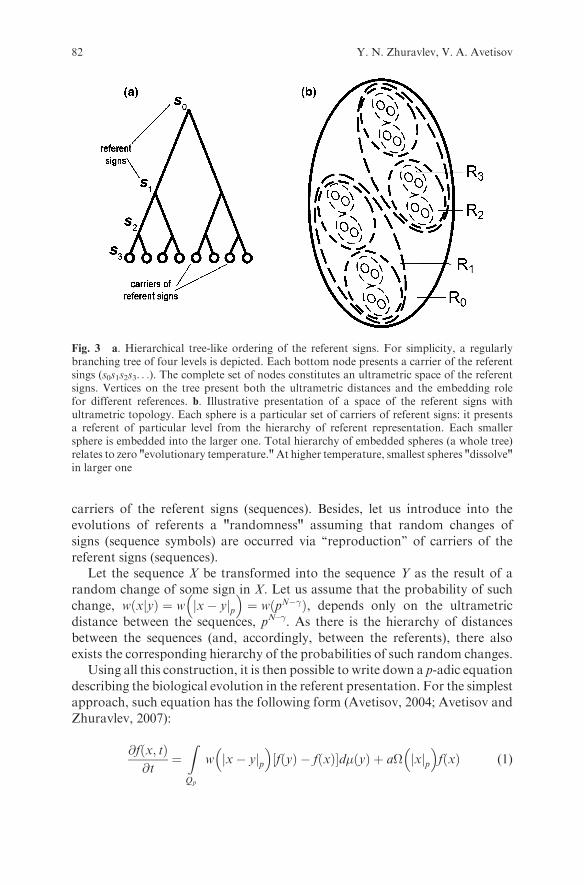
carriers of the referent signs (sequences). Besides, let us introduce into theevolutions of referents a "randomness" assuming that random changes ofsigns (sequence symbols) are occurred via ‘‘reproduction’’ of carriers of thereferent signs (sequences).
Let the sequence X be transformed into the sequence Y as the result of arandom change of some sign in X. Let us assume that the probability of such
change, w xjyð Þ ¼ w jx� yjp� �
¼ w pN��ð Þ, depends only on the ultrametricdistance between the sequences, pN–�. As there is the hierarchy of distancesbetween the sequences (and, accordingly, between the referents), there alsoexists the corresponding hierarchy of the probabilities of such random changes.
Using all this construction, it is then possible to write down a p-adic equation
describing the biological evolution in the referent presentation. For the simplestapproach, such equation has the following form (Avetisov, 2004; Avetisov andZhuravlev, 2007):
@f x; tð Þ@t
¼Z
Qp
w jx� yjp� �
f yð Þ � f xð Þ½ �d� yð Þ þ a� jxjp� �
f xð Þ (1)
Fig. 3 a. Hierarchical tree-like ordering of the referent signs. For simplicity, a regularlybranching tree of four levels is depicted. Each bottom node presents a carrier of the referentsings (s0s1s2s3. . .). The complete set of nodes constitutes an ultrametric space of the referentsigns. Vertices on the tree present both the ultrametric distances and the embedding rolefor different references. b. Illustrative presentation of a space of the referent signs withultrametric topology. Each sphere is a particular set of carriers of referent signs: it presentsa referent of particular level from the hierarchy of referent representation. Each smallersphere is embedded into the larger one. Total hierarchy of embedded spheres (a whole tree)relates to zero "evolutionary temperature." At higher temperature, smallest spheres "dissolve"in larger one
82 Y. N. Zhuravlev, V. A. Avetisov

Here the real-valued function of the p-adic argument x and the time t, f(x,t),is a distribution of carriers of the referent signs at instant t. An integral term inthe right-side of Eq. 1 describes a Markovian random walk over the ultrametricRS-space (ultrametric diffusion). This random process models variation of thereferent sign carriers by means of random changes of the signs themselves. Thesecond term in the right-side of Eq. 1 describes ‘‘reproduction’’ of some set ofcarriers, x 2 Zp, namely those forming a sphere of unity radius with the centrex = 0 in the ultrametric RS-space.
All eigenvalues lj of the right-side operator in Eq. 1 excluding the maximaleigenvalues lmax = l1 can be shown (Avetisov and Zhuravlev, 2007; Avetisovet al., 2002; Avetisov et al., 2003) to be negative. The maximal eigenvalue lmax ispositive or equal to zero, and, in the latter case, lmax is the spectrum accumulationpoint. By lmax>0, the distribution f(x,t) gets with time localized on the RS-spacearea, in which the reproducible carriers of signs are found. However, if lmax= 0,the distribution f(x,t) evolves to homogeneous distribution over the RS-space.
For our purposes, it is sufficient to estimate the conditions for the existenceof the positive value of lmax. Let us examine the case when the probability forrandom changes of the sign carriers decreases exponentially with the number ofthe hierarchy level on which these random changes take place:w jx� yjp� �
¼ p���; � > 0. Then, if �<1, the distribution of the sign carrierstends to be homogeneous. Since in this case, the distribution is not compact, nosubsets of the referent signs and, consequently, the referents themselves may bedistinguished in any bounded area of the RS-space. In other words, the refer-ents have no identity, and referent representation lacks a hierarchical structure.
When �>1, the distribution of the sign carriers always tends to get localizedover some bounded area of theRS-space. The larger is the value of the parametera, the narrower is the distribution localization area. This area can be understoodas a subset of the carrier signs and, consequently, of the referents correspondedto this subset, which has been evolutionary distinguished from others carriers ofsigns. In other words, the referents get identified on the RS-space.
4.3 Growing of the Referent Hierarchy
It is of interest, how the referent hierarchy grows in course of evolution. Todescribe this picture, it is convenient to introduce the notion of ‘‘evolutionarytemperature’’ T � Tc=� (Tc is the ‘‘critical temperature,’’ the meaning of whichis clarified below). The value of the parameter � increases, the evolutionarytemperature decreases.
Let the evolutionary temperature at the beginning be high, i.e.,T > Tc 0ð <�<1). As it has been mentioned above, in this case the distributionof the sign carriers tends to be homogeneous on the RS-space, no subset ofcarriers is distinguished, all carriers could be referred to as referents of ‘‘zero’’complexity level and, therefore, there is no referent hierarchy. If the
Hierarchical Scale-Free Representation of Biological Realm 83

evolutionary temperature T decreases, then, just below the value Tc, the dis-tribution of the sign carriers is localized in some bounded area of the RS-space.Since the space is ultrametric, the area is an ultrametric sphere with a finiteradius containing reproducible carriers of the ‘‘zero’’ level referents. Generally,just below the critical value Tc the RS-space ‘‘splits’’ into countable set of non-intersected areas (ultrametric spheres) which cover the whole space of thereferent signs. The splitting of the RS-space into factorized areas (ultrametricspheres) presents all possible ways of evolutional realization of an event which,according to the referent representation, is associated with the appearance ofthe first level in a referent hierarchy.We emphasize that factorized areas presentall potentialities for this ‘‘evolutionary jump.’’ In course of the evolution itself,these potentialities could be implemented only partially.
Thus, just below the critical value Tc the RS-space changes stepwise itstopology. Now it presents a set of factorized subspaces embedded into theRS-space. These subspaces correspond to the referents of the lowest hierarch-ical level, i.e., to the referents distinguished by most common characteristics inthe referent representation.
Such a topology of the RS-space persists until the next threshold of theevolutionary temperature, T1 ¼ Tc ��1, will be reached. Just below this tem-perature threshold, each of the sign carrier subsets, already factorized at highertemperature Tc, ‘‘splits’’ again into a multitude of smaller subsets. In the ultra-metric RS-space, this splitting relates to embedding of spheres of smaller radiusinto the spheres of larger one. Thus, below the ‘‘critical’’ temperature Tc (atwhich the first level arises in the referent hierarchy) there exists one more‘‘critical’’ temperature T1<Tc at which the topology of the RS-space changesstepwise again. Arisen at the first ‘‘evolutionary jump,’’ the ultrametric spheressplit into smaller ultrametric spheres embedded into the first ones, and thetopology of the RS-space now reflects the two-level hierarchy of the referents.
During further decreasing of the evolutionary temperature, the third ‘‘criticaltemperature’’ is passed, and so on. Thereby, in each of the sign subsets factorizedat the previous step, the subsets of the next level in the referent representation arefactorized. Thus, while the evolutionary temperature is decreasing, a hierarchicaltree of referents is growing by serial factorization of the referent signs (Fig. 3).This tree, as it has beenmentioned above, reflects all potentialities for realizationof sequential ‘‘evolutionary jumps’’ leading to emergence of the referent hier-archy. However, in the course of particular evolution only a part of thesepotentialities could be implemented, i.e., the referent presentation of the biolo-gical realm corresponds only to a subtree at the tree of all possible ways of‘‘growing’’ of the referent hierarchy.
And onemore interesting feature of themodel (1) should bementioned. Let usintroduce ‘‘evolutionary barriers’’ H(x,y) connecting them to the probability ofrandom transitions x!y by the relation w jx� yjp
� �� exp �H jx� yjp
� �.T
h i.
Then the above-described picture of ‘‘growing’’ of hierarchical referent tree canbe shown (Avetisov and Zhuravlev, 2007; Avetisov et al., 2003) to arise when thebarrier heights grows proportionally to the hierarchy level �: H jx� yjp
� �� �.
84 Y. N. Zhuravlev, V. A. Avetisov

Such dependence means that the hierarchy of ‘‘evolutionary barriers’’ in themodel (1) should possess a ‘‘scale-free’’ feature.
From this dependence it also follows that there takes place a simple relationbetween the ultrametric distance d x; yð Þ ¼ jx� yjp ¼ p� between the sign car-riers in the RS-space and the heightH(x,y) of an ‘‘evolutionary barrier’’ dividingthem: H jx� yjp
� �� ln p�ð Þ. Let us now mention that p� is the volume of
ultrametric spheres of the radius p�. This volume is a measure, V�, of thosesubsets of signs which represent the referents of the level �, and thereforeH� � lnV�. The last relation means that in the referent representation, thebiological realm can be perceived as a hierarchically organized ‘‘scale-free’’system of ‘‘small worlds.’’
5 Conclusions
In this study, the referent concept was proposed as a means to reconstruct theprincipal architecture of the biological realm and biological complexity. Inpursuing this goal, new pictures of the distribution and connections of the‘‘elementary units’’ of life, referents, were described. Every level of complexityincludes the space where reproduction, mixing, and differentiation togetherlead to the origin of a rich diversity of referents (at the same level of complexity),while the recombination and integration of referents takes place to produce thereferents of the HLC. The proposed hierarchical structure appears to be lesscontradictory than the linear or pyramidal structures presented previously, asno groups of biological referents are outside this hierarchy construction.
A hierarchical structure of referents can be described by a class of objectsforming an ultrametric space. These objects can be associated with the sets ofreferent signs being ordered in such way that sets of signs of low-level referentsare embedded into set of signs of high-level referents. The hierarchy of suchembeddingswould correspond to the referent hierarchy. For the space of referentsigns constructed in such way, it is possible to introduce an evolutionary equa-tion and to describe a ‘‘growing’’ of the hierarchical architecture of biologicalcomplexity.
Although the idea of ‘‘transitions’’ marking the integration of existingsystems into a metasystem was suggested by Turchin as long ago as in 1977, itremains unpopular among biologists and is rarely referred to. Some scientistswho are actively working on the problems of transition state and biologicalcomplexity are even convinced that ‘‘we should not expect any one model tocover everything’’ (Michot and Herron, 2006). In contrast, we believe that thereferent approach is valid for the multi-purpose generalization of evolutionaryevents. We understand that such a wide-ranging concept is vulnerable tocriticism, especially at its early stages of development. Nevertheless, the firstevidence of the validity of the referent concept was demonstrated in this presentchapter (the capacity of concept to comprise all the sets of the biological realm;
Hierarchical Scale-Free Representation of Biological Realm 85

the demonstration of the specific and modular design of levels of complexity; a
new view of the molecular and gene levels). We expect that the concept will be
useful for solving the problem of ‘‘error catastrophe’’ (Avetisov and Zhuravlev,
2007), for the phylogenetic presentation of individual development (Zhuravlev
et al., in preparation), and other evolutionary applications.
Acknowledgment The work was partly supported by the Program of Presidium of RAS‘‘Origin and Evolution of Biosphere’’ Project No. 04-1-�25-035 FEB RAS and by grantNSH 6923-2006.4 ‘‘Leading Schools of Thought’’ of President of Russian Federation.
V. A. Avetisov is thankful to the COST-D27 program for the partial support of this workthrough the Russian-EU scientific collaboration in the field of the origin of life and evolution.
Yu. N. Zhuravlev is grateful to Prof. E. Ya. Frisman, and Dr. L. N. Vasiljeva for theirhelpful discussion of these issues, and to Dr. Elena Sundukova for her excellent assistance onthe all stages of manuscript preparation.
References
Alexander, S. (1920) Space, Time, andDeity, vol. 2.Macmillan, London (cited byKorn 2005).Andersson, S.G., Karlberg, O., Canback, B. and Kurland, C.G. (2003) On the origin of
mitochondria: a genomics perspective. Phil. Trans. R. Soc. Lond. B 358, 165–177.Arnold, M.L. (1997) Natural Hybridization and Evolution. Oxford University Press,
New York.Avetisov, V.A. (2004) Origin of biological homochirality: in search of evolutional dynamics.
In: G. Palyi, C. Zucchi and L. Calglioty (Eds), Progress in Biological Chirality. Elsevier,Amsterdam, pp. 3–12.
Avetisov, V.A., Bikulov, A.H., Kozyrev S.V. and Osipov, V.A. (2002) p-Adic models ofultrametric diffusion constrained by hierarchical energy landscapes. J. Phys. A: Math.Gen. 35, 177–189.
Avetisov, V.A., Bikulov, A.H. and Osipov, V.A. (2003) p-Adic description of characteristicrelaxation in complex systems. J. Phys. A: Math. Gen. 36, 4239–4246.
Avetisov, V.A. and Zhuravlev Yu.N. (2007) An evolutionary interpretation of the p-adicultrametric diffusion equation. Doklady Math. 75, 453–455.
Ayala, F.J. (2000) Debating Darwin. Biol. Phil. 15, 559–573.Ayala, F.J. and Coluzzi, M. (2005) Chromosome speciation: humans, Drosophila, and
mosquitoes. Proc. Natl Acad. Sci. 102 (Suppl. 1), 6535–6542.Carroll, R.L. (2002) Evolution of the capacity to evolve. J. Evol. Biol. 15, 911–921.Cavalier-Smith, T. (2004) Only six kingdoms of life. Proc. Roy. Soc. Lond. B 271, 1251–1262.Changizi, M.A., McDannald, M.A. and Widders, D. (2002) Scaling of differentiation in
networks: nervous systems, organisms, ant colonies, ecosystems, businesses, universities,cities, electronic circuits, and Legos. J. Theor. Biol. 218, 215–237.
Claverie, J.-M. (2001) What if there are only 30 000 human genes? Science 291, 1255–1257.Drake, L.A., Choi1, K.-H., Ruiz, G.M. and Dobbs, F.C. (2001) Global redistribution of
bacterioplankton and virioplankton communities. Biol. Invasions 3, 193–199.Dupre, J. (2002) Hidden treasure in the Linnean hierarchy. Biology and Philosophy 17,
423–433.Dobzhansky, T. (1937) Genetics and the Origin of Species. Columbia University Press,
New York.Eldredge, N. and Salthe, S.N. (1984) Hierarchy and evolution. Oxford Surv. Evol. Biol.
1, 184–208.
86 Y. N. Zhuravlev, V. A. Avetisov

Ereshefsky, M. (2001) The poverty of the Linnaean hierarchy: a phylosophical study ofbiological taxonomy. Cambridge University Press, New York.
Erwin, D.H. (2000) Macroevolution is more than repeated rounds of microevolution. Evol.Dev. 2, 78–84.
Gould, S.J. (2002) The structure of evolutionary theory.HarvardUniversity Press, Cambridge.Haken, H. (1988) Information and Self-organization. A macroscopic Approach to Complex
Systems. Second enlarged edition. URSS, Moskwa, Russian translation, 2000.Harrison, R.G. (1990) Hybrid zones: windows on evolutionary process. Oxford Surv. Evol.
Biol. 7, 69–128.Hatcher, B.G. (1997) Coral reef ecosystems: how much greater is the whole than the sum of
the parts? Coral Reefs 16(Suppl.), S77–S91.Hey, J. (2001) The mind of the species problem. Trends Ecol. Evol. 16, 326–329.Honma, N., Abe, K., Sato, M. and Takeda, H. (1998) Adaptive evolution of holon networks
by an autonomous decentralized method. Appl. Math. Comp.. 91, 43–61.Hutchinson, C.A., Peterson, S.N., Gill, S.R., Cline, R.T., White, O., Fraser, C.M.,
Smith, H.O. and Venter, J.C. (1999) Global transposon mutagenesis and a minimalmycoplasma genome. Science 286, 2165–2169.
Koestler, A. (1967) The Ghost in the Machine. Arkana. The Penguin Group, London.Korn, R.W. (2002) Biological hierarchies, their birth, death and evolution by natural selec-
tion. Biol. Phil. 17, 199–221.Korn, R.W. (2005) The Emergence Principle in Biological Hierarchies. Biol. Phil. 20, 137–151.Kozo-Poljansky, B.M. (1925) New Principle in Biology. Studies on the Symbiogenetic
Theory. Voronesh (in Russian).Kurland, C.G., Collins, L.J. and Penny, D. (2006) Genomics and the irreducible nature of
eukaryote cells. Science 312, 1011–1014.Mayden, R.L. (1997) A hierarchy of species concepts: the denouement in the saga of the
species problem. In: M.F. Claridge et al. (Eds), Species: the Units of Biodiversity.Chapman & Hall, London, pp. 381–424.
Mayr, E. (1982) The Growth of the Biological Thought. Harvard University Press, Belknap.Mayr, E. and Provine, W.B. (1980) The Evolutionary Synthesis. Harvard University Press,
Cambridge.McShea, D.W. (2001) The minor transitions in hierarchical evolution and the question of a
directional bias. J. Evol. Biol. 14, 502–518.McShea, D.W. (2004) A Revised Darwinism. Biol. Phil. 19, 45–53.McShea, D.W. and Changizi, M.A. (2003) Three puzzles in hierarchical evolution. Integr.
Comp. Biol. 43, 74–81.Michod, R.E. (1997) Cooperation and conflict in the evolution of individuality. 1. Multilevel
selection of the organism. Am. Naturalist 149, 607–645.Michod, R.E. and Herron, M.D. (2006) Cooperation and conflict during evolutionary
transitions in individuality. J. Evol. Biol. 19, 1406–1409.Noda, T., Sagara, H., Yen, A., Takada, A., Kida, H., Cheng, R.H. and Kawaoka, Y. (2006)
Architecture of ribonucleoprotein complexes in influenza A virus particles. Nature 439,490–492.
Oltvai, Z.N. and Barabasi, A.-L. (2002) Life’s complexity pyramid. Science 298, 763–764.Omelchenko, M.V., Makarova, K.S., Wolf, Y.I., Rogozin, I.B. and Koonin, E.V. (2003)
Evolution of mosaic operons by horizontal gene transfer and gene displacement in situ.Genome Biol. 4, R55.
Pattee, H.H. (1970) The problem of biological hierarchy. In: C.H.Waddington (Ed.), Towardsa Theoretical Biology, Edinburgh University Press, Edinburgh, Vol. 3, pp. 117–136.
Pattee, H.H. (1995) Evolving self-reference: matter, symbols, and semantic closure. Comm.Cogn.-Artif. Intell. 12, 9–27.
Poli, R. (2001) The basic problem of the theory of levels of reality. Axiomathes 12, 261–283.
Hierarchical Scale-Free Representation of Biological Realm 87

Rivera, M.C. and Lake, J.A. (2004) The ring of life provides evidence for a genome fusionorigin of eukaryotes. Nature 431, 152–155.
Rocha, L.M. (2001) Evolution with material symbol systems. Biosystems 60, 95–121.Salthe, S.N. (2004) The spontaneous origin of new levels in a scalar hierarchy. Entropy
6, 327–324.Santelices, B. (2004) Mosaicism and chimerism as components of intraorganismal genetic
heterogeneity. J. Evol. Biol. 17, 1187–1188.Schoof, H., Zaccaria, P., Gundlach, H., Lemcke, K., Rudd, S., Kolesov, G., Arnold, R.,
Mewes, H.W. andMayer, K.F. (2002) MIPSArabidopsis thalianaDatabase (MAtDB): anintegrated biological knowledge resource based on the first complete plant genome. Nucl.Acids Res. 30, 91–93.
Schwendener, S. (1869) Die Algentypen der Flechtengonidien. Basel.Simon, H.A. (1962) The architecture of complexity: Hierarchic Systems. Proc. Am. Phil. Soc.
106, 467–482.Simonson,A.B., Servin, J.A., Skophammer, R.G., Herbold, C.W., Rivera,M.C. andLake, J.A.
(2005) Decoding the genomic tree of life. Proc. Natl Acad. Sci. 102(Suppl. 1), 6608–6613.Sites, J.W. and Marshall, J.C. (2003) Delimiting species: a Renaissance issue in systematic
biology. Trends Ecol. Evol. 18, 462–470.Smith, J.M. and Szathmary, E. (1995) TheMajor Transitions in Evolution. OxfordUniversity
Press, Oxford.Stebbins, G.L. (1950) Variation and Evolution in Plants. Columbia University Press, New
York.Suhre, K., Audic, S. and Claverie, J.M. (2005) Mimivirus gene promoters exhibit an unpre-
cedented conservation among all eukaryotes. Proc. Natl Acad. Sci. 102, 14689–14693.Turchin, V. (1977) The Phenomenon of Science. A cybernetic approach to human evolution.
Columbia University Press, New York. Russian translation, 1993.Valentine, J.W. (2000) Two genomic paths to the evolution of complexity in bodyplans.
Paleobiology 26, 513–519.Valentine, J.W. (2003) Architectures of biological complexity. Integr. Comp. Biol. 43, 99–103.Valentine, J.W. andMay, C.L. (1996) Hierarchies in biology and paleontology. Paleobiology
22, 23–33.Vorontsov, N.N. (1999) The Development of Evolution Idea in Biology. Progress-Traditsia-
Press, Moscow.Woese, C. (1998) The universal ancestor. Proc. Natl Acad. Sci. 95, 6854–6859.Woese, C.R. (2002) On the evolution of cells. Proc. Natl Acad. Sci. 99, 8742–8747.Wommack, K.E. and Colwell, R.R. (2000) Virioplankton: viruses in aquatic ecosystems.
Microbiol. Mol. Biol. Rev. 64, 69–114.Wu, J. and David, J.L. (2002) A spatially explicit hierarchical approach to modeling complex
ecological systems: theory and applications. Ecol. Modell. 153, 7–26.Zimmer, C. (2006) Did DNA come from viruses? Science 312, 870.Zhuravlev, Yu.N. (2002) Two rules of distribution of amino acids in the code table indicate
chimeric nature of the genetic code. Dokl. Biochem. Biophys. 383, 85–87.
88 Y. N. Zhuravlev, V. A. Avetisov

The Prebiotic Phase of the Origin of Life
as Seen by a Physical Chemist
V. N. Parmon
Abstract It is shown that the main sufficient distinction of living matter fromnonequilibrium abiogenic chemical systems seems to be the existence of abiological memory which allows the natural selection and thus an adaptiveevolution of living systems. The known carriers of that biological memory in thecurrently existing terrestrial living systems are only the DNA molecules.However, the existence of a primitive ‘‘memory’’ without a DNA support ischaracteristic of autocatalytic systems having the properties of chemicalmutation of autocatalysts. For this reason such autocatalytic systems can beconsidered as a real abiogenic predecessor of life on prebiotic Earth. The mostinteresting among the known autocatalytic systems with the ‘‘mutation’’properties appears to be the Formosa reaction, i.e., autocatalytic aqueoussynthesis of monosaccharides from formaldehyde in the presence of calciumhydroxide. One can expect that the Formosa reaction could initiate theabove-mentioned prebiological evolution resulting in appearance of ribosewhich is known as a key element of both RNA and DNA molecules.
The first natural question that arises when physical chemists begin to discuss theorigin of life is the possibility of a correct enough physicochemical definition ofthe phenomenon of life. Indeed, according to the opinion expressed since thesecond half of the nineteenth century by a great Marxist philosopher FriedrichEngels, the biological form of the motion of matter is qualitatively morecomplicated and is therefore not reducible to the simpler forms of themovement of matter, like chemical and physical ones (Engels, 1935). However,there is no doubt that any individually considered chemical processes in livingorganisms strictly obey all the laws of traditional physical chemistry.
What is the principal distinction between organic and inorganic matter?Unfortunately, we cannot offer a precise physicochemical definition of the
V. N. ParmonBoreskov Institute of Catalysis, Novosibirsk, Russiae-mail: [email protected]
N. Dobretsov et al. (eds.), Biosphere Origin and Evolution.� Springer 2008
89
phenomenon of life, although there are dozens and even hundreds of variousdefinitions of the phenomenon. Nevertheless, there are few extremely signifi-cant elements of such definitions which were given at different times by promi-nent specialists and are important in terms of physical chemistry.
According to Engels, who voiced the opinion of materialist scholars of thelate nineteenth century, life is a mode of existence of proteins marked by anexchange with the environment. As time passed, this definition became consider-ably more specific. An important event was the establishment in the 1950s of thecrucial role of DNA, which proved even more important than that of proteins.But as far as physical chemists were concerned, the key role belonged to thesupplement provided by I. Prigogine and P. Glensdorf, who found that fromthe point of view of nonequilibrium thermodynamics, living organisms can beconsidered as self-organizing dissipative structures that exist only in conditionswhich are far from equilibrium due to the existence of reasonable flows ofmatterand energy through a system (Glensdorf and Prigozhin, 1973). In the 1960s,M. Eigen proved that the properties of living systems should be demonstrated bythe so-called hypercycles on the basis of autocatalytic systems possessing abiological information storage and transmission mechanism (Eigen, 1971).
These points of view determine the foundation of the biochemical andbiophysical approaches to the study of the phenomenon of life (Rubin,1999). In the past decades, life was identified as a phenomenon coupledeverywhere with the DNA and its possible evolutionary predecessor, RNA.Both classes of these complex biopolymers are capable of self-replication and,in consequence, the reproduction (or replication) of living organisms, and,because of errors of the replication, this leads to mutations that in the longrun create the possibility of natural selection and the progressive or adaptiveevolution of living species.
An analysis of these and many other definitions of the phenomenon of lifeprompts the conclusion that its principal physicochemical attributes include:
1. phase individuality of living systems;2. the functioning of these systems via existence of an exchange of matter and
energy with the environment;3. the ability of the living systems for replication, that is, self-reproduction; and4. the capacity of living systems for irreversible adaptive evolution (bymeans of
the natural selection).
It is well known that the first attribute can be found in many equilibrium self-organizing systems in inorganic nature. A case in point is the spontaneousformation of emulsion micelles and supramolecular structures from moleculesof large enough size.
The second attribute also does not belong exclusively to living systems.Indeed, any heterogeneous or microheterogeneous catalyst also exchangesmatter and energy with its environment, because catalytic transformationstake place only through the formation of catalytic intermediates, which emergein the course of interaction of the active centers of the catalysts and the
90 V. N. Parmon
substance of initial chemical reagents (and products), provided there is a
thermodynamic driving force for a resulting overall catalytic process. This
force is constituted by the thermodynamic affinity of the catalyzed reaction,
that is, its thermodynamic nonequilibricity.The capacity for self-replication is also a well-known phenomenon in inor-
ganic nature. It is demonstrated, for example, by crystalline solids, a negligibly
small primer of which leads, in thermodynamically permitted conditions, to the
growth of a phase identical to the primer phase. The capacity for self-replication
is usually associated with the so-called autocatalytic properties. It is found in
the above-mentioned micelles and microemulsions in conditions of their
thermodynamic stability as the quantity of the high-molecular compound that
forms them increases. Note that, naturally enough, neither micelles nor
crystals nor autocatalytic systems can ever be placed in the category of living
systems.We see that the real qualitative difference between the phenomenon of life
and inorganic nature is the capacity of living systems for adaptive irreversible
evolution. Such evolution is a result of multistage natural selection and leads to
ever more complex objects which retain all the attributes of the living objects
listed above. On Earth, Homo sapiens is considered to be the crown of natural
selection in the course of such evolution of living systems.The capacity for irreversible adaptive evolution is organically determined by
the ‘‘biological memory’’ of living systems, because any changes that appear as a
result of mutations are built onto an already existing system and are fixed with
the help of the genetic apparatus, which has a chemical nature. The possibility
of reversion in the course of evolution is a rare exception which only confirms
the rule, as is always the case. The unique role of DNA and RNA, with which
the phenomenon of life (on Earth at least) is now closely associated, is deter-
mined by the fact that in the current conditions, these molecules can be con-
sidered as a material carrier of biological memory.The uniqueness of DNA and RNA properties caused an extremely serious
difficulty in all modern theories of the origin of life. Indeed, assuming that life
is impossible without DNA and RNA, one has to recognize that the phenom-
enon of life on Earth appeared only when the first functioning molecule of
this type appeared on our planet. Attempts to estimate the possibility of
spontaneous self-assembly of such a complex biopolymer in a ‘‘broth’’ even
saturated with all the necessary chemical components led to a vanishingly
small value and, therefore, an unrealistically long time required for the for-
mation of molecules of the most primitive biological information carriers,
RNA, in the course of random chemical interactions. This is why even such
dedicated materialists as biochemists are inclined to accept the theory of an
extraterrestrial origin of life, for example, through the arrival of ‘‘seeds’’ of
life, RNA or DNA molecules, with meteorites, in spite of an evident under-
standing that panspermia does not solve the problem and just moves it to
another place.
The Prebiotic Phase of the Origin of Life 91

The currently predominant theories of the natural origin of life on Earth (the
theory of Oparin–Holdane–Bernal on the self-organization of high-molecular
substance into coacervates;Miller’s theory on the formation of the predecessors
of biomolecules as a result of strong physical impacts such as UV irradiation or
lightnings on the proatmosphere and the protoocean; Kaufmann’s theory on
the evolution-induced phase transition as molecules become more complex;
etc.) do not even predict the natural emergence of RNA and DNA. Therefore,
the main mystery of the origin of life boils down to the question of whence the
first functioning RNAmolecules, the most primitive known biological informa-
tion storage and carriers, appeared.In other words, in terms of chemistry or physical chemistry, the key issue when
considering the origin of life is the possibility of finding an even simpler system
than RNA or DNA that could retain their chemical prehistory and support an
unidirectional, that is, progressive evolution of its properties through chemical
changes in the carriers of the information about such a prehistory. Identification
of such systems could solve the mystery of the origin of the first RNA and then
DNA, since in the presence of progressively evolving chemical systems, RNA and
DNA molecules could be a consequence of such evolution and not the origin of
the phenomenon of life that is perceived as a much more complex event.Curiously enough, in the last decades it was discovered that a capacity for
monodirectional chemical evolution could be found among simple enough
chemical systems that have no separate carriers of biological information.Some studies (Ebeling et al., 1990; Parmon, 2001, 2002a,b) have shown that
even in the simplest chemically reactive system, which contains mutually noninter-
acting autocatalysts, the phenomenon of natural selection leading to the adaptive
irreversible evolution of autocatalysts inevitably emerges if the autocatalysts
compete for the same type of ‘‘food’’ and the food niche becomes smaller.It is very easy to explain why the ‘‘natural selection’’ appears in such systems.
Assuming that the transformations of autocatalysts Xi proceed under the
simplest scheme of their replication:
RþXi !ki
k�i2Xi;
Xi!kti P; (1)
whereR is an original substratum—a feedstock; P is a product of the death of
the autocatalyst; and ki, k–i and kti are the rate constants of the relevant steps of
the transformation.When a preset concentration [R] of food is maintained in the system, it is easy
to find the stationary concentrations [Xi] of autocatalyst Xi by solving the
stationary kinetic equation
d Xi½ �dt¼ ki R½ � Xi½ � � k�i Xi½ �2�kti Xi½ � ¼ 0:
92 V. N. Parmon
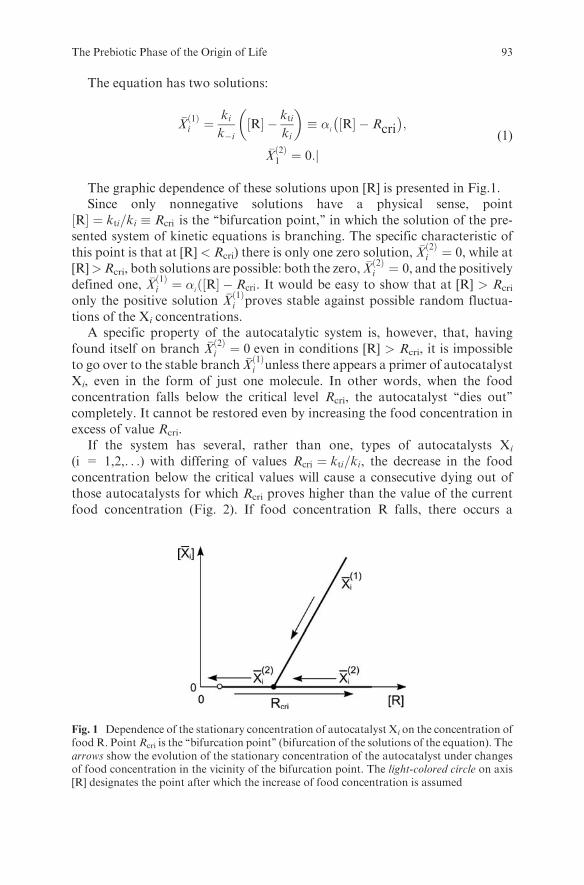
The equation has two solutions:
�X1ð Þi ¼
kik�i
R½ � � ktiki
� �� �
iR½ � � Rcri� �
;
�X2ð Þ1 ¼ 0:j
(1)
The graphic dependence of these solutions upon [R] is presented in Fig.1.Since only nonnegative solutions have a physical sense, point
R½ � ¼ kti=ki � Rcri is the ‘‘bifurcation point,’’ in which the solution of the pre-sented system of kinetic equations is branching. The specific characteristic ofthis point is that at [R] < Rcri) there is only one zero solution, �X
2ð Þi ¼ 0, while at
[R]>Rcri, both solutions are possible: both the zero, �X2ð Þi ¼ 0, and the positively
defined one, �X1ð Þi ¼ �i
R½ � � Rcrið . It would be easy to show that at [R] > Rcri
only the positive solution �X1ð Þi proves stable against possible random fluctua-
tions of the Xi concentrations.A specific property of the autocatalytic system is, however, that, having
found itself on branch �X2ð Þi ¼ 0 even in conditions [R] > Rcri, it is impossible
to go over to the stable branch �X1ð Þi unless there appears a primer of autocatalyst
Xi, even in the form of just one molecule. In other words, when the foodconcentration falls below the critical level Rcri, the autocatalyst ‘‘dies out’’completely. It cannot be restored even by increasing the food concentration inexcess of value Rcri.
If the system has several, rather than one, types of autocatalysts Xi
(i = 1,2,. . .) with differing of values Rcri ¼ kti=ki, the decrease in the foodconcentration below the critical values will cause a consecutive dying out ofthose autocatalysts for which Rcri proves higher than the value of the currentfood concentration (Fig. 2). If food concentration R falls, there occurs a
Fig. 1 Dependence of the stationary concentration of autocatalyst Xi on the concentration offood R. PointRcri is the ‘‘bifurcation point’’ (bifurcation of the solutions of the equation). Thearrows show the evolution of the stationary concentration of the autocatalyst under changesof food concentration in the vicinity of the bifurcation point. The light-colored circle on axis[R] designates the point after which the increase of food concentration is assumed
The Prebiotic Phase of the Origin of Life 93

consecutive and irreversible (in connection with the disappearance of
‘‘primers’’ even in the form of single molecules) dying out of all the auto-catalysts characterized by the highest Rcri ¼ kti=ki values. This means that in
the system, there occurs a strictly unidirectional (towards the decrease in
parameter Rcri) natural selection of the autocatalyst population, which corre-
sponds to the presence of a biological memory prototype. It is easy to show
(Parmon, 2001) that the physicochemical criterion of such selection proves tobe quite natural for thermodynamics: in the course of the selection, there
survive autocatalysts for which the maximum is their stationary chemical
potential, not just their concentration or total mass. (Note that till now
there is no definite opinion what the quantitative criteria of natural selection
in biology are.)A capacity for such natural selection also belongs to more complicated
autocatalytic systems, which include additional reactions in the scheme of
chemical transformations, e.g., nonautocatalytic metabolic and food assimila-
tion reactions (see, e.g., Parmon, 2002a):
R !Ri
Ri þXi ! 2Xi
Xi !Yi
Yi ! P
(2)
where Ri are the intermediate products of the food assimilation and Yi are
the intermediates of the autocatalyst metabolism.The same capacity for natural selection can also be observed among systems
with slowed down autocatalysis, where autocatalytic replication takes place
under the scheme
Fig. 2 Dependence of the stationary concentration of autocatalyst Xi on the concentration offood R in a system with several autocatalysts. After the food concentration falls to the valuedesignated by the light-colored circle, the subsequent increase in the food concentration is ableto restore only the ‘‘population’’ of autocatalyst X3
94 V. N. Parmon

RþXi !Xi þ Zi
Zi !Xi
Xi ! P
(3)
through the formation of intermediate compounds Zi, etc.A capacity for natural selection with more complicated characteristics can be
found among systems with nonideal replication under which autocatalyst Xi
can generate not only an identical autocatalyst but also another autocatalyst Xj:
RþXi ! 2Xi
RþXi !Xi þXj
RþXj ! 2Xj
RþXj !Xj þXi
(4)
A significant outcome of this analysis is the conclusion that, under periodic
decreases in the food concentration below the critical values, an adaptive
(unidirectional) evolution of the surviving population through the accumula-
tion of chemical ‘‘mutations’’ of autocatalysts Xi begins; that is, there are
changes in the existing molecules of autocatalysts Xj which do not, however,
lose their capacity for the autocatalytic replication. Thus, if the system has,
apart from food R, other compounds capable of a reaction with the autocata-
lyst molecules, such mutation will be constituted by the formation of autoca-
talyst molecules modified by these compounds. In the case of the
transformation scheme considered, such evolution can have only one direction:
towards a decrease in factor Rcri in the newly emergent populations as com-
pared to the populations that survived in the course of the earlier selection steps.
In other words, this means that the evolution of mutating autocatalytic systems
with natural selection is irreversible. There is no doubt that this assertion is
equivalent to that made regarding the consolidation of acquired characters
accumulated in the course of the previous natural selection.The thermodynamically determined ‘‘target’’ and the end outcome of the
development of the most primitive autocatalytic type (1) systems is the trend
towards zero of factor
Fev ¼ Rcri ¼ktiki;
that is, the trend towards zero of the ratio of the ‘‘death’’ and reproduction
rate constants. A similar meaning can be found in the factor of evolution Fev of
more complex autocatalytic systems of type (2)–(4), which comprise additional
steps. Competition for food results in the natural selection of the autocatalyst
populations; only those populations that have the highest stationary chemical
The Prebiotic Phase of the Origin of Life 95

potential values under the preset flow of food are preserved and retain acapacity for a further progressive development.
It is significant that the specificity of the stability of stationary states of theautocatalytic systems under consideration prompts the conclusion that, for anautocatalyst with favorable values of factor Fev to emerge and develop, only asingle primer molecule of such an autocatalyst is sufficient. This indicates that,provided that the chemical evolution of autocatalysts has a determined direc-tion, some of their properties may appear when the outcome of a random eventbecomes fixed. Such an event could be, e.g., the emergence and fixing of acertain optical activity in the autocatalyst populations (Gol’danskii andKuz’min, 1989) from one optically active molecule of the autocatalyst thatwon the competition at an early enough stage of natural selection.
The conclusion that it is possible that the evolution-induced characteristicsare fixed even in primitive autocatalytic systems is important for buildingpossible physicochemical scenarios of the origin of life on Earth. Indeed, itbecomes obvious that strong impacts upon the system (e.g., ionizing or UVradiation or electric discharges on the protoatmosphere model used in theMiller’s classic experiments) could result in a significant, but short, deviationof the system from thermodynamic equilibrium, and therefore they were factorsthat initiated not the process of natural selection itself but mainly mutations(for example, by adding new substituents to the molecules of an existing auto-catalyst) which create the possibility of the emergence of new objects from sucha selection. The mutants with a lowered Fev factor have better chances ofsurvival. For this reason, it is improbable that the objects produced by two ormore consecutive mutations, the first with an increase of factor Fev and thesecond with a decrease, should survive too (that is, evolve to reach the station-ary state of the system).
This assumption is in line with the theory that at the molecular level, anatural selection is possible only in the case of the ‘‘instantaneous’’ acquisitionof additional favorable properties that are able to decrease the ‘‘evolutionfactor’’ Fev. This means, specifically, that many of the enzymes adapted byevolving autocatalytic systems should have abiogenic but already functioninganalogs of many prosthetic centers of currently known enzymes. This conclu-sion has recently been confirmed during attempts to artificially synthesize thefunctioning analogs of such complex redox enzymes as the oxygen-generatingcenters of photosystem II of natural photosynthesis and nonheme oxygenases(Elizarova et al., 2000, 2001).
Thus, the most interesting issue when considering possible scenarios for, andeven modeling the origin of, life on Earth in abiogenic systems is which kind ofabiogenic autocatalytic systems was able to function in a natural environmentof the proto-Earth, thereby triggering the prebiotic natural selection.
In principle, such systems are known. Suitable ones for natural selection inthe primordial broth include the reactions of synthesis of a broad range ofmonosaccharide structures in a water solution of formaldehyde, which is sup-posed to have been widely available on the proto-Earth. These reactions were
96 V. N. Parmon
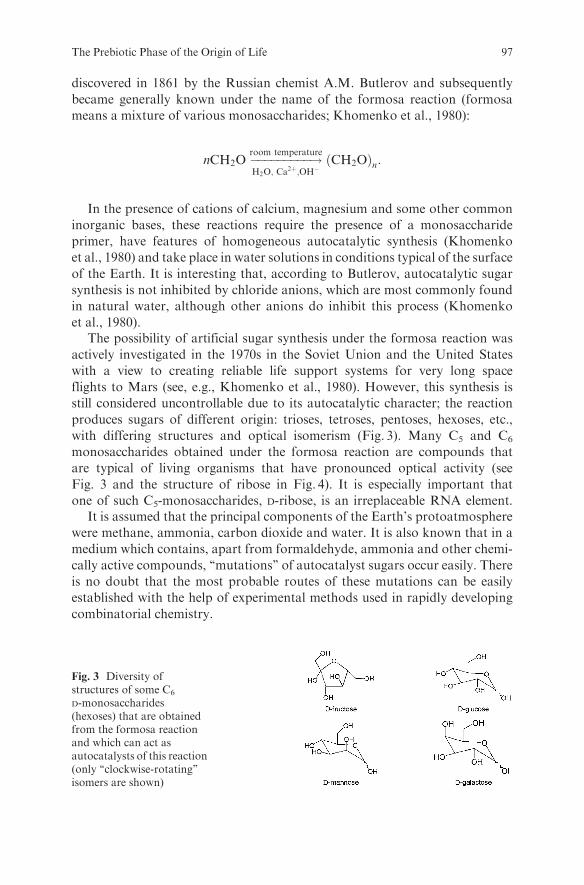
discovered in 1861 by the Russian chemist A.M. Butlerov and subsequently
became generally known under the name of the formosa reaction (formosa
means a mixture of various monosaccharides; Khomenko et al., 1980):
nCH2O ���������!room temperature
H2O; Ca2þ;OH�
CH2Oð Þn:
In the presence of cations of calcium, magnesium and some other common
inorganic bases, these reactions require the presence of a monosaccharide
primer, have features of homogeneous autocatalytic synthesis (Khomenko
et al., 1980) and take place in water solutions in conditions typical of the surface
of the Earth. It is interesting that, according to Butlerov, autocatalytic sugar
synthesis is not inhibited by chloride anions, which are most commonly found
in natural water, although other anions do inhibit this process (Khomenko
et al., 1980).The possibility of artificial sugar synthesis under the formosa reaction was
actively investigated in the 1970s in the Soviet Union and the United States
with a view to creating reliable life support systems for very long space
flights to Mars (see, e.g., Khomenko et al., 1980). However, this synthesis is
still considered uncontrollable due to its autocatalytic character; the reaction
produces sugars of different origin: trioses, tetroses, pentoses, hexoses, etc.,
with differing structures and optical isomerism (Fig. 3). Many C5 and C6
monosaccharides obtained under the formosa reaction are compounds that
are typical of living organisms that have pronounced optical activity (see
Fig. 3 and the structure of ribose in Fig. 4). It is especially important that
one of such C5-monosaccharides, D-ribose, is an irreplaceable RNA element.It is assumed that the principal components of the Earth’s protoatmosphere
were methane, ammonia, carbon dioxide and water. It is also known that in a
medium which contains, apart from formaldehyde, ammonia and other chemi-
cally active compounds, ‘‘mutations’’ of autocatalyst sugars occur easily. There
is no doubt that the most probable routes of these mutations can be easily
established with the help of experimental methods used in rapidly developing
combinatorial chemistry.
Fig. 3 Diversity ofstructures of some C6
D-monosaccharides(hexoses) that are obtainedfrom the formosa reactionand which can act asautocatalysts of this reaction(only ‘‘clockwise-rotating’’isomers are shown)
The Prebiotic Phase of the Origin of Life 97

Provided that thewater solutions contain ions of phosphoric acid, phosphates ofsugar could be formed; in the presence of nitrous bases, this could result in theappearance of universal energy carriers in biological systems, ATP molecules(Galimov, 2001) andRNAprototypes (Fig. 4) that retain the autocatalytic activity.
The possibility that the mechanism of modern biological memory originatedin monosaccharides is also confirmed by the fact that, first, RNA is much lessstable than DNA: RNA is easily decomposed by alkalis to mononucleotides(due to the presence of group 20-OH), whereas the polynucleotide DNA strandsimproved in the course of evolution are stable in the same conditions; and,second, RNA usually comprises a single polynucleotide strand (Khimicheskayaentsiklopediya, 1992). Directly and selectively obtaining ribose diphosphatesfrom glycoaldehyde phosphate implies that early life forms involved not onlyribose-type pentamerous but also hexamerous sugars, which formed pyranosyl-RNA (Eschenmoser, 1999).
One can consider the formosa reaction as a possible candidate for theprogressive natural selection of the living systems’ predecessors in the naturalwater of ancient Earth, because the sugar synthesis through formaldehydecondensation (oligomerization) does not involve the formation of watermolecules. This is why even the high-molecular products of such synthesisare not subject to hydrolysis, unlike polypeptides and proteins. This is extre-mely essential for synthesizing oligomers in lean solutions: due to thermo-dynamic reasons, the hydrolysis of proteins during the latter’s synthesis fromamino acids does not promote the synthesis of such biopolymers in dilutedwater solutions.
Fig. 4 Chemical formulae of the pentamerous monosaccharide D-ribose (D-rib), one of theproduct of autocatalytic synthesis in the formosa reaction, and, as an example, the residue ofone of the ribonucleotides, uridylic acid (U) and its homologous DNA, thymine acid (T), aswell as ATP which is the universal energy carrier in biological systems. The circles in thestructure of Tmark the evolutionary improvements of the biological memory elements underthe evolution of RNA to DNA
98 V. N. Parmon

Small amounts of formaldehyde required for the autocatalytic sugar synth-
esis with subsequent natural selection could form not only under a strong
‘‘physical impact’’ upon the Earth’s protoatmosphere (electric discharges or
UV radiation), but also during thermocatalytic gas transformations in the
reducing protoatmosphere, which had a high methane content when the gases
came into contact with a lava substance with a temperature of 7008C or more.
This substance, which has a high nickel and iron content in the reducing
environment, has pronounced catalytic properties for thermocatalytic steam
methane conversion to synthesis-gas (a mixture of hydrogen and carbon mon-
oxide) and/or formaldehyde:
CH4 þH2O�!>700 8CNi;Fe;lava
CH2Oþ 2H2:
The products of similar thermocatalytic transformations could include other
highly reactive ‘‘building blocks’’ for gradually evolving and increasingly com-
plicated autocatalytic systems, e.g., cyanic acid obtained in the course of the
thermocatalytic methane–ammonia reaction. The most debatable issue here is
the reason why nucleic acids, which are the necessary components and carriers
of the biological information of modern organic objects, were involved in the
processes of natural selection. It could be a natural consequence of the evolu-
tionary addition of nitrogen- and phosphate-containing fragments to the most
primitive autocatalytic oligosaccharide systems already functioning in the
‘‘protobroth,’’ which had passed the early stages of their evolution under
temperatures that were too high for proteins and nucleic acids.Below, there is a list of several general questions that can be answered with
the help of physicochemical analysis of the origin of life phenomenon on the
basis of the above kinetic and thermodynamic analysis of the ‘‘natural’’ selec-
tion of autocatalytic systems.
Prevalent opinion The findings of analysis
Progressive evolution through naturalselection mutations can take place in thepresence of DNA and/or RNA only
Prebiological progressive evolution throughnatural selection can take place withoutDNA and RNA
The ‘‘prebiotic’’ broth was ‘‘fatty’’ (that is,had a high content of the originalcompounds necessary for the synthesis ofbiomolecules)
To initiate prebiotic natural selection, thebroth must be ‘‘lean’’
A living organism is inevitably a ‘‘dissipativestructure’’ (chemical transformations ofthe metabolic cycle should have somenonlinear stages which must be kineticallyirreversible; Rubin, 1999)
At the early stages of evolution, thepredecessors of living organisms need nothave been ‘‘dissipative structures’’ (onlythe stage of ‘‘death’’ must be kineticallyirreversible; Parmon, 2002a)
The Prebiotic Phase of the Origin of Life 99

(continued)
Prevalent opinion The findings of analysis
Even primitive prebiotic structures in naturemust have been formed from complexorganic molecules
The presence of the simplest compound,formaldehyde, was enough to initiatenatural selection
Even the first prebiotic processes are apolycondensation of those organicmolecules whose condensation in watersolution is thermodynamically obstructed
The formation of sugar from formaldehydein water encounters no thermodynamicobstruction
The physicochemical position under discussion makes it possible to simplifymany points of the origin of life that are otherwise difficult to explain. Finally,this analysis allows the formulation of the principal elements of the physico-chemical definition of the phenomenon of life without mentioning the unique-ness of DNA or RNA: life is a phase-isolated form of existence of functioningautocatalysts capable of chemical mutations, which underwent prolonged evolu-tion owing to natural selection.
One can hope that these ideas may prove useful in the discussion of the mostobscure part of prebiotic evolution at the time when life on Earth originated.
Based on the meager data on the kinetics of the formosa reaction, one canassume that in the absence of live ‘‘eaters’’ of mono- and oligosaccharide mole-cules produced by autocatalytic synthesis, the prebiotic phase of natural selec-tion before the appearance of the first RNAwas not excessively long in terms ofgeologic time, occupying only tens of millions rather than billions of years afterthe cooling of the Earth’s surface and the appearance of natural liquid water.Obviously, the chemical evolution of autocatalytic systems in the conditions onEarth was inevitable. This is why the prototypes of living organisms couldappear and disappear repeatedly, and the trend of their natural selection wasdetermined by the chemical composition of the Earth’s surface andwas bound toproduce more or less similar life forms based on RNA and then DNA. In thisway the main features of life on our planet are predetermined.
Indeed, one cannot exclude that the appearance of monosaccharide riboseneeded for the formation of the first RNAwas not the consequence of the abovespoken prototype of the ‘‘natural selection’’ in a ‘‘community’’ of autocatalysts.This can be the case in the situation when there are some still unknown ways ofselective enough synthesis of ribose from formaldehyde and/or its simplestderivatives like C2–C3 monosaccharides.
Recently, we have carried out a wide research which was aimed to find resultsof the ‘‘natural selection’’ in the formosa system in a stationary flow-throughreactor with nearly ideal mode of operation (Simonov, A.N., Pestunova, O.P.,Parmon, V.N., accepted for publication). Unfortunately, we failed to reachsuch formaldehyde concentrations at which the selection starts. It has beenfound that for a change in the selectivity of the formosa reaction to be achieved,one has to either cool the system (and thus to diminish the rate of the formosareaction to consider the reaction as nearly dead) or diminish the starting
100 V. N. Parmon

concentration of formaldehyde below the level of sensitivity of liquidchromatography.
However, simultaneously we have found experimentally that there is theability of a quite selective synthesis of ribose from formaldehyde and C2, C3-monosaccharides in the presence of heterogeneous catalysts like, e.g., naturalmineral apatite, synthetic hydroxoapatite, mineral vivianit or homogeneousphosphates (see Pestunova et al.’s ‘‘Prebiotic Carbohydrates and Their Deri-vates,’’ this book). Note that the presence of phosphates in these catalyticsystems could be able to facilitate a phosphorylation of the sugars and, as aresult, the formation of the first proto-RNA. Anyhow, the consequence of suchsynthesis would be the start of the same progressive evolution of RNA on themolecular level in the ‘‘RNA world.’’
References
Ebeling, W., Engel, A. and Feistel, R. (1990) Physik der Evolutionarozesse.Akademie-Verlag, Berlin.
Eigen,M. (1971) ‘‘Molekulare Selbstorganisation und Evolution’’ (Self organization ofmatterand the evolution of biological macro molecules). Naturwissenschaften 58(10), 465–523.
Elizarova, G.L., Zhidomirov, G.M. and Parmon, V.N. (2000) Hydroxides of transitionmetalsas artificial catalysts for oxidation of water to dioxygen. Catal. Today 58, 71–88.
Elizarova, G.L., Matvienko, L.G., Kuzmin, A.O., Savinova, E.R. and Parmon, V.N. (2001)Copper and iron hydroxides as new catalysts for redox reactions in aqueous solutions.Mendeleev Commun. 11(1), 15–17.
Engels, F. (1935) Dialektik der Natur. Chemical etiology of nucleic acid structure. Marx-Engels Inst. Publ., Moscow.
Eschenmoser, F. (1999) Science 284, 2118–2124.Galimov, E.M. (2001) Fenomen Zhizni (Phenomenon of Life). URSS Publisher, Moscow
(in Russ.).Glensdorf, P. and Prigozhin, I. (1973) Thermodynamic Theory of Structure, Stability, and
Fluctuations. Mir, Moscow (in Russ.).Gol’danskii, V.I. and Kuz’min, V.V. (1989) Spontaneous disturbances in mirror symmetry in
nature and origin of life. Usp. Fiz. Nauk 157(1), 3–50.Khimicheskaya entsiklopediya (Chemical Encyclopedia) (1992) Bol’shaya Rossiiskaya
Entsiklopedia, Moscow, vol. 3, p. 297 (in Russ.).Khomenko, T.I., Sakharov, M.M. and Golovina, O.A. (1980) Hydrocarbon synthesis from
formaldehyde. Usp. Khim. 49(6), 1079–1105 (in Russ.).Parmon, V.N. (2001) Natural selection in a homogeneous system with noninteracting auto-
catalyst ‘‘populations.’’ Doklady Phys. Chem. 377(4), 91–95.Parmon, V.N. (2002a) Physicochemical driving forces and the pattern of selection and
evolution of prebiotic autocatalytic systems. Russ. J. Phys. Chem. 76(1), 126–133.Parmon, V.N. (2002b) The origin of life: The prebiotic phase. Herald Russ. Acad. Sci. 72(6),
592–598.Rubin, A.B. (1999) Biofizika (Biophysics). Knizhnyi Dom ‘‘Universitet’’,Moscow, vols. 1 and
2 (in Russ.).
The Prebiotic Phase of the Origin of Life 101

Prebiotic Carbohydrates and Their Derivates
O. P. Pestunova, A. N. Simonov, V. N. Snytnikov, and V. N. Parmon
Abstract The most significant experimental results on the putative synthesis ofvarious carbohydrates and their derivates from simple substrates in plausibleprebiotic conditions are summarized and discussed. The synthesis of monosac-charides from formaldehyde and lower carbohydrates (glycolaldehyde, glycer-aldehyde, dihydroxyacetone) can be catalyzed by different compounds such aslead, phosphate and borate ions and several natural minerals. Lower carbohy-drates can be directly formed in aqueous formaldehyde solutions under theaction of UV-irradiation. The possible role of carbohydrates and their derivatesin the chemical evolution and development of presumable abiogenic metabo-lism is illustrated as well.
1 Introduction
An abiogenic evolution of chemical compounds on the early prebiotic Earthwas, undoubtedly, the first step of the origin of life. Most likely such evolutionstarted from the simplest substances like H2, CO, H2O, CH2O and HCN whichare widely distributed in the universe (Hudson andMoore, 2004; Litvak, 1972).In the course of evolution, these substances were converted into more complexorganic compounds such as amino acids, carbohydrates, carboxylic acids andsome others which constituted the basis of life.
The presence of aqueous medium could be the most favorable factor forthe prebiotic chemical evolution to start. The first reactions which yieldedcomplex organic compounds from the simple ones might be catalyzed byinorganic substances like metal oxides and salts. There are a number ofalternative theories, with an origin of life based, for example, on proteins(de Duve, 1991), lipids (Segre and Lancet, 1997), inorganic crystals (Cairns-
O. P. PestunovaDepartment of Nontraditional Catalytic Processes, Boreskov Instituteof Catalysis, Novosibirsk, Russiae-mail: [email protected]
N. Dobretsov et al. (eds.), Biosphere Origin and Evolution.� Springer 2008
103

Smith, 1982; Hartman, 1998), FeS–H2S autotrophy (Wachtershauser, 1992),prebiotic organic synthesis under hydrothermal conditions (Simoneit, 2004),methane-hydrate deposits (Ostrovskii and Kadyshevich, 2007) or extraterres-trial sources of life (postponing its origin) (Crick, 1981). However, someexperts suppose carbohydrates to be the major source of the energy-drivingprebiotic metabolism and chemical evolution (Tolstoguzov, 2004; Weber,1997, 2001). Actually, carbohydrates play an inestimable role in the organiclife. Monosaccharides and their derivates constitute the building blocks ofvarious biomolecules like DNA and RNA, ATF, cellulose, chitin and starchwhich are indispensable for the living organisms. From the point of abiogenicchemical evolution, carbohydrates are supposed to be very important as well.The simplest monosaccharides—glycolaldehyde, glyceraldehyde and dihydrox-yacetone—can serve as substrates for further synthesis of amino acids, polyols,aldehydes and carboxylic acids. Higher monosaccharides—hexoses and pen-toses—can also be converted into various organic substances includingheterocycles.
Among all prebiotic carbohydrates the main emphasis is placed on ribose.Indeed, the RNA-world (Gesteland and Atkins, 1993) is the most reasonedhypothesis on the prebiotic chemical evolution and the origin of life. Recently ithas been experimentally proved that some ribonucleic acids possess anenzymatic-like activity (Altman, 1989; Cech et al., 1981). According to themodel, the first molecules of RNA must be present for the chemical evolutionto start (Joyce, 1991).
Thus, the main problem of prebiotic chemistry is the feasible synthesis of theRNA components: D-ribose, pyrimidine or purine bases and phosphoric acid andtheir selective assembly into ribonucleotides and then into a sequence of RNA.
The major obstacle in such RNA synthesis is the availability of D-ribose.Besides, ribose is rather unstable (Larralde et al., 1995). For these reasons someexperts even suggest that the backbone of the first analogs of modern RNAs didnot contain this carbohydrate.
In this paper we focus on possible prebiotic routes to synthesis of carbohy-drates, especially ribose, and their derivates.
To create a model of the prebiotic synthesis of any biosubstance one shoulddetermine the starting point—the first substrates and catalysts. According to thecommon knowledge (Hudson and Moore, 2004; Litvak, 1972), formaldehyde(CH2O), water, ammonia (NH3) and cyanhydric acid (HCN) are the most possi-ble starting prebiotic substrates. The inorganic catalysts like magnesium, calcium,iron and lead oxides, phosphates, borates can be supposed to be available.
2 The Formose Reaction
In 1861, an eminent Russian chemist A.M. Butlerov discovered that boiling ofthe aqueous formaldehyde solution in the presence of calcium and bariumoxides results in the formation of a complex mixture of various carbohydrates
104 O. P. Pestunova et al.
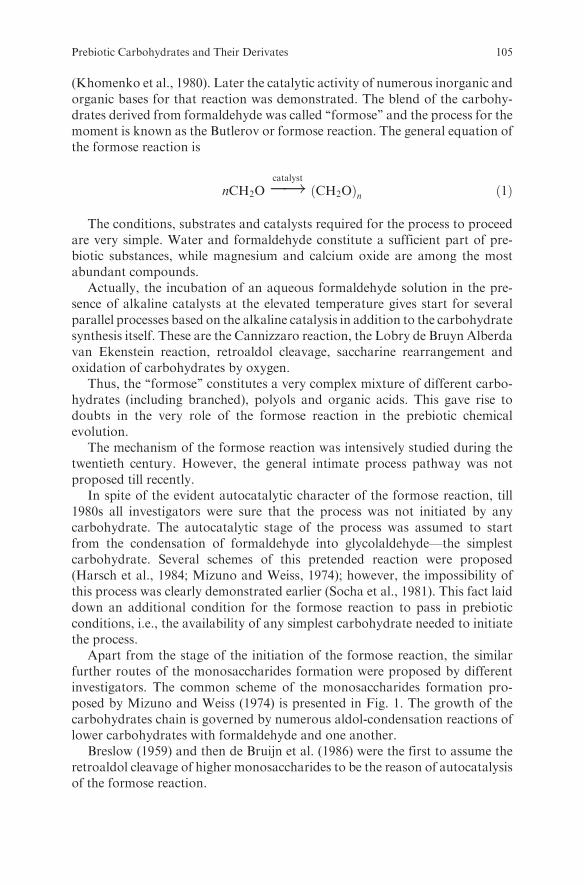
(Khomenko et al., 1980). Later the catalytic activity of numerous inorganic andorganic bases for that reaction was demonstrated. The blend of the carbohy-drates derived from formaldehyde was called ‘‘formose’’ and the process for themoment is known as the Butlerov or formose reaction. The general equation ofthe formose reaction is
nCH2O�!catalyst CH2Oð Þn ð1Þ
The conditions, substrates and catalysts required for the process to proceedare very simple. Water and formaldehyde constitute a sufficient part of pre-biotic substances, while magnesium and calcium oxide are among the mostabundant compounds.
Actually, the incubation of an aqueous formaldehyde solution in the pre-sence of alkaline catalysts at the elevated temperature gives start for severalparallel processes based on the alkaline catalysis in addition to the carbohydratesynthesis itself. These are the Cannizzaro reaction, the Lobry de Bruyn Alberdavan Ekenstein reaction, retroaldol cleavage, saccharine rearrangement andoxidation of carbohydrates by oxygen.
Thus, the ‘‘formose’’ constitutes a very complex mixture of different carbo-hydrates (including branched), polyols and organic acids. This gave rise todoubts in the very role of the formose reaction in the prebiotic chemicalevolution.
The mechanism of the formose reaction was intensively studied during thetwentieth century. However, the general intimate process pathway was notproposed till recently.
In spite of the evident autocatalytic character of the formose reaction, till1980s all investigators were sure that the process was not initiated by anycarbohydrate. The autocatalytic stage of the process was assumed to startfrom the condensation of formaldehyde into glycolaldehyde—the simplestcarbohydrate. Several schemes of this pretended reaction were proposed(Harsch et al., 1984; Mizuno and Weiss, 1974); however, the impossibility ofthis process was clearly demonstrated earlier (Socha et al., 1981). This fact laiddown an additional condition for the formose reaction to pass in prebioticconditions, i.e., the availability of any simplest carbohydrate needed to initiatethe process.
Apart from the stage of the initiation of the formose reaction, the similarfurther routes of the monosaccharides formation were proposed by differentinvestigators. The common scheme of the monosaccharides formation pro-posed by Mizuno and Weiss (1974) is presented in Fig. 1. The growth of thecarbohydrates chain is governed by numerous aldol-condensation reactions oflower carbohydrates with formaldehyde and one another.
Breslow (1959) and then de Bruijn et al. (1986) were the first to assume theretroaldol cleavage of higher monosaccharides to be the reason of autocatalysisof the formose reaction.
Prebiotic Carbohydrates and Their Derivates 105

In the last few years, thorough investigation of the mechanism of the formose
reaction was performed by Simonov et al. (2007a). The extensive evidence on
the kinetics of the formose reaction has shown that the initiation of the formose
reaction by higher monosaccharides (C5–C6) is due to their cleavage with the
formation of two lower carbohydrates (Eq. 2). The key role in this stage isplayed by endiol complexes of higher monosaccharides with calcium ions. The
carbohydrate chain growth is governed by aldol condensation of lower carbo-
hydrates (Eqs. 3 and 4). The autocatalytic nature is caused by the retroaldol
cleavage (2) of higher monosaccharides (C4–C5) formed at stages (3) and (4).
The scheme of the reaction can be described by analogy with the chain mechan-
ism with the confluent branching (2)–(4).
CiH2iOi !þCa OHð Þ2
�2H2OCiH2i�2O
�iCa
� ��!þ2H2O
�Ca OHð Þ2Ci�jH2 i�jð ÞOi�j þ CjH2jOj; ð2Þ
CjH2jOj þ CH2O�!Ca OHð Þ2Cjþ1H2 jþ1ð ÞOjþ1; ð3Þ
CnH2nOn þ CmH2mOm�!Ca OHð Þ2CnþmH2 nþmð ÞOnþm ð4Þ
where i = 4–7, j = 2–4; n, m = 2–5; n þ m < 8.Thus, the formation of monosaccharides from formaldehyde can only start
in the presence of a carbohydrate initiator. Glycolaldehyde is the simplest and
most active one. However, the possibility of its formation and presence on
prebiotic Earth is not evident.
3 Prebiotic Synthesis of Lower (C2–C3) Carbohydrates
Recently, astronomers have discovered a frigid reservoir of glycolaldehyde
molecules in a cloud of gas and dust near the center of our galaxy (Saxton,
2004). Such clouds are considered to be the raw material for the formation of
new stars and planets. The detection of cold glycolaldehyde indicates that a
Fig. 1. Scheme of theformose reaction (Mizunoand Weiss, 1974).C1– formaldehyde,C2– glycolaldehyde,Cn– carbohydrate withn carbon atoms
106 O. P. Pestunova et al.
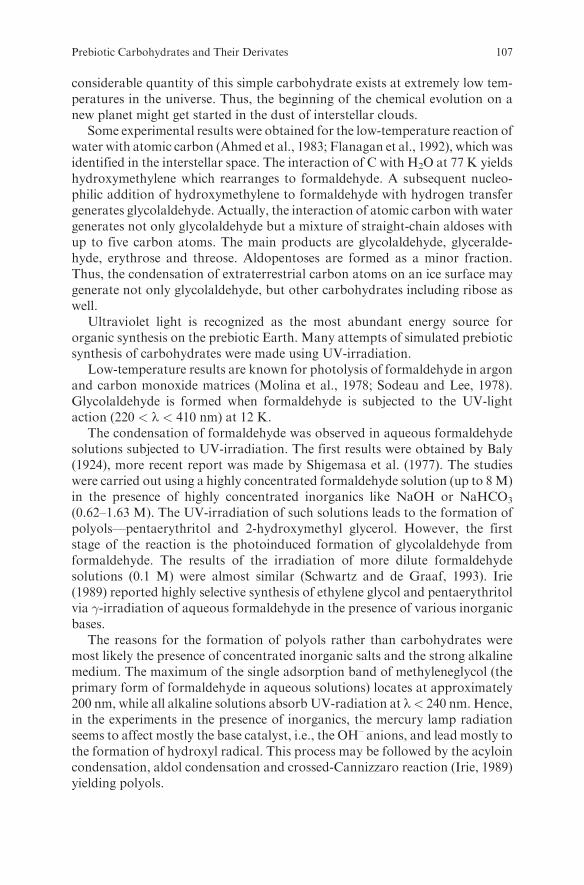
considerable quantity of this simple carbohydrate exists at extremely low tem-peratures in the universe. Thus, the beginning of the chemical evolution on anew planet might get started in the dust of interstellar clouds.
Some experimental results were obtained for the low-temperature reaction ofwater with atomic carbon (Ahmed et al., 1983; Flanagan et al., 1992), which wasidentified in the interstellar space. The interaction of C with H2O at 77 K yieldshydroxymethylene which rearranges to formaldehyde. A subsequent nucleo-philic addition of hydroxymethylene to formaldehyde with hydrogen transfergenerates glycolaldehyde. Actually, the interaction of atomic carbon with watergenerates not only glycolaldehyde but a mixture of straight-chain aldoses withup to five carbon atoms. The main products are glycolaldehyde, glyceralde-hyde, erythrose and threose. Aldopentoses are formed as a minor fraction.Thus, the condensation of extraterrestrial carbon atoms on an ice surface maygenerate not only glycolaldehyde, but other carbohydrates including ribose aswell.
Ultraviolet light is recognized as the most abundant energy source fororganic synthesis on the prebiotic Earth. Many attempts of simulated prebioticsynthesis of carbohydrates were made using UV-irradiation.
Low-temperature results are known for photolysis of formaldehyde in argonand carbon monoxide matrices (Molina et al., 1978; Sodeau and Lee, 1978).Glycolaldehyde is formed when formaldehyde is subjected to the UV-lightaction (220 < l < 410 nm) at 12 K.
The condensation of formaldehyde was observed in aqueous formaldehydesolutions subjected to UV-irradiation. The first results were obtained by Baly(1924), more recent report was made by Shigemasa et al. (1977). The studieswere carried out using a highly concentrated formaldehyde solution (up to 8M)in the presence of highly concentrated inorganics like NaOH or NaHCO3
(0.62–1.63 M). The UV-irradiation of such solutions leads to the formation ofpolyols—pentaerythritol and 2-hydroxymethyl glycerol. However, the firststage of the reaction is the photoinduced formation of glycolaldehyde fromformaldehyde. The results of the irradiation of more dilute formaldehydesolutions (0.1 M) were almost similar (Schwartz and de Graaf, 1993). Irie(1989) reported highly selective synthesis of ethylene glycol and pentaerythritolvia �-irradiation of aqueous formaldehyde in the presence of various inorganicbases.
The reasons for the formation of polyols rather than carbohydrates weremost likely the presence of concentrated inorganic salts and the strong alkalinemedium. The maximum of the single adsorption band of methyleneglycol (theprimary form of formaldehyde in aqueous solutions) locates at approximately200 nm, while all alkaline solutions absorb UV-radiation at l< 240 nm. Hence,in the experiments in the presence of inorganics, the mercury lamp radiationseems to affect mostly the base catalyst, i.e., the OH– anions, and lead mostly tothe formation of hydroxyl radical. This process may be followed by the acyloincondensation, aldol condensation and crossed-Cannizzaro reaction (Irie, 1989)yielding polyols.
Prebiotic Carbohydrates and Their Derivates 107

The UV-irradiation of a pure neutral aqueous formaldehyde solution
has been studied recently (Pestunova et al., 2005). It appears to result
predominantly in the decomposition of formaldehyde into gaseous carbon
oxides, hydrogen and light hydrocarbons. At the same time, glycolaldehyde
and glyceraldehyde are formed in the liquid phase with the registered
maximum yields of 4.2 and 0.18%, respectively. Thus, these results indicate
the possibility of photoinitiated formation of low carbohydrates at stan-
dard conditions in pure aqueous solutions. Note, that neither extremely
low temperatures, nor extraterrestrial substrates, nor energy sources are
needed for the formation of glycolaldehyde from formaldehyde.
4 Selective Prebiotic Synthesis of Carbohydrates
As it was already mentioned, ribose can be generated from formaldehyde
under the catalytic action of Ca(OH)2. Unfortunately, the whole array of
straight-chain and branched oligomers of (CH2O)n is obtained where n = 2,
3, 4, 5, 6... and the maximal content of ribose is 1%. Thus, the classical
autocatalytic Butlerov reaction seems to be judged as a very unlikely prebiotic
source of ribose.Zubay (1998) has reported that the formose reaction in the presence of
magnesium hydroxide suspension at pH 9.4, Pb(II) salts and catalytic amounts
of any intermediate of the prebiotic pentose pathway (for example, dihydrox-
yacetone) yields aldopentoses with up to 30% of the final product. Unfortu-
nately, the analysis in this work was performed by thin-layer chromatography
which is not very reliable for the identification of components of complex
mixtures. It was suggested that Pb2þ ions catalyze the synthesis of glycolalde-
hyde from formaldehyde in the presence of dihydroxyacetone. Zubay has
accepted the mechanism of the catalytic cycle as it was proposed earlier by
Langenbeck (1954). However, we suppose that the catalytic effects of Pb2þ and
Ca2þ cations are analogous and at the reaction conditions used by Zubay, the
classical autocatalytic formose reaction takes place. In this case, the selective
formation of aldopentoses is impossible.The most efficient way to increase the selectivity of the formose reaction is
deceleration of the disproportionation and retroaldol cleavage reactions. It can
be easily achieved by decreasing the pH. The rate of retroaldol cleavage reac-
tions can be decreased by the replacement of calcium by other cations as well.
Since the retroaldol cleavage, which is the source of lower carbohydrates in the
formose system, is excluded, the synthesis of monosaccharides from formalde-
hyde must be performed in the presence of considerable amounts of lower C2–C3
carbohydrates.
108 O. P. Pestunova et al.
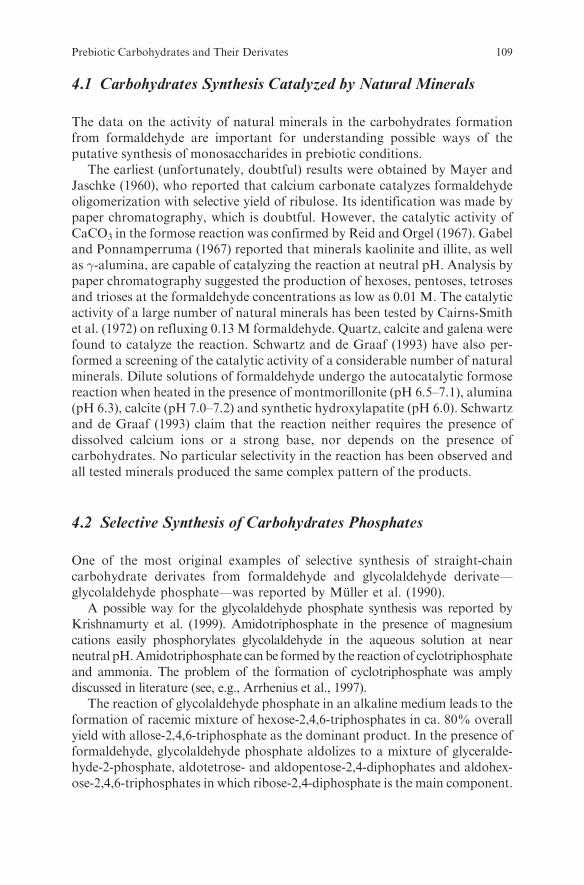
4.1 Carbohydrates Synthesis Catalyzed by Natural Minerals
The data on the activity of natural minerals in the carbohydrates formationfrom formaldehyde are important for understanding possible ways of theputative synthesis of monosaccharides in prebiotic conditions.
The earliest (unfortunately, doubtful) results were obtained by Mayer andJaschke (1960), who reported that calcium carbonate catalyzes formaldehydeoligomerization with selective yield of ribulose. Its identification was made bypaper chromatography, which is doubtful. However, the catalytic activity ofCaCO3 in the formose reaction was confirmed by Reid and Orgel (1967). Gabeland Ponnamperruma (1967) reported that minerals kaolinite and illite, as wellas �-alumina, are capable of catalyzing the reaction at neutral pH. Analysis bypaper chromatography suggested the production of hexoses, pentoses, tetrosesand trioses at the formaldehyde concentrations as low as 0.01 M. The catalyticactivity of a large number of natural minerals has been tested by Cairns-Smithet al. (1972) on refluxing 0.13 M formaldehyde. Quartz, calcite and galena werefound to catalyze the reaction. Schwartz and de Graaf (1993) have also per-formed a screening of the catalytic activity of a considerable number of naturalminerals. Dilute solutions of formaldehyde undergo the autocatalytic formosereaction when heated in the presence of montmorillonite (pH 6.5–7.1), alumina(pH 6.3), calcite (pH 7.0–7.2) and synthetic hydroxylapatite (pH 6.0). Schwartzand de Graaf (1993) claim that the reaction neither requires the presence ofdissolved calcium ions or a strong base, nor depends on the presence ofcarbohydrates. No particular selectivity in the reaction has been observed andall tested minerals produced the same complex pattern of the products.
4.2 Selective Synthesis of Carbohydrates Phosphates
One of the most original examples of selective synthesis of straight-chaincarbohydrate derivates from formaldehyde and glycolaldehyde derivate—glycolaldehyde phosphate—was reported by Muller et al. (1990).
A possible way for the glycolaldehyde phosphate synthesis was reported byKrishnamurty et al. (1999). Amidotriphosphate in the presence of magnesiumcations easily phosphorylates glycolaldehyde in the aqueous solution at nearneutral pH.Amidotriphosphate can be formedby the reaction of cyclotriphosphateand ammonia. The problem of the formation of cyclotriphosphate was amplydiscussed in literature (see, e.g., Arrhenius et al., 1997).
The reaction of glycolaldehyde phosphate in an alkaline medium leads to theformation of racemic mixture of hexose-2,4,6-triphosphates in ca. 80% overallyield with allose-2,4,6-triphosphate as the dominant product. In the presence offormaldehyde, glycolaldehyde phosphate aldolizes to a mixture of glyceralde-hyde-2-phosphate, aldotetrose- and aldopentose-2,4-diphophates and aldohex-ose-2,4,6-triphosphates in which ribose-2,4-diphosphate is the main component.
Prebiotic Carbohydrates and Their Derivates 109
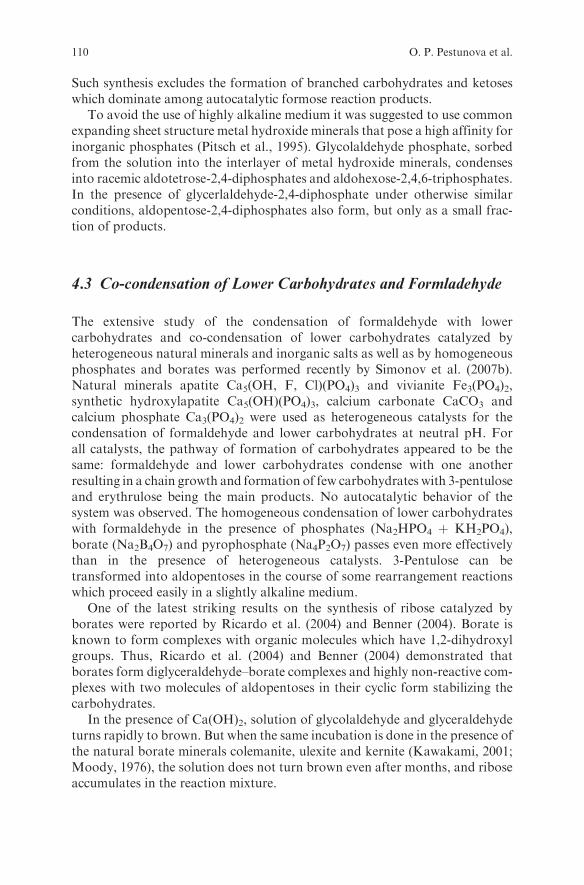
Such synthesis excludes the formation of branched carbohydrates and ketoseswhich dominate among autocatalytic formose reaction products.
To avoid the use of highly alkaline medium it was suggested to use commonexpanding sheet structure metal hydroxide minerals that pose a high affinity forinorganic phosphates (Pitsch et al., 1995). Glycolaldehyde phosphate, sorbedfrom the solution into the interlayer of metal hydroxide minerals, condensesinto racemic aldotetrose-2,4-diphosphates and aldohexose-2,4,6-triphosphates.In the presence of glycerlaldehyde-2,4-diphosphate under otherwise similarconditions, aldopentose-2,4-diphosphates also form, but only as a small frac-tion of products.
4.3 Co-condensation of Lower Carbohydrates and Formladehyde
The extensive study of the condensation of formaldehyde with lowercarbohydrates and co-condensation of lower carbohydrates catalyzed byheterogeneous natural minerals and inorganic salts as well as by homogeneousphosphates and borates was performed recently by Simonov et al. (2007b).Natural minerals apatite Ca5(OH, F, Cl)(PO4)3 and vivianite Fe3(PO4)2,synthetic hydroxylapatite Ca5(OH)(PO4)3, calcium carbonate CaCO3 andcalcium phosphate Ca3(PO4)2 were used as heterogeneous catalysts for thecondensation of formaldehyde and lower carbohydrates at neutral pH. Forall catalysts, the pathway of formation of carbohydrates appeared to be thesame: formaldehyde and lower carbohydrates condense with one anotherresulting in a chain growth and formation of few carbohydrates with 3-pentuloseand erythrulose being the main products. No autocatalytic behavior of thesystem was observed. The homogeneous condensation of lower carbohydrateswith formaldehyde in the presence of phosphates (Na2HPO4 þ KH2PO4),borate (Na2B4O7) and pyrophosphate (Na4P2O7) passes even more effectivelythan in the presence of heterogeneous catalysts. 3-Pentulose can betransformed into aldopentoses in the course of some rearrangement reactionswhich proceed easily in a slightly alkaline medium.
One of the latest striking results on the synthesis of ribose catalyzed byborates were reported by Ricardo et al. (2004) and Benner (2004). Borate isknown to form complexes with organic molecules which have 1,2-dihydroxylgroups. Thus, Ricardo et al. (2004) and Benner (2004) demonstrated thatborates form diglyceraldehyde–borate complexes and highly non-reactive com-plexes with two molecules of aldopentoses in their cyclic form stabilizing thecarbohydrates.
In the presence of Ca(OH)2, solution of glycolaldehyde and glyceraldehydeturns rapidly to brown. But when the same incubation is done in the presence ofthe natural borate minerals colemanite, ulexite and kernite (Kawakami, 2001;Moody, 1976), the solution does not turn brown even after months, and riboseaccumulates in the reaction mixture.
110 O. P. Pestunova et al.

The results by Simonov et al. (2007b) seem to approve the unique stabilizingability of borates. So, the condensation of 5 mM glycolaldehyde and 5 mMglyceraldehyde in the presence of Na2HPO4 and KH2PO4 leads to the formationof erythrose (0.14 mM), threose (0.16 mM), ribose (0.03 mM), arabinose (0.02mM) and fructose (0.03mM).On the other hand the same condensation catalyzedby Na2B4O7 yields much higher amounts of carbohydrates: erythrose (0.31 mM),threose (0.63mM), ribose (0.1mM), arabinose (0.1 mM) and fructose (0.11mM).
Magnesium oxide MgO, which seems to be one of the most abundantprebiotic oxides, appears to be the most efficient catalyst for the condensationof glycolaldehyde and glyceraldehyde. The interaction of lower carbohydratesleads to the formation of fructose (18%), sorbose (23%), ribose (10%) andarabinose (8%) within few hours (our unpublished results).
Alternatively, the direct aqueous aldol reactions of glycolaldehyde andglyceraldehyde are known to be catalyzed by a zinc–amino acid complexunder conditions that are compatible with the expected prebiotic environment(Kofoed et al., 2005). The reaction of glycoaldehyde and glyceraldehyde in thepresence of the Zn-proline complex gives rise to pentoses (62%) with riboseaccounting for about 30% of the pentoses. Ribose and other pentoses areformed by aldol reactions and are stable in aqueous media at room tempera-ture. Kofoed et al. (2005) suggests the catalytically active Zn–amino acidcomplex available in the prebiotic environment.
The mentioned experimental data allow the assumption that ribose might bepresent in reasonable amounts in an early stage of the evolution under expectedprebiotic conditions. Putative routes to further stabilization procedures of thecarbohydrate were also described.
4.4 Putative Prebiotic Synthesis of Carbohydrates fromFormaldehyde
All described possible prebiotic routes to carbohydrate synthesis start from thecomposition of either formaldehyde with lower carbohydrate or just lowercarbohydrates assuming that the presence of the latter is obvious. As it wasconsidered earlier, glycolaldehyde might be formed in terrestrial prebiotic con-ditions under the action of UV-irradiation on aqueous formaldehyde solution.The further condensation of formaldehyde and glycolaldehyde in the presenceof various catalysts leads to the monosaccharide formation. An attempt tocombine these two processes was reported by Simonov et al. (2007b).
The first stage was the irradiation of formaldehyde solution in the presenceof homogeneous phosphates, and the second stage was a reasonable heating ofthe irradiated mixture for the acceleration of the catalytic reaction. After theirradiation, glycolaldehyde and glyceraldehyde were formed in the solution asexpected. Then the catalytic reaction started. 3-Pentulose and erythrulose wereformed from one simplest substrate, formaldehyde, in the course of the
Prebiotic Carbohydrates and Their Derivates 111

described combination of photochemical and catalytic processes in neutralaqueous solution in the presence of dissolved phosphates. Unfortunately, theconditions with the minimal formaldehyde concentration, in comparison withglycolaldehyde and glyceraldehyde concentrations, to synthesize ribose werestill not achieved by Simonov et al. (2007b).
5 Important Prebiotic Organics from Carbohydrates
The prebiotic role of monosaccharides seems not to be limited only to thesynthesis of the RNA precursors and other monosaccharide-based biologicalmolecules. The presence of alcoholic and carboxylic groups in the structure ofmonosaccharides makes them convenient for disproportionation reactionswhich can provide free energy for the synthesis of other prebiotic compounds.In addition, carbohydrates can be substrates for synthesis of amino acids,polyols, carboxylic acids and heterocycles.
5.1 Synthesis of Heterocycles from Carbohydrates and Ammonia
The possibility of the synthesis of different imidazoles, pyrazines and pyridinesfrom carbohydrates and ammonia is well known (Grimmet, 1965; Kort, 1970).In general, the interaction of carbohydrates with ammonia results in the for-mation of a complex mixture of imidazoles, while metal salts are known tocatalyze the reaction. The initial step of that process involves dehydrogenationof an aldose. The dehydrogenation product reacts with ammonia and formal-dehyde to yield imidazole. A number of pyrazine and pyridine compounds arealso formed. The formation of these heterocycles is connected with the trans-formation of, e.g., fructose first to the fructosylamine and then to glucoseamine.The latter condenses to form 2,5-substituted pyrazine.
These processes require rather high temperatures (up to 200oC) and goslowly under milder conditions. However, the model discussed below takesinto account the possibility of the nitrogen heterocycles formation from carbo-hydrates and ammonia.
5.2 A ‘‘Sugar Model’’ by A.L. Weber
The data from a number of investigations by A.L. Weber (Weber, 1998 and ref.therein) resulted in the creation of the so-called ‘‘sugar model’’ (Weber, 2001).The following deduction by Weber (2000) was declared basing on the compar-ison of redox and kinetic properties of carbon groups in order to identify theoptimal biosubstrate: ‘‘Sugars are the optimal biosynthetic carbon substrate of
112 O. P. Pestunova et al.

aqueous life. Carbohydrates contain the maximum number of biosynthetically
useful high energy electrons/carbon atom while still containing a single carbo-
nyl group needed to kinetically facilitate their conversion to useful biosyntheticintermediates.’’
In addition to common substrates like formaldehyde, glycolaldehyde andammonia, the ‘‘sugar model’’ also requires thiols which act as catalysts for the
synthesis of amino acids (Weber, 1998).Fig. 2 shows the reactions of the sugar model. The pathway of the model
starts by aldol condensation of glycolaldehyde with formaldehyde to give
trioses and tetroses (Harsch et al., 1984). Next, �-dehydration of the trioses andtetroses generates the �-ketoaldehydes, pyruvaldehyde and 3-C-hydroxy-
methyl-pyruvaldehyde (Feather and Harris, 1973). In the presence of ammoniaand a thiol, the redox rearrangement of �-ketoaldehydes yields alanine and
homoserine thioesters that either hydrolyze to amino acids or oligomerize topeptides (Weber, 1985, 1998). The energy values in Fig. 2 show that the con-
densation of formaldehyde and glycolaldehyde is energetically favorable butnot irreversible. Both sugar dehydration to �-ketoaldehydes and ketoaldehyde
conversion to amino acids are irreversible. The aldol condensation of glycolal-dehyde with other aldehyde and ketone products of the ‘‘sugar model’’ pathway
could lead to the synthesis of other types of amino acid thioesters.Figure 2 also shows the side reactions. They result in the synthesis of
(a) larger pentose or hexose sugars by aldol condensations (Harsch et al.,
1984), (b) amines by Amadori rearrangements (Kort, 1970), (c) imidazoles,pyrazines and pyridines (Grimmet, 1965; Kort, 1970), (d) acetaldehyde
(Grimmett, 1965), (e) pyruvate (Weber, 2001) and (f) lactate thioester (Weber,1984a,b).
The next step in the development of the ‘‘sugar model’’ was the creation of
possible autocatalytic system in the context of the prebiotic model underdiscussion.
First, imidazole and pyridine products are possible autocatalysts, since theywere shown to catalyze the formose reaction (Gutsche et al., 1967). Second,
ammonia and amines (including amino acids) were shown to catalyze the
formose reaction too and, in addition, a subsequent conversion of sugars to
-3 kcal
+NH3+NH3 +tiol
-12 kcal-H2O
-5 kcal+NH3+tiol
-10 kcal+H2Otrioses &
tetrosesformald. + glycolald.pyruvald.
& CH2OH-pyruvald.
alanine &homoser.thioesters
alanine &homoser.
lagersugars
aminepyrazinespyridines
imidazoles acetald.glyoxal.pyruvate
glyoxylate
lactatethioester
peptides
Fig. 2 The ‘‘sugar model’’ by A.L. Weber
Prebiotic Carbohydrates and Their Derivates 113

carbonyl-containing products. The amine-catalyzed reactions yield glyceralde-hyde, dihydroxyacetone, erythrose, threose, erythrulose, pyruvaldehyde,acetaldehyde, glyoxal, pyruvate, glyoxylate and several unidentified carbonylproducts. Since alanine is synthesized from glycolaldehyde and formaldehydevia pyruvaldehyde (Weber, 1998), the ability of alanine to catalyze the con-version of glycolaldehyde and formaldehyde to pyruvaldehyde indicates thatthe ‘‘sugar model’’ is capable of autocatalysis.
Thus, the ‘‘sugar model’’ by Weber (2001) exhibits several essential charac-teristics of a plausible ‘‘origin of life’’ process. First, the model uses simplecarbon substrates—formaldehyde and glycolaldehyde which are undoubtedlyprebiotic compounds. Second, the ‘‘sugar model’’ can be regarded as autocata-lytic, while the ‘‘one-pot’’ nature of the model facilitates the autocatalysis byhaving the reaction intermediates and catalytic products made in close proxi-mity to one another. Besides, the model generates amino acid thioesters for thepeptide synthesis and consequently it can develop a more sophisticated type ofsequence-dependent catalysis based on polypeptide replication (Lee et al., 1997;Yao et al., 1998). Finally, since the model converts sugar substrates to‘‘biochemicals’’ by carbon redox disproportionation (Weber, 1997), chemicaltransformations of the ‘‘sugar model’’ could develop into modern metabolism(Weber, 2001).
5.3 Synthesis of Cytidine Ribonucleotides on Sugar Phosphate
Although various paths of the syntheses of the nucleic acid bases exist and thepossible ribose prebiotic synthesis has been just discussed, no prebioticallyplausible methods for attaching pyrimidine bases to ribose to give nucleosideshave been described.
No prebiotic condensation of uracil or cytosine with ribose to give nucleo-sides is known. The equilibrium constant for the reaction of ribose with uracil toform uridine has been calculated to be in the region of 10–3 M–1 (Kolb et al.,1994). An alternative route to the pyrimidine nucleosides involving a stepwiseassembly of the nitrogenous base on the sugar has been demonstrated bySanchez and Orgel (1970) but a stereochemical impasse was encountered.
Unique results concerning this problem were reported by Ingar et al. (2003).A process in which the base is assembled in stages on a sugar phosphate canproduce cytidine nucleotides. The sequential action of cyanamide and cyanoa-cetylene on arabinose-3-phosphate produces cytidine-20,30-cyclophosphate andarabinocytidine-30-phosphate (Fig. 3). Both cyanamide and cyanoacetylene arepresumed to be prebiotic compounds and can be produced in reasonable yields(Orgel, 2002; Schimpl et al., 1965). The fact that this conversion proceedsreadily in an aqueous solution at near-neutral pH values suggests that thischemistry is prebiotically plausible.
114 O. P. Pestunova et al.

6 Conclusions
This overview summarizes few most significant results on the putative synthesisof various carbohydrates, in particular ribose and their derivates, from simple
substrates in plausible prebiotic conditions. The described routes of the synthesisof monosaccharides can be formally divided into two groups. The first groupunites synthesis of carbohydrates in the interstellar space initiated by UV-
irradiation or cosmic radiation. The known substrates for these processes areatomic carbon, water and formaldehyde. The second group of possible scenariosof prebiotic carbohydrates synthesis embodies the catalytic processes in theaqueous formaldehyde solutions. In general these processes are the formose
reaction and its various modifications based on the mechanism of the aldol-condensation reactions. The catalytic synthesis of monosaccharides seems to bemore plausible. One cannot expect reasonable yields of carbohydrates for the
processes of the first group because of the presence of free radicals.The synthesis of biologically important monosaccharides from formalde-
hyde, first of all ribose, with increased yields can be catalyzed in plausibleprebiotic conditions by different compounds: lead, phosphate and borateions, several natural minerals (CaCO3, apatites, MgO and others). Higheryields can be achieved when formaldehyde interacts with lower carbohydrates
(glycolaldehyde, glyceraldehyde, dihydroxyacetone), which can be directlyformed in formaldehyde aqueous solutions under the action of UV-irradiation.
The possible role of carbohydrates and their derivates in the chemicalevolution and development of presumable abiogenic metabolism not only as
Fig. 3 Synthesis of cytidine-20,30-cyclophosphate and arabinocytidine-30-phosphate
Prebiotic Carbohydrates and Their Derivates 115

substrates for other ‘‘biochemical’’ substances but also as a source of energy isillustrated as well.
Acknowledgment The financial support of RFBR (Grant No. 05-03-32862), program ofPresidium of RAS ‘‘Origin and evolution of biosphere’’ (Grant RNP.2.1.1.1969) and ‘‘Scien-tific Schools of Russia’’ (Grant No. N.Sh. 6526.2006.3) are gratefully acknowledged.
References
Ahmed, S.N., McKee, M.L. and Shevlin, P.B. (1983) J. Am. Chem. Soc. 105, 3942–3947.Altman, S. (1989) Adv. Enzymol. Relat. Areas Mol. Biol. 62, 1.Arrhenius, G., Sales, B., Mojzsis, S. and Lee, T. (1997) J. Theor. Biol. 187, 503.Baly, E.C.C. (1924) Ind. Eng. Chem. 16, 1016–1018Benner, S.A. (2004) Acc. Chem. Res. 37, 784–797.Breslow, R. (1959) Tetrahedron Lett. 1, C22–C26.de Bruijn, J.M., Kieboom, A.P.G. and van Bekkum, H. (1986) J. Carbohydr. Chem. 5,
561–569.Cairns-Smith, A.G. (1982) Genetic Takeover and the Mineral Origins of Life. Cambridge
University Press, Cambridge.Cairns-Smith, A.G., Ingram, P. and Walker, G.L. (1972) J. Theor. Biol. 35, 601–604.Cech, R.R., Zaug, A.J. and Grabowski, P.J. (1981) Cell. 27, 487.Crick, F. (1981) Life Itself. It’s Origin and Nature. Simon and Schuster, New York.de Duve, C. (1991). Blueprint for a Cell: The Nature and Origin of Life. Patterson, NewYork.Feather,M.S. andHarris, J.F. (1973)Dehydration reactions of carbohydrates. In: R.S. Tipson
and D. Horton (Eds), Advances in Carbohydrate Chemistry and Biochemistry. AcademicPress, New York, 28, pp. 161–224.
Flanagan, G., Ahmed, S.N. and Shevlin, P.B. (1992) J. Am. Chem. Soc. 114, 3892–3896.Gabel, N.W. and Ponnamperuma, C. (1967) Nature 216, 453–455.Gesteland R.F. and Atkins J.F. (Eds) (1993) The RNAWorld. Cold Spring Harbor Labora-
tory, Cold Spring Harbor, NY.Grimmet, M.R. (1965) Rev. Pure Appl. Chem. 15, 101–108.Gutsche, C.D., Redmore, D., Buriks, R.S., Nowotny, K., Grassner, H. and Armbruster,
C.W. (1967) J. Am. Chem. Soc. 89, 1235–1245.Harsch, G., Bauer, H. and Voelter, W. (1984) Kinetik, Liebigs Ann. Chem. 4, 623–635.Hartman, H. (1998). Orig. Life Evol. Biosph. 28, 515–521.Hudson, R.L. and Moore, M.H. (2004) The formation, destruction, and spectra of extra-
terrestrial biological and prebiological molecules. Abstract 35th COSPAR ScientificAssembly, Paris, France (CD-ROM, COSPAR04-A-03541).
Ingar, A.A., Luke, R.W.A., Hayter, B.R. and Sutherland, J.D. (2003) ChemBioChem 4,504–507.
Irie, A. (1989) Carbohydr. Res. 190, 23–28.Joyce, G.F. (1991) New Biol. 3, 399.Kawakami, T. (2001) J. Metamorph. Geol. 19, 61–75.Khomenko, T.I., Sakharov, M.M. andGolovina, O.A. (1980) Russ. Chem. Rev. 49, 570–584.Kofoed, J., Reymond, J. and Darbre, T. (2005) Org. Biomol. Chem. 3, 1850–1855.Kolb, V.M., Dworkin, J.P. and Miller, S.L. (1994) J. Mol. Evol. 38, 549–557.Kort, M.J. (1970) Reactions of free sugars with aqueous ammonia. In: R.S. Tipson and
D. Horton (Eds) Advances in Carbohydrate Chemistry and Biochemistry. AcademicPress, New York, 25, pp. 311–349.
Krishnamurty, R., Arrhenius, G. and Eschenmoser, A. (1999) Orig. Life Evol. Biosph. 29,333–354.
116 O. P. Pestunova et al.

Langenbeck, W. (1954) Angew. Chem. 66, 151.Larralde, R., Robertson, M.P. and Miller, S.L. (1995) Proc. Natl Acad. Sci. USA. 92,
8158–8160.Lee, D.H., Severin, K., Yokobayashi, Y. and Ghadiri, M.R. (1997) Nature 390, 591–594.Litvak, M.M. (1972) Non-equilibrium processes in interstellar molecules. In: T.R. Carson,
and M.J. Roberts (Eds), Atoms and Molecules in Astrophysics. Academic Press, Londonand New York, p. 201.
Mayer, R. and Jaschke, L. (1960) Lieb. Ann. Chem. 635, 145–153.Mizuno, T. and Weiss, A. (1974) Adv. Carbohydr. Chem. Biochem. 29, 173.Molina, L.T., Tang, K.Y., Sodeau, J.R. and Lee, E.K.C. (1978) J. Phys. Chem. 82, 2575–2578.Moody, J.B. (1976) Lithos 9, 125–138.Muller, D., Pitsch, S., Kittaka, A., Wagner, E., Wintner, C.E. and Eschenmoser, A. (1990)
Helv. Chim. Acta 73, 1410.Orgel, L.E. (2002) Orig. Life Evol. Biosph. 32, 279–281.Ostrovskii, V.E. and Kadyshevich E.A. (2007) Phisics-Uspekhi 50, 175—196.Pestunova, O., Simonov, A., Snytnikov, V., Stoyanovsky, V. and Parmon, V. (2005) Adv.
Space Res. 36(2), 214–219.Pitsch, S., Eschenmoser, A., Gedulin, B., Hui, S. and Arrhenius, G. (1995) Orig. Life Evol.
Biosph. 25, 297–334.Reid, C. and Orgel, L.E. (1967) Nature 216, 455.Ricardo, A., Carrigan, M.A., Olcot, A.N. and Benner, S.A. (2004) Science 303, 196.Sanchez, R.A. and Orgel, L.E. (1970) J. Mol. Biol. 47, 531–543.Saxton, B. (2004) Cold Sugar in Space Provides Clue to the Molecular Origin of Life. http://
www.nrao.edu/pr/2004/coldsugar/.Schimpl, A., Lemmon, R.M. and Calvin, M. (1965) Science 147, 149–150.Schwartz, A.W. and de Graaf, R.M. (1993) Mol. Evol. 36, 101–106.Segre, D. and Lancet, D. (1997). Mutually catalytic amphiphiles: simulated chemical evolu-
tion and implications to exobiology. In: J. Chela-Flores and F. Raulin (Eds) Exobiology:Matter, Energy, and Information in the Origin andEvolution of Life in theUniverse, Proc.the 5th Trieste Conf. on Chemical Evolution. Kluwer Academic Publishers, Trieste,pp. 123–131.
Shigemasa, Y., Matsuda, Y., Sakazawa, C. et al. (1977) Bull. Chem. Soc. Jpn 50, 222–226.Simoneit, B.R.T. (2004) Adv. Space Res. 33, 88–94.Simonov, A.N., Pestunova, O.P., Matvienko, L.G. and Parmon, V.N. (2007a) Kinet. Catal.
48(2), 245–254.Simonov, A.N., Pestunova, O.P., Matvienko, L.G., Snytnikov, V.N., Snytnikova, O.A.,
Tsentalovich, Yu.P. and Parmon, V.N. (2007b) Possible prebiotic synthesis of monosac-charides from formaldehyde in presence of phosphates. Adv. Space Res. doi:10.1016/j.asr.2007.08.002
Socha, R.F., Weiss, A. and Sakharov, M.M. (1981) J. Catal. 67, 207–217.Sodeau, J.R. and Lee, E.K.C. (1978) Chem. Phys. Lett. 57(1), 71–74.Tolstoguzov, V. (2004) Orig. Life Evol. Biosph. 34, 571–597.Wachtershauser, G. (1992). Prog. Biophys. Mol. Biol. 58, 85–201.Weber, A.L. (1984a) J. Mol. Evol. 20, 157–166.Weber, A.L. (1984b) Orig. Life Evol. Biosph. 15, 17–27.Weber, A.L. (1985) J. Mol. Evol. 21, 351–355.Weber, A.L. (1997) J. Mol. Evol. 44, 354–360.Weber, A.L. (1998) Orig. Life Evol. Biosph. 28, 259–270.Weber, A.L. (2000) Orig. Life Evol. Biosph. 30, 33–43.Weber, A.L. (2001) Orig. Life Evol. Biosph. 31, 71–86.Yao, S., Ghosh, I., Zutshi, R. and Chmielewski, J. (1998) Nature 396, 447–450.Zubay, G. (1998) Orig. Life Evol. Biosph. 28, 13–26.
Prebiotic Carbohydrates and Their Derivates 117

Theoretical and Computer Modeling of Evolution
of Autocatalytic Systems in a Flow Reactor
S. I. Bartsev and V. V. Mezhevikin
Abstract A chemoautotrophic concept of the initial stages of chemical pre-biotic evolution, which eliminates key difficulties in the problem of life originand permits experimental tests, is proposed. The concept leads to an impor-tant statement—organisms emerging (out of the Earth and/or inside anexperimental reactor) have to be based on biochemical bases, different fromthose occurring on our planet. According to the concept the predecessor ofliving beings has to be sufficiently simple to provide non-zero probability ofself-assembly during a short (in geological or cosmic scale) time. In additionthe predecessor has to be capable of autocatalysis, and further complexifica-tion (i.e., evolution). A theoretical model of a multivariate oligomericautocatalyst coupled with a phase-separated particle is presented. Thismodel, possessing non-genomic inheritance, describes a version of the ‘‘meta-bolism first’’ approach to life origin. Conducted computer simulation showsthe origin of an autocatalytic oligomeric phase-separated system to be possibleat reasonable values of the kinetic parameters of involved chemical reactions ina small-scale flow reactor.
1 Introduction
1.1 The ‘‘Only’’ Statements
A concept of life as a phenomenon ought to be based on well-groundedassumptions about the sufficient conditions of life origin. But only experimentspertaining to life origin can meet these demands. Confirmation, or at leastsupport for, the initial conditions which are sufficient for life to originate canbe obtained only after successful completion of the experiment.
S. I. BartsevInstitute of Biophysics SB RAS, Theoretical Biophysics Department,e-mail: [email protected]
N. Dobretsov et al. (eds.), Biosphere Origin and Evolution.� Springer 2008
119

However organization of the experiment has to provide at least necessaryconditions for starting pre-biotic chemical evolution and the origin of life. Sincewe have no information on extraterrestrial life forms the necessary conditionscan be taken only from general ideas about life in general and possible ways ofits arising. So let us consider the main properties of living beings.
1.2 On the Main Properties of Living Beings
At the beginning a seemingly tautological but key statement is suggested: themain property of living beings is their ability to be. Logical consequences fromthis statement are many; however the consideration of life as an establishedphenomenon distinct from life in the process of formation seems to havedifferent emphasis (Bartsev, 2004; Bartsev et al., 2001). In this chapter thearising consequences relevant to the stage of life are considered.
So ability ‘‘to be’’ means
1. To be separate from an environment (e.g., cell, organism). The simplestexample of this property realization are phase-separated systems—coacervatedroplets, micelles, inorganic catalytic compartments etc.
2. To extend its own existence as long as possible in spite of external destructiveinfluences. The way this property is realized is by a combination of self-support and self-reproduction. The simplest example of self-reproduction innon-living systems is autocatalysis. Self-support and self-reproduction arenot possible without consuming free energy from outside.
So phase-separability and an autocatalytic nature are two properties that areinherent to all living and some non-living systems and which have to underliethe emergence of life.
This knowledge alone is insufficient to mount experiments on the life origin.It makes sense only if the known problems of the life origin are eliminated, atleast hypothetically.
1.3 Key Problem Is Due to Attempts to Explain theExact Origin of Earth’s Life Form
A key problem arises if one wishes to build a cause–effect relation (or exactlyreproduce in experiment) the origin of the Earth’s life. On one hand it is easy toevaluate that the mean time of spontaneous self-assembling of the simplestliving cell of the type presently existing on Earth from organic compoundsunder mostly favorable conditions would be greater by many orders ofmagnitude than the age of the Universe. On the other hand it is known thatlife on the Earth arose almost immediately (on the geological scale) after theocean condensed (Martin and Russell, 2002).
120 S. I. Bartsev, V. V. Mezhevikin

This contradiction has to be solved (at least hypothetically) before beginningthe experiment, and before searching for extraterrestrial life. It can be seen thatthe later problems of chirality (Gleiser and Thorarinson, 2006; Goldberg, 2007),the genetic code (Altstein, 1987; Feigin, 1987; Nelson et al., 2000; Rasmussen etal., 2002), and the specific chemical composition of cells are similar to the keyproblem. Two mutually amplifying presuppositions capable of eliminating thecontradiction can be suggested.
1.4 Presuppositions Capable of Eliminating the Problem
Presuppositions which are presented in this section are based on well-knownfacts and ideas. However, their simultaneous usage allows us to come to con-structive moves to the experiment.
Presupposition 1 (continuity principle). Modern cells are the result of gradualevolution from simple pre-biotic non-living system (Carny and Gazit, 2005;Martin and Russell, 2002; Pross, 2004; Rasmussen et al., 2002).
Presupposition 2 (many-to-one type of structure-function mapping). Thesame function (including catalysis) can be performed by many differentstructures (Fontana and Shuster, 1998; Fox and Dose, 1977; Schuster, 2000).
These presuppositions have three implications:
1. Life can exist on different chemical bases, and an earthly life form is only oneof a large number of possible realizations. Therefore it is not necessary toreproduce exactly specific properties of Earth’s living organisms.
2. The origin of a living cell must have arisen from some predecessor of such asimple structure that the possibility of its self-assembly was not negligible(Martin and Russell, 2002).
3. A ‘‘fully-fledged’’ living cell is the result of evolution from a simple predecessordriven by ‘‘natural selection’’ that acted even at the stage of pre-biotic chemicalevolution. So, in principle, an initial chemical base of the predecessor canessentially differ in its essentials from one of the ‘‘mature’’ life forms (Cody,2004; Cody et al., 2000).
Summarizing namely multiplicity of variants of chemical evolution starting,and simplicity of the living cell predecessor give a hope to successful experimentalmodeling of initial stages of pre-biotic chemical evolution leading to life origin.
1.5 On the Nature of the Predecessor
It seems logical to suppose that the existence and evolution of the predecessorof living systems was based on molecules of a simple chemical nature andnon-genomic inheritance (Martin and Russell, 2002; Oba et al., 2005; Pohorilleand Deamer, 2001; Pross, 2004). This allows us to set aside the implementation
Evolution of Autocatalytic Systems in a Flow Reactor 121

of the very complex function of matrix duplication in the initial stage ofchemical evolution.
In accordance with main properties of living beings a predecessor has to be aphase-separated autocatalytic system. In addition phase separation is necessaryfor effective selection of more suited autocatalytic systems (Feistel et al., 1980).Many types of phase-separated systems (PSS) self-formatting in the course ofdifferent physical processes are known (Fox and Dose, 1972; Rasi et al., 2004;Segre et al., 2001).
Phase-separated systems of micellar type can be used for the modeling stageof the origin of metabolism. In the course of their growth such systems canreach a critical size and then, due to mechanical instability, divide, i.e., undergoprimitive self-reproduction. It was shown that the particles themselves canoperate as autocatalytic systems (Segre and Lancet, 2000; Segre et al., 2001).
An ability to reproduce (autocatalyze) is a necessary, but not sufficient,property for enabling possible chemical evolution from the predecessor. Struc-tures of simple chemical auto-catalysts do not possess sufficient degrees offreedom to produce different variants of auto-catalysts. Therefore simple che-mical auto-catalysts are not capable of further complication or evolution.
A possible variant of an autocatalytic system capable of evolution is astatistical chemical autocatalytic system (Segre et al., 1998) in which anensemble of different catalysts cross-catalyze the syntheses of the other catalysts.Thereby the total effect is the reproduction of all components of the systemproviding self-replication in mutually catalyzing sets. However, it is not clearhow coordination in this population of heterogeneous catalytic reactions can beprovided. Besides, such a system can appear only if the origin of the completepopulation of the catalysts happens simultaneously to provide a closed chain ofreproduction—an eventuality that has to be considered highly improbable.
The hypothesis that the primary autocatalyst has to be a linear oligomericmolecule capable of catalyzing polymerization of monomers from which it isassembled (Bartsev andMezhevikin, 2005, 2006) seems to be well grounded. Inthis case only one event of self-assembly is required for initiating autocatalyticprocesses. This event is provided by only one type of chemical reaction—polymerization.
Generally properties of a linear oligomer depend upon the length of chain andits monomer sequence. While simple oligomers are not capable of matrix dupli-cation, under appropriate conditions, linear oligomerase can randomly synthe-size large numbers of different linear oligomers. These oligomers can performdifferent catalytic activity and some fraction of them can be auto-oligomerasessupporting oligomerization process.
In parallel, at the initial stage of chemical evolution, membranes can beassembled from amphiphiles presented in the environment of PSS. Amphiphilescan be produced by different physical–chemical processes. Micelles can beformed at low concentration (�10–8 M) of amphiphiles possessing high hydro-phobicity of the tail (Ruckenstein and Nagarajan, 1976). The presence ofhydrophobic nuclei can start formation of micelles at negligible concentrations
122 S. I. Bartsev, V. V. Mezhevikin
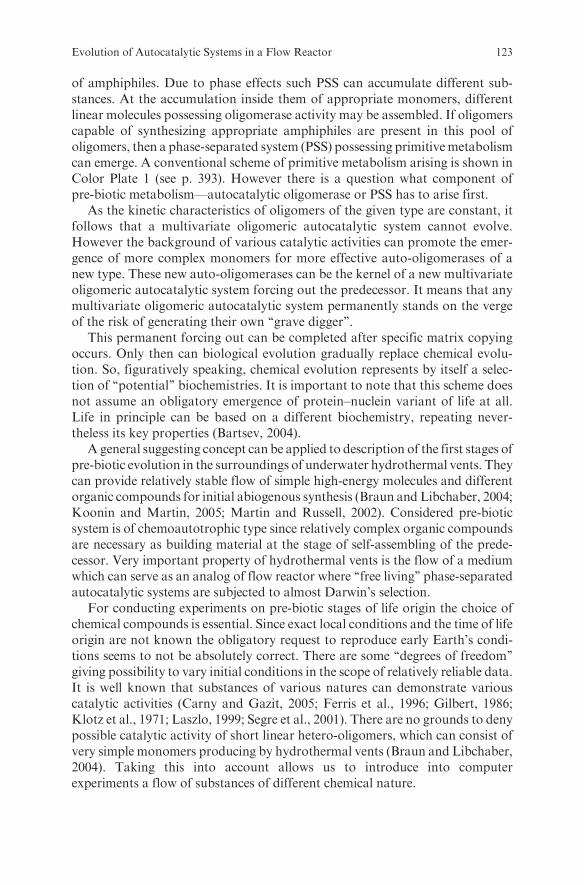
of amphiphiles. Due to phase effects such PSS can accumulate different sub-stances. At the accumulation inside them of appropriate monomers, differentlinear molecules possessing oligomerase activity may be assembled. If oligomerscapable of synthesizing appropriate amphiphiles are present in this pool ofoligomers, then a phase-separated system (PSS) possessing primitivemetabolismcan emerge. A conventional scheme of primitive metabolism arising is shown inColor Plate 1 (see p. 393). However there is a question what component ofpre-biotic metabolism—autocatalytic oligomerase or PSS has to arise first.
As the kinetic characteristics of oligomers of the given type are constant, itfollows that a multivariate oligomeric autocatalytic system cannot evolve.However the background of various catalytic activities can promote the emer-gence of more complex monomers for more effective auto-oligomerases of anew type. These new auto-oligomerases can be the kernel of a new multivariateoligomeric autocatalytic system forcing out the predecessor. It means that anymultivariate oligomeric autocatalytic system permanently stands on the vergeof the risk of generating their own ‘‘grave digger’’.
This permanent forcing out can be completed after specific matrix copyingoccurs. Only then can biological evolution gradually replace chemical evolu-tion. So, figuratively speaking, chemical evolution represents by itself a selec-tion of ‘‘potential’’ biochemistries. It is important to note that this scheme doesnot assume an obligatory emergence of protein–nuclein variant of life at all.Life in principle can be based on a different biochemistry, repeating never-theless its key properties (Bartsev, 2004).
A general suggesting concept can be applied to description of the first stages ofpre-biotic evolution in the surroundings of underwater hydrothermal vents. Theycan provide relatively stable flow of simple high-energy molecules and differentorganic compounds for initial abiogenous synthesis (Braun and Libchaber, 2004;Koonin and Martin, 2005; Martin and Russell, 2002). Considered pre-bioticsystem is of chemoautotrophic type since relatively complex organic compoundsare necessary as building material at the stage of self-assembling of the prede-cessor. Very important property of hydrothermal vents is the flow of a mediumwhich can serve as an analog of flow reactor where ‘‘free living’’ phase-separatedautocatalytic systems are subjected to almost Darwin’s selection.
For conducting experiments on pre-biotic stages of life origin the choice ofchemical compounds is essential. Since exact local conditions and the time of lifeorigin are not known the obligatory request to reproduce early Earth’s condi-tions seems to not be absolutely correct. There are some ‘‘degrees of freedom’’giving possibility to vary initial conditions in the scope of relatively reliable data.It is well known that substances of various natures can demonstrate variouscatalytic activities (Carny and Gazit, 2005; Ferris et al., 1996; Gilbert, 1986;Klotz et al., 1971; Laszlo, 1999; Segre et al., 2001). There are no grounds to denypossible catalytic activity of short linear hetero-oligomers, which can consist ofvery simple monomers producing by hydrothermal vents (Braun and Libchaber,2004). Taking this into account allows us to introduce into computerexperiments a flow of substances of different chemical nature.
Evolution of Autocatalytic Systems in a Flow Reactor 123
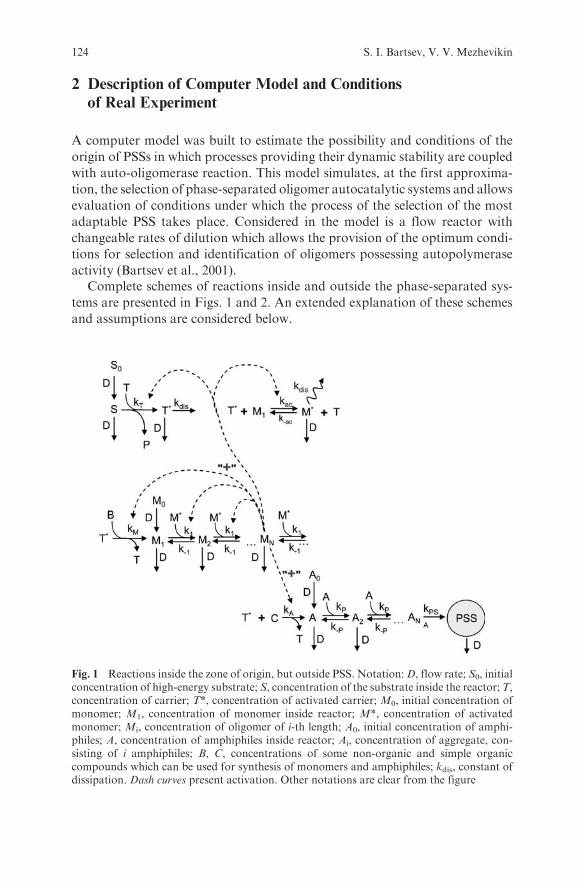
2 Description of Computer Model and Conditions
of Real Experiment
A computer model was built to estimate the possibility and conditions of the
origin of PSSs in which processes providing their dynamic stability are coupled
with auto-oligomerase reaction. This model simulates, at the first approxima-
tion, the selection of phase-separated oligomer autocatalytic systems and allows
evaluation of conditions under which the process of the selection of the most
adaptable PSS takes place. Considered in the model is a flow reactor with
changeable rates of dilution which allows the provision of the optimum condi-
tions for selection and identification of oligomers possessing autopolymerase
activity (Bartsev et al., 2001).Complete schemes of reactions inside and outside the phase-separated sys-
tems are presented in Figs. 1 and 2. An extended explanation of these schemes
and assumptions are considered below.
Fig. 1 Reactions inside the zone of origin, but outside PSS. Notation:D, flow rate; S0, initialconcentration of high-energy substrate; S, concentration of the substrate inside the reactor;T,concentration of carrier; T*, concentration of activated carrier; M0, initial concentration ofmonomer; M1, concentration of monomer inside reactor; M*, concentration of activatedmonomer; Mi, concentration of oligomer of i-th length; A0, initial concentration of amphi-philes; A, concentration of amphiphiles inside reactor; Ai, concentration of aggregate, con-sisting of i amphiphiles; B, C, concentrations of some non-organic and simple organiccompounds which can be used for synthesis of monomers and amphiphiles; kdis, constant ofdissipation. Dash curves present activation. Other notations are clear from the figure
124 S. I. Bartsev, V. V. Mezhevikin
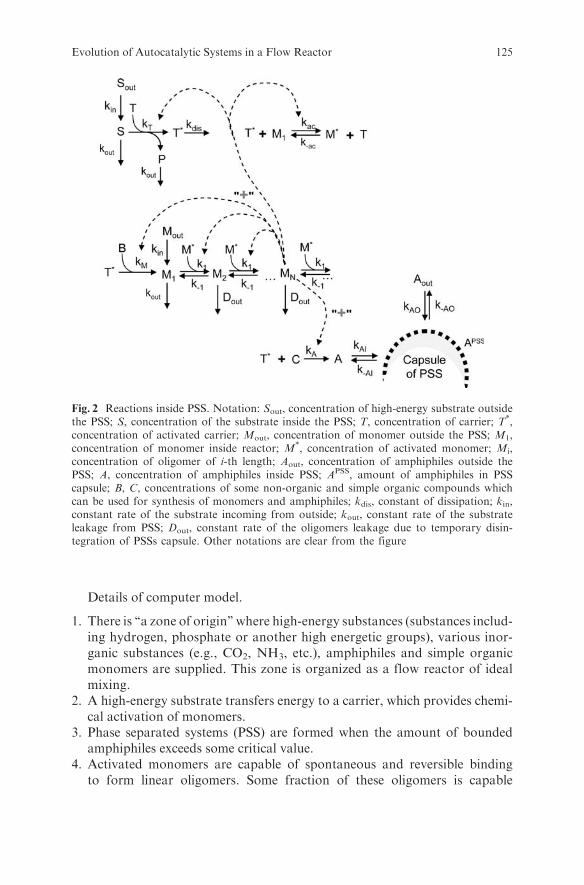
Details of computer model.
1. There is ‘‘a zone of origin’’ where high-energy substances (substances includ-ing hydrogen, phosphate or another high energetic groups), various inor-ganic substances (e.g., CO2, NH3, etc.), amphiphiles and simple organicmonomers are supplied. This zone is organized as a flow reactor of idealmixing.
2. A high-energy substrate transfers energy to a carrier, which provides chemi-cal activation of monomers.
3. Phase separated systems (PSS) are formed when the amount of boundedamphiphiles exceeds some critical value.
4. Activated monomers are capable of spontaneous and reversible bindingto form linear oligomers. Some fraction of these oligomers is capable
Fig. 2 Reactions inside PSS. Notation: Sout, concentration of high-energy substrate outsidethe PSS; S, concentration of the substrate inside the PSS; T, concentration of carrier; T*,concentration of activated carrier; Mout, concentration of monomer outside the PSS; M1,concentration of monomer inside reactor; M*, concentration of activated monomer; Mi,concentration of oligomer of i-th length; Aout, concentration of amphiphiles outside thePSS; A, concentration of amphiphiles inside PSS; APSS, amount of amphiphiles in PSScapsule; B, C, concentrations of some non-organic and simple organic compounds whichcan be used for synthesis of monomers and amphiphiles; kdis, constant of dissipation; kin,constant rate of the substrate incoming from outside; kout, constant rate of the substrateleakage from PSS; Dout, constant rate of the oligomers leakage due to temporary disin-tegration of PSSs capsule. Other notations are clear from the figure
Evolution of Autocatalytic Systems in a Flow Reactor 125

of catalyzing synthesis of amphiphiles. Another fraction is capable ofmonomer synthesis. And some fraction of oligomers is auto-oligomerases.
5. Internal concentration of monomers inside PSS is higher than outside due tointer-phases redistribution, and the polymerization reaction is shifted tooligomer synthesis.
6. The increase of PSS in size occurs due to embedding of amphiphiles,synthesized both inside PSS, and coming from the outside.
7. Since oligomers for performing catalytic functions have to possess a tertiarythree-dimensional structure then an assumption on terminating oligomerchain elongation after its folding is accepted.
3 Results of the Computer Simulation and Discussion
In principle two variants of the initial stages of pre-biological chemical
evolution are possible in the reactor. According to the first variant, the
auto-oligomerase reaction appears first in the flow reactor. This reaction
forms the background of varied catalytic activities in particular promoting
the syntheses of amphiphiles. When concentration of amphiphiles reaches a
certain threshold, then phase-separated systems also containing auto-
oligomerases within appear. As water is often a product of polymerization
then syntheses of oligomers in aqueous solution is difficult. And since the
water activity is reduced inside the phase-separated particles, it is possible to
expect an increase in the rate of oligomer synthesis. In addition the presence
of phase boundaries can lead to increase in concentrations of reagents inside
PSS, and by this to increase in auto-oligomerase reaction rates, and to the
growing of PSS itself. Further chemical evolution and its substitution by
biological evolution will occur inside PSS selected under conditions in the
flow reactor.According to the second variant if the amount of amphiphiles in the flow
reactor is sufficient for PSS production, then they can self-multiply by micel-
lar autocatalysis. As in the first variant, inside PSS conditions provide accel-
eration of chemical reactions and shift polymerization reactions toward the
generation of the longest average oligomer chain. Then auto-oligomeraze
reaction onsets inside PSS. Further possible stages comply with the first
variant.Computer simulation shows depending on kinetic constants both variants of
the events are possible. Fig. 3 demonstrates the ‘‘hump’’ of typical oligomer
length distribution inside PSS. It means that autocatalytic process takes place
inside PSS. This simulation was conducted at reasonable parameters of reaction
and flow rates in the reactor.
126 S. I. Bartsev, V. V. Mezhevikin

4 Conclusions
1. Addressing the oligomers of the simplest chemical nature, and the renuncia-tion of considerations of matrix duplication at initial stages of chemicalevolution, allows a simpler and more probable scenario of pro-biont meta-bolism origin. It gives possibility to put the objectives for experimentalmodeling of initial stages of evolution.
2. The model considered here allows a preliminary estimation of necessaryparameters of autocatalytic synthesis of oligomers, and the coupling tosyntheses of inphase-separated systems. Preliminary estimations show thatthe origin of autocatalytic oligomeric PSS is possible at reasonable values ofkinetics parameters of the chemical reactions involved in flow reactorprocesses. The signature of auto-oligomerase reaction is the presence of‘‘a hump’’ on the distribution of oligomers with respect to the length oftheir chains.
3. It is supposed that at the initial stages of chemical evolution the variants ofthe most successful compositions of amphiphiles and oligomers of differentchemical nature, i.e., variants of possible future biochemistries, are selectedto create conditions that encourage matrix duplication. Following this che-mical evolution gives gradually the place to biological evolution.
Acknowledgment This work was conducted with the support of RAS Program No. 18.2‘‘Biosphere Origin and Evolution’’ and RFBR Grant No. 06-04-49016.
Fig. 3 Computer simulation of steady state oligomer distribution with respect to their length:(a), inside the flow reactor; (b), inside a phase-separated system compartment
Evolution of Autocatalytic Systems in a Flow Reactor 127

References
Altstein, A.D. (1987) The origin of the genetic system: the progene hypothesis. Mol. Biol.21(2), 309–322 (in Russian).
Bartsev, S.I. (2004) Essence of life and multiformity of its realization: expected signatures oflife. Adv. Space Res. 33(8), 1313–1317.
Bartsev, S.I. andMezhevikin, V.V. (2005) Pre-biotic stage of life origin under non-photosyntheticconditions. Adv. Space Res. 35(9), 1643–1647.
Bartsev, S.I. and Mezhevikin, V.V. (2006) On the theoretical and experimental modeling ofinitial states of metabolism formation in prebiotic systems. Paleontol. J. 40(4), S536–S542.
Bartsev, S.I., Mezhevikin, V.V. and Okhonin, V.A. (2001) Life as a set of matter transforma-tion cycles: ecological attributes of life. Adv. Space Res. 28(4), 607–612.
Braun, D. and A. Libchaber (2004) Thermal force approach to molecular evolution: PhysicalBiology 1, 1–8.
Carny, O. and Gazit, E. (2005) A model for the role of short self-assembled peptides in thevery early stages of the origin of life. FASEB J. 19, 1051–1055.
Cody, G.D. (2004) Transition metal sulfides and the origin of metabolism. Ann. Rev. EarthPlanet. Sci. 32, 569–599.
Cody, G.D., Bactor, N.Z., Filley, T.R., Hazen, R.M., Scott, J.H., Sharma, A., Yoder, H.S., Jr.(2000) Primordial carbonylated iron-sulfur components and the synthesis of pyruvate.Science 289(5483), 1337–1340.
Feigin, A.M. (1987) On a possibility of origin of nucleic acids on the basis of polymers with asimpler structure. J. Evol. Biochem. Physiol. 23(4), 417–422.
Feistel, R., Romanovsky, Yu.M. and Vasil’ev, V.A. (1980) Evolution of Eigen’s hyper-cycletaking place in coacervate. Biophysics 25(5), 882–887 (in Russian).
Ferris, J.P., Hill, A.R., Jr., Liu, R. and Orgel, L.E. (1996) Synthesis of long prebioticoligomers on mineral surfaces. Nature 381, 59–61.
Fontana, W. and Shuster, P. (1998) Shaping space: the possible and the attainable in RNAgenotype–phenotype mapping. J. Theor. Biol. 194, 491–515.
Fox, S.W. and Dose, K. (1977) Molecular Evolution and the Origin of Life. Marcel Dekker,New York., p. 370.
Gilbert, W. (1986) The RNA world. Nature 319, 618.Gleiser, M. and Thorarinson, J. (2006) Prebiotic homochirality as a critical phenomenon.
Orig. Life Evol. Biosph. 36, 501–505.Goldberg, S.I. (2007) Enantiomeric enrichment on the prebiotic earth. Orig. Life Evol.
Biosph. 37, 55–60.Klotz, I.M., Royer, G.P. and Scarpa, I.S. (1971) Synthetic derivatives of polyethyleneimine
with enzyme-like catalytic activity (synzymes). PNAS 68(2), 263–264.Koonin, E.V. and W. Martin, (2005) On the origin of genomes and cells within inorganic
compartments. Trends Genet. 21, 647–654.Laszlo, P. (1999) Catalysis of organic reactions by inorganic solids. Pure Appl. Chem. 62(10),
2027–2030.Martin, W and Russell, M.J. (2002) On origins of cells: a hypothesis for the evolutionary
transitions from abiotic geochemistry to chemoautotrophic prokaryotes, and fromprokaryotes to nucleated cells. Phil. Trans. R. Soc. London, B. 358, 27–85.
Nelson, K.E., Levy, M. and Miller, S.L. (2000) Peptide nucleic acids rather than RNA mayhave been the first genetic molecule. PNAS 97, 3868–3871.
Oba, T., Fukushima, J, Maruyama, M., Iwamoto, R. and Ikehara, K. (2005) Catalyticactivities of [GADV]-peptides. Orig. Life Evol. Biosph. 34, 447–460.
Pohorille, A. and Deamer, D. (2001) Artificial cells: prospects for biotechnology. TrendsBiotechnol. 20, 123–128.
Pross, A. (2004) Causation and the origin of Life. Metabolism or replication first? Orig. LifeEvol. Biosph. 34, 307–321.
128 S. I. Bartsev, V. V. Mezhevikin

Rasi, S., Mavelli, F. and Luisi, P.L. (2004) Matrix effect in oleate micelles–vesiclestransformation. Orig. Life Evol. Biosph. 34, 215–224.
Rasmussen, S., Chen, L., Stadler, B.M.R. and Stadler, P.F. (2002) Proto-organism kinetics:evolutionary dynamics of lipid aggregates with genes and metabolism. Santa Fe Institute,Working Paper, No. 02-10-054.
Ruckenstein, E. and Nagarajan, R. (1976) On critical concentrations in micellar solutions.J. Colloid Interface Sci. 57(2), 388–390.
Schuster, P. (2000) Molecular insight into the evolution of phenotypes. Santa Fe Institute,Working Paper No. 00-02-013.
Segre, D. and Lancet, D. (2000) Composing life. EMBO Reports 1(3), 217–222.Segre, D., Lancet, D., Kedem, O. and Pilpel, Y. (1998) Graded autocatalysis replication
domain (GARD): kinetic analysis of self-replication in mutually catalytic sets. Orig. LifeEvol. Biosph. 28, 501–514.
Segre, D., Ben-Eli, D., Deamer, D.W. and Lancet, D. (2001) The lipid world. Orig. Life Evol.Biosph. 31, 119–145.
Evolution of Autocatalytic Systems in a Flow Reactor 129
RNA World: First Steps Towards
Functional Molecules
A.V. Lutay, M.A. Zenkova, and V.V. Vlassov
Abstract This review is focused on the evolution of prebiotic RNAmolecules—
from the first nucleotide’s origin towards the supramolecular complexes ofRNA molecules, possessing the catalytic activities. On the assumption of the
numerous experimental data known, the principal stages of the RNA World’sevolution are described in terms of the molecular complexity. Special attention
is given to our study of the metal-catalyzed nonenzymatic cleavage/ligation
reaction, which provides a mechanism of how the RNA molecules could elon-gate and diversify.
Studies of the last decades provided evidences that ‘‘there was once an RNA
world’’ (Orgel, 2004). The natural selection of such complicated molecule asRNA is a low-probability outcome for the primitive system, so there are several
hypotheses that some polymers of another type could forerun RNA (Joyce andOrgel, 1999; Orgel, 2003). Since the primordial catalytic RNAs from that era
have been replaced by protein enzymes, the exact reconstruction of a hypothe-sized ‘‘RNA world’’ is difficult, though one can verify experimentally some
crucial features ofRNAworld (for reviews seeDworkin et al., 2003; Orgel, 2003).This chapter focuses on the nonenzymatic reactions that could provide the
possibility of emergence of large functionally active RNA molecules requiredfor the development of RNA world. The following three sections describe the
main stages of the RNA world establishment according to their titles.
1 First RNA Monomers: Puzzle of Isomers
The chemical steps required for the emergence of RNA oligomers include
successive reactions of condensation increasing the molecular complexity(Fig. 1).
A.V. LutayInstitute of Chemical Biology and Fundamental Medicine SB RAS, Novosibirsk, Russiae-mail: [email protected]
N. Dobretsov et al. (eds.), Biosphere Origin and Evolution.� Springer 2008
131

The first stage was the generation of organic molecules from simple precur-sors such as primitive gases that might have constituted the primal atmosphere.A variety of energy sources like heat from sparks, chemical exudates from oceanvents and solar radiation were all capable of generating the key prebioticmolecules. The high energy favours the formation of the multiple bondedforms –C�C–, –C�N, >C=O that are capable of further polymerization,producing a wide variety of organic molecules.
Polymerization of formaldehyde in the presence of simple mineralcatalysts—the formose reaction—is a unique, cyclic autocatalytic process thattakes place in aqueous solution and converts a very simple substrate, formalde-hyde, to a mixture of complex molecules, many of which are importantbiochemicals. The first product of polymerization is glycoaldehyde, which islater converted to glyceraldehyde and a variety of tetrose, pentose and hexosesugars. However, it had not been possible to channel this reaction to thesynthesis of any particular sugar, and ribose usually has been a notoriouslyminor product. Eschenmoser and his co-workers showed that the pattern ofproducts could be greatly simplified if glycoaldehyde and glyceraldehyde werereplaced by their monophosphates. The condensation of glycoaldehyde phos-phate with glyceraldehyde phosphate on the mineral surfaces results in moreeffective formation of ribose-2,4-diphosphate, but it has another disposition ofthe phosphate groups than the natural ribose–phosphate backbone in RNAmolecule (Mueller et al., 1990; Pitsch et al., 1995).
The prebiotic purine synthesis is concerned with the polymerization processof HCN, which can proceed in a wide range of conditions, yielding substantialamounts of purines. The reaction of cyanoacetylene or cyanoacetaldehyde withurea and the reaction of cyanoacetylene with cyanate in eutectic solution are themost plausible prebiotic routes to cytosine. Uracil is formed from cytosine byhydrolysis, and this has been proposed as a prebiotic synthesis. In contrast topurines that react with D-ribose with the formation of nucleosides, no directsynthesis of pyrimidine nucleosides from ribose and uracil or cytosine has beenreported, although some variants of the indirect synthesis have been proposed(see Orgel, 2004 for the references). The mechanism of selection of nucleotideswith ‘‘correct’’ b-glycosidic linkage remains unknown.
The last structural unit to be mentioned is the phosphodiester bond by whichall nucleosides are linked together in the RNA structure. Like today, phos-phorus on the primitive Earth was likely present mostly as various phosphates.Nucleosides could be converted to a complex mixture of products containingone or more phosphate groups by heating at moderate temperatures with
Fig. 1 The prebiotic pathway leading to the emergence of the first RNA molecules
132 A. Lutay et al.
phosphate salts and urea. Some progress has been achieved in attempts to directthis solid-state reaction to the synthesis of 50-phosphorylated nucleosides, sincethe latter are considered to be the most probable nucleotide precursors. Whilemost efforts have been devoted to the phosphorylation of preformed nucleo-sides, some plausible routes with phosphorylated sugars have also been demon-strated. Whatever phosphate was incorporated at the stage of nucleoside orribose syntheses or it appeared later via some phosphorylation reactions, it isclear that the primitive condensation reactions between phosphorylated nucleo-sides could produce a mixture of isomeric phosphodiester bonds.
Thus many RNA-like molecules (including various isomers) could have beensynthesized in the reactions of prebiotic synthesis and there is no clear concep-tion how the RNA molecules, containing 30,50-phosphodiester bonds, D-riboseand b-glycosidic bonds, might have been selected. Detailed consideration of thementioned problems can be found in the reviews (Dworkin et al., 2003; Orgel,2004).
2 Prebiotic Synthesis of RNA Oligomers
Polymerization of nucleotides in aqueous solution must necessarily make use ofexternal activating agents. Since many highly reactive compounds (e.g. hydro-cyanic acid, cyanoacetylene, cyanoamide, formamide, different aldehydes) werelikely involved in the initial syntheses, it is natural to suppose that manynucleophiles were available and the phosphate group could be activatedunder these conditions. Activated forms of phosphate group that were likelyinvolved in prebiotic chemistry of RNA include phosphoramidates (e.g. phos-phorimidazolides; Lohrmann and Orgel, 1977), polyphosphates (Lohrmann,1975) and 20,30-cyclic phosphates (Lutay et al., 2005; Renz et al., 1971;Verlander et al., 1973) (Fig. 2a–c).
A number of investigations were focused on two possible types of prebioticpolymerization reactions: template-free polymerization and template-directedsynthesis (Fig. 2d and e). In the first case, the meeting of RNA fragments andthe total efficiency of the reaction is determined by diffusion. Since variousmolecules can react with activated phosphates, it is unlikely that template-independent polymerization in solution had been able to yield significant con-tribution to the synthesis of RNA although it was shown that a number ofactivated nucleotides are able to polymerize in the absence of template upondrying (Sleeper et al., 1978; Verlander and Orgel, 1974), freezing (Kanavariotiet al., 2001; Monnard et al., 2003; Renz et al., 1971; Trinks et al., 2005) oradsorption on the surface of minerals (Acevedo and Orgel, 1986).
Formation of double-stranded complexes by means of Watson–Crick basepairing could be another mechanism for the RNA contiguity. The templatebrings complementary activated monomers or short oligomers together, pro-viding proximity of specific reactive groups, and facilitates their ligation.
RNA World: First Steps Towards Functional Molecules 133

Metal ions are capable of coordinating with the oxygens of phosphate
groups, which could accelerate the reaction and affect the ratio of the result-
ing isomers. The ratio of 30,50-/20,50-phosphodiester linkages can be expected
to depend on the nature of the nucleoside base and the activating group. In
some cases this ratio can be as high as four (Prabahar and Ferris, 1997), in
other cases the regiospecificity favours the formation of 20,50-phosphodiesterbonds (Ertem and Ferris, 1997). Selective production of the 30,50-phosphodie-ster linkages has never been observed. Oligonucleotides, containing both 20,50-and 30,50-phosphodiester linkages, could serve as a template or a primer in the
template-directed synthesis that results in the double-stranded RNA complex
formation (Sawai et al., 1998, 2006).An imperfection of the template-directed synthesis model lies in the distin-
guished efficiencies of nucleotide incorporation depending on the opposite
nucleotide. For example, a pair of adjacent A residue in the template is an
almost complete barrier to further synthesis, and wobbling pairing of G oppo-
site U leads to extensive misincorporation of G. The results of sequence depen-
dence investigations have shown that a wide variety of different RNA sequences
can be copied, but not all (Joyce, 1987).The L-enantiomers of activated nucleotides are efficient inhibitors of
template-directed synthesis using the naturally occurring D-enantiomers.
Since any prebiotic synthesis produces racemates, one more challenge in any
scheme for polynucleotide replication from plausibly prebiotic monomeric
substrates is an enantiomeric cross-inhibition (Joyce, 1984).The most efficient synthesis of RNA oligonucleotides was achieved by poly-
merization of 50-phosphorimidazolides of the montmorillonite surface.
Fig. 2 The most probable prebiotic activated RNA monomers: phosphorimidazolides(a), tri- or tetraphosphates (b), 20,30-cyclic phosphates (c). Polymerization in the absence oftemplates (d). Template-directed synthesis (e)
134 A. Lutay et al.
Repeated addition of new portions of phosphorimidazolides led to synthesis ofRNA oligomers as long as 35 to 40-mers (Ferris, 2002).
It is not known if phosphorimidazolides could have been presented in largeamounts on the primitive Earth, and no similar reaction with phosphorimida-zolides (or any other phosphoramidates) involvement can be found in any livingsystems today. Thus, there can be no doubt that described mineral-catalyzedreactions are relevant to chemical evolution. Emerged oligonucleotides couldform double-stranded regions by means of Watson–Crick base pairing. None-nzymatic ligation reactions proceeding in those complexes seem to be the mostprobable mechanism of RNA elongation, as template-assisted polymerizationof activated monomers is less effective due to some sequence restrictions.
3 Emergence of Catalytic RNAs
After the synthesis of RNA oligomers the next key event in the RNA worldevolution is the emergence of RNA molecules long enough to possess thecatalytic activity. At this stage the only function of the first ribozymes wascatalysis of RNA replication, the building blocks of which could be eithermonomers or short RNA oligomers. The development of ‘‘in vitro selection’’and ‘‘in vitro evolution’’ strategies allowed to obtain ribozymes with predeter-mined activity; thus significant progress was achieved in understanding ribo-zyme’s potential in phosphodiester bond formation reactions.
In most studies the derived ligase ribozymes could catalyze phosphodiesterbond formation between substrate molecule and ribozyme itself (i.e. in cis),making the catalyst discharged for the subsequent reactions, what does notsimulate prebiotic evolution. Thus, the ribozymes with trans activity are ofspecial interest.
The first ligase ribozyme (class I ligase ribozyme) was selected from a largepool of 220-nt RNA molecules and catalyzed the ligation of 30-hydroxyl ofsubstrate molecule onto 50-triphosphate group of enzyme with formation of30,50-phosphodiester bond (Bartel and Szostak, 1993). Its modified form was93-nt long and could append several NTPs in template-dependent manner. Invitro evolution of that ribozyme with random RNA domain appended at its 30-end allowed to evolve an enzyme, catalyzing polymerization of NTPs onexternal template. Novel ribozyme containing approximately 200 nt was insen-sitive to nucleotide sequences of template and primer and could append up to 14nucleotides (Johnston et al., 2001).
In independent investigations several other ribozymes with 30,50-ligase activ-ity have been evolved. These include catalytic domains smaller than that of classI ribozyme. It is interesting that the L1 ligase can be activated by an oligonu-cleotide, protein effector or small molecule to act as an allosteric ribozyme,suggesting a possible mechanism for primitive phenotypic regulation (Ellingtonand Szostak, 1990; Robertson and Ellington, 2001). The R3C ribozyme has
RNA World: First Steps Towards Functional Molecules 135

been engineered to function in an intermolecular reaction format with onesubstrate containing the attacking 30-hydroxyl and the second substrate contain-ing the 50-triphosphate (Rogers and Joyce, 2001). Later R3C ribozyme wasredesigned for the development of self-replicating system based on the ribozymethat catalyzes the assembly of additional copies of itself throughRNA-catalyzedRNA ligation reaction (Paul and Joyce, 2002).
Variants of the hc ligase ribozyme, which catalyzes ligation of the 30-end ofan RNA substrate to the 50-end of the ribozyme, were utilized to evolve aribozyme that catalyzes ligation reactions of an external RNA template. Theevolved ribozyme has a length of about 300 nucleotides and catalyzes joining ofan oligonucleotide 30-OH group to the 50-triphosphate of an RNA hairpinmolecule. The enzyme also demonstrates predominately sequence-independentmechanism for substrate recognition and can catalyze the addition of NTP ontothe 30-end of an oligonucleotide primer in a template-dependent manner(McGinness and Joyce, 2002).
The highest length obtained in the polymerization of activated nucleotides isabout 40 nt, which is 2–3 times smaller than the minimal length of the evolvedligase ribozymes. But it seems that the prebiotic ribozyme might have been alittle bit smaller (60–100 nt). One great opportunity is hidden in supramolecularcomplexes of small RNA molecules that could possess the catalytic activity. Itwas shown that truncated and fragmented derivatives of the hairpin ribozymecan catalyze ligation of a wide variety of RNAmolecules to a given sequence infrozen solution (Vlassov et al., 2004). Another example is the binary form ofhammerhead ribozyme, consisting of two parts and possessing catalytic activitysimilar to that of the native ribozyme (Kuznetsova et al., 2004; Vorobjeva et al.,2006).
The progress of in vitro selection and in vitro evolution methods facilitatesthe evaluation of the most important aspects of prebiotic ribozymes, namely,catalytic efficiency and probability of emergence. It is evident that, despite thelow efficiency of obtained ribozymes, more active RNA polymerases acting intrans might be developed. Thus, progress in the minimal ribozyme designshould be expected.
4 RNA Recombination: Elongation and Diversity
The recombination reaction can provide formation of novel RNA molecules.Chetverin observed emergence of novel sequences in the colony of RNA mole-cules, exponentially amplified by Qb-replicase, and suggested that similarrecombination reactions might have proceeded in RNA world, providing itssequence diversity (Chetverin, 1999).
RNA molecules contain double-stranded regions of various lengths, formedby partially complementary sequences. Since the single-stranded regions aremuch more susceptible to transesterification reaction, cleavage can occur in
136 A. Lutay et al.
such a way that in the nick 20,30-cyclic phosphates and 50-hydroxyl groups arelocated. The intramolecular transesterification reaction is accelerated in thepresence of many compounds (metal ions, organic bases, etc.). The transforma-tion pathway of the new-born 20,30-cyclic phosphate, as well as any activatedphosphate, depends on the pH and availability of nucleophilic molecules pre-sent in the system. At pH close to neutral the time of 20,30-cyclic phosphate half-life is long enough to permit interaction with other available RNA molecules.Thus RNA fragments with 50-hydroxyl group and 20,30-cyclic phosphate,obtained as a result of RNA cleavage, could cross-interact with each otherforming new phosphodiester linkages and yielding new RNAmolecules. There-fore 20,30-cyclic phosphate could be viewed as an activated phosphate emergingin a customary process without any other activating groups.
It was shown that binding of oligoadenylates with 20,30-cyclic phosphateterminus to polyuridylic acid template in the presence of ethylenediamineleads to the formation of dimers (24%) and trimers (5%). The formed phos-phodiester bonds were predominately 20,50-isomers (Usher and McHale, 1976).
Recently, we have investigated the nonenzymatic template-directed ligationof oligonucleotides containing 20,30-cyclic phosphate (Lutay et al., 2006).Ligation of the oligonucleotides occurred even in the absence of metal ionsand its efficiency demonstrated an escalating pH–yield profile within a pHinterval of 6.0–8.8, which suggests base catalysis of the reaction proceedingvia increasing of nucleophilic properties of the attacking 50;-hydroxyl group, aswas shown earlier (Renz et al., 1971). Divalent cations (Mg2þ, Mn2þ, Zn2þ,Pb2þ) accelerated the reaction in pH-dependent manner, which is explained bythe following events: (1) activation of hydroxyl groups via the coordination ofthe attacking oxygen and increase of its nucleophilicity, (2) stabilization of thedeveloping negative charge on the leaving oxygen group, (3) activation ofphosphate centre atom for nucleophilic attack through coordination to thenonbridging oxygen (Dahm et al., 1993; Hampel and Cowan, 1997; Pyle,2002; Steitz and Steitz, 1993). At pH 7.2 the efficiency of the metal ions ascatalysts inversely correlated with the pKa values of the metal-bound watermolecules. However, the catalytic potential of the metal ion is determined bysolubility of its metal ion hydroxide; maximal yields were obtained at thehighest possible concentrations of the metal ions in solution. At pH 8.8 inso-luble metal hydroxides are formed resulting in the decrease of the ligationproduct yield, except forMg2þ ions, which showed the best catalytic properties,yielding up to 15% of the ligation product (Fig. 3).
At least 95%of the isolated products of nonenzymatic ligation were resistantto ribonuclease T1 under the conditions where 30,50-bonds are completelycleaved by the enzyme. The result of comparative T1-probing can be attributedto the 20,50-bond formation in the nonenzymatic ligation products (Lutay et al.,2006).
Similar ligation reaction was shown to proceed in vivo within peach latentmosaic viroid (PLMVd). Self-ligation occurs when the 50-hydroxyl and the 20,30-cyclic phosphate termini produced by the hammerhead ribozyme self-cleavage
RNA World: First Steps Towards Functional Molecules 137

of the viroid RNA are juxtaposed by the viroid rod-like structure. The formed
linkages were almost solely 20,50 (>96%) and were shown to stabilize the
replicational circular templates. Since the reverse transcriptase is able to read
through a 20,50-linkage with the efficacy more than 50%, their presence in the
viroid structure does not constitute an important obstacle to polymerase pro-
gression and results in a significant advantage in terms of viroid viability,
protecting the viroid integrity (Cote et al., 2001).The explanation of the observed stereospecificity concerns the geometry of
A-type RNA helix conformation. The rate of the transesterification reaction
depends on the probability of the in-line conformation in the transition state,
when forming O–P and cleaving P–O bonds are placed on the opposite sides
of the phosphorus atom. In the presence of complementary strand, 20,50-linkages are 103 times less stable than the 30,50-linkages. Similarly, the rate
of the ligation reaction depends on the probability of the in-line attack by the
50-oxygen atom and the type of formed linkage is determined by the direction
of attack—whether 20- or 30-oxygen atom is on the opposite side. Since the
transesterification reaction of 20,50-phosphodiester bonds, resulting in the
formation of 20,30-cyclic phosphate, is in equilibrium with the ligation reac-
tion, one can conclude that the terminal 20,30-cyclic phosphate participates
in reaction in single spatial orientation, when 50-attacking oxygen is in in-line
conformation with 30-cleaving O–P bond of cyclic phosphate. It means that
the equilibrium (phosphodiester bond vs. 20,30-cyclic phosphate and 50-OH)
involves the unstable 20,50-phosphodiester bond.
Fig. 3 The highest ligation yields obtained in the presence of metal ions at pH 7.2 (above) and8.8 (below). For each metal ion the maximal ligation yield is indicated above the bar at theconcentration used. Oligonucleotide complex was incubated in the presence of metal ions(50 mM–250 mM) at pH 7.2 and 8.8 for 3 days at 37 8C
138 A. Lutay et al.

Due to this conclusion the scientific interest to the possible role of 20,30-cyclicphosphates in nonenzymatic template-directed synthesis of RNA decreased, butligation reaction could also proceed in the complex with catalytic nucleic acid,and the orientation of reacting groups depends on the structure of the complex.
In vitro selection procedure was used to obtain deoxyribozymes that catalyzeligation of two RNA oligonucleotides, bearing 20,30-cyclic phosphate and 50-hydroxyl group. At least 96% of the formed linkages were 20,50 (Flynn-Charle-bois et al., 2003). On the contrary, two RNA oligonucleotides, one of whichcontained 20,30-cyclic phosphate, were ligated by fragmented hairpin ribozymederivatives with formation of 30,50-phosphodiester bonds (Vlassov et al., 2004).
Presented data suggest that RNA cleavage yielding oligonucleotides with20,30-cyclic phosphates, followed by reaction of these oligonucleotides with eachother, could provide a source of new RNA molecules under prebiotic condi-tions.We investigated two-step cleavage/ligation reaction of RNA oligonucleo-tides catalyzed by metal ions. The oligonucleotides were designed so as to formconcatemeric pseudo-duplex complex with dangling tetraadenylate tails, notinvolved in Watson–Crick base pairing (Fig. 4).
Magnesium ions were shown to catalyze cleavage of phosphodiester bondswithin single-stranded RNA sequences (namely, A4), followed by the ligationreaction. The ligation products contain not only dimers, but also detectableamounts of trimers.
An increase in pH from 7.0 to 9.5 weakens RNA duplex stability and thusenhances the degradation of phosphodiester bonds. This process can result in adecrease in the complexes in which the template-directed ligation can occur.Nevertheless, the yield of ligation products demonstrates an escalating profilewithin chosen pH range. The almost linear accumulation of the ligation pro-ducts is observed at pH 9.5 during 7 days incubation at 258C up to maximaltotal yield of 5%. At 378C the yield of the ligation products increases during 24h up to 3% and then diminishes almost completely by 72 h. According to theprofile of the degradation, the disappearance of the ligation product is causedmainly, if not entirely, by cleavage of the phosphodiester bond formed upon
Fig. 4 Mg2þ-catalyzed combined cleavage/ligation reaction proceeding in the complex of twooligoribonucleotides and leading to the emergence of new RNA sequences. Differentmolecules are marked with different colour intensities
RNA World: First Steps Towards Functional Molecules 139
ligation, suggesting its 20,50-isomeric form. Though the formed phosphodiesterbond is liable to metal ion-catalyzed degradation, the resistance of the otherlinkages has been increased due to stabilization of the double-stranded complexcaused by growth of oligonucleotide length. Formation of the ligation productis also observed at lower temperatures (15 and 208C), where its life-time seemsto be longer than a week.
It is natural to consider that the Watson–Crick base pairing existed underprebiotic conditions as primary essential mechanism of RNA–RNA interac-tions. Since the RNA molecules are able to form complexes with tertiarystructure, including bulges and loops, it seems that many phosphodiesterbonds should be accessible for the cleavage reaction. Thus, described clea-vage/ligation reactions could also proceed, catalyzed with ubiquitous metalions. Co-existence of numerous RNAs might provide catalysis via formationof some sophisticated complexes (as in the case of binary ribozymes), suggestingthe hypothetic network of the supramolecular interactions, in which one RNAmolecule might have been involved in many catalytic reactions.
5 Concluding Remarks
The RNA world model of the origin of life begins with the production of smallmolecules, which then combine to form ribonucleic acids. Small molecules areunfeasible to promote specific synthesis of RNA structural constituents, thuswe should consider the existence of many RNA-like molecules representing allpossible isomers of RNA. No mechanism of selection has been proved yet.
RNA monomers were likely to possess an activated phosphate group andcould couple in condensation reactions, of which the mineral-catalyzed con-densation is the most efficient. Under that conditions ribonucleic acids up to 10monomers in length could be formed. These newmolecules might be a source ofRNA catalysts directly or via formation of supramolecular complexes.
The combined cleavage/ligation reactions might contribute to production ofa variety of new RNAs in a recombination-like process and yield large RNAsneeded for the development of the RNA world.
Acknowledgment This work was supported by grants from FCSTP (RI012/001/254), RASprograms ‘‘Origin of life and evolution of the biosphere’’ and ‘‘Molecular and cellular biology.’’
References
Acevedo, O.L. and Orgel, L.E. (1986) Template-directed oligonucleotide ligation on hydro-xylapatite. Nature 321, 790–792.
Bartel, D.P. and Szostak, J.W. (1993) Isolation of new ribozymes from a large pool of randomsequences. Science 261, 1411–1418.
Chetverin, A.B. (1999) The puzzle of RNA recombination. FEBS Lett. 460, 1–5.
140 A. Lutay et al.
Cote, F., Levesque, D. and Perreault, J.P. (2001) Natural 20,50-phosphodiester bonds found atthe ligation sites of peach latent mosaic viroid. J. Virol. 75, 19–25.
Dahm, S.C., Derrick, W.B. and Uhlenbeck, O.C. (1993) Evidence for the role of solvatedmetal hydroxide in the hammerhead cleavage mechanism. Biochemistry 32, 13040–13045.
Dworkin, J.P., Lazcano, A. andMiller, S.L. (2003) The roads to and from the RNA world. J.Theor. Biol. 222, 127–134.
Ellington, A.D. and Szostak, J.W. (1990) In vitro selection of RNA molecules that bindspecific ligands. Nature 346, 818–822.
Ertem, G. and Ferris, J.P. (1997) Template-directed synthesis using the heterogeneous tem-plates produced by montmorillonite catalysis. A possible bridge between the prebiotic andRNA worlds. J. Am. Chem. Soc. 119, 7197–7201.
Ferris, J.P. (2002) Montmorillonite catalysis of 30–50 mer oligonucleotides: laboratory demon-stration of potential steps in the origin of theRNAworld.Orig. LifeEvol. Biosph. 32, 311–332.
Flynn-Charlebois, A., Wang, Y., Prior, T.K., Rashid, I., Hoadley, K.A., Coppins, R.L.,Wolf, A.C. and Silverman, S.K. (2003) Deoxyribozymes with 20-50 RNA ligase activity.J. Am. Chem. Soc. 125, 2444–2454.
Hampel, A. and Cowan, J.A. (1997) A unique mechanism for RNA catalysis: the role of metalcofactors in hairpin ribozyme cleavage. Chem. Biol. 4, 513–517.
Johnston, W.K., Unrau, P.J., Lawrence, M.S., Glasner, M.E. and Bartel, D.P. (2001) RNA-catalyzed RNA polymerization: accurate and general RNA-templated primer extension.Science 292, 1319–1325.
Joyce, G.F. (1984) Non-enzymatic template-directed synthesis of RNA copolymers. Orig.Life 14, 613–620.
Joyce, G.F. (1987) Nonenzymatic template-directed synthesis of informational macromole-cules. Cold Spring Harb. Symp. Quant. Biol. 52, 41–51.
Joyce, G.F. and Orgel, L.E. (1999) Prospects for understanding the origin of the RNA world.In: R.F. Gesteland, T.R. Cech and J.F. Atkins (Eds), The RNA World. Cold SpringHarbor Press, Cold Spring Harbor, pp. 49–78.
Kanavarioti, A., Monnard, P.A. and Deamer, D.W. (2001) Eutectic phases in ice facilitatenonenzymatic nucleic acid synthesis. Astrobiology 1, 271–281.
Kuznetsova, M., Novopashina, D., Repkova, M., Venyaminova, A. and Vlassov, V. (2004)Binary hammerhead ribozymes with high cleavage activity. Nucleosides NucleotidesNucleic Acids 23, 1037–1042.
Lohrmann, R. (1975) Formation of nucleoside 50-polyphosphates from nucleotides andtrimetaphosphate. J. Mol. Evol. 6, 237–252.
Lohrmann, R. and Orgel, L.E. (1977) Reactions of adenosine 50phosphorimidazolide withadenosine analogs on a polyuridylic acid template. J. Mol. Biol. 113, 193–198.
Lutay, A.V., Chernolovskaya, E.L., Zenkova, M.A. and Vlassov, V.V. (2005) Nonenzymatictemplate-dependent ligation of 20,30-cyclic phosphate-containing oligonucleotides cata-lyzed by metal ions. Doklady Biochem. Biophys. 401, 163–166.
Lutay, A.V., Chernolovskaya, E.L., Zenkova, M.A. and Vlassov, V.V. (2006) The none-nzymatic template-directed ligation of oligonucleotides. Biogeosciences 3, 243–249.
McGinness, K.E. and Joyce, G.F. (2002) RNA-catalyzed RNA ligation on an external RNAtemplate. Chem. Biol. 9, 297–307.
Monnard, P.A., Kanavarioti, A. and Deamer, D.W. (2003) Eutectic phase polymerization ofactivated ribonucleotide mixtures yields quasi-equimolar incorporation of purine andpyrimidine nucleobases. J. Am. Chem. Soc. 125, 13734–13740.
Mueller, D., Pitsch, S., Kittaka, A., Wagner, E., Wintner, C.E. and Eschenmoser, A. (1990)Chemistry of alpha aminonitriles. Aldomerization of glycoaldehyde phosphate to racemichexose 2,4,6-triphosphates and (in presence of formaldehyde) racemic pentose2,4-diphosphates: rac-allose 2,4,6-triphosphate and racemic ribose 2,4-diphosphate arethe main reaction products. Helv. Chim. Acta 73, 1410–1468.
Orgel, L.E. (2003) Some consequences of the RNAworld hypothesis. Orig. Life Evol. Biosph.33, 211–218.
RNA World: First Steps Towards Functional Molecules 141
Orgel, L.E. (2004) Prebiotic chemistry and the origin of the RNA world. Crit. Rev. Biochem.Mol. Biol. 39, 99–123.
Paul, N. and Joyce, G.F. (2002) Inaugural article: a self-replicating ligase ribozyme. Proc.Natl Acad. Sci. USA 99, 12733–12740.
Pitsch, S., Eschenmoser, A., Gedulin, B., Hui, S. and Arrhenius, G. (1995) Mineral inducedformation of sugar phosphates. Orig. Life Evol. Biosph. 25, 297–334.
Prabahar, K.J. and Ferris, J.P. (1997) Adenine derivatives as phosphate-activating groups forthe regioselective formation of 30,50-linked oligoadenylates on montmorillonite: possiblephosphate-activating groups for the prebiotic synthesis of RNA. J. Am. Chem. Soc. 119,4330–4337.
Pyle, A.M. (2002) Metal ions in the structure and function of RNA. J. Biol. Inorg. Chem. 7,679-690.
Renz,M., Lohrmann, R. andOrgel, L.E. (1971) Catalysts for the polymerization of adenosinecyclic 20,30-phosphate on a poly (U) template. Biochim. Biophys. Acta 240, 463–471.
Robertson,M.P. and Ellington, A.D. (2001) In vitro selection of nucleoprotein enzymes. Nat.Biotechnol. 19, 650–655.
Rogers, J. and Joyce, G.F. (2001) The effect of cytidine on the structure and function of anRNA ligase ribozyme. RNA 7, 395–404.
Sawai, H., Totsuka, S., Yamamoto, K. and Ozaki, H. (1998) Non-enzymatic, template-directed ligation of 20-50 oligoribonucleotides. Joining of a template and a ligator strand.Nucleic Acids Res. 26, 2995–3000.
Sawai, H., Wada, M., Kouda, T. and Nakamura Ozaki, A. (2006) Nonenzymatic ligation ofshort-chained 20-50- or 30-50-linked oligoribonucleotides on 20-50- or 30-50-linked comple-mentary templates. Chembiochem 7, 605–611.
Sleeper, H.L., Lohrmann, R. and Orgel, L.E. (1978) Formation of the imidazolides ofdinucleotides under potentially prebiotic conditions. J. Mol. Evol. 11, 87–93.
Steitz, T.A. and Steitz, J.A. (1993) A general two-metal-ion mechanism for catalytic RNA.Proc. Natl Acad. Sci. USA 90, 6498–6502.
Trinks, H., Schroder,W. and Biebricher, C.K. (2005) Ice and the origin of life. Orig. Life Evol.Biosph. 35, 429–445.
Usher, D.A. and McHale, A.H. (1976) Nonenzymic joining of oligoadenylates on a polyur-idylic acid template. Science 192, 53–54.
Verlander, M.S. and Orgel, L.E. (1974) Analysis of high molecular weight material from thepolymerization of adenosine cyclic 20, 30-phosphate. J. Mol. Evol. 3, 115–120.
Verlander, M.S., Lohrmann, R. and Orgel, L.E. (1973) Catalysts for the self-polymerizationof adenosine cyclic 20, 30-phosphate. J. Mol. Evol. 2, 303–316.
Vlassov, A.V., Johnston, B.H., Landweber, L.F. and Kazakov, S.A. (2004) Ligation activityof fragmented ribozymes in frozen solution: implications for the RNA world. NucleicAcids Res. 32, 2966–2974.
Vorobjeva, M.A., Zenkova, M.A., Venyaminova, A.G. and Vlassov, V.V. (2006) Binaryhammerhead ribozymes with improved catalytic activity. Oligonucleotides 16, 241–254.
142 A. Lutay et al.
Trans Hammerhead Ribozyme:
Ligation vs. Cleavage
M. A. Vorobjeva, A. S. Privalova, A. G. Venyaminova, and V. V. Vlassov
Abstract Trans hammerhead ribozymes are considered from the point of viewof the RNA world theory. An attempt was made to reconstruct the ‘‘ancestors’’of contemporary hammerhead ribozymes with improved ligation activity by
altering the sequence of trans hammerhead motifs. RNA ligation activity oftrans hammerheads was shown to be affected significantly by minor changes innon-conservative regions. In particular, introduction of heptanucleotide bulgeinto stem III led to the 10-fold increase of ligation rate constant. At that, RNA
cleavage was predominant activity in all cases. It was shown that trans hammer-head ribozyme can assemble from two separate short oligoribonucleotidesupon binding to RNA substrate. This binary hammerhead ribozyme possessesa higher RNA-cleaving activity than its full-length analog. It can be assumed
that such self-assembling multi-subunit catalytic RNAs could exist at earlystages of the prebiotic evolution.
1 Introduction
The discovery of catalytic RNAs (ribozymes) capable of performing the site-specific phosphodiester bond cleavage in the absence of proteins (Cech et al.,
1981; Guerrier-Takada et al., 1983) provided a paradigm shift in molecularbiology and led to the hypothesis of RNA world which is generally acceptednowadays as origin-of-life scenario (see reviews: Joyce, 2002; Spirin, 2002;Muller, 2006). According to this theory, first RNA molecules were formedfrom abiogenous ribonucleotides or their activated derivatives. As it was dis-
covered by Chetverin et al. (Chetverina et al., 1999), spontaneous rearrange-ments of RNA sequences can occur in the absence of any catalysts or cofactors.In the early RNAworld, this reaction could be a driving force for the elongation
M. A. VorobjevaInstitute of Chemical Biology and Fundamental Medicine, Novosibirsk, Russiae-mail : [email protected]
N. Dobretsov et al. (eds.), Biosphere Origin and Evolution.� Springer 2008
143
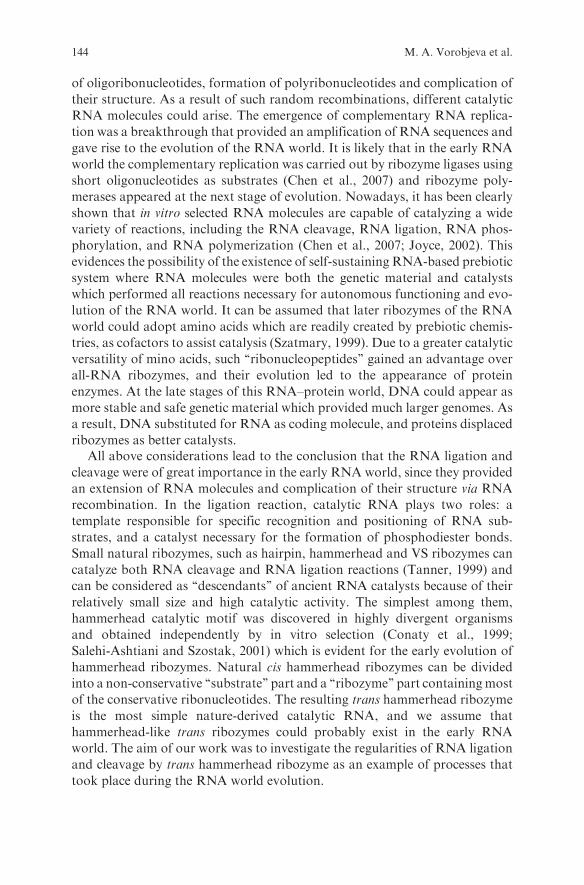
of oligoribonucleotides, formation of polyribonucleotides and complication of
their structure. As a result of such random recombinations, different catalytic
RNA molecules could arise. The emergence of complementary RNA replica-
tion was a breakthrough that provided an amplification of RNA sequences and
gave rise to the evolution of the RNA world. It is likely that in the early RNA
world the complementary replication was carried out by ribozyme ligases using
short oligonucleotides as substrates (Chen et al., 2007) and ribozyme poly-
merases appeared at the next stage of evolution. Nowadays, it has been clearly
shown that in vitro selected RNA molecules are capable of catalyzing a wide
variety of reactions, including the RNA cleavage, RNA ligation, RNA phos-
phorylation, and RNA polymerization (Chen et al., 2007; Joyce, 2002). This
evidences the possibility of the existence of self-sustaining RNA-based prebiotic
system where RNA molecules were both the genetic material and catalysts
which performed all reactions necessary for autonomous functioning and evo-
lution of the RNA world. It can be assumed that later ribozymes of the RNA
world could adopt amino acids which are readily created by prebiotic chemis-
tries, as cofactors to assist catalysis (Szatmary, 1999). Due to a greater catalytic
versatility of mino acids, such ‘‘ribonucleopeptides’’ gained an advantage over
all-RNA ribozymes, and their evolution led to the appearance of protein
enzymes. At the late stages of this RNA–protein world, DNA could appear as
more stable and safe genetic material which provided much larger genomes. As
a result, DNA substituted for RNA as coding molecule, and proteins displaced
ribozymes as better catalysts.All above considerations lead to the conclusion that the RNA ligation and
cleavage were of great importance in the early RNA world, since they provided
an extension of RNA molecules and complication of their structure via RNA
recombination. In the ligation reaction, catalytic RNA plays two roles: a
template responsible for specific recognition and positioning of RNA sub-
strates, and a catalyst necessary for the formation of phosphodiester bonds.
Small natural ribozymes, such as hairpin, hammerhead and VS ribozymes can
catalyze both RNA cleavage and RNA ligation reactions (Tanner, 1999) and
can be considered as ‘‘descendants’’ of ancient RNA catalysts because of their
relatively small size and high catalytic activity. The simplest among them,
hammerhead catalytic motif was discovered in highly divergent organisms
and obtained independently by in vitro selection (Conaty et al., 1999;
Salehi-Ashtiani and Szostak, 2001) which is evident for the early evolution of
hammerhead ribozymes. Natural cis hammerhead ribozymes can be divided
into a non-conservative ‘‘substrate’’ part and a ‘‘ribozyme’’ part containingmost
of the conservative ribonucleotides. The resulting trans hammerhead ribozyme
is the most simple nature-derived catalytic RNA, and we assume that
hammerhead-like trans ribozymes could probably exist in the early RNA
world. The aim of our work was to investigate the regularities of RNA ligation
and cleavage by trans hammerhead ribozyme as an example of processes that
took place during the RNA world evolution.
144 M. A. Vorobjeva et al.

2 RNA Ligation by Trans Hammerhead Ribozymes
A lot of artificial ribozymes capable of site-specific RNA cleavage weredesigned on the basis of hammerhead motif (see reviews: Amarzguioui andPrydz, 1998; Citti and Rainaldi, 2005; Grassi et al., 2004; Peracchi, 2004;Schubert and Kurreck, 2004), but the ligation activity of these ribozymes isstudied rather poor. It was shown that the rate constant for the reaction ofRNA ligation (which has beenmeasured for a few hammerhead sequences) is, inaverage, 0.01 min–1, while the rate constant for the cleavage is about 1 min–1
(Hertel and Uhlenbeck, 1995; Hertel et al., 1994; Stage-Zimmermann andUhlenbeck, 1998). It was proposed that the strong preference for the cleavagereaction is caused by the flexibility of complex of hammerhead ribozyme withtwo ligation substrates providing an entropic advantage for cleavage (Hertelet al., 1995). This suggestion was further proved by design of ‘‘conformationallyrestricted’’ cis hammerhead ribozyme, where ribozyme and ligation substratewere jointed covalently by a disulfide crosslink (Blount and Uhlenbeck, 2002;Stage-Zimmermann and Uhlenbeck, 2001). The modification made thecomplex more rigid, giving 50-fold increase in the ligation efficiency. Anotherpossibility to improve the ligation activity by reducing the flexibility ofribozyme–substrates complex could be the introduction of auxiliary elementsimitating loops or bulges in stem I of natural hammerhead ribozymes. It isknown that tertiary interactions between these elements and loop II stabilize theactive conformation of the complex formed by ribozyme and cleavage sub-strate, thus enhancing the cleavage activity (Burke and Greathouse, 2005;Penedo et al., 2004; Przybilski and Hammann, 2006; Weinberg and Rossi,2005; Westholf, 2007). It can be assumed that such loop–loop interactionscould as well stabilize the complex of ribozyme with ligation substrates andimprove the ligation activity. Indeed, it has been shown recently that thepresence of loop I in cis hammerhead ribozyme from satellite tobacco ringspotvirus (sTRSV) increases the efficiency of RNA ligation (Nelson et al., 2005).
We supposed that during the evolution of hammerhead ribozyme, its struc-ture changed so that the balance between cleavage and ligation shifted towardscleavage. In the present study, we examined the possibility to reconstruct the‘‘ancestors’’ of contemporary hammerhead ribozymes with improved ligationactivity by altering the sequence of hammerhead motif. Two variants of transhammerhead ribozymes were designed which could potentially possess animproved ligation activity. In the first variant, a semi-conservative U7 in thecatalytic core was replaced by cytidine, adenosine or guanosine (Fig. 1a).According to (Simorre et al., 1997) these mutations would disrupt U4–U7
base pair in a complex of ribozyme with substrates of ligation and change itsstructure; the authors supposed that this conformational change can potentiallybe favorable for the RNA ligation. The second variant represents hammerheadribozyme containing 7-nt bulge in stem I (Rz-bulge-I, Fig. 1b). Since all ribo-zymes designed in this work are based on sTRSV hammerhead motif, the
Trans Hammerhead Ribozyme: Ligation vs. Cleavage 145
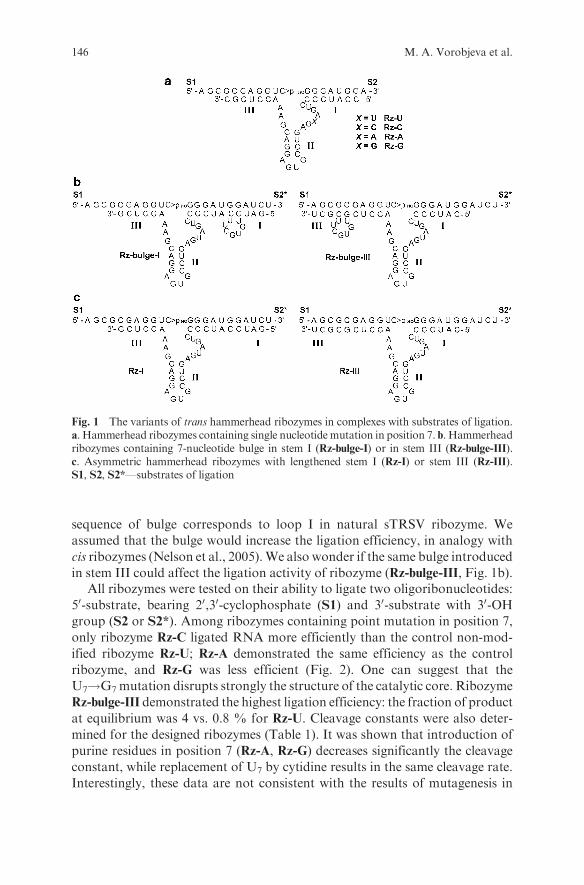
sequence of bulge corresponds to loop I in natural sTRSV ribozyme. Weassumed that the bulge would increase the ligation efficiency, in analogy with
cis ribozymes (Nelson et al., 2005).We also wonder if the same bulge introduced
in stem III could affect the ligation activity of ribozyme (Rz-bulge-III, Fig. 1b).All ribozymes were tested on their ability to ligate two oligoribonucleotides:
50-substrate, bearing 20,30-cyclophosphate (S1) and 30-substrate with 30-OHgroup (S2 or S2*). Among ribozymes containing point mutation in position 7,
only ribozyme Rz-C ligated RNA more efficiently than the control non-mod-
ified ribozyme Rz-U; Rz-A demonstrated the same efficiency as the control
ribozyme, and Rz-G was less efficient (Fig. 2). One can suggest that theU7!G7mutation disrupts strongly the structure of the catalytic core. Ribozyme
Rz-bulge-III demonstrated the highest ligation efficiency: the fraction of product
at equilibrium was 4 vs. 0.8 % for Rz-U. Cleavage constants were also deter-
mined for the designed ribozymes (Table 1). It was shown that introduction of
purine residues in position 7 (Rz-A, Rz-G) decreases significantly the cleavageconstant, while replacement of U7 by cytidine results in the same cleavage rate.
Interestingly, these data are not consistent with the results of mutagenesis in
Fig. 1 The variants of trans hammerhead ribozymes in complexes with substrates of ligation.a. Hammerhead ribozymes containing single nucleotide mutation in position 7. b. Hammerheadribozymes containing 7-nucleotide bulge in stem I (Rz-bulge-I) or in stem III (Rz-bulge-III).c. Asymmetric hammerhead ribozymes with lengthened stem I (Rz-I) or stem III (Rz-III).S1, S2, S2*—substrates of ligation
146 M. A. Vorobjeva et al.

position 7 obtained by Ruffner et al. (1990): ribozymes containing purines in
position 7 were more active than their C7-containing analog. The rate constants
for ligation were calculated from cleavage constants and equilibrium amount of
the ligated product (Seq), using Eq. 1 (Hertel et al., 1994):
Keq ¼ kcleav�klig ¼ 1
�Seq (1)
Among ribozymes with mutations in position 7, A7 and G7-containing
ribozymes demonstrated a lower ligation rate than control Rz-U. Since their
cleavage activity is also lower, one can conclude that purine residues in position
7 cause a significant distortion of the ribozyme structure. Ribozyme Rz-bulge-I
Fig. 2 The equilibrium extent of RNA ligation by different variants of hammerhead ribo-zymes. Reaction conditions: 158C, 50 mM Tris-HCl, pH 7.5, 10 mMMgCl2, 5 mM ribozyme,50 nM [32P]-labeled S1, 5 mM S2 or S2*
Table 1 RNA cleavage and ligation parameters for hammerhead ribozymes designed in thiswork
Ribozyme kcleav, (min�1) Seq Keq klig, (min�1)
RzU 5.0 0.0083 120.5 0.042
RzC 5.0 0.0168 59.5 0.084
RzA 1.8 0.0087 114.9 0.016
RzG 1 0.0025 400 0.0025
Rz-bulge-I 0.3 0.005 200 0.0015
Rz-I 0.15 0.0030 333.3 0.0005
Rz-bulge-III 11.1 0.0402 24.9 0.45
Rz-III 6.1 0.0200 50 0.12
Cleavage conditions: 158C, 50 mM Tris-HCl, pH 7.5, 10 mM MgCl2, 10 nM [32P]-labeledcleavage substrates, 10 mM ribozyme. Ligation conditions: 158C, 50 mMTris-HCl, pH 7.5, 10mM MgCl2, 5 8M ribozyme, 50 nM [32P]-labeled S1, 5 mM S2. Seq – fraction of ligationproduct at equilibrium, Keq – equilibrium constant for the cleavage-ligation reaction. Therelative experimental error was �20%.Cleavage substrates: 50-AGCGCGAGGUCGGGAUGGA (forRz-U, Rz-C, Rz-A, andRz-G)or 50-AGCGCGAGGUCGGGAUGGAUCU (forRz-bulge-I, Rz-I, Rz-bulge-III, and Rz-III).Ligation substrates are presented at Fig. 1.
Trans Hammerhead Ribozyme: Ligation vs. Cleavage 147

with loop I-imitating bulge was found to be less efficient than control ribozymeRz-U both in ligation and in cleavage reactions. This unexpected loss of activitycan be attributed to the asymmetry of its substrate-binding domains. The bulgehas to be placed six nucleotides apart form catalytic core to resemble the wild-type structure, therefore the overall length of stem I in Rz-bulge-I is 10 basepairs. According to (Hendry andMcCall, 1996), lengthening of stem I can slowthe exchange between the active and inactive conformations of the ribozyme–substrate complex and inhibit the cleavage. We assume that 10 bp stem I ofRz-bulge-I turned out to be long enough to produce the same effect. It isnoteworthy that Rz-bulge-III, where the same bulge is placed in stem III, andstem I contains only 6 bp, displayed the maximal cleavage and ligation effi-ciency. To estimate directly the influence of the flanking arms asymmetry oncatalytic properties, two control asymmetric ribozymes were designed,Rz-I andRz-III (Fig. 2c) with the same asymmetry of substrate-binding domains as inRz-bulge-I and Rz-bulge-III, respectively. Ribozyme Rz-I with lengthenedstem I displayed lower catalytic activity both in ligation and in cleavage reac-tions than its bulge-containing analogRz-bulge-I. These results clearly evidencethat the loss of activity is caused solely by the lengthening of stem I, and theintroduction of 7-nt bulge into stem I, though positively influence catalyticactivity, cannot entirely compensate this effect. On the other hand, the catalyticactivity of ribozyme Rz-III with lengthened stem III was closer to that ofcontrol Rz-U, and significantly lower as compared to Rz-bulge-III. Thus, 7-ntbulge in stem III is responsible for the increase of cleavage activity.
It was also of interest to determine the nature of phosphodiester bondformed upon ligation. The ligation product was gel-purified and hydrolyzedby nuclease P1 which is known to cleave only 30–50 bonds. If linkage between Gand C is 20–50, no cleavage would proceed at this site. It was shown that alllinkages in oligoribonucleotide obtained by ligation were hydrolyzed by P1nuclease, thus we concluded that natural 30–50 bond is a product of ligation.
Thus, ligation activity of trans hammerhead ribozymes can be improved bychanging the nucleotide sequence in non-conservative positions. However,equilibrium for the hammerhead reaction is still shifted towards cleavage.
3 Binary Hammerhead Ribozymes
It can be assumed that in the early RNAworld, catalytic RNAswere representedby multi-subunit complexes made of several short oligonucleotides. We haveshown that hammerhead ribozyme can be divided into two separate partiallycomplementary oligonucleotides capable to form catalytically active structurewithout tetraloop II after binding to RNA substrate (Fig. 3) (Kuznetsova et al.,2003, 2004; Vorobjeva et al., 2005a,b; Vorobjeva et al., 2006).
Under single turnover conditions this binary ribozyme cleaves RNAwith thesame efficiency as full-length analog. It is notable that under multiple turnover
148 M. A. Vorobjeva et al.

conditions catalytic activity of binary ribozyme can be altered by varying the
ratio of ribozyme chains, and an increase in the concentration of any strand
resulted in a significant increase in the cleavage efficiency, at that binary
hammerhead ribozyme becomes more effective than full-length one (Fig. 3b).
These properties of binary ribozyme could be attributed to the mechanism of its
interaction with RNA substrate. Apparently, formation of the binary
ribozyme-substrate complex includes two steps: (1) binding of one strand to
RNA, and (2) association of the second strand with pre-formed complex. This
suggestion was proved by a gel-shift assay of ribozyme-substrate complex
formation. To monitor directly the complex association, non-cleavable analog
of RNA substrate was used, bearing 20-O-methyl cytidine in the cleavage site
(RNA19m). It was shown that two-component complex of RNA and one of the
strands forms first, and then the second strand joins this complex (Fig. 4).
Fig. 4 Assembling of three-component complex of binary ribozyme and non-cleavablesubstrate RNA19m (autoradiograph of non-denaturing 15% polyacrylamide gel). Complexassociation was monitored at 258C under the same buffer conditions as those forribozyme cleavage (50 mM Tris-HCl, pH 7.5, 10 mM MgCl2), at 10 nM LRz, 50 nMRRz, and 50 nM [32P]-RNA19m. Controls: C1—RNA19m, C2—LRz �RNA19m complex,C3—LRz �RNA19m �RRz complex, C4—RRz �RNA19m complex. Lanes 0.5,. . ., 15—non-cleavable RNA substrate incubated with LRz and RRz for the indicated time
Fig. 3 RNA cleavage by binary hammerhead ribozyme binRz and its full-length analogRz-U under multiple turnover conditions. Kinetic curves are numbered as follows: 1: [RRz]= 0.1 mM, [LRz] = 0.01 mM (circles); 2: [RRz] = 0.01 mM, [LRz] = 0.1 mM (squares);3: [Rz-U] = 0.01 mM (triangles); 4: [RRz] = [LRz] = 0.01 mM (reverse triangles). Reactionconditions: 378C; 50 mM Tris-HCl, pH 7.5, 10 mM MgCl2, 0.1 mM [32P]-labeled RNA19
Trans Hammerhead Ribozyme: Ligation vs. Cleavage 149

Thus, different catalytic properties of binary and full-length ribozymes are
caused by distinctive features of their interaction with RNA substrate and
cleavage products. To reveal these differences and to investigate in detail the
properties of binary catalytic RNA, we compared catalytic cycles of binary and
full-length ribozymes.To propose a catalytic cycle of RNA cleavage by binary ribozyme, we based
on a kinetic scheme for full-length hammerhead ribozyme (Fedor and
Uhlenbeck, 1992; Hertel and Uhlenbeck, 1995, Hertel et al., 1994), including
substrate binding, cleavage and release of both products by different ways as
well as reverse reactions (Fig. 5a). Binary ribozyme is built of two separate
oligonucleotides, and ribozyme-substrate association, as we discussed above, is
a two-stage process. Products dissociation step also seems to be different in
catalytic cycles of full-length and binary ribozymes. After the phosphodiester
bond cleavage, some of non-canonical base pairs between nucleotides of cata-
lytic core that stabilize stem II in ribozyme–substrate complex are loss (Simorre
et al., 1997), and duplex II, which is less stable than 7-bp duplexes I and III,
dissociates in the first instance. After that two complexes of ribozyme strands
with correspondent cleavage products would dissociate independently. Based
on these considerations, we proposed a scheme for the catalytic cycle of binary
ribozyme (Fig. 5b). We have shown previously that the rate constants for
phosphodiester bond cleavage (k2) are similar for binary and full-length
Fig. 5 Kinetic schemes of RNA cleavage by full-length (a) and binary (b) hammerheadribozymes. Abbreviations: flRz, full-length ribozyme; LRz, ‘‘left’’ strand of binary ribozyme;RRz, ‘‘right’’ strand of binary ribozyme; S, RNA substrate; P1, 50-cleavage product; P2,30-cleavage product
150 M. A. Vorobjeva et al.
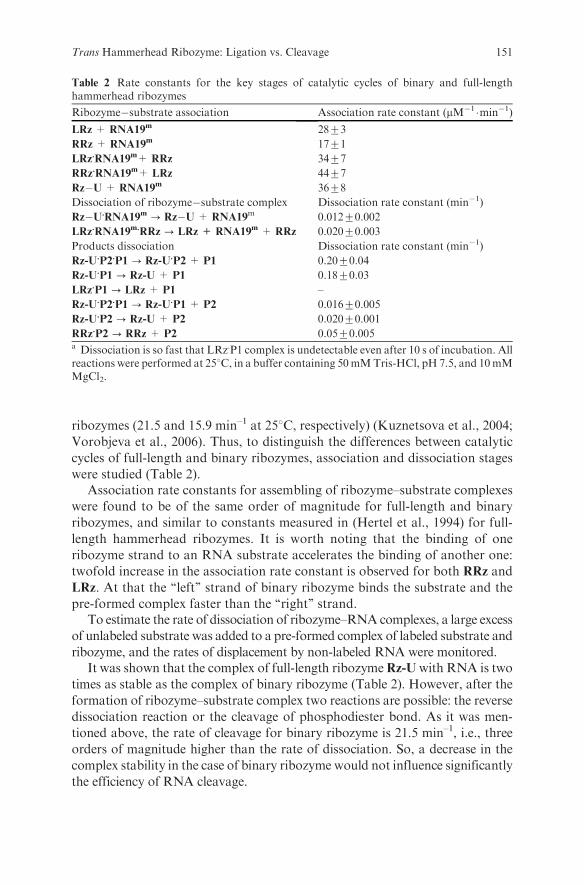
ribozymes (21.5 and 15.9 min–1 at 258C, respectively) (Kuznetsova et al., 2004;
Vorobjeva et al., 2006). Thus, to distinguish the differences between catalytic
cycles of full-length and binary ribozymes, association and dissociation stages
were studied (Table 2).Association rate constants for assembling of ribozyme–substrate complexes
were found to be of the same order of magnitude for full-length and binary
ribozymes, and similar to constants measured in (Hertel et al., 1994) for full-
length hammerhead ribozymes. It is worth noting that the binding of one
ribozyme strand to an RNA substrate accelerates the binding of another one:
twofold increase in the association rate constant is observed for both RRz and
LRz. At that the ‘‘left’’ strand of binary ribozyme binds the substrate and the
pre-formed complex faster than the ‘‘right’’ strand.To estimate the rate of dissociation of ribozyme–RNA complexes, a large excess
of unlabeled substrate was added to a pre-formed complex of labeled substrate and
ribozyme, and the rates of displacement by non-labeled RNA were monitored.It was shown that the complex of full-length ribozymeRz-Uwith RNA is two
times as stable as the complex of binary ribozyme (Table 2). However, after the
formation of ribozyme–substrate complex two reactions are possible: the reverse
dissociation reaction or the cleavage of phosphodiester bond. As it was men-
tioned above, the rate of cleavage for binary ribozyme is 21.5 min–1, i.e., three
orders of magnitude higher than the rate of dissociation. So, a decrease in the
complex stability in the case of binary ribozyme would not influence significantly
the efficiency of RNA cleavage.
Table 2 Rate constants for the key stages of catalytic cycles of binary and full-lengthhammerhead ribozymes
Ribozyme�substrate association Association rate constant (mM�1�min�1)
LRz + RNA19m 28+3
RRz + RNA19m 17+1
LRz.RNA19m+ RRz 34+7
RRz.RNA19m+ LRz 44+7
Rz�U + RNA19m 36+8
Dissociation of ribozyme�substrate complex Dissociation rate constant (min�1)
Rz�U.RNA19m ? Rz�U + RNA19m 0.012+0.002
LRz.RNA19m.RRz ? LRz + RNA19m + RRz 0.020+0.003
Products dissociation Dissociation rate constant (min�1)
Rz-U.P2.P1 ? Rz-U.P2 + P1 0.20+0.04
Rz-U.P1 ? Rz-U + P1 0.18+0.03
LRz.P1 ? LRz + P1 –
Rz-U.P2.P1 ? Rz-U.P1 + P2 0.016+0.005
Rz-U.P2 ? Rz-U + P2 0.020+0.001
RRz.P2 ? RRz + P2 0.05+0.005
a Dissociation is so fast that LRz.P1 complex is undetectable even after 10 s of incubation. Allreactions were performed at 258C, in a buffer containing 50mMTris-HCl, pH 7.5, and 10mMMgCl2.
Trans Hammerhead Ribozyme: Ligation vs. Cleavage 151

Another characteristic distinction in catalytic cycles of binary and full-lengthribozymes is the step of product release. Under multiple turnover conditions,this stage is often rate-limiting and determines the number of ribozyme turn-overs and the efficiency of RNA cleavage. In the case of binary ribozyme,complex with two cleavage products was not observed even at large excess ofribozyme components, so we were able to measure only the rates of dissociationof each product from the corresponding strand of binary ribozyme. Bothcleavage products dissociated from the components of binary ribozyme mark-edly faster than from full-length analog: the rate of dissociation of 30-productP2 from the ‘‘right’’ strand is twofold higher than from complexes with full-length ribozymeRz-U �P1 �P2 andRz-U �P2 (Table 2).Moreover, 50-productP1released from the ‘‘left’’ strand of binary ribozyme so quickly that we could notmeasure the dissociation rate: LRz �P1 complex was not observed after 10 s ofincubation. Under the same conditions Rz-U �P1 complex was detected evenafter 5 min of incubation. Taken together, these results clearly indicate that therate of release of the 50-product is much higher in the case of binary ribozyme.
As it can be concluded from the kinetic description of catalytic cycles, theassembling of binary ribozyme from two oligomers on RNA substrate proceedsas fast as ribozyme-substrate complex formation in the case of its full-lengthanalog. At the same time, the binary ribozyme is characterized by a fasterrelease of cleavage products.
Thus, binary hammerhead ribozyme possesses an improved ratio of associa-tion/dissociation rates in the catalytic cycle, as compared to its full-lengthanalog. Obtained results are in a good agreement with RNA cleavage experi-ments under multiple turnover conditions (Fig. 3b). The use of the ‘‘left’’ strandas deficient component at equal concentrations of ‘‘right’’ strand and substrateresults in the maximal cleavage efficiency, which is significantly higher thanefficiency of the full-length ribozyme. As it can be concluded from our kineticstudies, this effect is provided by several factors: (1) fast rate of association ofLRz with pre-formed complex RRz �S; (2) independent dissociation of cleavageproducts from the components of binary ribozyme; (3) fast release of the ‘‘left’’ribozyme strand from the complex with cleavage product.
Binary hammerhead ribozyme can be considered as the simplest RNAendonuclease with high efficiency and specificity. We hypothesize that at theearly stages of RNA world catalytic RNAs could emerge not only from spon-taneous RNA recombinations, but also from occasional assembling of shortoligoribonucleotides into catalytically active complexes.
4 Conclusion
To conclude, hammerhead ribozymes can be considered as ‘‘molecular fossils’’of RNA world because of their small size, structural simplicity and highcatalytic activity, as well as the fact that hammerhead motifs were discovered
152 M. A. Vorobjeva et al.

in highly divergent organisms. The data described above shows that ligationactivity of trans hammerhead ribozymes can be significantly enhanced byaltering the nucleotide sequence of non-conservative regions, at that RNAcleavage is the main catalytic activity of these ribozymes. It is likely that bothactivities of ‘‘ancient’’ hammerhead ribozymes were employed in early RNAworld, providing the extension of RNA molecules and recombination of theirfragments. It was demonstrated that highly active hammerhead-like structurecan assemble from separate catalytically inactive oligonucleotides. Detailedkinetic comparison of binary and full-length ribozymes revealed that binaryribozymes possess better ratio of association/dissociation rates in catalyticcycle. It can be assumed that such self-assembling multi-subunit catalyticRNAs could exist at early stages of pre-biological evolution, acting as specificand efficient RNA endonucleases. Since both ribozyme components were inclose proximity, bound to the same RNA template, they might be ligated bysome other ribozymes, with the formation of joint full-length hammerheadribozyme. It is worth noting that binary hammerhead ribozyme can catalyzethe RNA cleavage, but not RNA ligation, because the formation of four-component complex between two ribozyme components and two ligationsubstrates is almost impossible. In contrast, full-length hammerhead ribo-zymes are able to catalyze both cleavage and ligation reactions, and thisextended functionality could be an advantage over the binary analogs, thatprovided the transition from binary to full-length ribozymes during the nat-ural selection.
Acknowledgment This work was supported by RFBR (project No. 05-04-48341), RAS Pro-gram ‘‘Origin of Life and Evolution of the Biosphere’’, and Lavrentiev Competition of YoungScientists’ projects of SB RAS.
References
Amarzguioui, M. and Prydz, H. (1998) Hammerhead ribozyme design and application. Cell.Mol. Life Sci. 54, 1175–1202.
Blount, K.F. and Uhlenbeck, O.C. (2002) Internal equilibrium of the hammerhead ribozymeis altered by the length of certain covalent cross-links. Biochemistry 41, 6834–6841.
Burke, D.H. and Greathouse, S.T. (2005). Low-magnesium, trans-cleavage activity bytype III, tertiary stabilized hammerhead ribozymes with stem I discontinuities. BMCBiochemistry 6, 14.
Cech, T.R., Zaug, A.J. and Grabowski, P.J. (1981). In vitro splicing of the ribosomal RNAprecursor of Tetrahymena: involvement of a guanosine nucleotide in the excision of theintervening sequence. Cell 27, 487–496.
Chen, X., Li, N. and Ellington, A.D. (2007) Ribozyme catalysis of metabolism in the RNAworld. Chem. Biodivers. 4, 633–655.
Chetverina, H.V., Demidenko, A.A., Ugarov, V.I. and Chetverin, A.B. (1999) Spontaneousrearrangements in RNA sequences. FEBS Lett. 450, 89–94.
Citti, L. and Rainaldi, G. (2005) Synthetic hammerhead ribozymes as therapeutic tools tocontrol disease genes. Curr. Gene Ther. 5, 11–24.
Trans Hammerhead Ribozyme: Ligation vs. Cleavage 153

Conaty, J., Hendry, P. and Lockett, T.J. (1999) Selected classes of minimised hammerheadribozymes have very high cleavage rates at low Mg2þ concentration. Nucleic Acids Res.27, 2400–2407.
Fedor, M.J. and Uhlenbeck, O.C. (1992) Kinetics of intermolecular cleavage by hammerheadribozymes. Biochemistry 31, 12042–12054.
Grassi, G., Dawson, P., Guarneri, G., Kandolf, R. and Grassi, M. (2004) Therapeuticpotential of hammerhead ribozymes in the treatment of hyper-proliferative diseases.Curr. Pharm. Biotechnol. 5, 369–386.
Guerrier-Takada, C., Gardiner, K., Marsh, T., Pace, N. and Altman, S. (1983) The RNAmoiety of ribonuclease P is the catalytic subunit of the enzyme. Cell 35, 849–857.
Hendry, P. and McCall, M. (1996) Unexpected anisotropy in substrate cleavage rates byasymmetric hammerhead ribozymes. Nucleic Acids Res. 24, 2679–2684.
Hertel, K.J. and Uhlenbeck, O.C. (1995) The internal equilibrium of the hammerheadribozyme reaction. Biochemistry 34, 1744–1749.
Hertel, K.J., Herschlag, D. and Uhlenbeck, O.C. (1994) A kinetic and thermodynamic frame-work for the hammerhead ribozyme reaction. Biochemistry 33, 3374–3385.
Joyce, G.F. (2002) The antiquity of RNA-based evolution. Nature 418, 214–221.Kuznetsova, M., Fokina, A., Lukin, M., Repkova, M., Venyaminova, A. and Vlassov, V.
(2003) Catalytic DNA and RNA for targeting MDR1 mRNA. Nucleosides NucleotidesNucleic Acids 23, 1521–1523.
Kuznetsova, M., Novopashina, D., Repkova, M., Venyaminova, A. and Vlassov, V. (2004)Binary hammerhead ribozymes with high cleavage activity. Nucleosides NucleotidesNucleic Acids 24, 1037–1043.
Muller, U.F. (2006) Re-creating an RNA world. Cell. Mol. Life Sci. 63, 1278–1293.Nelson, J.A., Shepotinovskaya, I. and Uhlenbeck, O.C. (2005) Hammerheads derived from
sTRSV show enhanced cleavage and ligation rate constants. Biochemistry 44,14577-14585.
Penedo, J.C., Wilson, T.J., Jayasena, S.D., Khvorova, A. and Lilley, D.M. (2004) Folding ofthe natural hammerhead ribozyme is enhanced by interaction of auxiliary elements. RNA.10, 880–888.
Peracchi, A. (2004) Prospects for antiviral ribozymes and deoxyribozymes. Rev. Med. Virol.14, 47–64.
Przybilski, R. and Hammann, C. (2006) The hammerhead ribozyme structure brought in line.ChemBioChem 7, 1641–1644.
Ruffner, D.E., Stormo, G.D. and Uhlenbeck, O.C. (1990) Sequence requirements of thehammerhead RNA self-cleavage reaction. Biochemistry 29, 10695–10702.
Salehi-Ashtiani, K. and Szostak, J.W. (2001) In vitro evolution suggests multiple origins forthe hammerhead ribozyme. Nature 414, 82–84.
Schubert, S. and Kurreck, J. (2004) Ribozyme- and deoxyribozyme-strategies for medicalapplications. Curr. Drug Targets 5, 667–681.
Simorre, J.P., Legault, P., Hangar, A.B., Michiels, P. and Pardi, A. (1997) A conformationalchange in the catalytic core of the hammerhead ribozyme upon cleavage of an RNAsubstrate. Biochemistry 36, 518–525.
Spirin, A.S. (2002) Omnipotent RNA. FEBS Lett. 530, 4–8.Stage-Zimmermann, T.K. and Uhlenbeck, O.C. (1998) Hammerhead ribozymes kinetics.
RNA 4, 875–889.Stage-Zimmermann, T.K. and Uhlenbeck, O.C. (2001) A covalent crosslink converts
the hammerhead ribozyme from a ribonuclease to an RNA ligase. Nat. Struct. Biol. 8,863–867.
Szatmary, E. (1999) The origin of the genetic code. Amino acids as cofactors in an RNAworld. Trends Genet. 15, 223–229.
Tanner, N.K. (1999) Ribozymes: the characteristics and properties of catalytic RNAs. FEMSMicrobiol Rev. 23, 257–275.
154 M. A. Vorobjeva et al.

Vorobjeva, M., Gusseva, E., Repkova, M., Kovalev, N., Zenkova, M., Venyaminova, A. andVlassov, V. (2005a) Modified binary hammerhead ribozymes with high catalytic activity.Nucleosides Nucleotides Nucleic Acids 25, 1105–1109.
Vorobjeva, M.A., Gusseva, E.V., Venyaminova, A.G. and Vlassov, V.V. (2005b) Binarycatalytic RNA. International Workshop ‘‘Biosphere Origin and Evolution’’. 74–75.Abstracts.
Vorobjeva, M., Zenkova, M., Venyaminova, A. and Vlassov, V. (2006) Binary hammerheadribozymes with improved catalytic activity. Oligonucleotides 16, 239–252.
Weinberg, M.S. and Rossi, J.J. (2005) Comparative single-turnover kinetic analyses of trans-cleaving hammerhead ribozymes with naturally derived non-conserved sequence motifs.FEBS Lett. 579, 1619–1624.
Westholf, E. (2007) A tale in molecular recognition: the hammerhead ribozyme.J. Mol. Recogn. 20, 1–3.
Trans Hammerhead Ribozyme: Ligation vs. Cleavage 155

Paradoxical Bistate Status of a Prebiotic
Microsystem: Universal Predecessor of Life
V. N. Kompanichenko
Abstract A prebiotic organic microsystem has a chance to be transformed into asimplest living unit only through the intermediate stage—acquisition of the specificbistate status. The status is a result of uncompleted bifurcate transition of a chemicalsystem from the initial state into advanced state under oscillating nonequilibriumconditions. In the case of the balance between the tendencies to the forward andreverse transitions, the system oscillates around the highest point of bifurcationdisplacing to the initial and advanced states by turns. It acquires the paradoxicalway of organization—‘‘stabilized instability.’’ The remarkable characteristic of suchorganization is that the principally unstable point of bifurcation is ‘‘incorporated’’between two opposite but equal forces. This way of organization allows the pre-biotic microsystem to maintain the following properties, which are at the founda-tion of life: incessant inner fluctuations and re-arrangement of molecules; integritythrough cooperative events; exchange by matter and energy with the environment;latent biforked structure consisting of two interrelated co-structures; natural dichot-omy at the end of cycle of the existence, etc. The aim of the suggesting experimentalresearch is to obtain bistate prebiotic microsystems, which are able to evolve to life.During the experiments various prebiotic models should be explored at the state ofbifurcate transition and under oscillating conditions in experimental chamber.
1 Introduction
Since the classical works by A. Oparin, various organic microsystemsare considered as possible prebiotic models: coacervates (A. Oparin), RNA-World macromolecules (D. Gilbert, G. Joice), liposomes (D. Deamer, P. Luisi),proteinoide microspheres (S. Fox, K. Dose), marigranules (M. Ventilla,
V. N. KompanichenkoInstitute for Complex Analysis at Birobidzhan (Russia)e-mail: [email protected] of California at Santa Cruz, Department of Chemistry and Biochemistry (USA)e-mail: [email protected]
N. Dobretsov et al. (eds.), Biosphere Origin and Evolution.� Springer 2008
157

F. Egami), aromatic World molecules (P. Ehrenfreund), etc. These microsys-tems demonstrate some signs of the internal and external activity that arerelevant for living processes. For instance, RNA-World molecules are able toself-replicate, proteinoides possess catalytic activity, coacervates may grow andselectively assimilate substance. However, these initial signs of activity in themicrosystems are not converted into the corresponding self-maintaining pro-cesses (metabolism, natural self-replication), which are characteristic of life. Wehave to conclude that there exists is a principal gap separating the prebioticmodels and living cells.
The gap between non-living prebiotic microsystems and living microorgan-isms shows us that they are fundamentally different types of natural systems. Ifwe comprehend the systemic difference between prebiotic microsystems andcells, we will get a good chance to understand a nature of the gap and outline theway to life. This thesis was a starting-point for the elaborated initial version ofthe systemic approach to the origin of life (Kompanichenko, 2004). It is aimedto comparison of biological and non-biological types of natural systems basingon their fundamental properties, i.e. in fact comparison of the biological andnon-biological properties. The major result of the initial version is that any kindof prebiotic microsystems has a chance to be transformed into a simplest livingunit only through acquiring the bistate status that is an intermediate stagebetween non-life and life. So, according to the author’s conception the generalway to life lies through initial transformation of a prebiotic organic microsys-tem (its kind should be discussed) into bistate prebiotic microsystem, and thenthe last one into simplest living unit (probiont). The article is devoted toadvanced consideration of the intermediate stage of the origin of life pro-cess—a prebiotic microsystem having bistate status.
2 Fundamental Properties of Biological Systems
About 230 properties (features) of biological systems were distinguished byseveral tens competent scientists around the whole world in the book ‘‘Funda-mentals of Life’’ (2002). The book is the latest summarizing in this field offundamental biology. It contains 78 short definitions of life and 25 selectedfundamental papers. More or less definite properties of life are substantiated in64 short definitions and papers. The properties suggested by the differentauthors are often identical or similar to each other. According to the carriedout generalization, 31 fundamental properties of biological systems can becompiled on the basis of this data (Kompanichenko, 2003, 2004). Only 19 ofthem can be considered as the unique fundamental properties of biosystems,which are not peculiar to any other natural system. The remaining 12 areattributed to the non-unique fundamental properties. These or similar featuressometimes display themselves in few non-biological systems, although they aredevoid of any biological specificity.
158 V. N. Kompanichenko

The unique fundamental properties can be united into four key, or integratedproperties, which are expressed an essence of the biological organization. Theyare the following.
1. The ability of a living organism to concentrate free energy and informationby means of extraction from the environment.
2. The ability for the intensified counteraction to external influences.3. The ability for expedient behavior, or the expedient character of interaction
with the environment.4. Regular self-renovation at different levels, including renovation of cellular
structures, self-reproduction of organisms, and evolution of species.
In fact, the unique fundamental properties emphasize the strict barrier separ-ating animate and inanimate parts of nature, while the non-unique ones can beconsidered as the connecting thread between them. During the origin of lifeprocess on the Earth the unique properties for the first time appeared, unlike thenon-unique ones that transited from the maternal geological medium andacquired the biological specificity. Therefore, the non-unique properties mayserve as a ‘‘load-star’’ to characterize conditions in the geological Cradle of Life,especially in immediate temporal proximity to the emergence of the simplestliving units. From this point of view, the following three non-unique fundamen-tal properties of biological systems are themost peculiar: (1) thermodynamic andchemical nonequilibrium; (2) integrity through cooperative events (auto-organi-zation of molecules, emergent properties); (3) capability for self-organization(self-maintenance). These properties were distinguished as themost fundamentalin biological systems by 17 scientists. They indicate specific nonequilibriumprocesses that were characteristic for the geological cradle of life on the Earth.The necessity of nonequilibrium conditions is remarkable. This requirementrelates the origin of life process with the wide range of events investigating withinthe framework of irreversible thermodynamics, including first of all the theory ofdissipative structures (Nicolis and Prigogine 1977; Prigogine, 2003; Prigogineand Stengers 1984) and synergetics (Haken, 1978, 2003).
3 Stabilized Bifurcation as a Starting Point of Life
There exist two different mechanisms of evolution of natural systems. The firstone consists in gradual accumulation of small changes in a system. Thus,importance of this mechanism for biological evolution was emphasized byC. Darwin. The second revolutionary mechanism leads to radical transforma-tion in a system’s structure. The mechanism acts through the bifurcate transi-tion of a system. A bifurcation occurs when a system cannot develop further inthe current conditions. The general scheme of a bifurcate transition is thefollowing (Fig. 1): initial period of stable existence of a system—pre-bifurcateperiod (its structure become unstable due to rising fluctuations)—critical, orbifurcation point (highest transformation of a system, reorganization of the
Paradoxical Bistate Status of a Prebiotic Microsystem 159
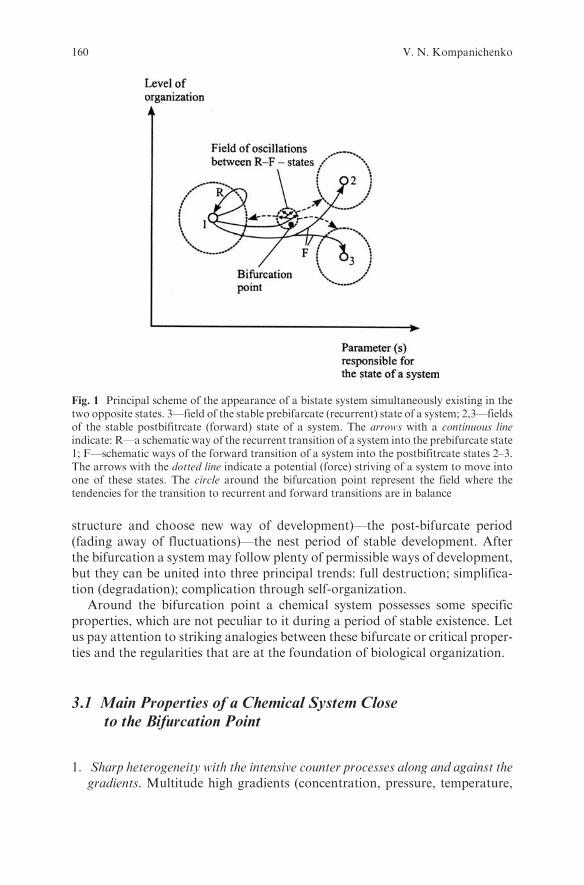
structure and choose new way of development)—the post-bifurcate period(fading away of fluctuations)—the nest period of stable development. Afterthe bifurcation a systemmay follow plenty of permissible ways of development,but they can be united into three principal trends: full destruction; simplifica-tion (degradation); complication through self-organization.
Around the bifurcation point a chemical system possesses some specificproperties, which are not peculiar to it during a period of stable existence. Letus pay attention to striking analogies between these bifurcate or critical proper-ties and the regularities that are at the foundation of biological organization.
3.1 Main Properties of a Chemical System Closeto the Bifurcation Point
1. Sharp heterogeneity with the intensive counter processes along and against thegradients. Multitude high gradients (concentration, pressure, temperature,
Fig. 1 Principal scheme of the appearance of a bistate system simultaneously existing in thetwo opposite states. 3—field of the stable prebifarcate (recurrent) state of a system; 2,3—fieldsof the stable postbifitrcate (forward) state of a system. The arrows with a continuous lineindicate: R—a schematic way of the recurrent transition of a system into the prebifurcate state1; F—schematic ways of the forward transition of a system into the postbifitrcate states 2–3.The arrows with the dotted line indicate a potential (force) striving of a system to move intoone of these states. The circle around the bifurcation point represent the field where thetendencies for the transition to recurrent and forward transitions are in balance
160 V. N. Kompanichenko
electric field, and other kinds) appear throughout in a chemical system thatapproaches to the critical point of transition.
2. Continuous waves and re-arrangement of molecules. The particles are orga-nized by fluctuations through cooperative events and synergism. A competi-tion between the fluctuations continuously changes their radiuses ofcorrelation.
3. Integrity through cooperative processes. At the critical point the dominantfluctuation integrates all particles because its radius of correlation expandsto the entire system. The particles are perceptive each other on macroscopicdistances due to long-range links and cooperative effect.
4. Open system: uninterrupted exchange by matter and energy with the surround-ings. Powerful fluctuations arising around the critical point open the systemand maintain the exchange by matter and energy, as well as by simplestructural information, with the surroundings.
3.2 The Corresponding Characteristics of a Living Cell
1. Heterogeneous structure and the counter processes of synthesis and destruc-tion. Distinct heterogeneity of a cell is displayed as in ionic-molecular and asin structural levels. It is maintained by extraordinary complex circulation ofthe spontaneous processes (decreasing the gradients) and the non-sponta-neous ones (increasing them) providing simultaneously synthesis anddestruction (assimilation and dissimilation).
2. Continuous dynamic processes and re-arrangement of molecules/atoms. A cellis an assembly-line system in which manifold dynamic processes proceeduninterruptedly. Permanent chemical nonequilibrium between a cell and theoutside world supports continuity of the processes.
3. Integrity based on cooperative interaction. Integrity of a cell is maintained bythe organization and regulation of cellular functions on different hierarchicallevels. The organization of entire cell appears in its organic process ofdivision, coordinate movement, etc.
4. Open system: continuous exchange of a cell by matter, energy, and informationwith the environment. Existence of any organism is maintained through thevarious exchange processes with the outside world. An organism is highlysensitive to external changes and responds upon them on different hierarch-ical levels.
The analogies between these two sets of the properties are obvious. Each offour critical properties is distinctly reflected in the vital processes. Althoughfour listed characteristics of living cells do not express the unique essence of life,they are in its background. Absence of even one of these characteristics wouldmake life impossible. Meanwhile, the critical properties are temporal character-istic of a chemical system. They appear since the beginning of the bifurcate
Paradoxical Bistate Status of a Prebiotic Microsystem 161

transformation and disappear with the completed transition to the advancedstable state. The following thesis is formulated on the basis of these facts: Lifearose of the bifurcate state that inhered to still indeterminate kind of organicmicrosystems.
This thesis has led to the paradoxical situation: the bifurcate state should beconsidered as a starting-point of living systems, but the bifurcation point isunstable in principle. A system cannot be at the bifurcation point for a longtime. But nature on the Earth found the way to prolong the bifurcate state of theinitial prebiotic microsystems about four billion years ago. The permissibleopportunity for this way is investigated in the next chapter.
4 Bistate System as Prototype of a Living Organism:
Theoretical Substantiation
The formulated thesis brings us to the consideration of the rare boundary eventsarising between the irreversible and reversible bifurcate transitions. This is thecase, when conditions in the outside world oscillate and constrain a chemicalsystem to balance as well. These events have not been investigated from theorigin of life point of view. The situation with the starting point of life iscontradictory: close to the bifurcation point a chemical system is unstable,but maintains the critical properties, while far from the point it is stable, butloses the properties. It seems this contradiction can be resolved in only if achemical system oscillates around the bifurcation point, developing to theadvanced state and to the initial one. The balanced oscillations provide relativestability of the system, while the ‘‘caught’’-inside unstable bifurcation pointserves as a permanent source of dynamic transformations. There appears theparadoxical state ‘‘stabilized instability’’ that is a background of living systems,in accordance with the author’s conception. On this basis the following thesiscan be formulated as a hypothesis: the critical properties in a prebiotic micro-system can be kept for a long time through regular oscillations around thebifurcation point. This principal opportunity to maintain the critical propertiesallowed the original prebiotic microsystems to evolve to life on the early Earth.The thesis will be theoretically corroborated below. The way to its futureexperimental proof will be outlined as well.
The considered case is shown on Fig. 1. Let us assume that a chemical systembegins to transit from the initial state 1 into the advanced states 2 or 3 throughthe bifurcation point. The transition is initiated by significant changes in theexternal parameters. There exist three possible scenarios of behavior for asystem that has been obtained the impulse for transition. The first one impliesthe impulse is insufficient for the system to reach the bifurcation point. In thiscase, the system returns to the initial field 1, according to the schematic trend R.The second scenario: the impulse is superfluous (more than sufficient) to over-come the bifurcation point. In the long run, the system selects a position in the
162 V. N. Kompanichenko

fields 2 or 3, in accordance with the schematic trends F (or goes to ruin if the
change is too strong). In case the intermediate value of the impulse the system
stays swinging between the opposite and equal forces for a while. This thirdscenario implies possible acquisition of temporal stability of the system. Dis-
placement of the system into forward state can be compensated by the adequate
reverse change of the external conditions, and visa versa. This theoretically
substantiated type of natural systems was called bistate system, or shortly
bisystem (Kompanichenko, 2004). Its principal scheme is shown on the Fig. 2.
Both opposite initial and advanced states are nonequilibrium: they are attractedto the bifurcation point and balance each other. The bistate system begins to
develop now to the initial (recurrent) now advanced (forward) states, corre-
spondingly these nonequilibrium states become dominant by turns. The oscil-
lating balance between the R-state (reverse force) and F-state (forward force) is
an indispensable condition for stability of a bistate system, otherwise the system
would leave the bifurcate area and loose its bistate status. Real stability of a
bisystem supports through the cooperative events and self-organization thatexist near by the bifurcation point. The bifurcation point itself is a principal
point of instability of a bistate system. The instability maintains due to high
fluctuations that also peculiar to bifurcate state of a system. A continuous
‘‘opposition-interaction’’ between the instability and the equilibrium leads to a
continuous rearrangement of molecules, structures and circulative physical–
chemical processes within bisystems.Although existence of the bistate type of natural systems is based theoreti-
cally, this notion allows us to get satisfactory principal responses to the follow-
ing questions concerning the biological way of organization.
1. Why a cell normally fissions at the end of its own existence? This propertyfollows the paradoxical way of organization of a bisystem, i.e. simultaneousrepulsion the nonequilibrium co-structures from the central instability pointand integration through maintenance of relative equilibrium between them.
Fig. 2 Principal scheme of a bistate system
Paradoxical Bistate Status of a Prebiotic Microsystem 163

Maintenance of the relative equilibrium on the background of repulsiveforces should inevitably lead to the final division into two sub-identicalcomponents. Figuratively speaking, normal cycle of existence of a bisystemrepresents its gradual ‘‘sawing’’ combined with the tendency to formation ofthe sub-identical dichotomous units.
2. Why advanced forms of life possess obvious plane of smooth subsymmetrydividing pair limbs, eyes, ears, cerebral hemispheres, etc? According to theelaborated conception, these characteristics are the developed consequenceof the latent biforked structure of a bisystem. It consists of two autonomousco-structures (Fig. 2). The development of a bistate system from the centralpoint of instability simultaneously into the opposite directions should resultin its specific biforked macrostructure divided by plane of smooth subsym-metry The plane reflects the virtual zone of the relative equilibrium betweenthe forces striving to outstretch the bisystem simultaneously ‘‘ahead andback.’’
3. Why various inner processes in a living organism have oscillating character,for instance, oscillations of flagellums in independent eucariotic cells orhierarchical biophysical rhythms in advanced forms of life? Oscillating char-acter of existence is a principal property of a bistate system related withperiodic change of the dominant states. Oscillations of all inner processessupport stability of a bisystem. Ceasing of the oscillations constrains abisystem to leave the bifurcate area with the following irreversible transitioninto one of the stable equilibrium states. Oscillations between the polarforces sustain the internal tension that is a source of incessant dynamicprocesses and intensive rearrangement of molecules in a bistate system.
4. What is a cause of mutability and heredity of life forms? According to thetheory of dissipative structures and synergetics, each forward transition overthe bifurcation point (from the initial into advanced state) brings someaccidental changes in a chemical system. During the back transition thesystem may return only into the altered initial state due to the happenedchanges. So, the reverse transition can be considered as a way directed toconservation of the previous state of a chemical system. In this context,regular oscillations around the bifurcation point occurring in a bistatechemical system step by step work towards accumulation of the accidentalchanges that provide its ability to evolve. The forward transitions initiatenew transformations in a bisystem (mutability), while the reverse ones retainits state (heredity).
As it was based, a bistate systemmay acquire relative stability in the oscillat-
ing thermodynamic and physical–chemical external conditions. Rewording, it
must undergo the regular influences from the outside world. Unlike an ocean,
significant thermodynamic and physical–chemical fluctuations are regularly
generated in hydrothermal systems where they are generated by the contra-
dictory interaction between rising hydrodynamic and descending lithostatic
pressures. It follows from the conception that hydrothermal systems with the
164 V. N. Kompanichenko

adjoining areas in ocean and terrestrial groundwater systems were the mostsuitable geological cradle of life on the Earth.
5 Conclusion
1. The results of the executed experimental efforts to transform various kinds ofprebiotic microsystems into really living units were negative because of themissing intermediate step—acquisition of the bistate status. The followingpermissible succession of transformation of the kind is suggested:
Prebiotic microsystem ð‘‘monostate’’Þ ! Bistate microsystem
! Living probiont
Unlike initial prebiotic model, a living probiont possesses dynamic self-sustaining heterogeneity and responds to instability by continuous internalreorganization.
2. Experimental getting of prebiotic bistate microsystems represents an impor-tant aim of science. In order to produce a useful model of the bistate system,synthetic prebiotic organic microsystems should be explored; first, close tothe bifurcation point of transition, and, second, under oscillating conditionsin the experimental chamber. To select the most suitable kind of prebioticmodels, all of them should be explored under these conditions. In fact, thisway consists in investigation of organic microsystems ‘‘on the verge ofsurvival,’’ with the attempt to prolong their bifurcate state by the adequatechanges of conditions in the experimental system. Increase of instability inthe bistate system due to spontaneous displacement into the stable forwardstate might become balanced with an adequate change of the external con-ditions in the reverse direction, and visa versa.
3. Bistate systems possess ability for evolution and complication by their ownnature. This means they are able to generate motive power under certainconditions and naturally turn the biosynthesis process. So, initial probiontscould be composed of very simple components, with the following complicat-ing synthesis of the both classes of biopolymers inside the evolving probiont.
4. Traces of volcanic and associated hydrothermal events on other planets andsatellites are favorable signs to suppose that life might take place there. Inthis context, even space bodies like Moon and Io should not be excluded outof the program of life search.
References
Fundamentals of Life (2002) G. Palyi, C. Zucci and L. Caglioti (Eds), Elsevier SAS, Paris.Haken, H. (1978) Synergetics. Springer-Verlag, Berlin, New York.HakenHermann (2003) Special issue. Nonlinear Phenomena in Complex Systems. Vol. 5, N4.
Paradoxical Bistate Status of a Prebiotic Microsystem 165

Kompanichenko, V.N. (2003) Distinctive properties of biological systems: the all-roundcomparison with other natural systems. Front. Perspect. 12(1), 23–35.
Kompanichenko, V.N. (2004) Systemic approach to the origin of life. Front. Perspect. 13(1),22–40.
Nicolis, G. and Prigogine, I. (1977) Self-organization in nonequilibrium systems. Wiley,New York.
Prigogine, I. and Stengers, I. (1984). Order out of chaos. Bantam, New York.Prigogine, I. (2003) Advances in chemical physics. Wiley, New York, Vol. 127.
166 V. N. Kompanichenko

Part III
Archaen–Proterozoic Ecosystems: TheirInteraction and Contemporary Analogues

The Ancient Anoxic Biosphere Was
Not As We Know It
A. E. Fallick, V. A. Melezhik, and B. M. Simonson
Abstract A previously unreported observation is that whereas c. post-2000Masedimentary rocks commonly contain microbially mediated, 13C-depleted car-bonate concretions, such features are largely absent in older rocks. Excluding
banded iron formations, �13C of sedimentary and diagenetic carbonates of theolder rocks are � 0 � 3% VPDB and are not characteristic of microbiallyrecycled organic matter. We propose that c. pre-2000 Ma the biosphereoperated in a different mode compared to the modern. Organic matter reminer-
alisation was predominantly in the anoxic water column and sediment–waterinterface and rarely within sediments. Isotopically distinctive CO2 and CH4
readily escaped to atmosphere leaving no vestige as diagenetic carbonates.Around c. 2000 Ma, in response to the now oxic near-surface conditions, the
anaerobic recycling microorganisms retreated deep into sediments to escapepoisonous dioxygen. Redox gradients developed in the sedimentary columnand abundant 12C-rich carbonate concretions then formed using recycledorganic carbon, as observed in the Phanerozoic world.
1 Introduction
If one were to seek unequivocal evidence for biological activity in the Earth’sdeep subsurface (i.e. significantly below the sediment–water interface) what, inthe absence of obviously active or once-active organisms, would be demanded?Ideally, we propose, one would look for integrated petrographic/fabric, miner-alogical, chemical and isotopic features which in aggregate compel us to deduce
that biological agents have been active in modifying the sediment relativelysoon after burial. Such features exist at the present day: they are calledconcretions, defined as a mass or nodule of mineral matter usually differing in
A.E. FallickScottish Universities Environmental Research Centre, Glasgow, G75 0QF, Scotlande-mail: [email protected]
N. Dobretsov et al. (eds.), Biosphere Origin and Evolution.� Springer 2008
169

chemical composition from the host rocks. Concretions of calcite, dolomite,silica, Fe- and Mn-oxide, Fe-sulphide, phosphate and gypsum are known; theymay vary in size from a fraction of a centimetre to a fewmetres and in form fromregular spheroidal and oblate nodules, through burrow-fills, to laterally exten-sive beds (Selles-Martınez, 1996).
Concretions are abundant in post-Precambrian rocks and attract interestbecause they stand out from their host rocks. Their chemical and isotopiccomposition can be used for tracking the burial (diagenetic) history of sedi-ments and subsurface microbial life. In most cases, concretions formed bydiffusion from a small volume of concentrated microbial activity in sedimentsafter they were deposited (Raiswell et al., 1993), e.g. during diagenesis (Cole-man, 1993). Constituents for their growth (HCO3
–, HS–) are supplied viaprocesses of microbial decomposition of organic matter (OM) deposited insediments. At the present day, the chemical and isotopic composition of carbo-nate concretions is the result of degradation of OM proceeding via a successionof processes during sediment burial, each mediated by a specific microbialgroup (e.g. Irwin et al., 1977) including
CH2OþO2 ! CO2 þH2O; (1)
2CH2Oþ SO2�4 ! 2CO2 þ S2� þ 2H2O; (2)
2CH2O! CH4 þ CO2; (3)
R:COOH! RHþ CO2; (4)
where CH2O is used generically for organic matter and R is an aliphatic oraromatic hydrocarbon group.
These and other reactions characterise at least four depth-related zones in thesequence of sediment burial, starting with (Eq. 1) microbial oxidation, followedby (Eq. 2) bacterial sulphate reduction, (Eq. 3) microbial fermentation and(Eq. 4) abiotic decarboxylation. Carbon dioxide (CO2, Eqs. 1–4) is the commonproduct for all these processes. The CO2 produced in the burial sequencedissolves readily in pore water, thus increasing the concentration of bicarbonatewhose carbon isotopic composition is very different from that of marine reser-voir bicarbonate (0 � 3%). During burial, sediments pass successively throughdifferent zones within which OM is being altered and CO2 produced.
Bicarbonate activities sufficient to cause carbonate super-saturation can bereached, thus causing precipitation of diagenetic carbonates in the form ofcement and concretions. Specific microbial groups decomposing OM can beconstrained via isotopic composition of postdepositional carbonate cement andconcretions. Carbonates precipitated from zone 1 (Eq. 1) are commonlyisotopically light (down to –27%). Carbonates of similar isotopic composition
170 A. E. Fallick et al.
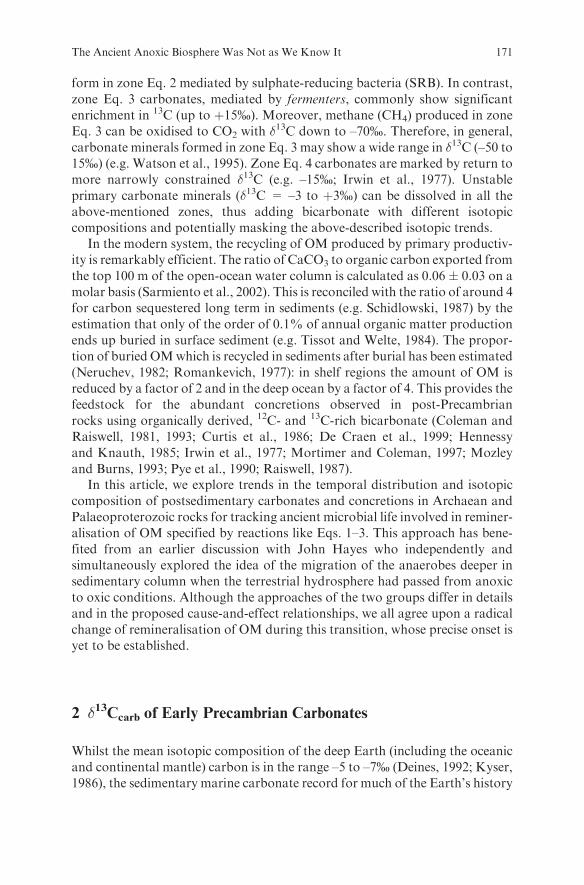
form in zone Eq. 2 mediated by sulphate-reducing bacteria (SRB). In contrast,zone Eq. 3 carbonates, mediated by fermenters, commonly show significantenrichment in 13C (up to þ15%). Moreover, methane (CH4) produced in zoneEq. 3 can be oxidised to CO2 with �
13C down to –70%. Therefore, in general,carbonate minerals formed in zone Eq. 3 may show a wide range in �13C (–50 to15%) (e.g. Watson et al., 1995). Zone Eq. 4 carbonates are marked by return tomore narrowly constrained �13C (e.g. –15%; Irwin et al., 1977). Unstableprimary carbonate minerals (�13C = –3 to þ3%) can be dissolved in all theabove-mentioned zones, thus adding bicarbonate with different isotopiccompositions and potentially masking the above-described isotopic trends.
In the modern system, the recycling of OM produced by primary productiv-ity is remarkably efficient. The ratio of CaCO3 to organic carbon exported fromthe top 100 m of the open-ocean water column is calculated as 0.06 � 0.03 on amolar basis (Sarmiento et al., 2002). This is reconciled with the ratio of around 4for carbon sequestered long term in sediments (e.g. Schidlowski, 1987) by theestimation that only of the order of 0.1% of annual organic matter productionends up buried in surface sediment (e.g. Tissot and Welte, 1984). The propor-tion of buried OMwhich is recycled in sediments after burial has been estimated(Neruchev, 1982; Romankevich, 1977): in shelf regions the amount of OM isreduced by a factor of 2 and in the deep ocean by a factor of 4. This provides thefeedstock for the abundant concretions observed in post-Precambrianrocks using organically derived, 12C- and 13C-rich bicarbonate (Coleman andRaiswell, 1981, 1993; Curtis et al., 1986; De Craen et al., 1999; Hennessyand Knauth, 1985; Irwin et al., 1977; Mortimer and Coleman, 1997; Mozleyand Burns, 1993; Pye et al., 1990; Raiswell, 1987).
In this article, we explore trends in the temporal distribution and isotopiccomposition of postsedimentary carbonates and concretions in Archaean andPalaeoproterozoic rocks for tracking ancient microbial life involved in reminer-alisation of OM specified by reactions like Eqs. 1–3. This approach has bene-fited from an earlier discussion with John Hayes who independently andsimultaneously explored the idea of the migration of the anaerobes deeper insedimentary column when the terrestrial hydrosphere had passed from anoxicto oxic conditions. Although the approaches of the two groups differ in detailsand in the proposed cause-and-effect relationships, we all agree upon a radicalchange of remineralisation of OM during this transition, whose precise onset isyet to be established.
2 �13Ccarb of Early Precambrian Carbonates
Whilst the mean isotopic composition of the deep Earth (including the oceanicand continental mantle) carbon is in the range –5 to –7% (Deines, 1992; Kyser,1986), the sedimentary marine carbonate record for much of the Earth’s history
The Ancient Anoxic Biosphere Was Not as We Know It 171

suggests that primary �13C was within a few per mil of 0% (see review by
Ripperdan, 2001); this is usually attributed to a relatively constant burial
ratio of carbonate carbon to reduced carbon (e.g. Schidlowski, 1987). Exclud-
ing samples from banded iron formations (BIF), �13C values for sedimentary
and diagenetic carbonates in the time interval 3700 to 2060 Ma with very few
exceptions are near 0 � 3% (Fig. 1), corroborating that diagenetic shifts of
carbon isotope ratios are systematically very low for Archaean carbonates
(Abell et al., 1985; Schidlowski et al., 1979; Veizer et al., 1989, 1990). Primary
micrite and late sparite show similar isotopic signatures and even calcite
disseminated in ‘‘black schists’’ (Corg = 4%) is depleted in 13C by only 2%compared to carbonate minerals precipitated from coeval seawater (Beukes
et al., 1990). Numerous whole-rock isotopic analyses obtained from 2700 Ma
stromatolitic carbonates in the Belingwe Greenstone Belt (Abell et al., 1985)
show a surprisingly tight cluster around 0%.
Fig. 1 Variation of carbon isotopes in sedimentary and diagenetic carbonates through theearly Precambrian. Sources for isotopic data are fromMelezhik and Fallick (1996), Melezhiket al. (1999) and Shields and Veizer (2002) and references therein; additional data are fromPerry et al. (1973), Thode and Goodwin (1983), Abell et al. (1985), Baur et al. (1985) andBeukes et al. (1990). All databases have been screened against metamorphic overprints, non-marine and hydrothermal carbonates
172 A. E. Fallick et al.

3 Diagenetic Concretions in the Early Precambrian
The scarcity of diagenetic carbonate concretions in the Archaean has beenacknowledged long ago (e.g. Pettijohn, 1940). A targeted search for carbonateconcretions over several decades (Melezhik, 1992) and extensive carbonateconcretion bibliography, listing 700 articles, (Dietrich, 1997) suggest thatthere is also a general lack of carbonate concretions in Early Palaeoproterozoicsedimentary formations older than 2060 Ma.
Similarly, sulphide concretions have rarely been reported from the Archaean(Krapez et al., 2003; Smyk andWatkinson, 1990). TheHamersley basin representsan exception. The concretions are widespread in the Mt. McRae and the shalierparts of theWittenoom formations. They are best developed in the RoyHill Shaleof the Jeerinah Formation, which is older than 2630 � 5 Ma (a SHRIMP datefrom a tuff right near its top; Hassler, 1993). However, even those Archaeansulphide occurrences, which have well preserved primary sedimentological fea-tures and biogenicity (Donnelly and Crick, 1992; Grassineau et al., 2002; Shenet al., 2001), very often do not show any concretional development of sulphides.
If BIF-associated concretions are excluded, there are only very few placesfrom which carbonate concretions are known or have been reported. Thisincludes the Boomplaas Formation constrained to c. 2642 to 2588 Ma(Altermann and Nelson, 1998; Nelson et al., 1999), in the Kaapvaal Craton,in South Africa, and the Wittenoom and Mt. McRae formations in the PilbaraCraton of Australia (Krapez et al., 2003; Simonson et al., 1993a,b) depositedroughly from 2600 to 2500 Ma (Trendall et al., 2004).
The first abundant development of diagenetic 13C-depleted carbonates occurat c. 2000 Ma in the aftermath of the Jatulian-Lomagundi positive isotopicexcursion of 13C/12C in sedimentary carbonates (reviewed in Melezhik et al.,1999) They coincide in time with the first widespread development of carbonateconcretions (Fig. 1).
3.1 Isotopic Composition of Archaean Concretions
Our study involved concretions from both currently known areas. These arethe Boomplaas Formation in the Kaapvaal Craton and the Wittenoom For-mation in Pilbara Craton. The Boomplaas concretions are calcitic in compo-sition and occur as flattened lenses (Color Plate 2a, see p. 394) in 1–2 m thickthinly laminated black shales. The host shales show a moderate differentialcompaction with respect to the concretions. The concretions exhibit a vaguezoning enhanced by recent weathering. Marginal parts contain pyrite(Color Plate 2b, see p. 394). �13C ranges between –1.2 and þ0.7%. Thisapproximates to �13C of coeval marine carbonates (Sumner, 2000).Microcored isotopic transects suggest no or very limited growth-associated�13C variations as concretionary cores are isotopically heavier by at most ca.
The Ancient Anoxic Biosphere Was Not as We Know It 173

1% (Table 1, Color Plate 2b, see p. 394). Hence there is no indication thatconcretions incorporated a sizable amount of CO2 derived through microbialremineralisation of OM as specified by reactions 1–3. �34S of concretion-hosted pyrite tightly clusters around zero averaging þ0.7 � 0.7 (1s)(Table 2), thus there is no clear evidence suggesting that microbial sulphatereduction was involved in the formation of these sulphides.
Samples analysed from the Wittenoom Formation include dolomite andcalcite concretions and several layers of sedimentary carbonates (Table 1and 3). Carbonate concretions are widespread in the Paraburdoo and espe-cially Bee Gorge members of the formation (Simonson et al., 1993a). Theyrange up to 75 cm long by 15 cm thick and appear as massive or concre-tionary layered but mostly laminated. The vast majority of the concretionshave remained in situ since their formation (Color Plate 2c and d, see p. 394)whereas a minority were pene-contemporaneously reworked by high-energysediment gravity flows, most notably a major eruptive event that formed theMain Tuff Interval (Hassler, 1993). This indicates that concretions originallyformed very close to the water–sediment interface. Associated carbonate bedsdisplay lumpy lamination, roll-up and other structures related to
Table 1 Isotopic profiles through selected concretions based on microcoring
Sample # Profile Distance (cm) �13 C (%) VPDB �18 O (%) VSMOW
Palaeoproterozoic calcite concentrations and host rock
Onega Basin, Kondopoga Fm., c. 1900 Ma
Greywacke-hosted, lensoidal, zoned concretion (#K1�05)a Core 5.5 �19.3 14.6
b 4.5 �18.8 14.5
c 4 �19.3 14.5
d 3.1 �19.5 14.5
e 2.3 �20.6 14.6
f 1.5 �21.3 15.3
g 0.8 �21.8 15.6
h Rim 0 �15.2 16.2
Pechenga Greenstone Belt, Pilgujarvi Sedimentary Fm., 2004 � 9 Ma (Re-Os)
Greywacke-hosted, lensoidal, zoned concretion (#2900/537)
n Core 7.0 �5.2 21.3
m 6.5 �10.8 15.0
l 6.0 �13.6 12.1
k 5.5 �8.9 17.0
j 5.0 �9.8 15.3
g 3.5 �5.8 20.8
f 3.0 �10.5 14.4
e 2.5 �12.4 13.4
d 2.0 �12.8 12.1
c 1.5 �13.1 12.2
b 1.0 �13.2 12.0
a Rim 0.5 �13.0 11.8
174 A. E. Fallick et al.
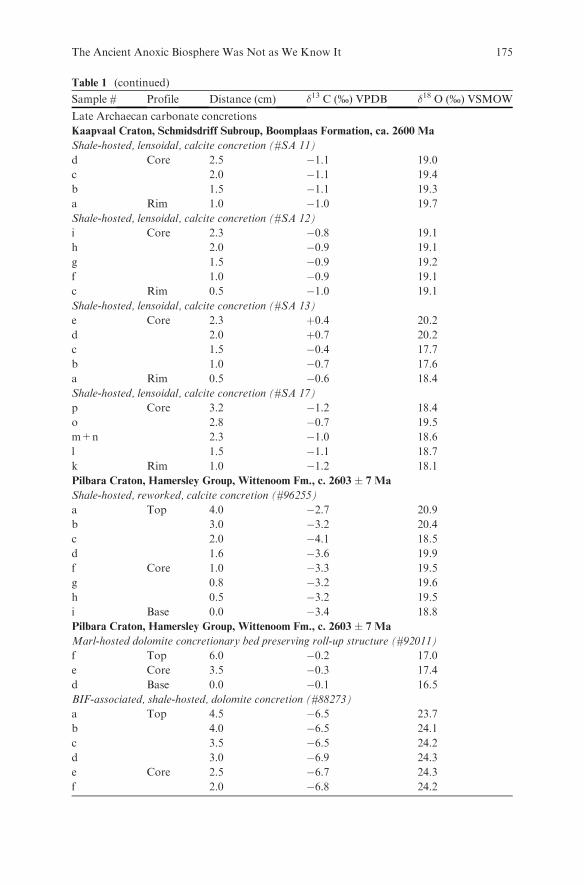
Table 1 (continued)
Sample # Profile Distance (cm) �13 C (%) VPDB �18 O (%) VSMOW
Late Archaecan carbonate concretions
Kaapvaal Craton, Schmidsdriff Subroup, Boomplaas Formation, ca. 2600 Ma
Shale-hosted, lensoidal, calcite concretion (#SA 11)
d Core 2.5 �1.1 19.0
c 2.0 �1.1 19.4
b 1.5 �1.1 19.3
a Rim 1.0 �1.0 19.7
Shale-hosted, lensoidal, calcite concretion (#SA 12)
i Core 2.3 �0.8 19.1
h 2.0 �0.9 19.1
g 1.5 �0.9 19.2
f 1.0 �0.9 19.1
c Rim 0.5 �1.0 19.1
Shale-hosted, lensoidal, calcite concretion (#SA 13)
e Core 2.3 þ0.4 20.2
d 2.0 þ0.7 20.2
c 1.5 �0.4 17.7
b 1.0 �0.7 17.6
a Rim 0.5 �0.6 18.4
Shale-hosted, lensoidal, calcite concretion (#SA 17)
p Core 3.2 �1.2 18.4
o 2.8 �0.7 19.5
m+n 2.3 �1.0 18.6
l 1.5 �1.1 18.7
k Rim 1.0 �1.2 18.1
Pilbara Craton, Hamersley Group, Wittenoom Fm., c. 2603 � 7 Ma
Shale-hosted, reworked, calcite concretion (#96255)
a Top 4.0 �2.7 20.9
b 3.0 �3.2 20.4
c 2.0 �4.1 18.5
d 1.6 �3.6 19.9
f Core 1.0 �3.3 19.5
g 0.8 �3.2 19.6
h 0.5 �3.2 19.5
i Base 0.0 �3.4 18.8
Pilbara Craton, Hamersley Group, Wittenoom Fm., c. 2603 � 7 Ma
Marl-hosted dolomite concretionary bed preserving roll-up structure (#92011)
f Top 6.0 �0.2 17.0
e Core 3.5 �0.3 17.4
d Base 0.0 �0.1 16.5
BIF-associated, shale-hosted, dolomite concretion (#88273)
a Top 4.5 �6.5 23.7
b 4.0 �6.5 24.1
c 3.5 �6.5 24.2
d 3.0 �6.9 24.3
e Core 2.5 �6.7 24.3
f 2.0 �6.8 24.2
The Ancient Anoxic Biosphere Was Not as We Know It 175

soft-sediment deformation (Color Plate 2e, see p. 394). Some concretions
trapped roll-up structures (Color Plate 2f, see p. 394). It has been proposed
that the roll-up structures are a result of soft-sediment deformation of lami-
nated mud which was originally stabilised by cohesive microbial mats built by
non-photosynthetic, heterotrophic or chemoautotrophic microbes below
wave base (Simonson and Carney, 1999).Bulk analyses of both in situ and reworked calcite concretions show similar
�13C ranging between –3.5 and –2.3%. Hosting marls have indistinguishable
ratios fluctuating between –3.5 and –3.0% though they are slightly enriched in18O (Tables 1 and 3). A bottom–top microcored transect through the redepos-
ited concretion reveals a fluctuation between –4.1 and –2.7%. The central
region is relatively depleted in 13C (Color Plate 2g, see p. 394). Dolomitic
Table 1 (continued)
Sample # Profile Distance (cm) �13 C (%) VPDB �18 O (%) VSMOW
g 1.5 �6.7 24.3
h 0.8 �6.8 24.3
i Base 0.0 �6.7 24.4
Concretion specimens were slabbed, polished, scanned and examined macroscopically.Polished 150 �m thick sections were made to provide a core-to-rim coverage. They werescanned and examined in transmitted and reflected light. The same sections were examinedwith backscatter-mode scanning electron microscopy in order to study authigenic carbonates.Ca, Mg, Fe and Mn core-to-rim trends were semi-quantitatively recorded in untreatedsamples at low vacuum by electron-microprobe analysis of thin sections. Back-scatteredelectron microscopy and microprobe analyses were performed using the scanning electronmicroscopy facility at the Geological Survey of Norway, which consists of a 1450VP electronmicroscope from LEO Electron Microscopy Ltd equipped with X-ray detection systemsEnergy 400 and Wave 500 from Oxford Instruments. The microscope is capable of runningprepared or conducting samples under high-vacuum conditions as well as untreated samplesin lower vacuum. The electron detection systems include a secondary electron detector fortopographic contrast and two back-scattered electron detectors, primarily for atomic numbercontrast. The X-ray detection system includes an energy-dispersive spectrometer and a singlewavelength dispersive spectrometer for trace element analysis.Submilligram microsamples were acquired for oxygen and carbon isotope analyses using anUlrike Medenbach microcorer, which enables core diameters from <50 �m to several milli-meters to be obtained with a maximum drilling depth of 1 mm. The microsamples were coredfrom 150 �m thick polished sections which have been examined by the back-scattered electronmicroscopy andmicroprobe analyses. Oxygen and carbon isotope analyses of whole-rock andmicrocore samples were performed at the Scottish Universities Environmental ResearchCentre, Glasgow, using the phosophoric acid method of McCrea (1950) as modified byRosenbaum and Sheppard (1986) for operation at 708C. Oxygen isotope data for dolomiteswere corrected using the fractionation factor 1.0099 recommended by Rosenbaum andSheppard (1986). Carbon and oxygen isotope ratios in carbonate constituents of the whole-rock and microcore samples were measured on an AP 2003 mass spectrometer. Analyses werecalibrated against NBS 19, and precision (1s) for both isotope ratios is better than � 0.2%.The carbon isotope data are reported relative to VPDB whereas the oxygen isotope data arerelative to VSMOW.
176 A. E. Fallick et al.

concretions and concretionary beds with roll-up structure and their host marls
exhibit �13C close to zero (Color Plate 2h, see p. 394). Similar to the calcite
concretions, the host marl is slightly enriched in 18O (Table 3). The overall data
suggest that a very limited 13C-depleted, organically derived source was
involved in concretionary calcite. No 13C-depleted source was involved in
concretionary dolomite whose �13C is close to zero. In contrast, a dolomite
concretion collected in close proximity to the Jimblebar iron ore deposit
(Blockley, 1990) shows significant 13C depletion with �13C averaging around
–6.7% though without any significant fluctuation along a bottom-to-top profile
(Color Plate 2i, see p. 394). Such values are a typical feature of BIF-associated
carbonates throughout the Archaean (Fig. 1)
3.2 Isotopic composition of Palaeoproterozoic concretions
The first abundant appearance of carbonate concretions is dated to c. 2050 Ma
(Color Plate 4a, see p. 396) (Melezhik, 1992). From c. 2000 Ma they became
widespread and formed in diverse depositional settings extending from marine
(Color Plate 4a–e, see p. 396) to subaerial (Color Plate 4f, see p. 396) and
Table 2 Isotopic composition of microcored sulphides from Boomplaas carbonateconcretions
Sample # �34S (% CDT)
Concretion # SA 11
1 þ0.43 þ0.14 �0.45 0.0
6 þ0.67 þ1.88 þ0.6Concretion #SA 17
9 þ1.410 þ1.6Concretion #SA 17A
11 þ1.412 þ0.3Mean þ0.7 � 0.7 (1s)
Individual cores were laser-combusted to SO2 (Fallick et al., 1992; Kelley and Fallick, 1990)which was cryogenically purified and isotopically assayed on an in-line dual inlet gas sourcemass spectrometer (SIRA II). A pyrite laser correction of �1% was applied (see Kellley andFallick, 1990). Combusting cores is more difficult to control than for polished blocks andthere is some loss in precision which we estimate as 0.7% (1s) from analyses of standards.Therefore, there is little evidence of geological scatter in the analyses of the cores.
The Ancient Anoxic Biosphere Was Not as We Know It 177

Table 3 Isotopic composition of Precambran concretions based on whole-rock analyses
Sample # �13C(%) VPDB �18O (%) VSMOW
Palaeoproterozoic calcite concretions
Onega Basin, Kondopoga Fm., ca 1900 Ma
Greywacke-hosted, lensoidal, zoned concretion
K1�05 �20.1 14.9
K2�05 �20.8 14.8
Greywacke-hosted, calcite concretionary layers
Kn1�02 �13.9 13.8
Kn2�02 �14.1 13.2
Kn3�02 �14.3 13.9
Kn4�02 �15.0 13.6
Kn5�02 �15.0 13.6
Pechenga Greenstone Belt, Pilgujarvi
Volcanic Fm., 1970 � 5 Ma (U�Pb zircon)
Felsic tuff-hosted, spherical, zoned concretions
1 �7.1 11.8
2 �7.9 9.6
Pechenga Greenstone Belt, Pilgujarvi
Sedimentary Fm., 2004 � 9 Ma (Re–Os)
Calcite cement in greywackes
2900/502 �10.7 13.7
2900/512 �11.2 13.4
2900/564 �11.2 12.7
R2900/565.7 �10.7 14.3
R2900/566 �11.1 12.7
R2900/567 �10.3 12.4
R2900/568 �7.2 25.8
2900/587 �13.8 13.0
2900/743 �10.9 13.1
2900/758 �10.6 13.2
2900/770 �9.1 13.1
2900/787 �11.9 13.2
2900/798 �8.8 13.4
2900/811 �10.9 13.5
2900/822 �10.2 13.5
2900/860 �9.9 13.5
2900/869 �11.3 13.4
Greywacke-hosted, spherical, zoned concretions
2900/448 �11.8 13.7
2900/453 �12.3 13.2
2900/472 �10.1 13.2
2900/473 �10.2 12.8
2900/508.5 �12.6 13.1
2900/517 �13.4 13.0
2900/549 �12.7 13.6
299/561.8 �7.5 11.6
2900/563.9 �8.2 13.0
178 A. E. Fallick et al.
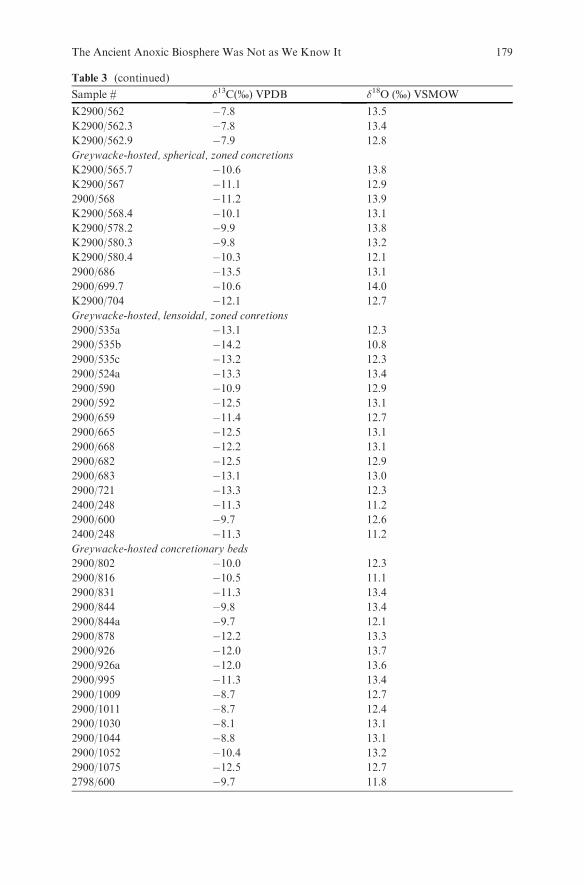
Table 3 (continued)
Sample # �13C(%) VPDB �18O (%) VSMOW
K2900/562 �7.8 13.5
K2900/562.3 �7.8 13.4
K2900/562.9 �7.9 12.8
Greywacke-hosted, spherical, zoned concretions
K2900/565.7 �10.6 13.8
K2900/567 �11.1 12.9
2900/568 �11.2 13.9
K2900/568.4 �10.1 13.1
K2900/578.2 �9.9 13.8
K2900/580.3 �9.8 13.2
K2900/580.4 �10.3 12.1
2900/686 �13.5 13.1
2900/699.7 �10.6 14.0
K2900/704 �12.1 12.7
Greywacke-hosted, lensoidal, zoned conretions
2900/535a �13.1 12.3
2900/535b �14.2 10.8
2900/535c �13.2 12.3
2900/524a �13.3 13.4
2900/590 �10.9 12.9
2900/592 �12.5 13.1
2900/659 �11.4 12.7
2900/665 �12.5 13.1
2900/668 �12.2 13.1
2900/682 �12.5 12.9
2900/683 �13.1 13.0
2900/721 �13.3 12.3
2400/248 �11.3 11.2
2900/600 �9.7 12.6
2400/248 �11.3 11.2
Greywacke-hosted concretionary beds
2900/802 �10.0 12.3
2900/816 �10.5 11.1
2900/831 �11.3 13.4
2900/844 �9.8 13.4
2900/844a �9.7 12.1
2900/878 �12.2 13.3
2900/926 �12.0 13.7
2900/926a �12.0 13.6
2900/995 �11.3 13.4
2900/1009 �8.7 12.7
2900/1011 �8.7 12.4
2900/1030 �8.1 13.1
2900/1044 �8.8 13.1
2900/1052 �10.4 13.2
2900/1075 �12.5 12.7
2798/600 �9.7 11.8
The Ancient Anoxic Biosphere Was Not as We Know It 179

lacustrine (Color Plate 6a–g, see p. 398) environments (Melezhik et al., 1998;Winter and Knauth, 1992). Importantly, this period was marked by formationof large arrays of other diagenetic products including Fe- and Mn-oxides,Mn- and Fe carbonates (siderite and rhodochrosite), phosphate and sulphideconcretions (Melezhik, 1992).
Palaeoproterozoic concretions isotopically analysed in our study are fromthe Fennoscandian Shield. Concretions that occur immediately in the aftermathof the Lomagundi-Jatuli event have been reported from the Il’mozero Sedimen-tary Formation in the Imandra/Varzuga Greenstone Belt (Melezhik andFallick, 1996). They formed in volcaniclastic greywacke deposited in a setting
Table 3 (continued)
Sample # �13C(%) VPDB �18O (%) VSMOW
Imandra/Varzuga Greenstone Belt, Il’mozero Sedimentary Fm., c. 2050
Greywacke-hosted, lensoidal, calcite concretions
496 �3.9 13.4
877 �4.1 12.8
3027 �20.5 13.3
Late Archaean carbonate concretions
Pilbara Craton, Hamersley Group, Wittenoom Fm., ca., 2603 � 7 Ma
Shale-hosted, in situ, lensoidal, calcite concretion
92026 �2.3 22.6
Shale-hosted, in situ, lensoidal, calcite concretion
92489-A �2.8 21.3
Shale-hosted, reworked, calcite concretion
96255 �3.5 20.3
Marl-hosted, reworked, calcite concretions Host marl
92848b �3.5 21.9
92848d �3.1 21.0
Marl-hosted, reworked, calcite concretion Host marl
92848h �3.0 20.4
Concretion
92848c �2.3 19.8
92848e �2.3 19.3
92848f �2.9 19.6
92848g �3.3 20.1
Marl-hosted dolomite concretion preserving roll-up structure
Host marl
92011a �0.4 17.9
92011c �0.5 18.2
92011g �0.6 18.3
92011h �0.5 18.2
92011i �0.5 18.3
Concretion preserving roll-up structure
92011b �0.3 17.5
BIF-associated, shale-hosted, dolomite concretion affected by recent weathering
88273 �6.9 31.6
180 A. E. Fallick et al.
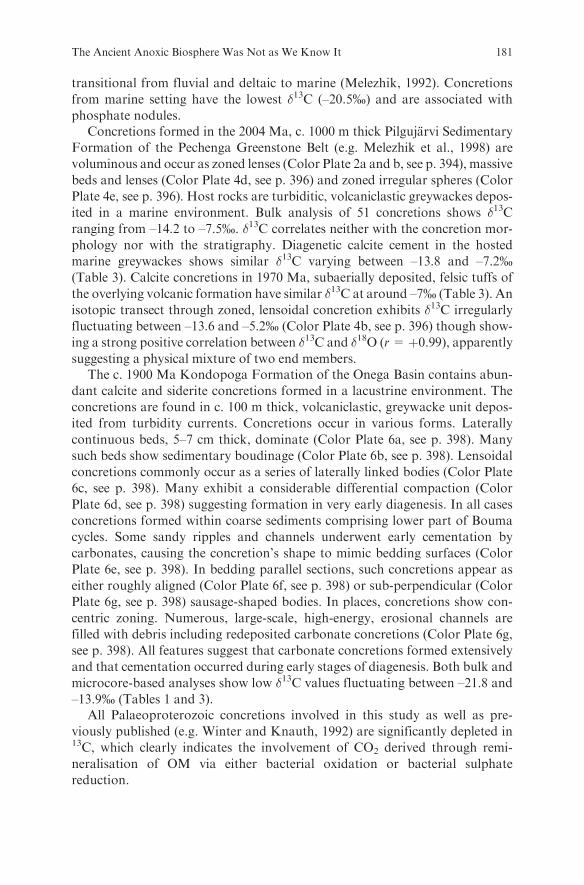
transitional from fluvial and deltaic to marine (Melezhik, 1992). Concretions
from marine setting have the lowest �13C (–20.5%) and are associated with
phosphate nodules.Concretions formed in the 2004 Ma, c. 1000 m thick Pilgujarvi Sedimentary
Formation of the Pechenga Greenstone Belt (e.g. Melezhik et al., 1998) are
voluminous and occur as zoned lenses (Color Plate 2a and b, see p. 394), massive
beds and lenses (Color Plate 4d, see p. 396) and zoned irregular spheres (Color
Plate 4e, see p. 396). Host rocks are turbiditic, volcaniclastic greywackes depos-
ited in a marine environment. Bulk analysis of 51 concretions shows �13Cranging from –14.2 to –7.5%. �13C correlates neither with the concretion mor-
phology nor with the stratigraphy. Diagenetic calcite cement in the hosted
marine greywackes shows similar �13C varying between –13.8 and –7.2%(Table 3). Calcite concretions in 1970 Ma, subaerially deposited, felsic tuffs of
the overlying volcanic formation have similar �13C at around –7% (Table 3). An
isotopic transect through zoned, lensoidal concretion exhibits �13C irregularly
fluctuating between –13.6 and –5.2% (Color Plate 4b, see p. 396) though show-
ing a strong positive correlation between �13C and �18O (r=þ0.99), apparentlysuggesting a physical mixture of two end members.
The c. 1900 Ma Kondopoga Formation of the Onega Basin contains abun-
dant calcite and siderite concretions formed in a lacustrine environment. The
concretions are found in c. 100 m thick, volcaniclastic, greywacke unit depos-
ited from turbidity currents. Concretions occur in various forms. Laterally
continuous beds, 5–7 cm thick, dominate (Color Plate 6a, see p. 398). Many
such beds show sedimentary boudinage (Color Plate 6b, see p. 398). Lensoidal
concretions commonly occur as a series of laterally linked bodies (Color Plate
6c, see p. 398). Many exhibit a considerable differential compaction (Color
Plate 6d, see p. 398) suggesting formation in very early diagenesis. In all cases
concretions formed within coarse sediments comprising lower part of Bouma
cycles. Some sandy ripples and channels underwent early cementation by
carbonates, causing the concretion’s shape to mimic bedding surfaces (Color
Plate 6e, see p. 398). In bedding parallel sections, such concretions appear as
either roughly aligned (Color Plate 6f, see p. 398) or sub-perpendicular (Color
Plate 6g, see p. 398) sausage-shaped bodies. In places, concretions show con-
centric zoning. Numerous, large-scale, high-energy, erosional channels are
filled with debris including redeposited carbonate concretions (Color Plate 6g,
see p. 398). All features suggest that carbonate concretions formed extensively
and that cementation occurred during early stages of diagenesis. Both bulk and
microcore-based analyses show low �13C values fluctuating between –21.8 and
–13.9% (Tables 1 and 3).All Palaeoproterozoic concretions involved in this study as well as pre-
viously published (e.g. Winter and Knauth, 1992) are significantly depleted in13C, which clearly indicates the involvement of CO2 derived through remi-
neralisation of OM via either bacterial oxidation or bacterial sulphate
reduction.
The Ancient Anoxic Biosphere Was Not as We Know It 181
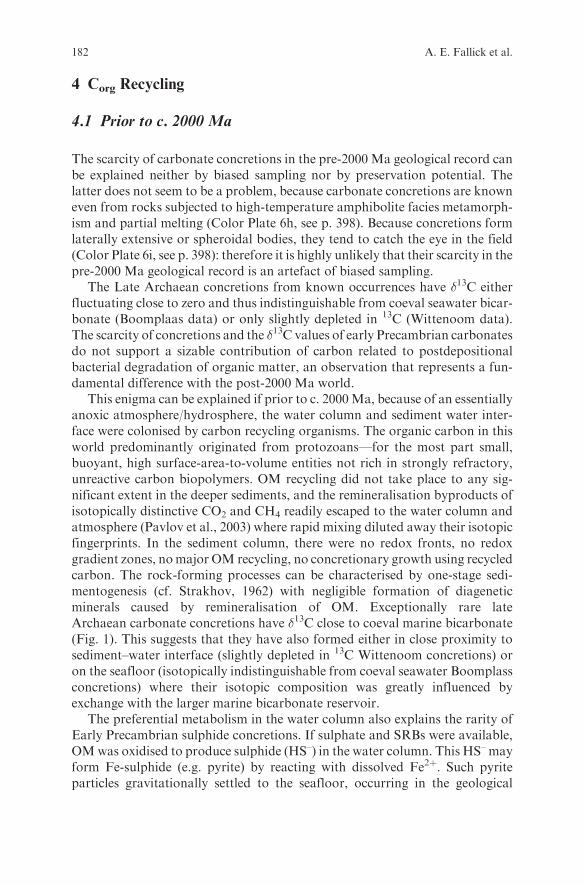
4 Corg Recycling
4.1 Prior to c. 2000 Ma
The scarcity of carbonate concretions in the pre-2000 Ma geological record canbe explained neither by biased sampling nor by preservation potential. Thelatter does not seem to be a problem, because carbonate concretions are knowneven from rocks subjected to high-temperature amphibolite facies metamorph-ism and partial melting (Color Plate 6h, see p. 398). Because concretions formlaterally extensive or spheroidal bodies, they tend to catch the eye in the field(Color Plate 6i, see p. 398): therefore it is highly unlikely that their scarcity in thepre-2000 Ma geological record is an artefact of biased sampling.
The Late Archaean concretions from known occurrences have �13C eitherfluctuating close to zero and thus indistinguishable from coeval seawater bicar-bonate (Boomplaas data) or only slightly depleted in 13C (Wittenoom data).The scarcity of concretions and the �13C values of early Precambrian carbonatesdo not support a sizable contribution of carbon related to postdepositionalbacterial degradation of organic matter, an observation that represents a fun-damental difference with the post-2000 Ma world.
This enigma can be explained if prior to c. 2000Ma, because of an essentiallyanoxic atmosphere/hydrosphere, the water column and sediment water inter-face were colonised by carbon recycling organisms. The organic carbon in thisworld predominantly originated from protozoans—for the most part small,buoyant, high surface-area-to-volume entities not rich in strongly refractory,unreactive carbon biopolymers. OM recycling did not take place to any sig-nificant extent in the deeper sediments, and the remineralisation byproducts ofisotopically distinctive CO2 and CH4 readily escaped to the water column andatmosphere (Pavlov et al., 2003) where rapid mixing diluted away their isotopicfingerprints. In the sediment column, there were no redox fronts, no redoxgradient zones, nomajor OM recycling, no concretionary growth using recycledcarbon. The rock-forming processes can be characterised by one-stage sedi-mentogenesis (cf. Strakhov, 1962) with negligible formation of diageneticminerals caused by remineralisation of OM. Exceptionally rare lateArchaean carbonate concretions have �13C close to coeval marine bicarbonate(Fig. 1). This suggests that they have also formed either in close proximity tosediment–water interface (slightly depleted in 13C Wittenoom concretions) oron the seafloor (isotopically indistinguishable from coeval seawater Boomplassconcretions) where their isotopic composition was greatly influenced byexchange with the larger marine bicarbonate reservoir.
The preferential metabolism in the water column also explains the rarity ofEarly Precambrian sulphide concretions. If sulphate and SRBs were available,OMwas oxidised to produce sulphide (HS–) in the water column. This HS– mayform Fe-sulphide (e.g. pyrite) by reacting with dissolved Fe2þ. Such pyriteparticles gravitationally settled to the seafloor, occurring in the geological
182 A. E. Fallick et al.
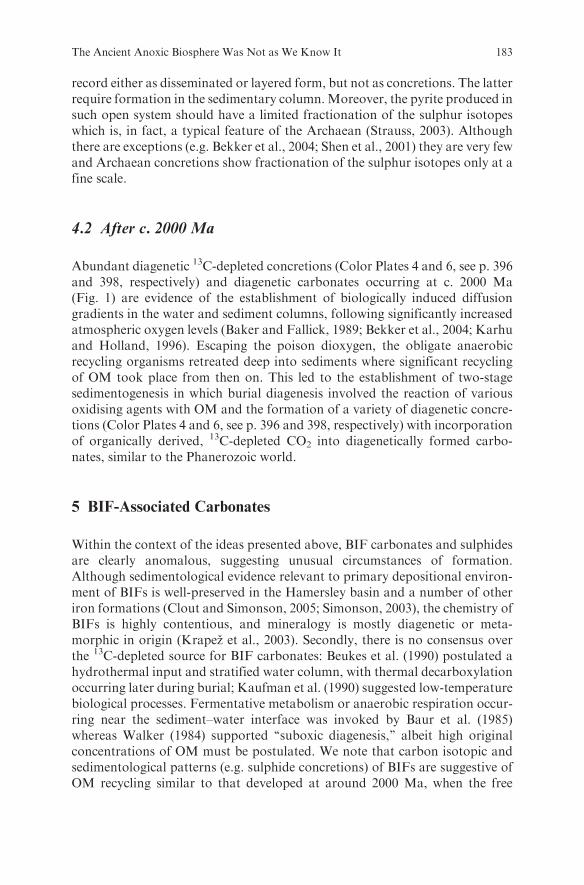
record either as disseminated or layered form, but not as concretions. The latterrequire formation in the sedimentary column.Moreover, the pyrite produced insuch open system should have a limited fractionation of the sulphur isotopeswhich is, in fact, a typical feature of the Archaean (Strauss, 2003). Althoughthere are exceptions (e.g. Bekker et al., 2004; Shen et al., 2001) they are very fewand Archaean concretions show fractionation of the sulphur isotopes only at afine scale.
4.2 After c. 2000 Ma
Abundant diagenetic 13C-depleted concretions (Color Plates 4 and 6, see p. 396and 398, respectively) and diagenetic carbonates occurring at c. 2000 Ma(Fig. 1) are evidence of the establishment of biologically induced diffusiongradients in the water and sediment columns, following significantly increasedatmospheric oxygen levels (Baker and Fallick, 1989; Bekker et al., 2004; Karhuand Holland, 1996). Escaping the poison dioxygen, the obligate anaerobicrecycling organisms retreated deep into sediments where significant recyclingof OM took place from then on. This led to the establishment of two-stagesedimentogenesis in which burial diagenesis involved the reaction of variousoxidising agents with OM and the formation of a variety of diagenetic concre-tions (Color Plates 4 and 6, see p. 396 and 398, respectively) with incorporationof organically derived, 13C-depleted CO2 into diagenetically formed carbo-nates, similar to the Phanerozoic world.
5 BIF-Associated Carbonates
Within the context of the ideas presented above, BIF carbonates and sulphidesare clearly anomalous, suggesting unusual circumstances of formation.Although sedimentological evidence relevant to primary depositional environ-ment of BIFs is well-preserved in the Hamersley basin and a number of otheriron formations (Clout and Simonson, 2005; Simonson, 2003), the chemistry ofBIFs is highly contentious, and mineralogy is mostly diagenetic or meta-morphic in origin (Krapez et al., 2003). Secondly, there is no consensus overthe 13C-depleted source for BIF carbonates: Beukes et al. (1990) postulated ahydrothermal input and stratified water column, with thermal decarboxylationoccurring later during burial; Kaufman et al. (1990) suggested low-temperaturebiological processes. Fermentative metabolism or anaerobic respiration occur-ring near the sediment–water interface was invoked by Baur et al. (1985)whereas Walker (1984) supported ‘‘suboxic diagenesis,’’ albeit high originalconcentrations of OM must be postulated. We note that carbon isotopic andsedimentological patterns (e.g. sulphide concretions) of BIFs are suggestive ofOM recycling similar to that developed at around 2000 Ma, when the free
The Ancient Anoxic Biosphere Was Not as We Know It 183

dioxygen concentration in seawater had become substantial. Perhaps thisaccords with the idea of localised ‘‘oases’’ such that short-term oxygenatedbasins might have punctuated the prevailing oxygen-free world describedabove (Baur et al., 1985; Huston and Logan, 2004; Thode and Goodwin,1983), a world that was to change irrevocably at around 2060 Ma.
6 OM Recycling and the Lomagundi-Jatuli Isotopic Event
An intriguing yet unexplained feature of the 2300(?) to 2060 Ma Lomagundi-Jatuli carbon isotope positive excursion(s) is that there is no evidence for asubsequent compensating low �13C excursion (see, e.g. the representation inKarhu and Holland, 1996). Transient low �13C excursions have been identifiedas possible characteristic features of extinction events (Magaritz, 1989) and ofventilation or turnover of deep anoxic basins (e.g. Aharon and Liew, 1992).Such an excursion might be anticipated to follow an episode of enhancedorganic carbon burial as recycling and remineralisation proceed. However,the lack of a compensating negative excursion emerges as a predictive conse-quence of the hypothesis, developed above, of the creation of a new locus forOM recycling. Since the active biomass reservoir within the sediments andcrust endures, there is no net return of oxidised OM of low �13C to theocean–atmosphere system to become recorded by carbonate �13C. Proponentsof a ‘‘deep biosphere’’ have a new insight into possible early stages and causativemechanisms of their favoured concept.
Hayes and Waldbauer (2006) have interpreted the Lomagundi-Jatuli excur-sion differently, namely as an indicator of shifting methanogenesis from watercolumn and the water–sediment interface deeper into the sedimentary columnat around 2400 Ma as a response to increasing SO4
2– and O2 availability in theocean. The resulting effect of this step function in microbial ecosystemdynamics was formation of 13C-rich diagenetic carbonates with the absence ofcongruent variations in the OM isotopic record andwithout requiring enhancedburial of OM.
This model somewhat echoes our earlier hypothesis, suggestingthat the cause for the Lomagundi-Jatuli 13C-rich carbonates was pene-contemporaneous recycling of OM in cyanobacterial mats with the productionand consequent loss of CO2 and CH4 in usual shallow-water depositionalsettings (Melezhik et al., 1999). However, our subsequent search for the recordof 13C-depleted end-member of methanogenetic processes in Jatuli carbonateswas unsuccessful (Melezhik and Fallick, 2003), thus leaving themethanogeneticmodel unproved. However, interestingly, both the Hayes and Waldbauer’sapproach and the ‘‘concretionary’’ approach explored in this contributionagree that there was an important biological change as a response to thedevelopment of the O2-rich hydrosphere. One remaining issue to be resolvedis the precise timing of onset of the event.
184 A. E. Fallick et al.

Acknowledgement The idea presented above has emerged in 2004 (Melezhik and Fallick,2004) and it was first discussed publicly during the 2004 Goldschmidt Conference with M.L.Coleman, S.D. Golding and H.D. Holland. Since then, we have elaborated our model fromstimulating debates with J.M. Hayes, A. Lepland, L.R. Kump and H. Strauss. Field work byBMS was supported by grants from the National Geographic Society. Field trip to SouthAfrica by VAM was supported by the Geological Survey of Norway. The isotope analyseswere performed at the Scottish Universities Environmental Research Centre supported by theConsortium of Scottish Universities and the Natural Environment Research Council. Thearticle represents contribution to the International Programme ‘‘Biosphere Origin and Evolu-tion’’ and to the Fennoscandian Arctic Russia—Drilling Early Earth Project within theframework of the International Continental Scientific Drilling Program.
References
Abell, P.I., McClory, J., Martin, A. and Nisbet, E.G. (1985) Archaean stromatolites from theNgesi Group, Belingwe Greenstone Belt, Zimbabwe; preservations and stable isotopes—preliminary results. Precambrian Res. 27, 357–383.
Aharon, P. and Liew, T.C. (1992) An assessment of the Precambrian/Cambrian transitionevents on the basis of carbon isotope records. In: M. Schidlowski, S. Golubic,M.M. Kimberley, D.M. McKirdy and P.A. Trudinger (Eds), Early Organic Evolution:Implications for Mineral and Energy Resources. Springer, Berlin, pp. 212–223.
Altermann, W. and Nelson, D.R. (1998) Sedimentation rates, basin analysis and regionalcorrelations of three Neoarchaean and Palaeoproterozoic sub-basins of the Kaapvaalcraton as inferred from precise U–Pb zircon ages from volcaniclastic sediments. Sediment.Geol. 120, 225–256.
Baker, A.J. and Fallick, A.E. (1989) Evidence fromLewisian limestones for isotopically heavycarbon in two-thousand-million-year-old sea water. Nature 337, 352–354.
Baur, M.E., Hayes, J.M., Studley, S.A. and Walter, M.R. (1985) Millimeter-scale variationsof stable isotope abundances in carbonates from banded iron-formations in theHamersleyGroup of Western Australia. Econ. Geol. 80, 270–282.
Bekker, A., Holland, H.D., Wang, P.L., Rumble III, D., Stein, H.J., Hannah, J.L.,Coetzee, L.L. and Beukes, N.J. (2004) Dating the rise of atmospheric oxygen. Nature427, 117–120.
Beukes, N.J., Klein, C., Kaufman, A. and Hayes, J.M. (1990) Carbonate petrography,kerogen distribution, and carbon and oxygen isotope variations in an Early Proterozoictransition from limestone to iron-formation deposition, Transvaal Supergroup, SouthAfrica. Econ. Geol. 85, 663–690.
Blockley (1990) Iron ore. Geology and Mineral Resources of Western Australia. Geol. Surv.West. Austral. Memoir 3, pp. 679–692.
Clout, J.M.F. and Simonson, B.M. (2005) Precambrian iron formations and iron formation-hosted iron ore deposits. In: J.W. Hedenquist, J.F.H. Thompson, R.J. Goldfarb andJ.P. Richards (Eds), Economic Geology One Hundredth Anniversary Volume1905–2005. Soc. Econom. Geol., Littleton, CO, pp. 643–679.
Coleman, M.L. (1993) Microbial processes: controls on the shape and composition of carbo-nate concretions. Mar. Geol. 113, 127–140.
Coleman, M.L. and Raiswell, R. (1981) Carbon, oxygen and sulphur isotope variationsin concretions from the upper Lias of N.E. England. Geochim. Cosmochim. Acta 45,329-340.
Coleman, M.L. and Raiswell, R. (1993) Microbial mineralization of organic matter: mechan-ism of self-organization and inferred rates of precipitation of diagenetic minerals. Philos.Trans. R. Soc. Lond. A 344, 69–87.
The Ancient Anoxic Biosphere Was Not as We Know It 185
Curtis, C.D., Coleman, M.L. and Love, L.G. (1986) Pore water evolution during sedimentburial from isotopic and mineral chemistry of calcite, dolomite and siderite concretions.Geochim. Cosmochim. Acta 50, 2321–2334.
De Craen, M., Swennen, R., Keppens, E.M., Macaulay, C.I. and Kiriakoulakis, K. (1999)Bacterially meditated formation of carbonate concretions in the Oligocene Boom Clay ofNorthern Belgium. J. Sediment. Res. 69, 1098–1106.
Deines, P. (1992) Mantle carbon: concentration, mode of occurrence, and isotopic composi-tion. In: M. Schidlowski, S. Golubic, M.M. Kimberley, D.M. McKirdy and P.A.Trudinger (Eds), Early Organic Evolution: Implications for Mineral and EnergyResource. Springer, Berlin, pp. 133–146.
Dietrich, R.V. (1997) Carbonate Concretions: A Bibliography. http://www.cst.cmich.edu/users/dieter1rv/concretions/, 64 pp.
Donnelly, T.H. and Crick, I.H. (1992) Biological and abiological sulfate reduction in twoNorthern Australian Proterozoic basins. In: M. Schidlowski, S. Golubic,M.M. Kimberley,D.M. McKirdy and P.A. Trudinger (Eds), Early Organic Evolution: Implications forMineral and Energy Resource. Springer, Berlin, pp. 398–407.
Fallick, A.E., McConville, P., Boyce, A.J., Burgess, R. and Kelley, S.P. (1992) Laser microp-robe stable isotope measurements on geological materials: some experimental considera-tions (with special reference to �34S in sulphides). Chem. Geol. 101, 53–61.
Grassineau, N.V., Nisbet, E.G., Fowler, C.M.R., Bickle, M.J., Lowry, D., Chapman, H.J.,Mattey, D.P., Abell, P., Yong, J. and Martin, A. (2002) Stable isotopes in the ArchaeanBelingwe Belt, Zimbabwe; evidence for a diverse microbial mat ecology. In: C.M. Fowler,C.J. Ebinger and C.J. Hawkesworth (Eds), The Early Earth: Physical, Chemical andBiological Development. Geol. Soc. Spec. Publ. 199, pp. 309–328.
Hassler, S.W. (1993) Depositional history of the Main Tuff Interval of the WittenoomFormation, late Archean–Early Proterozoic Hamersley Group, Western Australia. Pre-cambrian Res. 60, 337–359.
Hayes, J.M. and Waldbauer, J.R. (2006) The carbon cycle and associated redox processesthrough time. Philos. Trans. R. Soc. Lond. B 361, 931–950.
Hennessy, J. and Knauth, L.P. (1985) Isotopic variations in dolomite concretions from theMonterey Formation, California. J. Sediment. Petrol. 55, 120–130.
Huston, D.L. and Logan, G.A. (2004) Barite, BIFs and bugs: evidence for the evolution of theEarth’s early hydrosphere. Earth Planet. Sci. Lett. 220, 41–45.
Irwin, H., Curtis, C. and Coleman, M. (1977) Isotopic evidence for source of diageneticcarbonates formed during burial of organic rich sediments. Nature 269, 209–213.
Karhu, J.A. and Holland, H.D. (1996) Carbon isotopes and the rise of atmospheric oxygen.Geology 24, 867–879.
Kaufman, A.J., Hayes, J.M. and Klein, C. (1990) Primary and diagenetic controls ofisotopic compositions of iron-formation carbonates. Geochim. Cosmochim. Acta 54,3461–3473.
Kelley, S.P. and Fallick, A.E. (1990) High precision spatially resolved analysis of �34S insulphides using a laser extraction technique. Geochim. Cosmochim. Acta 54, 883–888.
Krapez, B., Barley, M.E. and Pickard, A.L. (2003) Hydrothermal and resedimented origins ofthe precursor sediments to banded iron formation: sedimentological evidence from theEarly Palaeoproterozoic Brockman Supersequence of Western Australia. Sedimentology50, 979–1011.
Kyser, T.K. (1986) Stable isotope variations in the mantle. Rev. Mineral. 16, 141–164.Magaritz, M. (1989) 13C minima follow extinction events: a clue to faunal radiation. Geology
17, 337–340.McCrea, J.M. (1950) On the isotopic geochemistry of carbonates and a paleotemperature
scale. J. Chem. Phys. 18, 849–857.Melezhik, V.A. (1992) Palaeoproterozoic Sedimentary and Rock-Forming Basins of the
Fennoscandian Shield. Nauka (Science), Leningrad (in Russ.).
186 A. E. Fallick et al.

Melezhik, V.A. and Fallick, A.E. (1996) A widespread positive �13Ccarb anomaly ataround 2.33–2.06 ga on the Fennoscandian Shield: a paradox. Terra Nova 8,141–157.
Melezhik, V.A. and Fallick, A.E. (2003) �13C and �18O variations in primary and secondarycarbonate phases: several contrasting examples from Palaeoproterozoic 13C-rich dolo-stones. Chem. Geol. 201, 213–228.
Melezhik, V.A. and Fallick, A.E. (2004) Concretions tell that ancient bugs lived differently.Goldschmidt Conference, Copenhagen, Denmark, June 5–11, 2004. Geochim. Cosmo-chim Acta, Abstract Volume, A796.
Melezhik, V.A., Grinenko, L.N. and Fallick, A.E. (1998) 2000 Ma sulphide concretions fromthe ’Productive’ Formation of the Pechenga Greenstone Belt, NW Russia: genetic historybased on morphological and isotopic evidence. Chem. Geol. 148, 61–94.
Melezhik, V.A., Fallick, A.E., Medvedev, P.V. and Makarikhin, V.V. (1999) Extreme 13Ccarb
enrichment in ca. 2.0 Ga magnesite-stromatolite-dolomite-‘red beds’ association in aglobal context: a case for the world-wide signal enhanced by a local environment. EarthSci. Rev. 48, 71–120.
Mortimer, R.J.G. and Coleman, M. (1997) Microbial influence on the oxygen isotopiccomposition of diagenetic siderite. Geochim. Cosmochim. Acta 61, 1705–1711.
Mozley, P.S. and Burns, S.J. (1993) Oxygen and carbon isotopic composition of marinecarbonate concretions: an overview. J. Sediment. Petrol. 63, 73–83.
Nelson, D.R., Trendall, A.F. and Altermann, W. (1999) Chronological correlations betweenthe Pilbara and Kaapvaal cratons. Precambrian Res. 97, 165–189.
Neruchev, S.G. (1982) Uranium and Life in the Earth History. Nedra, Moscow, 208 pp(in Russ.).
Pavlov, A.A., Hurtgen, M.T., Kasting, J.F. and Arthur, M.A. (2003) Methane-rich Proter-ozoic atmosphere? Geology 31, 87–90.
Perry, E.C., Jr, Tan, F.C. andMorey, G.B. (1973) Geology and stable isotope geochemistry ofthe Biwabik Iron Formation, NorthernMinnesota In: Precambrian iron-formations of theworld. Soc. Econ. Geol. Bull. 68, 1110–1125.
Pettijohn, F.J. (1940) Archean metaconcretions of Thunder Lake, Ontario. Geol. Soc. Am.Bull. 51, 1841–1850.
Pye, K., Dickson, J.A.D., Schiavon, N., Coleman, M.L. and Cox, M. (1990) Formation ofsiderite–Mg-calcite–iron sulphide concretions in intertidal marsh and sandflat sediments,north Norfolk, England. Sedimentology 37, 325–343.
Raiswell, R. (1987) Non-steady state microbiological diagenesis and the origin of concretionsand nodular limestones. In: J.D. Marshall (Ed.), Diagenesis of Sedimentary Sequences.Geol. Soc. Spec. Publ. 36, pp. 41–54.
Raiswell, R., Whaler, K., Dean, S., Coleman, M.L. and Briggs, D.E.G. (1993) A simple three-dimensional model of diffusion-with-precipitation applied to localised pyrite formation inframboids, fossils and detrital iron minerals. In: R.J. Parkes, P. Westbroek andJ.W. Leeuw (Eds), Marine Sediments, Burial, Pore Water Chemistry, Microbiology andDiagenesis. Marine Geol. 113, pp. 89–100.
Ripperdan, R.L. (2001) Stratigraphic variation in marine carbonate carbon isotope ratios.Rev. Mineral. 43, 637–662.
Romankevich, E.A. (1977) Geochemistry of Organic Matter in the Ocean. Nauka (Science),Moscow, 265 pp (in Russ.).
Rosenbaum, J.M. and Sheppard, S.M.F. (1986) An isotopic study of siderites, dolomites andankerites at high temperatures. Geochim. Cosmochim. Acta 50, 1147–1159.
Sarmiento, J.L., Dunne, J., Gnadadesikan, A., Key, R.M., Matsumoto, K. and Slater, R.(2002) A new estimate of the CaCO3 to organic carbon export ratio. Global Biogeochem.Cycles 16, 1107.
Schidlowski, M. (1987) Application of stable carbon isotopes to early biogeochemical evolu-tion on Earth. Earth Planet. Sci. Annu. Rev. 15, 47–72.
The Ancient Anoxic Biosphere Was Not as We Know It 187

Schidlowski, M., Appel, P.W.U., Eichmann, R. and Junge, C.E. (1979) Carbon isotopegeochemistry of the 3.7 � 109 yr old Isua sediments, West Greenland; implications forthe Archaean carbon and oxygen cycles. Geochim. Cosmochim. Acta 43, 189–200.
Selles-Martınez, J. (1996) Concretion morphology, classification and genesis. Earth Sci. Rev.41, 177–210.
Shen, Y., Buick, R. and Canfield, D.E. (2001) Isotopic evidence for microbial sulphatereduction in the early Archaean era. Nature 410, 77–81.
Shields, G. and Veizer, J. (2002) Precambrian marine carbonate isotope database: version 1.1.Geochem. Geophys. Geosyst. G3(3), 1–12.
Simonson, B.M. (2003) Origin and evolution of large Precambrian iron formations. In:M. Chan and A. Archer (Eds), Extreme Depositional Environments: Mega EndMembersin Geologic Time. Geol. Soc. Am. Spec. Pap. 370, pp. 231–244.
Simonson, B.M. and Carney, K.E. (1999) Roll-up structures: evidence of in situ microbialmats in late Archean deep shelf environments. Palaois 14, 13–14.
Simonson, B.M., Hassler, S.W. and Schubel, K.A. (1993a) Lithology and proposed revisionsin stratigraphic nomenclature of the Wittenoom Formation (Dolomite) and overlyingformations, Hamersley Group, Western Australia. West. Austral. Geol. Surv. Rep. 34,Prof. Pap. 65–79.
Simonson, B.M., Schubel, K.A. and Hassler, S.W. (1993b) Carbonate sedimentology of theearly Precambrian Hamersley Group ofWestern Australia. Precambrian Res. 60, 287–335.
Smyk, M.C. and Watkinson, D.H. (1990) Sulphide remobilization in Archean volcano-sedimentary rocks and its significance in Proterozoic silver vein genesis, Cobalt, Ontario.Can. J. Earth. Sci. 27, 1170–1181.
Strakhov, N.M. (1962) Stages of development of exospheres and sedimentary rock-formingprocesses in the Earth history. Proc. Acad. Sci. USSR, Geol. Series 12, 3–22 (in Russ.).
Strauss, H. (2003) Sulphur isotopes and the early Archaean sulphur cycle. Precambrian Res.126, 349–361.
Sumner, D.Y. (2000) Autotrophic fixation of HCO3– caused calcite precipitation in 2.5 Ga.
Geological Society of America, 2000 Annual Meeting. Geol. Soc. Am. Abstr. Programs32, 257.
Thode, H.G. and Goodwin, A.M. (1983) Further sulphur and carbon isotope studies of lateArchaean iron-formations of the Canadian Shield and the rise of sulfate reducing bacteria.Precambrian Res. 20, 337–356.
Tissot, B.P. and Welte, D.H. (1984) Petroleum Formation and Occurrence, 2nd ed. Springer,Berlin.
Trendall, A.F., Compston, W., Nelson, D.R., De Laeter, J.R. and Bennett, V.C. (2004)SHRIMP zircon ages constraining the depositional chronology of the HamersleyGroup, Western Australia. Aust. J. Earth Sci. 51, 621–644.
Veizer, J., Hoefs, J., Lowe, D.R. and Thurston, P.C. (1989) Geochemistry of Precambriancarbonates: II. Archean greenstone belts and Archean seawater. Geochim. Cosmochim.Acta 53, 859–871.
Veizer, J., Clayton, R.N., Hinton, R.W., Von Brunn, V., Mason, T.R., Buck, S.G. andHoefs, J. (1990) Geochemistry of Precambrian carbonates: III. Shelf seas and non-marineenvironments of the Archean. Geochim. Cosmochim. Acta 54, 2717–2729.
Walker, J.C.G. (1984) Suboxic diagenesis in banded iron formation. Nature 309, 340–342.Watson, R.S., Trewin, N.H. and Fallick, A.E. (1995) The formation of carbonate cement in
the Forth and Balmoral Fields, northern North Sea: a case for biodegradation, carbonatecementation and oil leakage during early burial In: A.J. Hartley and D.J. Prosser (Eds),Characterization of DeepMarine Clastic Systems. Geol. Soc. Spec. Publ. 94, pp. 177–200.
Winter, B.L and Knauth, L.P. (1992) Stable isotope geochemistry of early Proterozoiccarbonate concretions in the Animikie Group of the Lake Superior region; evidence foranaerobic bacterial processes. Precambrian Res. 54, 131–151.
188 A. E. Fallick et al.
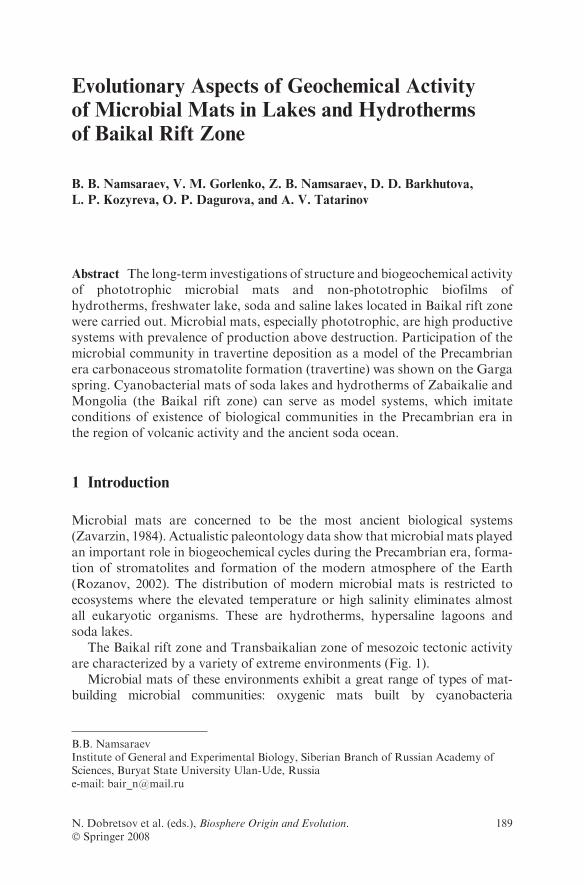
Evolutionary Aspects of Geochemical Activity
of Microbial Mats in Lakes and Hydrotherms
of Baikal Rift Zone
B. B. Namsaraev, V. M. Gorlenko, Z. B. Namsaraev, D. D. Barkhutova,
L. P. Kozyreva, O. P. Dagurova, and A. V. Tatarinov
Abstract The long-term investigations of structure and biogeochemical activityof phototrophic microbial mats and non-phototrophic biofilms ofhydrotherms, freshwater lake, soda and saline lakes located in Baikal rift zonewere carried out. Microbial mats, especially phototrophic, are high productivesystems with prevalence of production above destruction. Participation of themicrobial community in travertine deposition as a model of the Precambrianera carbonaceous stromatolite formation (travertine) was shown on the Gargaspring. Cyanobacterial mats of soda lakes and hydrotherms of Zabaikalie andMongolia (the Baikal rift zone) can serve as model systems, which imitateconditions of existence of biological communities in the Precambrian era inthe region of volcanic activity and the ancient soda ocean.
1 Introduction
Microbial mats are concerned to be the most ancient biological systems(Zavarzin, 1984). Actualistic paleontology data show that microbial mats playedan important role in biogeochemical cycles during the Precambrian era, forma-tion of stromatolites and formation of the modern atmosphere of the Earth(Rozanov, 2002). The distribution of modern microbial mats is restricted toecosystems where the elevated temperature or high salinity eliminates almostall eukaryotic organisms. These are hydrotherms, hypersaline lagoons andsoda lakes.
The Baikal rift zone and Transbaikalian zone of mesozoic tectonic activityare characterized by a variety of extreme environments (Fig. 1).
Microbial mats of these environments exhibit a great range of types of mat-building microbial communities: oxygenic mats built by cyanobacteria
B.B. NamsaraevInstitute of General and Experimental Biology, Siberian Branch of Russian Academy ofSciences, Buryat State University Ulan-Ude, Russiae-mail: [email protected]
N. Dobretsov et al. (eds.), Biosphere Origin and Evolution.� Springer 2008
189

(‘‘cyanobacterial mats’’), mats built by purple and green anoxygenic phototrophic
bacteria (‘‘purple and green mats’’) and mats built by colorless sulfur bacteria
(‘‘sulfuric mats’’) (Gorlenko et al., 1999) (Table 1).
Mongolia
Ulan-Bator
Aginskoe
Chita
Ulan-Ude
Lake Baikal
Russia
1 23
4
57
68
910 11
12
13
14 1516
1718
1920
2122
48°N
50°N
52°N
54°N
56°N106°E 110°E 114°E102°EFig. 1 Location scheme of
studied hydrotherms andsoda and saline lakes(Zabaikalie and Mongoliaregions). Hydrotherms: 1Alla, 2Kuchiger, 3 BolshayaRechka, 4 Garga, 5 Seiya, 6Uro, 7Umkhei, 8Zmeinaya,9 Sukhaya Zagza, 10KhoitoGol, 11 Shumak, 12Zhoigon, 13 Khuzhirta.Soda and saline lakes: 14Khilganta, 15Gorbunka, 16Solenoe, 17 Barun Torey, 18Dabas Nuur, 19 VerkhneeBeloe, 20 Niznee Beloe, 21Khotontyn Nuur, 22 SharaBurdyin Nuur
Table 1 Types of mats and characteristic of development places
Type DominantsDevelopmentplaces ToC
Salinityg l-1 pH
Cyanobacterial Phormidium,Oscillatoria,Synechococcus,Mastigocladus
Hydrotherms 25�68 0.2�1.2 7.8�10.4
Cyanobacterial Microcoleus,Phormidium,Oscillatoria,Arthrospira
Alkaline lakes �4�43 3�390 9.0�10.6
Purple Ectothiorhodospira,Allochromatium,Thiocapsa,Rhodovulum
Hydrotherms 25�66 0.2�1.2 7.8�10.4
Purple Ectothiorhodospira,Marichromatium,Allochromatium,Thiocapsa,Rhodovulum
Alkaline lakes �4�43 3�390 9.0�10.6
Green Chloroflexus Hydrotherms 25�70 0.2�1.2 7.8�10.4Sulfuric Thiothrix,
Beggiatoa,
Thiophisa
Hydrotherms 25�56 0.2�1.2 7.8�10.4
Thioploca Lake Baikal 3.4�6 0.1 7.5�8.6
190 B. B. Namsaraev et al.

Knowledge of these mat types provides evidence of the possible types of matswhich may have been important at different times.
The purpose of this article is to present findings on geochemical activity ofdifferent types of microbial mats from our long-term (1994–2005) research.
Methods of hydrochemical, microbiological and biogeochemical researchesare published in separate papers (Gorlenko et al., 1999).
2 Hot Spring Phototrophic Microbial Mats
Hot springs of the Baikal rift zone belong to nitric, carbonic andmethane types.The domination of gases in gas composition of springs was as follows: nitrogendominates in hot springs of Barguzin valley and Mongolia, carbon dioxide inhot springs of East Sayan Mountains, methane in hot springs of the Tunkavalley.
A combination of temperature, light and sulfide presence favors the formation ofmicrobial mats in these springs (Brock, 1967; Gorlenko and Bonch-Osmolovskaya,1989; Gorlenko et al., 1985). The temperature of water at the outflow of theinvestigated springs is from 25 to 79 8C; the highest temperature was on griffon ofthe Alla spring. The salinity of the investigated springs is low (0.2–1.2 g l–1),pH 7.8–10.4. Sulfide concentrations are 0–31 mg l–1. Thus, the microbialcommunities of alkaline hydrotherms of the Baikal Rift Zone are exposed to thecombined influence of extreme factors: high temperature, high pH and, in somecases, high sulfide concentration.
Anoxygenic mats built by purple bacteria are observed in springs Kucheger,Umkhey and Uro. These mats are 0.2–1.5 mm thick. Cyanobacteria, aerobicand anaerobic destructors are also present in mats. Green mat dominated byChloroflexus aurantiacus develops in the Alla spring in the zone of mixing ofsulfide-containing alkaline thermal waters with pH 9.0–9.9 and river waterswith pH 8.3. The thickness of this mat is 1.0–1.5 mm. These mats have highevolutionary significance showing that mats may be built solely by anoxygenicphototrophic bacteria. Mats of this type may have preceded the development ofcyanobacterial mats in the anoxic early Precambrian Earth (Ward et al., 1989).
The most microbial mats of the Baikal rift zone hot springs are thoseproduced by cyanobacteria. Most mats are 0.5–6 cm thick. In the Seiya springthe cyanobacterial mats accumulate up to 13 cm in thickness. The principalmicrobial components are cyanobacteria of genera Phormidium, Oscillatoriaand Synechococcus. In some hot springs cyanobacteria of genus Mastigocladusare found.
In alkaline hydrotherms phototrophic communities appear at lowertemperature than in slightly alkaline and neutral hydrotherms. For comparison,in the hot spring Uro with pH 8.8 cyanobacterial mats grow at temperatureslower than 64 8C, whereas in the slightly alkaline Octopus spring with pH 8cyanobacterial mat appears at temperature as high as 73 8C (Brock, 1967). The
Evolutionary and Geochemical Activity of Microbial Mats 191
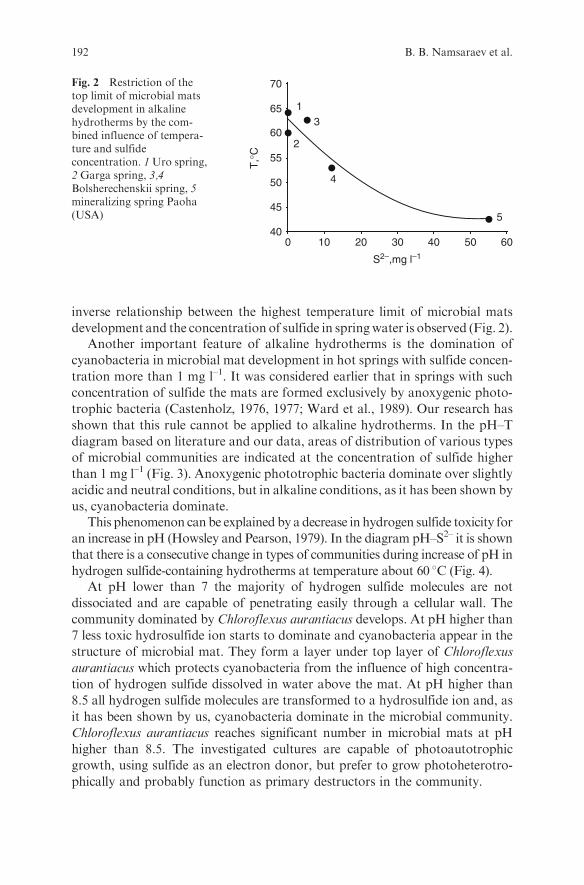
inverse relationship between the highest temperature limit of microbial mats
development and the concentration of sulfide in springwater is observed (Fig. 2).Another important feature of alkaline hydrotherms is the domination of
cyanobacteria in microbial mat development in hot springs with sulfide concen-
tration more than 1 mg l–1. It was considered earlier that in springs with such
concentration of sulfide the mats are formed exclusively by anoxygenic photo-
trophic bacteria (Castenholz, 1976, 1977; Ward et al., 1989). Our research has
shown that this rule cannot be applied to alkaline hydrotherms. In the pH–T
diagram based on literature and our data, areas of distribution of various types
of microbial communities are indicated at the concentration of sulfide higher
than 1 mg l–1 (Fig. 3). Anoxygenic phototrophic bacteria dominate over slightly
acidic and neutral conditions, but in alkaline conditions, as it has been shown by
us, cyanobacteria dominate.This phenomenon can be explained by a decrease in hydrogen sulfide toxicity for
an increase in pH (Howsley and Pearson, 1979). In the diagram pH–S2– it is shown
that there is a consecutive change in types of communities during increase of pH in
hydrogen sulfide-containing hydrotherms at temperature about 60 8C (Fig. 4).At pH lower than 7 the majority of hydrogen sulfide molecules are not
dissociated and are capable of penetrating easily through a cellular wall. The
community dominated by Chloroflexus aurantiacus develops. At pH higher than
7 less toxic hydrosulfide ion starts to dominate and cyanobacteria appear in the
structure of microbial mat. They form a layer under top layer of Chloroflexus
aurantiacus which protects cyanobacteria from the influence of high concentra-
tion of hydrogen sulfide dissolved in water above the mat. At pH higher than
8.5 all hydrogen sulfide molecules are transformed to a hydrosulfide ion and, as
it has been shown by us, cyanobacteria dominate in the microbial community.
Chloroflexus aurantiacus reaches significant number in microbial mats at pH
higher than 8.5. The investigated cultures are capable of photoautotrophic
growth, using sulfide as an electron donor, but prefer to grow photoheterotro-
phically and probably function as primary destructors in the community.
0 10 20 30 40 50 6040
45
50
55
60
65
70
T,°
CS2–,mg l–1
1
2
3
4
5
Fig. 2 Restriction of thetop limit of microbial matsdevelopment in alkalinehydrotherms by the com-bined influence of tempera-ture and sulfideconcentration. 1Uro spring,2 Garga spring, 3,4Bolsherechenskii spring, 5mineralizing spring Paoha(USA)
192 B. B. Namsaraev et al.
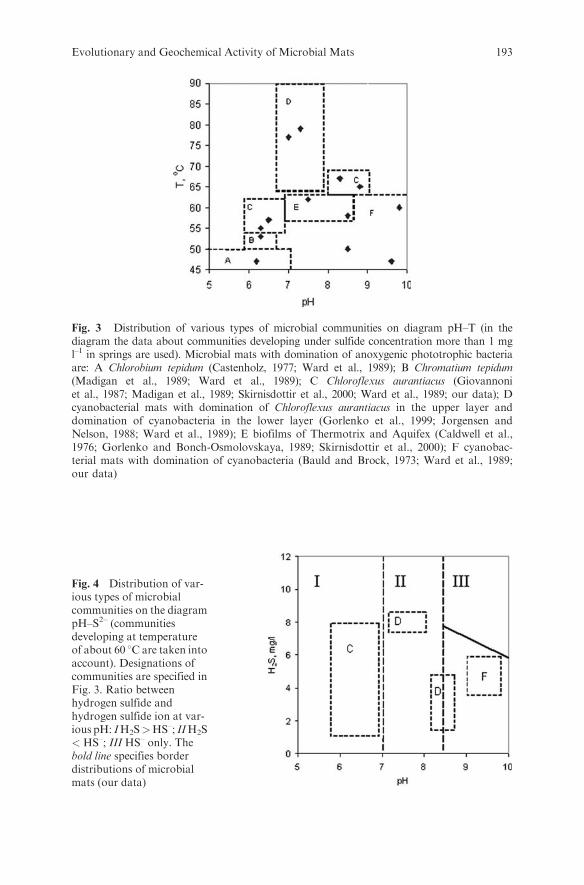
Fig. 3 Distribution of various types of microbial communities on diagram pH–T (in thediagram the data about communities developing under sulfide concentration more than 1 mgl–1 in springs are used). Microbial mats with domination of anoxygenic phototrophic bacteriaare: A Chlorobium tepidum (Castenholz, 1977; Ward et al., 1989); B Chromatium tepidum(Madigan et al., 1989; Ward et al., 1989); C Chloroflexus aurantiacus (Giovannoniet al., 1987; Madigan et al., 1989; Skirnisdottir et al., 2000; Ward et al., 1989; our data); Dcyanobacterial mats with domination of Chloroflexus aurantiacus in the upper layer anddomination of cyanobacteria in the lower layer (Gorlenko et al., 1999; Jorgensen andNelson, 1988; Ward et al., 1989); E biofilms of Thermotrix and Aquifex (Caldwell et al.,1976; Gorlenko and Bonch-Osmolovskaya, 1989; Skirnisdottir et al., 2000); F cyanobac-terial mats with domination of cyanobacteria (Bauld and Brock, 1973; Ward et al., 1989;our data)
Fig. 4 Distribution of var-ious types of microbialcommunities on the diagrampH–S2– (communitiesdeveloping at temperatureof about 60 8C are taken intoaccount). Designations ofcommunities are specified inFig. 3. Ratio betweenhydrogen sulfide andhydrogen sulfide ion at var-ious pH: IH2S>HS–; IIH2S< HS–; III HS– only. Thebold line specifies borderdistributions of microbialmats (our data)
Evolutionary and Geochemical Activity of Microbial Mats 193
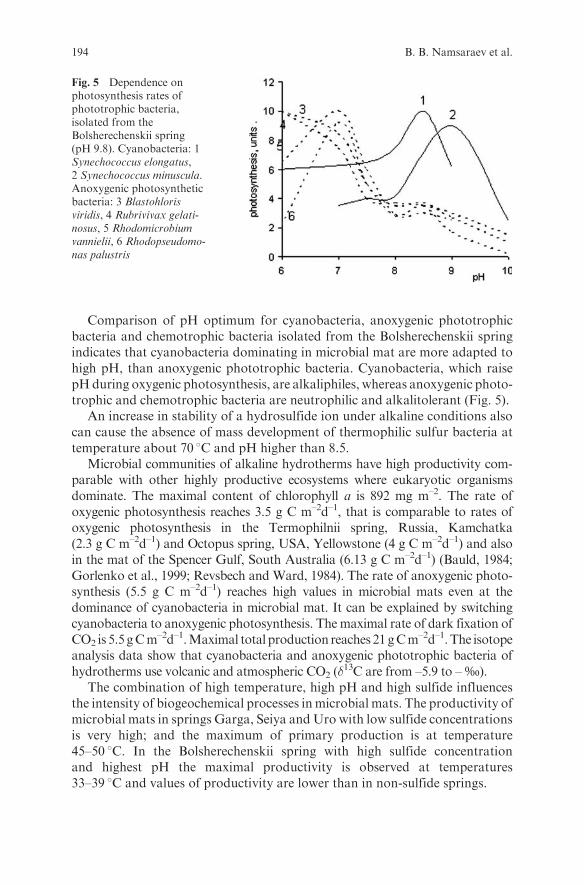
Comparison of pH optimum for cyanobacteria, anoxygenic phototrophicbacteria and chemotrophic bacteria isolated from the Bolsherechenskii springindicates that cyanobacteria dominating in microbial mat are more adapted tohigh pH, than anoxygenic phototrophic bacteria. Cyanobacteria, which raisepHduring oxygenic photosynthesis, are alkaliphiles, whereas anoxygenic photo-trophic and chemotrophic bacteria are neutrophilic and alkalitolerant (Fig. 5).
An increase in stability of a hydrosulfide ion under alkaline conditions alsocan cause the absence of mass development of thermophilic sulfur bacteria attemperature about 70 8C and pH higher than 8.5.
Microbial communities of alkaline hydrotherms have high productivity com-parable with other highly productive ecosystems where eukaryotic organismsdominate. The maximal content of chlorophyll a is 892 mg m–2. The rate ofoxygenic photosynthesis reaches 3.5 g C m–2d–1, that is comparable to rates ofoxygenic photosynthesis in the Termophilnii spring, Russia, Kamchatka(2.3 g C m–2d–1) and Octopus spring, USA, Yellowstone (4 g C m–2d–1) and alsoin the mat of the Spencer Gulf, South Australia (6.13 g C m–2d–1) (Bauld, 1984;Gorlenko et al., 1999; Revsbech and Ward, 1984). The rate of anoxygenic photo-synthesis (5.5 g C m–2d–1) reaches high values in microbial mats even at thedominance of cyanobacteria in microbial mat. It can be explained by switchingcyanobacteria to anoxygenic photosynthesis. Themaximal rate of dark fixation ofCO2 is 5.5 gCm–2d–1.Maximal total production reaches 21gCm–2d–1.The isotopeanalysis data show that cyanobacteria and anoxygenic phototrophic bacteria ofhydrotherms use volcanic and atmospheric CO2 (�
13C are from –5.9 to – ‰).The combination of high temperature, high pH and high sulfide influences
the intensity of biogeochemical processes inmicrobial mats. The productivity ofmicrobial mats in springs Garga, Seiya andUro with low sulfide concentrationsis very high; and the maximum of primary production is at temperature45–50 8C. In the Bolsherechenskii spring with high sulfide concentrationand highest pH the maximal productivity is observed at temperatures33–39 8C and values of productivity are lower than in non-sulfide springs.
Fig. 5 Dependence onphotosynthesis rates ofphototrophic bacteria,isolated from theBolsherechenskii spring(pH 9.8). Cyanobacteria: 1Synechococcus elongatus,2 Synechococcus minuscula.Anoxygenic photosyntheticbacteria: 3 Blastohlorisviridis, 4 Rubrivivax gelati-nosus, 5 Rhodomicrobiumvannielii, 6 Rhodopseudomo-nas palustris
194 B. B. Namsaraev et al.

Participation of the microbial community in travertine deposition as a
model of the Precambrian era carbonaceous stromatolite formation wasstudied on the Garga spring. The maximum thickness of the travertine is
2.5 m. Travertine is carbonate-calcium in composition and have high contentof SiO2 (3.61%) and MnO (1.27%). The travertine age is 19,245–25,725
(Middle–Late Pleistocene) (Plyusnin et al., 2000). Hydrothermal waterbelongs to sulfate-sodium type and contains relatively low concentration of
calcium and carbonate, therefore the fact of formation from such waters ofcalcium-carbonate travertine represents significant interest (Borisenko et al.,1976). In opinion of Plyusnin and coauthors (2000), the formation of traver-
tine could not occur during a process of decompression of carbon dioxide atan outflow because the concentrations of carbon dioxide carbonate, bicarbo-
nate and calcium ions are too low. According to our observations, thetravertine deposition is closely associated with the activity of microbial mat.
The highest activity of this process is measured in zones of microbial mat withexcess of primary production above destruction and constant access of hot
spring water. During decrease of the hot spring water flow the destructionprocess (0.89 g C m–2d–1) exceeds considerably the primary production(0.24 g C m–2d–1), the microbial mat dehydrates and forms a thin gradually
collapsing crust; lithification of microbial mat does not occur.Samples of dehydratedmicrobial mat, surface and deeper layers of travertine
are investigated using scanning electronic microscopy. Microfossils (filaments
and spheres) are found in travertine samples and microbial mat (Fig. 6).Among filaments the samples with diameter from 2.5 up to 4.5 mm (30 units,
60%) dominate. Filaments with thickness of up to 2.5 mm are found in lowernumbers (17 units, 34%). Filaments with thickness of up to 10 mm are found
only in three cases (6%). Diameter of the spheres is about 10 mm. The highestnumber of microfossils was revealed in the dried mat (28 filaments and
67 spheres). In lower levels of travertine the number of microfossils decreasesprobably due to destruction during diagenesis (Fig. 7).
Travertine deposit of the Garga spring at the initial stage of formationis represented by gel organic argillo carbonated substrate which then is
transformed into calcites 1, 2 and 3. Formation of calcite grains is located around
Fig. 6 Microfossils of Garga spring: (A) dehydrated mat; (B) surface layer of travertine
Evolutionary and Geochemical Activity of Microbial Mats 195

pelitomorphic organic argillo carbonated centers with bacterial basis. Fragmentsof cyanobacteria are basically found in connection with relict particles of gelorganic argillo carbonated substrate in calcite grains 1 and partly 2.
Comparison of neutral carbonic springs with high content of calcium andcarbonates located in the Baikal rift zone and the sulfate-sodium Garga springwith low concentrations of calcium and carbonates shows that the microbialcommunity plays an important role in the travertine deposition in theGarga spring.In the process of oxygenic photosynthesis an alkaline geochemical barrier is formedand precipitation of calcium carbonate occurs on it. Colloidal systems with highcontent of bioorganic substance and bicarbonate true solutions are formed in theprocesses of bacterial production and destruction of organic matter. At later stagesbicarbonate solution becomes the centers of crystallization of calcite.
At pH > 8.4 the travertine deposition does not occur due to the absence ofcalcium. Under these conditions siliceous deposit (geyserite) is formed aroundBolsherechenskii, Alla and Uro hot springs. These systems can be regarded asmodern analogs of the Precambrian fossil-bearing siliceous stromatolites.
3 Non-phototrophic Biofilms
In the absence of light or at temperatures excluding the growth of phototrophicmicroorganisms (>73 8C) microbial communities are based on the activity ofchemolithoautotrophic aerobic and anaerobic bacteria.
In the Frolikha Bay of the Lake Baikal, underwater vents were studied(Namsaraev et al., 1994). These waters are characterized by increased concen-trations of K, Na, Ca ions, lowered concentrations of Fe, Mn, Ni, Zn ions andan enormously high concentration of Cl ion. A sulfur biofilm dominated byThioploca develops in this area (Namsaraev and Zemskaya, 2000). Gentlebiofilms are located mosaically and have thickness of 0.1-0.3 mm. The rate ofdark CO2 fixation in underwater mats reaches 24.8 mg C m–2d–1,
Fig. 7 Changes of com-pound and number ofmicrofossils in cyanobacter-ial mat and travertine ofGarga spring
196 B. B. Namsaraev et al.

chemosynthesis reaches 13.7 mg C m–2d–1 and methane oxidation reaches
0.23 ml CH4 dm–3d–1. High activity of methanogenic and methane-oxidizing
bacteria in the microbial community of the Frolikha Bay influences the biogeo-
chemical cycles in this area. The values of �13C of the benthic animals of this
area are from –59.5 to 72.3‰. These data indicate that they use carbon of
biogenic methane.Sulfur streamers are found in high-sulfide slightly alkaline warm springs
Alla, Kucheger, Khoito-Gol and Zmeinaya. Streamers are dominated by color-
less sulfur bacteria of genera Thiotrix, Beggiatoa, Thiophisa and Thiobacillus.
4 Microbial Mats of Saline and Soda Lakes
Other systems where microbial mats develop are saline and soda lakes of the
Transbaikalian zone of mesozoic tectonic activity. Salinity of investigated lakes
varies from 3 to 390 g l–1. The lakes are alkaline with pH from 9.0 to 10.6.
Waters are sulfate-chloride, sulfate and carbonate types. The temperature of
water in the lakes in the summer warms up to 28–30 8C, in shallow lagoons
of lakes up to an ambient temperature (sometimes above 40 8C).Anoxygenic phototrophic bacteria of genera Ectothiorhodospira, Allochro-
matium, Thiocapsa, Rhodovulum dominate in purple mats of coastal lagoons of
soda lakes Khilganta, Gorbunka, Solenoe (Kyran), Barun Torey, Dabas Nuur,
Verkhnee and Nizhnee Beloe, Khotontyn Nuur and Shara Burdyin Nuur.Thin (2–3 mm) cyanobacterial microbial mats are observed in most of
the soda lakes. Thick (1.5–2.0 cm) layered cyanobacterial mat is formed only
in the shallow soda Lake Khilganta (Gerasimenko et al., 2003). Six vertical
layers are revealed (Table 2).
Table 2 Vertical structure of the Khilganta cyanobacterial mat
ZoneLayer(mm) Color Components
1 0–2 Darkgreen
Cyanobacteria (Microcoleus chthonoplastes,Aphanothecesalina, Oscillatoria sp., Phormidiummolle ), green algaeChlorella minutissima , diatoms, purple bacteria,minerals
2 2–4.5 Purple andbrown
Purple bacteria (Ectothiorhodospira, Allochromatium,Thiocapsa, Rhodovulum ), cyanobacteria, greenfilamentous bacteria Chloroflexus sp., minerals
3 4.5–7.5 Brown-green
Cyanobacteria, purple bacteria, minerals
4 7.5–10.5 Grey Minerals, fragments of cyanobacteria
5 10.5–12.5 Lightbrown
Fragments of cyanobacteria
6 12.5–18.5 Dark grey Bacteria-destructors, lysed cells of cyanobacteria
Evolutionary and Geochemical Activity of Microbial Mats 197

The first has dark green color by filamentous cyanobacteria domination. Thenext is the layer of development of the purple bacteria. In the third layercyanobacteria and anoxygenic phototrophic bacteria are observed in equalnumbers. In the fourth layer minerals and remnants of filamentous bacteriaare revealed. The fifth layer is formed by lysed filaments of cyanobacteriumMicrocoleus. The last layer is a zone of sulfate reduction with dark grey color.
Isotopic data show that primary producers in microbial mats of soda andsaline lakes use carbon of microbial origin (�13C from –15.6 to –24.2‰). Micro-bial mats of shallow soda lakes have productivity of about 0.1–3.9 g C m–2d–1.Dark CO2 fixation reaches 0.02–0.26 g C m–2d–1. The highest total photosynth-esis 1.4–3.9 g C m–2d–1 is measured in the Lake Khilganta cyanobacterial mat.Oxygenic photosynthesis is found in the upper zone of the mat where its part ofthe total photosynthetic production reaches 25%. In lower layers the photosyn-thetic production is carried out entirely by anoxygenic photosynthesis. That therate of anoxygenic photosynthesis is high in all layers indicates participation ofcyanobacteria in the process of anoxygenic photosynthesis by using photosystemI. The microbial community of the Lake Khilganta may be concerned as amodern analog of ancient sulfide environments where the evolution of cyano-bacteria occurred.
Deposition of minerals in the mat of the LakeKhilganta is found. Aragonite,calcite and calcium phosphate precipitated in zones of development of oxygeniccyanobacteria and anoxygenic photobacteria. Deposition of sulfide basicallyoccurred in the sulfate reduction zone.
5 Terminal Destruction Processes in Microbial Mats
High rates of terminal destruction processes are revealed in microbial mats ofhot springs. The maximal value of sulfate reduction reaches 5.5 g S m–2d–1. Therate of methane formation is low, no more than 1.5 mg C m–2d–1. The rate oforganic matter mineralization in the course of sulfate reduction has the valueof two to three orders of magnitude higher than that characterizing themethaneformation. The high rate of sulfate reduction (up to 5.5g S m–2d–1) results in ahigh activity of sulfur cycle’s microorganisms (anoxygenic phototrophicbacteria, sulfur-oxidizing bacteria) even in the absence of dissolved sulfide. Incyanobacterial mats from Spencer Gulf (South Australia) the maximal sulfatereduction rate is 3.5 g S m–2d–1, in Termophilnii spring it is 1.4 g S m–2d–1
(Gorlenko et al., 1989; Skyring et al., 1983).In microbial mats of soda lakes sulfate reduction is also higher than methane
formation. Therefore in these mats most part of the organic matter is miner-alized during the sulfate reduction.
In the Lake Baikal mat most part of the organic matter (10.3 mg Cm–2d–1) isused for formation ofmethane, whereas reduction of sulfates takes only 0.15mgC m–2d–1.
198 B. B. Namsaraev et al.

6 Conclusion
It is shown that microbial mats of hot springs, soda lakes and freshwater of the
Lake Baikal of the Baikal rift zone represent different types of mats which may
have been important at different times of the Precambrian era. Modern cyano-bacterial mats, purple and green mats and sulfur biofilms are independent
cooperative communities consisting of different functional groups of produ-
cents and destructors. In cyanobacterial mats the basic producents are filamen-tous and coccoid cyanobacteria capable of oxy- and anoxygenic photosynthesis
and of fixing molecular nitrogen. Purple and green mats are formed by anoxy-
genic phototrophic bacteria in hydrotherms with a high sulfide content and insoda lakes. In underwater hydrotherms in the absence of light and at high
sulfide concentration the streamers of colorless sulfur bacteria are found.
These bacteria are capable of using biogenic and volcanic hydrogen sulfide.Earlier the different microbial mats have been described in hydrotherms,
shallow soda and salt lakes and marine lagoons (Zavarzin, 1984). Comparative
analysis of literature and our data shows that the microbial communities in
microbial mats of hydrotherms and shallow soda and salt lakes are similar instructural and functional characteristics (Bauld, 1984; Gorlenko et al., 1989;
Ward et al., 1989).In these systems the high activity of microorganisms participating in the
organic matter production and destruction is measured. Cyanobacterial andpurple microbial mats of investigated environments of the Baikal rift zone are
high productive systems with dominance of production above destruction
(Table 3).Sulfate-reducing bacteria play a key role in the terminal destruction
processes at alkaline pH in a wide range of salinity and temperature in hydro-
therms and soda lakes. In microbial mats of freshwater of the Lake Baikal themajor terminal destruction process is methane formation. Methane-oxidizing
and sulfur-oxidizing bacteria form effective filter on the way of volcanic and
biogenic gases.Phototrophic, lithotrophic and heterotrophic bacteria of microbial mats par-
ticipate in the formation of biogenic minerals, first of all carbonates, phosphates
and sulfides. Precipitation of minerals during the formation of geochemical
Table 3 Intensity of microbial processes in microbial mats of water ecosystems of the Baikalrift zone
Waterecosystems
Photosynthesis(g Cm�2d�1) Chemo-
synthesis(g C m�2d�1)
Sulfatereduction(g Sm�2d�1)
Methaneformation(ml CH4
m�2d�1)Oxygenic Anoxygenic
Hydrotherms 0.002–3.65 0.004–5.48 – 0.006–5.5 0.28 –1560
Soda lakes 0.04–3.86 0.003–3.28 – 0.01– 0.12 3.5–80.7
Lake Baikal – – 1.4 0.014 12000
Evolutionary and Geochemical Activity of Microbial Mats 199

barriers by microbial communities of hot springs and soda lakes allows consider-
ing these communities as modern analogs of ancient stromatolites.
Acknowledgment This work was supported by Programs of the Presidium of the RussianAcademy of Sciences ‘‘Origin of life and evolution of biosphere’’ and ‘‘Molecular and cellularbiology,’’ grants of the Siberian Branch of the Russian Academy of Sciences 24, grant ofthe Russian Foundation for Basic Research 05-04-97215, grants of ‘‘Russian Universities’’07.01.474 and Program of Russian Federation Department of Education and Science‘‘Development of higher school educational potential (2006–2008).’’
References
Bauld, J. (1984)Microbial mats in SharkBay and SpencerGulf. In: Y.Cohen, R.W.Castenholzand H.O. Halvorson (Eds), Microbial Mats: Stromatolites. Alan R. Liss, New York, pp.39–58.
Bauld, J. and Brock, T.D. (1973) Ecological studies of Chloroflexus, a gliding photosyntheticbacterium. Arch. Microbiol. 92, 267–284.
Borisenko, I.M., Ochirov, Yu.Ch. and Suslenkova, R.M. (1976) The travertine compoundfrom sediments of the some mineral springs of Transbaikalia. Proc. Buryatia Geol. Inst.Ulan-Ude 7(15), 36–52.
Brock, T.D. (1967) Microorganisms adapted to high temperatures. Nature 214, 882–885.Caldwell, D.E., Caldwell, S.J. and Laycock, J.P. (1976) Thermotrix thioparus gen. nov. sp.
nov. a facultatively anaerobic facultative chemolithotroph living at neutral pH and hightemperature. Can. J. Microbiol. 22, 1509–1517.
Castenholz, R.W. (1976) The effect of sulfide on the blue-green algae of hot springs. I. NewZealand and Iceland. J. Phycol. 12, 54–68.
Castenholz, R.W. (1977) The effect of sulfide on the blue-green algae of hot springs. II.Yellowstone National Park. Microb. Ecol. 3, 79–105.
Gerasimenko, L.M., Mityushina, L.L. and Namsaraev, B.B. (2003) The mats Microcoleusfrom alkaliphilic and halophilic communities. Microbiology 72, 84–93 (in Russian).
Giovannoni, S.J., Revsbech, N.P., Ward, D.M. and Castenholz R.W. (1987) Obligatelyphototrophic Chloroflexus: primary production in anaerobic hot spring microbial mats.Arch. Microbiol. 147, 80–87.
Gorlenko, V.M. and Bonch-Osmolovskaya, E.A. (1989) The microbial mats formation andactivity of production and destruction processes. In: Calder Microorganisms. Nauka,Moscow, pp. 53-64.
Gorlenko, V.M., Kompantseva, E.I. and Puchkova, N.N. (1985) The influence of tempera-ture on the distribution of phototrophic bacteria in the hot springs. Microbiology 54,848–853 (in Russian).
Gorlenko, V.M., Namsaraev, B.B., Kulyrova, A.V., Zavarzina, D.G. and Zhilina, T.N.(1999) The activity of sulfate-reducing bacteria in the sediments of the soda lakes inSoutheastern Transbaikal Region. Microbiology 68, 580–585.
Howsley, R. and Pearson, H.W. (1979) pH dependent sulfide toxicity to oxygenic photo-synthesis in cyanobacteria. FEMS Microb. Lett. 6, 287–292.
Jorgensen, B.B. andNelson, D.C. (1988) Bacterial zonation, photosynthesis and spectral lightdistribution in hot spring microbial mats of Iceland. Microb. Ecol. 16, 133–148.
Madigan, M.T., Takigiku, R., Lee, R.G., Gest, R. and Hayes, J.M. (1989) Carbon isotopefractionation by thermophilic phototrophic sulfur bacteria: evidence for autotrophicgrowth in natural populations. Appl. Environ. Microbiol. 55, 639–644.
200 B. B. Namsaraev et al.

Namsaraev, B.B. and Zemskaya, T.I. (2000) Microbial processes of carbon circulation inbottom sediments of Lake Baikal. Publishing House of Siberian Branch of RAS,Novosibirsk.
Namsaraev, B.B., Dulov, L.E., Dubinina, G.A., Zemskaya, T.I., Granina, L.Z. andKarabanov, E.V. (1994) The participation of bacteria in processes of synthesis anddestruction of the organic matter in microbic mats the lake Baikal. Microbiology 63,345–352.
Plyusnin, A.M., Suzdalnitskii, A.P., Adushinov, A.A. and Mironov A.G. (2000) Formationof travertine from carbonated and nitric hydrotherms in the Baikal rift zone. Geol.Geophys. 41, 546–552 (in Russian).
Revsbech, N.P. andWard, D.M. (1984) Microelectrode studies of interstitial water chemistryand photosynthetic activity in a hot spring microbial mat. Appl. Environ. Microbiol.48, 270–275.
Rozanov, A.Yu. (Ed.) (2002) Bacteriological Paleontology. PIN RAS, Moscow.Skirnisdottir, S.,Hreggvidsson,G.O.,Hjorleifsdottir, S.,Marteinsson, V.T., Petursdottir, S.K.,
Holst, O. and Kristjansson J.K. (2000) Influence of sulfide and temperature on speciescomposition and community structure of hot spring microbial mats. Appl. Environ.Microbiol. 66, 2835–2841.
Skyring, G.M., Chambers, L.A., Bauld, J. (1983) Sulfate reduction in sediments colonized bycyanobacteria, Spencer Gulf, South Australia. Aust. J. Mar. Freshw. Res., 34, 359–374.
Ward, D.M., Weller, R., Shiea, J., Castenholz, R.W. and Cohen, Y (1989) Hot springmicrobial mats: anoxygenic and oxygenic mats of possible evolutionary significance. In:Y. Cohen and E. Rosenberg (Eds), Microbial Mats: Physiological Ecology of BenthicMicrobial Communities. ASM, Washington, pp. 3–15.
Zavarzin, G.A. (1984) Bacteria and composition of atmosphere. Nauka, Moscow.
Evolutionary and Geochemical Activity of Microbial Mats 201
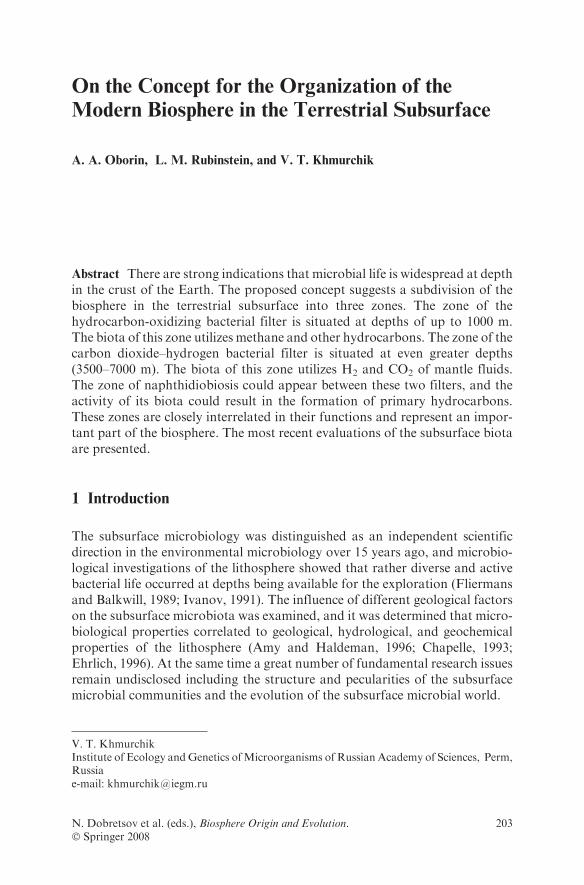
On the Concept for the Organization of the
Modern Biosphere in the Terrestrial Subsurface
A. A. Oborin, L. M. Rubinstein, and V. T. Khmurchik
Abstract There are strong indications that microbial life is widespread at depthin the crust of the Earth. The proposed concept suggests a subdivision of thebiosphere in the terrestrial subsurface into three zones. The zone of thehydrocarbon-oxidizing bacterial filter is situated at depths of up to 1000 m.The biota of this zone utilizes methane and other hydrocarbons. The zone of thecarbon dioxide–hydrogen bacterial filter is situated at even greater depths(3500–7000 m). The biota of this zone utilizes H2 and CO2 of mantle fluids.The zone of naphthidiobiosis could appear between these two filters, and theactivity of its biota could result in the formation of primary hydrocarbons.These zones are closely interrelated in their functions and represent an impor-tant part of the biosphere. The most recent evaluations of the subsurface biotaare presented.
1 Introduction
The subsurface microbiology was distinguished as an independent scientificdirection in the environmental microbiology over 15 years ago, and microbio-logical investigations of the lithosphere showed that rather diverse and activebacterial life occurred at depths being available for the exploration (Fliermansand Balkwill, 1989; Ivanov, 1991). The influence of different geological factorson the subsurface microbiota was examined, and it was determined that micro-biological properties correlated to geological, hydrological, and geochemicalproperties of the lithosphere (Amy and Haldeman, 1996; Chapelle, 1993;Ehrlich, 1996). At the same time a great number of fundamental research issuesremain undisclosed including the structure and pecularities of the subsurfacemicrobial communities and the evolution of the subsurface microbial world.
V. T. KhmurchikInstitute of Ecology andGenetics ofMicroorganisms of Russian Academy of Sciences, Perm,Russiae-mail: [email protected]
N. Dobretsov et al. (eds.), Biosphere Origin and Evolution.� Springer 2008
203
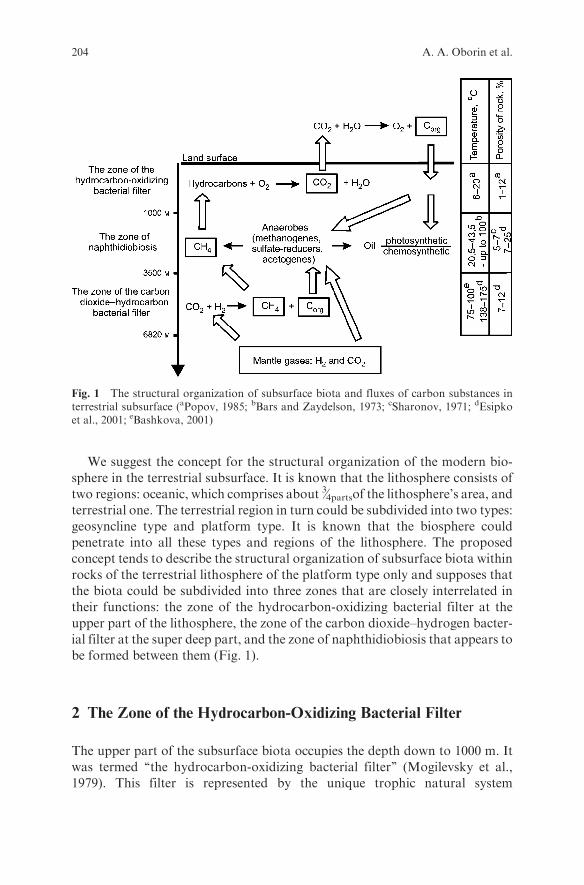
We suggest the concept for the structural organization of the modern bio-sphere in the terrestrial subsurface. It is known that the lithosphere consists oftwo regions: oceanic, which comprises about 3⁄4partsof the lithosphere’s area, andterrestrial one. The terrestrial region in turn could be subdivided into two types:geosyncline type and platform type. It is known that the biosphere couldpenetrate into all these types and regions of the lithosphere. The proposedconcept tends to describe the structural organization of subsurface biota withinrocks of the terrestrial lithosphere of the platform type only and supposes thatthe biota could be subdivided into three zones that are closely interrelated intheir functions: the zone of the hydrocarbon-oxidizing bacterial filter at the
upper part of the lithosphere, the zone of the carbon dioxide–hydrogen bacter-ial filter at the super deep part, and the zone of naphthidiobiosis that appears tobe formed between them (Fig. 1).
2 The Zone of the Hydrocarbon-Oxidizing Bacterial Filter
The upper part of the subsurface biota occupies the depth down to 1000 m. Itwas termed ‘‘the hydrocarbon-oxidizing bacterial filter’’ (Mogilevsky et al.,1979). This filter is represented by the unique trophic natural system
Fig. 1 The structural organization of subsurface biota and fluxes of carbon substances interrestrial subsurface (aPopov, 1985; bBars and Zaydelson, 1973; cSharonov, 1971; dEsipkoet al., 2001; eBashkova, 2001)
204 A. A. Oborin et al.

of microorganisms that includes biotopes of synthrophic microbiologicalcommunities of aerobic, chemolithotrophic, and heterotrophic microorgan-isms, and is based on the activity of hydrocarbon-oxidizing bacteria.Hydrocarbon-oxidizing bacteria assimilate methane and its homologues andfinally oxidize them to carbon dioxide and water. They provide most aminoa-cids as exometabolites, and—under cellular lysis—all essential components(proteins, lipids, carbohydrates) for heterotrophically grown bacteria (Oborinand Stadnik, 1996; Zavarzin, 1972). Carbon dioxide is in turn a growth sub-strate for all autotrophic microorganisms. While utilizing hydrocarbons thatare ‘‘exhausted’’ from the earth’s entrails the microorganisms of the filtersustain the hydrocarbon-free conditions of the earth’s atmosphere. The activityof the hydrocarbon-oxidizing bacterial filter renders significant effect on theenvironments: it causes the sharp changes in the migration capability of mostelements of chalkophile group and elements of variable valency—Fe, Mn, Cu,Ti, Pb, Zn, S, the essential elements of carbonate rocks—Ca, Mg, Ba, Sr, theelements of clay minerals—Si, Al, and the elements in complex organo-mineralcompounds—V, Ni, Co, etc. Most alterations occur in carbonate rocks: recrys-tallization and dolomitization of limestone, pyritization, silicification, reduc-tion of ferric iron to ferrous iron, deconsolidation of rocks, and the formationof secondary porosity therein. Chloritization, serpentinization, kaolinization,montmorillonization, and also the localization de novo of sulfide minerals(pyrite, chalkopyrite, sphalerite, galenite, and cinnabar) are observed in theterrigenous rocks. The formation of new additional sulfide andmagnetic miner-als provides the alterations in magnetic field and electric conductivity of rocks,and the creation of geophysical abnormalities above the hydrocarbon deposits(Oborin et al., 1996). The integral geochemical activity of the Earth’s bacterialfilter biocenosis is manifested in the alteration in the parameters of oil-gas-prospecting probation, in the formation of litho-, phyto-, and aerocosmicabnormalities over the oil-gas deposits (Galkin et al., 2006).
The activity of the hydrocarbon-oxidizing bacterial filter depends on thesurface and the sun via photosynthesis: almost all oxygen on the Earth isproduced via photosynthesis; heterotrophic bacteria could utilize the input oforganic matter from the surface. As the hydrocarbon-oxidizing bacterial filterand the surface biota are interrelated in their substrates and products one couldsuggest the coevolution of them. The issue of the evaluation of this filter role inthe involvement of ‘‘juvenile’’ carbon of deep fluids into a biogenous cycle and inthe enrichment of the rocks with organic substances seems to be topical as well.
3 The Zone of the CO2–H2 Bacterial Filter
The lower part of the subsurface biota occupies the depth from 3500 m to morethan 7000m below surface, but the proper depth of penetration of the biosphereinto the lithosphere (so-called ‘‘the lower boundary of the life’’) remains
Modern Biosphere in the Terrestrial Subsurface 205

unknown. As it is largely comprised of bacteria possessing chemolithotrophictype of metabolism that actively uptake hydrogen and carbon dioxide of mantlefluids (Gold, 1993), we term it ‘‘the carbon dioxide-hydrogen bacterial filter’’.The detection of the lower boundary of the biosphere in the terrestrial subsur-face is the first and most important scientific problem (Ivanov, 1991). It wassupposed that the upper temperature limit of bacterial life may well be withinthe region of 110–150 8C (Stetter et al., 1990). Then, the lower boundary of thebiosphere could be located in depth between 5 and 10 km in most areas of thecrust (Gold, 1992). Our investigations of core samples taken from the Ural andthe Tyumen superdeep wells revealed viable hydrogen-, carbon dioxide-, andcarbonmonoxide utilizing bacteria in them (Ilarionov et al., 1996; Oborin et al.,1999). So, at present the reliable determined depth of propagation of thebiosphere could comprise 6820 m (Ilarionov et al., 1996).
The dispersed organic matter in this zone could be formed at the sacrifice ofchemosynthetic activity of the biota (Pedersen, 1997; Stevens, 1997). As the biotadoes not depend on input of photosynthetic organic matter from the surface itcould be a model for how ecosystems functioned before the evolution of photo-synthesis (Stevens, 1997). Moreover, it was supposed that the place for the originof life could be a deep subterranean igneous rock environment where the earlylife could survive cosmological events, which sterilized the surface of the planet(Pedersen, 1997; Stevens, 1997). The biota of the carbon dioxide–hydrogenbacterial filter uses as its energy source various chemical imbalances that theoutgassing process creates as gases and liquids stream up through the rocks, soone could suggest the dependence of the evolution of the subsurface biota on theevolution of the lithosphere and the presence of adaptations of the biota to hightemperature similar to that observed inmicroflora of hydrothermal abyssal ventsin the oceans. However, further microbiological investigations are required.
4 The Zone of Naphthidiobiosis
Our concept supposes that at depth from 1000 to 3500 m (up to 5000 m in severalcases) below surface the zone of naphthidiobiosis is situated. Naphthidiobiosis is aprocess of microbiological synthesis of gaseous and liquid hydrocarbons. Majormicroorganisms that are involved into the biosynthesis of hydrocarbons appear tobe methanogenic, sulfate-reducing, and probably acetogenic ones. Vernadskyattracted the attention to the possibility of direct microbiological synthesis of oilhydrocarbons (Vernadsky, 1954), and as long ago as 1930s he stated, ‘‘One of theregular scientific issues appears to be the elucidation of whether those organismsthat gave the origin to. . . oil and bitumen. . . are preserved; as we know, they [oiland bitumen-auth.] are not created merely by physical-chemical processes’’ (Ver-nadsky, 1987, p. 57). Subsequently this suggestion was supported in field andlaboratory experiments (Bagaeva, 1997; Bagaeva andZolotukhina, 1994; Simoneitet al., 2004; Slobodkin and Bonch-Osmolovskaya, 1994). Carbon and hydrogen
206 A. A. Oborin et al.

sources for naphthidio-generating biota could be organic substances of photosyn-thetic origin, migrated organic matter of the area of the carbon dioxide–hydrogenbacterial filter, and inorganic gases (CO2, H2) of a migration stream from theEarth’s entrails. It is the authors’ opinion that this area does not spread everywherein the lithosphere, but its distribution is associated with deep-seated joints andfractures and so has a local character.
Vernadsky supposed that the geological process of formation of oil fields isproceeding at present, ‘‘But, indeed, simultaneously the generation of oils,coals, bitumens etc. takes place in newest rocks, in the subsurface biosphereat present’’ (Vernadsky, 1987, p. 249). The origin of oil and gas fields remainshighly topical. According to the concept, atoms of carbon in hydrocarbonmolecules could originate from both sources—photosynthetic organic matterand mantle fluids, and the biota of the zone of naphthidiobiosis is involved intohydrocarbon generation that could explain the low-temperature character ofthe process and the relationship of oil fields with the fracture disturbances of theearth crust (Oborin et al., 2005). It is the authors’ opinion that the formation ofoil fields is a very slow process, which is limited by many insufficiently studiedfactors of the environment.
5 Evaluation of the Subsurface Biota
All living organisms represent a large geological force (Vernadsky, 1987), and sothe evaluation of the subsurface biota in terms of mass and volumes is one of themain scientific issues. It was supposed that total mass of the subsurface biota iscomparable to all the living mass at the surface (Gold, 1992). As a part of theInternational Ocean Drilling Program, investigations of subseafloor sedimentstaken from the depth up to 900 m below sea floor level revealed that their biotabuilt up 10% in the mass of the surface biota (Parkes et al., 2000). We shouldpoint out that this appraisal is related to the subsurface biota into the oceanicregion only, not the lithosphere as a whole. The opinion of some investigators isthat microbial life at subsoil levels is much higher in mass and volume than thatin soils (Vorobyova et al., 1997).We studied themicrobiota in subsurface watersof the terrestrial lithosphere of the platform type only. According to our calcula-tions, the total mass of free-living bacteria in aquifers at the depth up to 2.2 kmcould comprise about 2% of mass of the surface biota (Oborin et al., 2004).However, further investigations are required.
6 Conclusion
Numerous investigations of the lithosphere confirm the existence of diversemicrobial world at depths being available for the exploration, and the results ofthe activity of the subsurface biota possess a global character. It was supposed
Modern Biosphere in the Terrestrial Subsurface 207

that total mass of the subsurface biota is comparable to all the living mass at thesurface (Gold, 1992). To authors’ calculations on the total mass of free-livingbacteria in aquifers at the depth up to 2.2 km could comprise about 2% of themass of the surface biota (Oborin et al., 2004). According to the concept thebiosphere in the terrestrial subsurface could be subdivided into the three zones.The zone of the hydrocarbon-oxidizing bacterial filter is located at the depth upto 1000 m. The biota of this zone utilizes hydrocarbons that are exhausted fromthe deep levels of the lithosphere providing the hydrocarbon-free conditions forthe earth’s atmosphere. The zone of the carbon dioxide–hydrogen bacterialfilter is situated at the super deep depth (3500–7000 m). The biota of this zoneuptakes H2 and CO2 of mantle fluids and synthesizes methane and organicmatter. The zone of naphthidiobiosis could appear between this two filters, butits distribution is associated with deep-seated joints and fractures, and so thezone does not spread everywhere in the lithosphere. The biota of the zone coulduse the organic matter of photosynthetic origin, the migrated organic matterof the zone of the carbon dioxide–hydrogen bacterial filter, and gases of amigration stream from the Earth’s entrails; its activity could result in theformation of the primary oil hydrocarbons. These three zones are closelyinterrelated in their functions, represent the important part of the biosphere,and could coevolve with the lithosphere and the surface biota.
Acknowledgment This work is supported by the Program of the Presidium of RAS ‘‘Scientificfundamentals of biodiversity preservation in Russia’’ and RFBR 07 – 05 – 00541a grant .
References
Amy, P.S. and Haldeman, D.L. (1996) The Microbiology of the Terrestrial Deep Subsurface.CRC Lewis Publications, Boca Raton.
Bagaeva, T.V. (1997) The ability of sulfate-reducing bacteria of various taxonomic groups tosynthesize extracellular hydrocarbons. Mikrobiologiya 66, 666–668.
Bagaeva, T.V. and Zolotukhina, L.M. (1994) The formation of hydrocarbons by sulfatereducing bacteria during the growth in chemolithoheterotrophic conditions. Mikrobiolo-giya 63, 993–995.
Bars, E.A. and Zaydelson, M.I. (1973) Hydrogeological Conditions for the Forming of Oiland Gas Field at Volga-Ural Basin. Nedra, Moscow.
Bashkova, S.E. (2001) The temperature regimen in the main oil and gas fields of Russia at thedepth of 5 km. In: M.B. Keller and A.V. Lipilin (Eds), Assessment Criteria for Oil-and-Gas Content Below Commercially Developed Horizons and Prioritization of Geological-Prospecting Work. KamNIIKIGS, Perm, T. 1, pp. 30–40.
Chapelle, F.H. (1993) Ground-Water Microbiology and Geochemistry. Wiley, New York.Ehrlich, H.L. (1996) Geomicrobiology. Marcel Dekker, New York.Esipko, O.A., Gorbachev, V.I. and Sokolova, T.N. (2001) The results of geophysical studies
at the Tyumen Superdeep Well. In: M.B. Keller and A.V. Lipilin (Eds), AssessmentCriteria for Oil-and-Gas Content Below Commercially Developed Horizons andPrioritization of Geological-Prospecting Work. KamNIIKIGS, Perm, T. 2, pp. 27–52.
Fliermans, C.B. and Balkwill, D.L. (1989) Life in the terrestrial deep subsurface. BioScience39, 370–377.
208 A. A. Oborin et al.

Galkin, V.I., Oborin, A.A. and Khmurchik, V.T. (2006) The fundamentals of theory, meth-odology, and geological-economical efficiency of biogeochemical methods of oil and gasdeposits searching. Sci. Ind. 1, 28–29.
Gold, T. (1992) The deep, hot biosphere. Proc. Natl Acad. Sci. USA 89, 6045–6049.Gold, T. (1993) The origin of methane in the crust of the Earth. In: D.G. Howell (Ed.), The
Future of Energy Gases.USGS Professional Paper 1570. USGovernment Printing Office,Washington.
Ilarionov, S.A., Oborin, A.A., Seleznyov, I.A., Khmurchik, V.T., Rubinstein, L.M.,Bakhareva, E.Z. and Titova, A.V. (1996) Microbiological study of core samples fromthe Tyumen Superdeep Well. In: V.B. Mazur (Ed.) The Tyumen Superdeep Well (0-7502m). Results of Boring and Research. Nedra, Perm, pp. 294–296.
Ivanov, M.V. (1991) Problems of subsurface microbiology in connection with drilling ofsuperdeep holes. Sovetskaya Geol. 8, 10–13.
Mogilevsky, G.A., Bogdanova, V.M. and Kichatova, S. (1979) Bacterial filter in the zone ofoil and gas deposits, its peculiarities and methods of investigation. In: GeochemicalMethod of Oil and Gas Search and the Problems of Nuclear Geology. Nedra, Moscow,pp. 210–246.
Oborin, A.A. and Stadnik, E.V. (1996) Oil-and-Gas Prospecting Geomicrobiology. UBRAS,Ekaterinburg.
Oborin, A.A., Ilarionov, S.A., Seleznyov, I.A. and Khmurchik, V.T. (1999) Microbiologicalinvestigations at the Ural Superdeep Well. In: B.N. Khakhaev and A.F. Morozov (Eds),Results of Boring and Research at the Ural Superdeep Well (SD-4). Nedra, Yaroslavl,pp. 354–360.
Oborin, A.A., Rubinstein, L.M., Khmurchik, V.T. and Churilova, N.S. (2004) The Conceptfor the Organization of the Subsurface Biosphere. UB RAS, Ekaterinburg.
Oborin, A.A., Rubinstein, L.M. and Khmurchik, V.T. (2005) The role of subsurface micro-biota in carbon flows of the upper part of lithosphere. Geol. Geophys. Develop. Oil GasDeposits 9–10, 34–36.
Parkes, J.R., Cragg, B.A. and Wellsbury, P. (2000) Recent studies on bacterial populationsand processes in subseafloor sediments: a review. Hydrogeol. J. 8, 11–28.
Pedersen, K. (1997) Microbial life in deep granitic rock. FEMSMicrobiol. Rev. 20, 399–414.Popov, V.G. (1985) Hydrogeochemistry and Hydrodynamics of Pre-Ural. Nauka, Moscow.Sharonov, L.V. (1971) The Formation of Oil and Gas Fields at the North of Volga-Ural
Basin. PKI, Perm.Simoneit, B.R.T., Lein, A.Yu., Peresypkin, V.I. and Osipov, G.A. (2004) Composition and
origin of hydrothermal petroleum and associated lipids in the sulfide deposits of theRainbow Field (Mid-Atlantic Ridge at 36N). Geochim. Cosmochim. Acta 68, 2275–2294.
Slobodkin, A.I. and Bonch-Osmolovskaya, E.A. (1994) The growth and producing of metha-bolites by extreme-thermophilic archaea Desulfurococcus. Mikrobiologiya 63, 981–986.
Stetter, K.O., Fiala, G., Huber, G., Huber, R. and Segerer A. (1990) Hyperthermophilicmicroorganisms. FEMS Microbiol. Rev. 75, 117–124.
Stevens, T. (1997) Lithoautotrophy in the subsurface. FEMS Microbiol. Rev. 20, 327–337.Vernadsky, V.I. (1954) Essays on geochemistry. In: Selected Works. USSR Academy of
Sciences, Moscow.Vernadsky, V.I. (1987) The Chemical Structure of the Earth’s Biosphere and Its Environment.
Nauka, Moscow.Vorobyova, E., Soina, V., Gorlenko,M.,Minkovskaya,N., Zalinova,N.,Mamukelashvili, A.,
Gilichinsky, D., Rivkina, E. and Vishnivetskaya, T. (1997) The deep cold biosphere: factsand hypothesis. FEMSMicrobiol. Rev. 20, 277–290.
Zavarzin, G.A. (1972) Lithotrophic Microorganisms. Nauka, Moscow.
Modern Biosphere in the Terrestrial Subsurface 209
Biomineralization and Evolution. Coevolution
of the Mineral and Biological Worlds
I. S. Barskov
Abstract The concept of coevolution as a process of irreversible changes in thecomposition, structure, and function of two or more co-existing systems ofdifferent origin resulting from the exchange of the matter, energy, and informa-tion is applicable to a broad range of processes in nature. This chapter considersbiomineralization, one of the fundamental biospheric phenomena, as an exampleof coevolution of the biological and mineralogical worlds.
1 Introduction
The evolution of the biosphere is a process of dynamic interactions of at leastthree of its components (three natural systems): living matter, non-living mat-ter, and the space in which they exist. Irreversible changes in these systems,including their content (taxonomic content of the biota, composition of theatmosphere and geosphere, positions of continents and oceans), constitute theirinherent evolution. Biological evolution is thought to be stochastic, and itsresults are unpredictable. Evolution of abiotic systems is determined by theirprevious states. Changes in each system are not autonomous, but connectedwith the evolution of other systems influencing their future, i.e. contributingto coevolution.
2 Definition of Coevolution
The first definition of coevolution is connected to the phenomenon of reciprocalevolutionary changes in two interacting species or groups of species, whenchange in the genetic composition of one species (or group) leads to a genetic
I. S. BarskovPaleontological Institute of the Russian Academy of Science, Moscow, Russiae-mail: [email protected]
N. Dobretsov et al. (eds.), Biosphere Origin and Evolution.� Springer 2008
211

change in another (Ehrlich and Raven, 1964). Presently, the concept ofcoevolution extends far beyond the study of two or several species and biologicalsystems in general and is used in a wider sense, although remaining withinecology and biosphere evolution studies. For instance, while discussing today’secological crisis Danilov-Danilian et al. (2005, p. 140) wrote: ‘‘. . .this term (mean-ing coevolution – I.B.) successfully describes a wide spectrum of phenomenarelated to the evolution of any interacting systems or elements of the samesystem.’’ Moissejev (1997), discussing present day interactions between manand biosphere, uses the term ‘‘coevolution’’ to describe these interactions andequates it to the term ‘‘stable development.’’ According to this viewpoint, coevo-lution is favourable to both interacting systems and allows their trouble-free andprogressive development. The academic program ‘‘Origin and Evolution of theBiosphere,’’ by containing a section on ‘‘Coevolution of Abiotic and BioticEvents,’’ expands this term to the past states of the biosphere and geospheres ofthe Earth. Thus, the term ‘‘coevolution’’ is understood as a collection of generalrules of the evolution of nature and requires a definition describing general rules.In the philosophical sense, the essence and purpose of the existence of everythingthat exists is the interaction of co-existing entities, i.e. coevolution. Nothing canexist without such an interaction. Interaction in a general sense is an exchange ofmatter, energy, and information between systems. Given that, coevolution ingeneral may be defined as a process of irreversible change in the composition,structure, and function of co-existing natural systems and their parts due to theenhancement (acceleration, modification) of the exchange of matter, energy, andinformation between systems. The hierarchy of biological and non-biologicalsystems comprising the biosphere allows their evolution to be studied at varioushierarchical levels. The study of these processes constitutes the basis of variousfields of modern science.
The interaction between the biological molecules which are products of meta-bolism (either normal or pathological) of organisms and ions of the environmentthat results in the formation of the ‘‘secondary’’ mineral world is studied by thescience of biological mineralization (biomineralization). Classical ecology (cur-rently often referred to as bioecology) studies interactions on another hierarchicallevel, i.e. interactions of organisms and the environment. Complex relation-ships between communities of organisms and their environment (biotope),including their mutual changes constituting microevolution, are studied bybiogeocoenology.
The investigations of global tendencies in the mutual effects of the Earth’sbiota at different stages of its development and of the Earth’s geospheres, whichform a global ecotop of the biota, are studied by global ecology or biospherology.At present, when the influence of human activity on all natural systems: biota,lithosphere, hydrosphere, atmosphere, and on man himself as a special systemicentity (social, religious, cultural, and informational) approaches a permissiblelimit, new fields of coevolutionary studies: geoecology and ecological geology,problems of stable development in the relationship between man and thebiosphere, genetic ecology, cultural ecology, etc. have arisen. Each of these fields,
212 I. S. Barskov
including the first definition, has its own understanding of coevolution andstudies particular patterns of the coevolutionary process, but each of them inthe end can be reduced to the above definition of coevolution. Processes of theorigin of life, which are described by the hypothesis of astrocataclysm (Snytnikov,‘‘Astrocatalysis Hypothesis for Origin of Life Problem,’’ this book), are interac-tions between the simultaneously born systems of the ancestral mineral andbiological worlds and are also processes of coevolution.
3 Biomineralization Is Coevolution of the Mineral
and Biological Worlds
This paper discusses biological mineralization, among the most importantaspects of coevolution for understanding the history of the biosphere. Biologicalmineralization is one of the fundamental processes in nature occurring at themolecular level and resulting in the formation of the biogenic mineral world,i.e. of the secondary mineral nature. The appearance and evolution of theprocess of biomineralization that can be traced in the geological (and possiblyin the pre-geological) past profoundly affected the evolution of the biologicalworld and development and change of all of the inorganic (abiological)envelopes (geospheres) of our planet.
Coevolution of the biological and mineral worlds is the most strikingexample of the environment-creating function of living matter.
Presently, biomineralization studies extended far beyond the framework ofclassical biology and natural history into theory (molecular biology, genetic,and biophysics) and practical use (orthopaedics, dentistry, technology, etc.).Major issues of biomineralization and their implications for the Earth’s historyare discussed below.
3.1 Modern Understanding and Types of Biomineralization
Rigorous studies of biomineralization in recent decades significantly extendedthe original, apparent understanding of biomineralization as a process of secre-tion of minerals by living organisms. In the modern understanding, biominer-alization is a process when biological molecules and supramolecular cellular andextracellular structures forming during metabolism act as mediators, templates,and matrices for mineral compounds. The processes of biomineralization occurin conditions, which are very distinct from the conditions of inorganic miner-alization, i.e. in ‘‘normal’’ temperature ranges, in a water medium, with theparticipation of ions of water-soluble compounds.
Some 80 minerals are currently known to be formed through the metabolismof organisms. Theoretically anymineral can be created by biomolecules because
Biomineralization and Evolution 213

the number of possible spatial conformations of biological molecules (mediatorsof mineralization) greatly exceeds 230 Fedorov’s groups of crystalline symmetrythat describe a possible arrangement of particles inside crystals of any mineral.
In most reviews of biomineralization (Dove et al., 2004; Lowenstam andWeiner, 1989; Mann, 2001) two major types of biomineralization are recog-nized. These are the types first recognized by Lowenstam (1981): (1) inducedand (2) matrix mediated. Recent studies have significantly contributed to theunderstanding of the types of biomineralization. It has been shown that naturaland synthetic biopolymers, their supramolecular structures, biofilms, and alsosimple organic compounds can work as mediators and templates of mineralformation from non-saturated water solution, which is not observed inabiogenic mineralization. This process has been referred to as biomimetics(Sarikaya, 1994). Biomimetic technology is thought to have immense potentialfor producing minerals with predetermined qualities, and generally belongs tothe field of coevolution of the noosphere and mineral world and leads to thecreation of a third mineral kingdom, which is controlled by man. It seemslogical to assume that this process was performed by nature much earlier thanit was discovered by man and was a significant factor in the biosphere.
Recently, with the discovery and study of nanobacteria, an additional miner-alization phenomenon has become known. Nanobacteria are microorganismswith a diameter less than 0.2 �m. Formerly, small mineralized objects referred toas nanobacteria had been discovered in various rocks and on the surface of someminerals (Folk, 1992, 1993) and were interpreted as fossilized remains of extre-mely small organisms, one tenth of the size and one thousandth of the volume, ofany known bacteria. In 1989 the existence of living nanobacteria, isolated fromkidney stones, human blood, cow blood, and commercial blood serum prepara-tions, was confirmed (Kajander and Ciftcioglu, 1998). They form the tinymineral structures of which apatite is composed. Many critics have argued thatthey are smaller than the minimum possible size for a living cell, and some haveargued that the tiny structures in question were formed by abiological processes(Cisar et al., 2000; Kirkland et al., 1999), and that there is no evidence for theexistence of any life forms which are only 10% of the size of the smallestmicrobes known on Earth.
Although it is not yet universally accepted that nanobacteria are livingorganisms, numerous workers have referred to numerous examples of nanobac-teria on Earth. Minuscule 25–200 nm calcite and aragonite particles, of spher-oidal or oval shape, have been found in hot springs carbonates, hardgrounds andother carbonate sediments, recent and Precambrian stromatolite and ovoidlimestone (Folk, 1992, 1993) and have been interpreted as nanobacteria. Struc-tures resembling nanobacteria are found inMartianmeteorites (Benzerara et al.,2003; Folk and Lynch, 1998; Hoover et al., 2004; McKay et al., 1996) andPrecambrian phosphorites (Zhegallo et al., 2000). There is a hypothesis thatmanganese and iron ores have also been formed by nanobacteria (Chafetz et al.,1998). Biomimetic and nanobacterial mineralization in general contributes toLowenstam’s concept of induced mineralization and changes our interpretation
214 I. S. Barskov

of the origin and early stages of this process. Both types of induced biominer-alization are largely physical–chemical, rather than biological processes. Livingorganisms supply organic molecules and/or supramolecular structures as finalproducts of their metabolism, rather than parts of organisms. During biological-induced mineralization, the resulting minerals and their crystalline aggregatesare equivalent in their habitus and properties to minerals formed throughinorganic processes. During the bacteria-induced mineralization a wide rangeof minerals may be formed, including metal ores, depending on the medium inwhichmineralization occurs. Induced biomineralizationwas the first stage of theevolutionary development of this process; it is widely represented in Prokaryotaand is also present in Eukaryota. In Eukaryota, a second, more advanced type ofmineralization matrix-mediated biomineralization of Lowenstam (1981) (cur-rently called controlled biomineralization) prevails. Controlled mineralizationresults in crystals that have specific morphology and shape. Their polycrystallinestructure is genetically controlled and shows a high regularity of their axes andcrystalline structure. These biominerals are different from minerals formedinorganically. They usually have multileveled hierarchical inner structure,which is not observed in abiogenicminerals. This suggests the presence of severalfractions of biomolecules participating at different stages of mineralization fromnucleation to the arrest of crystalline growth. In addition, someminerals formedby biologically controlled mineralization do not precipitate in the modernhydrosphere through abiogenic synthesis (gypsum, fluorite, celestine, magnetite,etc.). During controlled mineralization a restricted number of minerals contain-ing calcium, phosphorus, iron, and silicon, i.e. elements playing an importantrole in the cell’s metabolism, the content of which is rigidly controlled in thecytoplasm. Although matrix-mediated biomineralization is known in severalgroups of bacteria, its mass occurrence is related to the appearance of Eukaryotaand the development of mineralized skeletons. It is still not known whetherEukaryota inherited themechanism of matrix-mediated biomineralization, or invarious groups of eukaryotes, including metazoans, matrix-mediated biominer-alization developed independently (Lowenstam, 1984).
3.2 Evolution of the Composition, Structure, and Functionsof Biominerals
The major aspects of the relationships between the biological evolution andbiomineralization were considered earlier (Barskov, 1982, 1984; Lowenstam,1984; Lowenstam and Weiner, 1989). It is very likely that some inorganicminerals worked as templates and matrices for the formation of the first self-replicating organic compounds, predecessors of the cellular organization of life.This may be an explanation of their chiral selectivity, which would be unlikely inthe case of the non-matrix-mediated abiogenic synthesis. Biomineralization isessentially a reverse process, when biological molecules and supramolecular
Biomineralization and Evolution 215
structures work as mediators of mineralization. The composition and diversityof bacterially induced minerals largely depend on the environment and suggestthe diversity of biogeochemical functions in prokaryotes, rather than differ-ences in their evolutionary level. Mineralogical composition of the products ofthe skeletal matrix biomineralization is restricted to four minerals: calcite,aragonite, silica and calcium phosphate. Siliceous mineralization is mainlyobserved in Protista (radiolarians, diatoms, and closely related groups) andlower metazoans (sponges). Phosphatic mineralization is observed in advancedphyla of invertebrates (brachiopods and arthropods) and chordates. Phospha-tic biomineralization of the early Cambrian small shelly fossils, the ‘‘first’’skeletal organisms in the Phanerozoic, is likely to result from the diageneticbiomimetic mineralization against a background of spotted carbonate miner-alization (Lowenstam, 1984). Calcite and aragonite biomineralization are uni-versally found in almost all eukaryotic groups (from Protista to Vertebrata). Insome phyla, organisms have only one mineral (either calcite or aragonite); insome phyla there are both types. In the evolution of corals, calcitic skeletonsprecede aragonitic. In bivalves and gastropod molluscs, quite the reverseoccurs, taxa with calcitic shells appeared in the geological record later thanthose with aragonitic shells. The structure, i.e. spatial organization and sizehierarchy of crystalline elements, is the ultimate morphological demonstrationof skeletal matrix-mediated biomineralization. The supposed stages of thegradual transition from the induced to controlled mineralization consideredby Lowenstam (1984) are observed in the organization of the size and shape ofcrystals and of their arrangement in polycrystalline units and their integrationin skeleton formations. This process occurred in the Late Precambrian and firstresulted in patchy mineralization of the external skeleton, composed of isolatedsclerites, and later massive skeletons (Knoll, 2004; Lowenstam, 1984). Thistransition is usually thought to be connected with the Cambrian explosion.This crisis resulted in the skeleton acquiring a morphogenetic function andsubsequently the acceleration of morphological evolution in the animal worldand the diversity of skeleton structures, which became as specific as morpholo-gical characters of the soft body.
Bacterially induced biomineralization, which prevailed in the Precambrian,played a large role in the development of the composition of sediments andgeochemical circulation of many elements and in the conditioning of organisms’habitats. Controlled matrix-mediated biomineralization became an innate,genetically fixed property of metabolism, whereas its products became partsof the organism, essentially a new organ responsible for various functions. Asmentioned above, the primary function of biomineralization was to detoxify theorganism. The integration of mineralization into the external tissues and inter-nal structures of organisms facilitated the acquisition of various functions byminerals. The function of orientation in the gravity field in mobile animals isperformed by statocysts and statocones of various mineral compositions(gypsum, celestine, calcite, aragonite, phosphate). The formation of magnetitecrystals in different groups (from magnetotactic bacteria to birds and man)
216 I. S. Barskov

provides extrasensory orientation in the magnetic field. Piezoelectric crystals of
apatite may work as extrasensory receptors.Mineral formations work as depotsfor metabolically important elements (Ca, P, Fe) and energy depots providinghomeostasis and relative independence of functions from the changes in theenvironment. The inner skeleton of vertebrates performs supporting functionsand encloses blood-producing organs.
Thus the interaction between the mineral and biological worlds can be tracedthroughout the entire period of their existence that is available to study. For theworld of minerals, this coevolution enabled the existence of some minerals inthe thermodynamically unbalanced conditions of the biosphere and allowedminerals to acquire functions, other than the substrate for life. For biologicalworld, biomineralization was a powerful means for conditioning its environ-ment, facilitated the acceleration of the biological evolution and growth ofdiversity, and allowed the acquisition of new organs responsible for variousbiological functions.
Acknowledgment I would like to thank Dr T.B. Leonova for her time and efforts,Dr S.V. Nikolaeva for help in translation and contribution to this manuscript.
References
Barskov, I.S. (1982) Biomineralization and evolution. Paleontol. Zh. 4, 5–13 (in Russ.).Barskov, I.S. (1984) Paleontological aspects of biomineralization. Reports of 27th Interna-
tional Geological Congress, Moscow, USSR, Paleontology Sect. C.02, vol. 2, 61–66 (inRuss.).
Benzerara, K., Menguy, N., Guyot, F., Dominici, C. and Gillet, P. (2003) Nanobacteria-likecalcite single crystals at the surface of the Tataouine meteorite. Proc. Natl Acad. Sci.USA 100(13), 7438–7442.
Chafetz, H.S., Akdim, B., Julia, R. and Reid, A. (1998) Mn- and Fe-rich black travertineshrubs: bacterially (and nanobacterially) induced precipitates. J. Sediment. Res. 68,404–412.
Cisar, J.O., Xu, D.-Q., Thompson, J., Swaim, W., Hu, L. and Kopecko, D.J. (2000) Analternative interpretation of nanobacteria-induced biomineralization. Proc. Natl Acad.Sci. USA 97(21), 11511–11515.
Danilov-Danilian, V.I., Losev, K.S. and Reif, I.E. (2005) To the main defiance of civilization.View from Russia. Infra-M, Moscow (in Russ.).
Dove, P.M., DeYoreo, J.J. and Weiner, S. (Eds) (2004) Biomineralization. MineralogicalSociety of America.
Ehrlich, P.A. and Raven, P.R. (1964) Butterflies and plants. Evolution 18(4), 586–608.Folk, R.L. (1992) Bacteria and nannobacteria revealed in hardgrounds, calcite cements,
native sulfur, sulfide materials, and travertines (abstract). Geol. Soc. Am. Annu. Prog.Abstr., p. 104.
Folk, R.L. (1993) SEM imaging of bacteria and nannobacteria in carbonate sediments androcks. J. Sediment. Petrol. 63, 990–999.
Folk, R.L. and Lynch, F.L. (1998) Carbonaceous objects resembling nannobacteria in theAllende meteorite. Proceedings of the International Symposium on Optical Science,Engineering, and Instrumentation (SPIE), vol. 3441, pp. 112–122.
Biomineralization and Evolution 217

Hoover, R.B., Rozanov, A.Yu., Jerman, G.A. and Coston, J. (2004) Microfossils in CI andCO carbonaceous meteorites. In: R.B. Hoover, G.V. Levin and A.Yu. Rozanov (Eds),Instruments, Methods and Missions for Astrobiology VII, Proc. SPIE, vol. 5163, 7–22.
Kajander, E. and Ciftcioglu, N. (1998) Nanobacteria: an alternative mechanism for patho-genic intra- and extracellular calcification and stone formation. Proc. Natl Acad. Sci. USA95(14), 8274–8279.
Kirkland, B.L., Lynch, F.L., Rahnis, M.A, Folk, R.L., Molineux, I.J. and McLean, R.J.C.(1999) Alternative origins for nannobacteria-like objects in calcite. Geology 27(4),347–350.
Knoll, A.H. (2004) Biomineralization and evolutionary history. In: P.M. Dove, J.J. DeYoreoand S. Weiner (Eds), Reviews in Mineralogy and Geochemistry, 54(1), 329–356.
Lowenstam, H.A. (1981) Minerals formed by organisms. Science 221, 1126–1131.Lowenstam, H.A. (1984) Processes and products of biomineralization. Evolution of
biomineralization. Reports of 27th International Geological Congress, Moscow, USSR,Paleontology Sect. C.02, vol. 2, 51–56 (in Russ.).
Lowenstam, H. and Weiner, S. (1989) On Biomineralization. Oxford University Press,Oxford.
Mann, S. (2001) Biomineralization. Oxford University Press, Oxford.McKay, D.S., Gibson, E.K., Jr, Thomas-Keprta, K.L., Vali, H., Romanek, C.S., Clemett, S.J.,
Chiller, X.D.,Maechling, C.R. and Zare, R.N. (1996) Search for past life onMars: possiblerelic of biogenic activity in Martian meteorite ALH84001. Science 273, 924–930.
Moissejev, N.N. (1997) Human and Biosphere. Jung Quardian, Moscow (in Russ.).Sarikaya, M. (1994) An introduction to biomimetics: a structural viewpoint. Microsc. Res.
Technol. 27, 360–375.Zhegallo, E.A., Rozanov, A.Yu., Ushatinskaya, G.T., et al. (2000) Atlas of Microorganisms
from Ancient Phosphorites of Khubsugul (Mongolia). NASA, Huntsville, AL, 167 pp.
218 I. S. Barskov
Visualization of the Silicon Biomineralization
in Cyanobacteria, Sponges and Diatoms
Ye. V. Likhoshway, E. G. Sorokovikova, O. I. Belykh, OL. V. Kaluzhnaya,
S. I. Belikov, Ye. D. Bedoshvili, OK. V. Kaluzhnaya, Ju. A. Masyukova, and
T. A. Sherbakova
Abstract Organisms of three kingdoms – cyanobacteria, sponges and diatoms –played a key role in the global cycle of silicon at certainmoments of formation ofthe biosphere. At present, only diatoms retain this leading position. Usingmicroscopy techniques, we studied mineralization of Si by these organisms.Analysis of silicateins-proteins, which take part in condensation of silica insponges – helped to establish phylogeny of sponges of Lake Baikal. The presenceof the gene of Silicic Acid Transport protein in chrysophycean algae suggeststhat this protein was ‘‘invented’’ long before diatoms appeared. Data onbiomineralization of Si, analysis of silicic acid transport and of silica-condensingproteins suggest that the biotic pathway of the global Si cycle appeared at anearly stage of the evolution and involved cyanobacteria, sponges and somealgae.
1 Introduction
Silicon is the second highest abundant element in the Earth’s crust. The cyclingof silica, along with geological processes, involves the work of live organisms(Ragueneau et al., 2000). Diatom algae which give a significant contribution tothe global primary production sink to the bottom of oceans, seas and fresh-water bodies forming siliceous sediments up to several kilometer thickness.Ancient fossil sponges formed large reefs (Conway et al., 2006). Cyanobacteriaare believed to have changed the Earth atmosphere to oxygenic at an early stageof the development of life, about 2 billion years BP (Rozanov, 2006; Sergeevet al., 2002). Cyanobacteria, sponges and diatoms belong to three differentkingdoms of living beings; their origin is separated by many hundred millionyears (Table 1).
Ye.V. LikhoshwayLimnological Institute of the Siberian Branch of the Russian Academy of Sciences, Irkutsk
N. Dobretsov et al. (eds.), Biosphere Origin and Evolution.� Springer 2008
219

Cyanobacteria from thermal springs, siliceous sponges and diatoms share acommon property of being able to process biomineralization of silica—uptakeof silicic acid and its reworking into sediments. The structures which they formare diverse, such as silicified trichomes, spicules and bivalve frustules. Visuali-zation of the processes ofmineralization of Si in different organisms bymethodsof light, scanning and transmission electron microscopies (LM, SEM andTEM) can disclose common features and help us to approach understandingof the mechanisms given below.
2 Silicification of Cyanobacteria
Cyanobacteria, among other environments (seas and fresh waters), inhabitthermal springs where they form bacterial mats. Siliceous deposits formed bycyanobacteria are found in tuffs of many thermal springs (Canet et al., 2005;Jones et al., 2005; Konhauser et al., 2001; Renaut et al., 2002).
Live cyanobacteria form siliceous deposits outside their cells, but doesnot involve the cytoplasm (Konhauser et al., 2001). Experiments have shownthat deposits of silica occur as amorphous sediments on the outer surfaces ofpolysaccharide sheaths sometimes built in part of nanospheres (Benning et al.,2004; Phoenix et al., 2000); due to silicification, the diameter of Calothrix sp.sheaths increased two to three times.
Our experiments on cultivation of cyanobacterial strains at a high con-centration of Si (20 mM) isolated from thermal springs of the Baikal riftzone have shown that already in 24 h the density of sheaths increased;layers of the sheaths become more distinct. There was no silica between thesheaths and the cell wall, as well as in the cytoplasm. There were noabnormalities (Fig. 1a–c). SEM revealed that mineralization of Si by cya-nobacteria occurs in three ways: thickening and increase of density ofsheaths (Fig. 1d and e); deposition of amorphous silica around the trichome
Table 1 Time of nascence on Earth of silicifying organisms
Organisms Time of appearance Reference
Cyanobacteria Silicified microfossils found in deposits of an agebeginning with 3.5 billion years BP
Gerasimenko andUshatinskaya(2002)
Sponges The most ancient siliceous sponge spicules werefound in sediments belonging to Late Pre-Cambrian (650–543 My BP)
Gehling and Rigby(1996)
Diatom algae The most ancient diatoms are no older than 240My according to molecular clock calculationsbased on sequences of four genes
Medlin andKaczmarska(2004, p. 245)
220 Ye. V. Likhoshway et al.

(Fig. 1f); and deposition as spheres of submicrometer sizes (Fig. 1g)
(Likhoshway et al., 2006a).It is possible that cyanobacteria have certain adaptations which help to
precipitate silica. The silicified cover can provide protection from UV light
(Phoenix et al., 2000), from heat and from excess of silicic acid and other
detrimental substances. On the other hand, precipitation of silicic acid and
accompanying salts favorably changes the environment for the benefit of
cyanobacteria themselves and of other organisms.The structure of the siliceous covers of cyanobacteria does not have
species-specific peculiarities, unlike that of siliceous structures of sponges
and diatoms which form species-specific siliceous parts of their exoskele-
tons—spicules and frustules. The latter are built within cells in specialized
a
c
f
d e
g
b
Fig. 1 Biosilicification of strainPseudanabaena sp. 0411, isolated fromKotelnikovsky spring.(a–c) TEM: (a) without Si, (b) cells on the sixth day of the experiment, (c) silica deposition onthe 24th day. (d) without Si; (e–g) different types of Si biomineralization, SEM: (e) sheathsilicification; (f) deposition of amorphous silica around the trichomes; (g) nanospheres(treatment with 30%H2O2). c cyanophycin granules, p phycobilisomes in the interthylakoidalspace, pg polyphosphate granules, s sheath, t thylakoid. Scale bars: a–c, g 1 mm; d–f 5 mm
Silicon Biomineralization in Cyanobacteria 221

subcellular particles, silica deposition vesicles (SDVs) encircled by special
membranes—silicalemmas (Drum and Pankratz, 1964; Reimann, 1964)—
under control of genomes. The first stages of the synthesis of spicules
also occur within SDVs of special cells, scleroblasts, but mature spicules
are formed extracellularly due to assistance of cells of other types (Uriz
et al., 2003).
3 Sponges
Sponges are the only extant multicellular organisms which build their skeletons
of silica. Spicules of sponge skeletons have a different form and architecture of
surface. In the middle of spicules, there are channels which have different forms
in different species (Uriz et al., 2000; Weaver and Morse, 2003). Spicules of a
sponge from the Lake Baikal Lubomirskia baicalensis (Color Plate 3, see p. 395)
contain a round axial channel (Color Plate 3c, see p. 395). Side branches of the
central channel determine the outer form of spicules (spines) (Belikov et al.,
2005; Kaluzhnaya et al., 2005a; Muller et al., 2006). The channel hosts an axial
filament which can be stained blue with Coumassee after dissolution of spicule
with ammonium fluoride (Color Plate 3d–f, see p. 395) (Kaluzhnaya et al.,
2005b; Muller et al., 2006).The central filaments of marine sponges contain special proteins, silicateins,
belonging to the class of cysteine proteinases cathepsins-L. Electrophoresis in a
gradient of polyacrylamide (4–20%) revealed three fractions having molecular
masses about 30 kDa which were named silicateins-a, -b and -� (Shimizu et al.,
1998). A broader diversity of proteins was found in spicules of the freshwater
Fig. 2 SDS-PAGE ofL. baicalensis spicule pro-teins. An arrow shows bandscorresponding to silicateinsby molecular weights(M molecular weightmarker)
222 Ye. V. Likhoshway et al.

sponge L. baicalensis: along with proteins of the size of silicateins, two more
proteins of masses 45 and 62 kDa were found (Kaluzhnaya et al., 2007) (Fig. 2).We were the first who determined nucleotide sequences of silicatein gene for
Baikal species (Kaluzhnaya et al., 2005b) and demonstrated the multiplicity of
silicateins in freshwater sponges sequencing four silicatein cDNAs. Compar-
ison of silicatein sequences for freshwater L. baicalensis, Ephydatia fluviatilis
and marine species shows the significant variation at the N-terminus, which are
cleaved during sequence maturation. Mature proteins are considerably similar
and also conserved at active center sites (Fig. 3).
Fig. 3 Comparison of silicatein amino acid sequences for freshwater and marine sponges.Conserved amino acids are in gray; sites conserved among freshwater sponges sequences are inblack. The amino acid residues involved in the silicatein active center are boxed above sequences.Denotation of species names: L. baicalensis a1-L.baic–a4-L.baic; freshwater E. fluviatilisE.fluviat; marine species Thetya aurantia and Suberites domuncula a-T.aur and a-S.dom,respectively
Silicon Biomineralization in Cyanobacteria 223
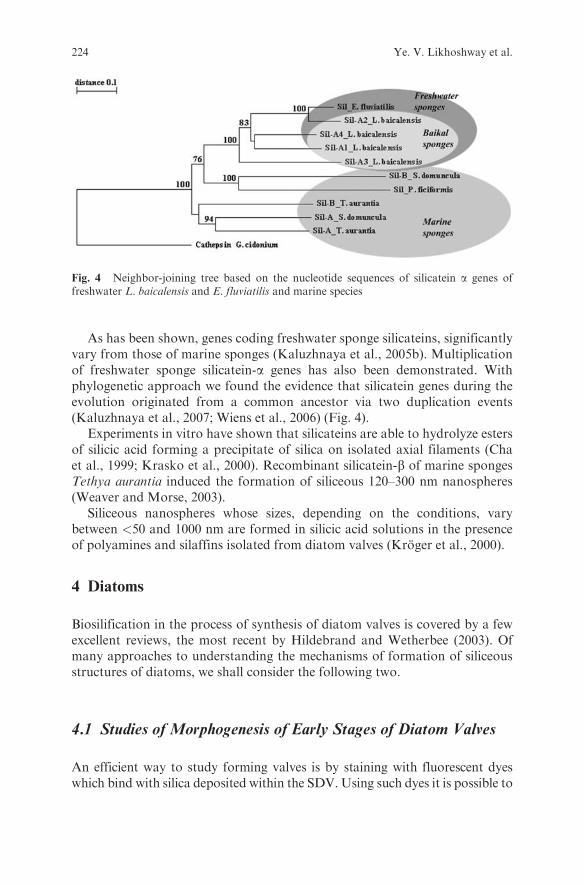
As has been shown, genes coding freshwater sponge silicateins, significantlyvary from those of marine sponges (Kaluzhnaya et al., 2005b). Multiplicationof freshwater sponge silicatein-a genes has also been demonstrated. Withphylogenetic approach we found the evidence that silicatein genes during theevolution originated from a common ancestor via two duplication events(Kaluzhnaya et al., 2007; Wiens et al., 2006) (Fig. 4).
Experiments in vitro have shown that silicateins are able to hydrolyze estersof silicic acid forming a precipitate of silica on isolated axial filaments (Chaet al., 1999; Krasko et al., 2000). Recombinant silicatein-b of marine spongesTethya aurantia induced the formation of siliceous 120–300 nm nanospheres(Weaver and Morse, 2003).
Siliceous nanospheres whose sizes, depending on the conditions, varybetween <50 and 1000 nm are formed in silicic acid solutions in the presenceof polyamines and silaffins isolated from diatom valves (Kroger et al., 2000).
4 Diatoms
Biosilification in the process of synthesis of diatom valves is covered by a fewexcellent reviews, the most recent by Hildebrand and Wetherbee (2003). Ofmany approaches to understanding the mechanisms of formation of siliceousstructures of diatoms, we shall consider the following two.
4.1 Studies of Morphogenesis of Early Stages of Diatom Valves
An efficient way to study forming valves is by staining with fluorescent dyeswhich bind with silica deposited within the SDV. Using such dyes it is possible to
Fig. 4 Neighbor-joining tree based on the nucleotide sequences of silicatein a genes offreshwater L. baicalensis and E. fluviatilis and marine species
224 Ye. V. Likhoshway et al.

observe optically the formation of valves of diverse diatoms, including tiny valves(2–3 mm, Synedra acus) (Color Plate 5a–f, see p. 397). Staining with Rhodamine123 (R 123) allowed to study the development of valves and girdle bands of acentric diatomDitylum brightwellii and to see daughter valves while they are stillwithin the mother cell (Li et al., 1989). R 123 was also used to study thedeposition of silica during the cell cycle of a centric marine diatom Thalassiosiraweissflogii with flow cytometry (Brzesinski and Conley, 1994). By measuring thedecrease of silicic acid concentration in the growthmedium and the accumulationofR 123 in cells during a few cell division cycles, it was found that the dye appliedat a concentration of 2 mg/L does not affect the growth, and that 1 molecule ofR 123 is absorbed per 17 million molecules of SiO2.
Shimizu et al. (2001) recommended to use another fluorescent PDMPOwhich produces a more intense fluorescence compared to R 123 and allows tostudy the development of valves in more detail. Using PDMPO Hazelaar et al.(2005) visualized the very earliest stages of morphogenesis of a marine pennatediatomNavicula salinarum. It was found that at the initial stage the valve growsin two dimensions and grows very fast—less than 15 min. Subsequent growth inthird dimension takes a much longer time, a significant part of the time of valvesynthesis which equals 240 min.
Study by means of SEM (some examples in Color Plate 5g and h, see p. 397)and TEM (some examples in Color Plate 5i–k, see p. 397) of valves after decom-position of organic matter with acid revealed stages of morphogenesis in diatomsof all known classes: for review see Pickett-Heaps et al. (1990) and Hildebrandand Wetherbee (2003). These studies determined stages of morphogenesis of allsiliceous structures which are important for the identification of species andserved as a basis for the proposed scheme of their evolution (Cox, 1999; Coxand Kennaway, 2004; Round et al., 1990).
TEM of cross-sections reveals electron-dense matter within SDVs of valvesand SDVs of girdle bands (Color Plate 5l–n, see p. 397). TEM is used to studythe role of different subcellular particles in synthesis of diatom cell walls formore than 40 years (Drum and Pankratz, 1964; Pickett-Heaps et al., 1990;Reiman, 1964; Schmid and Schultz, 1979), but its key issues have not beenunderstood yet and remain topics for continuous discussions (Hildebrand andWetherbee, 2003).
4.2 Discovery of Silicic Acid Transporters
Long-term studies of processes of silicification and morphogenesis in diatomsperformed in the laboratory of B.E. Volcani (University of California, SanDiego) have finally led to the discovery of a gene of a silicic acid transporterprotein (SIT) in a marine diatom Cylindrotheca fusiformis (Hildebrand et al.,1997). A homologous gene was subsequently found in a freshwater diatomS. acus (Grachev et al., 2002). Up to date, complete and partial sequences of
Silicon Biomineralization in Cyanobacteria 225

sit genes are published for more than 100 diatom species of all known classes
(Sherbakova et al., 2005; Thamatrakoln and Hildebrand, 2005; Thamatrakoln
et al., 2006; Alverson et al., 2007 and our unpubl. data). Analysis of the
sequences revealed that SITs diverge rather fast. During million years of evolu-
tion, a few motifs have remained intact (Fig. 6); in spite of numerous substitu-
tions the physicochemical properties of these membrane proteins have kept that
is confirmed by significant similarity of hydropathy profiles (Sherbakova et al.,
2005; Likhoshway et al., 2006b). All the SIT sequences are predicted to contain
sites of post-translational modification, i.e., glycosilation, myristylation, phos-
phorylation. A motif YxxØ, a potential target of clathrin adaptors, is also
present (Sherbakova et al., 2005). Examination of deciphered SIT sequences
of an araphid freshwater diatom S. acus and a raphid marine species
Fig. 6 Fragments of predicted SIT sequences of chrysophyte algae and diatoms. Identicalamino acid residues are printed on black background. Names of chrysophytes are in bold
226 Ye. V. Likhoshway et al.

Chaetoceros muelleri allowed to propose a mechanism of interaction of SIT
proteins with silicic acid (Grachev et al., 2002). According to this hypothesis,
silicic acid is coordinated via a zinc ion with a motif CML(I)D (Grachev et al.,
2005; Sherbakova et al., 2005). Another model assumes that conservative
repeats GXQ join silicic acid by means of hydrogen bonds, inducing changes
in the protein conformation which helps silicic acid to move inside the cell
(Thamatrakoln et al., 2006).The origin of diatoms and their ability to use silica for cell walls construction
have been discussed in many publications (for review see Sims et al., 2006).
Modern phylogeny based on sequences of the nuclear gene of 18S rRNA places
diatoms close to Bolidophyceae, planktonic algae without any signs of silicifi-
cation (Guillou et al., 1999; Medlin and Kaczmarska, 2004). Nikolaev et al.
(2001) based on paleontological data believe that a precursor of diatoms might
have been silicified bivalved spores of Xanthophyta. According to other
hypothesis, diatoms arose from a scaled ancestor (Round and Crawford,
1981, 1984) or from a cyst-like form similar to the extant Parmales in the
chrysophyte algae (Mann and Marchant, 1989).Vegetative cells of some chrysophyte algae are covered by scales, and at
certain stages of their development form siliceous spherical cysts, or stomato-
cysts. Both for chrysophyte algae and diatoms silicon is an obligatory element
of their metabolism. In accord with this dependence, chrysophyte species
Ochromonas ovalis and Synura petersenii contain sit genes (Likhoshway et al.,
2006b). SIT proteins of diatoms and chrysophytes have evident features of
homology, the differences between them are similar to those between SITs
of diatoms belonging to evolutionary distant classes. Figure 5 shows that all
SITs have identical amino acid residues separated by non-identical sites.
Discovery of sit genes in distant relatives of diatoms—chrysophyte algae—
suggests that these genes are ancient (Likhoshway et al., 2006b) because scales
of chrysophytes were found in deposits of the Late Precambrian (Blackwell and
Powell, 2000; Knoll, 1992). If the identification of scales is correct, SIT was
invented much earlier than the first diatoms appeared. Nevertheless, no sit
genes have been found in sponges so far. Hence, the question put by Franz
Brummer (2003, p. 8): ‘‘And what about a silicon transporter in sponges?’’ still
remains an open one. However, it is noteworthy that siliceous sponges also
appeared in the Late Precambrian (Table 1)—the time of expansion of aerobic
eukaryotes into the ocean.According to one of the most recent hypotheses, life in the hot, salty and
silica-saturated ocean was limited to bacteria, including cyanobacteria. Global
glaciations cooled the water and increased the concentration of dissolved
oxygen making the ocean more favorable for diverse aerobic eukaryotic organ-
isms (Knauth, 2005). Appearance of silicon-reworking molecular machinery
was timely because it gave a possibility to use a ‘‘cheap’’ raw material for the
construction of functional inorganic exoskeletons, a matter of subsequent
improvement in the course of evolution.
Silicon Biomineralization in Cyanobacteria 227

Acknowledgment The present study was supported by the Program of the Presidium of RAS‘‘Origin and evolution of the biosphere’’ N 18.4.
References
Alverson A.J., Jansen R.K., Theriot E.C. (2007) Bridging the Rubicon: Phylogenetic analysisreveals repeated colonizations of marine and fresh waters by thalassiosiroid diatoms.Molecular Phylogenetics and Evolution 4(1), 193–210.
Belikov, S.I., Kaluzhnaya, O.V., Schroder, H.C., Krasko, A., Muller, I.M. andMuller, W.E.G. (2005) Expression of silicatein in spicules from the Baikalian spongeLubomirskia baicalensis. Cell Biol. Int. 29, 943–951.
Benning, L.G., Phoenix, V.R., Yee, N. and Konhauser, K.O. (2004) The dynamics ofcyanobacterial silicification: an infrared micro-spectroscopic investigation. Geochim.Cosmochim. Acta 68, 743–757.
Blackwell, W.H. and Powell, M.J. (2000) A review of group filiation of the strameopiles,additional approaches to the question. Evol. Theory 12, 49–88.
Brummer, F. (2003) Living inside a glass box—silica in diatoms. In: W.E.G. Muller (Ed.),Silicon Biomineralization. Springer, Berlin, pp. 3–10.
Brzesinski, M.A. and Conley, D.J. (1994) Silicon deposition during the cell cycle of T.weissflogii using dual Rhodamine 123 and propidium iodide staining. J. Phycol. 30, 45–55.
Canet, C., Prol-Ledesma, R.M., Torres-Alvarado, I., Gilg, H.A., Villanueva, R.E. andLozano-Santa Cruz, R. (2005) Silica-carbonate stromatolites related to coastal hydro-thermal venting in Bahia Concepcion, Baja California Sur, Mexico. Sediment. Geol. 174,97–113.
Cha, J.N., Shimizu, K., Zhou, Y., Christianssen, S.C., Chmelka, B.F., Stucky, G.D. andMorse, D.E. (1999) Silicatein filaments and subunits from a marine sponge direct thepolymerization of silica and silicones in vitro. Proc. Natl Acad. Sci. USA 96, 361–365.
Conway, K.W., Krautter, M., Barrie, J.V., Whitney, F., Thomson, R.E., Reiswig, H.,Lehnert, H., Mungov, G. and Bertram, M. (2006) Sponge reefs in the Queen CharlotteBasin, Canada: controls on distribution, growth and development. In: A. Freiwald andJ.M. Roberts (Eds), Cold-Water Corals and Ecosystems. Springer, Berlin, pp. 605–621.
Cox, E.J. (1999) Variation in patterns of valve morphogenesis between representatives of sixbiraphid diatom genera. J. Phycol. 35, 1297–1312.
Cox, E.J. and Kennaway, G.M. (2004) Studies of valve morphogenesis in pennate diatoms:investigating aspects of cell biology in a systematic context. In: M. Poulin (Ed.),Proceedings of the 17th International Diatom symposium. Biopress Ltd, Bristol,pp. 35–48.
Drum, R.W. and Pankratz, H.S. (1964) Post mitotic fine structure of Gomphonema parvulum.J. Ultrastruct. Res. 10, 217–223.
Gehling, J.G. and Rigby, J.K. (1996) Long expected sponges from the NeoproterozoicEdiacara fauna of South Australia. J. Paleontol. 70(2), 185–195.
Gerasimenko, L.M. and Ushatinskaya, G.T. (2002) Cyanobacteria, cyanobacteria/bacteriaassociations, mats, biofilms. In: A.Yu. Rozanov (Ed.), Bacterial Paleontology. Paleonto-logical Institute RAS, Moscow, pp. 36–46.
Grachev, M.A., Denikina, N.N., Belikov, S.I., Likhoshwai, E.V. (Likhoshway, Ye.V.),Usoltseva, M.V., Tikhonova, I.V., Adelshin, R.V., Kler, S.A. and Shcherbakova(Sherbakova), T.A. (2002) Elements of the active center of silicon transporters in diatoms.Mol. Biol. 36, 535–536.
Grachev, M., Sherbakova, T., Masyukova, Yu. and Likhoshway, Ye. (2005) A potentialZink-binding motif in silicic acid transport proteins of diatoms. Diatom Res. 20(2),409–441.
228 Ye. V. Likhoshway et al.

Guillou, L., Chretiennot-Dinet, M.-J., Medlin, L.K., Claustre, H., Loiseaux-de Goer, S. andVaulot, D. (1999) Bolidomonas: a new genus with two species belonging to a new algalclass, the Bolidophyceae (Heterokonta). J. Phycol. 35, 368–381.
Hazelaar, S., Strate, H.J., Gieskes, W.C. and Vrieling, E.G. (2005) Monitoring rapid valveformation in the pennate diatom Navicula salinarum (Bacillariophyceae). J. Phycol. 41,354–358.
Hildebrand, M. and Wetherbee, R. (2003) Components and control of silicification inDiatoms. In: W.E.G. Muller (Ed.), Silicon Biomineralization. Springer, Berlin, pp. 11–58.
Hildebrand, M., Volcani, B.E., Gassmann, W. and Schroder, J.I. (1997) A gene family ofsilicon transporters. Nature 385, 688–689.
Jones, B., Renaut, R.W. and Konhauser, K.O. (2005) Genesis of large siliceous stromatolitesat Frying Pan Lake, Waimangu geothermal field, North Island, New Zealand.Sedimentology 52, 1229–1252.
Kaluzhnaya, O.V., Belikov, S.I., Schroder, H.C., Rothenberger,M., Zapf, S., Kaandorp, J.A.,Borejko, A., Muller, I.M. and Muller, W.E.G. (2005a) Dynamics of skeleton formation inthe Lake Baikal spongeLubomirskia baicalensis. Part I. Biological and biochemical studies.Naturwissenschaften 92, 128–133.
Kaluzhnaya, O.V., Belikov, S. I., Schroder, H.C., Wiens, M., Giovine, M., Krasko, A.,Muller, I.M. and Muller, W.E.G. (2005b) Dynamics of skeleton formation in the LakeBaikal sponge Lubomirskia baicalensis. Part II. Molecular biological studies. Naturwis-senschaften 92, 134–138.
Kaluzhnaya, O.V., Belikova, A.S., Podolskaya, E.P., Krasko, A., Muller, W.E.G. andBelikov, S.I. (2007) Silicatein identification of the freshwater sponge Lubomirskiabaicalensis. Mol. Biol. 4,554–561.
Knauth, L.P. (2005) Temperature and salinity history of the Precambrian ocean: implicationfor the course of microbial evolution. Palaeogeogr. Palaeoclimatol. Palaeoecol. 219, 53–69.
Knoll, A.H. (1992) The early evolution of eukaryotes: a geological perspective. Science 256,622–627.
Konhauser, K.O., Phoenix, V.R., Bottrell, S.H., Adams, D.G. and Head, I.M. (2001)Microbial–silica interactions in Icelandic hot spring sinter: possible analogues for somePrecambrian siliceous stromatolites. Sedimentology 48, 415–433.
Krasko, A., Batel, R., Schroder, H.C., Muller, I.M. andMuller, W.E.G. (2000) Expression ofsilicatein and collagen genes in the marine sponge Suberites domuncula is controlled bysilicate and myotrophin. Eur. J. Biochem. 267, 4878–4887.
Kroger, N., Deutzmann, R., Bergsdorf, C. and Sumper, M. (2000) Species-specific polya-mines from diatoms control silica morphology. Proc. Natl Acad. Sci. USA 97,14133–14138.
Li, C.-W., Chu, S. and Lee, M. (1989) Characterizing the silica deposition vesicle of diatoms.Protoplasma 151, 158–163.
Likhoshway,Ye.V., Sorokovikova, E.G., Belkova,N.L., Belykh,O.I., Titov,A.T., Sakirko,M.V.and Parfenova, V.V. (2006a) Silicon mineralization in the culture of cyanobacteria from hotsprings. Dokl. Biol. Sci. 407, 201–205.
Likhoshway, Ye.V., Masyukova, Yu.A., Sherbakova, T.A., Petrova, D.P. andGrachev, M.A. (2006b) Detection of the gene responsible for silicic acid transport inChrysophycean algae. Dokl. Biol. Sci. 408, 256–260.
Mann, D.G. and Marchant, H.J. (1989) The origins of the diatom and its life cycle In: J.C.Green, B.S.C. Leadbeater and W.L. Diver (Eds) The Chromophyte Algae: Problems andPerspectives. Clarendon Press, Oxford, pp. 307–323.
Medlin, L.K. and Kaczmarska, I. (2004) Evolution of the diatoms: V. Morphological andcytological support for the major clades and a taxonomic revision. Phycologia 43, 1–29.
Muller,W.E.G., Kaluzhnaya, O.V., Belikov, S.I., Rothenberger,M., Schroder, H.C., Reiber, A.,Kaandorp, J.A.,Manz, B.,Mietchen,D. andVolke, F. (2006)Magnetic resonance imaging ofthe siliceous skeleton of the demosponge Lubomirskia baicalensis. J. Struct. Biol. 153, 31–41.
Silicon Biomineralization in Cyanobacteria 229
Nikolaev, V.A., Harwood, D.M. and Samsonov, N.I. (2001) Early Cretaceons Diatoms.Nauka, St Petersburg.
Phoenix, V.R., Konhauser, K.O. and Adams, D.G. (2000) Cyanobacterial viability duringhydrothermal biomineralization. Chem. Geol. 169, 329–338.
Pickett-Heaps, J.D., Schmid, A.-M.M. and Edgar, L. (1990) The cell biology of diatom wallmorphogenesis. In: F.E. Round and D.J. Chapman (Eds.) Progress in PhycologicalResearch. Biopress, Bristol, pp. 2–168.
Ragueneau, O., Treguer, P., Leynaert, A., Anderson, R.F., Brzezinski,M.A., DeMaster, D.J.,Dugdale, R.C., Dymond, J., Fischer, G., Francois, R., Heinze, C., Maier-Reimer, E.,Martin-Jezequel, V., Nelson, D.M. and Queguiner, B. (2000) A review of the Si cycle in themodern ocean: recent progress and missing gaps in the application of biogenic opal as apaleoproductivity proxy. Global Planet. Change 26, 317–365.
Reimann, B.E.F. (1964) Deposition of silica inside a diatom cell. Exp. Cell. Res. 34, 605–608.Renaut, R.W., Jones, B., Tiercelin, J.J. and Tarits, C. (2002) Sublacustrine precipitation of
hydrothermal silica in rift lakes: evidence from Lake Baringo, central Kenya Rift Valley.Sediment. Geol. 148, 235–257.
Round, F.E. and Crawford, R.M. (1981) The lines of evolution of Bacillariophyta. I. Origin.Proc. R. Soc. Lond. B 211, 237–260.
Round, F.E. and Crawford, R.M. (1984) The lines of evolution of Bacillariophyta. II. Origin.Proc. R. Soc. Lond. B 221, 169–188.
Round, F.E., Crawford, R.M. andMannD.G. (1990) TheDiatoms Biology andMorphologyof the Genera. Cambridge University Press, Cambridge.
Rozanov, A.Yu. (2006) Precambrian geobiology. Paleontol. J. 40(4), 434–443.Schmid, A.-M.M. and Schulz, D. (1979) Wall morphogenesis in diatoms: depositions of silica
by cytoplasmic vesicles. Protoplasma 100, 268–288.Sergeev, V.N., Gerasimenko, L.M. and Zavarzin, G.A. (2002) The proterozoic history and
present state of cyanobacteria. Microbiology 71, 623–637.Sherbakova, T.A, Masyukova, Yu.A., Safonova, T.A., Petrova, D.P., Vereshagin, A.L.,
Minaeva, T.V., Adelshin, R.A., Triboy, T.I., Stonik, I.I., Aizdaitcher, N.A., Kozlov, M.V.,Likhoshway, E.(Ye.)V. and Grachev, M.A. (2005) Conservative motif CMLD in silicic acidtransport proteins of diatom algae. Mol. Biol. 39, 269–280.
Shimizu, K., Cha, J, Stucky, G.D. and Morse, D.E. (1998) Silicatein alpha: cathepsin L-likeprotein in sponge biosilica. Proc. Natl Acad. Sci. USA 95, 6234–6238.
Shimizu, K., Del Amo, Y., Brzezinski, M.A., Stucky, G.D. and Morse, D.E. (2001) A novelsilica tracer for biological silification studies. Chem. Biol. 8, 1051–1060.
Sims, P.A., Mann, D.G. and Medlin L.K. (2006) Evolution of the diatoms: insights fromfossil, biological and molecular data. Phycologia 45(4), 361–402.
Thamatrakoln, K. and Hildebrand, M. (2005) Approaches for functional characterization ofdiatom silicic acid transporters. J. Nanosci. Nanotechnol. 5, 1–9.
Thamatrakoln, K., Alverson, A.J. and Hildebrand, M. (2006). Comparative sequenceanalysis of diatom silicon transporters: toward a mechanistic model of silicon transport.J. Phycol. 42, 822–834.
Uriz, M.J., Turon, X. and Becerro, M.A. (2000) Silica deposition in Demospongiae: spiculo-genesis in Crambe crambe. Cell. Tissue Res. 301, 299–309.
Uriz, M.J., Turon, X., Becerro, M.A. and Agell, G. (2003) Siliceous spicules and skeletonframeworks in sponges: origin, diversity, ultrastructural patterns, and biologicalfunctions. Microsc. Res. Technol. 62, 279–299.
Weaver, J.C. and Morse, D.E. (2003) Molecular biology of Demosponge axial filaments andtheir roles in biosilicification. Microsc. Res. Technol. 62, 356–367.
Wiens, M., Belikov, S.I., Kaluzhnaya, O.V., Krasko, A., Schroder H.C., Perovic-Ottstadt, S.and Muller, W.E.G. (2006) Molecular control of serial module formation along theapical–basal axis in the spongeLubomirskia baicalensis: silicateins, mannose-binding lectinand mago nashi. Dev. Genes Evol. 216(5), 229–242.
230 Ye. V. Likhoshway et al.
Transformational Changes in Argillaceous
Minerals due to Cyanobacteria
T. V. Alekseeva, L. M. Gerasimenko, E. V. Sapova, and A. O. Alekseev
Abstract The aim of the study was to investigate the transformations ofbentonite, illite, kaolin and smectite–zeolite clay at the laboratory experimentsunder the growth and fossilization of alkaline cyanobacteria Microcoleus
Chthonoplastes. Cyanobacteria influenced the chemical properties of studiedclays. It had no visible influence on the mineralogy of bentonite and kaolin.Whereas the development of more smectitic layers within the illite matrices incase of illite clay and defect ‘‘island’’ layer in the interlayer space of montmor-
illonite in smectite–zeolite clay were found. Cyanobacteria affected theproperties of iron compounds, which are present in all studied clays asimpurities. Both dissolution and precipitation processes of iron compoundswere observed. In the experiments with smectite–zeolite and kaolin an increase
in magnetic susceptibility and magnetization values connected with the preci-pitation of Fe in the form of metastable ferrihydrite followed by the formationof goethite were found. This process correlated with the mineralization oforganic matter, which plays the role of inhibitor and prevents goethite crystal-
lization during the growth of cyanobacteria. In the case of bentonite a decreasein both magnetic susceptibility and magnetization values connected with oxida-tion of Fe2þ in the magnetite (maghemite) structure and precipitation ofgoethite took place. Ferrihydrite is a key mineral in the biogenic cycle of Fe.
1 Introduction
Cyanobacteria or blue–green algae are oxygenic photoautotrophic organisms.
Silicified microfossils of cyanobacteria (stromatolites) are found in depositsfrom 1.9–2.0 billion years ago. At present they create relict communities inextreme ecological conditions—regions with hydrothermal activity, hyper
T. V. AlekseevaInstitute Physical, Chemical and Biological Problems of Soil Science RAS, Pushchinoe-mail: [email protected]
N. Dobretsov et al. (eds.), Biosphere Origin and Evolution.� Springer 2008
231

saline reservoirs and alkaline lakes (Dubinin et al., 1992; Gerasimenko et al.,1996; Phoenix et al., 2000; Schultze-Lam et al., 1995; Tazaki, 1998; Tazaki et al.,2003; Zavarzin, 1993). Besides organic matter, bacterial mats contain mineralcomponents—carbonate, silica, Fe and Mn oxides /hydroxides, clay minerals,phosphates, sulfides of biogenic origin (Tazaki, 1998; Zavarzin, 1993).Biomineralization is a widespread phenomenon which occurs in different geo-chemical environments in the presence of liquid. In the most cited paper onbiominerals, Lowenstam (1981) has shown that 31 biominerals have been foundand more than 30% are formed with the participation of microorganisms. Themost frequent biominerals are carbonate, opal and Fe oxides/hydroxides(ferrihydrite and magnetite).
Recent findings show that microorganisms also participate in the synthesis oflayer silicates—smectite–celadonite (Geptner et al., 1997), glauconite–nontronite(Geptner and Ivanovskaya, 1998; Ueshima and Tazaki, 2001), imogolite–allo-phane–chamosite (Kawano and Tomita, 2002), saponite (Geptner et al., 2002).Based on electron microscopy observations of fresh water microorganismcommunities, Konhauser and Urrutia (1999) concluded that these communitiesare mineralized and are associated with amorphous (Fe, Al)-silicates with acomposition close to chamosite/bertherine. These authors concluded that thisphenomenon has global distribution.
Mineralization processes in the presence of cyanobacteria are extensivelystudied for hot spring communities (Likhoshway et al. 2006; Phoenix et al.,2000), but there are few publications on mineralization in the presence ofalkaline species (Ushatinskaya et al., 2006).
The aim of the study was to investigate the possible transformations ofkaolinite, smectite–zeolite clay, illite and bentonite SWy-2 in laboratory experi-ments under the growth and fossilization of alkaline cyanobacteriaMicrocoleusChthonoplastes.
2 Experimental
2.1 Objectives
In our experiments we used a culture of alcalophilic filamentous cyanobacteriaMicrocoleus chthonoplastes, a unique member of laminated benthic community,isolated from soda lake Khilganta (Buryatiya, Russia).
The stimulating growing of cells was done using ‘‘S’’ medium (g/l): KCl 1.0;K2SO4 1.0; NaHCO3 16.8; K2HPO4 0.5; NaNO3 2.5; NaCl 30.0; MgSO4.7H2O)0.2; CaCl2 0.04; FeSO4 0.01; A5 1ml (Gerasimenko et al., 1996). pH of themedium was 8.5. The culture was grown autotrophically under continuous illu-mination (white fluorescent light) at approximately 3000 lx (10,000E S m–2 s–1)and 288C with CO2 provided by bubbling air. After 4 days stimulating growth4 ml of suspension containing Microcoleus chthonoplastes was added to bottles
232 T. V. Alekseeva et al.

contained: clay 0.5 g, NaCl 2.0 g,NaHCO3 1.2 g and sterile distilled water 100ml.
Cyanobacteria were incubated for 7, 14, 28 and 60 days at 288C in the light.
Control bottles without cyanobacteria were incubated under the same conditions.
All experiments have been done in duplicate. It is well known that the intensity of
weathering and their trends are determined by the mineral’s structure and
composition. We studied the influence of Microcoleus chthonoplastes on the
properties of different clays: 1:1 (kaolinite), 2:1 non-swelling (illite), 2:1 swelling
(bentonite) and zeolite. The information about clays and some of their properties
are given in Table 1.
2.2 Methods
The content of chlorophyll a was detected by spectrophotometric analysis at
665 nm wavelength after extraction in ethanol (Gerasimenko et al., 1989). The
velocity of oxygen flow was determined by polyarographic method using a
Clark electrode and 1 mm cell (Trebst, 1980) Organic matter content in clays
before and after incubation with cyanobacteria was measured by the dichro-
mate method. Exchangeable base cations were extracted with 1.0 mol L–1
ammonium acetate and Ca2þ and Mg2þ in solution were determined by atom
absorption spectroscopy (AAS) and Naþ and Kþ by flame photometry.
Element concentrations in solids were determined with a ‘‘SPECTROSCAN
MAKC-GV’’ XRF crystal diffraction scanning spectrometer. Mineralogical
composition of clays was analyzed by X-ray diffraction (XRD, CuKaradiation). Oriented specimens were prepared by sedimentation on glass-slides
and step-scanned in steps 0.1 82� and 10 s/step counting time. Mg- and
Table 1
Content (%)
CEC,Cmol/kg
�(10�8m3
kg�1)Sample Mineralogy Fe2O3 K2OOC(%)
Kaolin(Vimianzo,Spain)
Kaolinite, muscovite,quartz
0.69 0.92 2.25 0.9 0.24
Smectite–zeolite
(Russia)
Montmorillonite,
clinoptilolite,quartz, muscovite,calcite
1.53 1.40 34.6 2.73 0.04
Illite
(Hungary)
Illite, quartz,microcline
0.60 6.20 12.84 0 0.15
BentoniteSWy-2
Montmorillonite,quartz, feldspars,calcite
3.10 0.50 94.53 10.47 0.86
Changes in Argillaceous Minerals due to Cyanobacteria 233

K-saturated clays were examined at room temperature, after ethylene glycolsaturation and after heating to 3008C and 5508C.
The magnetic characteristics of sediments reflect the amount and quality offerruginous minerals they contain and are connected with their content,mineralogy and the grain size. To investigate the influence of cyanobacteriaon the properties of iron compounds present in all studied clays as impurities,solids were investigated by a complex of magnetic measurements, including:low- and high-frequency magnetic susceptibility (MS), anhysteretic remanence(ARM) and incremental acquisition of magnetic remanence (IRM) and demag-netization, and a high-field IRM (HIRM). These magnetic techniques arenon-destructive and sensitive to trace amounts of magnetic minerals (Maherand Thompson, 1999; Thompson and Oldfield, 1986). Magnetic susceptibility(�) reflects the total concentration of ferrimagnetic or total concentration ofparamagnetic minerals and antiferromagnetic with low content of ferromag-netics. IRMs were imparted in pulsed fields of 10, 20, 50, 100 and 300 mT(Molspin pulse magnetizer) and a dc field of 1000 mT (Newport 4’’ Electro-magnet). All magnetic remanences were measured using a fluxgatemagnetometer (Molspin Ltd, sensitivity �10–7 A m2) and JR-6 magnetometer(AGICOLtd). As the majority of ferrimagnetic is fully saturated in fields of 100mT, IRM100 mT/SIRM allows evaluating the content of ferrimagnets(magnetite, maghaemite). In our experiment a remanence acquired in a fieldof 1T is referred to as SIRM (SIRM= IRM1000 mT). HIRM = SIRM-IRM300 mT can be used to approximate the total concentration of high coerci-tivity minerals (haematite þ goethite). Magnetic hysteresis was measured usingvibrating sample magnetometer (VSM Molspin Ltd) in the magnetic fieldbetween þ1 and –1 Tesla.
Concentrations of Fe, Si and Al in solutions were measured by AAS and Kby flame photometry. For the observation of dynamics of Microcoleus growthin the presence of clays, SEM-EDAX (CamScan with Link-860) was used.
3 Results and Discussion
3.1 Biological Activity of Cyanobacteria in the Presence of Clays
SEM micrographs show that the behavior of cyanobacteria in the presence ofstudied clays is similar: on 7–14th days the trichomes are well developed; on28th day the formation of glycocalyx in a form of extracellular polysaccharidesheath was found. On 60th day trichomes become lithified and hardlyrecognized on the surface of clays (not shown).
The pH values for all experiments were 9.2–9.5 and similar for the systemswith cyanobacteria and controls. Figure 1 shows the dynamics of chlorophyll aconcentration and the oxygen flow for Microcoleus chthonoplastes in thepresence of clays. The peaks of both parameters are observed for the first 7
234 T. V. Alekseeva et al.

days of the experiments. Afterwards a gradual decrease in the biological activitytakes place. The largest chlorophyll concentration is observed for the experi-ments with bentonite and kaolin and the smallest—with illite.
Parent clays have different concentrations of organic C (Table 1). For theexperiments with illite and smectite–zeolite clay, 14 days of incubation withcyanobacteria lead to the accumulation of OC in spite of the decline of biolo-gical activity. For the experiment with kaolin an increase in the OC content
Fig. 1 Biological activity of Microcoleus chthonoplastes: (a) dynamics of chlorophyll �aconcentration (mg/ml) and oxygene (mmol/ml^h); (b) dynamics of organic carbon content
Changes in Argillaceous Minerals due to Cyanobacteria 235

took place till 28th day, after which the destruction of OC prevailed. Forbentonite 2 steps were observed with a decline of the OC content after 14 daysfollowed by an increase on 28th day.
The intermediate decline is most probably connected with the destruction ofOC presented in the parent bentonite. The obtained results allow the period ofculture growth (7–14 days) and destruction of organic substances (after 14–28days) to be distinguished.
3.2 Changes in Argillaceous Minerals After Incubationwith Cyanobacteria
Both the content of dissolved Si, Al, Fe and K and the composition of solidsafter incubation withMicrocoleus show that kaolin and bentonite clays have thegreatest stability, for which no visible changes have been observed but only theformation of Mg-calcite in the presence of kaolin after 28 days of incubation(not shown).
The main component of the illite clay (Fuz_erradvany, Hungary) is anirregularly interstratified illite—smectite mineral which contains 17–26% ofswelling smectite layers. Incubation of cyanobacteria with illite resulted in adepletion of Kþ and the development of more smectitic layers within the illitematrices which is observed after 7 and 14 days (Fig. 2). This conclusion is basedupon the appearance of a new peak at 17.3 A after ethylene glycol treatment ofthe specimen. K-saturation resulted in the collapse of newly formed smectitephase.
Formation of traces of defect ‘‘island’’ layer in the interlayer space ofmontmorillonite from smectite–zeolite clay was observed after 28 days ofincubation where the collapse of smectite structure on heating is not complete(Fig. 3b and c). The latter most probably connected with the exchange of Kþ forAl (or other)—hydroxyls or their complexes with organic anions. Ransom et al.(1999) showed that in biological systems swelling smectite type minerals playthe role of ‘‘catch pit’’ where the accumulation of ammonia and other productsof metabolism could occur. The described transformations are accompanied bythe increase in concentrations of dissolved cations in supernatants afterincubation with cyanobacteria—K, Si and Fe for illite; K, Si, Fe and Al forsmectite–zeolite.
Clay minerals usually possess paramagnetic properties. Magnetic propertiesof clays are caused by impurities of iron oxide minerals which have ferromag-netic properties (dispersed forms of magnetite or maghaemite, hematite andiron hydroxides).
Iron is involved in the variety of the physiological and biochemical functionsof organisms and being the element of variable valence is exclusively sensitive tothe changes of surrounding conditions (pH, oxidation–reduction etc.). Theparticipation of iron-reducing bacteria in the biogeochemical cycle of Fe is
236 T. V. Alekseeva et al.

well known (Lovley et al., 1998; Murad and Fischer, 1988; Zavarzina et al.,
2003). Recently the participation of phototrophic microorganisms in a cycle of
oxidation–reduction of iron has also been shown (Konhauser et al., 2002).Microcoleus chthonoplastes visibly influenced the properties of iron
compounds. Both dissolution and precipitation processes were observed.
Kaolin and smectite–zeolite demonstrate the increase of magnetic susceptibility
andmagnetization values (Fig. 4a) which connect with the precipitation of Fe in
the form of metastable ferrihydrite (5Fe2O3 �9H2O) followed by the formation
of more stable goethite (a-FeOOH). Robert and Berthelin (1986) underlined
that weathering in biochemical systems promotes the prevalence of components
with a low degree of the order, such as allophone, ferrihydrite et al.In our experiments the formation of poor ordered ferrihydrate is caused by
the properties of the system—large concentration of oxygen which promotes
the fast oxidation of Fe, the presence of organic matter which, probably, plays
Fig. 2 XRD patterns of illite: (a) parent illite air dry, ethylene glycol solvated and heated to350 and 5508C; (b) control illite, samples ethylene glycol solvated after 7, 14, 28 and 60 daysincubation without cyanobacteria; (c) the same after incubation with cyanobacteria. Qu,quartz; fsp, feldspar. Values are given in A
Changes in Argillaceous Minerals due to Cyanobacteria 237

the role of inhibitor and prevents crystallization of goethite. The appearance of
goethite was observed at the end of the experiment (28–60th days) and
correlated with the mineralization of organic matter. Our experimental
parameters of the metastable mineral, which are similar to the low coercivity
minerals (magnetite) with full saturation at low fields of �200 mT, low mag-
netic susceptibility value (comparable with goethite or hematite ) allow us to
confirm the ferrihydrate composition of this mineral (Pannalal et al., 2005).The Fe2O3 content in SWy-2 bentonite is 3.10% (Table 1), its magnetic
susceptibility is 10.5 units of SI 10–8 m3 kg–1 and magnetizations of saturation
(SIRM)—90 to 130 � 10–5 Am kg–1. The analysis of hysteresis loops demon-
strates the presence of the mixture of ferrimagnetic and paramagnetic parts.
The relatively high magnetic values are caused by impurities of iron oxide
minerals (superparamagnetic hematite, goethite and traces of magnetite). The
behavior of magnetic properties correlates with the biological activity of
cyanobacteria. Destruction of organic mater on 14th day of the experiment is
accompanied by a jump of a paramagnetic signal and a corresponding decrease
Fig. 3 XRD patterns of smectite–zeolite clay: (a) parent clay, air dry; (b) control samplesheated to 3508C after 7, 14, 28 and 60 days incubation without cyanobacteria; (c) the sameafter incubation with cyanobacteria. Sm, smectite; m, mica; ka, kaolinite; Qu, quartz. Valuesare given in A
238 T. V. Alekseeva et al.

Fig. 4 Hysteresis loops for clays after incubation with cyanobacteria: (a) smectite–zeolite;(b) bentonite (in brackets duration of experiment in days)
Changes in Argillaceous Minerals due to Cyanobacteria 239

in the ferromagnetic signal (Fig. 4b). A decrease in both magnetic susceptibility
and magnetization took place and most probably are connected with oxidation
of Fe2þ in the magnetite (maghemite) structure and precipitation of ferrihydrite
and goethite.
4 Conclusions
CyanobacteriaMicrocoleus chthonoplastes affects the properties of studied clays.
It has no visible influence on the mineralogy of bentonite and kaolin. Whereas
the development of more smectitic layers within the illite matrices in the case of
illite clay and defect ‘‘island’’ layer in the interlayer space of montmorillonite in
smectite–zeolite clay were found. Cyanobacteria influences the properties of iron
compounds, which are present in all studied clays as impurities. Both dissolution
and precipitation processes of iron compounds were observed. We suppose that
ferrihydrite is the keymineral in the biogenic cycle of Fe and it can, probably, be
synthesized via ‘‘green rust’’ minerals. ‘‘Green rusts’’ are natural hydrotalcites
with the formula: Fe2þ4 Fe3þ
2(OH)nA, where A is SO4, Cl, CO3 or other. They
are unstable in the presence of oxygen and hardly detectable. We suppose that
these minerals could be one of the intermediate metastable phases in the
biochemical cycle of Fe in the studied systems which contain Fe2þ, Fe3þ,
HCO3–, Cl–. Fast oxidation of Fe in the structure of ‘‘green rust’’ in the presence
of organic C most probably results in ferrihydrite synthesis (Hansen, 2001).
Obtained data show that the biochemical transformations we observed have
the multi-step nature. The initial precipitates differ from the posterior form and
one mineral can substitute to another. These processes connect with the condi-
tions of the medium (temperature, pH, redox conditions, rate of Fe oxidation,
presence of inhibitors—organic matter, Si and etc). This conclusion applies to
transformations of layer silicates as well as Fe oxides (hydroxides).
Acknowledgment The investigation was supported by Program 25 of the Russian Academy ofSciences ‘‘Biosphere Origin and Evolution.’’ We are very grateful to Prof. B. Maher (Centrefor Environmental Magnetism and Paleomagnetism, Lancaster University, UK) for thepossibility to use the equipment.
References
Dubinin, A.V., Gerasimenko, L.M. and Gusev, M.V. (1992) Physiological characteristics ofMicrocoleus chthonoplastes from hyper saline lake. Microbiology 61(1), 63–69 (inRussian).
Geptner, A.R. and Ivanovskaya, T. A. (1998) Biochemogenic genesis of the glauconite–non-tronite series minerals in present-day sediments of the Pacific Ocean. Lithol. Miner.Resour. 33(6), 503–517.
240 T. V. Alekseeva et al.

Geptner, A.R., Petrova, V.V., Sokolova, A.L. and Gor’kova, N.V. (1997) Biochemogenicformation of phyllosilicates during hydrothermal alteration of basalts in Iceland. Lithol.Miner. Resour. 32(3), 216–225.
Geptner, A., Kristmannsdottir, H., Kristjansson, J. and Marteinsson, V. (2002) Biogenicsaponite from an active submarine hot spring, Iceland. Clays Clay Miner. 50(2), 174–185.
Gerasimenko, L.M., Nekrasova, V.K., Orleansky, V.K., Venetskaya, S.L. and Zavarzin, G.A.(1989) The primary production of halophilicCyanobacterium cenoses. Microbiology 58(3),507–514 (in Russian).
Gerasimenko, L.M., Dubinin, A.V. and Zavarzin, G.A. (1996) Alkaliphilic cyanobacteriafrom soda lakes of Tuva and their ecophysiology. Microbiology 65(6), 736–740.
Hansen, H.C.B. (2001) Environmental Chemistry of iron(II)–iron (III) LDHs (green rusts).In: V. Rivers (Ed.), Layered Double Hydroxides: Present and Future. Nova SciencePublishers, New York, pp. 413–434.
Kawano, M. and Tomita, K. (2002) Microbiotic formation of silicate minerals in the weath-ering environment of a pyroclastic deposit. Clays Clay Miner. 50(1), 99–110.
Konhauser, K.O. and Urrutia, M.M. (1999) Bacterial clay authigenesis: a common biogeo-chemical process. Chem. Geol. 161, 399–413.
Konhauser, K.O., Hamade, T., Raiswell R., Morris, R.C, Ferris, G, Southam, G. andCanfield D.E. (2002) Could bacteria have formed the Precambrian banded iron forma-tions? Geology 30, 1079–1082.
Likhoshway, E.V., Sorokovikova, E.G., Bel’kova, N.L., Belykh, O.I., Titov, A.T.,Sakirko, M.V. and Parfenova V.V. (2006) Silicon Mineralization in the Culture ofCyanobacteria from Hot Springs. Doklady Biol. Sci. 407, 201–205.
Lovley, D.R., Fraga, J.L., Blunt-Harris, E.L., Hayes, L.A., Phillips, E.J.P. and Coates J.D.(1998) Humic substances as a mediator for microbially catalyzed metal reduction. ActaHydrochim. Hydrobiol. 26, 152–157.
Lowenstam, H.A. (1981) Minerals formed by organisms. Science 211, 1126–1130.Maher, B.A. and Thompson R. (1999) Quaternary Climates, Environments and Magnetism.
Cambridge University Press, Cambridge.Murad, E. and Fischer, W.R. (1988) The geobiochemical cycle of iron. In: J.W. Stucki,
B.A. Goodman and U. Schwertmann (Eds), Iron in Soils and Clay Minerals. NATOASI series, Vol. 217, pp. 1–18.
Pannalal, S.J., Crowe, S.A., Cioppa, M.T., Symons, D.T.A., Sturm, A. and Fowle, D.A.(2005) Room-temperature magnetic properties of ferrihydrite: a potential magnetic rema-nence carrier? Earth Planet. Sci. Lett. 236, 856–870.
Phoenix, V.R., Adams, D.G. and Konhauser, K.O. (2000) Cyanonacterial viability duringhydrothermal biomineralisation. Chem. Geol. 169, 329–338.
Ransom, B., Bennet, R.H., Baerwald, R., Hulbert, M.H. and Burkett P-J. (1999) In situconditions and interactions between microbes and minerals in fine-grained marine sedi-ments: A TEM microfabric perspective. Am. Miner. 84, 183–192.
Robert, M. and Berthelin, J. (1986) Role of biological and biochemical factors in soil mineralweathering. In: Interactions of Soil Minerals with Natural Organics and Microbes. SSSAspecial publication 17. Soil Science Society of America, Madison, pp. 453–495.
Schultze-Lam, S., Forris, F.G., Konhauser, K.O. and Wiese, R.G. (1995) In situ silicifica-tion of an Icelandic hot spring microbial mat: implications for microfossil formation.Can. J. Earth Sci. 32, 2021–2026.
Tazaki, K. (1998) A New world in the science of biomineralization—environmental biomi-neralization in microbial mats in Japan. The Science Reports of Kanazawa University,Japan. XLII (No. 1 and 2).
Tazaki, K., Okrugin, V., Okuno,M., Belkova, N., Islam, A.R., Chaerun, S.K.,Wakimoto, R.,Sato, K. and Moriichi S. (2003) Heavy metallic concentration in microbial mats found athydrothermal systems, Kamchatka, Russia. Science reports of Kanazawa University,Japan, 47 (No. 1–2).
Changes in Argillaceous Minerals due to Cyanobacteria 241

Thompson, R. and Oldfield, F. (1986) Environmental Magnetism. Goerge Allen and Unwin,London.
Trebst, A. (1980) Inhibitors in electron flow: tools for the functional and structural localiza-tion of carriers and energy conversation sites. Meth. Enzymol. 69, 675–715.
Ueshima, M. and Tazaki, K. (2001) Possible role of microbial polysaccharides in nontroniteformation. Clays Clay Miner. 49(4), 292–299.
Ushatinskaya, G.T., Zaitseva, L.V., Orleansky, V.K. and Gerasimenko, L.M. (2006) Signifi-cance of bacteria in natural and experimental sedimentation of carbonates, phosphatesand silicates. Paleontol. J. 40(Suppl. 4), 524–531.
Zavarzin,G.A. (1993)Development ofmicrobial community in the Earth’s history. In: Problemsof Before Anthropogenic Evolution of Biosphere. Nauka, Moscow, pp. 212–222 (inRussian).
Zavarzina, D.G., Alekseev, A.O. and Alekseeva, T.V. (2003). Iron-reducing bacteria andformation of magnetic properties of steppe soils. Eurasian Soil Sci. 36(10), 1085–1094.
242 T. V. Alekseeva et al.

Part IV
Coevolution of Geological and BiologicalEvents in Phanerozoe

Ecological Revolution Through Ordovician
Biosphere (495 to 435 Ma ages): Start of the
Coherent Life Evolution
A. V. Kanygin
Evolution of the biosphere can be presented as the following processes:(1) emergence of new ecologically specialized groups (guilds), providing amore efficient use, transfer, and transformation of matter and energy inecosystems; (2) spatial expansion of life throughout the Earth (gradual transi-tion from a discrete to continual exploration of new bionomic zones andbiotopes); (3) complication of the trophic structure of ecosystems (from simpleArchean autotrophic–heterotrophic prokaryotic systems to modern globaltrophic pyramid); (4) variations in the spatial and dynamic parameters ofbiogeochemical cycles.
The main evolutionary strategy at the early stages of biosphere development(including the Cambrian) was involved with the formation of optimal physio-logical mechanisms for interaction of living organisms with the physicochem-ical environment (widening of the tolerance range) with minimization of thedependence of the biotic environmental factors (Kanygin, 2004). To followKrasilov (1977), who coined the terms ‘‘coherent ecosystems’’ (ecologicallysaturated) and ‘‘incoherent ecosystems’’ (ecologically unsaturated), we mayrefer to this evolution as ‘‘incoherent evolution’’ to distinguish it from thecoherent evolution, in which the biotic interaction of organisms, together withphysicochemical factors, plays a decisive role in the evolution (Kanygin, 2001).The Ordovician period is the early stage of transformation of noncoherent seaecosystems to coherent ones, when they acquired the ‘‘Phanerozoic’’ habit,according to Sepkoski (1982). Starting from the Ordovician, as the taxonomicdiversity increased to the upper limit with successive emergence of new biomesin marine areas, fresh-water reservoirs, and on the land, the rate of evolutionincreased at each stage of the spatial expansion of the biosphere.
Early Paleozoic (Cambrian, Ordovician) is a transitional stage between theprimordial, locally distributed Precambrian-type ecosystems and the mature,tiered Phanerozoic-type ecosystems. The Cambrian and Ordovician periods
A. V. KanyginTrofimuk Institute of Petroleum Geology and Geophysics, Novosibirsk, Russiae-mail: [email protected]
N. Dobretsov et al. (eds.), Biosphere Origin and Evolution.� Springer 2008
245

mark the two fundamental revolutionary events that determined the principal
structural-functioning and spatial parameters of marine ecosystems: (1) the
appearance of major skeletal hydrobionts and the explosion of biotic diversity
in benthic communities dominated by grazing heterotrophs (trilobites and soft-
bodied worm-type organisms) in the Early Cambrian (Fig. 1); (2) in the middle
Ordovician—the rapid diversification of benthic groups of filter-feeding fauna
(cnidarians, bryozoans, crinoids, brachiopods, etc.) and small-sized trophic
generalists (ostracodes), the rise of a new group of autotrophs (chitinozoans),
specialized groups of zooplankton (graptolites, radiolarians) and nektonic pre-
dators (conodontophores, nautiloids, early agnostids), the flourishing of col-
ony-grade organisms, being an effective means of ecospace conquering and
food resource utilization (Fig. 2). The principal chorological and trophic
restructuring in marine ecosystems in Cambrian and Ordovician was controlled
by (1) the changes in the biological productivity and spatial (tiered) distribution
of autotrophic components in food chains (benthic cyanobacteria being
replaced with phytoplankton), the formation of a vertical vector and a system
network in trophic conveyers; and (2) the emergence and rapid diversification of
Fig. 1 Taxonomic and trophic structure of Cambrian biota: the model of Siberian platform(after Phanerozoic of Siberian, 1984, with additions)
246 A. V. Kanygin

new ecological guilds in the benthial and pelagial, thereby facilitating the
diversity of trophic specializations, the amplification of the system of deposit-
ing, transportation, and spacial distribution of food resources, and the dom-
inance of detritivore-based food webs over grazer-based food webs.The Ordovician was marked by a unique combination of geological and
biological events (Kanygin, 2001). Here are the most important Ordovician
biological events:
1. The most powerful explosion of biological divergence in the Phanerozoic(after the sudden emergence of main marine animal taxa in the earlyCambrian). This resulted in a threefold increase in taxonomic diversity.
2. Rapid (geologically instantaneous in the case of some taxa) global coloniza-tion of the bottoms and water columns of seas by new ecological guilds,which was accompanied by the formation of amultistage trophic structure ofecosystems.
Fig. 2 Main ecological quilds of the Ordovician period. Dominancy oxyphil groups oflong-time philolines
Ecological Revolution Through Ordovician Biosphere 247

3. Spatial rearrangement and taxonomic rotation of producers (photosynthe-sizing organisms) at the Early–Middle Ordovician boundary (Llanvirn),which changed dramatically the spatial and biological structure of foodresources in the benthic and pelagic zones of seas.
4. Emergence of a constant zoopelagic zone (instead of the former facultativeone) owing to the emergence and efflorescence of specialized planktonic andnektonic organisms.
5. The prosperity of oxyphil colonial (cnidaria, bryozoans), aggregated(crinoids) filter-feeding organismus with carcass skeletons and predators(conodontophores, nautiloids, asters, early agnostids).
6. The decrease of the diversity and the loss of dominant part of grazingheterotrophs (trilobites and soft-bodied worm-type organisms) among thebottom communities.
7. Dramatic decrease in taxonomic diversity of marine biotas in the lateOrdovician. It was not, however, accompanied by complete extinction ofany ecological guilds, unlike later major biological crises (e.g., at thePermian–Triassic and Cretaceous–Paleogene boundaries).
Global geological events also occurred in the Ordovician. They caused
dramatic changes in abiotic environmental settings in the euphotic zones of
seas and a wide expansion of the ecological space:
1. Contrasting climatic changes: traces of profound coolings and aridization inSouth America and on the Siberian Platform, global warming in the MiddleOrdovician, and Late Ordovician continental glaciations in Gondwana.
2. The widest occurrence of Phanerozoic epicontinental seas in the MiddleOrdovician and their dramatic reduction during the Late Ordovician con-tinental glaciation.
3. Abrupt change in the Mg:Ca ratio in marine sediments at the Early–MiddleOrdovician boundary. The evidence is a wide occurrence of dolomites anddolomitic limestones in the Lower Ordovician of many epicontinental basins(particularly on the Siberian Platform) and their nearly complete absencefrom theMiddle andUpperOrdovician, dominated by limestones andmarls.
4. The greatest peaks in the content of CO2 in the atmosphere, volumes ofvolcanic rocks, and fossilized in carbonate rocks (similar large-scale changesin the balance of these indices occurred in the Carboniferous and Cretac-eous); CO2 is the main biophil gas for the biosphere autotrophic level.
5. Dramatic increase in the content of oxygen in the atmosphere (to about 10%of the present-day value) and, correspondingly, its partial concentrations inthe hydrosphere and formation of the ozone screen (Berkner–Marshallpoint), which protected life from lethal fluxes of the short-wave solar radia-tion on the Earth’s surface and in the euphotic zones of water areas.
O2 is the main biophil gas for the biosphere heterotrophic level. Taken
together, these profound changes in biotas and environmental settings greatly
affected further development of the biosphere.
248 A. V. Kanygin

Presently available paleontological, paleoecological, and geological data(Budyko et al., 1985; Kraft and Fatka, 1999; Li and Droser, 1999; Morrowet al., 1996; Phanerozoic of Siberian, 1984; Ronov, 1993; Rozhnov, 2005;Severtsev, 1939; Walliser, 1996) allow outlining the ecological regularities ofecosystem evolution in the Ordovician.
Three stages are recognized in the evolution of Ordovician biotas: EarlyOrdovician (495 to 455Ma ages), Middle Ordovician (465 to 455Ma ages), andLate Ordovician (455 to 435 Ma ages). The most dramatic biota changesoccurred at the Early–Middle Ordovician boundary. The Early and MiddleOrdovician biotas differed not only in the range of taxa but also in abundance(population density) and clearly discrete bionomic distribution, both lateraland stratigraphic (Kraft and Fatka, 1999; Morrow et al., 1996; Walliser, 1996).The Early Ordovician fauna was much closer to the Cambrian than the MiddleOrdovician fauna in taxonomy and structure (range of species, short foodchains, and discrete location of biotopes). According to Sepkoski (1982), theboundary between the ‘‘Cambrian’’ and ‘‘Phanerozoic’’ faunas should be drawnat the base of the Middle Ordovician rather than at the base of the LowerOrdovician. In life density, the bottoms of Early Ordovician seas can becompared with modern desert landscapes, with rare oases and scarce traces oflife in the rest of the area. Early Ordovician seas, like Cambrian ones, weredominated by mud-eating trilobites and soft-bodied worm-type organisms(identified due to varions ichnofossils), often forming dense accumulations atthe muddy bottom, rich in organic matter. Less frequent were brachiopods,gastropods, monoplacophorans, and sponges.
Exotic living forms of uncertain systematics appeared almost everywhere inthe shallow areas of the Siberian Platform before the Middle Ordoviciantaxonomic explosion. They were Clyptolichinaria (morphologically close totabulates), Tolmachovia (presumably either crustaceans or mollusks), Soanites(having features of archaeocyaths, sponges, and corals), and Angarella (havingfeatures of cap-shelled gastropods and monoplacophorans). Some of these taxaoccur in other regions of the world at approximately the same stratigraphiclevels. All of them existed for a short time, much shorter than any other species;therefore, they can be called evolutionary ephemeres. They did not leave directevolutionary descendants, but the morphoanatomical variants they testedappeared, in a modified form, in related taxa during saltations.
The appearance and rapid extinction of the evolutionary ephemeres on theeve of the global taxonomic radiation of evolutionary long-livers is a goodexample of the role of inadaptive taxa in search for adaptational compromisebetween the changing environment and living organisms. Mass appearance ofevolutionary ephemeres also preceded the Early Cambrian large-scale biologi-cal radiation (Fig. 1).
In theMiddle Ordovician, new filter feeders of attached benthos (bryozoans,stromatoporates, tabulates, rugoses, and crinoids) began large-scale coloniza-tion of the sea bottom (Fig. 2). The appearance and rapid dispersal of thesecarcass organisms abruptly changed the stage and trophic structure of benthic
Ecological Revolution Through Ordovician Biosphere 249

biocenoses. All of them are sessile filter feeders capable of consuming nutrientparticles varying in size not only from bottomwater flows but also from verticalgravitational flows. The rapid radiation of colonial organisms and their massdispersal in the shelf zones of seas point to a rapid increase in food resourcesnear the bottom and their stepwise distribution. The colonial forms proved tobe efficient for occupation of living space by rapid propagation of polyps,continual colony growth, and more complete food utilization by cooperativeaction of tentacles, which ensures constant water circulation around the colo-nies and catch of nutrient particles.
The beginning of theMiddle Ordovician was also marked by rapid radiationof echinoderms, particularly crinoids, which formed large monotaxic associa-tions (Rozhnov, 2005). They occupied space no less efficiently than it could bedone by colonial cooperation of organisms. Ordovician crinoids had a newfeeding tool absent from their Cambrian ancestors: mobile tentacles withenlarged food-conducting grooves. This allowed them to rise to a higher stage(above 1 m, whereas eucrinoids existed no more than 10–15 cm above thebottom), widen the zone of food catch from bottom currents and gravitationalflows, and utilize food particles of a broader size range. Eucrinoids, as deducedfrom examination of their present-day descendants, had a less diverse dietconsisting of dissolved organic matter and bacteria, which were supplied tothe body by brachioles.
The high diversification rate of another guild, bryozoans, may also be relatedto their capability for occupying and efficiently using food space by combiningtwo types of cooperation: colonial habit and aggregation. They could also haveformed monopoly settlements in different biotopes owing to varying colonyshapes (from mechanically rigid spherical to mobile bushy) and topographicdistribution.
The aggregational habit of settlements, which increases the adaptationalpotential owing to cooperation, characterized early stages of ecosystem evolu-tion. It is also typical of migrational successions related to changes in physico-chemical indices of the environment. Modern analogs of various aggregationtypes can be observed in extreme landscapes, such as tundra. According topaleontological evidence, aggregations were the main type of the topographicstructure of associations in the Cambrian and Early Ordovician seas. The funda-mental difference between the topographic structures of the Cambrian–EarlyOrdovician and Middle Ordovician associations was that in the MiddleOrdovician, the local discrete ecological space gave way to a continual-mosaicone. Three reasons can be suggested for the rearrangement of the topographicstructure of associations: (1) change in the spatial structure of the primaryproducer link, i.e., the autotroph stage; (2) appearance of new guilds and increasein biodiversity at the heterotroph stage; (3) appearance of ecological generalists.All these factors led to a broad extension of ecological space (range of availablefood resources) andheterogeneity in the distribution of producers and consumersaccompanied by an increase in the interdependence of associations related toincreasing intricacy of food webs.
250 A. V. Kanygin

Geological data indicate that at the Early–Middle Ordovician boundary, seabasins became less rich in stromatoliths (traces of bacterial–algal associations).Probably, they provided the bulk of food resources for benthic biota by photo-synthesis. It is difficult to estimate the role of phytoplankton in the total foodbalance from paleontological evidence, though there is much proof for its early(Precambrian) appearance. According to indirect data, significant amounts ofspecialized forms of zooplankton appeared only in the Ordovician. They couldensure vertical trophic transition of primary products and expand its horizontaltransition within the euphotic zone of seas. Important arguments for the dra-matic change in the balance between the bottom and pelagic phytoproduction, inaddition to the abrupt disappearance of abundant stromatoliths, are a dramaticincrease in the taxonomic diversity of pelagic (graptolites and radiolarians) andnektonic (conodonts and nautiloids) organisms, a principal change in the ratioof filter-feeding and mud-eating (crawling and burrowing) animals, and forma-tion of a multistage trophic structure in benthic associations. Moreover, withregard to the Middle Ordovician large-scale occurrence of benthic colonialorganisms propagating through the planktonic larva stage, meroplanktonacquired a great significance in the food webs of the bottom parts of seas.
Ostracodes became an important link in the global food cycle of MiddleOrdovician sea ecosystems. Their spatial expansion and diversification occurredmost rapidly. From the outset, ostracodes had the widest range of adaptive toolsof all aquatic organisms: the ability to crawl, burrow, and drift with watercurrents owing to small sizes. In the Middle Ordovician, ostracodes acquiredtools for passive hovering and active swimming in the water and were among thefirst aquatic animals colonizing the pelagic zone. Nearly all alimentation modescharacteristic of aquatic invertebrates are known in ostracodes: sestonic, filter-ing, detritivorous, carrion feeding, parasitic, etc. Moreover, ostracodes, like allshort-lived small animals capable of rapid propagation, could have filled thesmallest ecological niches under the conditions of dense occupation of theecological space. In the Ordovician, being universally eurybiotic, ostracodeswere predominant at the lower trophic level and were then dispersed throughoutthe Earth’s hydrosphere, including various fresh-water biotopes.
The abrupt restructuring of food resources in Middle Ordovician seas is alsoconfirmed by significant changes in the proportions of former predominantgroups: trilobites and articulate brachiopods. The Early Ordovician seas, aswell as the Cambrian ones, were clearly dominated by mud-eating trilobites,and the role of filter-feeding brachiopods was of little significance, whereas inthe Middle Ordovician, the range of brachiopod species reached its acme, andtrilobites began to dwindle. TheMiddle Ordovician is marked by the maximumrate of emergence of new adaptive tools in trilobites. For example, the length ofocular stems in some species of the family Asaphidae increased dramatically.This allowed them to burrow deep into mud, maintaining visual monitoring ofthe situation. Some trilobites acquired tools for active and passive swimmingabove the bottom. This enhanced their ability to obtain food under the condi-tions of rapidly increasing competition for food resources.
Ecological Revolution Through Ordovician Biosphere 251

The distribution of skeletal over Cambrian and Ordovician biostratonsdemonstrates that the total bioproductivity of sea ecosystems increased by anorder of magnitude on the average (Kanygin, 2001; Li and Droser, 1999). Thebioproductivity difference between Early and Middle Ordovician ecosystems isstill more pronounced if the increasing role of living organisms in trophicdecomposition of dead ones (particularly, mollusks) and reduction of skeletalelements by bioturbation (particularly, graptolites) is taken into account.
The main feature of theMiddle Ordovician saltation, in comparison with theEarly Cambrian one, is that it was not accompanied by fundamental anatomi-cal changes. Biodiversification of all new ecological guilds involved all con-struction elements which appeared earlier. However, the structures oflocomotory and food-catching organs of new taxa underwent numerous mod-ifications, advantageous for colonization of living space and utilization of foodresources. These modifications determined new types of adaptation to the bioticrather than abiotic environment. Thus, their scale and evolutionary conse-quences allow them to be assigned to aromorphs, i.e., changes which substan-tially affect the energy potential and adaptability of organisms and determineappearance of new modes of interaction with other organisms in ecosystems(Severtsev, 1939). Taxonomically, the new aromorphs manifested themselves inrapid divergence and broad expansion of new high-rank groups: corals,brachiopods, bryozoans, ostracodes, stromatoporates, echinoderms, grapto-lites, radiolarians, conodonts, and nautiloids. All these groups were oxyphiland long-lived. Many of them still exist.
Thus, in the Middle Ordovician, the evolutionary strategy of marine biotaschanged, first in benthic associations and then in pelagic ones. The generalevolutionary trend was regulated mainly by ecological interactions betweenorganisms (i.e., adaptation to the biotic environment) rather than by physico-chemical adaptation, which was the main driving and stabilizing force in earlierecosystems. In the Middle Ordovician, evolution of benthic ecosystems becamecoherent. As a result, the total range of species in benthic ecosystems stabilizedand very slowly increased thereafter (Fig. 3).
The Ordovician was the time of formation of constantly functioning pelagiczones inhabited by the first specialized groups of marine skeletal zooplankton:graptolites and radiolarians. This time was also marked by large-scale develop-ment of nektonic organisms (nautiloids and conodonts) and the advent ofagnathans. The first ostracodes capable of broad dispersal and facultativedwelling in the pelagic zone are also dated to the Middle Ordovician.
The global ecological event was accompanied by the greatest (in thePhanerozoic) burst of the diversity of Ordovician marine biotas followed byrapid stabilization. Later, the stability was maintained by a phylogeneticsuccession of ecologically equivalent taxa, with some ecological guilds replacedat critical borderlines. Thus, in the Ordovician, sea ecosystems became multi-stage, their trophic structure became more complex, and a global closedbiogeochemical cycle formed for the first time throughout the sea area. TheOrdovician global biotic events matched large-scale geological events (abrupt
252 A. V. Kanygin

climatic changes, maximum range of transgressions and regressions of epicon-tinental seas, changes inMg andCa balance inmarine sediments, increase in thecontent of oxygen in the Earth’s atmosphere and hydrosphere, and formationof the ozone screen; Budyko et al., 1985;Morrow et al., 1996; Ronov, 1993). It issupposed that the increase in the content of oxygen in seawater had a crucialimpact on the settling of heterotrophs in the pelagic zone and formation ofcoherent (ecologically complete) benthic ecosystems. At the initial metastablestage of the development of the ozone screen, eustatic fluctuations of the worldocean level caused dramatic biodiversity fluctuations in bottom and pelagicassociations determined by profound changes in spatial parameters of seashelves, the main habitat of biota. The Late Ordovician extinction of marinebiotas resulted from an abrupt shrinkage of the shelf habitat caused by alowering of the world ocean, which, in turn, resulted from the fixation ofhuge volumes of water in continental glaciers after the Ordovician transgressionmaximum.
References
Budyko, M.I., Ronov, A.B. and Yanshin, A.L. (1985) History of the Atmosphere.Gidrometeoisdat, Leningrad, 208 pp. [in Russ.].
Kanygin, A.V. (2001) The Ordovician explosive divergence of the Earth’s organic realm:causes and effects of the biosphere evolution. Russ. Geol. Geophys. 42(4), 599–633.
Fig. 3 Evolution of taxonomic, trophic, and space structure of marine ecosystems throughearly Paleozoic
Ecological Revolution Through Ordovician Biosphere 253

Kanygin, A.V. (2004) Geological Setting of Life Evolution. SB RAS, Novosibirsk, pp. 23–32[in Russ.].
Kraft, P. and Fatka, O. (Eds) (1999) Qua vadis Ordovician? Short papers of the InternationalSymposium on Ordovician System, Universitatus Carolinae. Geologica 43(1/2), 533 pp.
Krasilov, V.A. (1977) Evolution and Biostratigraphy. Nauka, Moscow, 256 pp. [in Russ.].Li, X. and Droser, M. (1999) Lower and Middle Ordovician shell beds from the basin and
range province of the Western United States (California, Nevada and Utah). Palaios 14,2i5, 215–233.
Morrow, J., Schindler, E. andWalliser, O. (1996) Phanerozoic development of selected globalenvironmental features. Global Events and Event Stratigraphy in the Phanerozoic.Springer, Berlin Heidelberg New York, pp. 53–61.
Phanerozoic of Siberian (1984) T. 1. Vend, Paleozoic. Nauka, Novosibirsk, 192 pp. [in Russ.].Ronov, A.B. (1993) Stratisphere, or the Sedimentary Shell of the Earth. Nauka, Moscow,
144 pp. [in Russ.].Rozhnov, S.V. (2005)Morphological Regularity of Echidermes Higher Taxons Establishment
and Evolution. KMK, Moscow, pp. 156–170 [in Russ.].Sepkoski, J.J. (1982) Spec. Pap. Geol. Soc. Am. 247, 283–290.Severtsev, A.N. (1939) Morphological Regularity of Evolution. AS USSR, Moscow, 610 pp.
[in Russ.].Walliser, O. (Ed.) (1996) Global Events and Event Stratigraphy in the Phanerozoic. Springer,
Berlin Heidelberg New York, 333 pp.
254 A. V. Kanygin

Part V
Ecosystems and Molecular Genetic Factorsof Organism Evolution

Evolution by Gene Duplications:
from the Origin of the Genetic Code
to the Human Genome
S. N. Rodin and A. S. Rodin
Abstract Evolution ab simplecioribus ad complexiora is based on duplications.In a working live system novelties almost never emerge by chance. New genes,exons, or even smaller functional units typically originate with minute changesin the duplicate(s) of preexisting sequences. Extant gene and protein sequencesoften harbor the periodicity that unambiguously points to their duplication-based origins (Ohno, 1987, 1988). Here we consider two fundamentalparadoxes associated with duplications. The first paradox dates back to theorigin of encoded protein synthesis, and it can be explained away by whatarguably was the single most important duplication event in the history oflife, the duplication of a presumable short precursor of a transfer RNA thatshaped it into a major adaptor of the genetic code. The second paradox belongsto the realm of already quite complex and advanced life; it concerns survival ofgene duplicates per se and appears to be most pronounced in the humangenome. In a sense, the entire history of life (as we see it presently) can be saidto lie in between the above two series of events.
1 Origin of the Genetic Code: Duplication in tRNA
1.1 Domains of tRNAs and the Paradox of Two Codes
The assignment of nucleotide triplets (codons) to amino acids (aa) representsthe universal code (Table 1) for synthesizing gene-instructed proteins.
Although other codes have arisen during evolution (Weiss and Buchanan,2005), the universal genetic code is accepted as the basic (most fundamental)one. Any hypothesis of its origin must somehow evade the ‘‘chicken-or-egg’’conundrum. This brings us to a paradox that concerns the nature of tRNA, a
S.N. RodinBeckman Research Institute of the City of Hope, Duarte, CA, USAe-mail: [email protected]
N. Dobretsov et al. (eds.), Biosphere Origin and Evolution.� Springer 2008
257

necessary bifunctional code-translation adaptor. It is as follows: transfer RNAsbring the code into action by using the codon’s precise complementary copy, theanticodon. The problem with the anticodon is that it is located at the oppositeend of the tRNA molecules to the corresponding aa-binding site (Fig. 1). Thismakes the anticodon-specific self-aminoacylation of tRNAs very unlikely.Indeed, even the simplest forms of life always have 20 enzymes, theaminoacyl-tRNA synthetases (aaRS), each of which ‘‘charges’’ its tRNAswith a cognate amino acid. Obviously, to perform this substrate-specificaminoacylation, the aaRSs must recognize their tRNAs as selectively aspossible, by interacting either directly with the anticodon triplet or with someother site(s) within the same tRNA molecule. In the latter case, the anticodon-to-aa assignment is established indirectly, due to the physical linkage of theanticodon with the aa-specific site. In reality, both mechanisms seem to havebeen used (Schimmel and Beebe, 2006). And yet, when tRNAs are truncated tothemini-helices (or even smaller fragments of the acceptor stem) they can still beselectively charged with the correct amino acid (Schimmel and Beebe, 2006;Schimmel et al., 1993). Such anticodon-independent aminoacylation of tRNAswas detected for half of amino acids (Schimmel and Beebe, 2006; Schimmelet al., 1993).Moreover, in reciprocal experiments with truncated aaRSs (includ-ing extreme cases in which a truncated enzyme was unable to reach the antic-odon) the specificity of aminoacylation also remained unchanged (Schimmeland Beebe, 2006; Schimmel et al., 1993).
This remarkable autonomy of aa-binding domains in tRNAs, as well asaaRSs, led to the concept of an operational code that is localized mainly in the
Table 1 The conventional representation of the genetic code with indicated assignment ofaaRSs to class I (White) and class II (gray)
258 S. N. Rodin, A. S. Rodin

acceptor stem of tRNAs (Schimmel et al., 1993; see also De Duve, 1988) asopposed to the classic genetic code that is associated with the anticodons.
Importantly, it seems logical to postulate the similar modularity for theribozymic precursors of aaRS (Fig. 1). The obvious advantage would be thatsuch ribozymes can easily recognize the anticodon by means of directcomplementary base pairing. However, in order to attach appropriate aas tothe tRNAs, this ribozyme must, in turn, have had the aa-specific binding site,and this site would again be localized very far from the ‘‘anti-anticodon’’ site—inthe vicinity of the tRNA 30 terminus, to be exact (Fig. 1). It thus appears that theribozymic precursors of aaRSs had exactly the same problem with two(operational and classic) codes: to aminoacylate the cognate tRNA with highspecificity they would need the catalysts of their own, i.e., ‘‘ribozymes of thesecond order’’. . .which, in turn, would require their own catalysts again, and soon (Rodin and Rodin, 2006a).
It is the operational code, rather than the classic code, which is directlyresponsible for the tRNA’s correct aminoacylation at its 30’ end by the cognateaaRS (Schimmel et al., 1993). And it is the operational code that makes theclassic code possible—it was suggested, therefore (Schimmel et al., 1993) that
Fig. 1 tRNA cloverleaf (a) and L-shaped 3D structure (b) consisting of two halves, topminihelix (acceptor stem plus TcC arm) and bottom dumbbell (anticodon arm plus D arm).One of E. coli tRNAsAla (with GGC anticodon) is shown, with the characteristic 3G:U72‘‘wobbling’’ complementary base pair that determines the identity of the Ala tRNAs across allspecies (Hou and Schimmel, 1988). The second base of the anticodon and the second base pairof the acceptor (showing dual complementarity—see text) are enlarged and boxed. Thehypothetical aminoacylating ribozyme is schematically shownwith a dotted line (to the right, a)
Evolution by Gene Duplications 259

the top halves of tRNAs, which contain the embedded operational code forspecific aa attachments, might be older than the bottom halves, which areassociated with the anticodon–codon recognition (Fig. 1b). Consistent withthis hypothesis are the minihelix-like tags that are found at the ends of RNAgenomes—these short tRNA precursors might have been used originally as thereplication initiation sites (Weiner and Maizels, 1987, 1999).
Furthermore, the very existence of the operational code revived the idea ofthe classic code (Table 1) being a ‘‘frozen accident’’ of sorts (Crick, 1968;Schimmel et al., 1993). An alternative to the ‘‘frozen accident’’ scenario is thepossibility of a direct stereochemical affinity between amino acids and cognatetriplets (anticodons and/or codons) (Szathmary, 1999; Woese, 1965; Yarus,1998; Yarus et al., 2005). Theoretical modeling (Shimizu, 1982) and RNAaptamers that were selected in evolutionary experiments with random RNApools (Caporaso et al., 2005; Yarus, 1998; Yarus et al., 2005) clearly demon-strate that this affinity, weak though it might be, does exist.
Such stereochemical preference necessarily generates the ‘‘similar triplets forsimilar aas’’ coding pattern. However, the frozen accident-based evolution ofthe classic code does not necessarily preclude its optimization along the ‘‘similartriplets for similar aas’’ trajectory (Crick, 1968). Indeed, the close association(within the same tRNA molecule) of the operational and classic codes allowsthem to evolve concordantly. For such co-evolutionary processes to initiatesuccessfully, and to continue proceeding smoothly (and with lower selectioncosts), it would be beneficial if the two (presently very different) codes initiallyhad the same ancestor. This implies that the dumbbell module of tRNA mighthave originated from the minihelix module, or vice versa (Fig. 1b), by duplica-tion (Di Giulio, 1992; Rodin et al., 1996).
1.2 Dual Complementarity in tRNAs Points to Ancient Duplication
A direct search for anticodon- or codon-like duplicates within the acceptorstem, in the vicinity of the base-determinator and 30 terminal site of aa attach-ment, yielded nothing. However, traces of this crucial duplication event doshow up—not directly in individual tRNAs, but rather in pairs of consensus/ancestral tRNAs with complementary anticodons. Specifically, such pairs havecomplementary bases at the second positions of their acceptor stems as well(Fig. 1) (Rodin et al., 1996). We interpreted this dual complementarity as asignature of the common ancestry of two codes (classic and operational).Moreover, the anticodon triplet and the first three bases of the acceptor stemoriginally could have been the same entity (Rodin and Ohno, 1997; Rodin et al.,1996). However, since this concerted complementarity is observed only for thesecond base pair in the acceptor, even a triplet structure of the primordialoperational code remains difficult to explain away. How, in general, could thetwo codes co-evolve during the expansion of the amino acid repertoire?We haverecently addressed this question by testing the updated collection of 8246 tRNA
260 S. N. Rodin, A. S. Rodin

gene sequences (Sprinzl and Vassilenko, 2005) with respect to dual complemen-
tarity. The sequences cover threemain kingdoms, eubacteria, archaebacteria andeukaryotes. We have manually aligned the sequences of concatenated tRNAgenes and built the phylogenetic trees for each of these kingdoms. We subse-quently reconstructed the ancestral tRNA sequences (supposedly representingthe respective latest universal common ancestors) separately for each anticodon,for each phylogenetic tree and for the complete set of tRNAs.
Two groups of ancestral tRNA pairs have been tested: the pairs with fullycomplementary anticodons and the pairs in which only the second bases of theanticodons are complementary. Only the first group exhibited the dualcomplementarity thus suggesting (Rodin and Rodin, 2006a) that:
1. Ancestral tRNAs gained the dual complementarity when the three-lettertranslation frame was already in use.
2. Although the double-stranded anticodon (codon)-like trinucleotides couldindeed have represented the ancestral operational code, the latter was highlyambiguous. In fact, only the second base pair was established at the timewhen the first protein aaRSs replaced their ribozymic precursors.
3. It was most likely the ancient simultaneous translation (in the same frame) ofboth sense and antisense strands (under which the new tRNAs enteredprimitive translation in pairs with complementary anticodons) thatpreserved the dual complementarity.
1.3 Simultaneous Sense–Antisense Coding Might PredetermineTwo Complementary Modes of tRNA Aminoacylation
The main premise of our ongoing study is that, in contrast to the advanced‘‘bilingual’’ life of nucleic acids and proteins with only one of the DNA strands(sense strand) used for encoding proteins, in the hypothetical preceding
‘‘monolingual’’ (and thus arguably more strand-symmetric) RNA world bothcomplementary replicas of a gene could have been used not only as catalysts(Kuhns and Joyce, 2003) but also, later, as first templates for encoded proteinsynthesis (Carter and Duax, 2002; Pham et al., 2007; Rodin and Ohno, 1995,1997; Rodin and Rodin, 2006a). Accordingly, we expected to find thefundamental ‘‘fingerprints’’ of this primordial strand symmetry not only intRNAs but also in aaRSs and in the genetic code organization itself.
The division of aaRSs into two unrelated classes, I and II (Eriani et al., 1990),is remarkable in this regard. Their modes of tRNA recognition appear to becomplementary to each other: class I and II aaRSs approach the acceptor stemfrom the opposite sides, minor versus major groove, and attach aas to the 20-OHand 30-OH of the terminal A76, respectively (ibid). Accordingly, we rearrangedthe classic genetic code table by putting the complementary codons vis-a-viseach other (Table 2, A). This rearrangement revealed the striking mirror
Evolution by Gene Duplications 261

Table 2 A subcode for two modes of tRNA recognition reveated by complementarytransformation of the genetic code (Table 1)
(A) The genetic code representation in which white and gray mark two modes of tRNArecognition (instead of class I and II of AARSs shown in Table 1)—from the minor and majorgroove sides of the acceptor stem, respectively. A lighter shade of gray (Lys) reflects the minorgroove side recognition of its tRNA by a class I synthetase in some archaebacteria (Ibba et al.,1997). The ‘‘nonsense’’ UGA is assigned to Trp, as in many nuclear and mitochondrial codes(Knight et al., 2001). Two other stop codons are shown in white because the known cases oftheir ‘‘capture’’ by amino acids are mostly of the minor groove side variety (Knight et al.,2001). Also, codons AGR are assigned to gray Ser or Gly, as they are inmitochondria (Knightet al., 2001). Alternatively, one can assume a Arg$Lys swap between codons AGR and AAR(Szathmary, 1991). This swap is consistent with AAA triplets found in the Arg-binding site ofselected RNA aptamers (Caporaso et al., 2005). (B) The genetic code representation from (A)is further rearranged to put complementary codons vis-a-vis each other. The code is ‘‘com-pressed,‘‘ with N (and complementary I) standing for all four nucleotides; R, purine (G or A);Y, pyrimidine (C or U). The opposite-directed arrows poiint at four pairs of codons on thecomplementary stands that might have determined subcode for two modes of tRNA aminoa-cylation in early RNP world. See Rodin and Rodin (2006b) for details.
262 S. N. Rodin, A. S. Rodin
symmetry of the two modes of tRNA recognition (Table 2, B) (Rodin andRodin, 2006b). Specifically, two types of complementary codons (and, sym-metrically, anticodons) immediately attract attention. We will call them ‘‘type1’’ and ‘‘type 2.’’ Type 1 complementary codons contain YY versus RR atthe second and either first or third positions. They are in the same recognitionmode, meaning that their aaRSs approach the tRNA acceptor from thesame side (either minor, shown in white in Table 2B, or major, shown ingray in Table 2B, groove side). In contrast, type 2 complementary codonscontain RY versus YR at the aforementioned positions. They are in thedifferent recognition modes, their aaRSs approaching from the oppositegroove sides (one from the major groove side and the other from the minorgroove side).
It is important to note here that the dinucleotides in type 2 complementarycodons, namely YR and RY, include palindromes CG, GC, UA and AU(of course, RR and YY dinucleotides in type 1 complementary codons cannotpossibly be palindromes). Palindromes, by definition, are identical to their comple-ments. Therefore, a single one-base shift in recognition of corresponding tRNAswould dramatically increase the recognition confusion risk. Such errors werelikely quite frequent in the primordial RNA life catalyzed by ribozymes. We seethe only way to avoid this confusion—the recognition of tRNAs by the earliesttwo (most likely ribozymic) precursors of aaRSs should be spread from theiranticodons in the opposite directions (Rodin and Rodin, 2006b). In the mostparsimonious scenario, this suggests complementarity of the two ribozymesthemselves. Accordingly, they spread tRNA recognition and reached amino acidattachment site from the opposite sides (minor versus major groove) of the accep-tor stem.
Let us assume also that the ancestral genes of two protein aaRSs werephysically linked with their ribozymic precursors. If we take into account thegeneral principle of evolutionary continuity, then all of the above suggestthat the two protein aaRSs were originally encoded by the complementarystrands of the same ancestral gene. Interestingly, we put forward this hypothesismuch earlier (Rodin and Ohno, 1995), from a different inquiry and on thebasis of the surprising complementarity shown in ‘‘head-to-tail’’ alignmentsof the signature motifs from the catalytic domains of class I and II aaRSs(Fig. 2). The real precedent for sense–antisense coding of class I and II homo-logs (Carter and Duax, 2002), as well as the recent artificial creation of a‘‘minimalist’’ TrpRS catalytic domain (Pham et al., 2007), strongly supportsthis hypothesis.
To summarize, the early genetic code might have had its operationalduplicate in the acceptor helix. Moreover, the code might have begun itsexpansion under the constraints of archaic double strand translation. Thisdouble-stranded beginning is likely the reason why the code is not mutationallyoptimized for the subsequent differentiation of DNA strands into the coding(sense, non-transcribed) and non-coding (anti-sense, transcribed) strands(Rodin and Ohno, 1997). Using this strand asymmetry, we proposed a
Evolution by Gene Duplications 263

novel indicator of selection via calculation of the ratio of non-synonymous
to synonymous base substitutions at CpG palindromes (Rodin et al., 1998,
2005a). This indicator is insensitive to the local site-specific mutability; at the
same time, it distinguishes the selection- and drift-driven trajectories of mole-
cular evolution. Therefore, it is particularly suitable for the study of duplicate
genes.
Fig. 2 Schematic diagram representing class I versus class II aaRSs complementarily (‘‘head-to-tail’’) mapped to each other (adopted from Rodin and Ohno, 1995). Class-defining signa-ture motifs are HIGH (class I) against motif 2 (class II) and KMSKS (class I) against motif 1(class II). CP1 and CP2 are the hypervariable (in length) connective polypeptides. Threesignature motifs of class II aaRSs are shown at the bottom. Amino acid groups are designatedas follows: x—any residue, (�)—polar residue, (þ)—positively charged residue, (–)—nega-tively charged residue, (�)—hydrophobic residue. In this representation, signature motifsfrom the opposite classes appear to be highly complementary, suggesting that the two aaRSsmight have originated as products of in-frame translation of complementary sense andantisense strands of the same primordial gene (Rodin and Ohno, 1995). Recently, Phamet al. have successfully deleted the anticodon-binding domain from TrpRS, have reducedCP1 and have fused the discontinuous segments comprising its active site (Pham et al., 2007).The resulting 130-aa-long minimal catalytic domain maintained the original TrpRS’s abilityto activate tryptophan. This proves in vitro that the conserved class I signature motifs HIGHand KMSKS could have indeed originated simultaneously with the class II signature motifs 2and 1 from complementary strands, as proposed in Rodin and Ohno (1995)
264 S. N. Rodin, A. S. Rodin

2 Epigenetic Regulation of Expression, Repositioning and
Evolutionary Fate of New, Redundant Gene Copies
2.1 Loss-or-Gain Dilemma, Effective Population Size and theDuplication–Degeneration–Complementation Model
An intriguing paradox lies at the very heart of evolution ab simplecioribus ad
complexiora (Rodin and Riggs, 2003; Rodin et al., 2005a,b). All other things
being equal, more complex organisms have to be more complex genetically.
An increase in genetic complexity necessarily suggests the emergence of new
genes and/or new, non-coding regulatory elements. Both of these novelties, in
turn, necessarily suggest the presence of DNA duplications. In the classic
model of evolution to a new function (neo-functionalization) by gene duplica-
tion, one gene copy retains the original function and remains under strong
control by negative (purifying) selection, whereas its duplicate gene is free of
selective constraints, so spontaneous mutations and positive selection may
gradually shape it into a novel gene (Ohno, 1970). However, any mutation,
either deleterious or advantageous, in the redundant gene copy becomes
neutral and may be spread in a population by random drift. Deleterious
mutations originate far more frequently than advantageous ones. Therefore,
one would predict that instead of neo-functionalization, deleterious mutations
will almost always cause the deterioration of the redundant gene into a
functionless pseudogene and, eventually, into junk DNA. Population genetic
models (Ohta, 1980) and genome-wide studies of duplicate genes support this
prediction (Lynch and Conery, 2000; Lynch et al., 2001; Mounsey et al.,
2002).Moreover, the smaller the effective population size Ne, the more likely that
pseudogenization will occur, relative to the selective fixation of advantageous
mutations (Lynch and Conery, 2000; Lynch et al., 2001; Mounsey et al., 2002).
This means that the ‘‘loss-or-gain’’ alternative is especially biased toward ‘‘loss’’
in higher organisms with complex, slow development and relatively small Ne.
This is a striking paradox (Rodin and Riggs, 2003; Rodin et al., 2005a,b),
because the complexity is originally defined, and subsequently increased, by
the new genes and/or regulatory elements that are generated by duplication.
Ironically, in order to detect positive selection at work on gene duplicates, one
usually turns to relatively simple organisms with large Ne. In other words, the
more complex the organisms are, the more difficult neo-functionalization
should be. At some point, presumably long before achieving, say, human
genome levels of complexity, neo-functionalization becomes prohibitively
difficult. And yet, here we are!Members of a typical multigene family are descendents of duplication
events, but they do not degenerate into pseudogenes because each member
of the family has a particular developmental period and/or tissue-specific
Evolution by Gene Duplications 265

expression pattern, when and/or where it is exposed to selection. That is, the
individual expression patterns do not overlap, but rather complement each
other temporally and spatially. This complementation is employed in the
duplication–degeneration–complementation (DDC) model of duplicate genes
survival (Force et al., 1999; Lynch et al., 2001). This model assumes that,
although degenerative mutations occur in gene duplicates they may affect
different, relatively independent regulatory elements that are responsible for
stage/tissue-specific expression of the gene. In this case, duplicate genes come
back under the control of selection, thus preserving themselves and opening
new vistas toward further adaptive divergence. The earlier a duplicate gene
comes under selective pressure, the more likely the duplicate will escape from
mutational degradation. Keeping this in mind, it is important to consider the
role of epigenetic silencing, which seems to occur much faster than mutational
silencing.
2.2 The Epigenetic Complementation Model
Indeed, the newly created duplicates can easily be inactivated epigenetically—
via methylation, heterochromatinization, homologous RNAi-mediated silen-
cing or other processes that involve heritable chromatin structure (Rodin and
Riggs, 2003; Rodin et al., 2005a,b). In this epigenetic complementation (EC)
model, degenerative mutations appear as an effect rather than a cause of the
complementary silencing of duplicate genes.A quantitative analysis of the model (Rodin and Riggs, 2003; Rodin et al.,
2005a,b) showed that:
- The complementary silencing of duplicates notably accelerates their functionaldivergence in relatively small populations (in the range 1<Nes< 100, where sis the selection factor).
- This accelerative advantage is inversely dependent on the gene-specificadaptive/degenerative mutation ratio: the rarer the adaptive mutation is(compared to the degenerative mutations), the larger the beneficial effect ofthe epigenetic stage/tissue-complementary silencing of duplicates will be(thus clearly pointing to the protective role of this mechanism againstpseudogenization).
Notably, the EC model predicts more efficient ‘‘escape’’ from pseudogen-
ization and more efficient functional expansion of multigene families in
organisms with small Ne, and methylated genomes. Our genome-wide
study confirmed the prediction (Rodin and Riggs, 2003). Another attribute
of the EC-based survival of extra gene copies is their repositioning in a
genome.
266 S. N. Rodin, A. S. Rodin

2.3 Repositioning Favors Survival of Duplicate Genes
The local chromatin environment (whether on the same or differentchromosomes) has a strong effect on gene expression (Brown et al., 2001;Cockell and Gasser, 1999). Therefore, translocations may, and do, changegene expression (Aladjem et al., 1998; Simon et al., 2001). Accordingly, wehypothesized that repositioning might play an important role in the evolutionof gene duplicates. Repositioning is of different importance for the DDC andEC models. It is essentially unnecessary for the DDC model, because twoindependent strongly deleterious mutations in different regulatory sites are allthat is needed for the extra gene copy to escape pseudogenization. In the ECmodel, survival is greater for those duplicates that move to a differentchromatin domain in the genome (Rodin and Riggs, 2003). As a baselineanalysis of the repositioning effect, we compared syntenic (located on thesame chromosome) and non-syntenic (located on different chromosomes)groups of gene pairs (Rodin and Parkhomchuk, 2004). Their evolutionarydynamics contrast strongly (Fig. 3b). About 90% of very young duplicates(synonymous substitutions per site, sps < 0.05) are syntenic. However, as thenumber of synonymous substitutions per site increases (‡0.05 sps), a steepdecline in the number of duplicates is observed. Non-syntenic duplicates showthe opposite trend; they rapidly grow in number with time, apparently at theexpense of syntenic counterparts. Remarkably, in the initial period (0 < sps <0.025) the ‘‘syntenic decrease’’ noticeably exceeds the ‘‘non-syntenic increase,’’suggesting that the large fraction of newly created (most likely tandem)duplicates perish if they stay at the same chromosome location, whereastranslocation to ectopic sites, often on a different chromosome, favors theirsurvival.
Computer simulation of random base substitutions in protein-encodinggenes showed that at � 0.1 sps the majority of human gene duplicates that aredestined to degenerate (pseudogenes-to-be) have already become identifiablepseudogenes, and accordingly have been removed from the database of intactgenes (Rodin and Parkhomchuk, 2004). By superposing the two genome-wideplots (Fig. 3a and b) we noticed that exactly at the point where the number ofpseudogenes-to-be runs short, the group of syntenic duplicate genes drops to itsminimum, whereas the group of non-syntenic duplicate genes reaches itsmaximum, and then both groups, presumably largely purged of pseudogenes,decline slowly (Fig. 3b) (Rodin et al., 2005a,b). Since such pseudogene-freepairs are predominantly non-syntenic (Fig. 3b, sps > 0.1), we conclude thatrepositioning to ectopic sites often saves duplicate genes from degradation andpromotes their functional divergence, probably through epigenetic develop-mental stage- and tissue-complementary silencing of their expression (Rodinand Riggs, 2003). Pairs of non-syntenic duplicates certainly belong to thiscategory, whereas the majority of pairs with a degrading ‘‘pseudogene-to-be’’are from the syntenic group.
Evolution by Gene Duplications 267
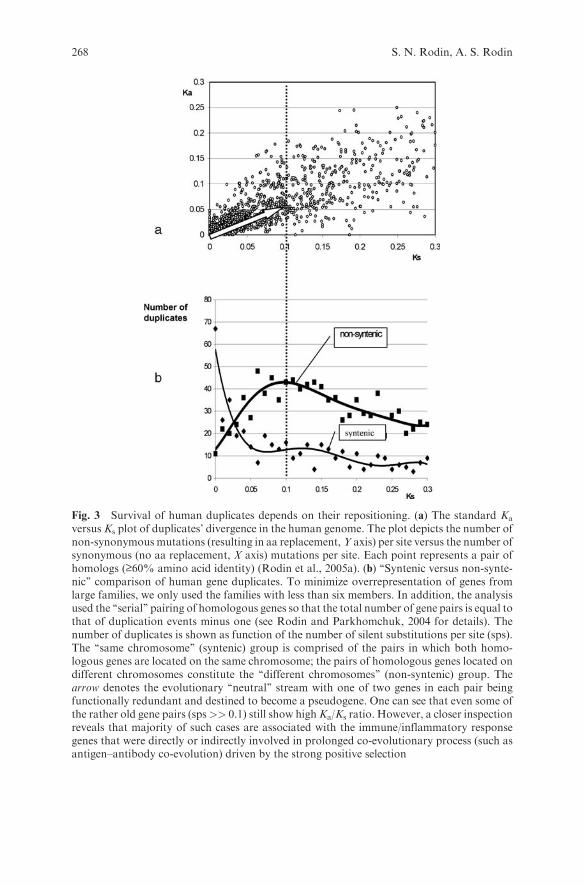
Fig. 3 Survival of human duplicates depends on their repositioning. (a) The standard Ka
versus Ks plot of duplicates’ divergence in the human genome. The plot depicts the number ofnon-synonymous mutations (resulting in aa replacement,Y axis) per site versus the number ofsynonymous (no aa replacement, X axis) mutations per site. Each point represents a pair ofhomologs (‡60% amino acid identity) (Rodin et al., 2005a). (b) ‘‘Syntenic versus non-synte-nic’’ comparison of human gene duplicates. To minimize overrepresentation of genes fromlarge families, we only used the families with less than six members. In addition, the analysisused the ‘‘serial’’ pairing of homologous genes so that the total number of gene pairs is equal tothat of duplication events minus one (see Rodin and Parkhomchuk, 2004 for details). Thenumber of duplicates is shown as function of the number of silent substitutions per site (sps).The ‘‘same chromosome’’ (syntenic) group is comprised of the pairs in which both homo-logous genes are located on the same chromosome; the pairs of homologous genes located ondifferent chromosomes constitute the ‘‘different chromosomes’’ (non-syntenic) group. Thearrow denotes the evolutionary ‘‘neutral’’ stream with one of two genes in each pair beingfunctionally redundant and destined to become a pseudogene. One can see that even some ofthe rather old gene pairs (sps>> 0.1) still show highKa/Ks ratio. However, a closer inspectionreveals that majority of such cases are associated with the immune/inflammatory responsegenes that were directly or indirectly involved in prolonged co-evolutionary process (such asantigen–antibody co-evolution) driven by the strong positive selection
268 S. N. Rodin, A. S. Rodin
2.4 Repositioning Increases Mutational Asymmetry
The new chromatin environment may also influence local mutability, at least
in the genomes that consist of isochores, long (>300 kb) segments of DNA
that differ in GC content (Bernardi, 2000). A relocated duplicate may
accumulate mutations that shift its GC content toward the GC content
surrounding its new location (Jabbari et al., 2003; Rodin and Parkhomchuk,
2004). Our genome-wide studies revealed such changes for different eukaryo-
tic species.Specifically (Fig. 4):
- Duplicate genes show significant asymmetry in their GC content.- For human and other mammalian genomes, this GC asymmetry correlateswith the relative GC content of the isochores in which the GC-asymmetricduplicates are located (Rodin and Parkhomchuk, 2004).
- Apparently, the GC asymmetry results from significant differences betweengene duplicates in the rate and direction of mutations (Fig. 4b).
Shown in Fig. 4 are mutation data for the third codon position, where
nucleotide substitutions are mostly silent and therefore reflect the duplicate-
asymmetric neutral mutational noise. We observed the same, but less
pronounced, asymmetries of gene duplicates for the first and second codon
positions. Increased mutation pressure on the re-positioned gene copy could
be a great help in that copy’s functional divergence from its parental twin:
it does not change the ratio of detrimental to advantageous mutations, but
essentially shortens the ‘‘waiting time’’ required for the acceptable non-silent
(quasi-neutral or, rarely, advantageous) mutations to occur. Very telling in this
regard is the difference between mammalian a- and b-globin gene clusters
(Rodin et al., 2005a):
- In the mammalian b-globin cluster, adult and fetal genes have beenaccumulating non-silent mutations significantly faster than embryonicgenes, whereas in the mammalian, avian and amphibian a-globin clustersadult genes and their embryonic paralogs evolved at approximately thesame speed.
- Also, silent mutations have been accumulating significantly faster in b- than ina-globin loci of mammals, thus pointing to a higher background mutability ofthe b genes ‘‘neighborhood.’’
These differences correlate with the fact that mammalian a- and b-globingene clusters are non-syntenic, and have contrasting subnuclear environments
(GC content, CpG islands, methylation levels, replication timing and
interphase positioning). Accordingly, the a locus is expressed in many tissues
(like housekeeping genes) whereas the b locus is expressed solely in erythroid
cells (Brown et al., 2001).
Evolution by Gene Duplications 269

2.5 Adaptive Evolution of Young Duplicates
It is very difficult to directly observe positive selection at work on the extra
gene copy. First, the period when the copy evolves in an adaptive manner
(when Ka/Ks >> 1) is very short (Fay and Wu, 2001, 2003). Second, advanta-
geous mutations are rare—they emerge only in very few key sites, whereas
silent mutations originate across the entire duplicated gene, almost in each
codon (Conant and Wagner, 2003; Ophir et al., 1999). As a consequence, gene
pairs with Ka/Ks > 1 are very rare and are statistically indistinguishable from
Fig. 4 Mutational asymmetry of duplicate genes. (a) A fragment of aligned human a1 and�2 actin genes with seven ‘‘silent’’ nucleotide differences, six of which occur at CpGdinucleotides (shown in bold). Below are the ‘‘gene-total’’ ratios of silent to non-silenttransitions and transversions that presumably occurred in the a1 and �2 lineages. (b) Theasymmetry of gene duplicates in C!T transitions in human, mouse, nematode andmustard weed genomes. Shown are frequency distributions of deviations from expectedmean values of C$T transitions. Each point represents a frequency (Y-axis) of gene pairswith the corresponding ‘‘oddness’’ of pair-wise asymmetry measured in unit variance (X-axis). The duplicates with nucleotide identity > 80% were excluded since they mightcontain many still unrecognized pseudogenes (‘‘pseudogenes-to-be’’) (see Fig. 3a). Thesolid line shows the normal (Gaussian) distribution that is expected under the assumptionof equal substitution rates in gene duplicates. If a value is higher than expected, themutation rates are duplicate-asymmetric in the corresponding pairs. The inset tableshows the variance of this distribution in different eukaryotic species. From (Rodin andParkhomchuk, 2004)
270 S. N. Rodin, A. S. Rodin

Ka/Ks � 1 cases of neutral pairs. Third, the Ka and Ks components are usually
calculated for different sites that may vary greatly in mutability, even within
the same gene or its particular region. Finally, gene duplicates themselves
may differ in background mutation rate, with the difference being position-
dependent, especially when one of the duplicates translocates and experiences
a mutational pressure for alternative base composition. The fact that
evolutionary time measured in synonymous mutations runs differently in
different genomic locations calls for adopting the position-independent and
more selection-sensitive ratio of missense to same-sense base substitutions as
an unbiased indicator of natural selection.We have proposed an unbiased indicator that employs transitions (C!T and
G!A) and transversions (G!T and C!A) at CpG dinucleotides (Rodin and
Rodin, 2005; Rodin et al., 1998, 2002): these account for 30% of base substitu-
tions in mammals. The putative primary mutational events for both
CpG!TpG and CpG!CpA transitions are most likely the same (specifically,
deamination of methylated Cs), but occur on opposite DNA strands (Rideout
et al., 1990; Yang et al., 1996). CpG is a strand-symmetric palindrome.
However, if mC deamination occurs on the sense (non-transcribed) strand, it
generates a CpG!TpG transition, whereas the same deamination event on the
antisense (transcribed) strand requires replication to appear in the sense strand
as a complementary CpG!CpA transition (Fig. 5a).Similarly, two transversions at CpG dinucleotides, G!T and C!A, seem to
have the same primary lesion at the guanines residues, suggesting that the G!T
transversion originates directly in the coding (non-transcribed) strand, while
C!A is the strand-complementary conversion of the G!T transversion that
originated in the non-coding (transcribed) strand (Fig. 5b) (Rodin and Rodin,
2005; Rodin et al., 2002).Importantly, in both cases the complementary substitutions originate on the
opposite strands with equal probabilities, i.e., the substitutions themselves are
strand-symmetric, but, due to the genetic code, have extremely asymmetric
functional consequences. This asymmetry for transitions and transversions in
codons CCG (Pro) and CGG (Arg), respectively, which shows silent versus
strong non-silent mutations with major physical–chemical changes in charge,
size and hydrophobicity, is illustrated in Fig. 5.When tested for p53 tumor suppressor and some other disease-associated
genes, this indicator of selection provided the expected results. For example, the
ratio of C!T transitions over total transitions at CpG dinucleotides in codons
NCG and CGN (i.e., the ratio NC!T/(NC!T þ NG!A)) was 0.5 for p53
pseudogenes, in full agreement with the strand-independent transition rate in
the absence of selection. When selection acted, this ratio was strand-asym-
metric, 0.06–0.2 for purifying selection in evolution of functional p53 genes
and >>0.5 for the strong tumorigenic selection that favored non-transcribed
(coding) strand-biased loss-of-function mutations in p53 genes from human
cancers (Rodin et al., 1998, 2002).
Evolution by Gene Duplications 271

As a natural control, one can use common CpG sites that cover two neigh-boring codons (i.e., NNCpGNN) and that produce the non-silent G!A versusthe silent C!T, thus mirroring the non-silent C!T and silent G!A in codonsNCG. Four putative silent C!T transitions at such CpG sites in the line leadingto the human �2 actin gene serve a good example (Fig. 4a).
The rationale for using the CpG-focused metric of selection in genomicanalyses of gene duplicates is that a translocated duplicate gene might beunder relatively strong mutational pressure in its new location (Fig. 4). At thesame time, according to the EC model, in order to escape pseudogenization theduplicate needs to change its expression pattern and come under the control of
Fig. 5 Strand-specific origin of transitions (a) and transversions (b) at methylated CpGmutagenic sites. Shown are two strand-mirror CpG dinucleotides located in the coding(‘‘sense’’) non-transcribed strand (NTS) and non-coding (‘‘antisense’’) transcribed strand(TS) of DNA, respectively. The mutagenic sites are shown in bold. C!T transitions resultfrom deamination of methylated cytosines in the NTS; same changes in TS result in G!Atransitions. G!T transitions are assumed to result from oxidation, polycyclic aromatichydrocarbons adducts and other changes of guanines in the NTS; same changes in TS resultin C!A transversions. Two CG-containing codons, CCG (Pro) and CGG (Arg), exemplifythe genetic code-based functional strand asymmetry of these substitutions. Non-silent muta-tions are shown in bold, and ‘‘quantified’’ by Dm values (based on changes in charge, size andhydrophobicity of amino acids (Miyata et al., 1979)). Silent mutations have Dm = 0. Forstrand-asymmetric Dm values in all other CG-containing codons, see Rodin et al. (2005a)
272 S. N. Rodin, A. S. Rodin

selection as soon as possible. Therefore, the repositioning of a gene duplicateaffects both its mutability and survival (Figs. 3 and 4). Additional study isrequired to estimate the relative contributions of the primary mutagenesis andsubsequent selection to the dynamics (such as shown in Fig. 3); mutationallystrand-symmetric/selectionally strand-asymmetric CpG-based criteria will behelpful in achieving this goal.
Adaptation to a new genomic environment might require advantageousmutations. However, compared to silent substitutions, advantageous substitu-tions are rare and, consequently, the repositioned duplicate might show asignificantly smaller Ka/Ks value than its parental gene at the old location,thus obscuring any positive selection activity. When we calculate Ka and Ks
for only the NCG and neighboring NNC andGNN codons, instead of calculat-ing them for entire gene sequences, we are guaranteed the same initial mut-ability for the silent and non-silent mutations that are under comparison. Thisleads to the more reliable interpretation of the Ka/Ks ratio in terms of thedominating evolutionary mode, i.e., whether the corresponding stage of theduplicate’s divergence was driven by selection (positive or negative) or neutralrandom drift.
Finally, an additional code-based opportunity is associated with the pair ofcomplementary CpG transversions G!T and C!A in Arg codons (CGA andCGG); C!A is silent, whereas its complementary counterpart G!T producesCTA and CTG that encode Leu, which is functionally very different from Arg.We expect these two specific codons to be particularly useful in genome-widestudies of duplicate genes encoding transcription factors since the most impor-tant domains of transcription factors directly interact with DNA targets and,accordingly, are rich in positively charged amino acids such as Arg and Lys.Five mutationally ‘‘hot’’ Arg codons in the DNA-binding domain of the p53tumor suppressor gene serve as a representative, and practically very important,example (Rodin and Rodin, 2005).
2.6 EC Model and G-Value Paradox
Gene duplicates in the human genome appear to be more mutationallyasymmetric than those in any other genomes tested so far (Fig. 4), undoubtedlydue to the depletion of methylated CpG dinucleotides. Methylation is also ofgrowing interest as a marker for the epigenetic processes that likely assist withthe neo-functionalization of extra gene copies.
However, the human genome has only about 30,000 genes in total. Thisseems unimpressive compared, for example, with the 17,000 genes of thenematode genome. This lack of linear proportionality between the organismcomplexity and the total number of genes is known as aG-value paradox (Hahnand Wray, 2002). Organism complexity does correlate with the tissue- andstage-associated diversity of expression patterns, which in turn depends on
Evolution by Gene Duplications 273

the number of genes encoding transcription factors and co-factors, and thenumber of their DNA targets—promoters, enhancers, silencers, etc. (Levineand Tjian, 2003). However, this does not resolve the paradox; instead, it simplyre-targets it from the genes per se to their regulatory regions. We posit thatduring the initial phase local epigenetically contrasting chromatin domainscould have provided a ‘‘launching platform’’ of sorts for evolution by geneduplication (Rodin et al., 2005b). To create genes with novel functions,evolution, perhaps more often than not, experiments with already existinggenes and regulatory elements by moving their duplicates (or sometimes evensingle genes themselves) to new locations in the genome and changing theirtissues and stages of expression, instead of creating a truly novel gene throughthe gradual accumulation of rare advantageous mutations that change the oldgene’s function (Rodin et al., 2005b). If the repositioned gene or element has apositive effect, the repositioned duplicate will be further modified by perhaps nomore than a very few adaptive mutations, to better suit the functional demandsof its new environment. Further genome-wide analyses are needed to examinethis hypothesis in detail.
Acknowledgment: The authors thank Paul Schimmel, Eors Szathmary, Arthur Riggs, GeraldHolmquist and Dmitry Parkhomchuk for valuable suggestions.
References
Aladjem,M.I., Rodewald, L.W., Kolman, J.L. andWahl, G.M. (1998) Genetic dissection of amammalian replicator in the human beta-globin locus. Science 281, 1005–1009.
Bernardi, G. (2000) Isochores and the evolutionary genomics of vertebrates. Gene 241, 3–17.Brown, K.E., Amoils, S., Horn, J.M., Buckle, V.J. and Higgs, D.R. (2001) Expression of a-
and b-globin genes occurs within different nuclear domains in haemopoetic cells. NatureCell Biol. 3, 602–606.
Caporaso, J.G., Yarus, M. and Knight, R. (2005) Error minimization and coding triplet/binding site associations are independent features of the canonical genetic code. J. Mol.Evol. 61, 597–607.
Carter, C.W., Jr. and Duax, W.L. (2002) Did tRNA synthetase classes arise on oppositestrands of the same gene? Mol. Cell 10, 705–708.
Cockell, M. and Gasser, S.M. (1999) Nuclear compartments and gene regulation. Curr. Opin.Genet. Dev. 9, 199–205.
Conant, G.C. and Wagner, A. (2003) Asymmetric sequence divergence of duplicate genes.Genome Res. 13, 2052–2058.
Crick, F.H.C. (1968) The origin of the genetic code. J. Mol. Biol. 38, 367–380.De Duve, C. (1988) The second genetic code. Nature 333, 117–118.Di Giulio,M. (1992) On the origin of the transfer RNAmolecule. J. Theor. Biol. 159, 199–214.Eriani, G., Delarue, M., Poch, O., Gangloff, J. andMoras, D., (1990) Partition of aminoacyl-
tRNA synthetases into two classes based on mutually exclusive sets of conserved motifs.Nature 347, 203–206.
Fay, J.C. andWu, C-I. (2001) The neutral theory in the genomic era. Curr. Opin. Genet. Dev.11, 642–646.
274 S. N. Rodin, A. S. Rodin

Fay, J.C. and Wu, C-I. (2003) Sequence divergence, functional constraint, and selection inprotein evolution. Annu. Rev. Genomics Hum. Genet. 4, 213–235.
Force, A., Lynch,M., Pickett, B., Amores, A., Yan, Y-l. and Postlethwait, J. (1999) Preservationof duplicate genes by complementary, degenerative mutations. Genetics 151, 1531–1545.
Hahn, M.V. and Wray, G.A. (2002) The G-value paradox. Evol. Dev. 4, 73–75.Hou, Y.-M. and Schimmel, P. (1988) A simple structural feature is a major determinant of the
identity of a transfer RNA. Nature 333, 140–145.Jabbari, K., Rayko, E. and Bernardi, G. (2003) The major shifts of human duplicated genes.
Gene 317, 203–208.Knight R.D., Freeland S.J. and Landweber L.F. (2001) Rewriting the keyboard: evolvability
of the genetic code. Nat. Rev. Genet. 2, 49–58.Kuhns, S.T. and Joyce, G.F. (2003) Perfectly complementary nucleic acid enzymes. J. Mol.
Evol. 56, 711–717.Levine,M.andTjian,R.(2003)Transcriptionregulationandanimaldiversity.Nature424,147–151.Lynch, M. and Conery, J.C. (2000) The evolutionary fate and consequences of duplicate
genes. Science 290, 1151–1155.Lynch, M., O’Hely, M., Walsh, B. and Force, A. (2001) The probability of preservation of a
newly arisen gene duplicate. Genetics 159, 1789–1804.Miller, S.L. (1987) Which organic compounds could have occurred on the prebiotic earth.
Cold Spring Harbor Symp. Quant. Biol. 52, 17–27.Miyata, T., Miyazawa, S. and Yasunaga, T. (1979) Two types of amino acid substitutions in
protein evolution. J. Mol. Evol. 12, 219–236.Mounsey, A., Bauer, P. and Hope, I.A. (2002) Evidence suggesting that a fifth of annotated
Caenorhabditis elegans genes may be pseudogenes. Genome Res. 12, 770–775.Ohno, S. (1970) Evolution by Gene Duplication. Springer, Berlin.Ohno, S. (1987) Early genes that were oligomeric repeats generated a number of divergent
domains on their own. Proc. Natl Acad. Sci. USA 84, 6486–6490.Ohno, S. (1988) On periodicities governing the construction of genes and proteins. Anim.
Genet. 19, 305–316.Ohta, T. (1980) Evolution and Variation of Multigene Families. Springer, Berlin.Ophir, R., Itoh, T., Graur, D. and Gojobori, T. (1999) A simple method for estimating the
intensity of purifying selection in protein-coding genes. Mol. Biol. Evol. 16, 49–53.Pham, Y., Li, L., Kim, A., Erdogan, O., Weinreb, V., Butterfoss, G.L., Kuhlman, B. and
Carter, C.W. Jr. (2007) A minimal Trp RS catalytic domain supports sense/antisenseancestry of class I and II aminoacyl-tRNA synthetases. Mol. Cell 25, 851–862.
Rideout, W.M., III, Coetzee, G.A., Olumi, A.F. and Jones, P.A. (1990) 5-Methylcytosineas an endogenous mutagen in the human LDL receptor and p53 genes. Science 249,1288–1290.
Rodin, S. and Ohno, S. (1995) Two types of aminoacyl-tRNA synthetases could be originallyencoded by complementary strands of the same nucleic acid. Orig. Life Evol. Biosph. 25,565–589.
Rodin, S.N. and Ohno, S. (1997) Four primordial modes of tRNA-synthetaserecognition, determined by the (G,C) operational code. Proc. Natl Acad. Sci. USA94, 5183–5188.
Rodin, S.N. and Parkhomchuk, D.V. (2004) Position-associated GC asymmetry of geneduplicates. J. Mol. Evol. 59, 372–384.
Rodin, S.N. and Riggs, A.D. (2003) Epigenetic silencing may aid evolution by geneduplication. J. Mol. Evol. 56, 718–729.
Rodin, S.N. and Rodin, A.S. (1998) Strand asymmetry of CpG transitions as indicator of G1phase-dependent origin of multiple tumorigenic p53 mutations in stem cells. Proc. NatlAcad. Sci. USA 95, 11927–11932.
Rodin, S.N. and Rodin, A.S. (2005) Origins and selection of p53 mutations in lungcarcinogenesis. Semin. Cancer Biol. 15, 103–112.
Evolution by Gene Duplications 275

Rodin, S.N. and Rodin, A.S. (2006a) Origin of the genetic code: first aminoacyl-tRNAsynthetases could replace isofunctional ribozymes when only the second base of codonswas established. DNA Cell Biol. 25, 365–375.
Rodin, S.N. and Rodin, A.S. (2006b) Partitioning of aminoacyl-tRNA synthetases in twoclasses could have been encoded in a strand-symmetric RNA world. DNA Cell Biol. 25,617–626.
Rodin, S., Rodin, A. and Ohno, S. (1996) The presence of codon–anticodon pairs in theacceptor stem of tRNAs. Proc. Natl Acad. Sci. USA 93, 4537–3542.
Rodin, S.N., Holmquist, G.P. and Rodin, A.S. (1998) CpG transition strand asymmetry andhitch-hiking mutations as measures of tumorigenic selection in shaping the p53 mutationspectrum. Int. J. Mol. Med. 1, 191–199.
Rodin, S.N., Rodin, A.S., Juhasz, A. and Holmquist, G.P. (2002) Canceroushyper-mutagenesis in p53 genes is possibly associated with transcriptional bypass ofDNA lesions. Mutat. Res. 510, 153–168.
Rodin, S.N., Parkhomchuk, D.V., Rodin, A.S., Holmquist, G.P. and Riggs, A.D. (2005a)Repositioning-dependent fate of duplicate genes. DNA Cell Biol. 24, 529–542.
Rodin, S.N., Parkhomchuk, D.V. and Riggs, A. D. (2005b) Epigenetic changes andrepositioning determine the evolutionary fate of duplicated genes. Biochemistry (Moscow)70, 559–567.
Schimmel, P. and Beebe, K. (2006) Aminoacyl tRNA synthetases: from the RNAworld to thetheater of proteins. In: R.F. Gesteland, T.R. Cech and J.F. Atkins (Eds) The RNAWorld.Cold Spring Harbor Laboratory Press, New York, pp. 227–255.
Schimmel, P., Giege, R., Moras, D. and Yokoyama S. (1993) An operational RNA code foramino acids and possible relation to genetic code. Proc.Natl Acad. Sci. USA 90, 8763–8768.
Shimizu, M. (1982) Molecular basis for the genetic code. J. Mol. Evol. 18, 297–303.Simon, I., Tenzen, T., Mostoslavsky, R., Fibach, E., Lande, L., Milot, E., Gribnau, J.,
Grosveld, F., Fraser, P. and Cedar, H. (2001) Developmental regulation of DNA replica-tion timing at the human beta globin locus. EMBO J., 20, 6150–6157.
Sprinzl, M. and Vassilenko, K.S. (2005) Compilation of tRNA sequences and sequences oftRNA genes. Nucl. Acids Res. 1(33), D139–D140.
Szathmary, E. (1991) Codon swapping as a possible evolutionary mechanism. J. Mol. Evol.32, 178–182.
Szathmary, E. (1999) The origin of the genetic code: amino acids as cofactors in an RNAworld. Trends Genet. 15, 223–229.
Weiner, A.M. and Maizels, N. (1987) TRNA-like structures tag the 3’ ends of genomic RNAmolecules for replication: implications for the origin of protein synthesis. Proc. Natl Acad.Sci. USA 84, 7383–7387.
Weiner, A.M. and Maizels, N. (1999) The genomic tag hypothesis: modern viruses as mole-cular fossils of ancient strategies for genomic replication and clues regarding the origin ofprotein synthesis. Biol. Bull. 196, 327–330.
Weiss, K.M. and Buchanan, A.V. (2005) ‘‘The’’ genetic code? Evol. Anthropol. 14, 6–11.
Woese, C.R. (1965) On the evolution of the genetic code. Proc. Natl. Acad Sci. USA 54,1546–1552.
Yang, A.S., Jones, P.A., Shibata, A. (1996) The mutational burden of 5-methylcytosine. In:V.E.A. Russo, R.A. Martienssen, A.D. Riggs (Eds) Epigenetic Mechanisms of GeneRegulation. Cold Spring Harbor Laboratory Press, New York, pp. 77–94.
Yarus, M. (1998) Amino acids as RNA ligands: a direct-RNA-template theory for the code’sorigin. J. Mol. Evol. 47, 109–117.
Yarus, M., Caporaso, J.G. and Knight, R. (2005) Origins of the genetic code: the escapedtriplet theory. Annu. Rev. Biochem. 74, 125–151.
276 S. N. Rodin, A. S. Rodin
Evolution of the Translation Termination System
in Eukaryotes
G. A. Zhouravleva, O. V. Tarasov, V. V. Schepachev, S. E. Moskalenko,
N. I. Abramson and S. G. Inge-Vechtomov
Abstract Proteins eRF1 and eRF3 are key components of translation termina-
tion in eukaryotes. The highly conserved translation termination factor eRF1
decodes stop codons, while another eukaryotic release factor (RF) eRF3 sti-
mulates eRF1 in GTP-dependent manner. Functional C-terminal domain of
eRF3 is necessary for cell viability and reveals high degree of similarity between
all known eRF3 and elongation factor eEF1A. Unlike the C-terminal part, the
N-terminal region of eRF3 proteins is not conserved and contains ‘‘prion
forming domain’’ (PFD). In mammals, eRF3 homologous proteins can be
divided into two subfamilies based on the sequence of their N termini, GSPT1
(eRF3a) and GSPT2 (eRF3b). In our work we hypothesize that GSPT2 gene
originated through retrotransposition of processed GSPT1 transcript after
divergence between placental and marsupial mammals. Data obtained on the
order Rodentia indicate that nucleotide sequence encoding N-terminal part of
GSPT2 maybe used as a new marker for philogenetic analysis to distinguish
between families.
1 The Evolutionary Origin of Termination Factors
Protein synthesis is an essential process, highly conserved among different
organisms such as Eubacteria, Archaea and Eucarya. Termination of transla-
tion (recognition of stop codons and hydrolysis of peptidyl-tRNA) is also well
conserved among eukaryotes. Two types of translation termination factors,
G. A. ZhouravlevaDepartment of Genetics and Breeding, St. Petersburg State University, 199034,St. Petersburg, Russiae-mail: [email protected]
N. Dobretsov et al. (eds.), Biosphere Origin and Evolution.� Springer 2008
277
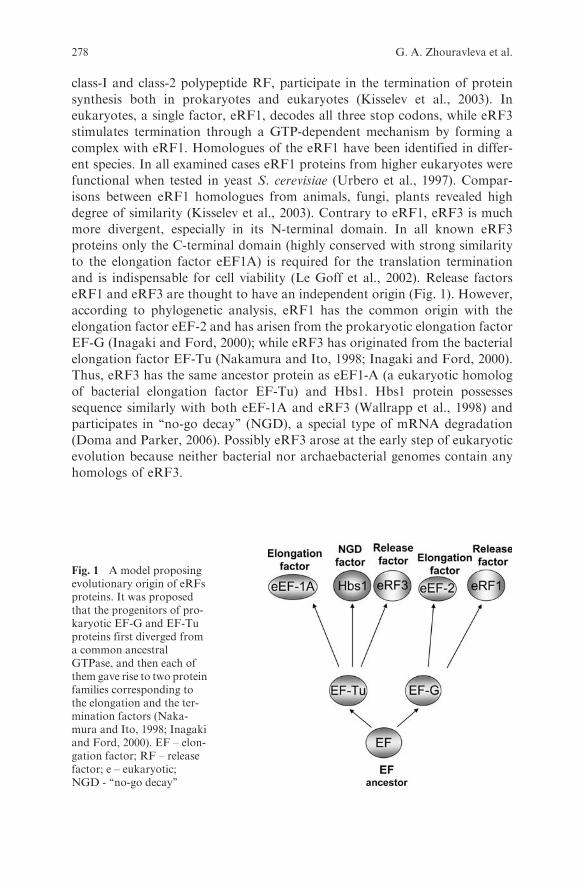
class-I and class-2 polypeptide RF, participate in the termination of protein
synthesis both in prokaryotes and eukaryotes (Kisselev et al., 2003). In
eukaryotes, a single factor, eRF1, decodes all three stop codons, while eRF3
stimulates termination through a GTP-dependent mechanism by forming a
complex with eRF1. Homologues of the eRF1 have been identified in differ-
ent species. In all examined cases eRF1 proteins from higher eukaryotes were
functional when tested in yeast S. cerevisiae (Urbero et al., 1997). Compar-
isons between eRF1 homologues from animals, fungi, plants revealed high
degree of similarity (Kisselev et al., 2003). Contrary to eRF1, eRF3 is much
more divergent, especially in its N-terminal domain. In all known eRF3
proteins only the C-terminal domain (highly conserved with strong similarity
to the elongation factor eEF1A) is required for the translation termination
and is indispensable for cell viability (Le Goff et al., 2002). Release factors
eRF1 and eRF3 are thought to have an independent origin (Fig. 1). However,
according to phylogenetic analysis, eRF1 has the common origin with the
elongation factor eEF-2 and has arisen from the prokaryotic elongation factor
EF-G (Inagaki and Ford, 2000); while eRF3 has originated from the bacterial
elongation factor EF-Tu (Nakamura and Ito, 1998; Inagaki and Ford, 2000).
Thus, eRF3 has the same ancestor protein as eEF1-A (a eukaryotic homolog
of bacterial elongation factor EF-Tu) and Hbs1. Hbs1 protein possesses
sequence similarly with both eEF-1A and eRF3 (Wallrapp et al., 1998) and
participates in ‘‘no-go decay’’ (NGD), a special type of mRNA degradation
(Doma and Parker, 2006). Possibly eRF3 arose at the early step of eukaryotic
evolution because neither bacterial nor archaebacterial genomes contain any
homologs of eRF3.
Fig. 1 A model proposingevolutionary origin of eRFsproteins. It was proposedthat the progenitors of pro-karyotic EF-G and EF-Tuproteins first diverged froma common ancestralGTPase, and then each ofthem gave rise to two proteinfamilies corresponding tothe elongation and the ter-mination factors (Naka-mura and Ito, 1998; Inagakiand Ford, 2000). EF – elon-gation factor; RF – releasefactor; e – eukaryotic;NGD - ‘‘no-go decay’’
278 G. A. Zhouravleva et al.

2 The Structural Organization of Termination Factor eRF3
In mammals eRF3s are represented by two related proteins, GSPT1 (eRF3a)
and GSPT2 (eRF3b), each encoded by a distinct gene, GSPT1 and GSPT2,
respectively (Fig. 2). Homologous genes were found in rat, dog, elephant and
cow genomes. Only one eRF3-homologous gene was discovered in each of
full sequenced genomes of Gallus gallus, Caenorhabditis elegans and Droso-
phila melanogaster. As in fungi, the eRF3-C region remains greatly conserved
from yeast to human, while the eRF3-N regions exhibit high degree of
divergence.All eukaryotic eRF3 proteins studied so far (exceptG. lamblia) (Inagaki et al.,
2002) have long N-proximal extension with unknown functions. In several
species of fungi, closely related to S. cerevisiae, this domain is responsible for
[PSIþ] prion induction and propagation, however it seems that prionization
ability of eRF3 is highly restricted to budding yeast (reviewed in Zhouravleva
Fig. 2 Organization and evolutionary relationships of eRF3s of different species. a. Transla-tion termination factor eRF3 consists of three domains, N, M and C. Percentage of identitybetween different domains of eRF3a Homo sapiens and eRF3 of S. cerevisiae is shown.Numbers on the right correspond to the size of eRF3 proteins. b. Duplication of eRF3-encoding genes, GSPT1 andGSPT2, during evolution. (???)—time of duplication is unknown
Evolution of the Translation Termination System in Eukaryotes 279

et al., 2002). It was also shown that some sub-regions of N-terminal domain
participate in interaction with such proteins as Pab1, Sla1, IAPs (reviewed in
Inge-Vechtomov et al., 2003), nevertheless the role of most part of theN-domain
remains unknown.The most intriguing property of eRF3 N-terminal domain is its unusual
amino acid composition. N-terminal part of S. cerevisiae eRF3 contains a so
called ‘‘prion forming domain’’ (PFD) with two sub-regions which influence the
prion propagation: QN-rich stretch (aa 6-33), and OR, region of oligopeptide
repeats (aa 41-97) (Fig. 3). The presence of G-rich oligopeptide repeats (con-
sensus sequence PQGGYQQ-YN), which are similar to those found at approxi-
mately the same position in mammalian PrP (consensus sequence
PHGGGWGQ), is one of the most puzzling features of the eRF3 PFD. It is
rich in Q andN residues (45%, compared to 10% for the average yeast protein),
and also in G and Y residues (33%, compared to 8% average in the yeast
proteome). Capability of forming prions has not been proven as yet for eRF3
homologues from species other than budding yeast. The eRF3-N region of a
distant relative of budding yeast, the fission yeast Shizosaccharomyces pombe,
does not contain QN andOR regions and exhibits very low amino acid sequence
homology (18% identity) with the corresponding domain of S. cerevisiae, while
the eRF3-C region remains highly conserved (64% identity) However, another
distantly related species, Podospora anserina, contains the N-proximal region
Fig. 3 N-terminal domain of eRF3 is not conserved in evolution. SOPMmethodwas used forthe secondary structure prediction (Geourjon and Deleage, 1994, see http://npsa-pbil.ibcp.fr/cgi-bin). Alpha helix: h; extended strand: e; random coil: c; beta turn: t. mGSPT1 andmGSPT2: eRF3a and eRF3b from Mus musculus, respectively; xSup35 and ySup35: eRF3from X. laevis and S. cerevisiae, respectively
280 G. A. Zhouravleva et al.

resembling that of budding yeast by a high content of Q/N residues (40%) andthe presence of at least four repeats with a consensus sequence QQGQGYG(Zhouravleva et al., 2002).
While the N-terminal domains of higher eukaryotes eRF3 proteins show noobvious sequence similarity to the corresponding domains of lower eukaryotes,they still exhibit an unusual aa composition. For example, N-domain ofmGSPT1 (mouse eRF3a) contains high percentage of P, S and G residues (10,15 and 20%, respectively). Instead of the QN-stretch and oligopeptide repeatsfound in yeast eRF3-N regions, mGSPT1 and hGSPT1 (human eRF3a) pro-teins contain long poly-G tracts, similar to those observed in the so-called‘‘homopeptide proteins’’ (Karlin and Burge, 1996). Homopeptides, or SSR(single sequence repeats) are regions within proteins that comprise a singlehomopolymeric tract of a particular amino acid (Faux et al., 2005). Mosteukaryote RCPs (repeat-containing proteins) are involved in transcription/translation or interact directly with DNA, RNA or chromatin (Faux et al.,2005). It was shown that uncontrolled genetic expansions of SSR regions lead tothe development of some neurodegenerative disorders, such as, for example,Huntington’s disease in the case of expanded poly-Q tract. It was also demon-strated that many SSRs are toxic to cells and/or lead to protein aggregation ormisfolding (Fandrich and Dobson, 2002). Interestingly, both human, rat andmouse GSPT1s contain homopeptide sequences of poly-G and of poly-S tracts(Fig. 4). Moreover, G11 in hGSPT1 is encoded from (GGC)10 (GGG)1 showingno variation in codon usage. The peptide S7 of hGSPT1 protein immediatelydownstream of G11 is encoded from (AGC)3 (GGC) (AGC)4. Thus, the differ-ence in the length of homopeptide sequences between hGSPT1 and mGSPT1can be explained by expansion of trinucleotides GGC and AGC.
Fig. 4 Localization of GGC- and AGC-repeats in sequences encoding N-terminal parts ofH. sapiens and Mus musculus eRF3 proteins. G11, G12, S7 and S5—homopeptide repeats.Continuous arrows—repeats of the same codon GGC or AGC, dotted arrows—codonsdifferent from GGC or AGC
Evolution of the Translation Termination System in Eukaryotes 281

Regardless of the low level of amino acid identity among N-domains ofmGSPT1 with mGSPT2 and Xenopus eRF3 proteins (49 and 11%, respec-tively) they show similar secondary structure with �-helixes in the samepositions (Fig. 3). This indicates that the mammalian mGSPT1 and hGSPT1N-proximal regions may also exist in highly flexible or partially unfoldedconformations. Taken together, these data show that all eRF3 homologuesexhibit an unusual aa composition of their N-proximal regions, pointing to apossibility of their high structural flexibility, the property potentially related tothe capability to undergo prion-like switches.
3 Evolution of Genes Encoding for eRF3
Only one of mammalian paralogues, GSPT2 is intronless and expressed only inmouse brain (Hoshino et al., 1998). Its expression is not detected in any ofhuman cell lines (Chauvin et al., 2005). In contrast, allGSPT1 genes are intron-containing and ubiquitously expressed.We have proposed that theGSPT2 geneis a functional retrogene, or intronless paralogue of GSPT1 (which contains 15exons) that has arisen as a result of retrotransposition of processed GSPT1’stranscript into the genome (Zhouravleva et al., 2006) (Fig. 5). CAGE analysis(http://fantom.gsc.riken.jp) suggests dual promoter activity of GSPT1 genethat in its turn indicates the presence of cryptic promoter in 50 region ofmRNA GSPT1.
We have estimated the divergence time for GSPT1 and GSPT2 genes ofhuman and mouse using QDate algorithm (Rambaut and Bromham, 1998).The obtained time is 119 � 15 million years. We hypothesize that the duplica-tion event took place after the divergence between placental and marsupialmammals, which is proposed to have happened from 160 to 135 Mya (Arnason
Fig. 5 GSPT2 is a retrogene, which arose by retroposition of mRNA GSPT1. GSPT2 arisesfrom mRNA transcript of GSPT that is reverse transcribed and re-integrated in chromosomeX. Only four exons of 15 exons in GSPT1 are shown for simplicity. 50UTR—50 untranslatedregion, CP—cryptic promoter, AAAAA—polyadenine sequence
282 G. A. Zhouravleva et al.
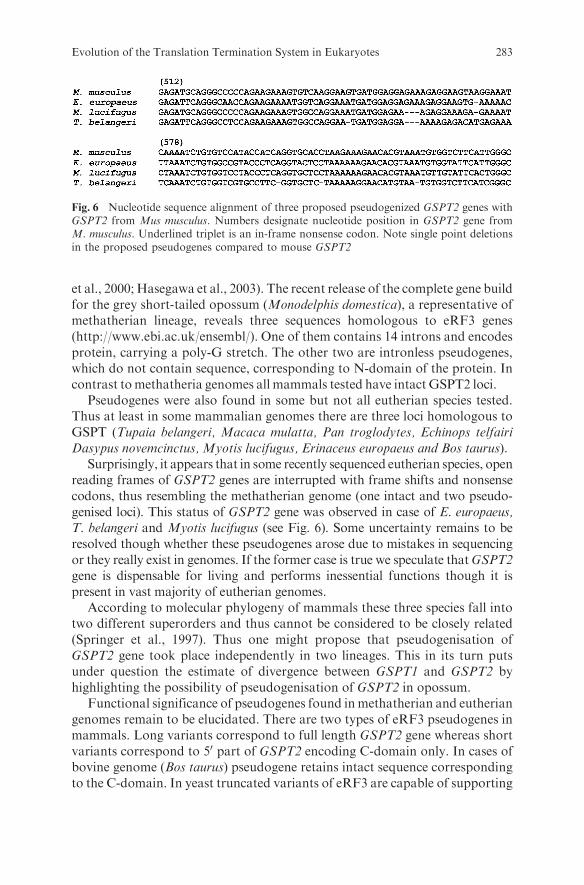
et al., 2000; Hasegawa et al., 2003). The recent release of the complete gene buildfor the grey short-tailed opossum (Monodelphis domestica), a representative ofmethatherian lineage, reveals three sequences homologous to eRF3 genes(http://www.ebi.ac.uk/ensembl/). One of them contains 14 introns and encodesprotein, carrying a poly-G stretch. The other two are intronless pseudogenes,which do not contain sequence, corresponding to N-domain of the protein. Incontrast tomethatheria genomes all mammals tested have intact GSPT2 loci.
Pseudogenes were also found in some but not all eutherian species tested.Thus at least in some mammalian genomes there are three loci homologous toGSPT (Tupaia belangeri, Macaca mulatta, Pan troglodytes, Echinops telfairiDasypus novemcinctus, Myotis lucifugus, Erinaceus europaeus and Bos taurus).
Surprisingly, it appears that in some recently sequenced eutherian species, openreading frames of GSPT2 genes are interrupted with frame shifts and nonsensecodons, thus resembling the methatherian genome (one intact and two pseudo-genised loci). This status of GSPT2 gene was observed in case of E. europaeus,T. belangeri and Myotis lucifugus (see Fig. 6). Some uncertainty remains to beresolved though whether these pseudogenes arose due to mistakes in sequencingor they really exist in genomes. If the former case is true we speculate thatGSPT2gene is dispensable for living and performs inessential functions though it ispresent in vast majority of eutherian genomes.
According to molecular phylogeny of mammals these three species fall intotwo different superorders and thus cannot be considered to be closely related(Springer et al., 1997). Thus one might propose that pseudogenisation ofGSPT2 gene took place independently in two lineages. This in its turn putsunder question the estimate of divergence between GSPT1 and GSPT2 byhighlighting the possibility of pseudogenisation of GSPT2 in opossum.
Functional significance of pseudogenes found inmethatherian and eutheriangenomes remain to be elucidated. There are two types of eRF3 pseudogenes inmammals. Long variants correspond to full length GSPT2 gene whereas shortvariants correspond to 50 part of GSPT2 encoding C-domain only. In cases ofbovine genome (Bos taurus) pseudogene retains intact sequence correspondingto the C-domain. In yeast truncated variants of eRF3 are capable of supporting
Fig. 6 Nucleotide sequence alignment of three proposed pseudogenized GSPT2 genes withGSPT2 from Mus musculus. Numbers designate nucleotide position in GSPT2 gene fromM. musculus. Underlined triplet is an in-frame nonsense codon. Note single point deletionsin the proposed pseudogenes compared to mouse GSPT2
Evolution of the Translation Termination System in Eukaryotes 283

viability. Shortened variants of eRF3 in mammals can still be implicated insome molecular processes. The appearance of pseudogene of GSPT2 in cowseems to have occurred relatively recently because it shares 97.9% identity innucleotide sequence with GSPT2.
4 GSPT2 as a New Phylogenetic Marker
Since 1980s, the comparative analysis of nucleotide sequences of different partsof genome (coding and noncoding regions of nuclear andmitochondrial DNA),in a broad sense—molecular markers, has become the most popular method inthe studies of phylogeny and systematics of various organisms. Today it ispractically impossible to imagine the further development in these fields with-out the application of molecular markers. Meanwhile, up to the present time,for most groups of animals only few molecular markers have been used for thestudy of phylogeny (most common were 18S RNA and different mtDNAgenes). Mammals are the group where the widest range of molecular markerswas applied for the study of phylogeny. But even within this well-studied groupthe markers for the phylogenetic study are selected most frequently in a randommanner, without any preliminary study of their evolution or variation. Theadequate choice ofmolecular marker in correspondence with taxonomic level ofthe group under study is a very problematic point to which attention is rarelypaid. The algorithms of a phylogenetic analysis independent of quality andnumber of data will anyway create some trees. The necessity of thoroughselection of a character or set of characters adequate to the taxonomic level ofthe group under study is well known to morphologists and classical system-aticians: it is impossible to use one and the same characters to the study ofphylogeny of taxa at different levels. There are only some general assumptionsfrom empirical data on the rate of variation of this or that marker proceedingfrom which they could be more reasonably used at the species, generic or otherlevel. In practice it is quite often that one and the same marker is used for theanalysis of several different taxonomic ranks. As a rule the choice of themolecular marker for the phylogenetic study is highly influenced by the dataon the rate of its evolution in other groups, by the convenience of their usageand by the presence of comparative material in the Genebank. However, if therate of evolution of molecular marker is slower than the times of speciation inthe group under study or a too small fragment is analyzed, then it is highlyprobable that the number of unique mutations (synapomorhies) will be insuffi-cient for the statistically robust tree. If the observed small variability isrestricted to the small number of sites then the probability of parallel andreciprocal changes (homoplasies) will highly increase. On the other hand ifmolecular marker evolves too fast in relation to the time of divergence of thegroup then the high level of homoplasies will be achieved due to the mutationalsaturation andwill result in severe bias on the obtained phylogenetic trees. Thusthe evolution and variation of the newmolecular markers should be studied. To
284 G. A. Zhouravleva et al.
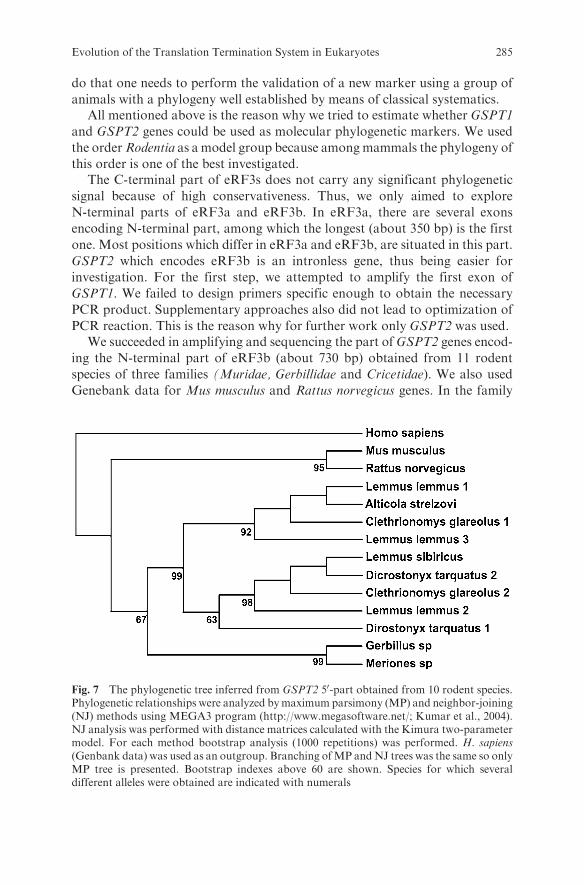
do that one needs to perform the validation of a new marker using a group of
animals with a phylogeny well established by means of classical systematics.All mentioned above is the reason why we tried to estimate whether GSPT1
and GSPT2 genes could be used as molecular phylogenetic markers. We used
the orderRodentia as a model group because amongmammals the phylogeny of
this order is one of the best investigated.The C-terminal part of eRF3s does not carry any significant phylogenetic
signal because of high conservativeness. Thus, we only aimed to explore
N-terminal parts of eRF3a and eRF3b. In eRF3a, there are several exons
encoding N-terminal part, among which the longest (about 350 bp) is the first
one. Most positions which differ in eRF3a and eRF3b, are situated in this part.
GSPT2 which encodes eRF3b is an intronless gene, thus being easier for
investigation. For the first step, we attempted to amplify the first exon of
GSPT1. We failed to design primers specific enough to obtain the necessary
PCR product. Supplementary approaches also did not lead to optimization of
PCR reaction. This is the reason why for further work only GSPT2 was used.We succeeded in amplifying and sequencing the part of GSPT2 genes encod-
ing the N-terminal part of eRF3b (about 730 bp) obtained from 11 rodent
species of three families (Muridae, Gerbillidae and Cricetidae). We also used
Genebank data for Mus musculus and Rattus norvegicus genes. In the family
Fig. 7 The phylogenetic tree inferred from GSPT2 50-part obtained from 10 rodent species.Phylogenetic relationships were analyzed bymaximum parsimony (MP) and neighbor-joining(NJ) methods using MEGA3 program (http://www.megasoftware.net/; Kumar et al., 2004).NJ analysis was performed with distance matrices calculated with the Kimura two-parametermodel. For each method bootstrap analysis (1000 repetitions) was performed. H. sapiens(Genbank data) was used as an outgroup. Branching ofMP andNJ trees was the same so onlyMP tree is presented. Bootstrap indexes above 60 are shown. Species for which severaldifferent alleles were obtained are indicated with numerals
Evolution of the Translation Termination System in Eukaryotes 285

Cricetidae (hamsters and voles), we had several sample species for some genera
and even several geographically distant samples for three species. Using these
data, we estimated the variability of those sequences at the level of species and
genera. We found out that there was no correlation between gene divergence
and species divergence in this family. Almost all the variability observed was a
result of a ‘‘switch’’ between the set of same substitutions in same positions. This
may be a case of ‘‘gene sorting’’ of alleles or paralogues inherited from the
common ancestor of all the family.Further analysis of the data indicates that the variability of the gene of our
interest may be enough to distinguish between families inside one order, though
this result is to be proven by enlarged set of data. In maximum parsimony and
neighbor joining trees four nodes with high bootstrap indexes can be found.
Three of them correspond to family divisions (families Muridae, Gerbillidae,
Cricetidae), while the fourth one is a subdivision inside Cricetidae described
above (Fig. 7). Thus the part of GSPT2 gene encoding the N-terminal part of
eRF3b is potentially useful molecular phylogenetic marker at family level.
Acknowledgment This work was supported by grant from the Russian Foundation for BasicResearch (07-04-00605), Lider Scientific Schools (7623.2006.4) and the program Origin andEvolution of the Biosphere of the Presidium of the Russian Academy of Sciences.
References
Arnason, U., Gullberg, A., Burguete, A.S. and Janke, A. (2000) Molecular estimates ofprimate divergences and new hypotheses for primate dispersal and the origin of modernhumans. Hereditas 133, 217–228.
Chauvin, C., Salhi, S., Le Goff, C., Viranaicken, W., Diop, D. and Jean-Jean, O. (2005)Involvement of human release factors eRF3a and eRF3b in translation termination andregulation of the termination complex formation. Mol. Cell Biol. 25, 5801–5811.
Doma, M.K. and Parker, R. (2006) Endonucleolytic cleavage of eukaryotic mRNAs withstalls in translation elongation. Nature 440, 561–564.
Fandrich,M. andDobson, C. (2002) The behaviour of polyamino acids reveals an inverse sidechain effect in amyloid structure formation. EMBO J. 21, 5682–5690.
Faux, N., Bottomley, S., Lesk, A., Irving, J., Morrison, J., de la Banda, M. andWhisstock, J.(2005) Functional insights from the distribution and role of homopeptiderepeat-containing proteins. Genome Res. 15, 537–551.
Geourjon, C. and Deleage, G. (1994) SOPM: a self-optimized method for protein secondarystructure prediction. Protein Eng. 7, 157–164.
Hasegawa, M., Thorne, J.L. and Kishino, H. (2003) Time scale of eutherian evolutionestimated without assuming a constant rate of molecular evolution. Genes Genet. Syst.78, 267–283.
Hoshino, S., Imai,M.,Mizutani,M., Kikuchi, Y., Hanaoka, F., Ui,M. andKatada, T. (1998)Molecular cloning of a novel member of the eukaryotic polypeptide chain-releasing factors(eRF). Its identification as eRF3 interacting with eRF1. J. Biol. Chem. 273, 22254–22259.
Inagaki, Y. and Ford, D.W. (2000) Evolution of the eukaryotic translation terminationsys-tem: origins of release factors. Mol. Biol. Evol. 17, 882–889.
286 G. A. Zhouravleva et al.

Inagaki, Y., Blouin, C., Doolittle, W. and Roger, A. (2002) Convergence and constraint ineukaryotic release factor 1 (eRF1) domain 1: the evolution of stop codon specificity.Nucleic Acids Res. 30, 532–544.
Inge-Vechtomov, S., Zhouravleva, G. and Philippe, M. (2003) Eukaryotic release factors(eRFs) history. Biol. Cell 95, 195–209.
Karlin, S. and Burge, C. (1996) Trinucleotide repeats and long homopeptides in genes andproteins associated with nervous system disease and development. Proc. Natl. Acad. Sci.USA 93, 1560–1565.
Kisselev, L., Ehrenberg, M. and Frolova, L. (2003) Termination of translation: interplay ofmRNA, rRNAs and release factors? EMBO J. 22, 175–182.
Kumar, S., Tamura, K. and Nei, M. (2004) MEGA3: Integrated software for molecularevolutionary genetics analysis and sequence alignment. Brief. Bioinf. 5, 150–163
Le Goff, C., Zemlyanko, O., Moskalenko, S., Berkova, N., Inge-Vechtomov, S., Philippe, M.and Zhouravleva, G. (2002)MouseGSPT2, but notGSPT1, can substitute for yeast eRF3in vivo. Genes Cells 7, 1043–1057.
Nakamura,Y. and Ito,K. (1998) How protein reads the stop codon and terminates transla-tion. Genes Cells 3, 265–278.
Rambaut, A. and Bromham, L. (1998) Estimating divergence dates from molecularsequences. Mol. Biol. Evol. 15, 442–448.
Springer, M.S., Cleven, G.C., Madsen, O., de Jong,W.W.,Waddell, V.G., Amrine, H.M. andStanhope, M.J. (1997) Endemic African mammals shake the phylogenetic tree. Nature388, 61–64.
Urbero, B., Eurwilaichitr, L., Stansfield, I., Tassan J-P., Le Goff, X., Kress, M. and Tuite, M.(1997) Expression of the release factor eRF1 (Sup45p) gene of higher eukaryotes in yeastand mammalian tissues. Biochimie 79, 27–36.
Wallrapp, C., Verrier, S., Zhouravleva, G., Philippe, H., Philippe, M., Gress, T. and Jean-Jean, O. (1998) The product of the mammalian orthologue of the Saccharomyces cerevisiaeHBS1 gene is phylogenetically related to eukaryotic release factor 3 (eRF3) but does notcarry eRF3-like activity. FEBS Lett. 440, 387–392.
Zhouravleva, G., Alenin, V., Inge-Vechtomov, S. and Chernoff, Y. (2002) To stick or not tostick: Prion domains from yeast to mammals. Recent Res. Develop. Mol. Cell. Biol. (3),185–219.
Zhouravleva, G., Schepachev, V., Petrova, A., Tarasov, O. and Inge-Vechtomov, S. (2006)Evolution of translation termination factor eRF3: is GSPT2 generated by retrotransposi-tion of GSPT1’s mRNA? IUBMB. Life 58, 199–202.
Evolution of the Translation Termination System in Eukaryotes 287
The Hedgehog Signaling Cascade System:
Evolution and Functional Dynamics
K. V. Gunbin, D. A. Afonnikov, L. V. Omelyanchuk, and N. A. Kolchanov
Abstract Here, the results we obtained in the analysis of the parametric robust-ness of the Hh signaling cascade and molecular gene evolution are compared.Emphasis is on the molecular evolution events that match the corresponding
divergence of the major Bilateria taxonomic types. It is demonstrated thatpositive selection is characteristic of the genes that encode proteins of theHh-cascade whose function is related to the molecular morphogenesis mechan-isms and matches with the divergence events of the Bilateria types. It was found
that the gene products of the Hh-cascade that are subject to positive selectiondefine the kinetic parameters whose change produces the greatest shift in thedynamics of the Hh-cascade. The evolutionary implications for the phenom-enon are discussed.
1 Introduction
The molecular-genetic mechanisms that control morphogenesis in the highereukaryotes pose thought-provoking problems. A large body of evidence hasbeen accumulated to treat their multifaceted aspects (Held, 2002; Rossant andTam, 2002). Breakthroughs came with increasing knowledge about genes con-
trolling cell differentiation, the patterning of developmental processes by someof them and also about the precise functions of the genes. Furthermore, thetransduction pathways have been determined for the Hh, Wnt, TGF-b, RTK,JAK/STAT, Notch signals and also for the nuclear receptors (Pires-daSilva andSommer, 2003). There loomed an impasse, with the experimental data see-
mingly incompatible and the systems appearing so intractable (Held, 2002;Rossant and Tam, 2002). Clearly, recourse had to be taken to novel high-throughput computer technologies and approaches to bring the data together
K. V. GunbinInstitute of Cytology and Genetics SB RAS, Novosibirsk, Russiae-mail: [email protected]
N. Dobretsov et al. (eds.), Biosphere Origin and Evolution.� Springer 2008
289

and to simulate computational events (Eppig et al., 2005; Grumbling et al.,
2006).The theoretical studies of eukaryote morphogenesis currently tend to
(1) build and analyze numerical models of morphogenesis, and (2) make feasible
comparative and/or evolutionary analyses of genes controlling morphogenesis.
Mathematical modeling is usually of three steps, including building of a model,
identification of its parameters and analysis of its behavior in terms of the
model robustness. When intricate molecular-genetic systems with their multiple
kinetic parameters are simulated, insights are gained into how the systems
function so that, importantly, the system responses to changes in kinetic para-
meters can be estimated and the classification of kinetic parameters can bemade
(de Jong, 2002). Researchers are usually interested in those molecular-genetic
system parameters whose small changes cause a strong response in the system’s
function (the hyper-responsive parameters) and, conversely, parameters whose
significant changes cause no significant changes in the molecular-genetic system
response (the inert parameters; Dillon et al., 2003; Eldar et al., 2002; Lai et al.,
2004). Genes that define the hyper-responsive parameters are of biological
interest. The morphogenetic process may prove to be very sensitive to impair-
ment or weak mutational changes in the function of these genes. This makes
their research timely and appropriate, particularly with reference to cancero-
genesis and/or formation of developmental abnormalities.It is pertinent to recall that analyses of the modes of molecular evolution of
these genes have disclosed their evolutionary features. As is well known, the
analyses were based on Kimura’s (1983) neutral evolution theory, according to
which genes or their regions accomplishing important functions due to negative
selection accumulated nonsynonymous substitutions slower than those under
smaller functional load. A part of the genes could most rapidly accumulate
nonsynonymous substitutions, thereby evolving in the positive selection mode
(Kimura, 1983). Thus, evolutionary analysis of the accumulation rates of
different types of nucleotide substitutions (synonymous and nonsynonymous)
made it possible to rank genes according to the degrees of their variability and
functional importance.Here we study the Hh signaling cascade (Lum and Beachy, 2004) and
compare the results we obtained using the model of the insect Hh-cascade
(Gunbin et al., 2007a) with those yielded by evolutionary analysis of the genes
involved in the functioning of the cascade (Gunbin et al., 2007b). The Hh-
cascade is involved in numerous morphogenetic processes, being one of the
most amply studied (Lum and Beachy, 2004; Nybakken and Perrimon, 2002).
The structure of the gene network that controls the cascade has been described
(Gunbin et al., 2004). The set of families which participate in the cascade work is
the same in all Bilateria. It includes the Hh morphogene; the Hh morphogene
secretionmechanism (theDisp proteins); the cellular receptors Ptc and Smo; the
Cos2, PKA, Slmb, Su(Fu) and Fu proteins; the components of the high mole-
cular complex that transduces the Hh signal into the cell nucleus, the
290 K. V. Gunbin et al.

transcription factors Ci (Gli) that regulate the ptc gene expression (in verte-
brates and invertebrates) and the Gli expression (in vertebrates only).Taking into consideration the differences in the Hh-cascade for signal trans-
duction between vertebrates and invertebrates, we compared the parametric
robustness of the Hh-cascade model in invertebrates (Gunbin et al., 2007a) and
vertebrates (Lai et al., 2004). As a result, we identified a parameter set whosesmall changes cause a strong response in the model’s normal behavior and, in
this way, we identified a set of hyper-responsive genes of the Hh-cascade. The
analysis of the molecular evolution of genes of the Hh-cascade was successful in
that it allowed us to (1) identify the genes that at the divergence step of themajorBilateria types evolved in the positive selection mode and (2) demonstrate that
the genes are predominantly those we identified as hyper-responsive. Based on
the obtained results, we hypothesize that the hyper-responsive genes might have
served as evolutionary ‘‘internal reserves’’ for the compensatory changes during
the structural reorganization of the Hh signaling cascade.
2 Modeling of the Hedgehog Signaling Cascade
In the current study, we performed a comparative analysis of parametric
robustness of the vertebrate (Fig. 1a) and invertebrate (Fig. 1b) Hh-cascademodels. These models take into account the kinetic parameters obtained in
experimental research (Gunbin et al., 2007a; Lai et al., 2004). Lai and co-
authors have analyzed the robustness of the switchlike behavior of the verte-
brate Hh-cascade (Lai et al., 2004); their simulation has demonstrated that
bistable behavior of the Hh-system is consistent with the experimental data;furthermore, they have described the necessary and sufficient conditions for the
molecular Hh-system to adopt one of the alternate states.The dynamics of the invertebrate Hh-cascade has been studied in Gunbin et
al. (2007a). It has been found that the model of invertebrate Hh-cascade
behaves in a manner consistent with the experimental data (Gunbin et al.,2007a) and also the consequences of mutational changes in the various system
components were predicted (Gunbin et al., 2007a), but the invertebrate
Hh-cascade did not behave switchlike, consistent with the previous studies
(von Dassow and Odell, 2002; von Dassow et al., 2000).It should be noted that the above models of the Hh signaling cascade in
invertebrates (Gunbin et al., 2007a) and vertebrates (Lai et al., 2004) are
complementary in their common subnet for the Hh-cascade gene network
(Fig. 1). The model for the Hh-cascade in invertebrates offers a more detailed
description of the processes that mediate Hh signal transduction within the cell.
This enables to study the features of the kinetics of the processes. Also, themodel of vertebrate Hh-cascade contains a subnet of the Hh-cascade gene
network specific to vertebrates and allows to take into account the crucial
The Hedgehog Signaling Cascade System 291
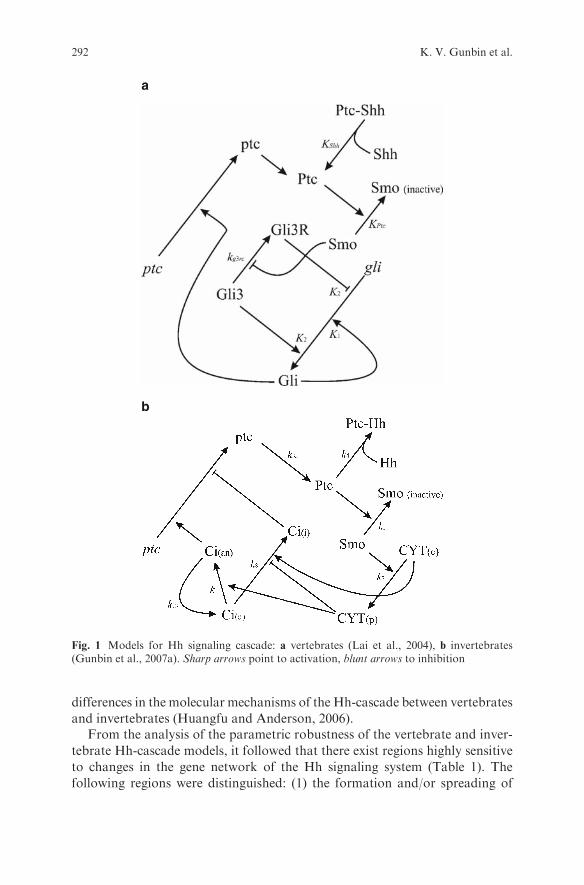
differences in the molecular mechanisms of the Hh-cascade between vertebrates
and invertebrates (Huangfu and Anderson, 2006).From the analysis of the parametric robustness of the vertebrate and inver-
tebrate Hh-cascade models, it followed that there exist regions highly sensitive
to changes in the gene network of the Hh signaling system (Table 1). The
following regions were distinguished: (1) the formation and/or spreading of
a
b
Fig. 1 Models for Hh signaling cascade: a vertebrates (Lai et al., 2004), b invertebrates(Gunbin et al., 2007a). Sharp arrows point to activation, blunt arrows to inhibition
292 K. V. Gunbin et al.
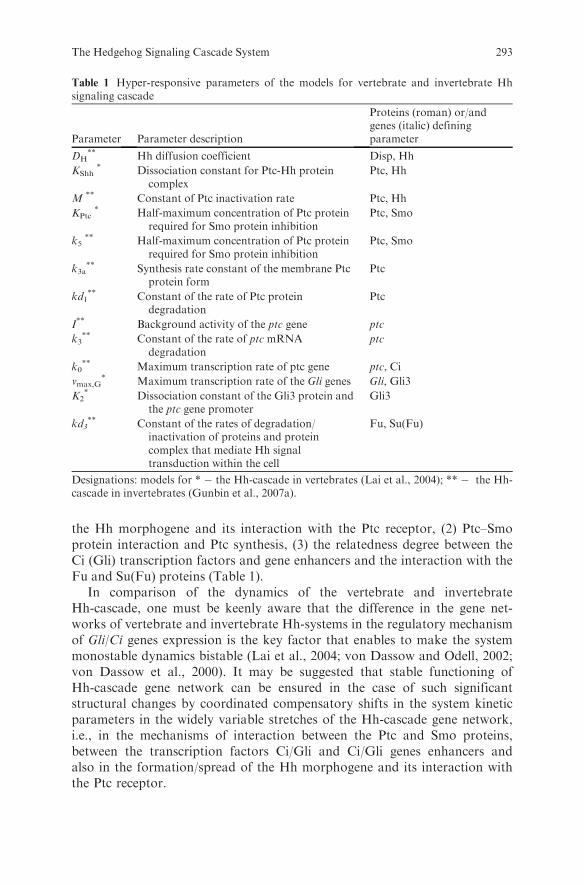
the Hh morphogene and its interaction with the Ptc receptor, (2) Ptc–Smoprotein interaction and Ptc synthesis, (3) the relatedness degree between theCi (Gli) transcription factors and gene enhancers and the interaction with theFu and Su(Fu) proteins (Table 1).
In comparison of the dynamics of the vertebrate and invertebrateHh-cascade, one must be keenly aware that the difference in the gene net-works of vertebrate and invertebrate Hh-systems in the regulatory mechanismof Gli/Ci genes expression is the key factor that enables to make the systemmonostable dynamics bistable (Lai et al., 2004; von Dassow and Odell, 2002;von Dassow et al., 2000). It may be suggested that stable functioning ofHh-cascade gene network can be ensured in the case of such significantstructural changes by coordinated compensatory shifts in the system kineticparameters in the widely variable stretches of the Hh-cascade gene network,i.e., in the mechanisms of interaction between the Ptc and Smo proteins,between the transcription factors Ci/Gli and Ci/Gli genes enhancers andalso in the formation/spread of the Hh morphogene and its interaction withthe Ptc receptor.
Table 1 Hyper-responsive parameters of the models for vertebrate and invertebrate Hhsignaling cascade
Parameter Parameter description
Proteins (roman) or/andgenes (italic) definingparameter
DH** Hh diffusion coefficient Disp, Hh
KShh* Dissociation constant for Ptc-Hh protein
complexPtc, Hh
M ** Constant of Ptc inactivation rate Ptc, Hh
KPtc* Half-maximum concentration of Ptc protein
required for Smo protein inhibitionPtc, Smo
k5** Half-maximum concentration of Ptc protein
required for Smo protein inhibitionPtc, Smo
k3a** Synthesis rate constant of the membrane Ptc
protein formPtc
kd1** Constant of the rate of Ptc protein
degradationPtc
I** Background activity of the ptc gene ptc
k3** Constant of the rate of ptc mRNA
degradationptc
k0** Maximum transcription rate of ptc gene ptc, Ci
vmax,G* Maximum transcription rate of the Gli genes Gli, Gli3
K2* Dissociation constant of the Gli3 protein and
the ptc gene promoterGli3
kd3** Constant of the rates of degradation/
inactivation of proteins and proteincomplex that mediate Hh signaltransduction within the cell
Fu, Su(Fu)
Designations: models for * � the Hh-cascade in vertebrates (Lai et al., 2004); ** � the Hh-cascade in invertebrates (Gunbin et al., 2007a).
The Hedgehog Signaling Cascade System 293
3 Molecular Evolution of Hedgehog Signaling Cascade
The above-described comparative structural–functional analysis of the verte-brate and invertebrate Hh-cascade demonstrated that their topology underwentsignificant changes at the time when vertebrates diverged from invertebrates.
We analyzed single nucleotide substitutions in the families of genes encodingproteins, the participants of Hh-cascade (Hh, Ptc, Smo, Disp, PKA, Slmb,Su(Fu), Fuand Ci), to define the evolutionary mode of the genes at a particularstep of evolution. We proceeded on the assumption that during the evolution ofthe gene network, topology reorganized under selection impact to stabilize itsfunction, a part of the genes incorporated into the morphogenetic networkcould accumulate nonsynonymous substitutions that compensated structuralchanges to provide function (Gunbin et al., 2007b).
A result of the performed analysis was identification of the gene (protein)regions in the Hh-cascade genes subjected to positive selection (Table 2). Whenthe location of the gene regions subjected to positive selection and the functionalrole of the encoding protein domains were related, it proved that positiveselection mainly acts on proteins and their domains that are involved in pro-tein–protein interaction within the Hh signaling cascade and that these proteinsand their domains define the hyper-responsive parameters (Tables 1 and 2). Toillustrate, changes in the intein domain of the Hh protein and also the N-end ofthe Disp protein can affect the rate at which Hh morphogene forms and/orspreads (Table 1, the DH and KShh parameters). Regarding the ptc gene, selec-tion was found to be positive for the regions that determine interaction featuresbetween Hh and Ptc proteins (Table 1, the M,kd1 and KShh parameters). Selec-tion in the smo gene is positive in those regions that define the interaction withthe high molecular weight complex Fu/Cos2/Ci (Table 1, the k5 parameter). Theregions of the ptc and smo genes defining the interaction between the Ptc andSmo proteins also underwent positive selection (Table 1, the k5 and KPtc para-meters). In the su(fu) and fu genes, the regions define the interaction between theSu(Fu) and Fu proteins and also between them and the Ci protein. These regionsare subjected to positive selection, possibly due to the evolutionary changes intheHh signal transduction rate into the cell nucleus (Table 1, the kd3 parameter).Finally, in the ci gene and its Gli homologs, positive selection was observed forthe coding domain regions responsible for the retention of Ci (Gli) proteins inthe cytoplasm and for binding to the transcription cofactors (Table 1, the k0, K2
and vmax,G parameters)Analysis of the phylogenetic trees did not reveal positive selection on the
branches for the Ptc, PKA and Slmb genes (Gunbin et al., 2007b). The stagesthroughout which positive selection acted in theHh, Disp, Smo, Su(Fu), Fu andCi(Gli) genes corresponded to the stages of the divergence between invertebratesand vertebrates (Gunbin et al., 2007b). Thus, it may be reasonably inferred thatthe timescales when positive selection acted in the evolving Hh-cascade matchedwith the divergence steps of the major Bilateria groups: Ecdysozoa (Insecta,
294 K. V. Gunbin et al.
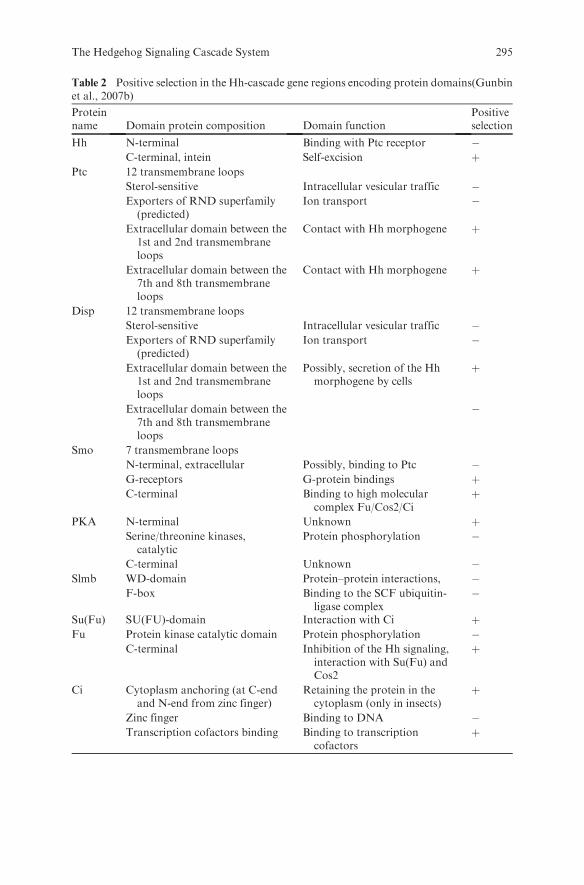
Table 2 Positive selection in the Hh-cascade gene regions encoding protein domains(Gunbinet al., 2007b)
Proteinname Domain protein composition Domain function
Positiveselection
Hh N-terminal Binding with Ptc receptor �C-terminal, intein Self-excision þ
Ptc 12 transmembrane loops
Sterol-sensitive Intracellular vesicular traffic �Exporters of RND superfamily
(predicted)Ion transport �
Extracellular domain between the1st and 2nd transmembraneloops
Contact with Hh morphogene þ
Extracellular domain between the7th and 8th transmembraneloops
Contact with Hh morphogene þ
Disp 12 transmembrane loops
Sterol-sensitive Intracellular vesicular traffic �Exporters of RND superfamily
(predicted)Ion transport �
Extracellular domain between the1st and 2nd transmembraneloops
Possibly, secretion of the Hhmorphogene by cells
þ
Extracellular domain between the7th and 8th transmembraneloops
�
Smo 7 transmembrane loops
N-terminal, extracellular Possibly, binding to Ptc �G-receptors G-protein bindings þC-terminal Binding to high molecular
complex Fu/Cos2/Ciþ
PKA N-terminal Unknown þSerine/threonine kinases,
catalyticProtein phosphorylation �
C-terminal Unknown �Slmb WD-domain Protein–protein interactions,
Binding to the SCF ubiquitin-ligase complex
�F-box �
Su(Fu) SU(FU)-domain Interaction with Ci þFu Protein kinase catalytic domain Protein phosphorylation �
C-terminal Inhibition of the Hh signaling,interaction with Su(Fu) andCos2
þ
Ci Cytoplasm anchoring (at C-endand N-end from zinc finger)
Retaining the protein in thecytoplasm (only in insects)
þ
Zinc finger Binding to DNA �Transcription cofactors binding Binding to transcription
cofactorsþ
The Hedgehog Signaling Cascade System 295

Crustacea), Lophotrochozoa (Mollusca, Annelida), Deuterostomia (Chordata,Echinodermata). This means that the evolutionary steps subjected to positiveselection and the emergence of large Bilateria taxa matched.
4 Comparison of the Evolution Mode of the Hh Signaling Cascade
Genes with Their Functional Load and Response Type
Summing up, based on analyses of (1) the parametric robustness ofmathematicalmodels for Hh-cascade in vertebrates and invertebrates, the hyper-responsiveparameters of the models and genes related to these parameters were identified;(2) the molecular evolution of the Hh-cascade genes, genes that underwentpositive selection soon, in evolutionary terms, after vertebrates and invertebrateshad diverged, were identified.
Table 3 compares the evolutionary mode of the Hh-cascade genes (proteins),their functional load and response type. From the tabulated data it followsthat, of the nine genes under study, five can be assigned to the hyper-responsivegenes and two to the potentially hyper-responsive genes (Table 3). It is ofinterest that all these genes belong to the developmental according to theirfunctions. Rank correlation analysis demonstrates that parametric robustnesscorrelates with gene function (r=1; p < 0.05). Another interesting feature, alsoshown in Table 3, is the consistency between the response type of a gene(hyper-response present) and the positive selection mode of the gene at thedivergence time of the major Bilateria groups. Of the seven hyper-responsivegenes, the evolutionary mode under positive selection was identified for six,and the positive selection mode was not identified for two not hyper-responsivegenes. Rank correlation analysis also demonstrates that gene evolutionarymode correlates with gene function (r=1; p < 0.05) and with parametricrobustness (r=0.75; p < 0.05).
Heterogeneity of parametric robustness and evolutionary liability of variousHh-cascade components may be, in the first approximation, related toprotein–protein interaction number and protein (gene) expression level.However, rank correlation analysis demonstrates that the estimates of geneevolutionary mode do not correlate with those of the number of protein–proteinassociations (r=0.07) and with the protein (gene) expression level (r=0.07).Rank correlation analysis also demonstrates that parametric robustnessestimates do not correlate with the number of protein–protein associations(r=0.45) and with gene expression level (r=0.45).
5 Discussion
The performed analysis concerned the parametric robustness of the models for theHh-cascade system and evolution of the system genes. Based on the analysis ofparametric robustness, thehyper-responsivegeneswere identified in theHh-cascade.
296 K. V. Gunbin et al.

Table3
Relationbetweengeneevolutionmodes,divergence
ofBilateriataxonomictypes,andhyper-responsivekineticparameters
Protein
(gene)
name
Kineticparameters
ofthemodels
correspondingto
protein
function
Network
response
correspondingto
changein
kinetic
parameters
Functional
protein
group
(D–Developmental;
H–Housekeeping)
Eventsofpositive
selectionsrelatedwith
divergence
of
taxonomicBilateria
types
Number
of
protein–protein
associations
(L–�
20;
S–�
15)
Gene(protein)
expressionlevel
(U–ubiquitous;
L–local)
Hh
DH**;KShh*
þ**, *
Dþ
LL
Ptc
kd1,M,k5**;KPtc*
þ**, *
D�
LL
Smo
k5**;KPtc*
þ**, *
Dþ
SU
Disp
DH**;KShh*
þ**, *
Dþ
–U
PKA
k8,k9,kd2**;kg3rc,
Kg3rc*
�**, *
H�
SU
Slm
bk8,k9,kd2**;kg3rc,
Kg3rc*
�**, *
H�
SU
Su(Fu)
k11,k12,kd3**
þ�
**
Dþ
SU
Fu
k11,k12,kd3**
þ�
**
Dþ
SU
Ci
k0**;v m
ax,G,K2*
þ**, *
Dþ
LL
Number
ofprotein–protein
associationsextracted
from
BioGRID
(Stark
etal.,2006).Gene(protein)expressionlevelextracted
from
FlyBase
(Crosby
etal.,2007).Designations:modelsfor*–theHh-cascadein
vertebrates(Laietal.,2004);**–theHh-cascadein
invertebrates(G
unbin
etal.,2007a);+
hyper-response
(positiveselection),–inertness(negativeselection),+
–interm
ediate
effect
The Hedgehog Signaling Cascade System 297

For the Hh-cascade developmental genes under positive selection, there were timespans thatmatchedwith thedivergence timebetween themajorgroupsofBilateria—Ecdysozoa and Deuterostomia. This was taken to mean that amino acid substitu-tions accumulated rapidly duringperiodswhen the structure ofHh-cascade changeddrastically. In contrast, positive selection is not a characteristic feature of the PKAandSlmbgenes that encodeproteins involved in interactionswith theother signalingpathways or the catalytic domains of the proteins under study. Possibly, thesecomponents canmanage and be tasked to performa continuous function to providethe vital activities of the cell; this explains why their evolution was in the negativeselection mode.
The question is ‘‘How structural changes possibly occurred in the Hh signal-ing cascade?’’ The greatest shifts in the dynamics of a functioning Hh-cascadewere brought about by change in the input portion of the Hh-cascade, the Hhmorphogene production by the cells (the Disp, Hh genes under study) and itsdiffusion (the DH, M (Gunbin et al., 2007a) and KShh (Lai et al., 2004) para-meters) and also change in the molecular-genetic system that senses the Hhmorphogene, i.e., change in its Ptc receptor (the M, kd1 (Gunbin et al., 2007a)and KShh (Lai et al., 2004) parameters). Thus, the positive selection in the Disp,Hh and Ptc proteins would provide profound reorganization of the Hh-cascadefunctioning by appropriate changes in the kinetics of the formation and diffu-sion of the Hh morphogene.
Changes in the proteins of the middle portion of the Hh-cascade might haveprovided important changes of rates and forces of cell responsiveness to the Hhmorphogene.Asknown, themainBilateriagroups (EcdysozoaandDeuterostomia)differ in the composition of proteins involved in the work of the middle portion ofthe Hh-cascade (the k5, kd3 (Gunbin et al., 2007a) and KPtc (Lai et al., 2004)parameters). For example, it is known that in Drosophila the N-end of the Smoprotein is required for Hh signal transduction, while a deletion in the region iswithout significant effect on thevertebrateHh-cascade (Nakanoet al., 2004).More-over, in invertebrates the Cos2 and Fu proteins form an important complex thatcontrols the penetration of the transcription factor Ci into the nucleus (Ascano andRobbins, 2004;Ruel et al., 2003), but the experimental data on theCos2necessity invertebrates are not straightforward (Tay et al., 2005).
Changes in the proteins of the output portion of the Hh-cascade couldprovide drastic changes in the cell response type (the passage from the contin-uous to switchlike response) to the Hh morphogene by modifying the type fortranscription regulation of the ci (gli) and ptc genes. Ecdysozoa and Deuter-ostomia differ fundamentally by the composition and function of the Ci(Gli)transcription factors (Huangfu and Anderson, 2006). In contrast to inverte-brates, vertebrates have three Gli (Gli1, Gli2 and Gli3) paralogs (Huangfu andAnderson, 2006). Moreover, Gli transcription factors activate the expression ofthe gli1 and gli2 genes, thereby forming a regulatory positive feedback loopmissing in invertebrates (the k0 (Gunbin et al., 2007a), vmax,G and K2 (Lai et al.,2004) parameters; Dai et al., 1999; Huangfu and Anderson, 2006). Thus,vertebrates possess additional feedback circuits that set a definite expression
298 K. V. Gunbin et al.

level for the effector genes of Hh-cascade. The presence of paralog groups of the
transcription factors Gli in vertebrates broadens the repertoire of genes whose
expression can regulate the Hh-cascade, thereby giving more opportunities for
getting specific response of various tissues to the same morphogene (Huangfu
and Anderson, 2006).The results of the current comparative analysis of the evolution of proteins
and their domains in the Hh signaling cascade in the Bilateria, in conjunction
with that of the dynamics of theHh-cascade function, are highly suggestive. The
drastic changes in the Hh-cascade occurred at the time when the main
taxonomic groups of the Bilateria Ecdysozoa (Insecta, Crustacea) and
Deuterostomia (Chordata, Echinodermata) might have diverged.
6 Conclusions
The results of the current analysis are dual. To begin with, the twomathematical
models for the Hh signaling cascade and their numerical representation revealed
that among the participant genes in the cascade a set of hyper-responsive genes
that define the model parameters is distinguishable. Small changes in
hyper-responsible parameters produce significant changes in the dynamics of
the function of the molecular-genetic network. Genes of this type may be of
particular importance for stabilization of the network function. In fact, very
small derangements of hyper-response gene function by small spontaneous
weakly damaging mutations can make the network malfunctioning. It is of
interest that all these genes belong to the developmental according to their
functions.Second, analysis of nucleotide substitutions demonstrated that evolution
under the pressure of positive selection is a feature of the hyper-responsive
genes. Positive selection began to operate immediately after the major groups of
the Bilateria taxonomic types Ecdysozoa and Deuterostomia had diverged, i.e.,
very soon after the molecular events associated with the rearrangements in the
Hh-cascade topology. It may be assumed that the hyper-responsive genes had
an important role in evolution. Even small changes in their function might have
resulted in great changes in the function of the entire network and, hence, these
genes could serve as good candidate genes for ‘‘the within’’ sources of compen-
satory shift produced by mere point mutations. In summary, this is the putative
evolutionary role we assign to the hyper-response genes we identified here.
Acknowledgment The work is supported by the Ministry of Education of the RussianFederation grant ‘‘Development of the Higher School Scientific Potential’’ 2.1.1.4935,Russian Foundation of the Basic Research (05-04-49141-a, 05-07-98012-p, 03-04-48506-a),SB RAS integration projects 49, N10104-34/�-18/155-270/1105-06-001/28/2006-1. The com-putation was performed in part at the High Performance Computing Center, SB RAS. Theauthors are grateful to A.N. Fadeeva for translating the manuscript from Russian to English.
The Hedgehog Signaling Cascade System 299

References
Ascano,M., Jr and Robbins, D.J. (2004) An intramolecular association between two domainsof the protein kinase Fused is necessary for hedgehog signaling. Mol. Cell. Biol. 24,10397–10405.
Crosby, M.A., Goodman, J.L., Strelets, V.B., Zhang, P., Gelbart, W.M. and the FlyBaseConsortium (2007) FlyBase: genomes by the dozen. Nucleic Acids Res. 35, D486–D491.Version FB2006_01, December 8, 2006.
Dai, P., Akimaru, H., Tanaka, Y., Maekawa, T., Nakafuku, M. and Ishii, S. (1999) Sonichedgehog-induced activation of the Gli1 promoter is mediated by GLI3. J. Biol. Chem.274, 8143–8152.
de Jong, H. (2002)Modeling and simulation of genetic regulatory systems: a literature review.J. Comput. Biol. 9, 69–105.
Dillon, R., Gadgil, C. and Othmer, H.G. (2003) Short- and long-range effects of sonichedgehog in limb development. Proc. Natl Acad. Sci. USA 100, 10152–10157.
Eldar, A., Dorfman, R., Weiss, D., Ashe, H., Shilo, B.Z. and Barkai, N. (2002) Robustness ofthe BMP morphogen gradient in Drosophila embryonic patterning. Nature 419, 304–308.
Eppig, J.T., Bult, C.J., Kadin, J.A., Richardson, J.E., Blake, J.A. and Mouse GenomeDatabase Group (2005) The Mouse Genome Database (MGD): from genes to mice—acommunity resource for mouse biology. Nucleic Acids Res. 33, D471–D475.
Grumbling, G., Strelets, V. and The FlyBase Consortium (2006) FlyBase: anatomical data,images and queries. Nucleic Acids Res. 34, D484–D488.
Gunbin, K.V., Omelyanchuk, L.V. and Ananko, E.A. (2004) Two gene networks underlyingthe formation of the anterior–posterior and dorso-ventral wing imaginal disc compart-ment boundaries in Drosophila melanogaster. Proceedings of the Forth InternationalConference on Bioinformatics of Genome Regulation and Structure, BGRS’2004, vol. 2,56–59.
Gunbin, K.V., Omelyanchuk, L.V., Kogai, V.V., Fadeev, S.I. and Kolchanov, N.A. (2007a)Model of the reception of hedgehog morphogen concentration gradient: comparison withan extended range of experimental data. J. Bioinform. Comput. Biol. 5, 491–506.
Gunbin, K.V., Afonnikov, D.A. and Kolchanov, N.A. (2007b) The evolution of theHh-signaling pathway genes: a computer-assisted study. In Silico Biol. 7,0047.
Held, L.I. (2002) Imaginal Discs: The Genetic and Cellular Logic of Pattern Formation.Cambridge University Press, Cambridge.
Huangfu, D. and Anderson, K.V. (2006) Signaling from Smo to Ci/Gli: conservation anddivergence of hedgehog pathways from Drosophila to vertebrates. Development 133,3–14.
Kimura,M. (1983) TheNeutral Theory ofMolecular Evolution. CambridgeUniversity Press,Cambridge.
Lai, K., Robertson, M.J. and Schaffer, D.V. (2004) The sonic hedgehog signaling system as abistable genetic switch. Biophys. J. 86, 2748–2757.
Lum, L. and Beachy, P.A. (2004) The hedgehog response network: sensors, switches, androuters. Science 304, 1755–1759.
Nakano, Y., Nystedt, S., Shivdasani, A.A., Strutt, H., Thomas, C. and Ingham, P.W. (2004)Functional domains and sub-cellular distribution of the hedgehog transducing proteinSmoothened in Drosophila. Mech. Dev. 121, 507–518.
Nybakken, K. and Perrimon, N. (2002) Hedgehog signal transduction: recent findings. Curr.Opin. Genet. Dev. 12, 503–511.
Pires-daSilva, A. and Sommer, R.J. (2003) The evolution of signalling pathways in animaldevelopment. Nat. Rev. Genet. 4, 39–49.
Rossant, J. and Tam, P. (2002) Mouse Development: Patterning, Morphogenesis, andOrganogenesis. Academic Press, San Diego.
300 K. V. Gunbin et al.

Ruel, L., Rodriguez, R., Gallet, A., Lavenant-Staccini, L. and Therond, P.P. (2003) Stabilityand association of Smoothened, Costal2 and Fused with Cubitus interruptus are regulatedby hedgehog. Nat. Cell Biol. 5, 907–913.
Stark, C., Breitkreutz, B.J., Reguly, T., Boucher, L., Breitkreutz, A. and Tyers, M. (2006)BioGRID: a general repository for interaction datasets. Nucleic Acids Res. 34,D535–D539. Version 2.0.27, May 1, 2007.
Tay, S.Y., Ingham, P.W. and Roy, S. (2005) A homologue of the Drosophila kinesin-likeprotein Costal2 regulates hedgehog signal transduction in the vertebrate embryo. Devel-opment 132, 625–634.
von Dassow, G., Meir, E., Munro, E.M. and Odell, G.M. (2000) The segment polaritynetwork is a robust developmental module. Nature 406, 188–192.
von Dassow, G. and Odell, G.M. (2002) Design and constraints of the drosophila segmentpolarity module: robust spatial patterning emerges from intertwined cell state switches.J. Exp. Zool. B Mol. Dev. Evol. 294, 179–215.
The Hedgehog Signaling Cascade System 301

Approaches to the Resolution of Contradictions
Between Phylogenetic Systems Based
on Paleontological and Molecular Data
G. S. Rautian, A. S. Rautian, and N. N. Kalandadze
Abstract Essential differences between molecular and morphofunctional char-acteristics as sources of information about evolutionary development are dis-cussed. Global historical geography of terrestrial vertebrates is considered as a
source of information on the basic events in mammalian phylogeny and on thedates of emergence of certain lineages. It is emphasized that some aspects ofzoogeographical reconstructions are supported by new data of the fossil recordand comparative molecular studies.
1 Introduction
Phylogenetic reconstruction based on paleontological and molecular data hasmuch in common, but, at the same time, shows certain essential differences. It isreasonable to suppose that, as contradictions between final phylogenetic recon-structions are resolved, new insights into the patterns of evolution and the
correlation of evolutionary changes at different levels of biological organizationwill be achieved. An important obstacle to this is the profound differences ingenerally accepted methods in different fields of biology, and their mostlyindependent development. An alarming sign of this discordance is the recently
emerging practice to introduce new taxonomic names based on the results ofmolecular studies, regardless of the absence of any analogs in taxonomicsystems based on classical approaches. Taking into account the fact thatmolecular studies mostly involve similarities and dissimilarities, the biologicalsignificance of which is poorly understood, such newly created molecular taxa
cannot be diagnosed in a biologically meaningful way. Reasonable diagnosesare presently possible only at the morphophysiological level, although even inthis case the degree of biological understanding is still a long way from perfect.
G. S. RautianPaleontological Institute, Russian Academy of Sciences, Moscow, 117997 Russiae-mail: [email protected]
N. Dobretsov et al. (eds.), Biosphere Origin and Evolution.� Springer 2008
303

In other words, a taxonomic group recognized based on molecular traits shouldnecessarily be comprehended in terms of the morphophysiological properties oforganisms. For the moment, molecular taxa remain ‘‘a thing to themselves.’’They add little to the understanding of the nature of organisms, or to orderingour knowledge of biodiversity and, hence, cannot provide the basis for furtherbiological studies. At the same time, the search for a constructive dialog aimedto reveal and overcome the contradictions between phylogenetic reconstruc-tions at molecular and morphophysiological levels is the most topical problemof modern phylogenetics.
The major distinctive feature of phenotypic evolution is the fact that it isdirectly controlled by natural selection, whereas the dependence of geneticcharacteristics on selective pressure is always indirect and is determined by theextent to which they have a selectively significant phenotypic manifestation.1 Asearly as 1938, Schmalhausen (1938, 1949) formulated that phenotypic charactersare potentially much more stable than the genetic traits providing the basis fortheir development. This concept agrees with the empirical generalization thatTimofeev-Resovsky (1958) named the Chetverikov’s principle (Chetverikov,1926, 1983). It states that uniform phenotypes of the wild type (Schmalhausennamed it the adaptive norm) are underlain by a vast genetic diversity, which canbe discovered in laboratory conditions through inbreeding but usually has nophenotypic manifestation in nature. Thus, according to Schmalhausen, thestability of the adaptive norm (= wild type) is maintained in spite of genotypicdiversity rather than due to genotypic uniformity.
Stabilizing (canalizing) selection produces and constantly maintains struc-tural variants that are capable of persisting over potentially infinite periods ofgeological history (irrespective of the accumulation of genetic change). There-fore, the rates of morphological evolution not only vary within a very wide rangebut, more importantly, can be extremely low, supporting successful variants oforganization. This is corroborated, in particular, by the existence of living fossilsand long-lived groups at any time in the geological history of Earth. Thus, theorganismal level of biological organization has the potential (not necessarilyrealized) for self-preservation over an arbitrarily long time period.
Molecular genetic characteristics are only indirectly influenced by naturalselection; in particular, they are only indirectly subjected to stabilization(Schmalhausen, 1938, 1949). Therefore, in contrast to morphofunctional char-acteristics, they are incapable of remaining constant over arbitrary long periodsand inevitably change in the course of evolution. In particular, even underconditions of long stabilizing selection of the phenotypes (for example, in livingfossils), more or less neutral genetic changes are constantly accumulated and,hence, result in genetic divergence between species even when they belong to
1 The more complex is the morphofunctional organization, the longer is the ontogenetic pathfrom a nucleotide sequence to phenotype. Therefore, this statement is particularly importantwith reference to higher metazoans.
304 G. S. Rautian et al.

closely related taxa. A prominent example is provided by the Siberian newt(Salamandrella keyserlingii), which was examined in regard to the nucleotidesequence of the mitochondrial gene for cytochrome b (Berman et al., 2005). Itwas shown that the Magadan, Sakhalin, Chukchi and Ural populations arerather similar both morphologically and genetically (genetic variability wasestimated as 0.38%), while the population from the Primorye region combinedsmall morphological differences from other populations with high differences inmtDNA (9.8-11.6%). The researchers emphasized that similar genetic distancesbetween the nucleotide sequences of the cytochrome b gene are observed indifferent species of the same genus of the family Hynobiidae. Thus, the inter-specific distances within the genusBatrachuperus (with six species included in thecomparison) range from 4.4 to 9.3%; those in the genera Pseudohynobius (twospecies) andHynobius (three species) are 15.5 and 10.7-12.7%, respectively.2 Thisexample distinctly illustrates the theoretically derived statement that geneticdifferences are accumulated even whenmorphological evolution is slowed down.
Themore neutral the genetic change that occurs in a certain lineage, themorereliable the information on the sequence of branching and the time of diver-gence they provide, but the less suitable they are for the recognition of bound-aries between taxa, because they cannot provide a measure of the biologicalsignificance of changes. Thus, the tasks of splitting phylogenetic branches intoparticular taxa and the creation of hierarchical phylogenetic classification arestill solvable only on the basis of morphofunctional characteristics. In otherwords, genetic and morphological approaches mostly supplement each otherrather than impose rigid restrictions on the interpretation of results.
A number of recent studies have considered the divergence times betweenvarious groups and species. This is important for assessing evolutionary rates ofmorphological and molecular changes as well as for estimating the geologicaland ecological context of the diversification events and for understanding thespeciation mechanisms. However, the calibration points based on the fossilrecord always give younger dates than true points of divergence between taxaexamined because split between particular lineages occurs deep in the ancestraltaxon where derived characters have not yet developed. Therefore, even if itwere possible to find an earliest representative of a lineage in the fossil record itwould not be placed in the daughter taxon. In addition, the fossil record israther incomplete, particularly in regard to small mammals, since the prob-ability to find an extinct taxon directly depends on the biological progress sensuSevertsov, implying high taxonomic diversity and abundance of subordinatetaxa, and on the body size. In particular, mammals were suppressed by dino-saurs over a large part of their early history and remained cryptic until theyblossomed forth in abundance in the Cenozoic. At the same time they
2 For comparison, intergeneric distances (estimated based on the nucleotide sequences of thecytochrome b gene) between the elephantids Elephas, Loxodonta and Mammuthus are only3–4% (Rautian and Dubrovo 2001, 2003; Rautian et al., 2006).
Approaches to the Resolution of Contradictions 305

dominated in the small-sized class beginning from the later part of the LateJurassic as a result of the greatest crisis in the history of land tetrapods(Kalandadze and Rautian, 1993a,b).
It is possible to obtain additional calibration points for dating certain diver-gence events in mammalian phylogenetic tree based on the results of globalhistorical zoogeography. Regarding the estimation of divergence times of parti-cular lineages zoogeographical and genetic approaches have much in common,since both reflect the loss of links between initial populations irrespective of theirmorphofunctional and ecological characters. Thus, in contrast to the morpholo-gical approach, they provide time estimates for the divergence of the stem groups.
2 Historical Vertebrate Zoogeography and Molecular
Phylogeny of Mammals
2.1 Global Historical Geography of Land Vertebrates as a Sourceof Information on Divergence Events in Mammalian Phylogeny
The history of intercontinental faunal contacts was established using all acces-sible data (mainly published) on geographical and stratigraphic distribution offossil and modern tetrapods, excluding marine or flying taxa. Each taxon understudy was considered to be monophyletic, monotopic and monochronous inorigin (Skarlato and Starobogatov, 1974). The faunas were compared by thedegree of their taxonomic similarity at the generic and family levels. To avoidsubjectivity of paleogeographical judgments, faunas were compared with eachother in pairs, regardless of their present or past position on the Earth’s surface.The reconstruction of faunal connections and zoogeographical division werebuilt for each stage of the stratigraphic scale.
Discarding the false (inherited from the previous epochs) and mediatedfaunal links from each reconstruction was made through the combination oftwo operations.
Operation of subtraction. If the direct link between two faunas shown by acertain taxon can be explained by its actually known distribution in the previousstages, such a taxon was eliminated from consideration in the zoogeographicalreconstruction for the given stage.
Operation of reduction. If the direct link between faunas of two regions wasweaker, or could be fully reduced to two (or a greater number) mediating links(i.e., all or overwhelming majority of taxa of direct link corresponded to thesame taxa of indirect links), such a link was considered to be false, produced bythe connection between two faunas through a third, or several faunas.
The valid faunal links between paleogeographical regions were interpreted asindication of direct land contact between them during the whole or a part of thegiven geological stage, while the absence of links was evidence of marineisolation of these regions during the whole stage. It is noteworthy that only
306 G. S. Rautian et al.

one paleogeographical reconstruction was in agreement with the strict zoogeo-
graphical requirements imposed.In addition, the principles of irreversibility of evolution, monophyletic,
monotopic and monochronic origin of taxa of phylogenetic system allowed
the reconstruction of a number of missing links based on the following assump-
tions (Rasnitsyn, 1988, 2002, 2006): (1) a disjunctive range of a taxon is evidence
for the existence of its representatives in the intermediate area; and (2) the
presence of members of a taxon in isolated faunas is evidence to its existence
in the epochwhen the faunas of the territories were in direct or indirect contacts.
These assumptions of geographical and stratigraphical distribution of taxa
allowed the improvement of the general scenario of faunagenesis, in particular,
a suitable paleogeographical reconstruction for the Early and Middle Jurassic
(which were impossible to obtain based on the fossil record of that time because
of extremely scanty data).
Fig. 1 Global paleogeographical reconstructions established based on the data on historicalzoogeography of terrestrial tetrapods: (a) Late Triassic–early Early Jurassic, 227–195 Ma;(b) late Early Jurassic–early Middle Jurassic, 195–159 Ma; (c) early Middle Jurassic–terminalJurassic, 159–142 Ma; (d) early Early Cretaceous, 142–127 Ma; (e) late Early Cretaceous–early Late Cretaceous, 127–85 Ma; (f) late Late Cretaceous, 85–65 Ma; (g) Early Paleocene,65–61 Ma; (h) Middle Paleocene–Early Eocene, 61–49 Ma; (i) Middle–Late Eocene, 49–34Ma; (j) Early Oligocene, 34–28Ma; (k) Late Oligocene, 28–24Ma; (l) Early–MiddleMiocene,24–11 Ma; (m) Late Miocene–Middle Pliocene, 11–3 Ma; (n) Late Pliocene–Recent, 3–0 Ma.Designations of faunas of: (1) North America, (2) South America, (3) Africa, (4) Antarctic,(5) Australia, (6) India, (7) Asia, (8) Europe
Approaches to the Resolution of Contradictions 307

Based on the paleogeographic reconstruction obtained (Fig. 1), it is possibleto date certain important events in the history of mammals.
2.2 Basic Events in the History of Mammalian Faunas
Mammals compose a terminal group of an extensive trunk of Theromorpha,which includes not less than two-thirds of fossil land vertebrates (Synapsida).The mammal-like reptile branch differentiated not later than in the middle ofthe Carboniferous (Westphalian 310–320 Ma), i.e., before the Carboniferousseparation of the Euramerican and Gondwanian zoogeographical regions.However, they probably emerged even earlier. The distribution of Eothyrididaeand Edaphosauria is confined to the Euramerican Zoogeographical Realmestablished by Kalandadze and Rautian (1980, 1981, 1983), which expandedin the Early Permian (283–270 Ma) at least to western China.
This reconstruction is supported by the high level of specialization ofthe earliest known Synapsida and the presence of primitive pelycosaurs(Varanopseidae, seu ‘‘Anningiomorpha’’) in the Late Permian (265–270Ma) of South Africa (Romer and Price, 1940) and northern Eastern Europe(Caseidae and Varanopseidae: Mesenosaurinae) (Carroll, 1988). In addition,Therapsida, a sister group of pelycosaurs, was widespread in the GondwananZoogeographical Realm. This group included Cynodontia, direct ancestors ofmammals. The Upper Triassic (227–205 Ma) of either zoogeographicalrealm yielded such taxa as Diplocaulinae, Herpetospondyli, Dissorophoidea,Captorhynomorpha and Bolosauria (Kalandadze and Rautian, 1980, 1981,1982, 1983, 1991, 1992, 1995a,b, 1997, 1998a,b).
Thus, the development of both remote (Therapsida) and direct ancestors ofmammals (Cynodontia) was primarily connected with Gondwana (SouthAmerica–Africa–Antarctic–Australia–India). Mammals (both Prototheriaand Theria) achieved the global distribution at the very beginning of theirhistory, in the Late Triassic (about 227–205 Ma). At that time the greatestconsolidation of all tetrapod faunas was observed, all continents came in director indirect contact (Fig. 1a), which has never occurred later in the Earth’shistory (Kalandadze and Rautian, 1980, 1981, 1983, 1991). ZoogeographicalPangea of the Late Triassic destroyed all previous zoogeographical divisions.
The separation of the southern block of continents (including SouthAmerica–Antarctica–Australia) occurred in the middle of the Early Jurassic(200–190 Ma, Fig. 1b). This event marks the split of Prototheria intoMonotremata and Multituberculata (extinct groups) as well as Theria intoMetatheria and Eutheria, the signs of which are clearly seen even in themodern mammal zoogeography. The origin of Monotremata and Metatheriawas connected with the southern block, while Multituberculata and Eutheriaemerged in the northern block (including Africa).
The next geological eventmarked by paleozoogeography was the isolation ofAsia from the other continents of the northern block (Fig. 1c), which occurred
308 G. S. Rautian et al.

in the late Middle Jurassic (169–159 Ma); at that time, the Turgai Sea (in placeof modern Western Siberia) and epeiric seas in the Fore-Urals isolated Asiafrom Europe. A number of placental lineages, including Cimolodonta (Kie-lantheria, Deltatheridia, which were ancestral to Creodonta), Scandentia(including Anagalida), Dermoptera and their relatives (Plesiadapiformes andApatotheria) and Lagomorpha and their relatives (Mixotheridia, Mixodontiaand Taeniodontia) appeared in Asia.
In the western center (Africa–Europe–North America), Plagiaulacida,Feliformia, Lipotyphla, Xenarthra, Tubulidentata, Pholidota, ancestors ofPrimates (Strepsirhini þ Haplorhini) and Rodentia emerged. The absence ofLipotyphla from the Asian center and the absence ofMenotyphla (sensu Butler,1956) from the western center suggest that the basal placentals were carnivorousanimals closer to predators (Carnivora sensu lato, including Aegialodontia,Deltatheridia, Creodonta) rather than to insectivores, as is usually thought.Similarly, in the parallel Metatheria trunk, insectivorous groups (Peramelida,Myrmecobiidae, Notoryctidae, Caenolestidae, Necrolestidae) evolved from thepredator trunk Marsupicarnivora (Dasyuroidea þ Didelphoidea).
At the Jurassic–Cretaceous boundary (about 142 Ma), the western block ofcontinents split into isolated Africa, Europe and North America (Fig. 1d). Thefauna ofMadagascar, which was isolated for at least the whole of the Cenozoic,shows essential elements of the autochthonous African fauna, with which theorigin of Feliformia, Tenrecoidea, Strepsirhini, Miomorpha (Cricetidae) andTubulidentata was connected.
Not later than at the middle of the Early Cretaceous (132–121 Ma), SouthAmerica came in contact with North America (Fig. 1d); this was the onlypossibility for some placental groups to enter South America. As a result ofthe faunal exchange between these continents, Didelphoidea penetrated fromSouth America into North America, while placentals, such as Tarsiiformes(descendants of which gave rise to NewWorld monkeys, Platyrrhini), ancestorsof Caviomorpha, Xenarthra, Notoungulata (Notioprogonia) (probable ances-tors of Astrapotheria and Pyrotheria) andCondylarthra (Mioclaenidae) (ances-tors of Litopterna) penetrated from North America into South America. Theabsence from South America of Artiodactyla and Perissodactyla strongly sug-gests that they differentiated in North America later, when the bridge betweenSouth and North Americas was broken. The autochthonous (pre-Pliocene)fauna of South America lacks placentals of Asian origin (descendants ofMeno-typhla, Scandentia, Dermoptera or Lagomorpha). This supports that the ear-liest Bering land (bridge between Asia andNorth America in place of the BeringStrait) that provided intense faunal exchange between these continents occurredat the end of the Early Cretaceous (121–99 Ma) when South America hadbecome completely isolated from the other continents (Fig. 1e). The next faunalexchange between South and North Americas occurred as late as the LateMiocene (see Simpson, 1980).
In the autochthonous fauna of South America, carnivorous mammals arerepresented by marsupials (Didelphoidea, Borhyaenoidea and Coenolestidae),
Approaches to the Resolution of Contradictions 309

while phytophagans are almost exclusively placentals (except for Polydolopi-dae, Groeberiidae and Argyrolagidae): rodents (Caviomorpha), Xenarthra andungulates (Notoungulata, Astrapotheria, Pyrotheria, Didolodontidae andLitopterna). North America is the native land of ungulates (Notoungulataand Condylarthra) and the unique continent free from autochthonous preda-tory mammals. Apparently, at the moment of contact between the marsupialand placental faunas in the Early Cretaceous, marsupials were represented bymore specialized and competitive predators, while at least some placentalspossessed pronounced pre-adaptations to phytophagy.
Marsupials (Didelphoidea) probably stimulated specialization of ungulateancestors in North and South Americas. Predatory specialization of condy-larthrs, such as Mesonychia and Arctocyonia, was probably secondary. Theabsence of a Bering bridge from the end of the Cretaceous (Campanian–Maastrichtian) to the Early Paleocene (83–58 Ma; Fig. 1e–h) combined withthe origin of Artiodactyla in North America and Cetacea on the coast of theTethys suggest the Late Cretaceous age (85–83 Ma) of their common ancestor(predatory condylarths Eparctocyonia).
The absence of marsupial phytophagans of Australian origin (Diproto-donta) in America and the absence of placentals in the Miocene (24 Ma) andearlier faunas of Australia indicate that Australia became isolated before themiddle of the Early Cretaceous (> 130–140 Ma; Fig. 1d and e). The finds ofSouth American tetrapod groups (Polydolopidae, Ancodonta, Astrapotheria,Litopterna, Phorusrhacidae and Sebecidae) in Antarctic Continent (Hooker,1992) corroborated the reconstruction where the faunal link between Antarcticand South America existed longer than a bridge between Antarctic andAustralia (Kalandadze and Rautian, 1982) (Fig. 1d–k).
2.3 Zoogeographical Dating Compared with the PhylogeneticReconstruction Based on Molecular Data
When the global historical tetrapod zoogeography was first developed andassociated with contacts and isolation between faunas inhabiting particular land-masses, it provided surprisingly early dates of divergence of a number of therianlineages (Kalandadze and Rautian, 1980, 1981, 1983, 1992), so that manyresearchers could not accept these results. However, recent studies have providednew fossil data on Early Cretaceous and Jurassic therian mammals (Flynn et al.,1999; Ji et al., 2002; Rauhut et al., 2002; Rich et al., 1999), which reduce the gapbetween zoogeographical estimates and data of the fossil record. In addition,molecular evidence for the early divergence of mammals, in particular, placentalshave been reported (Arnason and Janke, 1996; Easteal et al., 1995; Hasegawaet al., 2003; Huchon et al., 2002; Kumar and Hedges, 1998; Madsen et al., 2001;Murphy et al., 2001; Penny et al., 1999; Scally et al., 2002; Springer et al., 2003;etc.). The dates for particular nodes of phylogenetic trees range depending on the
310 G. S. Rautian et al.

material, technique and calibration points used; however, they are much closer tothe dates obtained on the basis of tetrapod zoogeography than the dates deriveddirectly from the fossil record. For example, the divergence between placentalsand marsupials is dated from 120 to 180 Ma.
At the same time, these molecular-based estimates are still younger thanwhat is predicted by zoogeography (190–200 Ma). This is not surprising,because they are also based on particular calibration dates that mark theappearance of taxa in the fossil record, i.e., mostly the state of biologicalprogress of these taxa. In actuality, divergences between lineages alwaysoccurred somewhat earlier. In this respect, it is interesting that the moleculardate that is closest to zoogeographical estimate was obtained when the diver-gence between synapsids and diapsids (ca. 310 Ma) was taken for calibration(Kumar and Hedges, 1998). This is additional evidence for the fact that therianmammals reached biological progress rather late in historical development andwere less completely represented in the fossil record than other tetrapod groups.In other words, many amphibian and reptile groups reached biological progresssoon after their emergence and, hence, they appeared in the fossil recordrelatively early. In contrast, all therian groups played a subordinate role incommunities throughout most of their history. This raises the question of thereason for the acquisition of the key position.
Mammals mastered the majority of adaptive zones only in the Cenozoicwhen they became free from large reptiles. It is evident that mammals could notsupersede adult dinosaurs through competition. This replacement probablyresulted from the development of Multituberculata after the Great MiddleJurassic Crisis in the tetrapod community (Kalandadze and Rautian, 1992,1993a). This group comprised the earliest small efficient tetrapod phytopha-gans, which gave rise to a special food chain within the subdominant commu-nity sensu Olson (1966) of small tetrapods (Kalandadze and Rautian, 1995c).Since they were progressive phytophagous animals, they produced abundantbiomass and were prerequisite for the development of predators of a new typeadapted for feeding on these and similar tetrapod animals. As such predatorsdeveloped, they could consume juvenile dinosaurs as a supplementary foodresource. At the same time, dinosaurs were formed under conditions of theabsence of this type of predators, in particular, they were not adapted for takingcare of their posterity. For them it appeared impossible to develop thesemechanisms. Thus, one could say dinosaurs became extinct because of vulner-ability of their juvenile stage. On the contrary, mammals showed pronouncedjuvenile care and, hence, were pre-adapted for specialized predators feeding onthem. This distinction anticipated the Cenozoic progress of mammals, includ-ing the development of large-sized taxa.
It is important to keep in mind the subordinate position of early mammals,when taking calibration points from the fossil record. Additional restrictionson the presence in the fossil record are imposed by the biotopes. Inhabitantsof forest landscapes, especially, small arboreal animals infrequently occur inthe fossil record (Simpson, 1980). This point is particularly important with
Approaches to the Resolution of Contradictions 311

reference to primates and rodents. They are recorded in South America
beginning from the Oligocene. However, zoogeographical data suggest that
both groups entered South America not later than 120 Ma; large differences
in molecular sequences between these and closest primate and rodent groups,
respectively, from other continents are in general agreement with these results.
Thus, calibration points based on primate and rodent fossils should be used
with caution.Thus, recent studies show agreement between the results of tetrapod zoogeo-
graphical reconstructions and molecular phylogeny of mammals, which sup-
port each other, although certain disagreements still remain and require the
development of study in this field.
Acknowledgment The study was supported by the programs of the Presidium of the RussianAcademy of Sciences ‘Origin and Evolution of the Biosphere,’ ‘‘Biological Resources ofRussia: Fundamental Bases of Efficient Use’’ and the Russian Foundation for BasicResearch, project no. 05-04-48493a.
References
Arnason, U. and Janke, A. (1996) Mitogenomic analyses of eutherian relationships. Cyto-genet. Gen. Res. 96, 20–32.
Berman, D.I., Derenko, M.V., Malyarchuk, B.A., Grzybowski, T., Kryukov, A.P. andMiscicka-Sliwka, D. (2005) Intraspecific genetic differentiation of the Siberian Newt (@Salamandrellakeyserlingii,@Amphibia,Caudata) and the cryptic species@S. schrenckii@fromsoutheasternRussia. Zool. Zh., 84(11), 1–15.
Butler, P.M. (1956a) The skull of Ictops and the classification of the Insectivora. Proc. Zool.Soc. London, Ser. B 126, 453–481.
Carroll, R.L. (1988) Vertebrate Paleontology and Evolution. Freeman, New York.Chetverikov, S.S. (1926) On certain points of the evolutionary process from the point of view
of modern genetics. Zh. Eksp. Biol., Ser. A. 2, 3–54.Chetverikov, S.S. (1983) Problems of General Biology and Genetics (Reminiscences,
Research Works, and Lectures.Nauka, Novosibirsk.Easteal, S., Collet, C.C. and Betty, D.J. (1995) The Mammalian Molecular Clock. Springer,
Texas.Flynn, J.J., Parrish, M., Rakotosamimanana, B., Simpson, W.F. and Wyss, A.R. (1999)
A Middle Jurassic mammal from Madagascar. Nature 401, 57–60.Hasegawa, M., Thorne, J.L. and Kishino H. (2003) Time scale of eutherian evolution
estimated without assuming a constant rate of molecular evolution. Genes Genet. Syst.78, 267–283.
Hooker, J.J. (1992) An additional record of a placental mammals (Order Astrapotheria) fromthe Eocene of West Antarctica. Antarct. Sci. 4(1), 107–108.
Huchon, D.,Madsen, O., Sibbald,M., Ament, K., Stanhope,M.J., Catzeflis, F., Jong,W. andDouzery, E.J.P. (2002) Rodent phylogeny and a timescale for the evolution of Glires:evidence from an extensive taxon sampling using three nuclear genes. Mol. Biol. Evol.19(7), 1053–1065.
Ji, Q., Luo, Z.-X., Yuan, C.-X., Wible, J.R., Zhang, J.-P. and Georgi, J.A. (2002) The earliestknown eutherian mammal. Nature 416, 816–822.
312 G. S. Rautian et al.
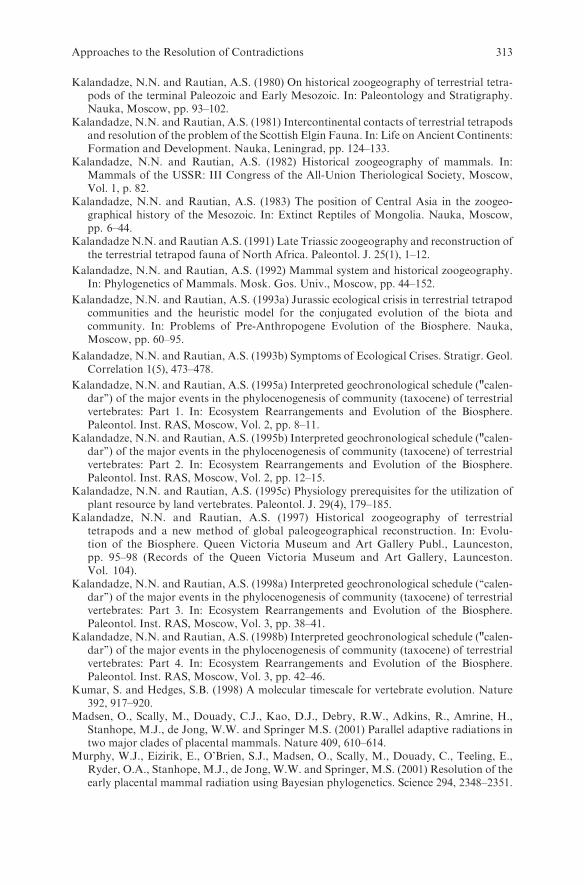
Kalandadze, N.N. and Rautian, A.S. (1980) On historical zoogeography of terrestrial tetra-pods of the terminal Paleozoic and Early Mesozoic. In: Paleontology and Stratigraphy.Nauka, Moscow, pp. 93–102.
Kalandadze, N.N. and Rautian, A.S. (1981) Intercontinental contacts of terrestrial tetrapodsand resolution of the problem of the Scottish Elgin Fauna. In: Life on Ancient Continents:Formation and Development. Nauka, Leningrad, pp. 124–133.
Kalandadze, N.N. and Rautian, A.S. (1982) Historical zoogeography of mammals. In:Mammals of the USSR: III Congress of the All-Union Theriological Society, Moscow,Vol. 1, p. 82.
Kalandadze, N.N. and Rautian, A.S. (1983) The position of Central Asia in the zoogeo-graphical history of the Mesozoic. In: Extinct Reptiles of Mongolia. Nauka, Moscow,pp. 6–44.
Kalandadze N.N. and Rautian A.S. (1991) Late Triassic zoogeography and reconstruction ofthe terrestrial tetrapod fauna of North Africa. Paleontol. J. 25(1), 1–12.
Kalandadze, N.N. and Rautian, A.S. (1992) Mammal system and historical zoogeography.In: Phylogenetics of Mammals. Mosk. Gos. Univ., Moscow, pp. 44–152.
Kalandadze, N.N. and Rautian, A.S. (1993a) Jurassic ecological crisis in terrestrial tetrapodcommunities and the heuristic model for the conjugated evolution of the biota andcommunity. In: Problems of Pre-Anthropogene Evolution of the Biosphere. Nauka,Moscow, pp. 60–95.
Kalandadze, N.N. and Rautian, A.S. (1993b) Symptoms of Ecological Crises. Stratigr. Geol.Correlation 1(5), 473–478.
Kalandadze, N.N. and Rautian, A.S. (1995a) Interpreted geochronological schedule ("calen-dar’’) of the major events in the phylocenogenesis of community (taxocene) of terrestrialvertebrates: Part 1. In: Ecosystem Rearrangements and Evolution of the Biosphere.Paleontol. Inst. RAS, Moscow, Vol. 2, pp. 8–11.
Kalandadze, N.N. and Rautian, A.S. (1995b) Interpreted geochronological schedule ("calen-dar’’) of the major events in the phylocenogenesis of community (taxocene) of terrestrialvertebrates: Part 2. In: Ecosystem Rearrangements and Evolution of the Biosphere.Paleontol. Inst. RAS, Moscow, Vol. 2, pp. 12–15.
Kalandadze, N.N. and Rautian, A.S. (1995c) Physiology prerequisites for the utilization ofplant resource by land vertebrates. Paleontol. J. 29(4), 179–185.
Kalandadze, N.N. and Rautian, A.S. (1997) Historical zoogeography of terrestrialtetrapods and a new method of global paleogeographical reconstruction. In: Evolu-tion of the Biosphere. Queen Victoria Museum and Art Gallery Publ., Launceston,pp. 95–98 (Records of the Queen Victoria Museum and Art Gallery, Launceston.Vol. 104).
Kalandadze, N.N. and Rautian, A.S. (1998a) Interpreted geochronological schedule (‘‘calen-dar’’) of the major events in the phylocenogenesis of community (taxocene) of terrestrialvertebrates: Part 3. In: Ecosystem Rearrangements and Evolution of the Biosphere.Paleontol. Inst. RAS, Moscow, Vol. 3, pp. 38–41.
Kalandadze, N.N. and Rautian, A.S. (1998b) Interpreted geochronological schedule ("calen-dar’’) of the major events in the phylocenogenesis of community (taxocene) of terrestrialvertebrates: Part 4. In: Ecosystem Rearrangements and Evolution of the Biosphere.Paleontol. Inst. RAS, Moscow, Vol. 3, pp. 42–46.
Kumar, S. and Hedges, S.B. (1998) A molecular timescale for vertebrate evolution. Nature392, 917–920.
Madsen, O., Scally, M., Douady, C.J., Kao, D.J., Debry, R.W., Adkins, R., Amrine, H.,Stanhope, M.J., de Jong, W.W. and Springer M.S. (2001) Parallel adaptive radiations intwo major clades of placental mammals. Nature 409, 610–614.
Murphy, W.J., Eizirik, E., O’Brien, S.J., Madsen, O., Scally, M., Douady, C., Teeling, E.,Ryder, O.A., Stanhope, M.J., de Jong, W.W. and Springer, M.S. (2001) Resolution of theearly placental mammal radiation using Bayesian phylogenetics. Science 294, 2348–2351.
Approaches to the Resolution of Contradictions 313
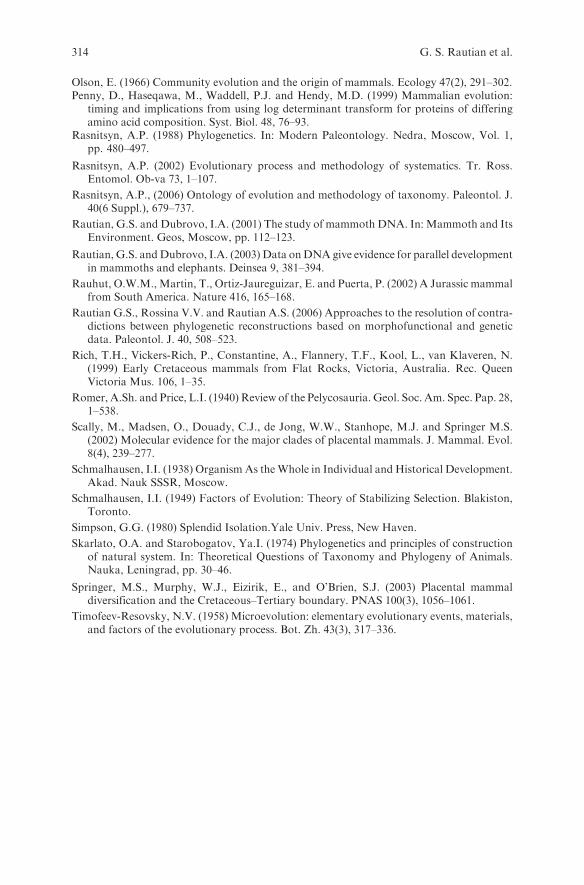
Olson, E. (1966) Community evolution and the origin of mammals. Ecology 47(2), 291–302.Penny, D., Haseqawa, M., Waddell, P.J. and Hendy, M.D. (1999) Mammalian evolution:
timing and implications from using log determinant transform for proteins of differingamino acid composition. Syst. Biol. 48, 76–93.
Rasnitsyn, A.P. (1988) Phylogenetics. In: Modern Paleontology. Nedra, Moscow, Vol. 1,pp. 480–497.
Rasnitsyn, A.P. (2002) Evolutionary process and methodology of systematics. Tr. Ross.Entomol. Ob-va 73, 1–107.
Rasnitsyn, A.P., (2006) Ontology of evolution and methodology of taxonomy. Paleontol. J.40(6 Suppl.), 679–737.
Rautian, G.S. and Dubrovo, I.A. (2001) The study of mammoth DNA. In: Mammoth and ItsEnvironment. Geos, Moscow, pp. 112–123.
Rautian, G.S. andDubrovo, I.A. (2003) Data onDNA give evidence for parallel developmentin mammoths and elephants. Deinsea 9, 381–394.
Rauhut, O.W.M., Martin, T., Ortiz-Jaureguizar, E. and Puerta, P. (2002) A Jurassic mammalfrom South America. Nature 416, 165–168.
Rautian G.S., Rossina V.V. and Rautian A.S. (2006) Approaches to the resolution of contra-dictions between phylogenetic reconstructions based on morphofunctional and geneticdata. Paleontol. J. 40, 508–523.
Rich, T.H., Vickers-Rich, P., Constantine, A., Flannery, T.F., Kool, L., van Klaveren, N.(1999) Early Cretaceous mammals from Flat Rocks, Victoria, Australia. Rec. QueenVictoria Mus. 106, 1–35.
Romer, A.Sh. and Price, L.I. (1940) Review of the Pelycosauria. Geol. Soc. Am. Spec. Pap. 28,1–538.
Scally, M., Madsen, O., Douady, C.J., de Jong, W.W., Stanhope, M.J. and Springer M.S.(2002) Molecular evidence for the major clades of placental mammals. J. Mammal. Evol.8(4), 239–277.
Schmalhausen, I.I. (1938) Organism As theWhole in Individual and Historical Development.Akad. Nauk SSSR, Moscow.
Schmalhausen, I.I. (1949) Factors of Evolution: Theory of Stabilizing Selection. Blakiston,Toronto.
Simpson, G.G. (1980) Splendid Isolation.Yale Univ. Press, New Haven.
Skarlato, O.A. and Starobogatov, Ya.I. (1974) Phylogenetics and principles of constructionof natural system. In: Theoretical Questions of Taxonomy and Phylogeny of Animals.Nauka, Leningrad, pp. 30–46.
Springer, M.S., Murphy, W.J., Eizirik, E., and O’Brien, S.J. (2003) Placental mammaldiversification and the Cretaceous–Tertiary boundary. PNAS 100(3), 1056–1061.
Timofeev-Resovsky, N.V. (1958) Microevolution: elementary evolutionary events, materials,and factors of the evolutionary process. Bot. Zh. 43(3), 317–336.
314 G. S. Rautian et al.
Chromosomes and Speciation
P. M. Borodin
Abstract We analyzed a relative contribution of chromosomal and genetic
divergence into reproductive isolation and speciation in three different taxa of
mammals. We demonstrated that male sterility in hybrids between different
subspecies of South American rodent Thrichomys and hybrids between geo-
graphically isolated population of the house musk shrew Suncus murinus was
determined solely by genetic incompatibility, and chromosomal changes
played minor, if any, role in the speciation. The genetic incompatibility in
these two taxa was controlled by a very small number of loci affecting the
early stages of meiosis of the hybrids, while the viability of the hybrids was
not affected. The analysis of the hybrid zone between two chromosome races
of the common shrew Sorex araneus revealed more complex picture. Their
genetic divergence for habitat preferences led to formation of ecological pre-
mating isolation. Divergence for the genes controlling morphological traits
affected the development of the hybrids and, apparently, their viability, thus
contributing into postmating isolation. Meiosis in the hybrid males was also
affected. In the hybrids we observed a high frequency of synaptic aberrations,
which were apparently determined by chromosomal incompatibility. Thus, we
may conclude that the fixation of different selectively neutral chromosomal
rearrangements in geographically isolated populations does not drive these
populations to speciation; however in some cases chromosomal differences
may reinforce postmating isolation already established by the divergence of
the genes controlling development and chromosome pairing and recombina-
tion at meiosis.
P. M. BorodinInstitute of Cytology and Genetics, Siberian Department of Russian Academy of Science,Novosibirsk 630090, Russiae-mail: [email protected]
N. Dobretsov et al. (eds.), Biosphere Origin and Evolution.� Springer 2008
315

1 Introduction
Many closely related species of animals show considerable differences in their
karyotypes. There is a large body of evidences that chromosomal rearrange-
ments reduce the fertility of heterozygous hybrids. These facts led to suggestion
that chromosomal changes play a causative role in speciation (King, 1993;
White, 1978). An alternative view is that the accumulation of chromosomal
differences between populations is largely incidental to speciation (Coyne and
Orr, 1998, 2004; Rieseberg, 2001).In this chapter I review our studies in relative contribution of chromosomal
and genetic changes to reproductive isolation in three mammalian models:
1. A group of sibling species of South American caviomorph rodent Thrich-omys (Rodentia, Echimyidae) (Borodin et al., 2006);
2. Geographically isolated populations of the house musk shrew (Suncus mur-inus, Eulipotyphla, Soricidae) (Aulchenko et al., 1998; Axenovich et al.,1998; Borodin et al., 1998; Rogatcheva et al., 1997, 1998, 2000a,b);
3. Parapatric chromosome races of the common shrew (Sorex araneus, Eulipo-typhla, Soricidae) (Pack et al., 1993; Polyakov et al., 1996, 1997a,b, 2000a,b,2001, 2002, 2003).
These models differ for the time of intra-group divergence and complexity of
chromosomal changes thus allowing us to assess the role of chromosomal
rearrangements and genetic divergence in formation of genetic incompatibility,
reproductive isolation and finally in speciation.
2 Sibling Species of South American Caviomorph Rodent
Thrichomys
All taxa of genus Thrichomys show very low morphological variation and the
genus has been for long considered as monospecific. Recently, this view has
been challenged on the basis of morphological and cytogenetic evidences, and
several sibling species and subspecies have been suggested: T. pachyurus,T. apereoides apereoides, T. apereoides laurentius and others (Bonvicino et al.,
2002). They are geographically isolated and occupy rather different habitats.
Cytogenetic analyses revealed karyotypic divergence between these taxa.
T. pachyurus has diploid chromosome number 2n = 34 and differs from
T. a. laurentius (2n = 30) and T. a. apereoides (2n = 28) for a series of
chromosomal rearrangements. T. a. apereoides differs from T. a. laurentius
for a tandem fusion of a large acrocentric chromosome with a small metacentricchromosome.
When we crossed specimens of three taxa of genusThrichomys:T. pachyurus,
T. a. laurentius and T. a. apereoides we found that they were able to mate in
316 P. M. Borodin

captivity and produce viable progeny. We did not detect underdominance
effects of interspecies hybridization on litter size and body mass of the hybrids
at birth and weaning. The reproductive success of the majority of between-species crosses was similar to that of within-species crosses.
Some female hybrids produced viable offspring in the crosses with the males
of the parental species. All male hybrids were sterile. Histological examinationrevealed meiotic arrest at the primary spermatocyte stage. No sperm was
detected (Fig. 1).Electron microscopic analysis of surface spread synaptonemal complexes
revealed a complete failure of chromosome pairing in F1 hybrids of T. pachyurus
with T. a. laurentius and T. a. apereoides.In the male hybrids between T. a.
apereoides and T. a. laurentius all chromosomes including the heteromorphic onespaired orderly, however, meiosis did not proceed beyond diplotene.
Results of our analysis indicated that in the hybrids between T. a. laurentius
and T. a. apereoides the heterozygosity for the tandem fusion was not the maincause of the male hybrid sterility.
We found that the chromosomes involved in the rearrangement paired
orderly in the majority of the F1 hybrid male pachytene cells. Chromosomalcause of male sterility in the hybrids of T. pachyurus with T. a. laurentius and
T. a. apereoides also appears to be unlikely. Indeed, spermatogenesis in thesehybrids was already affected at premeiotic stage: the number of spermatogonia
was greatly reduced. In a few of them that entered meiotic prophase, weobserved complete pairing failure in all chromosomes, both heteromorphic
and homomorphic.Spermatogenesis abnormalities detected in the hybrids of Thrichomys were
rather different from those described in mice heterozygous for chromosomal
rearrangements. The main cause of low fertility in mouse heterozygotes was the
non-disjunction of rearranged chromosomes and formation of unbalancedgametes (Capanna and Castiglia, 2004; Castiglia and Capanna, 2000; Hauffe
and Searle, 1998), while the hybrids of Thrichomys showed a decreased number
Fig. 1 Sections of seminiferous tubules of pure breed T. a. apereoides (a), and its hybrids withT. a. laurentius (b) and T. pachyurus (c). Bar 50 mm
Chromosomes and Speciation 317

of spermatogonia and primary spermatocytes due to arrested meiosis beforeand during prophase (Fig. 1).
The stage ofmeiotic arrest in the hybrids depended on the phylogenetic distancebetween the parental species. Both cytogenetic analysis and the analysis of DNAsequence variation within cytochrome b among species of the genus Thrichomys(Braggio and Bonvicino, 2004) indicate earlier branching T. pachyurus and ratherrecent divergence between T. a. laurentius and T. a. apereoides. The hybrids withT. pachyurus showed a very early arrest of germ cell development. Meiosis in thehybrids of more closely related T. a. laurentius and T. a. apereoides was lessaffected.
Another strong argument against the chromosomal cause of the sterility ofthe hybrids between T. a. laurentius and T. a. apereoides comes from the resultof the analysis of backcross males. The types of sterility observed among themfit results expected under models of genetic incompatibility arising from epi-static interactions between two parental loci that have diverged in allopatry(Dobzhansky, 1936, Muller, 1940). Under such models, two types of incompat-ibilities should be observed among backcross progeny: between two heterozy-gous loci derived from different species (e.g. A1A2; B1B2) and a heterozygousand a homozygous loci (e.g. A1A1; B1B2) (Turelli and Orr, 2000).
Although our sample of backcross males did not permit detailed statisticalanalysis of segregation, both classes predicted by the Turelli–Orr incompat-ibility model were observed. One sterile male, which showedmeiotic arrest afterpachytene (similar to F1 males), could be explained as heterozygous for twoincompatibility loci (AlAa; BlBa, where l and a refer to laurentius and aperoidesalleles respectively) while two males with very early meiotic arrest could beassumed homozygous for one locus of T. a. laurentius origin and heterozygousfor another (AlAl; BlBa). The fertile male was apparently homozygous for lociof T. a. laurentius origin (AlAl; BlBl).
Thus, all these data indicate that the male sterility of the hybrids between thespecies of genus Thrichomys is due to genetic but not chromosomal incompat-ibility of the parental taxa.
3 Chromosome Races of the House Musk Shrew
The house musk shrew is a widespread species which occur from East Africa toEast Asia. The most common karyotype of S. murinus consists of 40 chromo-somes (Rogatcheva et al., 1997; Yosida, 1982). Variation in the chromosomenumber, attributed to fixation of novel metacentrics formed by Robertsonianfusion has been reported fromMalaysia (2n=40–35), Sri Lanka (2n=30), andsouthern India (2n = 30–32, 37, 40). Sex chromosome variation has beenrecorded in the S. murinus, with Y-chromosome polymorphism found to bevery extensive (Yosida, 1982). Analysis of variation in mtDNA, allozymes andmorphological traits revealed a high genetic diversity of local populations of
318 P. M. Borodin

S. murinus, comparable with genetic distances between different subspecies of
the house mouse (Yamagata et al., 1995).In the house musk shrew we were able to estimate a relative contribution of
chromosomal and genic divergence in formation of reproductive isolation
between geographically isolated populations. We crossed in the laboratory
two strains of the shrew: KAT and SRI. The KAT strain was derived from a
wild population in Katmandu, Nepal and has been shown to have 2 = 40. The
SRI strain was derived from the animals captured on the West Coast of Sri
Lanka. SRI strain differed from KAT strain by five Robertsonian fusions and
morphology of chromosomes 7, X and Y (Rogatcheva et al., 1997, 2000a,b).Being so diverged in karyotype SRI and KAT shrews were able to hybridize
in the laboratory and produce fertile offspring. A hybrid stock SK was set up.
SK shrews had various combinations of variable chromosomes, having them
either heterozygous or homozygous. In general, they demonstrated a sufficient
reproductive performance. However, many sterile males were found among
them.Meiosis in sterile SKmales did not progress beyond pachytene. Electron-
microscopic analysis of synaptonemal complexes (SC) in fertile hybrids demon-
strated an orderly pairing of all chromosomes, including heteromorphic com-
binations. In the sterile males chromosome pairing was distorted not only in
heterozygous pairs, but also in homozygous ones (Borodin et al., 1998).Heterozygotes for each of the rearrangements were found among both sterile
and fertile males. There was no correlation between the number of heterozygous
rearrangements per individual and its fertility (Fig. 2).Sterile males had all possible combinations of the sex chromosomes; hence
compatibility of the sex chromosomes does not seem to play any role in the
Fig. 2 Frequency of different cytotypes in sterile and fertile male hybrids between Suncusmurinus from Nepal (KAT) and Sri Lanka (SRI)
Chromosomes and Speciation 319

control of fertility. Therefore we concluded that meiotic arrest and sterility ofinterracial hybrids was not determined by structural heterozygosity.
Using segregation analysis we tested several hypotheses of autosomal geneticcontrol of male sterility. The results of this analysis of pedigree data indicatedthat it can be described within a framework of the triallele model, assuming thatthe KAT strain was A2A2 homozygous, the SRI was polymorphic for allele A1andA3, and the hybrids (A2A3) were sterile (Aulchenko et al., 1998; Axenovichet al., 1998).
Thus, our data on Suncus murinus clearly demonstrated that chromosomedivergence played a negligible (if any) role in fertility problems of the hybrids.A single gene controlling early stages of male meiosis was responsible for malehybrid sterility. It is especially interesting that the hybrid sterility in mammals(in contrast to Drosophila, for example) is usually determined by relativelysimple oligogenic systems (one locus in Suncus murinus and two loci inThrichomys).
4 Chromosome Races of the Common Shrew
The common shrew (Sorex araneus) populates a huge area from British Islandson the west to the Lake Baikal on the east. It shows one of the most remarkablechromosomal polymorphism in mammals. To date more than 60 chromosomeraces were described (Wojcik et al., 2003) and the actual number of distinctraces goes probably far beyond 100. This chromosomal variation is determinedby occurrence and fixation of various Robertsonian and whole-arm reciprocaltranslocations. It is postulated that the ancestral karyotype of the commonshrew was characterized by acrocentrics and the karyotype evolution hasproceeded in the direction from high to low 2n numbers (Polyakov et al.,2001, Volobouev, 1989). Each of the ancestral acrocentric chromosomes inthe common shrew is labeled by an italicized letter of the alphabet (e.g. g, h, i,k), and so the different karyotypic races can be characterized by their specificarm combination (e.g. race 1 may have metacentrics gh and ik, race 2 may havegi and hk and race 3 may have metacentric gi and acrocentrics h and k).
We carried out a detailed analysis of geographic distribution, morphologicaldifferences and meiotic properties of the Tomsk (gk, hi, mn, o, p, q, r) andNovosibirsk races (go, hn, ik, mp, qr) and their hybrids. The Tomsk race isdistributed mainly on Altai Mts. and Kuznetzky Alatau highlands while theNovosibirsk race was found on a huge area of the West Siberian Plain(Polyakov et al., 1996, 1997a, 2001).
To interpret the characteristics and distributions of the Novosibirsk andTomsk races, the events of the last glaciation and the transition to theHolocene,are likely to be of particular significance (Searle, 1986). During the last glacia-tion, much of the western Siberia is thought to have been flooded by a glaciallake (Frenzel et al., 1992). Currently, over much of the area of West Siberian
320 P. M. Borodin

Plain common shrews have the Novosibirsk race karyotype. This suggests that
Novosibirsk race shrews were able to colonize and spread over this territory
before other races had a chance to. It can be presumed that the Novosibirsk race
colonized from a glacial refugium in northern parts of the Ural Mts. The
similarity in karyotype between the Serov race, an undoubted Ural form, and
the Novosibirsk race (Polyakov et al., 1997b) supports this model. Likewise, the
Altai Mts. could have been a refugial area for the Tomsk and more easterly
races that show karyotypic affinities (Polyakov et al., 2000a,b, 2001). The
current distribution of the Tomsk race is certainly consistent with south–north
colonization from a glacial refugium in the AltaiMts. into low-lying areas to the
east of the River Yenisey. When the Novosibirsk and Tomsk races spread from
their glacial refugia, it appears that they made contact near Novosibirsk such
that there was introgression of metacentric qr chromosome into the Tomsk race
and the acrocentrics q, r into the Novosibirsk race.To check this hypothesis we carried out a detailed study of the hybrid zone
between the Novosibirsk and Tomsk races (Polyakov et al., 2002, 2003). We
found that the Novosibirsk–Tomsk F1 hybrids occurred in very low frequency
and in a very narrow segment of the hybrid zone (no more than 500 m wide),
while the recombinant individuals were rather frequent and found as far as
50 km from the center of the hybrid zone. This difference in frequency and
dispersal of the F1 hybrids and recombinants may indicate a low viability of the
hybrids or/and rather strong pre-mating isolation between the parental races.
A strict ecological affinity of the parental races gives evidence in favor of the
latter suggestion.We have demonstrated altitudinal partition of the races (Polyakov et al.,
2003). The Tomsk race occurs in the highlands while the Novosibirsk race is
found in the lowlands. A relatively narrow contact zone between the races runs
at about 200 m above sea level. The 200 m isocline separates two types of
vegetation in West Siberia: forest-steppe habitats at lower altitudes, typical
for most of the West Siberian Plain, and taiga habitats at higher altitudes,
widely distributed in the Siberian highlands. There is no reason to believe that
the particular chromosomal combinations that characterize these races some-
how predisposed their adaptations to highland and lowland habitats, respec-
tively. These adaptations have come through selective exposure of the races to
different environments.The chromosomal differences between the parental races contribute to their
reproductive isolation at postmating stage. Immunofluorescent and electron
microscopy of the synaptonemal complexes of the male hybrids demonstrated
that in some cells the rearranged chromosomes were able to pair orderly (Fig. 3).However, a majority of their meiotic cells contained univalents and other
synaptic aberrations (from 40 to 85% in different hybrids) while in the pure-
race and recombinant males the frequency of such pairing aberration did not
exceed 5–10%. We also found a significant decrease of recombination fre-
quency both in multivalents and normal bivalents of the hybrid.
Chromosomes and Speciation 321

Random segregation of such non-crossover chromosomes may result in the
high frequency (up to 50%) of aneuploid genetically unbalanced gametes. These
data indicate that the fertility of the male hybrids should be severally reducedOur analysis of variation in 22 traits of cranial and postcranial skeleton of
the shrews trapped in the center of the hybrid zone three distinct groups of
individuals, which corresponded to the three karyotypic categories involved in
the analysis: Tomsk, Novosibirsk and hybrids. The first discriminant function
reflected the differences in the size of skeletal elements. The Novosibirsk shrews
and the hybrids were significantly smaller than the Tomsk shrews. However, it
was not the variation in the separate morphometric features that allowed a
reliable discrimination of the hybrids from the pure races, but the covariation
between them. In the hybrids the pattern covariation was apparently disrupted
(Polyakov et al., 2002).This may indicate that the divergence between the races was not only con-
cerned with the set of genes controlling skeletal morphology, but also with the
Fig. 3 Chromosome pairing in the male hybrid between the Tomsk and Novosibirsk races ofthe common shrew
322 P. M. Borodin

coordination of those genes. Lack of coordination in the development of thehybrids may decrease their viability and thus contribute to postmatingisolation.
Thus, both pre-mating and postmating mechanisms of reproductive isola-tion apparently restrict the gene flow between the races in the hybrid zone. Wemay consider the Tomsk and Novosibirsk chromosome races as biologicalspecies at the early stage of speciation. Due to random genetic processes(occurrence and accumulation of chromosome rearrangements and gene muta-tions) and natural selection in different ecological conditions they diverged bothchromosomally and genetically up to the point of partial chromosomal andgenetic incompatibility.
5 Conclusions
Wemay conclude that the fixation of different selectively neutral chromosomalrearrangements in geographically isolated populations does not drive thesepopulations to speciation; however, in some cases, chromosomal differencesmay reinforce postmating isolation already established by the divergence of thegenes controlling development and chromosome pairing and recombination atmeiosis.
Acknowledgment This work was supported by research grants from the Programs of RAS‘‘Biosphere Origin and Evolution’’ and ‘‘Biodiversity,’’ INTAS, RFBR. We thank the Micro-scopic Center of the Siberian Branch of the Russian Academy of Sciences for granting accessto microscopic equipment.
References
Aulchenko, Yu.S., Oda, S.-I., Rogatcheva, M.B., Borodin, P.M. and Axenovich, T.I. (1998)Inheritance of litter size at birth in the house musk shrew (Suncus murinus, Insectivora,Soricidae). Genet. Res. 71, 65–72.
Axenovich, T.I., Rogatcheva, M.B., Oda, S.-I. and Borodin, P.M. (1998) Inheritance of malehybrid sterility in the house musk shrew (Suncus murinus, Insectivora, Soricidae).Genome 41, 825–831.
Bonvicino, C.R., Otazu, I.B. and D’Andrea, P.S. (2002) Karyologic evidence of divesificationof the genus Thrichomys (Rodentia, Echimyidae). Cytogenet. Genome Res. 97, 200–204.
Borodin, P.M., Rogatcheva,M.B., Zhelezova, A.I. andOda S. (1998) Chromosome pairing ininter-racial hybrids of the house musk shrew (Suncus murinus, Insectivora, Soricidae).Genome 41, 79–90.
Borodin, P.M., Barreiros-Gomez, S.C., Zhelezova, A.I., Bonvicino, C.R. and D’Andrea P.S.(2006) Reproductive isolation due to the genetic incompatibilities between Thrichomyspachyurus and two subspecies of Thrichomys apereoides (Rodentia, Echimyidae).Genome 49, 159–167.
Braggio, E. and Bonvicino, C.R. (2004) Molecular divergence in the genus Thrichomys(Rodentia, Echimyidae). J. Mammal. 85, 316–320.
Chromosomes and Speciation 323

Capanna, E. and Castiglia, R. (2004) Chromosomes and speciation in Mus musculus domes-ticus. Cytogenet. Genome Res. 105, 375–384.
Castiglia, R. and Capanna, E. (2000) Contact zone between chromosomal races of Musmusculus domesticus. 2. Fertility and segregation in laboratory-reared and wild miceheterozygous for multiple robertsonian rearrangements. Heredity 85, 147–156.
Coyne, J.A. and Orr H.A. (1998) The evolutionary genetics of speciation. Philos. Trans. R.Soc. Lond. B. Biol. Sci. 28, 287–305.
Coyne, J.A. andOrr, H.A. (2004) Speciation. SinauerAssociates, Sunderland,Massachusetts.Dobzhansky, Th. (1936) Studies on hybrid sterility. II. Localization of sterility factors in
Drozophila pseudoobscura hybrids. Genetics 21, 113–135.Frenzel, B., Pecsi, M. and Velichko, A.A. (1992) Atlas of Palaeoclimates and Palaeoenviron-
ments of the Northern Hemisphere. G. Fischer, Stuttgart.Hauffe, H.C. and Searle, J.B. (1998) Chromosomal heterozygosity and fertility in house mice
(Mus musculus domesticus) from Northern Italy. Genetics 150, 1143–1154.King, M. (1993) Species Evolution: the Role of Chromosome Change. Cambridge University
Press, Cambridge.Muller H.J. (1940) Bearings of the Drosophila work on systematics. In: J. Huxley (Ed.), The
New Systematics. Clarendon Press, Oxford, pp. 185–268.Pack, S.D., Borodin, P.M., Serov, O.L. and Searle, J.B. (1993) The X-autosome translocation
in the common shrew (Sorex araneus L.): late replication in female somatic cells andpairing in male meiosis. Chromosoma 102, 355–360.
Polyakov, A.V., Volobouev, V.T., Borodin, P.M. and Searle J.B. (1996) Karyotypic races ofthe common shrew (Sorex araneus) with exceptionally large ranges: the Novosibirsk andTomsk races of Siberia. Hereditas 125, 109–115.
Polyakov, A.V., Borodin, P.M., Lukanova, L., Searle, J.B. and Zima, J. (1997a) The hypothe-tical Old-Northern chromosome race of Sorex araneus found in the Ural Mts. Ann. Zool.Fin. 34, 139–142.
Polyakov,A.V., Chadova,N.B.,Rodionova,M.I., Panov,V.V.,Dobrotvorsky,A.K., Searle, J.B.and Borodin, P.M. (1997b) Novosibirsk revisited 24 years on: chromosome polymorphism inthe Novosibirsk population of the common shrew Sorex araneus L. Heredity. 79, 172–177.
Polyakov, A.V., Zima, J., Banaszek, A., Searle, J.B. and Borodin, P.M. (2000a) New chromo-some races of the common shrew Sorex araneus fromEastern Siberia. Acta Theriol. 45, 11–18.
Polyakov, A.V., Zima, J., Searle, J.B., Borodin P.M. and Ladygina, T.Y. (2000b) Chromo-some races of the common shrew Sorex araneus in theUralMts: a link between Siberia andScandinavia? Acta Theriol. 45, 19–26.
Polykov, A.V., Panov, V.V., Ladygina, T.Yu., Bochkarev, M.N., Rodionova, M.I. andBorodin, P.M. (2001) Chromosomal Evolution of the Common Shrew Sorex araneus L.from the Southern Urals and Siberia in the Postglacial Period. Rus. J. Genet. 37, 351–357.
Polyakov, A.V., Onischenko, S.S., Ilyashenko, V.B., Searle, J.B. and Borodin, P.M. (2002)Morphometric difference between the Novosibirsk and Tomsk chromosome races ofSorex araneus in a zone of parapatry. Acta Theriol. 47, 381–387.
Polyakov, A.V., Volobouev, V.T., Aniskin, V.M. and Borodin, P.M. (2003) Altitudinalpartitioning of two chromosome races of the common shrew (Sorex araneus) in WestSiberia. Mammalia 67, 201–207.
Rieseberg, L.H. (2001) Chromosomal rearrangements and speciation. Trends Ecol. Evol. 16,351–358.
Rogatcheva, M.B., Borodin, P.M., Oda, S.-I. and Searle J.B. (1997) Robertsonian chromo-somal variation in the house musk shrew (Suncus murinus, Insectivora: Soricidae) and thecolonisation history of the species. Genome 40, 18–24.
Rogatcheva, M.B., Oda, S.-I., Aulchenko, Yu.S., Axenovich, T.I., Searle, J.B. and Borodin,P.M. (1998) Chromosomal segregation and fertility in Robertsonian chromosomal hetero-zygotes of the house musk shrew (Suncus murinus, Insectivora, Soricidae). Heredity 81,335–341.
324 P. M. Borodin

Rogatcheva,M.B., Aulchenko, Yu.S., Oda, S.-I., Zhelezova, A.I., Serova, I.A., Axenovich, T.I.and Borodin, P.M. (2000a) Chromosomal and genic mechanisms of reproductive isolation:the case of Suncus murinus. Acta Theriol. 45, 147–161
Rogatcheva, M.B., Ono, T., Sonta, S.-I, Oda, S.-I. and Borodin P.M. (2000b) Robertsonianmetacentrics of the house musk shrew (Suncus murinus, Insectivora, Soricidae) lose thetelomeric sequences in the centromeric area. Genes Genet. Syst. 75, 155–158.
Searle, J.B. (1986) Factors responsible for a karyotypic polymorphism in the common shrew,Sorex araneus. Proc. R. Soc. Lond. B. 229, 277–298.
Turelli, M. and Orr, H.A. (2000) Dominance, epistasis and the genetics of postzygoticisolation. Genetics 154, 1663–1679.
Volobouev, V.T. (1989) Phylogenetic relationships of the Sorex araneus-arcticus speciescomplex (Insectivora, Soricidae), based on high-resolution chromosome analysis.J. Hered. 80, 284–290.
White, M.J.D. (1978) Modes of Speciation. Freeman, San Francisco.Wojcik, J.M., Borodin, P.M., Fedyk, S., Fredga, K., Hausser, J., Mishta, A., Orlov, V.N.,
Searle, J.B., Volobouev, V. and Zima, J. (2003) The list of the chromosome races of thecommon shrew Sorex araneus (updated 2002). Mammalia 67, 169–178.
Yamagata, T., Ohishi, K., Faruque, M.O., Masangkay, J.S., Ba-Loc, C., Vu-Binh, D.,Mansjoer, S.S., Ikeda, H. and Namikawa, T. (1995) Genetic variation and geographicdistribution on the mitochondrial DNA in local populations of the musk shrew, Suncusmurinus. Jap. J. Genet. 70, 321–337.
Yosida, T.H. (1982) Cytogenetical studies on Insectivora. II. Geographical variation ofchromosomes in the house shrew, Suncus murinus (Soricidae), in East, Southeast andSouthwest Asia, with a note on the karyotype evolution and distribution. Jap. J. Genet. 57.101–111.
Chromosomes and Speciation 325

Biotic Turnover in Superorganism Systems:
Several Principles of Establishment
and Sustenance (Theoretical Analysis,
Debatable Issues)
V. G. Gubanov and A. G. Degermendzhy
Abstract Biosphere in first approximation (taking into consideration the mostgeneral characteristics) can be characterized by the inflow of light energy, thepresence of differentiated alive and inert matter and high degree of thermo-dynamic closedness. The material cycle based on closure, driven by energy flowbased on functional distribution of organisms, is formed to become the basis forlong-term existence and evolution of the biosphere. The problem of formationand maintenance of the cycle on all biologically important chemical elements interms of the biosphere seems urgent because the cycle is the most importantattribute of biosphere existence. The biosystem closed on biotic matter cycle isthe system with substantially short biocycle of its existence. In the planetaryscale the possibility of biocycles destruction due to the formation of biologicallynon-degradable matters (‘‘deadlocks’’) can be absolutely real, besides othermechanisms of biosphere degradation (toxicity, warming, ozone holes, etc.).The same problem exists in constructing artificial closed ecosystems, e.g. withthe aim of life support for crew of spacecrafts, underwater and arctic settle-ments and the possible model prototype of noosphere. The aim of the work is todescribe and make primary mathematical analysis of two principles of biologi-cal closure: ‘‘ecological’’ and ‘‘evolutionary.’’ The ratio of any ith biogenicelement flow on the producer link to the sum of the same flow and the flowof element coming into the deadlock sediments is the closure measure of any ithelement (coefficient Cli).
1 Introduction
The problem of formation and maintaining steady state of the matter cycle onall necessary chemical elements in natural ecosystems (Odum, 1975), on thebiosphere level (Kamshilov, 1966, 1979; Pechurkin, 1982, 1988; Vernadsky,
V. G. GubanovInstitute of Biophysics SB RAS, Krasnoyarsk, Russiae-mail: [email protected]
N. Dobretsov et al. (eds.), Biosphere Origin and Evolution.� Springer 2008
327
1940, 1967), in life support systems (Gitelson et al., 1975, 2003; Nelson et al.,1993), laboratory microcosms (Beyers, 1964; Burdin, 1978; Carpenter, 1996;Folsome and Hanson, 1986; Gubanov et al., 1984; Kovrov and Fishtein, 1978;Nixon, 1969; Sugiura, 1998; Taub, 1969a,b, 1974) and other similar super-organism systems seems extremely urgent. In this case, the intensity and theclosure degree (or closure) are the most important characteristics. This workwill consider the latter characteristic.
For the Earth’s biosphere on the whole the closure biotic of matter cycle,calculated based on biologo-geographical data, is approximately 99.99%.
Apparently, the high matter cycle closure in biosphere does not mean thesame high closure of natural ecosystems (ES) in the biosphere. The matter,which is taken out from the cycle (deadlock matter) of one ES, can be involvedin the cycle of a neighbour and a farther (in distance and time) ES. Instead of thematter fallen out of the cycle, almost the same amount of the matter from eitherabiogenic supply or another ES is involved in the cycle. ES in its existencedepends upon the introduction of matters from the outside.
Probably, primary ES, due to constant mutational pressure, occasionally butnecessarily forms species which initiate the matter cycle and increase its closuredegree. Thanks to this property obtained in the process of evolution, organismcommunities resist the pressure of lack of nutrition supply.
Since the nutrient resource is limited, the time of biotic systems with smallclosure (at that, complete and required nutrient resource does not recycle andthus stops sooner or later) existence is highly limited in comparison with moreclosed systems. Therefore, additional opportunities for further evolutionaryimprovement occur for populations inhabiting these systems (Yablokov andYusufov, 1989), which leads to an increase in the system life-time and favoursfurther selection, etc. where the biotic system itself as a whole will be theregulator and the test object. Probably, ES should simultaneously be selectedaccording to matter cycle closure. Supposedly, systems with higher matter cycleclosure should be more reliable or, at least, more competitive than those withlower closure—they do not need ‘‘thinking’’ about the sources required forliving under conditions of limited matter resource.
Therefore, ES in the process of evolution, probably, should increase thematter cycle closure and, at least, be selected in this direction on primary stagesof evolution. It is noteworthy that the mentioned sign (closedness) favours thesustainment of the integrity of the properties of biotic system.
The urgency of understanding and analysing the situation in this directioncan be justified by the observed reduction and destruction of many naturalbiocycles by human impact. To estimate the methods of sustaining the cyclingdiversity in nature, one needs to study the mechanisms of formation andmaintenance of various types of biocycles. In this case, important questionsappear: what species (with what kinetic characteristics) are capable of formingand maintaining highly closed stable biotic matter cycle in different systems?How can the cycle closure in quantity and change (increase) be estimated?Whatare the mechanisms (methods) of maintaining highly closed biocycle?
328 V. G. Gubanov, A. G. Degermendzhy

This work is dedicated to the analysis of possible ways and some principlesof formation and sustainment of high closure of biotic material cycle. It wouldbe convenient to start solving this problem by taking into consideration allpossible (in structure and functional relations) systems capable of long-termautonomous functioning.
2 The Measure of Closure of Biotic Matter Cycle
for Systems Based on Matter Supply
Biotic matter cycle (BMC) is the movement of matter through production oforganic matter (start of matter moving–ascending branch) and through itsdestruction with restoration of initial elements required and used in biosynthesis(descending branch). Notably, the descending branch is directed to producers,i.e. to the start of the matter movements, which is principal.
In this sense, we will not consider here populations, communities, associa-tions, artificial systems on flow channels (like chemostat), biosystems withmatter recycling only on heterotrophic level. There is no biotic matter cycle inthem in certain sense, as in that case there would be no matter return to thestart—to producers. We consider the ecosystem level and higher.
Notably and of principle, when talking of matter cycle formation in super-organism systems, we will consider only one forming force – biological trans-formation of matters (compounds), biological mechanism of cycle formation,without taking into consideration any physical or artificial forces. Therefore,we speak particularly about biological i.e. biotic (i.e. formed only by bioticcomponents) matter cycle.
Formalize the concept of degree of closure (closure coefficient Cl) of thematter biocycle in superorganism systems—the measure of biotic closure. Inthis case we require the correlation 0� C1� 1 to hold always. With Cl = 1 thesystem is completely closed biotically (no deadlocks formation) and is capable ofexisting for indefinitely long time. With Cl = 0 the system has no biotic cycle(in the sense defined above) elements and, in this case, its existence is completelydependent on the matter supply from outside. The biotic closure coefficientallows, to a certain extent, ways of enhancing the matter cycle closedness to beevaluated.
It is noteworthy that the parameter which characterizes the internal potentialof the biotic system to organization of some biocycle, though is not responsiblefor system openness in relation to external matter flows, should be taken intoconsideration. For example, the completely closed biocycle system (Cl = 1,no deadlocks formation and this has a principal meaning) can be set into the flowconditions. In this case, if the system structure does not change, the speciespotentially are still able to form closed biocycle (in this case Cl = 1 for such asystem), though there exists the flow through the system which shows itsincomplete closure on biocycle. In reality, in this case the system is open on
Biotic Turnover in Superorganism Systems 329

matter flow through it (thermodynamically open) but, according to species’
characteristics, can exist for indefinitely long time even if the matter flow is
disrupted (i.e. biotically closed), since as before there is no deadlock formation.
In nature the partially closed lakes are among these objects. It is noteworthy
that all known methods of closure coefficient formalization (Bartsev, 2002;
Bartsev et al., 1996; Finn, 1976, 1978; Gitelson et al., 1975; Lisovsky and
Tikhomirov, 2002; Morozov, 1977; Voronin and Polivoda, 1967) suffer from
not taking the most important BMC property into account.Let the system on matter supply be the initial point. The system boundaries
will be set so that the deadlock matter, which falls out of the cycle, would be
left as system component. In this case such system is closed from the thermo-
dynamic point of view (i.e. does not exchange matter with the external
environment, only the energy).The degree (coefficient) of the biotic material cycle closure (Gubanov
and Degermendzhy, 2002, 2003; Tikhomirov et al., 2003) for supply systems
is the ratio of the flow rate of thematerial coming from heterotrophic organisms
to producers [ _�] to the sum of the flow rates of the material coming from
heterotrophs to producers ( _�Þand the material going to the dead end ½ _U]:
Cli ¼
Pk
_�ik
Pk
_�ik þPl
_Uil
; (1a)
Cl ¼
Pi
Pk
_�ik
Pi
Pk
_�ik þPi
Pl
_Uil
: (1b)
where Cli, Cl are coefficients of the cycle closure for the ith biogenic element and
the matter as a whole, k and l are all possible channels through which the
substances move from heterotrophic organisms to producers and to the dead
end. Obviously 0 � Cli;Cl � 1.Systems on matter supply include artificial (microcosms), complex technical
systems (e.g. biological life support systems, BLSS) and other natural systems,
e.g. those without access to closed lakes, etc. (including biosphere).A priori, we can assert that the degrees of closure on various elements are
different. They become equal only in the case of complete closure, i.e. when all
closure coefficients are equal to 1. From this assertion and determination of the
cycle degree of closure (Eqs. 1) it follows that
Clj;min5Cl5Clk;max; (2)
where Clj, min, Clk, max are the minimum and the maximum closure on some
j and k elements, respectively. To all appearances, the correlation (2) is a general
property.
330 V. G. Gubanov, A. G. Degermendzhy

From the formulas (Eqs. 1), we can see that the change of Cl goes in the same
direction with change of Cli for any ith chemical element. But it is obvious that
Cl change happens not necessarily unidirectionally with Cli change for any ith
chemical element. It is obvious that, if on any account, the degree of closure
of matter biotic cycle as a whole (Cl) stays invariable at the change of degree of
closure on some ith element (Cli), then there should be the change of degree
of closure (Clm) at least on one element m with the coefficient opposite to
i element. Thus, saying in the form of the statement: a change in the biotic
cycle degree of closure on some element with the same coefficient of closure on the
matter as a whole having the same sign results in the change in the closure degree
of the cycle with opposite sign on other element (or elements).Obviously, this statement is the corollary of the law ofmatter conservation in
the system, i.e. assignable.
3 Mathematical Model of Simple Homogenous Closed Ecosystem
on Matter Supply
3.1 Base Model Description
Consider a mathematical model of a simplest homogenous biotic system with
constant and limited amount of the matter turning over with a certain degree of
closedness (large store system) (see Fig. 1):
Fig. 1 Flows of substance inthe model. Arrows withcircles denote direction offlows of substance in thesystem, X producer,R reducer, Z dead organicmatter, Si the ith biogenouselement in the environment,�iA specific content of the ithelement in A component orrespective flow of thesubstance
Biotic Turnover in Superorganism Systems 331
_X ¼ �xX� �xX; _R ¼ �RR� �RR;_Z ¼ �xXþ �RR�
�RYRZ
R;
_Si ¼ ��xXYXiþ �iSZ’�RR; _U ¼ �RR
1
YRZ� 1� ’
� �; ð3Þ
where � are specific growth rates of respective organisms; � are specific die-off
(metabolism) rates; Y are the economic yield coefficients for organisms on the
respective substrate; � iSZ is the specific content of the ith biogene in the flow of
mineralized substance into the background; ’ is the mineralization coefficient
indicating the amount of dead organic matter mineralized by the reducer in
increment rate unit.
It should be noted that for the sake of simplicity of analysis all biogenous
elements feature identical properties (typical with respect to their involvement
in the turnover). Special properties of such elements as C, O, H, Si and some
other are given no consideration.We should also note that deadlock U has no effect on establishment and
sustenance of the cycle; to take it into account explicitly is important for this
model from the viewpoint of control of balance of substances in the system, for
the analysis of the biotic cycle formationmechanism and for the introduction of
the biotic cycle closure measure—its closure degree (coefficient). The presence
of the natural deadlocks for introduction of the biotic cycle closure term and
measure has the principal meaning.It is common knowledge that the element composition of organisms
(specific content of elements in the biomass) is not constant and varies
with food, conditions of existence, physiological condition of organisms,
etc. For the sake of simplicity and without loss of generalization of reason-
ing these parameters (specific content) in the models are assumed to be
constant.Consider a more general case: variability of these parameter values to eval-
uate the effect of variability of the element composition of the biotic system
components on the closure degree of matter cycle and, thus, on the feasibility of
implementing closure of ‘‘ecological’’ type (see below).If A is the biomass of a certain component, and � iA is the specific (relative)
content of the ith component in A, then
ð�iAAÞ�¼ �i _AAþ _�iAA; (4)
whereð�iAA�Þ is the variation rate of the ith element in component A equal to
the difference between the rate of arrival (involvement) of the ith element intoA
and its removal (elimination) from A. For example,
332 V. G. Gubanov, A. G. Degermendzhy

ð�iZZÞ� ¼ �iX�XXþ �iR�RR� �iZ
�RYRZ
R ;
and the rest by analogy:
From Eq:4;
_�iA ¼ ð�iAAÞ���iA _A
A(5)
Then
_�iX ¼ �x1
YXi� �iX
� �;
_�iR ¼ �Rð�iRZ � �iRÞ;
_�iz ¼ð�ix � �izÞ�xXþ ð�iR � �izÞ�RR
Z;
_�iU ¼�RR
Uð�iUZ � �iUÞ:
(6)
where � iRZ is the specific content of the ith element in the flow of the organicmatter onto the reducer; � iuz is the specific content of the ith element in theflow of the matter into the deadlock.
Even if, in this case, �iR and �iX are assumed to be constant (then_�iX ¼ _�iR ¼ 0; �iRZ ¼ �iR; �iX ¼ 1=YXi), then �iZ and �iU are variable when�iX 6¼ �iR.
As the components consist only of elements comprising the system only, andno other, then
Xi
�iX ¼Xi
�iR ¼Xi
�iZ ¼Xi
�iRZ ¼Xi
�iSZ ¼Xi
�iUZ ¼Xi
�iU ¼ 1 (7)
3.2 Conditions for Establishment of Biotic Matter Cycle
The system to be considered is thermodynamically closed, i.e. without exchangeof the matter with the outside.
Then, since in this case the amount of the matter within the system isconstant,
�iXXþ �iRRþ �iZZþ Siþ �iUU ¼Mi ¼ consti (8)
where Mi is the total amount of the ith element in the system for allcomponents.
Biotic Turnover in Superorganism Systems 333

This equality is the corollary of the requirement of the thermodynamic
‘‘closedness’’ of the system:
ð�iXXÞ�þ ð�iRRÞ
�þ ð�iZZÞ
�þ _Siþ ð�iUUÞ
�¼ 0; (9)
and the ratio (8) is the first integral of the system (Eqs. 3) on the ith element.Substituting the right sides of Eqs. 3 into Eq. 9 and expanding Eq. 9 for each
i, derive the ‘‘closedness condition’’ for the system, i.e. the conditions for the
constancy of amount of each ith element in the system:
�iUZ1
YRZ� 1� ’
� �¼ �iZ
YRZ� �iRZ � �isz’: (10)
These conditions only indicate that the system does not spontaneously
generate or eliminate the matter, they do not demonstrate the nature of condi-
tions sustaining prolonged operation of the system based on stable cycle of the
matter.What species (with what properties) are capable of establishing and sustain-
ing biotic cycle of thematter? Find for the system (Eqs. 3) conditions required to
maintain closure of biotic cycle and call them ‘‘closure conditions.’’ If a system is
capable of sustaining stable turnover of the matter for indefinitely long time
(which means that the time of matter turnover within a system is considerably
smaller than the time of its existence, while in the limit this ratio equals zero), it is
the case of completely closed biotic cycle, i.e. no deadlock formation. Therefore,
isolating deadlock U from the system (Eqs. 3) and imposing requirements
analogous to Eq. 9:
ðð�iXXÞ�þ ð�iRRÞ
�þ ð�iZZÞ
�þ _Siþ ð�iUUÞ
�Þð�iUUÞ�!0¼ ð�iXXÞ
�þ ð�iRRÞ
�þ ð�iZZÞ
�þ _Si ¼ 0 (11)
have sought for conditions for the given element i—closure conditions (CC):
�iz
YRZ¼ �iRZ þ �iSZ’ (12)
Condition (11) is the method of increasing the biocycle closure in some
system under study, here for the system (Eqs. 3) it is the left part of the
equivalence (12).When conditions (12) hold for all elements the system is ‘‘closed’’ for the
entire matter on the whole; at the same time the ‘‘closedness conditions’’ (10) are
met for every element i, whence in this case for the matter on the whole follows
1
YRZ¼ 1þ ’; (13)
334 V. G. Gubanov, A. G. Degermendzhy

which actually means total absence of deadlock formation (build-up).For the system (Eqs. 3) it is easy to show that
Cli ¼ YRZ’�iSZ�iZ � �iRZYRZ
;Cl ¼ ’YRZ
1� YRZ: (14)
If Cli=1, the closure conditions (12) are fulfilled, and vice versa. For Cl= 1
condition (13) is fulfilled analogically. This indicates the immanent relation of
closure conditions and the introduced closure measure, which implies that the
closure coefficient on any element or matter on the whole can reach 1, if the
corresponding CC are realized, and vice versa.Even though conditions (12) are fairly trivial (because of the simplicity of
the system (Eqs. 3)), they mean that only species with such properties are
capable of establishing a completely closed cycle of the matter. These
conditions resemble a stoichiometric relation, but in the general case it is not
so, because they depend on the method of deadlock formation and can
involve kinetic characteristics of the species. Call such a type of closure of a
biotic cycle—permanent maintenance of these conditions in invariable state—
‘‘ecological.’’ Conditions close to the ratio (12) when sign ‘‘=’’ is replaced by
sign ‘‘ � ’’ are the conditions of quasiclosure and, accordingly, the cycling
realized is quasiclosed.Conditions sufficient to sustain the cycle result from the requirement of
positiveness of cycle intensity. If the system structure is invariable this means
that all living components are positive, here: X, R > 0. As it was demonstrated
(Abrosov et al., 1976; Alekseyev, 1973; Svirezhev, 1978) for X and R to be
positive for systems of this type it is necessary to fulfil condition Mi > Mi*,
where Mi* is a certain critical value of the total (for all components) content of
the ith biogenous element in the system. Then, the stability requirement is
imposed.Writing the variability rate of the deadlock substance in the system (Eqs. 3)
element by element, we have
_Ui ¼ �RR�iz
YRz� �iRZ � �iSZ’
� �(15)
whence we can see that for element i not to form a deadlock it is required to fulfil
condition (12), i.e. the same ‘‘closure condition’’ for the ith element, and vice
versa, the absence of a deadlock leads to the fulfilment of CC.Systems with completely closed biotic cycle are non-existent in nature. Yet,
systems with the matter cycle are ubiquitous and the case in point is evaluation
of completeness of this cycle, methods to increase its closure and intensity. In
our case system of this kind can be formed (as follows from Eqs. 3) by the
species for which the following conditions are fulfilled.
Biotic Turnover in Superorganism Systems 335

for the whole matter1þ ’ � 1=YRZ; (16a)
for every element
YRZð�iRZ þ �iSZ’Þ � �iz: (16b)
It is possible to demonstrate that when �iSZ > �iUZ, then
Bi > �iZ > Ci; (17)
where
Bi ¼ �iSZð1� YRZÞ þ �iRZYRZ;Ci ¼ YRZð�iRZ þ ’�iSZÞ: (18)
if �iUZ > �iSZ, then
Ai > �iZ > Bi; (19)
where
Ai ¼ 1� YRZð1þ ’Þ þ YRZð�iRZ þ ’�iSZÞ (20)
These correlations (17–20) result from the law of conservation of the quan-tity of matter in the closed system and add to correlations (10) and (16) for therequirement of formation and sustenance of matter cycle in a natural manner inthe model—biotic cycle.
Particularly, the choice of coefficients for the model of initial conditionsshould meet correlations (10), (16), (17) and (19). Otherwise, various ‘‘exotic’’regimes of model system functioning can occur in the model and be very similarand hardly differentiated from the real regimes. However, they would still be‘‘exotic’’ going, so to say, with the conservation law disruption.
Yet, asP
i �iSZ ¼P
i �iUZ ¼P
i �iZ ¼ 1, for certain elements j fulfilled arecorrelations (17) and at the same time for other elements k realized are correla-tions (19). This fact means that the larger is the part of some element to form thedeadlock (removed from the turnover) the larger is to be its part in the deadorganic matter to maintain the turnover of the matter and vice versa. Note-worthy is the buffer role of detritus (Odum, 1975).
4 Examples of Closure Coefficients Calculation
Closure coefficients can be calculated for different systems. Experimentalinvestigations with the microecosystems presenting bacterial communitieswith Spirulina platensis as a producer were conducted Bolsunovsky et al.,
336 V. G. Gubanov, A. G. Degermendzhy

1997; Bolsunovsky, 1999; Bolsunovsky and Kosinenko, 2000. The aim of the
experiments was to find stable regimes of cultivation of spirulina at different
conditions and obtain appropriate kinetic dependencies and characteristics.
The culture Sp. platensis used in the experiments was grown on a Zarruk
nutrient solution (Pinevich et al., 1970) in the absence of phosphorus and
subsequently diluting the culture with the phosphorus-free Zarruk nutrient in
the culture filtrate. In the definite periods of the experiments additional por-
tions of mineral or organic phosphorus were added into flasks with Sp. platensis
culture. Thus in the experiments the systems in which intracellular poll of
spirulina was filled rather completely (well-formed), moderately (filled) and
poorly (unfilled) were investigated. The effect of different forms of nitrogen
on the spirulina growth was studied in two variants of the experiment. In the
first variant ammonium chloride (NH4Cl) was used as a source of nitrogen, in
the second (NH2)2CO. Development of spirulina was controlled daily by regis-
tering changes in the optical density and dry weight of the culture.On the basis of the model (Eqs. 3) mathematical models were constructed
where Sp. platensiswas taken as a producer and its growth rate was limited by the
intracellular concentration of phosphorus or carbamide nitrogen. It was shown
that themathematicalmodels were in good agreement with the experimental data.Figures 2–4 show the calculated dynamics of closure coefficients for different
variants of experimental systems limitation. Notably, the variant for the system
with non-filled phosphorus pool and without compensating it by adding phos-
phorus (012410, Fig. 2) is rather exotic—closure coefficient is more than 1. In
this case the required correlation of primary conditions for the law of matter
conservation in the system was disrupted specially for demonstration, condi-
tions (16–20). The figures indicate that the closure coefficient can be the marker
of correct choice of model coefficients and their primary values.Analysis of Fig. 4 shows that the dynamics of biocycle closure coefficient on
nitrogen for studied systems, in which Sp. platensis development is limited by
0 100 200 300 400 500 600
0.85
0.9
0.95
1.0
Hours
0.8
1234
MP0124 012410012415012420
Fig. 2 Dynamics of coefficient of system closure in terms of phosphorus (calculated) for well-formed pool (MPO124) and for the system with unfilled pool (012410, 012415, 012420). It isobvious that the version without compensation is exotic: closure is higher than 1
Biotic Turnover in Superorganism Systems 337

carbamide nitrogen, differs from the dynamics of the similar closure coefficient
for phosphorus for systems limited by phosphorus (Figs. 2 and 3). The example
of this difference is principal and important. For BLSS with crew, in case of
emergency leading to matter cycle disruption, return of the biocycle closure
degree back to primary state (required) is preferable according to the curve in
Figs. 2 and 3 than according to Fig. 4, because the state of the crew will be
determined by the depth of closure degree fall and its restoration rate. This is the
advantage of the suggested dynamic coefficient of cycle closure, which allows
estimating non-standard situations in dynamics, which is sometimes useful.It is noteworthy that the calculated closure coefficients on phosphorus were
higher than on nitrogen.
1
0.95
0.9
0.85
0.80 100 200 300 400 500 600
hours
MPO124012450012460012470
1234
Fig. 3 Calculated dynamics of coefficients of cycle closure for systems with filled phosphoruspool. All coefficients are correct
0.85
0.8
0.75
0.7
0.65
0.60 50 100 150 200 250 300
hours
0100201001
AK060103061
54321
AKMO3021
Fig. 4 Calculated dynamics of closure coefficient for systems with Spirulina growth limited bycarbamide nitrogen in the medium
338 V. G. Gubanov, A. G. Degermendzhy

5 On Realizability of Some Mechanisms of Sustaining Highly
Closed Cycle of the Matter
5.1 Ecological Principle of Biological Cycle Closure
Consider now the feasibility of the ‘‘ecological’’ principle (type) of closure.As Cli for the system (Eqs. 3) is a monotonically decreasing hyperbolic
function of �iz, passing all its values from �^iz to 1, it achieves its maximum
(=1) and minimum (=�^iz) values at the boundary of the interval on which
the function is defined, i.e. by conditions (12), (18) and (19) with �iz equal toCi or Ai, respectively. In other words, the matter cycle cannot be closed forsome element so that the specific content of this element in the forming non-living organic matter could naturally be adjusted by the organisms in thecourse of functioning to completely close in terms of this element, i.e. to havea certain degree of freedom = to be realized in terms of �iz within the intervalfrom Ci to Ai, and not at the boundary of the interval on which the function isdefined with �iz ¼ Ci. The requirement is quite rigorous, but with respect toCli = 1 it seems to have generality. Though if this can be realized, it would bealmost impossible to sustain it for a long period at the Cli definition (= at thepoint) boundary.
The complete closure can be most ‘‘simply settled’’ under the requirement forthe specific content of each biogene both in the producer and the reducer to beconstant and equal to each other. Hence it is clear why the biochemical compo-sition maintained by nature in different organism species is on the wholeapproximate. At the same time, as organisms with absolutely identical qualita-tive and quantitative element composition are non-existent in nature, bioticsystems truly closed in matter cycle can hardly be realized, i.e. speaking about‘‘closure’’ as a desirable property we should mean ‘‘quasiclosure.’’
Thus, in biotic systems the ‘‘ecological’’ type of the matter cycle can berealized under very rigorous requirements and is highly susceptible to externaldisturbances. This means that with large times it is difficult for ecosystems withpoor species composition to sustain high closure of the cycle, provided that it issustained ‘‘ecologically’’ only. Besides, the degree of cycle closure being fixed inthe characteristics of species that comprise the system hides from the viewpossible avenues to increase it.
5.2 ‘‘Evolutionary’’ Type of Closure
Given the poor feasibility of ‘‘ecological’’ type of closure, what are the otherways and opportunities to enhance closure of matter cycle in biotic systems?How can a cycle with high closure form? For example, can the Darwinianevolution (in this case it is selection by growth rates) affect the matter cycle
Biotic Turnover in Superorganism Systems 339

closure coefficient? The answer seems to be the following: If the evolution
(selection) is going by individual signs unconnected (not correlating) with the
signs responsible for the closure of the matter cycle the Darwinian evolution
does change the degree of closure of the matter cycle. So, the way to enhance
biotic closure evolutionally must be different.Natural existence of ES generates deadlocks—substances which are not
transformed by the existing set of species. Assuming that a new species emerges
in the process of evolution and involves these matters in cycling but generates
new deadlock, i.e. the trophic chain length increases = ‘‘vertical’’ species for-
mation occurs (Fig. 5).Figure 6 shows the combined model dynamics of the producer and three
sequentially occurring reducers for the model of type (Eqs. 3) constructed
Fig. 6 Combined dynamics of producer and three sequentially occurring reducers for schemein Fig. 2
Fig. 5 General scheme of cycle closure evolutionary principle
340 V. G. Gubanov, A. G. Degermendzhy

according to the scheme of Fig. 5 (we will mark this model 3* and will notdisplay it here).
Feasibility of such an ‘‘evolution’’ mechanism increasing the cycle closure isbased on the assumption of convergence of series of biomass values of emergingand co-existent reducer species and deadlocks generated by them. Analysis ofsuch a diagram in Fig. 5 with the model of 3* type disproves this assumption—the diagram is realized for the infinitely large value of the total mass of thesystem. Besides, the feasibility of such a diagram is limited by dissipation ofenergy along the trophic chain (Svirezhev, 1978).
5.3 Interaction of Microevolutionary Population Parameters
Many problems of population microbiology (especially problems of microevo-lution) are solved based on description of population dynamics and DDGFequations (equations in terms of density-dependent and growth-controllingfactors; Adamovich et al., 1987; Degermendzhy et al., 1979), which involvevarious kinetic microparameters of populations characterizing different rela-tions of organisms to environment. These parameters includemaximum specificgrowth rates, coefficients of substrate consumption (yield), Michaelis–Mentencoefficients, coefficients of various released materials, etc. By ‘‘colliding’’ simplepopulations with varied microparameters in the models, we study the conse-quences of such collision (removal, co-existence, dominance). In this case, it isconsidered that these microparameters are independent and, correspondingly,we can get the result when the predominant population grows quicker and hashigher substrate application coefficient and other advantages.
Here a principal question arises about the degree of population micropara-meters relation, when one of them varies due to, e.g. mutations. If adequatemodel would exist and describe the inter-related change of these micropara-meters, these questions could be answered. However, such models do not exist.Even in regard to a frequently used microparameter—maximum specificgrowth rate—there are several different schemes for description of specificgrowth rate dependence on DDGF: enzymatic, populational, etc. However, itfollows from the enzymatic scheme that the hypothesis on independence ofmicroparameters is beneath all criticism. Let us consider this in detail. Let themechanism of specific growth rate dependence upon the limiting substratedescribed by real enzymatic ‘‘bottleneck’’ reaction (Fig. 7) be
g ¼ �S=ðKS þ SÞ (21)
where g is the specific growth rate, � is the maximum reaction rate (�=K2E),KS
is Michaelis–Menten constant (KS=(K2þK–1)/K1).Obviously, the mutations change the microparameters (K1, K2, K�1 and E).
If, for example,K2 increases, both � andKS will increase as well, i.e. the curve of
Biotic Turnover in Superorganism Systems 341

specific growth rate dependence will become more plain, but will rise at high S
(Fig. 8). Change ofK1 will influence onlyKS, whereas �will not change (Fig. 9).
The number of such examples can be continued. Consequently, even the sim-
plest models show that microparameters are independent of one type of muta-
tion (on K1,K–1, E) and dependent on the other type (K2).The ‘‘direct’’ way of solving this problem depends upon the type of chosen
cellular or populational level model describing the microparameters similar to
the above. However, when the knowledge about the whole model of cellular
biosynthesis and its regulation is not enough, this way cannot be used. There
exists an alternative method of phenomenological type without analysis of the
relation mechanisms between the microparameters yet, though based on statis-
tical analysis. Imagine we have a collection of one strain mutants with calcu-
lated microparameters. Then, the multi-dimensional regression parametrical
Fig. 8 ‘‘Mutation’’ increase in microparameter k2 (constant of product formation—biomass)increases the macroparameters � and kS and, correspondingly, deforms the growth rate g
Fig. 7 Block diagram of‘‘bottleneck’’ enzymaticreaction. S0 input concen-tration of substrate, S back-ground concentration ofsubstrate, E general concen-tration of enzyme, ES enzy-me–substrate complex, Pfinal product concentration(biomass), k1 rate of enzy-me–substrate complex for-mation, k–1 back reactionrate, k2 rate of product,P formation (biomass)
342 V. G. Gubanov, A. G. Degermendzhy

analysis will solve the set problem on the phenomenological level. This can berealized using the electronic databases on kinetic microorganism parametersfrom museum collections. The study of different ‘‘mechanistic’’ models ofmicroparameter (or microprocesses) relations can be conducted in a parallelway.
Obviously, the cycle closure can be determined by the degree of dependencebetween population microparameters in the process of their evolutionarychanges. Therefore, this question requires specific consideration in the contextof the discussed problem.
6 General Degree of Biocycle Closure
Let us generalize the notion about the BMC closure degree on any biosystemwith cycle, including natural ones.
The measure of effective (visible) closure of matter cycle in superorganismsystems, which will integrate the biotic closure and thermodynamic openness insystems, will be introduced analogically to correlations (1). For systems open onthe matter let us indicate through Cli
* the following value:
Cli� ¼ Cli ¼
Pk
_�ikðAia;BibÞPk
_�ikðAia;BibÞ þPl
_UilðAia;BibÞ(22)
where a are the channels transferring the matter into the system from outside; bthe channels transferring thematter from the system, except deadlockmatters;Aiathe rate of ith biogenic element introduction into the system from outside throughchannel ‘‘a,’’ e.g. migrations, inflow, artificial correction, etc.; Bib the rate of ith
Fig. 9 Increasing k1 does not change � but decreases/increases kS; correspondingly, the fan ofgrowth rate curves g is formed with constant maximal specific rate �
Biotic Turnover in Superorganism Systems 343
biogen removal (taking out) from the system through channel ‘‘b,’’ e.g. yield with
complete or partial removal from the system, emigration flows, current, etc.In this case, ( _�) is the rate of any biogenic element flow from the processes, in
which there is production of biogenic elements in the ecosystem and, in this or that
way, are intercepted by producers, whereas in numerator (and correspondingly
in the denominator) there is the sum of all biogen flows produced (constructed)
within various processes in CC, and not only related to heterotrophic processes
and directed to producers.Further, let Ai be the rate of ith biogen introduction into the system from
outside through all channels ‘‘a’’ (Ai ¼P
a AiaÞ;Bi the rate of ith biogen taking
out from the system through all channels ‘‘b’’ (Bi ¼P
b Bib). Then the degree
(coefficient) of the biotic matter cycle closure (on ith element) for any system in
general case will be the following:
Cli ¼ limAi;Bi!0
Cl�i ¼ limAi;Bi!0
Pk
_�ikðAi;BiÞPk
_�ikðAi;BiÞ þPl
_UilðAi;BiÞ(23)
All is analogically for Cl, coefficient of biotic cycle closure on matter on the
whole:
Cl ¼ limA;B!0
Cl� (24)
where Cl* is the coefficient of the efficient system closure on material on the
whole; A is the rate of material introduction into the system on all ‘‘i’’ elements
and through all ‘‘a’’ channels; B is the rate of the material elimination (removal)
from the system through all ‘‘b’’ channels and on all ‘‘i’’ elements.Hence, the degree of biotic cycle closure in superorganism systems (of
ecosystem level and higher) for any biogenic element and matter on the whole
is defined by correlation of the biogen flow rate from all processes which involve
production of biogenic elements in the biosystem and are directed (biogens) to
producers (or, in this or that way, are intercepted by producers) to the sum of rates
of the same flow and matter coming to the deadlock.Thus, the degree (coefficient) of biotic cycle closure for some chemical
element in any superorganism system with the matter cycle is determined in
general according to Eq. 23 taking into consideration Eq. 22, and for the matter
on the whole according to Eq. 24, considering the formula (1b).Let us emphasize the moments which allowed introduction of general mea-
sure of the biotic matter closure for any superorganism system with biotic
matter closure: the presence of produced and reducedmatter flows in the system
(at that, the introduction of the reduced matter part is directed exactly to
producers); obligatory naturally (biotically) formed deadlocks; marking of
system boundaries; separation of thermodynamic and biotic closure terms.
344 V. G. Gubanov, A. G. Degermendzhy

Notably, the characteristic of closure in the present form is dynamic andallows estimating the closure degree on any element and matter on the whole,current, average and stationary, and comparing the systems according to theseindices and making the respective decisions and actions, if necessary.
This measure helps to increase the biocycle closure degree on any biogenicelement and matter on the whole for any superorganism system, includingbiosphere and BLSS (in practice).
7 Conclusions
Thus, by investigating the role of biotic turnover in the economy of nature, wediscern two major characteristics—closedness and intensity. Closedness spe-cifies the turnover mostly as a phenomenon, while the intensity as a process.The fact that the species composition of the ecosystems is not accidental andis defined in certain links-relations between the characteristics of speciesmakes the system and forms the biocycle (coevolutionary characteristics andrelations—analogue of stoichiometric correlations). Demonstration and regis-tration of such relations—conditions of biotic cycle formation and mainte-nance and its complete closure conditions (CC)—is the most important andnecessary moments of analysis at the mathematical description of superorgan-ism systems. The record of these correlations in terms of species’ kineticcharacteristics allows answering the following questions: what organisms(with what characteristics) are able to form and sustain highly closed matterbiocycle in natural and artificial biosystems and what are the ways of chan-ging the biotic closure of these ecosystems? It allows avoiding ‘‘exotic’’ func-tioning regimes in models which break the law of matter conservation in thesystem.
The general measure of biotic matter cycle closure in superorganism systemsof ecosystem (and higher) level for any ith biogenic element (Cli) and for thematter on the whole (Cl) was suggested. The immanent relation of the suggestedmeasure of biocycle closure and closure conditions was mentioned, meaningthat the closure coefficient on some element or matter on the whole can reach 1if the corresponding CC are realized, and vice versa.
Several mechanisms of formation and sustenance of the matter biotic cycle insuperorganism systems were suggested and studied. The ways related toincrease of buffer volume of the system on total amount of matter within andon ‘‘horizontal’’ species diversity—formation of trophic nets—would be takeninto consideration.
The evolutionary mechanism of sustaining high degree of matter cycleclosure (at least global) based on the high buffer state of matter content in thesystem and realized practically according to trigger scheme by switching fromone global limiting element to another with further introduction of the first intothe cycle seems interesting. For example, this is the excretion of carbon from the
Biotic Turnover in Superorganism Systems 345

global cycle in the form of coal, oil and gas with further return back to the cycle
or interchange of redox properties, e.g. periodic land lowering with further
sinking and vice versa. At least, such mechanics explains the paradox that the
cycle closure degree (even high) is always subunit and the global system exists
and prospers for a long time. We can say that in such mechanism the structural
instability generates functional stability.And, finally, we can suggest another mechanism illustrating themechanics of
cycle formation and retention in all superorganism systems from ecosystem to
biosphere. It is noteworthy that natural ES are not 100% closed on biocycle and
have the compensatory mechanism in the form of open exchange with other
systems = with the environment. This mechanism works when closed on the
biosphere level on the whole—biosphere is corrected bymatter inflow as a result
of volcanic activity. This is the mechanism which compensates non-complete
closure of the biosphere and allows its long-term existence. Indeed, there are
data showing that the volcanic activity, and underwater firstly, is substantial on
our planet. Thus, the correlation of biogenic and abiogenic oxygen in the
atmosphere, which is showed by the isotope composition of atmospheric oxy-
gen, is approximately 50% to 50% on the mass (Bgatov, 1985). Degassing
basalt magmatic rocks are the suppliers of free oxygen in the atmosphere. At
that, the activity of underwater volcanos is very strong. For balancing the
isotope composition of atmospheric oxygen, it would be sufficient if deep
waters of the ocean supplied only 0.5% of diluted oxygen into the atmosphere
per year. By mass, it is equal to the mass of oxygen formed in the atmosphere
every year by photosynthesis. A similar situation occurs with other elements.
Thus, solfatars of only one Ebeko volcano (Kamchatka) excrete the following
into the atmosphere every year (in tons): 4,381,830 of H2O, 1,078,790 of CO2,
11,530 of SO2, 5150 of HCl, 2880 of H2S, 1830 of N2, 330 of CH4, 10 of H2
(Bgatov, 1985). This requires special consideration but goes out of the scope of
this work.Therefore, we can state the existence of ecological and evolutional mechan-
isms of maintaining the highly closed matter biocycle in superorganism systems
and compensatory mechanisms, which possess an exogenous character for
ecosystems and endogenous for biosphere. Special periods of processes flowing
in different biosystems are very important. Therefore, the hierarchical analysis
of various types of cycle closure becomes important as well. The current closure
is maintained by the ‘‘ecological’’ type of closure. The material for formation
and maintenance of the biocycle high closure is provided by the evolutionary
process and, correspondingly, the ‘‘evolutionary’’ type of closure occurs during
the evolutionary periods. And, finally, the closure on a geological time-scale
should be taken into account. Analysis of principles and regularities of these
types of enclosures and, respectively, connecting (packing) their processes seem
a prospective problem of theoretical biology and important contribution in
understanding the formation of system relations and various, though, hier-
archically packed, biosystems.
346 V. G. Gubanov, A. G. Degermendzhy

References
Abrosov, N.S., Gubanov, V.G. and Kovrov, B.G. (1976) A theoretical study of closedecosystem functioning. Izv. SO AN SSSR 15. Ser. Biol. Vyp. 3, 3–9 (in Russ.).
Adamovich, V.A., Terskov, I.A. and Degermendzhy, A.G. (1987) Effect of autostabilizationof growth controlling factors and interactions in community. DokladyAN 295, 1236–1239(in Russ.).
Alekseyev, V.V. (1973) Dynamic stability of water biocenoses. Vodnye resursy 3, 156–166 (inRuss.).
Bartsev, S.I. (2002) Systematic approach to construction of closed ecological life supportsystems. In: J.I. Gitelson and N.S. Pechurkin (Eds), Ecological Biophysics. Logos,Moscow, vol. 3, pp. 190–226 (in Russ.).
Bartsev, S.I., Mezhevikin, V.V., Okhonin, V.A., Doll, S.C. and Rao, N.S. (1996) Life supportsystem (LSS) designing: principle of optimal reliability. 26th ICES, SAE Paper 961365.
Beyers, R.J. (1964) The microcosm approach to ecosystem biology. Am. Biol. Teacher 26,491–498.
Bgatov, V.I. (1985) The History of Earth Atmosphere Oxygen. Nedra, Moscow (in Russ.).Bolsunovsky, A.Ya. (1999) Microalgae in culture and reservoirs: Ecological and biophy-
sical mechanisms of predomination. Abstract of Ph.D. thesis in biology. Krasnoyarsk(in Russ.).
Bolsunovsky, A.Ya. andKosinenko, S.V. (2000) Intracellular pool of cyanobacteria Spirulinaplatensis culture phosphorus. Microbiology 69(1), 135–137 (in Russ.).
Bolsunovsky, A.Ya., Kosinenko, S.V. and Khromechek, E.B (1997) Study of the oxygenregime of microalgae Spirulina platensis culture. Biotechnology 7–8, 60–68 (in Russ.).
Burdin, K.S. (1978) Application of man-made microecosystems to solve theoretical andapplied problems of ecology. In: V.D. Fedorov (Ed.), Man and Biosphere. MGU,Moscow, pp. 124–144 (in Russ.).
Carpenter, S.R. (1996) Microcosm experiments have limited relevance for community andecosystem ecology. Ecology 77, 677–680.
Degermendzhy, A.G., Pechurkin, N.S. and Shkidchenko, A.N. (1979) Autostabilization ofGrowth-Controlling Factors in Biological Systems. Nauka, Novosibirsk (in Russ.).
Finn, J.T. (1976) Measures of ecosystem structure and function derived from analysis offlows. J. Theor. Biol. 56, 363–380.
Finn, J.T. (1978) Cycling index: a general definition for cycling in compartment models,Environmental chemistry and cycling processes. DOE Symposium Series 45, CONF760429, National Technical Service, Spring-field, Virginia, USA, pp. 138–164.
Folsome, C.E. and Hanson, I.A. (1986) The emergence of materially closed system ecology.Ecosystem Theory and Application. Wiley, New York, pp. 269–288.
Gitelson, J.I., Kovrov, B.G., Lisovsky,G.M., Okladnikov, Yu.N., Rerberg,M.C., Sidko, F.Ya.and Terskov, I.A. (1975) Experimental Ecological Manned Systems. Problems of SpaceBiology. Nauka, Moscow (in Russ.).
Gitelson, J.I., Lisovsky, G.M. and MacElroy, R. (2003) Manmade Closed Ecological Sys-tems. Taylor & Francis, New York.
Gubanov, V.G. and Degermendzhy, A.G. (2002) Biophysical investigations of aquaticecosystems. In: J.I. Gitelson and N.S. Pechurkin (Eds), Ecological Biophysics. Logos,Moscow, vol. 2, pp. 247–359 (in Russ.).
Gubanov, V.G. and Degermendzhy, A.G. (2003) Closure of biotic matter cycle in super-organism systems (methodological aspect). Degree of biotic closure. In: T.G. Volova (Ed.),Ecological Biophysics. SB RAS, Novosibirsk, pp. 318–333 (in Russ.).
Gubanov, V.G., Kovrov, B.G. and Fishtein, G.N. (1984) Closed microecosystems—a newtest-object for biophysical and ecological research. In: I.A. Terskov (Ed.), BiophysicalMethods of Ecosystem Research. Nauka, Novosibirsk, pp. 34–44 (in Russ.).
Biotic Turnover in Superorganism Systems 347
Kamshilov, M.M. (1966) Organic matter cycle the problem of life sense. ZhOB 27(3), 282–298(in Russ.).
Kamshilov, M.M. (1979) Evolution of Biosphere. Nauka, Moscow (in Russ.).Kovrov, B.G. and Fishtein, G.N. (1978) Experimental closed microecosystems containing
unicellular organisms. Continuous Cultivation of Microorganisms, 7th InternationalSymposium, Prague.
Lisovsky, G.M. and Tikhomirov, A.A. (2002) Subject and principles of constructing closedecological systems. In: J.I. Gitelson and N.S. Pechurkin (Eds), Ecological Biophysics.Logos, Moscow, vol. 3, pp. 133–154 (in Russ.).
Morozov, G.I. (1977) Theoretical Fundamentals in Designing Life Support Systems. Pro-blems of Space Biology. Nauka, Moscow (in Russ.).
Nelson, M., et al. (1993) Meaning of ‘‘Biosphere-2’’ in studying the ecosystem processes.Vestnik RAN 11, 1024–1034 (in Russ.).
Nixon, S.W. (1969) A synthetic microcosm. Limnol. Oceanogr. 14, 142–145.Odum, Eu. (1975) Fundamentals of Ecology. Mir, Moscow (in Russ.).Pechurkin, N.S. (1982) Energy Aspects of Super-organism Systems Development. Nauka,
Novosibirsk (in Russ.).Pechurkin, N.S. (1988) Energy and Life. Nauka, Novosibirsk (in Russ.).Pinevich, V.V., Verzilin, N.N. and Mikhailov, A.A. (1970) An investigation into Spirulina
platensis—a novel subject for a highly intensive cultivation. Plant Physiol. 17, 1037–1046(in Russ.).
Sugiura, K. (1988) A materially-closed aquatic-ecosystem: a useful tool for determiningchanges of ecological processes in space. Biol. Sci. Space 15(2), 115–118.
Svirezhev, Yu.M. (1978) On the length of trophic chain. ZhOB 39(3), 373–379 (in Russ.).Taub, F.B. (1969a) A biological model of freshwater community: a gnotobiotic ecosystem.
Limnol. Oceanogr. 14, 136–142.Taub, F.B. (1969b) Gnotobiotic models of freshwater communities. Verh. Int. Ver. Limnol.
17, 485–496.Taub, F.B. (1974) Closed ecological systems. Annu. Rev. Ecol. Syst. 5, 139–160.Tikhomirov, A.A., Ushakova, S.A., Manukovsky, N.S., Lisovsky, G.M., Kudenko, Yu.A.,
Kovalev, V.S., Gubanov, V.G., Barkhatov, Yu.V., Gribovskaya, I.V., Zolotukhin, I.G.,Gros, J.B. and Lasseur, Ch. (2003)Mass exchange in an experimental new-generation LSSmodel based on biological regeneration of environment. Adv. Space Res. 31(7),1711–1720.
Vernadsky, V.I. (1940) Biogeochemical Essays. AN SSSR, Moscow-Leningrad (in Russ.).Vernadsky, V.I. (1967) Biosphere. Mysl, Moscow (in Russ.).Voronin, G.I. and Polivoda, A.I. (1967) Life Support of Space Crafts Crew. Machine con-
struction, Moscow (in Russ.).Yablokov, A.V. and Yusufov, A.G. (1989) Evolution Teaching (Darwinism). Vysshaya
shkola, Moscow (in Russ.).
348 V. G. Gubanov, A. G. Degermendzhy

Chromosomes and Continents
I. I. Kiknadze, L. I. Gunderina, M. G. Butler, W. F. Wuelker, and J. Martin
Abstract The high level of inversion polymorphism and, correspondingly, the
abundance of inversion banding sequences (BSs) of polytene chromosomes in
the banding sequence pool of Chironomus species permit scientists to recon-
struct the cytogenetic evolution of the genus and to evaluate the role of struc-
tural rearrangements in the genome during population divergence and
speciation. We performed a quantitative assessment of the important role of
inversion polymorphism in the differentiation of natural populations and
demonstrated the adaptive significance of different gene orders in populations
of species occurring in different regions. For the first time, it has been shown
that the BS pools of populations of the same species on different continents
differed much in the sets and frequencies of gene inversion orders. BS pools of
populations on each continent were found to contain continent-specific BSs in
addition to sequences occurring on several continents. This intraspecies diver-
sity of the linear organization of the genome is one of the major factors
maintaining the evolutionary stability of species in dramatically different envir-
onments. In addition to endemic species-specific sequences, the BS pool of the
genus Chironomus contains sequences common for different species, cytocom-
plexes, and continents. These sequences, termed basic sequences, are very
important for reconstruction of genome divergence in the course of evolution.
It is suggested that they are close to the initial primitive sequences existing on
ancient supercontinents, whereas continent-specific BSs were formed after
continent separation. Comparison of all currently known BSs in the sequence
pool of the genus Chironomus showed that the genomes of the most distant
species differed by more than 90 inversion breaks, causing changes of their
linear structure. In such cases, conserved genome regions span about 10 bands.
I. I. KiknadzeInstitute of Cytology and Genetics SB, RAS, Novosibirsk, Russiae-mail: [email protected]
N. Dobretsov et al. (eds.), Biosphere Origin and Evolution.� Springer 2008
349

1 Introduction
As shown by cytogenetic analysis of chromosomal evolution, the divergence of
animal karyotypes is mediated mainly by para- and peri-centric inversions,
altering the gene order in linkage groups (Dobzhansky, 1970; Eichler andSankoff, 2003; King, 1993; Navarro and Barton, 2003; White, 1977). Compara-
tive genomics confirms this conclusion on the basis of molecular analysis ofgenomes and proteomes. The genomes of distant species, such as man, mouse,
Drosophila, and Anopheles, differ mainly by the order of genes in linkage
groups rather than the number and the set of genes (Ayala and Coluzzi, 2005;Marques-Bonet et al., 2004; Zdobnov et al., 2002).
Alteration of gene order in chromosomes during speciation can be traced
visually in dipterans, which possess polytene chromosomes with distinct bandingsequences (Beermann, 1972; Bridges, 1935; Painter, 1934; Zdobnov et al., 2002).
Species of the genus Chironomus (Diptera, Chironomidae) are particularlyappropriate for this purpose. They occur on all continents (except for Antarctica)
with highly variable environments and include numerous groups of sibling
species, whose members differ in the amount of cytological or genetic changethat has accompanied speciation. By global analysis of banding sequences (BS)
in the genus Chironomus, we have traced gene order change during speciesdivergence and dispersal. We studied BSs in 46 Eurasian endemic species (the
Palearctic biogeographic subzone), 14 North American species (the Nearctic
subzone), five Holarctic species, whose populations inhabit two continentsin two subzones, and 24 endemic species from Australia and New Zealand
(Australasian biogeographic zone). In addition, we invoked data on BSs studiedin four Central African species (Ethiopian biogeographic zone). The species
studied belonged to two subgenera: Chironomus and Camptochironomus.Before proceeding to the characteristics of BS divergence on different con-
tinents revealed by global analysis, let us consider the main parameters of the
structures of karyotypes and BSs in species of the genus Chironomus.
2 Karyotype Structure in the Genus Chironomus
Species of the genus Chironomus possess seven conserved linkage groups,
corresponding to seven chromosome arms (A, B, C, D, E, F, and G). The
chromosome arms typically form four chromosomes in the Chironomus karyo-type (n = 4). Different species possess different arm combinations: chromo-
somes AB CD EF G in the thummi cytocomplex, AE CD BF G in thepseudothummi cytocomplex, AB CF DE G in the camptochironomus cyto-
complex, etc. In rare cases, the acrocentric chromosome is not arm G, e.g., thecolumbiensis group with AG, CD, BF and E. A few species of the genus have
reduced chromosome numbers (n = 3, n = 2) owing to fusion of short arm G
350 I. I. Kiknadze et al.

with another arm (Keyl, 1962; Kiknadze et al., 1989, 1991, 1996a;Martin, 1979;
Michailova, 1989; Wuelker, 1980).The seven linkage groups correspond to seven main BSs in the karyotype of
each species. These main BSs are the most abundant in natural populations of a
species. As the karyotypes of the overwhelming majority of Chironomus species
are highly polymorphic due to various inversions, alternative BSs occur in each
species in addition to the seven main ones. They can occur at relatively high
frequencies, although not in all populations. There are also rare and unique
BSs, found in the heterozygous state in occasional larvae and in few popula-
tions. Each arm sequence is designated with a unique identifier, which includes
an abbreviation of the species name and the BS number. For example, armA of
C. plumosus has 12 BSs: pluA1, pluA2,. . ., pluA12; arm B has 8 BSs: pluB1,. . .,pluB8, etc. The set of BSs found in a particular species forms its banding
sequence pool. The pool size depends on the level of chromosome polymorph-
ism of the species. In the genus Chironomus, the pool size within a species varies
within the range 7–60 BSs.Speciation is accompanied by karyotype divergence mediated by the fixation
of various inversion BSs. The role of chromosome variability in speciation is
most clear in groups of sibling species. For example, karyotypes of virtually all
of about a dozen species belonging to gr. plumosus have common BSs in some
arms, but other arms differ by species-specific fixed inversion sequences. The
number of arms with homologous BSs varies from one to six per genome.
Correspondingly, the more homologous arms that are conserved between the
karyotypes of species, the closer are these species, and vice versa. This conclu-
sion is confirmed by Nei’s cytogenetic distances. Species divergence can be
enhanced by variability of frequencies of homologous BSs (Gunderina and
Kiknadze, 2000; Gunderina et al., 1999).Common BSs do not occur only in sibling species of the genus Chironomus.
They can be found between more distant species, even those belonging to
different cytocomplexes (Keyl, 1962; Wuelker, 1980). Such BSs found in
different cytocomplexes are termed ‘‘basic’’ and considered to be primitive,
existing before the formation of cytocomplexes. Moreover, some basic BSs are
found not only in European species, to which earlier BS studies were dedi-
cated, but also in species from other continents: North America (Wuelker,
1980; Wuelker and Martin, 1971, 1974; Wuelker et al., 1968), Australia
(Martin, 1971, 1979), South America (Wuelker and Morath, 1989; Wuelker
et al., 1989), and India (Saxena, 1995). However, the overall number and
geographical distribution of basic BSs have not been known until recently. We
attempt to recognize those BSs in the Chironomus banding sequences pool
that can be assigned as ‘‘basic,’’ trace their dispersal on various continents,
and assess their contribution to the chromosomal evolution of the genus.
Unfortunately, we have to confine our study to three of seven arms (A, E,
and F), because BSs of Australian species are currently known only for these
arms.
Chromosomes and Continents 351
3 Divergence of Banding Sequences in the Genus Chironomuson Various Continents
As mentioned above, the genus Chironomus is virtually cosmopolitan. How-ever, it is represented on each continent mainly by endemic species (Saether,2000; Shobanov et al., 1996). In addition to endemic species, the genus includesfew species with vast ranges, covering several continents and several biogeo-graphic zones. In particular, Holarctic species occur on two continents belong-ing to the Holarctic biogeographic zones: Northern Eurasia (Palearctic) andNorth America (Nearctic). For this reason, the BS designations are preceded bysymbols for the corresponding biogeographic zones or subzones, to specify thegeographic occurrence of various basic BSs. Banding sequences confined to thePalearctic are designated with p0 (e.g., p0pluA1); BSs confined to the Nearctic,with n0 (e.g., n0plu A9); BSs found on both continents of the Holarctic, with h0
(e.g., h0pluA2); Australasian BSs, with a0 (e.g., a0oppA1); and Central African(Ethiopian biogeographic zone), with e0 (e.g., e0allA1).
We can now consider BS features in species from various continents.Of the Holarctic species, we have studied BS divergence in C. plumosus,
C. entis, C. pallidivittatus, C. anthracinus, and C. annularius. Populations ofthese species occur in Northern Eurasia and North America (Butler et al., 1999;Gunderina et al., 1999; Kiknadze et al., 1996a,b, 2000). Generally, HolarcticChironomus species are characterized by high levels of chromosomal poly-morphism and, correspondingly, large banding sequence pools (Table 1). Unex-pectedly, comparison of BSs between populations of each of these species ondifferent continents shows that Eurasian and North American populationsdiffer dramatically in BS sets. These differences are related mainly to the factthat different endemic BSs occur on either continent. Eurasian populations ofeach species have their own p0BS groups, and North American populations,n0BS groups (Table 1). Naturally, in addition to these continent-specific BS, thebanding sequence pools of each species include Holarctic h0BSs, common forboth continents. The numbers of the various BS categories in the sequencepools of Holarctic species are presented in Table 1. The pools of all Holarcticspecies are dominated by p0BSs (over 50%); n0BSs constitute ca. 35%; andh0BSs are much scarcer, ca. 15%. Thus, the presence of p0- and n0BSs, endemicfor continents, is indicative of strong cytogenetic population divergencebetween the continents, whereas the presence of common h0BSs points totheir common origin. It should be mentioned that intercontinental populationdivergence can be enhanced by differences in the prevalence of certain BScategories. First, if any endemic BS occurs as a homozygote (i.e., close tofixation), the degree of divergence increases. Second, frequencies of h0BSsstrongly influence population divergence; that is, if any of them are scarce inthe Palearctic but abundant in the Nearctic, or vice versa, the divergence ofpopulations increases. Note also that theNearctic populations have lower levelsof chromosome polymorphism than Palearctic ones as reflected in the general
352 I. I. Kiknadze et al.

heterozygosity of populations and the mean number of heterozygous inversionsper individual.
The differences between populations in their BS sets and frequencies allowquantitative assessment of cytogenetic distances between them within particu-lar continents and between continents. The cytogenetic distance dendrogramshown in Fig. 1 (left) convincingly shows that intercontinental populationdivergence exceeds intracontinental divergence by an order of magnitude.
The available information indicates that the continental isolation of popula-tions of Holarctic species caused their dramatic cytogenetic differentiation,resulting in the appearance of specific inversion BSs on each continent.
Table 1 Cytogenetic divergence of the species of the genus Chironomus
SpeciesNumber ofpopulations
Number of BS perspecies (BS pool)
Cytogenetic structure ofthe BS pool
Holarctic species
C. plumosus 73 54 (28p+8h+18n)
C. entis 39 52 (26p+6h+20n)
C. annularius 10 25 (13p+6h+6n)
C. pallidivittatus 17 29 (19p+5h+5n)
C. anthracinus 17 (2p+12h_3n)
Palearctic species
C. acutiventris 2 27 (27p - -)
C. bernensis 3 16 (16p - -)
C. setivalva 8 (8p - -)
C. heterodentatus 6 24 (24 - -)
C. sokolovae 4 17 (17p - -)
C. agilis 3 8 (6p+2h -)
C. balatonicus 17 60 (58p+2h -)
C. borokensis 7 11 (9p+2h -)
C. muratensis 4 17 (15p+2h -)
C. nudiventris 4 19 (15p+4h -)
C. tentans 25 45 (39p+6h -)
C. sinicus 10 (9p+1h -)
C. suwai 10 (8p+2h -)
C. nuditarsis 16 (15p+1h -)
Nearctic species
C. crassicaudatus 1 11 (- - 11n)
C. utahensis 7 15 (- - 15n)
C. sp. B2 2 9 (- - 9n)
C. sp. B3 1 15 (- - 15n)
C. matures 13 (- - 13n)
C. atrella 2 16 (- 2h+14n)
C. sp Is 3 9 (- 2h+7n)
C. cuccini 2 9 (- 5h+2n)
C. staegeri 17 ( - 2h+15n)
Chromosomes and Continents 353

Nevertheless, Nearctic and Palearctic populations of each Holarctic species
retain common h0BSs, pointing to the common origin of the populations.
These h0BSs can be assigned to the basic BSs discussed earlier. Basic BSs
common in the Palearctic are predominant on both continents; hence, Palearc-
tic populations of Holarctic species are likely to be older. This conclusion is
supported by the lower level of chromosome polymorphism in Nearctic
populations.
Fig. 1 Dendrogram of the divergence of Palearctic (Eurasia) and Nearctic (North America)Chironomus plumosus populations constructed from cytogenetic distances between popula-tions (on the left). Dendrogram of the divergence of populations of sibling species, PalearcticChironomus tentans and Nearctic C. dilutus, constructed from cytogenetic distances (Dcg)between populations (on the right)
354 I. I. Kiknadze et al.

Few Holarctic basic BSs (hb0BSs) have been found. They are listed in Table 2:four in arm A, four in arm E, and three in arm F. Some of the hb0BSs occur notonly in Eurasia andNorthAmerica but also on other continents. For example, oneof the four arm A hb0BSs (Table 2) is common for four continents and, corre-spondingly, three biogeographic zones: Holarctic, Ethiopian, and Australian. Wedesignate this sequence as heab0A. It is the most abundant in Eurasian species.
Three of four arm E hb0BSs are detected on other continents. One of them(hab0E) is widespread over Eurasian species, less common in North Americanspecies, and scarce in Australia. Another sequence, heab0E, occurs on all con-tinents studied. It is most abundant in North Eurasia and Australia. It has beenreported that heab0E also occurs in Brazil, South America (Wuelker and Mor-ath, 1989). It is not inconceivable that further studies will show it to becosmopolitan, although there is no data on cosmopolitan BSs in Chironomidae.A third sequence, heb0E, occurs in Eurasian, North American, and CentralAfrican species. It was also found in India (Saxena, 1995), although it could notbe identified precisely because of poor image quality.
On arm F (Table 2), one of the three hb0F BSs was found on all continentsstudied and, correspondingly, designated as heab0F. Another sequence, pab0F,was found on two continents: Eurasia and Australia, being abundant inAustralia. Sequence heab0F was also detected in Brazil, South America(Wuelker and Morath, 1989; Wuelker et al., 1989). Like heb0E, it may becosmopolitan.
The banding sequence pools of many North Eurasian (Palearctic) endemicspecies contain only Eurasian p0BSs (Table 1), However, we found that thechromosome pools of some Palearctic endemics also contain h0BS, common forNorthern Eurasia and North America. Typically, a banding sequence poolcontains no more than two such h0BSs, but some species have four to sixh0BSs. In particular, six hb0BSs have been found in the chromosome pool ofC. tentans. This species shares these sequences, first of all, with its Nearcticsibling species C. dilutus, diverging relatively recently (Martin et al., 2002). Itcan be conjectured that species with few h0BSs are more divergent, whereasspecies with greater numbers of h0BSs are less divergent from Palearctic species.A total of 12 hb0BSs have been detected in arms A, E, and F of Eurasian species.They are identical to those described above for European populations ofHolarctic species and have similar dispersal on continents.
The banding sequence pools of mostNorth American endemic species studiedcontain only n0BSs, found only in Nearctic (Table 1). However, hb0BSs presentalso in Palearctic species were found in the pools of several Nearctic endemicspecies (Table 1). Generally, such sequences are few (two h0BSs), but someNearctic endemics, e.g., C. cucini, have as many as five h0BSs. This fact maypoint to close relationship of this species to Palearctic ones. The Holarctic basicBSs present in banding sequence pools of North American species are the sameas those found in Eurasian species (Table 2).
By now, BSs have been determined in banding sequence pools of fourCentralAfrican species (Ethiopian biogeographic zone): C. alluaudi, C. transvaalensis, C.
Chromosomes and Continents 355

Table2
Geographicdispersalofthebandingsequences(BS)ofthespeciesofthegenusChironomus
Arm
BS
BS
symbol
SpecieshavingBSin
Palearctic
Nearctic
Ethiopian
Australasian
A01a-02c10a-12c03i-02d09e-
04a13a-19fC
heab0 A
p0 hol,p0 m
ls,p0 pan,p0 yos,p0 sax,
p0 A
l.1,p0 rii,p0 tnu,p0 esa,h0 lon
n0 sta,n0 cuc,n0 m
aj,
n0 tar,h0 lon
e0all,
e0sp.3
a0 feb,a0 clo,a0 inc
01a-02c10a-12a13b-13a
04a-04c02g-02d09e-04d
02h-03i12c-12b13c-19fC
hb10 A
h0 plu,h0 ann,h0 ant,p0 bor,p0 suw,
p0 ber,p0 bon,p0 com,p0 sp.J
h0 plu,h0 ann,h0 ant
01-02c10a-12a03f-02h04d-
09e02d-02g04c-04a13a-
13b03g-03i12c-12b13c-
19fC
hb20 A
p0 cin,h0 ant
h0 ant
01a-19fC
hb30 A
p0 pig,h0 rip
h0 rip
E01a-03e05a-10b04h-03f
10c-13gC
hab0 E
p0 abe,p0 plu,p0 agi,p0 agi2,p0 A
L1,
p0 bel,p0 beh,p0 bon,p0 bor,p0 cin,
p0 cur,p0 fra,p0 fre,p0 spJ,p’jon,
p0 lac,p0 m
el,p0 nud,p0 ocu,p0 res,
p0 rii,p0 sor,p0 spTu3,p0 use,h0 lon,
p0 tnu,h0 ann
n0 cuc,n0 sta,n0 A
ve,
n0 spIs,n0 neo,
n0 tar,n0 dec,
h0 ant,h0 lon
a0 gro
01a-03e10b-03f10c-13gC
heab0 E
h0 plu,p0 aci,p0 apr,p0 lur,p0 uli,
p0 yos,p0 spYa2,p0 hpi,p0 pil,
p0 wue
h0 plu,n0 atr
a0 opp,a0 tim
,a0 tep,a0 sam,a0 pse,
a0 m
ad,a0 aus,a0 aus,a0 for,
a0 jac,a0 sp5,a0 sp6,a0 sp8,a0 sp9,
a0 sp7
01a-13gC
heb0E
p0 pig,h0 rip,p0 pst,p0 hol,p0 spYa4
h0 rip
e0all
01a-02e10g-10c03f-04h
10b-05a03e-03a11a-
13gC
hb30 E
p0 m
ur,h0 ent
h0 ent
F01a-10d17d-11a18a-23fC
hb10 F
p0 abe,p0 alb,p0 bal,p0 bor,p0 bel,
p0 fra,p0 jon,p0 rii,p0 sor,p0 tnu
n0 cuc,n0 m
aj,n0 tar
01a-01d06e-01e07a-10d
17d-11a18a-23fC
hb20 F
h0 plu,h0 ent,p0 bon,p0 spJ,p0 m
ur,
p0 nud,p0 use,h0 ant
h0 plu,h0 ant
01a-23fC
heab0 F
p0 pig,h0 rip,p0 nig,p0 res,h0 lon,
p0 m
el,p0 spTu1,h0 ann,h0 ant
n0 A
ve,h0 rip,h,ant,
h0 ann,h0 lon
e0all
a0 gro
356 I. I. Kiknadze et al.

sp.3, and C. formosipennis. Some data on BSs in some of these species wereformerly reported byWuelker (1980) andMartin (1979). Analysis shows that thepool of only one of four species,C. transvaalensis, includes only BSs endemic forCentral Africa. The other three species have basic BSs (heb0BSs). For example,three arms of C. alluaudi, A, E, and F, have heb0BSs (Table 2). The heb0BSs ofarms A and F are common to four continents, and the basic sequence of arm Eoccurs on three continents. Other arms have endemic e0BSs. The bandingsequence pool of C. sp.3 has the basic heb0BS similar to C. alluaudi and speciesof Eurasia and North America. Other arms have e0BSs endemic for Africa. Thebanding sequence pool of C. formosipennis has one basic heab0BS characteristicof four continents. Other arms have endemic e0BSs (Table 2).
The most prominent feature of the banding sequence pools ofAustralian andNew Zealand endemic species (Australasian biogeographic zone) is their smallerdivergence from each other. Of 24 species, 17 have common BSs linking them tothe central species C. oppositus. In addition, the BSs of Australian endemics aresimpler than in Eurasian and North American ones; they differ from standardBSs by smaller numbers of inversions.
As in Eurasia, North America, and Central Africa, the banding sequencepools of all species in Australia are dominated by endemic Australian BSs(a0BSs). However, many species also have some of the basic BSs occurring inEurasia, North America, and Central Africa. As is evident from Table 2, suchcommonBSs are present in all the three arms studied: A, E, and F. Some of themoccur on all continents, others on three, and still others on two. Five basic BSswere found in the Holarctic, Ethiopian, and Australasian biogeographic zones.
4 Basic Banding Sequences as Markers of Evolutionary
Divergence of Species Genomes
Thus, we have analyzed 271 BSs in three arms (A, E, and F) of 87 Chironomusspecies and found 11 BSs occurring on several continents, which we regard asbasic BSs. They include two heab0BSs, common for four continents (Eurasia,North America, Central Africa, andAustralia); two hab0BSs, common for threecontinents (North Eurasia, North America, and Australia); one heb0BS, com-mon for the other three continents (North Eurasia, NorthAmerica, and CentralAfrica), and six sequences (hb0BSs and pab0BSs) common for two continents(Eurasia þ North America or Eurasia þ Australia, respectively).
It is conceivable that heab0BSs, common to four continents, are the oldest.They may have belonged to a common ancestor of the genus Chironomus,existing even on Pangaea supercontinent (Fig. 2). The appearance of Chirono-midae is recorded in the range from the Triassic to Cretaceous, before thesplitting of Pangaea into Laurasia (Northern Hemisphere: Eurasia, NorthAmerica, and Greenland) and Gondwana (Southern Hemisphere: Australia,Africa, South America, and Antarctica.
Chromosomes and Continents 357

Chironomidae are recorded in the late Permian (Paleozoic)–early Triassic(Mesozoic), when the supercontinent Pangaea existed, encompassing all con-
tinents. The BSs of these Chironomidae can be designated as original ones (o0s).They included basic sequences (b0s), which remained unchanged in the course of
evolution. Later, the basic sequences existed in Laurasia, Gondwana, and on
separate continents. After splitting of Pangaea into Laurasia and Gondwana,
BS divergence was mediated by different inversions in the Northern and South-
ern Hemispheres because of different environmental conditions. Correspond-
ingly, basic b0s could partly survive in Laurasia, and new inversion sequences
common for Eurasia and North America (Holarctic h0s) could arise. Some of
these h0s were shared by several species; that is, they were basic Holarctic,
hb0s. Sequences common for future Australia (Australasian zone, a0), Africa
(Ethiopian zone, e0), and South America (Neotropic zone, t0) formed in
Gondwana. These sequences are designated as aet0s. They included basic
sequences common for several species (aetb0s). In addition, part of b0s survived,reflecting the Pangaean origin of the BSs.
Later, during formation of each continent, continent-specific endemic
sequences arose: Palearctic (p0s), Nearctic (n0s), Australian (a0), and Ethiopian
(e0s). In addition, some BSs formed in Pangaea (b0s), Laurasia (h0s, hb0s),and Gondwana (ae0s, aeb0s) survived on continents. Sequences common for
Eurasia and Australia, pab0BS, can also be assigned to that time. Later, hb0BSsfound in Northern Eurasia and North America could arise in Laurasia. Com-
mon intracontinental p0, n0, e0, and a0BSs may reflect BS divergence in endemic
species. These banding sequences may be considered the youngest.
Fig. 2 The hypothetical pattern of divergence of banding sequence (BS) of polytene chromo-somes in the genus Chironomus during formation of continents
358 I. I. Kiknadze et al.

As indicated above, basic BSs are the minority of the banding sequence pools
of species. The most numerous BSs in chromosome pools are endemic. They are
likely to have diverged independently on each continent. It is reasonable to
suggest that mutagenic effects on chromosomes differed depending on environ-
mental features on each continent (volcanism and glaciations), types of bottom
sediments in water pools inhabited by chironomid larvae, etc. This suggestion is
clearly confirmed by the fact that inversion breakpoints in endemic BSs are
strictly continent-specific.Study of the divergence of basic and endemic BSs allows the tracing of the
history of gene orders during the evolution of the chironomid chromosome
pool.
5 Scenario of BS Divergence
By now, BS divergence in the genus Chironomus has been studied for five of
seven chromosome arms (Gunderina et al., 2005; Kiknadze et al., 2003, 2004).
However, as said above, we had to confine ourselves to BSs of three arms, A, E,
and F. Phylograms of BS divergence in these arms are shown in Figs. 3a–c.ArmA (Fig. 3a) is one of themost variable arms inmany species of the genus.
However, the phylogram shows that there is a notably large group of species
whose karyotypes contain the basic sequence heab0BS. This group includes
Palearctic, Nearctic, and Holarctic species. The basic sequence heab0BS was
productive in the evolution of arm A, giving rise to BSs present in the majority
of Palearctic and Nearctic species. The left part of the phylogram indicates
Palearctic species of the genus having various inversion BSs of arm A. In
particular, inversion 4d-2g produced the basic Palearctic sequence pb0BS,occurring in eight species. In turn, various inversions in this sequence gave
rise to a large group of hb0BSs and other BSs. Other BSs in arm A of Palearctic
species were less productive, although their inversions also resulted in the
formation of species-specific BSs.The right part of the phylogram shows BSs characteristic of the banding
sequence pools of Nearctic species. It is obvious that the formation of Nearctic
BSs was mediated by quite different inversions with breakpoints located at
other chromosomal sites than in the Palearctic. Moreover, the Nearctic species
do not exhibit such a large number of basic BSs.ArmE (Fig. 3b) is the least variable in the genusChironomus. The presence of
basic BSs in this arm in a great number of species is prominent in the phylogram
of BS divergence. The most widespread is the Holarctic basic BS, hab0. It wasfound in at least 39 species, including p, n, and h species. Another basic BS,
heab0, is present in 11 species, also including p, n, and h species. The third BS,
hb3, is less widespread than the first and second ones.
Chromosomes and Continents 359

Fig. 3a Phylograms of the divergence of inversion banding sequences of the arm A in speciesof the genus Chironomus. Black circles designate numbers of inversions between sequences.Key inversions from basic sequences to Palearctic (left) andNearctic (right) ones are indicatedabove arrows. Homologous basic sequences occurring in different species are boxed. Forfurther explanations, see text
360 I. I. Kiknadze et al.

Fig. 3b Phylograms of the divergence of inversion banding sequences of the arm E in speciesof the genus Chironomus
Chromosomes and Continents 361
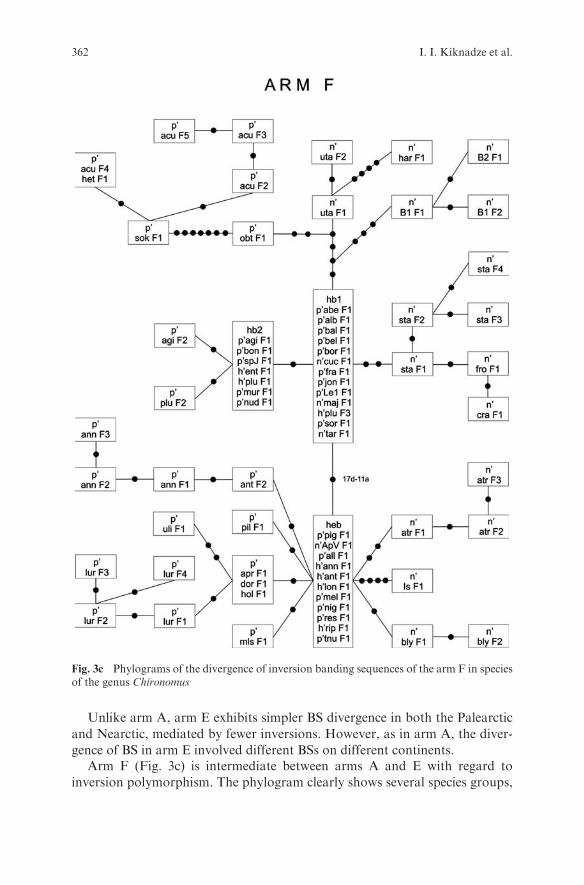
Unlike arm A, arm E exhibits simpler BS divergence in both the Palearctic
and Nearctic, mediated by fewer inversions. However, as in arm A, the diver-
gence of BS in arm E involved different BSs on different continents.Arm F (Fig. 3c) is intermediate between arms A and E with regard to
inversion polymorphism. The phylogram clearly shows several species groups,
Fig. 3c Phylograms of the divergence of inversion banding sequences of the arm F in speciesof the genus Chironomus
362 I. I. Kiknadze et al.

each of which has a characteristic basic BS. Groups with hb1 and heab BSsinclude approximately equal numbers of species. Somewhat fewer species havethe hb2 basic BS. The most productive sequences proved to be hb1 and heab.These BSs produced Palearctic andNearctic sequences; however, BSs formed inthe Palearctic and Nearctic were related to quite different inversions. This fact
Fig. 4 The NJ-phylogenetic AEF tree constructed on the basis of analysis of pairwisesimilarity between banding sequences in three chromosome arms (A, E, and F) of polytenechromosomes in 84 Chironomus species. Groups of sibling species are designated as plu, tnu,rii, obt, dec, abe, alb, pil, and pig; cytocomplexes as thu, cam, pst, mat; and biogeographiczones as p, n, h, a, e. For further explanations, see text
Chromosomes and Continents 363
indicates that different gene orders are advantageous on different continents. It
is noteworthy that, in addition to continent-specific BSs, there are groups of
common basic BSs, indicative of the common origin of Chironomus species.
6 Dispersal of Species and Banding Sequences
Analysis of BS divergence allows tracing not only of their evolution but also
of the putative pathways of species dispersal. As indicated above, the presence
of basic BSs common for the four continents analyzed suggests that ancestors
of Chironomus species existed even in Pangaea. Then, the primary BSs
diverged mostly by means of inversions and, probably, gave birth to the
endemic species of Eurasia, North America, Central Africa, and Australasia.
The subsequent history of the Earth included multiple continent aggregations
and breakups, which may have been accompanied by migrations of species
between continents. The most appropriate group for studying such migrations
is the Holarctic species, whose populations occur on several continents.As early as 1970s, the variability of BSs in chromosomes of C. tentans was
studied and it was suggested that this species had colonized North America
from Europe through Siberia and the Bering land bridge (Acton and Scudder,
1971), because the BS pool of its Alaskan populations was intermediate
between Europe and North America. By that time, nothing was known about
the banding sequence pools of Siberian C. tentans populations, but Acton and
Scudder suggested that the divergence of European BSs had begun in Siberia.
We pioneered a parallel study of BS variability in Siberian, European, and
NorthAmericanC. tentans populations (Kiknadze et al., 1996b, 1998) and found
that Siberian populations were similar to European ones in BS pools and
different in the presence of a few unique Siberian BSs and frequencies of some
main or alternative BSs. According to cytogenetic distances, Siberian and
European populations belong to one Palearctic cluster (Fig. 1 right). In contrast,
North American populations differ significantly from European and Siberian
ones by the presence of endemic Nearctic BSs and frequencies of some Holarctic
BSs. For example, h0tenF3 and h0tenA4, rare in Siberian populations, are
predominant in North America. Owing to the drastic difference in BS sets and
frequencies between Palearctic and Nearctic C. tentans populations, the
cytogenetic distances between them is at the level of differences between sibling
species (Fig. 4). On this basis, the formerly single Holarctic speciesC. tentans has
been divided into two species: Palearctic C. tentans and Nearctic C. dilutus
(Kiknadze et al., 1996b; Shobanov et al., 1999). A similar pattern of BS
divergence between Palearctic and Nearctic populations is observed in other
Holarctic species: C. pallidivittatus, C. plumosus, C. entis, C. anthracinus,
C. annularius. However, the differentiated populations of these species still
belong to one species (Butler et al., 1999; Kiknadze et al., 1998, 2000, 2004, 2005).
364 I. I. Kiknadze et al.
In all Holarctic species studied, Siberian populations aremore polymorphic inBS pools, population heterozygosity, and mean numbers of heterozygous inver-
sions thanNearctic ones. The intracontinental divergence of these populations is
greater. These data show that Siberian populations are older thanNearctic ones.
Moreover, there is one Siberian (Yakutian) population of C. tentans containing
the rare h0tenF3 and h0tenA4 BSs, which became characteristic of North
America. This leads us to the conclusion that North American populations
descended from Siberian populations after their migration through the Bering
land bridge. Obviously, migration of European populations via Greenland is not
impossible, but this way is much more difficult.For understanding the cause of migration of Siberian populations of Holarc-
tic species to North America, it should be emphasized that the last Quaternary
glaciation covered the bulk of North America and Europe for a long time,
whereas Siberia never experienced complete glaciation. Separate glaciation
zones in Siberia were confinedmainly tomountainous regions. Correspondingly,
the chironomid fauna of North America was much depauperated after comple-
tion of the solid glaciation, and its diversity may have been restored bymigration
of Siberian Chironomidae in the periods of existence of the Bering bridge.One may suggest that profound changes of BSs after migration of species to
North America resulted from colonization stress. A peculiar ‘‘chromosomal
revolution’’ during the migration is likely to have occurred as follows: The
intervention of Siberian populations presumably occurred in early Pleistocene
just after the end of the last glaciation in North America (Kiknadze et al., 1998,
2000; Martin and Porter, 1973) or in the late Pliocene (Martin et al., 2002). It is
likely that the dramatic change of environmental conditions resulted in increas-
ing frequencies of chromosome rearrangements, because stress conditions
favored variability, mediated by recombinations and mutations (Belyaev and
Borodin, 1980). The low population size, related to either mass-scale death of
individuals under extreme conditions or to colonization of new econiches accord-
ing to the founder principle, favored rapid change of BS frequencies and fixation.Ecogeographical analysis of a number of Holarctic animal and plant taxa
shows that the degree of taxonomic difference between them correlates well
with the duration of intercontinental isolation caused by the disappearance of
the Bering bridge (Beringia in Kainozoi, 1976). It is suggested that animal
populations isolated in the late Wurm–Wisconsin epoch (ca. 30 kyr BP) belong
to one species; species isolated in the late Riss–Illinoian epoch (ca. 75 kyr BP)
are semispecies or sibling species; species isolated in the late Mindel–Kansan
epoch or earlier (300–1000 kyr BP) are genuine allopatric species. The discov-
ered correlation between the taxonomical state and time of continental isolation
of populations of Holarctic species suggests that the ancestors of the species
recognized by us (C. dilutus and C. tentans) came to North America from
Eurasia in early Pleistocene or late Pliocene and evolved to the state of sibling
species. Populations of other Holarctic species migrated later and diverged to
the level of geographic populations. Therefore, another explanation for the
Chromosomes and Continents 365

different degrees of divergence between populations of different Holarcticspecies may be relevant to at least some of the species. The different divergencemay reflect different abilities of the genomes to respond to colonization stressand environmental selection. The latter hypothesis is supported by moleculardata on the divergence of two chironomid mitochondrial genes. They indicatethat C. tentans, diverging to two sibling species, andC. pallidivittatus, divergingonly to the level of differentiated populations in the Palearctic and Nearctic,synchronously migrated to North America (Martin et al., 2002).
7 Chromosome Evolution and Speciation
Comparison of BSs in species of the genus Chironomus allows assessment ofevolutionary relationships between species and construction of phylogenetictrees. The number of breakpoints altering banding order in BSs under compar-ison was used as a measure of the degree of BS divergence. The degree of BSdivergence was assessed in five chromosome arms (A, C, D, E, and F) inChironomus species by a special-purpose method (Gunderina et al., 2005;Gusev et al., 2001; Kiknadze et al., 2003). The degree of divergence, i.e., numberof breakpoints discriminating BS, increased with the rank of taxonomic differ-ence between species (Gunderina et al., 2005). In this report, we analyze the treeconstructed from data on breakpoint numbers in arms A, E, and F. Theneighbor-joining tree constructed from breakpoint numbers in three chromo-some arms in pairwise comparisons of BSs from 87 chironomid species (Saitouand Nei, 1987) illustrates a complex branched hierarchy (Fig. 4). It is apparentthat BSs of species from different cytocomplexes and groups of closely relatedspecies generally form distinct clusters on the tree. The cluster first separatedfrom the tree includes two distinct subclusters. One of them is formed by BSsfrom species of the camptochironomus-cytocomplex, the other by those fromthematurus-cytocomplex. Then a succession of three clusters is separated. Theyare formed by BSs of species of the pseudothummi-cytocomplex. The rest of thetree includes BSs of species of the thummi-cytocomplex. This is an intricatelybranched set of clusters. Most of them correspond to separate groups of closelyrelated species: plumosus, albimaculatus, aberratus, pilicornis, tenuistylus, andpiger. Two groups, decorus and obtusidens, are bulked into one cluster. Theresulting tree shows that BS evolution is in good agreement with the morpho-logically determined taxonomic positions of species in the genus Chironomus.
The tree clearly illustrates the correlation between the geographic distribu-tion of BSs of chironomid species studied and their phylogenetic relationships.Our analysis shows that this correlation is not unambiguous. In most cases, thegeographic distribution of BSs is clearly linked to the taxonomic positions ofspecies. Such a linkage is obvious in the case of BSs of species of the pseu-dothummi-cytocomplex, grouped into three clusters. One cluster is formed byPalearctic BSs, the second one by Australasian ones. The third cluster includesonly two BSs: one Australian and one Palearctic. Nevertheless, the BSs of the
366 I. I. Kiknadze et al.

species of the camptochironomus–cytocomplex belong to a single cluster inde-
pendent of the geographic region of their occurrence. The same regularity is
observed with species of the maturus-cytocomplex. The BSs of species belong-
ing to the thummi-cytocomplex occur on all continents, as clearly illustrated by
the tree. It is apparent that in most cases BSs of species belonging to one group
of closely related species occur in the same geographic regions. Thus, the
geographic diversity of BSs in the thummi-cytocomplex is determined by dif-
ferent geographic occurrences of groups of closely related species present in this
cytocomplex.This regularity has some exceptions. For example, the cluster with Palearctic
BSs of species belonging to the pseudothummi-cytocomplex also includes
Holarctic BSs of C. riparius, a species of the thummi-cytocomplex. Palearctic
BSs of C. novosibiricus, belonging to the camptochironomus-cytocomplex, and
Australian BSs of C. crassiforceps, belonging to pseudothummi-cytocomplex,
are clustered with Palearctic BSs ofC. nigrifrons from the thummi-cytocomplex
and belong to the system of BS clusters of the thummi-cytocomplex. This
phenomenon may be related to secondary translocation of corresponding
chromosome arms (Keyl, 1962), which occurred relatively recently in these
species in the course ofChironomus karyotype evolution. The result is alteration
of the arm combinations forming a chromosome and, correspondingly, transi-
tion of the species to another cytocomplex.The diversity of geographic clustering of BSs in different cytocomplexes can
be related to the differences in the time of divergence of these species and the
strategy of colonization on different continents by these species. The BSs of
species of the camptochironomus-cytocomplex belong to one cluster indepen-
dent of their geographic occurrence. This may be related to the fact that the
ancestor of the Palearctic species C. tentans and the Nearctic species C. dilutus,
as well as C. pallidivittatus, was a Holarctic species. The complete but relatively
recent geographic segregation of these species has not resulted in their complete
cytogenetic divergence and formation of independent clusters on the tree. On
the other hand, species of the pseudothummi-cytocomplex are considered the
oldest in the genus Chironomus, and this has permitted the manifestation of
both cytogenetic and geographic factors in determining their evolutionary
divergence. As a result, BSs of species of this cytocomplex are combined into
distinct clusters in agreement with their geographic occurrence. Thus, the AEF
tree shows relationships between banding sequences and species and illustrates
the geographic occurrence of Chironomus species in the past.
References
Acton, A.B. and Scudder, G. (1971) The zoogeography and races of Chironomus tentans.Limnologica 8, 83–92.
Ayala, F.J. and Coluzzi, M (2005) Chromosome speciation: human,Drosophila, and mosqui-toes. PNAS 102, 6535–6542.
Chromosomes and Continents 367

Beermann, W. (1972) Chromosomes and genes. Results and Problems in Cell Differentiation4, 1–33.
Belyaev, D.K. and Borodin, P.M. (1980) The influence of stress on the frequency of cross-ingover in chromosome 2 of mouse. Rep. USSR Acad. Sci. 253, 727–729.
Beringia in Cenosoic (1976) Far Eastern Dept. Acad. Sci. USSR, Vladivostok.Bridges, C.B. (1935) Salivary gland chromosome maps, with a key to the banding of chromo-
somes of Drosophila melanogaster. J. Hered. 26, 60–64.Butler, M.G., Kiknadze, I.I., Golygina, V.V., Martin, J., Istomina, A.G., Wuelker, W.,
Sublette, J.E. and Sublette, M.F. (1999) Cytogenetic differentiation between Palearcticand Nearctic populations of Chironomus plumosus L. (Diptera, Chironomidae). Genome42, 797–815.
Dobzhansky, Th. (1970) Genetics of Evolutionary Process. ColumbiaUniv. Press, NewYork.Eichler, E.E. and Sankoff, D. (2003) Structural dynamics of eukaryotic chromosome evolu-
tion. Science 301, 793–797.Gunderina, L.I. and Kiknadze, I.I. (2000) Divergence of karyofunds in sibling species of the
plumosus group (Chironomidae, Diptera). Russ. J. Genet. 36, 265–272.Gunderina, L.I., Kiknadze, I.I. and Golygina, V.V (1999) Intraspecific differentiation of the
cytogenetic structure in natural populations of Chironomus plumosus L., the centralspecies in the group of sibling species (Chironomidae: Diptera). Russ. J. Genet. 35,142–150.
Gunderina, L.I., Kiknadze, I.I., Istomina, A.G., Gusev, V.D. and Miroshnichenko, L.A.(2005) Divergence of the polytene chromosomes banding sequences as a reflection ofevolutionary rearrangements of the genome linear structure. Russ. J. Genet. 41, 130–137.
Gusev, V.D., Nemytikova, L.A. and Chuzhanova, N.A. (2001) Rapid method for identifica-tion of interconnections between functionally and/or evolutionarily related biologicalsequences. Mol. Biol. (Russ.) 35, 1015–1022.
Keyl, H-G. (1962) Chromosome evolution dei Chironomus. II. Chromosomenumbauten undphylogenetische Beziehungen der Arten. Chromosoma 13, 464–514.
Kiknadze, I.I., Blinov, A.G. and Kolesnokov, N.N. (1989) Molecular and cytological orga-nization of chironomid genome. In: V. Shumny (Ed.), Structural and Functional Organi-zation of Genome. Nauka SD, Novosibirsk, pp. 4–58.
Kiknadze, I.I., Shiliva, A.I., Kerkis, I.E, Shobanov, N.A., Zelentzov, N.I., Grebenjuk, L.P.,Istomina, A.G., and Prasolov, V.A. (1991) Karyotypes and Morphology of Larvae inTribe Chironomini. Nauka SD, Novosibirsk.
Kiknadze, I.I., Istomina, A.G., Gunderina, L.I., Salova, T.A., Aimanova, K.G. andSavvinov, D.D. (1996a) Banding Sequences Pool of Chironomids in Jakutian Criolito-zone. Nauka SD, Novosibirsk.
Kiknadze, I.I., Butler, M.G., Aimanova, K.G., Gunderina, L.I. and Cooper, K. (1996b)Geographic variation in polytene chromosome banding pattern of the Holactic midgeCamptochironomus tentans (Fabr.). Can. J. Zool. 74, 171–191.
Kiknadze, I.I., Butler,M.G., Aimanova,K.G., Andreeva, E.N.,Martin, J. andGunderina, L.I.(1998) Divergent cytogenetic evolution in Nearctic and Palearctic populations of siblingspecies in subgenus CamptochironomusKieffer. Can. J. Zool. 76, 361–376.
Kiknadze, I.I., Butler, M.G., Golygina, V.V., Martin, J., Wuelker, W., Sublette, J.E. andSublette, M.F. (2000) Intercontinental cytogenetic differentiation in Chironomus entis Shoba-nov, a holarctic species in plumosus-group (Diptera, Chironomidae). Genome 43, 857–873.
Kiknadze, I.I., Gunderina, L.I., Istomina, A.G., Gusev, V.D. and Nemytikova, L.A. (2003)Similarity analysis of inversion banding sequences of Chironomus species (breakpointphylogeny). In: N. Kolchanov and R. Hofestaedt (Eds), Bioinformatics of GenomeRegulation and Structure. Kluwer Acad. Press, Dordrecht, pp. 245–253.
Kiknadze, I.I., Gunderina, L.I., Istomina, A.G., Gusev, V.D. and Miroshnichenko, L.A. (2004)Reconstruction of chromosomal evolution in genus Chironomus. Euras. Entomol. J. 3,265–273.
368 I. I. Kiknadze et al.
Kiknadze, I.I., Wuelker, W.G., Istomina, A.G. and Andreeva, E.N. (2005) Bandingsequences pool in Chironomus anthracinus Zett. (Diptera, Chironomidae) in Palearcticand Nearctic. Euras. Entomol. J. 4, 13–27.
King,M. (1993) Species Evolution: The Role of Chromosome Change. Cambridge UniversityPress. Cambridge New York.
Marques-Bonet, T., Caceres, M. and Bertranpetit, A. (2004) Chromosomal rearrangementsand the genomic distribution of gene-expression divergence in humans and chimpanzees.Trends Genet. 20, 524–529.
Martin, J. (1971) A review of genus Chironomus (Diptera, Chironomidae). IY. The karyosys-tematics of australis group in Australia. Chromosoma 35, 418–430.
Martin, J. (1979) Chromosome as tools in taxonomy and phylogeny of Chironomidae(Diptera). Entomol. Scand. 10, 67–74.
Martin, J. and Porter, D. L (1973) The salivary gland chromosomes ofGlyptotendipes barbipes(Staeger) (Diptera, Chironomidae): description of inversions and comparison of Nearcticand Palearctic karyotypes. Stud. Nat. Sci. (Portales, New Mexico) 1, 1–25.
Martin, J., Guriev, V. and Blinov, A. (2002) Population variability in Chironomus (Campto-chironomus) species (Diptera, Nematocera) with Holarctic distribution: evidence of mito-chondrial gene flow. Insect Mol. Biol. 11, 387–397.
Michailova, P.V. (1989) The polytene chromosomes and their significance to the systematicsof the family Chironomidae, Diptera. Acta Zool. Fenn. 186, 107.
Navarro, A. and Barton, N.H. (2003) Accumulating postzygotic isolation genes in parapatry:a new twist on chromosomal speciation. Evolution 57, 447–459.
Painter, T.S. (1934) Salivary chromosomes and the attack on the gene. J. Hered. 25, 465–476.Saether, O. (2000) Zoogeographical patterns in Chironomidae (Diptera). Verh. Int. Verein
Limnol. 27, 290–302.Saitou, N. and Nei, M. (1987) The neighbor-joiningmethod: a newmethod for reconstructing
phylogenetic trees. Mol. Biol. Evol. 4, 406–425.Saxena, S. (1995) Basic patterns n the chromosome evolution of the genus Chironomus
(Diptera):polytenechromosomesofthethreeIndianspeciesC.plumatisetigerus,C.calipterus,andC.sp.In:P.Cranston(Ed.),Chironomids:FromGenetoEcosystems.CSIRO,Australia,pp.39–48.
Shobanov, N.A., Shilova, A.I. and Belyanina, S.I. (1996) The size and the structure of genusChironomusMeigen (Diptera, Chironomidae): the review of word fauna. In: N. Shobanovand T. Zinchenko (Eds), Ecology, Evolution and Taxonomy of Chironomidae. Tolijatti,Borok, pp. 44–96.
Shobanov, N.A., Kiknadze, I.I. and Butler, M.G. (1999) Palearctic and Nearctic Chironomus(Camptochironomus) tentans (Fabricius) are different species. Entomol. Scand. 30, 311–322.
White, M.J. (1977) Animal Cytology and Evolution. Cambridge Univ. Press, Melbourne.Wuelker, W. (1980) Basic pattern in the chromosome evolution of the genus Chironomus
(Diptera). Z. Zool. Syst. Evol. 18, 112–123.Wuelker, W. andMartin, J. (1971) Karyosystematics of the Chironomus staegeri group. Stud.
Nat. Sci. (Portales, New Mexico) 1, 22–34.Wuelker,W. andMartin, J. (1974)A review of the genusChironomus (Diptera, Chironomidae).
YI. Cytology of the maturus-komplex. Stud. Nat. Sci. (Portales, New Mexico) 1, 1–24.Wuelker, W. and Morath, E. (1989) South American Chironomus (Diptera). Karyotypes and
their relations to North America. Acta Biol. Debr. Oecol. Hung. 2, 389–397.Wuelker, W., Sublette, J.E. and Martin, J. (1968) Zur Cytotaxonomie nordamerikanischer
Chironomus-Arten. Ann. Zool. Fenn. 5, 155–158.Wuelker, W., Sublette, J.E., Morath, E. and Martin, J. (1989) Chironomus columbiensis n. sp.
in South America and C. anonymus Williston in North America—closely related species .Stud. Neotr. Fauna Environ. 24, 121–136.
Zdobnov, E.M., von Mering, C. and Letunic, I. (2002) Comparative genome and proteomeanalysis of Anopheles gambiae and Drosophila melanogaster. Science 298, 149–159.
Chromosomes and Continents 369

Part VI
Biosphere And Human Being
Genetic Landscape of the Central Asia
and Volga–Ural Region
E. K. Khusnutdinova, M. A. Bermisheva, I. A. Kutuev, B. B. Yunusbayev,
and R. Villems
Abstract The study of the Volga–Ural region and the Central Asia populations
is carried out on the basis of the analysis of SNP and microsatellites of
Y-chromosome, and also mtDNA hypervariable segment I and coding region.
Principally new data on relationship, reciprocal location, degree of similarity
and distinction of populations are received. Genetic relationships between
populations of these regions are investigated.
1 Introduction
Studies of genetic variation within and between present day human populations
provide unique information about the past human history. Phylogeographic
reconstructions based on the analysis of uniparentaly inherited mitochondrial
DNA (mtDNA) and Y-chromosome markers have become very popular in
recent years owing to their ability to provide information about the place and
the time of demographic events which can be associated with prehistoric events
in human history. Because inferences about the past population history are
based on the current phylogeographic pattern, it is essential to study present-
day genetic diversity using as many as possible population samples in order to
cover all possible geographic regions inhabited by human.Numerous studies in the recent years have yielded considerable progress in
understanding the phylogeography of Y-chromosome and mtDNA lineages
mainly in the western part of Eurasia. In contrast eastern regions like the Central
Asia and the Volga–Ural region have not been investigated systematically to the
level, currently available for the western Eurasian populations. We conducted a
number of field expeditions in order to obtain population samples from the
E. K. KhusnutdinovaInstitute of Biochemistry and Genetics, Department of Genomics Ufa, Russiae-mail: [email protected]
N. Dobretsov et al. (eds.), Biosphere Origin and Evolution.� Springer 2008
373

Volga–Ural region andCentral Asia (Table 1) and here we provide a brief reviewof our earlier and currently obtained results.
It is common to treat the Central Asia and the Volga–Ural region as acrossroad area witnessed in the past numerous waves of population migrations.According to archeological and paleoanthropological data, southern Uralsuntil Early Medieval Age was inhabited by an europeoid population whichcan be associated with the currently living representatives of different divisionsof the Europeoid major race (Pontic type of the Indo-Mediterranean race andSuburalic type which prevail among Volga basin Finnic populations)(Akimova, 1974). Ancient population of the Volga basin could be linked tothe present day Baltic and Suburalic types of the Europeoid major race(Akimova, 1974). Alexeev and Gokhman (1984) reviewed paleoanthropologi-cal studies and demonstrated that ancient population of the Central Asia regionbetween Neolithic times and until Iron Age was predominantly europeoid(Alexeev and Gokhman, 1984). Turkic-speaking nomadic people from thesouth Siberia and later Tataro-Mongol invaders are considered to be relativelyrecent newcomers into Central Asia (Alexeev, 1974; Kuzeev, 1992).
2 Materials and Methods
A total of 1949 individuals were sampled from two regions during field expeditionsin 1993–2003 (see details in Table 1). Four Turkic-speaking populations from thenorth Caucasus region: Karachays (106), Karanogays (102), Kuban Nogays (110)and Kumyks (107) were included into the analysis to provide data for comparison.Informed consent was obtained from all donors. The ethnic origin of sampledindividuals was ascertained up to three generations, as determined through oralinterviews. GenomicDNAwas extracted from peripheral blood lymphocytes usinga standard phenol–chloroform method (Mathew, 1984). We also included data onYakuts, Altaics, Shors, Nganasans, Hants, Mansi, Selkups, Tuvinians, Dolgans,Turks, Azerbaijanians and Estonians for comparison (Khusnutdinova et al., 2002).
The fragment 16,024–16,400 of mtDNA hypervariable segment I (HVS I) wassequenced in a Perkin–Elmer ABI 377 DNA sequencer with a DYEnamic ET kit(Amersham Pharmacia Biotech). The nucleotide sequences obtained were com-pared with the Cambridge reference sequence (CRS) (Anderson et al., 1981;Andrews et al., 1999).Haplogroups were identified by restriction fragment lengthpolymorphism analysis (RFLP analysis) of 39 polymorphic sites of the mtDNAcoding region as described elsewhere (Macaulay et al., 1999; Richards et al., 1998,2000; Torroni et al., 1996). Forty-two binary polymormphisms (M9, M89, YAP(M1), M174, M40, M35, M130, M48, 12f2, M267, M62, M172, M12, M201,M285, M342, P20, P15, P16, M286, M406, M287, M170, M253, P37, M223,M52, M231, Tat (M46), P43, M128, M175, M20, M70, 92R7, M207, M242,M173, SRY 1532, M73, M269 and M124) were genotyped using either RFLPanalysis or direct sequencing, following the hierarchy of the Y-chromosomephylogeny (Jobling and Tyler-Smith, 2003; YCC, 2002). Principal component
374 E. K. Khusnutdinova et al.

analysis based on the haplogroup frequencies was performed using Statisticav. 5.5 (Statsoft, 1999).
3 mtDNA Variation
The analysis of mtDNA variation among the Volga–Ural populations (Tatars,Bashkirs, Chuvashis, Mari, Mordvins, Udmurts, Komi) revealed that themajority of maternal lineages are those distributed among western Europeanand eastern European populations. Relatively high frequencies of east Asian(those specific to east Asian populations) G, D, C, Z and F haplogroups amongboth Turkic-speaking population (Bashkirs) and Finno-Ugric speaking popu-lations (Udmurts and Komi-Permyaks) possibly indicate significant geneticcontribution of Siberian and Central Asian populations. Comparable highfrequencies of east Asian and European lineages are consistent with the
Table 1 Geographic and linguistic description of studied populations
Population Country, region and district N Linguistic affiliation
Volga-Ural region
Bashkirsa Northwestern, northeastern,southwestern and southeasternethnogeographic groups ofBashkortostan
258 Turkic branch ofAltaic Languagefamily
Gaininsk Bashkirsa Perm region 60
Tatarsa Al’met’evskii and Elabuzhskiidistricts of Tatarstan
228
Chuvashisa Morgaushskii district of
Chuvashia
55
Komi-Permyaksa Komi-Permyak autonomous district 74 Finno-Ugricsubfamily ofUralic languagefamily
Komi-Zyryansa Sysol’skii district
of the Komi Republic
62
Maria Zvenigovskii district of Marii El 136
Mordviniansa Staro-Shaiginskii district ofMordovia
102
Udmurtsa Malo-Purginskii district of
Udmurtia and the Tatyshlinskiidistrict of Bashkortostan
101
Central Asia
Uzbeks Samarkandskaya, Khorezmskaya,Tashkentskaya provinces of
Uzbekistan
103 Turkic branch ofAltaic Languagefamily
Kazakhs Kazakhstan 331
Uygurs Kazakhstan 121amtDNA data from Bermisheva et al. (2002)
Central Asia and Volga–Ural Region 375
intermediate position of the Volga–Ural region but when we take into accountlinguistic affiliation of individual populations some inconsistent features indistribution of frequencies of mtDNA lineages become apparent.
It is generally believed that the first Turkic-speaking people were native to aregion spanning from Central Asia across throughout Siberia (Alexeev andGokhman, 1984). We examined distribution of mtDNA haplogroups among 18Turkic-speaking populations scattered throughout Eurasia by assuming thatwestward expansion of Turkic tribes involved spread of mainly east Asianmaternal lineages. Frequencies of east Asian mtDNA lineages ranged from 1%in Gagauz to 99% in Yakuts, with an increasing cline from west to northeast(Color Plate 7, see p. 399 ). While the frequency cline is consistent with thewestward direction of migration proportion of east Asian mtDNA lineageswithin individual populations is too small to suggest significant genetic inputassociatedwith south Siberian populations. For example, Turkic-speaking popu-lations residing in the Volga–Ural region (Tatars andChuvashis) aremore closelyrelated genetically to their geographic neighbors than to their linguistic neighborselsewhere. It looks like as if indigenous populations of the region adopted Turkiclanguageswithoutmuch genetic input as for exampleAzerbaijanians inCaucasus(Nasidze et al., 2003) and Turks in Anatolia (Cinnioglu et al., 2004). Limitedpresence of east Asian mtDNA lineages in these two Volga–Ural populations,most likely reflect consequences of language replacements that occurred via elitedominance. In general this observation is consistent with our previous suggestionthat the geographic proximity rather than linguistic relatedness best explainsgenetic similarities between populations (Khusnutdinova et al., 2002).
It should be noted that spread of east Asian lineages from Turkic homelandimply that east Asian lineages were predominant in south Siberia and expectationof high frequencies of east Asian lineages among Turkic-speaking people doesnot take into account admixture process that occurred in the course of westwardmigration. More realistic explanation could be offered if we take into accountpaleoanthropological data from south Siberian and Central Asian area. Excava-tions at burial sites belonging to Turkic people of VII–VIII AD in Tuva (southSiberian region in Russia) demonstrated detectable europeoid traits in mongo-loid human skeletal remains (Alexeev and Gokhman, 1984). Moreover, AlexeevandGokhman (1984) based on their review of paleoanthropolical studies showedthat westward expansion of Turkic people from south Siberia through CentralAsia was accompanied by gradual admixture process with indigenous europeoidpopulation (Alexeev and Gokhman, 1984). Thus, limited presence of east AsianmtDNA lineages in the Volga basin (Tatars, Chuvashis) as well as in Caucasus(Azerbaijanians) and Anatolia (Turks) (Cinnioglu et al., 2004; Nasidze et al.,2003) cannot be explained by limited genetic input. In the light of paleoanthro-pological data more realistic explanation could be the arrival of already admixedTurkic-speaking populations in these three regions which are remote fromTurkichomeland. Finally, because of Turkic people were admixed and their migrationswere accompanied by admixture process estimation of proportion of gene flowassociated with their arrival turns out to be problematic or even impossible.
376 E. K. Khusnutdinova et al.

Geographic frequency distribution of Asian mtDNA lineages among17 Finno-Ugric populations, with some exceptions, forms a similar west toeast increasing cline.
Like in the Turkic-speaking groups Asian mtDNA lineages dominate innortheastern Siberia, reaching maximum frequency in Nganasans (80%) anddecrease towards west: for example, in Estonians it is almost absent. A highproportion (60–70%) of typical west Eurasian mtDNA lineages among Hants,Mansi and Selkups living in the west Siberia does not fit to the opposite westeast frequency gradient of European lineages. These populations are character-ized by high frequency of U4 and low frequency of haplogroup W, which istypical of Finno-Ugric populations of Volga–Ural region. This may be theresult of west to east migration from Volga–Ural region (Bermisheva et al.,2002, 2004; Tambets et al., 2003; Villems et al., 2002).
So far we analyzed the mtDNA haplogroup diversity by dividing mtDNAvariants into two broad groupings (European and Asian). In order to testwhether the frequency distribution of lineages correlates with our previousfindings we summarized mtDNA haplogroup frequencies using the principalcomponent analysis (PCA). Figure 1 demonstrates the projection of theVolga–Ural, Caucasus and Central Asian populations in the plot of two prin-cipal components of mtDNA variability. As illustrated by the PC plot distribu-tion of populations approximates the previously demonstrated frequency cline.It is evident from the plot that the studied populations are clustered accordingto their geographic positions. Some deviations, for example, the close positionof Nogays in the plot to the Central Asian populations can be explained by thehigh proportion of typical east Asian mtDNA lineages in this population.
Fig. 1 PC plot based on mtDNA haplogroups frequencies for the 14 populations
Central Asia and Volga–Ural Region 377

Our preliminary summary of obtained results is that the predominantly eur-opeoid population of Central Asia and the Volga–Ural region experienced sig-nificant gene flow from eastern mongoloid populations that reshaped eventuallythe genetic (mtDNA) landscape of the Volga–Ural region and Central Asia.
4 Y-Chromosome Variation
A total of 25 distinct haplogroups were defined in the combined Y-chromosomepool of the Volga–Ural and Central Asian populations. Most paternal lineagesof the Volga–Ural and the Central Asian populations belong to the westernEurasian Y-chromosome haplogroups. Sub-clades of widely distributedR haplogroup together with northern Eurasian haplogroup N predominate inall studied populations, constituting about 25%of paternal lineages in Kazakhsand up to 91% in Bashkirs. Except Kazakhs, carrying C (25%) and J (18%)lineages in relatively high frequencies, all studied populations share consider-able portion of eastern European lineages. Haplogroup N3, which is spreadamong northern Eurasian populations (Rootsi et al., 2007; Tambets et al., 2004;Zerjal et al., 2001) according to recent phylogeographic reconstruction hasdispersed throughout north Eurasia either from northern China or southernSiberia (Rootsi et al., 2007). High incidence of this lineage among Udmurts(55%) and other Volga–Ural Finno-Ugric populations (Mari, Komi-Ziryansand Komi-Permyaks) is consistent with the scenario, according to which N3bearing ancient populations witnessed numerous bottlenecks while migratingfrom Siberia to eastern Europe. Turkic-speaking populations in the Volga–Uralregion (Chuvashis, Tatars and Bashkirs) also share this haplogroup but in lowerfrequencies. The high frequency of this lineage in the Volga–Ural region is likelyto be associated with ancient Finno-Ugric tribes and somewhat lower frequencyin neighboring Turkic-speaking groups is either a ‘‘signature’’ of Finno-Ugricgenetic input or the legacy of common ancestral population for these twolinguistically distinct groups. Indeed, taking into account that Karanogaysfrom northeastern Caucasus (N3—3%), Kyrgyz and Dungans from CentralAsia (Zerjal et al., 2002) as well as 11 Altaic-speaking south Siberian popula-tions carry this haplogroups (frequency ranges from 2% in Shors to 25% inTofalars) (Derenko et al., 2006), it is possible that N3 lineage was a commonSiberian genetic background of Finno-Ugric and Turkic tribes in the past.Overall, haplogroup N subclades (N2, N3) regardless they were brought bythe ancestors of Turkic or Finno-Ugric populations represent a significantamount of southern Siberian genetic legacy.
R subclades (R1b3, R1a1), which are widespread in Europe and West Asia,are distributed unevenly in the Central Asia and the Volga–Ural region, rangingfrom 1% in Kazakhs to 82% in Trans-Ural Bashkirs. The place and the time oforigin of these two ancient lineages are not well established yet (Kivisild et al.,2003). There is an increasing evidence that Y-chromosome haplogroup R1b3 is
378 E. K. Khusnutdinova et al.

not specific to west Europe but rather represent a genetic legacy of ancient
widely spread population of Eurasia. Recently, Al-Zahery et al. (2003) and
Cinnioglu et al. (2004) demonstrated that R1b3 Y-chromosomes in MiddleEastern populations were associated with the Taq I ht35 restriction profile
(haplotype of the complex 49a,f RFLP polymorphic system) while westEuropean populations were characterized by the ht15 haplotype. The latter is
restricted mainly to Europe and has west east decreasing gradient. Al-Zahery
et al. (2003) suggested that haplotype 35, which had uniform distribution acrosswest Eurasia, settled west Eurasia earlier and that haplotype 15 could derived
from it by a single mutation event. That mutation probably occurred withinEurope and its high incidence in western Europe could be a result of the
population bottleneck event after the Last Glacial Maximum (Al-Zahery
et al., 2003). These findings are very important because they suggest subdivisionof R1b3 lineage into yet undefined lineages, one of which (ht15) is mainly
confined to Europe. In this regard decreasing frequency cline of haplogroupR1b3 from western Europe towards eastern Europe and unexpectedly high
frequency of this lineage in the eastern most fringe, i.e. southern Urals
(>82%) and in Central Asian highlands among Tajiks, Kyrgyz and Altai(>50%) (Kivisild et al., 2003) imply that R1b3 Y-chromosomes in these two
eastern regions cannot be associated with the west east population expansionfrom Europe. In light of the earlier presence of europeoid population in both
regions this proposal seems to be plausible. Further genetic evidence is neces-
sary in order to test the above mentioned proposal.Populations located in the Volga–Ural region exhibit a complex mtDNA and
Y-chromosome lineage composition, consisting mainly of western Eurasian
lineages, with somewhat lower but comparable contribution of eastern Asianlineages. Central Asians exhibit higher frequencies of east Asian lineages com-
pared with their northern Volga–Ural neighbors. Overall, the pattern of geneticvariation in these two regions point to a stronger genetic influence of Turkic-
people on Central Asian populations compared with northern neighbors.
Finally, genetic relationships between studied populations can be best explainedby geographic proximity rather than linguistic affiliation.
References
Akimova, M.S. (1974) Anthropological investigations in Bashkiria. In: V.P. Alexeev (Ed.),Anthropology and Genogeography. Nauka, Moscow, pp. 77–97.
Alexeev, V.P. (1974) Geography of Human Races. Nauka, Moscow.Alexeev, V.P. and Gokhman, I.I. (1984) Anthropology of the Asian Part of the USSR.
Nauka, Moscow.Al-Zahery, N., Semino, O., Benuzzi, G., Magri, C., Passarino, G., Torroni, A. and
Santachiara-Benerecetti, A.S. (2003) Y-chromosome and mtDNA polymorphisms inIraq, a crossroad of the early human dispersal and of post-Neolithic migrations. Mol.Phylogenet. Evol. 28, 458–472.
Central Asia and Volga–Ural Region 379

Anderson, S., Bankier, A.T., Barrell, B.G., de Bruijn,M.H.L., Coulson, A.R., Drouin, J. et al.(1981) Sequence and organization of the human mitochondrial genome. Nature 290,457–465.
Andrews, R.M., Kubacka, I., Chinnery, P.F., Lightowlers, R.N., Turnbull, D.M. andHowell, N. (1999) Reanalysis and revision of the Cambridge reference sequence forhuman mitochondrial DNA. Nat. Genet. 23, 147.
Bermisheva, M.A., Tambets, K., Villems, R. and Khusnutdinova, E. K. (2002) Diversity ofmitochondrial DNA haplogroups in ethnic populations of the Volga–Ural region. Mol.Biol. 36, 802–812.
Bermisheva, M.A., Kutuev, I.A., Korshunova, T. Yu., Dubova, N.A., Villems, R. andKhusnutdnova, E.K. (2004) Phylogeographic analysis of mitochondrial DNA in theNogays: a strong mixture of maternal lineages from Eastern and Western Eurasia. Mol.Biol. 38, 516–523.
Cinnioglu, C., King, R., Kivisild, T., Kalfoglu, E., Atasoy, S., Cavalleri, G.L., Lillie, A.S.,Roseman,C.C., Lin, A.A., Prince,K., Oefner, P.J., Shen, P., Semino,O., Cavalli-Sforza, L.L.and Underhill, P.A. (2004) Excavating Y-chromosome haplotype strata in Anatolia. Hum.Genet. 114, 127–148.
Derenko, M., Malyarchuk, B., Denisova, G.A., Wozniak, M., Dambueva, I., Dorzhu, C.,Luzina, F., Miscicka-Sliwka, D. and Zakharov, I. (2006) Contrasting patterns ofY-chromosome variation in South Siberian populations from Baikal and Altai-Sayanregions. Hum. Genet. 118, 591–604.
Jobling, M.A. and Tyler-Smith, C. (2003) The human Y chromosome: an evolutionarymarker comes of age. Nat. Rev. Genet. 4, 598–612.
Khusnutdinova, E., Bermisheva, M., Malyarchuk, M. et al. (2002) Towards a comprehensiveunderstanding of the east European mtDNA heritage in its phylogeographic context.Meeting ‘‘Human Origins and Disease’’ Cold Spring Harbor, p. 90.
Kivisild, T., Rootsi, S., Metspalu, M., Mastana, S., Kaldma, K., Parik, J., Metspalu, E.,Adojaan, M., Tolk, H.-V., Stepanov, V., Golge, M., Usanga, E., Papiha, S.S., Cinnioglu,C., King, R., Cavalli-Sforza, L., Underhill, P.A. and Villems, R. (2003) The geneticheritage of earliest settlers persist in both the Indian tribal and caste populations. Am.J. Hum. Genet. 72, 313–332.
Kuzeev, R.G. (1992) The People of the Central Volga Region and Southern Ural. Nauka,Moscow.
Macaulay, V.A., Richards, M.B., Hickey, E., Vega, E., Cruciani, F., Guida, V., Scozzari, R.,Bonne-Tamir, B., Sykes, B. and Torroni, A. (1999) The emerging tree of West EurasianmtDNAs: a synthesis of control-region sequences and RFLPs. Am. J. Hum. Genet. 64,232–249.
Mathew, C.C. (1984) The isolation of high molecular weight eukaryotic DNA. In: J.M.Walker (Ed.), Methods in Molecular Biology. Haman Press, New York, pp. 31–34.
Nasidze, I., Sarkisian, T., Kerimov, A. and Stoneking, M. (2003) Testing hypotheses oflanguage replacement in the Caucasus: evidence from the Y-chromosome. Hum. Genet.112, 255–261.
Richards, M.B., Macaulay, V., Bandelt, H.J. and Sykes, B.C. (1998) Phylogeography ofmitochondrial DNA in Western Europe. Ann. Hum. Genet. 62, 241–260.
Richards, M., Macaulay, V., Hickey, E., Vega, E., Sykes, B., Guida, V., Rengo, C., Sellitto, D.,Cruciani, F.,Kivisild, T., Villems,R., Thomas,M., Rychkov, S., Rychkov,O., Rychkov,Y.,Golge,M., Dimitrov, D., Hill E. et al. (2000) Tracing European founder lineages in theNearEastern mtDNA pool. Am. J. Hum. Genet. 67, 1251–1276.
Rootsi, S., Zhivotovsky, L.A., Baldovic, M., Kayser, M., Kutuev, I.A., Khusainova, R.,Bermisheva, M.A., Gubina, M., Fedorova, S., Ilume, A.M., Khusnutdinova, E.K.,Osipova, L.P., Stoneking, M., Ferak, V., Parik, J., Kivisild, T., Underhill, P. andVillems, R. (2007) A counter-clockwise northern route of the Y-chromosome haplogroupsN from Southeast Asia towards Europe. Eur. J. Hum. Genet. 15, 204–211.
380 E. K. Khusnutdinova et al.

StatSoft, Inc. (1999) STATISTICA for Windows (Computer program manual). Tulsa, OK:StatSoft, Inc., Web: http://www.statsoft.com.
Tambets, K., Tolk, H., Kivisild, T., Metspalu, E., Parik, J., Voevoda, M., Damba, L.,Golubenko, M., Stepanov, V., Puzerev, V., Bermisheva, M., Knushnudtinova, E.,Usanga, E., Rudan, P. and Villems, R. (2003) Complex signals for population expansionsin Europe and beyond. In: P. Bellwood and C. Renfrew (Eds.), Examining the Farming/Language Dispersal Hypothesis. McDonald Institute for Archaeological Research,Cambridge, pp. 449–458.
Tambets,K., Rootsi, S.,Kivisild, T.,Help,H., Serk, P., Loogvali, E.-L., Tolk,H.-V.,Reidla,M.,Metspalu, E., Pliss, L., Balanovsky, O., Pshenichnov, A., Balanovska, E., Gubina, M.,Zhadanov, S., Osipova, L., Damba, L. et al. (2004) The Western and Eastern roots of theSaami—the story of genetic ‘‘outliers’’ told by mitochondrial DNA and Y chromosomes.Am. J. Hum. Genet. 74, 661–682.
Torroni, A., Huoponen, K., Francalacci, P., Petrozzi,M.,Morelli, L., Scozzari, R., Obinu, D.,Savontaus, M.L. and Wallace, D.C. (1996) Classification of European mtDNA from ananalysis of three European populations. Genetics 144, 1835–1850.
Villems, R., Rootsi, S., Tambets, K., Adojaan, M., Orekhov, V., Khusnutdinova, E. andYankovsky, N. (2002) Archaeogenetics of Finno-Ugric-speaking populations. In: K Julku(Ed.), The Roots of Peoples and Languages of the Northern Eurasia. Gummerus OY,Juvaskyla, pp. 271–284.
Y Chromosome Consortium (YCC) (2002) A nomenclature system for the tree of humanY-chromosomal binary haplogroups. Genome Res. 12, 339–348.
Zerjal, T., Beckman, L., Beckman, G., Mikelsaar, A.-V., Krumina, A., Kucinskas, V.,Hurles, M.E. and Tyler-Smith, C. (2001) Geographical, linguistic, and cultural influenceson genetic diversity: Chromosomal distribution in Northern European populations. Mol.Biol. Evol. 18, 1077–1087.
Zerjal, T., Wells, R.S., Yuldasheva, N., Ruzibakiev, R., and Tyler-Smith, C. (2002) Agenetic landscape reshaped by recent events: Y-chromosomal insights into CentralAsia. Am. J. Hum. Genet. 71, 466–482.
Central Asia and Volga–Ural Region 381

Problems of Reconstruction of Paleoenvironment
and Conditions of the Habitability of the Ancient
Man by the Example of Northwestern Altai
A. K. Agadjanian
Abstract Using the example of the northwestern Altai, the reconstruction of
environment and conditions of habitats of the Paleolithic man are considered. It
is shown that, in the Late Pleistocene of the Anui valley, the climate became
more continental on the background of alternation of dry and humid climatic
phases. Communities show a mosaic structure. Clear relationships between
natural conditions of the Late Pleistocene, the structure of animal populations,
and the state of the population and mode of life of the Paleolithic man are
established.
1 Introduction
A topical problem in the study of the biosphere is the reconstruction of its
development at the late stage of geological history, the position and role of
the Paleolithic man in its structure. The resolution of these questions is
important for a better understanding of the role of the modern man in the
ecology of natural systems, an appraisal of the effect of economic activity on
various components of the biosphere. Large regional ecological crises con-
nected with human activity occurred at least 2000 years ago and even earlier.
It is necessary to detect and study in detail these events and compare with the
development of natural systems. This will provide the elaboration of prog-
nostic models for the behavior of modern and future natural associations and
the revelation of factors and parameters of human impact on biological
resources and, hence, the development of measures for environmental
protection.
A. K. AgadjanianPaleontological Institute, Russian Academy of Sciences, Moscow, Russiae-mail: [email protected]
N. Dobretsov et al. (eds.), Biosphere Origin and Evolution.� Springer 2008
383
2 Material
The area studied is located in the western part of the Altai Mountains, in themiddle and upper reaches of the Anui River. This is a system of mountainranges separated by deep valleys, with the altitudinal fluctuations from 500 to2300 m above sea level. Altitudinal zonation of vegetation is well pronounced.The mountain slopes are mainly covered with taiga forests. River valleys mostlycontain meadow–steppe associations. Communities of the nival type occur atelevations above 1800 m.
Both closed (Denisova, Kaminnaya, Ust’-Kanskaya caves) and open(Ust’-Karakol, Anui-2, Anui-3, etc.) Paleolithic sites were examined.
Open Paleolithic sites and later human habitats were studied in Russia for along time. Classical works in this field were performed by Pidoplichko (1929,1934, 1936), Gromov (1953, 1957, 1961) and Gromov and Fokanov (1980).Mammal remains from the Paleolithic beds of the Anui basin were collectedand identified from the first stage of their study (Agadjanian, 1998, 1999;Agadjanian and Shun’kov, 1999, 2001; Agadjanian et al., 1999; Derevyankoand Markin, 1992; Derevyanko and Molodin, 1994; Derevyanko et al., 1998,1999; Germonpre, 1993; Ivleva, 1990; Ovodov and Ivleva, 1986; Shun’kov andAgadjanian, 2000; Vasil’ev and Grebnev, 1994).
Apparently, an important factor of the accumulation of material in opensites was man. All Paleolithic sites of the Desna, Dnieper, and the lower reachesof the Don have yielded abundant marmot bones. Beavers are abundant in latersettlements in the central part of the Russian Plain. Hares occur in almost allsites. Marmot bones from the Kamennaya Balka site in the southern RussianPlain were exposed to fire and occurred in the fire-spots (Agadjanian, 2006).Marmot bones from the Betovo Paleolithic site on the Desna River show cleartraces of dissection of the skeleton by sharp cutting tools. Beaver bones from theMesolithic settlement of Yazykovo in the Tver Region and the D’yakovo site inKolomenskoe (Moscow) have traces of flaying, dissection of corpses, andseparation of meat from the bones. The widespread use of marmot as food iscorroborated by the material from Paleolithic sites of France (Patou, 1987).
3 Results
3.1 Contemporaneous Animals of the Anui Valley
The study performed shows the pattern of altitudinal zonation and the structure ofthe small mammal community. The following biotopes are recognized in the Anuidrainage basin: floodplain–meadow, meadow–steppe, larch–birch, birch–pine,cedar pine forests, subalpine moss–shrub, mountain–steppe petrophilous, andnival sedge-grass. Each association is distinguished by its small mammal
384 A. K. Agadjanian

assemblage. It is shown that the vicinity of Denisova cave is dominated by the voleClethrionomys rutilus Pallas, which comprised the majority of small mammals inalmost all biotopes (39%of animals caught). On the forested slopes and cedar pineforests, this vole composes up to 80% of animals. Even on dry forestless slopes, inthe river and meadow biotopes, the proportion of the root vole is 20–30%. Thesecondmost abundant group is composed of common voles of the genusMicrotus,which occur in the biotopes with a low relief. Microtus arvalis Pallas is mostabundant (18.5%). The floodplain is inhabited by M. oeconomus Pallas (4%).Apodemus uralensis Pallas and A. peninsulae Thomas are common on dry slopescovered with acacia (up to 30–40% of small mammals). In the lower part of theslopes, with a well-developed soil cover, the Altai mole Asioscalops altaicaNikolsky occurs frequently. The proportion of other small mammal species isless than 3%; however, this poorly corresponds with their role in communities.In particular, the chipmunk Eutamias sibiricus Laxmann frequently occurs atall altitudes from the floodplain of the Anui to the near-top mountain sites. Theground squirrel Spermophilus undulatus Pallas inhabits flat slopes with poorherbage in the Anui and Karakol valleys. The Baraba (or Dahurian) hamsterCricetulus barabensis Pallas sometimes occurs in the grassy-forb sites. In biotopeswith dense forbs on the floodplain and flat slopes, two species ofSicista, S. betulinaPallas and S. napaea Hollister, are recorded. On high terraces and flat slopes, thezokorMyospalax myospalax Laxmann is rather common. It is safe to assume thatat present the Anui valley is dominated by taiga mammal assemblages. In parti-cular, they prevail in the vicinity of Denisova cave position.Meadow communitiesare less significant, while steppe associations are absent from this area. However,isolated representatives of these associations occur in agricultural and meadowcommunities.
3.2 Small Mammals from the Pleistocene of Denisova Cave
Deposits ofDenisova cave yielded a total of 34,663 of identifiable bone specimens.Taphocenoses from different sites of the cave floor are rather similar; this makesthe results obtained rather reliable. The list of small vertebrate taxa from thePleistocene of Denisova cave includes more than 40 species.
The distribution of vertebrate bone remains over the sedimentary sequence ofDenisova cave allows the reconstruction of environmental changes in the vici-nity of the cave during the accumulation of the Pleistocene beds. Comparison ofthe modern fauna of the Anui canyon, its slopes, and adjacent sites of the valleywith the fossil fauna (taphocenosis) from the Pleistocene beds of Denisova caveshows their significant differences. In particular, the modern fauna of the Anuibasin lacks characteristic elements of steppe communities, such as marmot,Eversmann’s hamster, mole-vole (Ellobius), lemming, and Lagurus lagurus. Allthese taxa occur here as fossils. As for the species present in both modern andfossil communities, they substantially differ in abundance. The modern fauna of
Problems of Reconstruction of Paleoenvironment 385

the Anui basin is dominated by voles of the genus Clethrionomys, characteristic
indicators of taiga conditions. The Pleistocene fauna of the cave is dominated by
the voles Stenocranius gregalis and Alticola strelzovi, which inhabit dry steppes
and tundras or highland steppes. In the modern fauna, Asian wood mice of the
genusApodemus (A. uralensis andA. peninsulae), representatives of the southern
taiga subzone, play an important role. These species are extremely rare in the
Pleistocene beds of the cave. In the modern fauna, the second most important
group after red-backed voles is common voles (Microtus), specialized vege-
tarians living in herbage meadows. In the fossil fauna of Denisova cave, they
compose not more than 5%. The pika Ochotona is currently not numerous and
has a patchy distribution in the area studied, but it is relatively common in the
fossil record. This indicates changes in the composition of the small mammal
fauna at the Pleistocene–Holocene boundary. They were expressed in a reduc-
tion of nival and steppe elements of the biota and increase in the proportion of
taiga species due to reorganization of ecosystems in the Anui valley and, prob-
ably, throughout the Altai Mountains at the Late Pleistocene–Holocene
transition.The turnover of ecosystems should not be overestimated. Both the fossil record
and extant fauna constantly include regional endemic species, such as theAltaimole
A. altaica and the zokorM. myospalax. Several characteristic East Siberian species
occur in both the modern biota and the fossil record: long-tailed ground squirrel,
chipmunk, Siberian ruddy vole, flat-headed vole, Baraba hamster, and other forms.
This suggests that changes in the ecological composition of communities proceeded
against a backgroundof a generally stable zoogeographic situation. The community
of the area studied mainly originated from the Altai Mountains and adjacent
territories.Nival (Alticola) and steppe (Spermophilus, Stenocranius, and Lagurus) taxa
dominate along the studied sequence pointing to a more important role of
communities of open landscapes than at present. The area of scree slopes
occupied by mountain–steppe petrophyte associations was much larger. High
terraces, gentle slopes, and near-top plateaus were occupied by light steppe
vegetation rather than by high meadow herbage with dense turf, as today. The
presence of marmots in the taphocenosis, though probably underestimated,
confirms this. An indicator of dry steppes and semideserts is the mole-vole
Ellobius, which sporadically occurs in the Pleistocene beds of Denisova cave.
Today, its nearest populations occur in steppe Altai. The continuous presence
of the Altai pika indicates extensive scree areas.However, the domination of steppe and nival communities was not constant
and complete. All Pleistocene beds of the section contain remains of the Siberian
ruddy voleC. rutilus. This is evidence of a stable existence of forest vegetation in
the site investigated in the Anui valley. The presence of chipmunk and, espe-
cially, red squirrel and flying squirrel, typical arboreal species, fully confirms this
conclusion. The sites of larch–birch and birch–pine and possibly Siberian cedar
pine forests, similar to modern forests, existed throughout the Late Pleistocene.
386 A. K. Agadjanian

3.3 Small Mammals from the Ust’-Karakol Paleolithic Site
All specimens of the Ust’-Karakol site come from the natural sequence of soils,loesses, floodplain, and alluvial deposits. A larger part of the material belongsto species that lived directly in this part of the valley. The structure and textureof beds strongly suggest that vertebrate bones and mollusk shells were includedin the strata without a distinct effect of dynamic or biogene processes. This givesa special significance to the material of the open site Ust’-Karakol. The totalnumber of determined specimens is 1908. The list of small mammals of thetaphocenosis includes about 30 species. Small mammal bones are unevenlydistributed over the beds.
Ground squirrels and zokor were the major components of the smallmammal community in the Anui valley during the accumulation of the Pleis-tocene strata. The group of codominants includes shrews, mole, red-backedvole, narrow-skulled vole, and, partly, common hamster and root voles. Thegroup of rare species includes jerboa, mole-vole, Lagurus, lemmings of the tribeLemmini, the gray voles M. hyperboreus and M. agrestis, the water voleArvicola, and pika. The group of very rare species includes red squirrel,chipmunk, marmot, Baraba hamster, birch mouse, and the Asian highlandvole Alticola. In all the features listed, the fossil fauna of Ust’-Karakol isessentially different from the taphocenosis of Denisova cave; this reflects localbiotopic conditions. In contrast to Denisova cave, the fauna completely lacksbats and has very rare Alticola and very few hamsters.
The proportions of the major ecological groups of small mammals and theirdynamics trace the general pattern of the change in faunal composition andenvironment in the Upper Pleistocene of the Anui valley near the mouth of theKarakol River. In general, from Bed 19B to Bed 11A, the assemblage wasdominated by ground squirrels, while from Bed 11B, by zokor. Forest species,such as the red squirrel, chipmunk, red-backed voles mostly occur in the lowerpart of the section (Beds 18A to 11A).Most records of Lemmini also come fromthis interval (Beds 18B to 14). In the taphocenosis of the upper part of thesection, starting from Bed 11A, an important role is played by the commonhamster and narrow-skulled vole with the total domination of zokor. Thus,essential changes of paleogeographic conditions at the boundary of Beds 11Band 11A are assumable.
4 Mammal Fauna and Activity of the Paleolithic Man
The above data show that environmental and climatic changes in the Pleistoceneof the Anui basin were directional. The Late Pleistocene is characterized by ageneral decrease in the heat supply and an increase in the continentality of theclimate. The general direction of the process was complicated by periodicfluctuations caused by alternation of relatively dry and more humid climatic
Problems of Reconstruction of Paleoenvironment 387
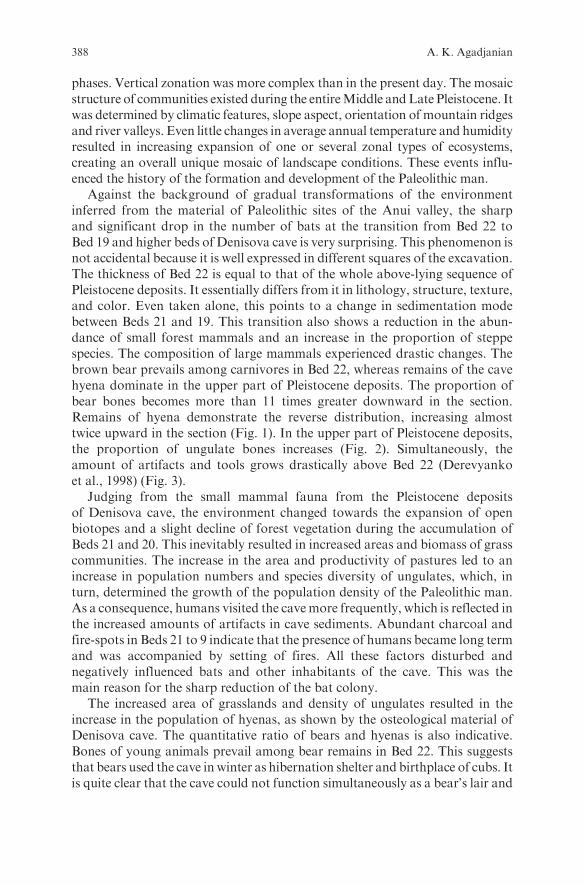
phases. Vertical zonation was more complex than in the present day. The mosaicstructure of communities existed during the entireMiddle andLate Pleistocene. Itwas determined by climatic features, slope aspect, orientation of mountain ridgesand river valleys. Even little changes in average annual temperature and humidityresulted in increasing expansion of one or several zonal types of ecosystems,creating an overall unique mosaic of landscape conditions. These events influ-enced the history of the formation and development of the Paleolithic man.
Against the background of gradual transformations of the environmentinferred from the material of Paleolithic sites of the Anui valley, the sharpand significant drop in the number of bats at the transition from Bed 22 toBed 19 and higher beds of Denisova cave is very surprising. This phenomenon isnot accidental because it is well expressed in different squares of the excavation.The thickness of Bed 22 is equal to that of the whole above-lying sequence ofPleistocene deposits. It essentially differs from it in lithology, structure, texture,and color. Even taken alone, this points to a change in sedimentation modebetween Beds 21 and 19. This transition also shows a reduction in the abun-dance of small forest mammals and an increase in the proportion of steppespecies. The composition of large mammals experienced drastic changes. Thebrown bear prevails among carnivores in Bed 22, whereas remains of the cavehyena dominate in the upper part of Pleistocene deposits. The proportion ofbear bones becomes more than 11 times greater downward in the section.Remains of hyena demonstrate the reverse distribution, increasing almosttwice upward in the section (Fig. 1). In the upper part of Pleistocene deposits,the proportion of ungulate bones increases (Fig. 2). Simultaneously, theamount of artifacts and tools grows drastically above Bed 22 (Derevyankoet al., 1998) (Fig. 3).
Judging from the small mammal fauna from the Pleistocene depositsof Denisova cave, the environment changed towards the expansion of openbiotopes and a slight decline of forest vegetation during the accumulation ofBeds 21 and 20. This inevitably resulted in increased areas and biomass of grasscommunities. The increase in the area and productivity of pastures led to anincrease in population numbers and species diversity of ungulates, which, inturn, determined the growth of the population density of the Paleolithic man.As a consequence, humans visited the cavemore frequently, which is reflected inthe increased amounts of artifacts in cave sediments. Abundant charcoal andfire-spots in Beds 21 to 9 indicate that the presence of humans became long termand was accompanied by setting of fires. All these factors disturbed andnegatively influenced bats and other inhabitants of the cave. This was themain reason for the sharp reduction of the bat colony.
The increased area of grasslands and density of ungulates resulted in theincrease in the population of hyenas, as shown by the osteological material ofDenisova cave. The quantitative ratio of bears and hyenas is also indicative.Bones of young animals prevail among bear remains in Bed 22. This suggeststhat bears used the cave in winter as hibernation shelter and birthplace of cubs. Itis quite clear that the cave could not function simultaneously as a bear’s lair and
388 A. K. Agadjanian

a human dwelling. This suggests infrequent visits of humans to the cave during
the accumulation of Bed 22, which is supported by the small amount of artifacts
found. After the change of environmental conditions, an increase in the areas of
meadow and steppe biotopes, growth in numbers of ungulates, hyenas, and
humans, the bear was forced out of the cave. The facts listed above confirm
this conclusion.It is more difficult to explain how humans and hyenas could share the cave in
the periods of their activity. It is known that hyenas need a protected shelter for
giving birth to cubs only in spring and early summer. On the contrary, humans
probably used the cave as a shelter primarily in fall and winter periods. Cave
walls, especially combined with the use of fire, gave protection from the cold. It
is the fire use that would have had an unfavorable effect on the bat colony which
inhabited the cave at previous stages of its history. However, life in the cave also
had its limitations for humans. Denisova cave is located in a narrow part of the
Anui canyon, which restricts a wide outlook on the area and prevents hunting of
moving herds of ungulates. Therefore, at the beginning of a warm season,
Fig. 1 Proportions of bear and hyena bones in the beds of Denisova cave. 1 abundance bonesof bear; 2 abundance bones of hyena
Problems of Reconstruction of Paleoenvironment 389
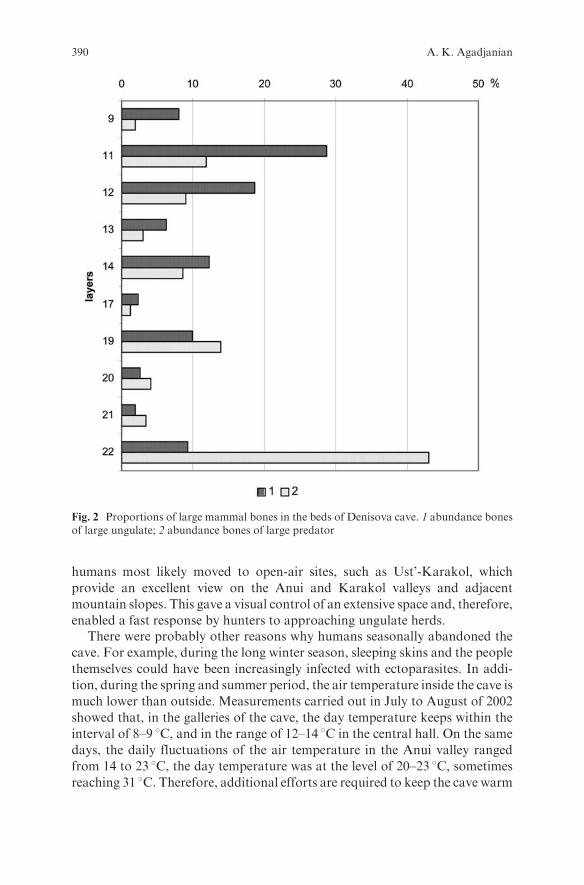
humans most likely moved to open-air sites, such as Ust’-Karakol, which
provide an excellent view on the Anui and Karakol valleys and adjacent
mountain slopes. This gave a visual control of an extensive space and, therefore,
enabled a fast response by hunters to approaching ungulate herds.There were probably other reasons why humans seasonally abandoned the
cave. For example, during the long winter season, sleeping skins and the people
themselves could have been increasingly infected with ectoparasites. In addi-
tion, during the spring and summer period, the air temperature inside the cave is
much lower than outside. Measurements carried out in July to August of 2002
showed that, in the galleries of the cave, the day temperature keeps within the
interval of 8–9 8C, and in the range of 12–14 8C in the central hall. On the same
days, the daily fluctuations of the air temperature in the Anui valley ranged
from 14 to 23 8C, the day temperature was at the level of 20–23 8C, sometimes
reaching 31 8C. Therefore, additional efforts are required to keep the cave warm
Fig. 2 Proportions of large mammal bones in the beds of Denisova cave. 1 abundance bonesof large ungulate; 2 abundance bones of large predator
390 A. K. Agadjanian

in summer. It is also noteworthy that most of the dry brushwood in the cave’s
vicinity was consumed during the fall–winter period. In this situation, the move
of its inhabitants to open air summer sites became almost inevitable. Thus,
humans and hyenas could use the cave in different seasons of the year.The data on bones of large mammals of Denisova cave reveals another
regularity. As indicated by archeological materials, the presence of humans in
the cave during the accumulation of Bed 22 was minimal, as well as their
influence on the formation of the taphocenosis of this bed (Derevyanko et al.
2003). During this interval, bones of ungulates were brought into the cave only
by carnivores. The quantitative ratio of bones of predators and ungulates in Bed
22 is 4.73:1, which corresponds to their natural ratio in taphocenoses formed
without human influence. This ratio of predator to victim bones would have
been retained during all the time of the formation of the cave’s taphocenoses in
the absence of humans. However, the actual data indicate a steady increase
through the time in relative (and absolute) numbers of bones of herbivores.The proportions reported allow the share of bones brought by predators and
by humans to be calculated for every bed ofDenisova cave. The results obtained
are shown in Fig. 4.
Fig. 3 Number of tools of the Paleolithic man from the beds of Denisova cave. 1 abundanceof tools
Problems of Reconstruction of Paleoenvironment 391

Figure 4 clearly shows a sharp increase during the Late Pleistocene in theamount of bones of herbivores brought by humans. This, in turn, reflects the
increased human pressure on the populations of ungulates and the environment
in general.The data presented reveal the existence of intricate links between natural
conditions of the Late Pleistocene, the composition of animal communities, the
condition of populations, and the economy of prehistoric people. It is assumed
that these links were not only unidirectional but had a feedback. The activity of
Paleolithic people exerted a considerable influence on natural resources of the
Anui valley throughout the last 100,000 years or even more.
Fig. 4 Proportions of large herbivore bones brought to Denisova cave by large carnivores andhumans during the Late Pleistocene. 1 bones abundance of large ungulate brought toDenisovacave by Paleolithic humans; 2 bones abundance of large ungulate brought to Denisova cave bylarge carnivores; 3 bones abundance bones large carnivores in Denisova cave
392 A. K. Agadjanian
Acknowledgment The study was supported by the programs of Presidium of the RussianAcademy of Sciences ‘‘Origin and Evolution of the Biosphere,’’ ‘‘Biological Resources ofRussia: Fundamental Bases of Efficient Use,’’ and the Russian Foundation for BasicResearch, project no. 05-04-48493a.
References
Agadjanian, A.K. (1998) Small mammal fauna of Denisoava cave // Paleoecology andPaleolithic culture of century of Northern Asia and neighbouring territories. (The materi-als of international symposium), volume 1. Novosibirsk: Institute archeology and ethno-graphy SB RAS. pp. 34–41
Agadjanian, A.K. (1999) Small mammals of Holocene beds of Denisova cave. Problems ofArchaeology, Ethnography, and Anthropology of Siberia and Adjacent Territories. Inst.Arkheol. Etnogr. Sib. Otd. Ross. Akad. Nauk, Novosibirsk, vol. 5, pp. 226–231.
Agadjanian, A.K. (2006) Small mammals of the major layer of the Upper Paleolithic site ofKamennaya Balka II. Paleoecology of the Paleolithic Plain. Nauchnyi Mir, Moscow,Appendix no. 1, pp. 318–328.
Agadjanian, A.K. and Shun’kov, M.V. (1999) The rests of small mammal from sedimentsPaleolithic site Anuy-3. // the problem archeology, ethnography, anthropology of Siberiaand neighbouring territories. Volume V. Institute archeology and ethnography SB RAS,Novosibirsk, pp. 6–10.
Agadjanian, A.K. and Shun’kov, M.V. (2001) The microtheriological characteristic of multi-layer profil Paleolithic site Ust’-Karakol-1 // Problem archeology, ethnography, anthro-pology of Siberia and neighbouring territories. Novosibirsk: Institute archeology andethnography SB RAS, Novosibirsk, Volume VII. pp. 37–42.
Agadjanian, A.K. Malaeva, L.M., Shun’kov M.V. (1999) Experience of reconstruction of anatural environment of the Paleolithic man of Denisova cave. // Ecology of ancient andmodern communities. Tyumen: Institute of problems of development of North SB RAS,1999, pp. 9–12.
Derevyanko A.P. and Markin, C.V. (1992) Musterian of Mountain Altai. Novosibirsk:Science. 225 p.
Derevyanko, A.P. and Molodin, V.I. (1994) Denisova Cave. Nauka, Novosibirsk.Derevyanko, A.P., Agadjanian, A.K., Baryshnikov, G.F., et al. (1998) Archaeology, Geology
and Paleogeography of the Pleistocene and Holocene of the Altai Mountains. Inst.Arkheol. Etnogr. Sib. Otd. Ross. Akad. Nauk, Novosibirsk.
Derevyanko, A.P., Shun’kov,M.V., Agadjanian, A.K., et al. (1999)Multilayer paleolithic siteAnui-3: results of work in 1999. Problems of Archaeology, Ethnography, and Anthro-pology of Siberia and Adjacent Territories. Inst. Arkheol. Etnogr. Sib. Otd. Ross. Akad.Nauk, Novosibirsk, vol. 5, pp. 111–116.
Derevyanko, A.P., Shun’kov, M.V., Agadjanian, A.K., et al. (2003) Natural Environmentand Man in the Paleolithic of the Altai Mountains. Inst. Arkheol. Etnogr. Sib. Otd. Ross.Akad. Nauk, Novosibirsk.
Germonpre, M. (1993) Preliminary results of the taphonomic study of Denisova cave (basedon the material of excavation in 1992). Altaica 2, 11–16.
Gromov, I.M. (1953) Vertebrate fauna from the Tardenauzskaya Murzak-Koba site in theCrimea. Mat. Issled. Arkheol. SSSR. 39, 459–462.
Gromov, I.M. (1957) Upper Quaternary rodents of the Samarskaya Luka river bend andconditions of the burial and accumulation of their remains. Tr. Zool. Inst. Akad. NaukSSSR. 22, 112–150.
Gromov, I.M. (1961) Fossil Upper Quaternary rodents from the Submontane Crimea.Tr. Komiss. Izuch. Chetvertichn. Per. 17, 1–189.
Problems of Reconstruction of Paleoenvironment 393

Gromov, I.M. and Fokanov, V.A. (1980) On Late Quaternary rodent remains from Kudaro1 cave. Kudaro Cave Site in Southern Ossetia. Nauka, Moscow, pp. 79–89.
Ivleva, N. G. (1990). Microtheriological materials from Okladnikov and Denisova cave onAltai // Complex researches of Paleolithic objects of Anuy basin. Novosibirsk: INF&F SBAN USSR. pp. 257–292.
Ovodov, N.D. and Ivleva, N.G. (1986) Pleistocene theriofauna of Denisova cave (Altai)based on material of excavation in 1982–1984. Quaternary Geology and PrimevalArchaeology of Southern Siberia. Buryat. Fil. Sib. Otd. Akad. Nauk SSSR, Ulan-Ude,Part 1, pp. 88–90.
Patou, M. (1987) Les marmottes: animaux intrusifs ou gibiers des prehistoriques du Paleo-lithique. Archaeozoologia 1, 93–107.
Pidoplichko, I. (1929) Rodents and lagomorphs from a locality near the village of Zhuravtsy,Prilutsk Region. Antropologiya 3, 133–147.
Pidoplichko, I.G. (1934) Discovery of a mixed tundra-steppe fauna in the Quaternary beds ofNovgorod-Seversk. Priroda 5, 80–82.
Pidoplichko, I.G. (1936) Fauna of the Gontsovo Paleolithic site. Priroda 1, 113–116.Shun’kov, M.V. and Agadjanian, A.K. (2000) Paleogeography of the Paleolithic of Denisova
cave. Arkheol. Etnogr. Antropol. Evraz. 2(2), 2–19.Vasil’ev, S.K. andGrebnev, I.E. (1994) TheHolocenemammal fauna fromDenisova cave. In:
A.P. Derevyanko and V.I. Molodin (Eds), Denisova Cave. Nauka, Novosibirsk, Part 1,pp. 167–180.
394 A. K. Agadjanian

The Settling of the Ancient Man by the Example
of North-Western Altai
A. P. Derevianko and M. V. Shunkov
Abstract Archaeological collections from the Pleistocene deposits of North-
Western Altai are the best studied Quaternary materials from all of Northern
and Central Asia. Stratified sites in that region have yielded the longest
archaeological record, which includes Middle and Upper Pleistocene, covering
all the stages of the Paleolithic, from the early to the late. Archaeological
materials from these sites illustrate the gradual evolution of lithic industries
and attest to the continuity of the technological traditions throughout the
Paleolithic.
The Paleolithic complex in the Altai Mountains currently provides the
most complete information about early human occupation in Northern and
Central Asia. It is best represented in studies of multilayered Paleolithic sites in
the Anui River valley of North-Western Altai. The general stratigraphic profile,
which includes Middle and Upper Pleistocene deposits, has been defined based
on data obtained from a number of sites in this region.Multidisciplinary research
at the stratified Paleolithic sites in the Anui valley using archaeological, litho-
stratigraphic and paleontological methods has made it possible to trace the
origins and evolution of Paleolithic cultural traditions and to reconstruct the
conditions of early human habitation throughout a long phase of the Pleistocene.The occupation of the Altai by early humans is most likely connected with a
northern migration wave of Homo erectus who expanded beyond the bound-
aries of the African continent and reached Asia. According to the dates that
have been recently generated from the loess and soil from the Kuldara,
Khonako II and Obi-Mazar-6 sites in Tajikistan, Homo erectus arrived in
Central Asia in the chronological range of 600–900 ka (Ranov, 2001). The
most archaic pebble tools that probably correspond to roughly that same
A. P. DereviankoInstitute of Archaeology and Ethnography, Siberian Branch, Russian Academy of SciencesNovosibirsk, Russiae-mail: [email protected]
N. Dobretsov et al. (eds.), Biosphere Origin and Evolution.� Springer 2008
395

time have been reported from the northeastern piedmonts of Karatau inKazakhstan (the Borykazgan, Tanirkazgan and Akkol sits) (Alpysbaev, 1979)and from the northern portion of the Valley of Lakes inMongolia (Nariyn-Gol-17) (Derevianko et al., 2000c). These industries are characterized by irregularorthogonal cores, ‘‘citron’’ spalls, massive tools reminiscent of racloirs and largecutting tools resembling chopper/chopping tools.
The earliest stage of the human presence in the Altai Mountains is evidencedby archaic artifacts found in the red deposits at Karama site, dating from earlyMiddle Pleistocene (Derevianko and Shunkov, 2005). Karama is located in theAnui valley 15 km downstream from the well-known archaeological site ofDenisova Cave. The Karama site has yielded a cultural sequence of severalhuman occupation horizons bearing distinct pebble tools attributable to theLower Paleolithic in the time range of 600–800 ka BP.
The characteristic features of the lithic implements suggest their attributionto the Lower Paleolithic pebble industries. The assemblage of the products ofprimary reduction includes pebbles showing signs of core preparation withplain striking platforms and negative scars of parallel detachments and shortnon-faceted spalls. The collection of typologically distinct tools includeslongitudinal and transverse racloirs, denticulate and notch-denticulate toolsfashioned on short spalls and cutting tools of the chopper/chopping tool typewith a convex flattened cutting edge and a trimmed massive back. Most pebbletools from Karama are characterized by archaic morphological features andcomparatively advanced technology of secondary treatment.
The next stage in the development of the Altai Paleolithic is illustrated by theEarly Mousterian industries from the basal sediments at Denisova Cave (strata22 and 21) and from the alluvial sediments of stratum 19 at the lowermostportion of the Ust-Karakol site. Various dating methods suggest that the age ofthese lithological strata lies in the range of 133–282 ka, which corresponds to thesecond half of the Middle Pleistocene (Derevianko et al., 2003).
The most ancient industries of the Denisova Cave demonstrate the Levalloisfeatures in stone reduction and a preferable usage of flakes as blanks for toolmanufacturing. Various types of racloirs and notch-denticulate tools prevail inthe tool kit. Most spalls identified within the Ust-Karakol industry fromstratum 19 show parallel edges on the dorsal face and a prepared platform.Such categories as racloirs with longitudinal and convergent edges, spur-liketools and notched tools with Clactonian and retouched encoches have beenidentified within the tool kit. A notable absence of tools made on completepebbles and Acheulian bifaces, together with the features of parallel reductionand a set of typologically distinct implements made on standard blanks, allsuggest a Middle Paleolithic attribution to the most ancient industries of theDenisova and Ust-Karakol.
The chronological attribution of the Altai early Mousterian industries to theMiddle Pleistocene seems reasonable when comparing it to archaeologicalevidence from other Eurasian Paleolithic sites. Archaeological materials fromWestern and Central Europe have shown that pre- and early Mousterian
396 A. P. Derevianko, M. V. Shunkov

industries with flake tools but without Acheulian bifaces appeared along withtypical Acheulian technocomplexes as early as the initial Riss period (Bosinski,1982; Tuffreau, 1982). It is known that racloirs, notches and denticulate toolswere the most characteristic flake tools for certain early Mousterian industries(Laville, 1982). Recent geo-chronological estimations of the age of true Mous-terian industries of the Tabun Cave in the Near East have suggested a period250,000–270,000 years ago (Bar-Yosef, 1995; Mercier et al., 1995).
The Altai Middle Paleolithic industries continued their development in theUpper Pleistocene. Available Paleolithic evidence from the Altai testifies to thefact that the majority of Mousterian sites exhibit common features that evolvedwithin a single Middle Paleolithic culture. However, various Altai technocom-plexes reveal different proportions of the major technical–typological indiceswithin this single cultural tradition. On the basis of these variations, two majortypes of industries have been established in the Altai Mousterian sites: indus-tries with predominantly Mousterian technology and those with distinct Leval-lois tools.
The Mousterian group of industries includes collections recovered from theDenisova and Okladnikov cave sites as well as from the open-air Tiumechin-1site. The primary reduction strategy is predominantly parallel and radial. Leval-lois reduction is apparent on only a few artifacts. In general, the impact of theLevallois technique on the technological process seems insignificant. Themajorityof tools were produced on medium-sized, short spalls. The collection of typolo-gically distinct tools is dominated by Mousterian and notch-denticulate tools.Levallois implements are morphologically distinct but scarce. Various racloirs aremost numerous.On the basis of the common technical–typological features notedwithin these materials, we propose categorizing these collections into a ‘‘Denisovavariant of the Altai Mousterian’’ (Derevianko and Shunkov, 2002).
The Altai Middle Paleolithic industries included in the Levallois grouppossess the most distinct technical–typological features. This group includesthe sites of Kara-Bom, Ust-Karakol, Anui-3, Ust-Kan Cave. These industriesare characterized by the predominance of Levallois reduction, a developedtechnique of blade detachment, comparatively large numbers of tools fash-ioned on blades and Levallois spalls, a rather small variety of tool types whereblades and Levallois points are most numerous. According to these specificcharacteristics of the Altai Levallois-Mousterian industries, they are desig-nated as the ‘‘Kara-Bom variant of the Altai Middle Paleolithic’’ (Dereviankoet al., 2000b).
The Middle Paleolithic industries from the multilayered sites of Anui-3 andUst-Karakol demonstrate a well-developed Levallois technology of tool pro-duction and bifacial working. Within the Kara-Bom technical variant, materi-als included in these Levallois-Mousterian collections form a specific industrialtype with distinct foliate bifaces (Derevianko and Shunkov, 2002).
The evidence available has not yet provided reliable grounds for associatingthe technological variants of the Altai Middle Paleolithic with distinct prehis-toric human populations bearing independent cultural traditions. There is also
The Settling of the Ancient Man 397

currently insufficient evidence for considering the noted industrial variability ofthe Altai Middle Paleolithic as a purely chronological phenomenon. The AltaiPaleolithic chronostratigraphy testifies to the long-term parallel developmentof two major industrial variants throughout the so-called Mousterian Wurmchron. The initial stage of development of true Mousterian industries (e.g.,Denisova Cave, stratum 22) is estimated as falling within the Middle Pleisto-cene, while its final stages (e.g., Okladnikov Cave) are associated with anabsolute date of 33–44 ka. The age estimates for Ust-Karakol (stratum 18)and Kara-Bom (Mousterian horizon 1) suggest that Levallois-Mousterianindustries occurred within the chronometric range of 100 to 44 ka. The currentstate of our knowledge allows us to hypothesize that differentiation of lithicindustries took place within a single Middle Paleolithic culture as the result ofvarious adaptation strategies to different environmental, seasonal, economic,productive and raw material factors, among others.
The specificity of the productive and economic activities of ancient popula-tions at long-term and seasonal occupation sites may be regarded as one of thereasons for the variability noted in these archaeological assemblages. Thepattern of lithic artifact distribution by stratum at the sites of Ust-Karakoland Anui-3 suggests regular, though relatively short-term, occupation byhuman ancestors. On the other hand, the diverse composition of the tool kitdoes not allow us to regard these sites as merely short-term encampments.Practically all occupation horizons at these sites yielded lithic collections illus-trating the entire technological sequence of rawmaterial utilization. Thus, thesecollections include instruments for primary stone working, principal productsof stone reduction and a typologically diverse tool kit. The noted specificity ofthe tool kits, correlated with the structure of enclosing sediments, suggests theclassification of these multilayered sites as sequences of episodic, seasonaloccupation sites. This hypothesis is well supported by the topography of Ust-Karakol andAnui-3. Both sites are located in areas of the river valley, which aremost beneficial for establishing seasonal hunting camps. The available evidencesuggests that these Middle Paleolithic industries were primarily aimed at pro-ducing hunting equipment, such as Levallois points and foliate bifaces. Refit-ting analyses of the lithic artifacts from Ust-Karakol and petrographic analysisof knapped stone from Anui-3 indicate that the tools were produced there,rather than having been brought in from elsewhere.
The Mousterian collections associated with long-term occupation cave sitesalso include bifacially worked tools and classic Levallois implements. Gener-ally, bifacial and Levallois traditions in stone reduction are less pronounced inthe collections from presumed long-term occupation sites. This may beexplained by the fact that solitary, typologically distinct products are not asapparent in the non-homogeneous concentration of waste accumulated at long-term sites. Most likely, distinct technical and typological characteristics dis-solved in the homogeneous industrial context of long-term occupation sites.
Early Paleolithic pebble-tool technocomplexes, which have been recentlydiscovered in the Altai, may hardly be considered as a basis for the development
398 A. P. Derevianko, M. V. Shunkov

ofMiddle Paleolithic industries. Sources for the development of such industriesare likely to be discovered in contiguous regions of North and Central Asia.Acheulian industries, which are characterized by tools produced on strategi-cally planned, shaped spalls detached from well-prepared nuclei, i.e., techno-complexes exhibiting parallel (proto-prismatic) reduction strategies andLevallois flaking, may be considered as candidates for the Early Paleolithicgenesis of their development. These cultural traditions may have originated inAcheulian industries of Western Asia: the Caucasus, the Levant and southernArabia (Amirhanov, 1991; Bar-Yosef, 1994; Hours, 1975; Liubin, 1998).
Kazakhstan, adjacent to the Altai, has produced the most distinctive Acheu-lian-like technocomplexes from sites located in the northwestern piedmont ofthe Mugodjari Mountains (Derevianko et al., 2001). The Early Paleolithic sitesof Mugodjari-3 to 6 represent concentrations of heavily to moderately abradedartifacts occurring on the surfaces of diluvial benches and on the crests of hills inthe vicinity of quartz sandstone outcrops exploited as sources of raw materialfor tool production. These assemblages contain distinct foliate, ovoid andcordiform bifaces of the Acheulian type as well as nuclei exhibiting morpholo-gical features of Levallois reduction and various racloirs and notch-denticulatetools.
In Mongolia, Acheulian-like bifaces were first reported within the surfacecollections at such open-air sites as Bottom-of-the-Gobi and in the vicinity ofMount Yarkh (Okladnikov, 1986). Recent investigations in the southeasternGobi Altai have provided new information supporting a model of the dissemi-nation of Acheulian elements over Mongolia in the Paleolithic. Bifaciallyworked tools associated with Levallois products have been identified withinthe series of artifacts exhibiting heavy surficial aeolian abrasion at TsakhiurtynHondii or ‘‘Flint Valley’’ (Derevianko et al., 1996), as well as from collectionsassociated with the lower stratigraphic levels in Tsagaan Agui Cave(Derevianko et al., 2000a). Age estimates for the Tsagaan Agui sedimentssuggest a Lower Pleistocene origin for the local Levallois-Acheulian traditions.
The majority of the Mongolian Lower Paleolithic industries bears featurescharacteristic of pebble tool traditions (Derevianko et al., 1990, 2000c). Numer-ous sites located have yielded rich collections of aeolian abraded artifactsincluding large polyhedral cores, Levallois and parallel nuclei with one flakingsurface, ‘‘citron’’ spalls, various types of racloirs, notch-deniculate tools andchoppers. Nearly all the early industries ofMongolia exhibit Levallois technicalmethods in stone reduction.
The Torgalyk A Early Paleolithic site located in Tuva has yielded Acheulianartifacts (Astahov, 1998). Its geo-morphological setting and the heavily aeo-lized state of the artifact surfaces allow age estimates of the Middle Pleistocene.Among other artifacts, cores exhibiting elements of Levalloisian reduction,longitudinal racloirs, massive points and grattoirs, notched and denticulatetools have also been identified. The collection also includes archaic bifaces ina variety of forms including limandes and proto-limandes as well as amygdaloi-dal and ovoid bifaces.
The Settling of the Ancient Man 399

Bifacial stone reduction strategy has also been recorded at the Early Paleo-lithic sites of the southern Angara region (Medvedev, 1983). Judging by therelative stratigraphic position of these artifacts and the state of aeolian abrasionapparent on their surfaces, they cannot be younger than the OIS 6. All southernAngara lithic collections may be subdivided into one of two traditions:Tarakhaiski and Olonski. The Tarakhaiski group comprises industries withwell-developed pebble tool technology. Primary reduction is based on the‘‘citron’’ flaking strategy and chopper tools constitute a considerable propor-tion of the tool kit. The Olonski assemblages aremore similar to Acheulian-typeindustries. This variant is characterized by bifacially, radially flaked core-likeimplements and specific quartzite micro-bifaces.
Eastwards, bifaces reminiscent of western Acheulian specimens have beenreported from the territory limited within North China. SolitaryMiddle Pleistocene bifacially worked tools classified as handaxes (e.g., theGongwangling locality at Lantian, Shanxi, and Kehe, Shanxi) and a cleaver(Zhoukoudian, Locality 13) were recovered from the loess plateau andHuanghe Basin (Jia and Huang, 1991). However, reliable evidence illustrat-ing Levallois technology in Paleolithic industries has not yet been reportedfrom China (Gao, 2000). The notable absence of developed, standardLevallois technologies in East Asian industries serves as a major argumentsupporting the hypothetical western origin of the technical and typologicalbasis of the Lower Paleolithic in Central Asia.
In summary, this brief review of known Lower Paleolithic technocomplexesreported from those regions geographically contiguous with the Altai hasshown that the majority of industries producing Acheulian-like bifaces arecharacterized by developed methods of parallel and Levallois reduction andby the production of tools on intentional blanks of standard size. The featuresnoted support our hypothesis regarding the original development of the AltaiMiddle Paleolithic on the basis of local Lower Paleolithic cultural traditionsbearing the Levallois reduction strategy.
The original development of the majority of the Altai Middle Paleolithicindustries does not exclude close relationships with contiguous territories. Inparticular, such a supposition is supported by similarities noted in the char-acteristics of the Mousterian industries of the Altai and Central Asia. MostCentral Asian Mousterian technocomplexes as well as the Altai Middle Paleo-lithic industries can be subdivided into two major technical variants: the trueMousterian (Montane Mousterian) and the Levallois-Mousterian (Ranov andNesmeianov, 1973).
The major technical features of the Central Asian Levallois-Mousterianindustries, such as those from Obi-Rakhmat, Khodjakent and Khudji, includethe parallel reduction strategy for cores with prepared platforms and largenumbers of laminar blanks and tools fashioned on large blades. Similar featuresare also characteristic of the Kara-Bom variant of the Altai Middle Paleolithic.Predominantly radial and parallel cores, a small number of blades and atypologically diverse series of racloirs typify the industries associated with
400 A. P. Derevianko, M. V. Shunkov
long-term occupation cave sites like Teshik-Tash and Ogzi-Kichik. Such tech-nical features are also noted within those industries included in the Denisovavariant of the Altai Mousterian.
Previously identified variants of the Altai Middle Paleolithic also showfeatures analogous with Paleolithic industries recorded in the Eastern Mediter-ranean. For instance, Levallois-Mousterian archaeological materials of theKara-Bom type resemble the Tabun D Early Mousterian assemblages fromthe Levant (Bar-Yosef and Meignen, 1992; Marks, 1992). The high level ofdevelopment of Levallois technology focused on parallel flaking in order toproduce elongated spalls, including large blades and Levallois points, is themajor characteristic feature shared by these industries. The resemblance of theMousterian materials recovered from Okladnikov Cave in the Altai to theYabrudian complexes recovered from Tabun Cave, Yabrud I rockshelter andother Paleolithic sites in the Levant is also noteworthy (Jelinek, 1982; Rust,1950). These industries include many similar tool types, especially the numerousdejete scrapers.
The analogous technical–typological features noted in theMiddle Paleolithictechnocomplexes of the Altai, Central Asia and Near East suggest their attribu-tion to a single cultural domain. In this respect, western Central Asian sites seemto provide links between Middle Eastern and Central Asian industries.
Mousterian traditions dispersed over Asia to include the territory ofMongolia. The available materials provide evidence for similar tendencies inthe formation and development of Middle Paleolithic industries. Thus, theMousterian industry identified in the important cave site of Tsagaan Agui(Derevianko et al., 2000a) is characterized by parallel reduction of Levallois,proto-prismatic and narrow-face nuclei. Massive racloirs, notch-denticulateand spurred tools represent major tool categories within tool kit. In GornyAltai, the industries of the Denisova variant of the Middle Paleolithic representthe closest analog with these Mongolian materials.
The alternative variant of theMongolianMiddle Paleolithic is represented byLevallois industries. The Barlagiin-Gol-1 site located in the southeasternMongolian Altai (Derevianko and Petrin, 1987) and the Orkhon-1 stratifiedsite located in the southern Khangai Mountains yielded archaeological collec-tions which demonstrated high indices of Levallois technique utilization in toolproduction. Levalloisian tools, including cores, points, blades and flakes, repre-sent the most numerous categories in these tool kits. The Orkhon-1 archaeolo-gical materials indicate the contemporaneous existence of Levalloisian andMousterian industries in the Mongolian Paleolithic. The Levallois technocom-plexes of Mongolia particularly resemble the Kara-Bom variant of the AltaiMiddle Paleolithic. It has been noted that both technical traditions evolvedwithin the Mongolian Paleolithic. Both developmental trends are illustrated inthe available archaeological materials attributable to the transitional periodfrom the Middle to the Upper Paleolithic. The true Mousterian variant isillustrated by the archaeological collection associated with deposits from thethird sedimentation cycle in TsagaanAgui Cave, while the Levallois-Mousterian
The Settling of the Ancient Man 401

variant has been identified in materials recovered from the Orok-Nuur-1 and 2sites (Derevianko et al., 2000c).
The cultural continuity apparent in the development of the MongolianPaleolithic suggests the formation of Mousterian traits on the basis of a localLower Paleolithic tradition with Levalloisian technology. The analogous fea-tures of the major Mousterian variants allow us to include Mongolia, primarilythe Mongolian and Gobi Altai regions, and Altai Mountains in a single geo-graphical unit representing the development of a distinctive Middle Paleolithicculture.
In this respect, the anthropological identification of the Middle Paleolithicpopulation of the Altai presents particular interest. Formerly, it was believedthat odontological remains of hominid fossils recovered from the Mousterianlayers at Denisova and Okladnikov Caves represent clear European Nean-derthal features (Turner, 1990). However, Alekseev argued that scanty anthro-pological materials did not allow unambiguous Neanderthal identification ofthe fossils. The noted morphological features are interpreted as belonging tophysically modern humans (Alekseev, 1998). Additional analyses of the fossilcollection from the Altai caves have shown that despite certain archaic features,these remains most likely belong to representatives of physically modernhumans—early Homo sapiens sapiens (Shpakova, 2001).
Around 50,000–40,000 years ago, Initial Upper Paleolithic industries wereformed as a result of the continuous transformation of Middle Paleolithicindustries in the Altai. The Altai Initial Upper Paleolithic technocomplexesexhibit certain features in common. However, each assemblage possesses itsown specific characteristics, on the basis of which the whole body of Altai InitialUpper Paleolithic industries may be subdivided into two major groups reflect-ing a particular developmental trend: the Ust-Karakol and Kara-Bomtrajectories.
Such Altai technocomplexes as Ust-Karakol, Denisova Cave, Anui-3,Tiumechin-4 are included in the Ust-Karakol variant. This variant is character-ized by the parallel reduction of Levallois and single platform cores as well as bythe addition of new methods aimed at repetitive detachment of elongatedblanks from prismatic, conical and narrow-face cores, including wedge-shapedvarieties. As a result of the application of this progressive technology, thetechnique of microblade flaking developed, aimed at the production of micro-blades themselves and at fashioning specific Upper Paleolithic tool forms. Thetool kits identified within these industries still include numerous racloirs andnotch-denticulate tools. The Upper Paleolithic tools constitute several newtypes that have not been noted in earlier collections. Most interesting are theso-called Aurignacian forms including end-scrapers on blades, carinated scra-pers fashioned with micro-laminar removals, dihedral burins, large bladesretouched throughout their whole perimeters and backed microblades. Bifa-cially worked tools, especially classical foliate bifaces, constitute an importantcharacteristic feature of these assemblages. Another important feature is theoccurrence of various bone implements recovered in Denisova Cave stratum 11.
402 A. P. Derevianko, M. V. Shunkov
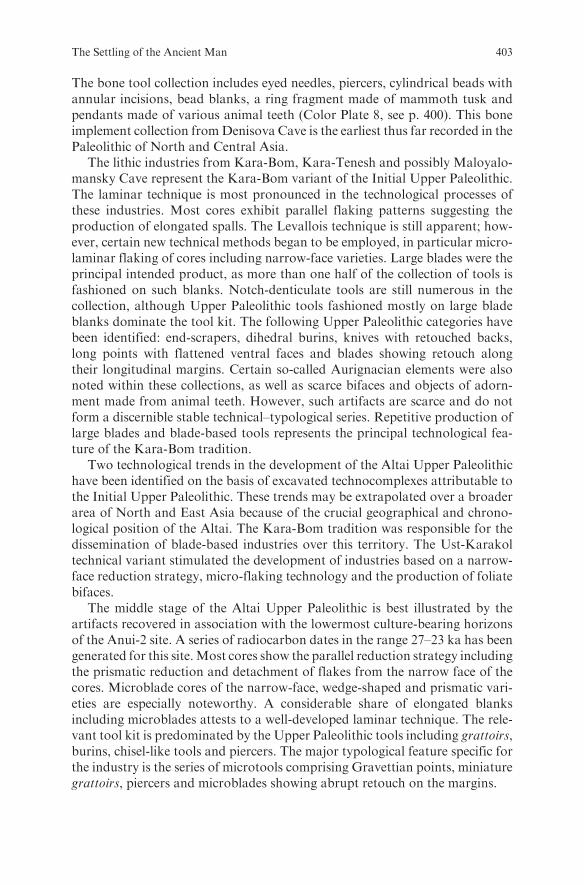
The bone tool collection includes eyed needles, piercers, cylindrical beads withannular incisions, bead blanks, a ring fragment made of mammoth tusk andpendants made of various animal teeth (Color Plate 8, see p. 400). This boneimplement collection fromDenisova Cave is the earliest thus far recorded in thePaleolithic of North and Central Asia.
The lithic industries from Kara-Bom, Kara-Tenesh and possibly Maloyalo-mansky Cave represent the Kara-Bom variant of the Initial Upper Paleolithic.The laminar technique is most pronounced in the technological processes ofthese industries. Most cores exhibit parallel flaking patterns suggesting theproduction of elongated spalls. The Levallois technique is still apparent; how-ever, certain new technical methods began to be employed, in particular micro-laminar flaking of cores including narrow-face varieties. Large blades were theprincipal intended product, as more than one half of the collection of tools isfashioned on such blanks. Notch-denticulate tools are still numerous in thecollection, although Upper Paleolithic tools fashioned mostly on large bladeblanks dominate the tool kit. The following Upper Paleolithic categories havebeen identified: end-scrapers, dihedral burins, knives with retouched backs,long points with flattened ventral faces and blades showing retouch alongtheir longitudinal margins. Certain so-called Aurignacian elements were alsonoted within these collections, as well as scarce bifaces and objects of adorn-ment made from animal teeth. However, such artifacts are scarce and do notform a discernible stable technical–typological series. Repetitive production oflarge blades and blade-based tools represents the principal technological fea-ture of the Kara-Bom tradition.
Two technological trends in the development of the Altai Upper Paleolithichave been identified on the basis of excavated technocomplexes attributable tothe Initial Upper Paleolithic. These trends may be extrapolated over a broaderarea of North and East Asia because of the crucial geographical and chrono-logical position of the Altai. The Kara-Bom tradition was responsible for thedissemination of blade-based industries over this territory. The Ust-Karakoltechnical variant stimulated the development of industries based on a narrow-face reduction strategy, micro-flaking technology and the production of foliatebifaces.
The middle stage of the Altai Upper Paleolithic is best illustrated by theartifacts recovered in association with the lowermost culture-bearing horizonsof the Anui-2 site. A series of radiocarbon dates in the range 27–23 ka has beengenerated for this site.Most cores show the parallel reduction strategy includingthe prismatic reduction and detachment of flakes from the narrow face of thecores. Microblade cores of the narrow-face, wedge-shaped and prismatic vari-eties are especially noteworthy. A considerable share of elongated blanksincluding microblades attests to a well-developed laminar technique. The rele-vant tool kit is predominated by the Upper Paleolithic tools including grattoirs,burins, chisel-like tools and piercers. The major typological feature specific forthe industry is the series of microtools comprising Gravettian points, miniaturegrattoirs, piercers and microblades showing abrupt retouch on the margins.
The Settling of the Ancient Man 403

The final stage of the Altai Upper Paleolithic is represented in the archae-
ological materials of cave sites. The Upper Paleolithic industries of Denisova
and Kaminnaya caves demonstrate the further development of the laminar
technique. Comparing to the assemblages associated with previous stages,
these final Upper Paleolithic industries comprise a greater amount of elongated
spalls, in which the share of microblades also increases. Blades were used as
blanks for manufacturing longitudinal varieties of racloirs, end-scrapers, bur-
ins, chisel-like tools, denticulate and notched tools. Backed microblades and
foliate bifaces represent the most typologically perfect tool types. A set of bone
tools and adornments includes eyed needles, piercers, pendants made of deer
teeth cylindrical beads and ring-shaped beads made of ostrich egg shell.In general, lithic industries of the final stage Upper Paleolithic demonstrate a
continuous development. This continuity is reflected in a combination of certain
archaic (radial and Lavallois cores, Mousterian racloirs and notch-denticulate
tools) and clear Upper Paleolithic (prismatic and narrow-face nuclei,
end-scrapers, dihedral burins, backed microblades, composite tools) elements
both in primary reduction strategy and in typology of lithic and bone implements.
Additionally, these archaeological materials demonstrate a continuous develop-
ment of Paleolithic traditions apparent in awider application of laminar reduction
technique, in microblade production in particular.
References
Alekseev, V. (1998) The physical specificities of Paleolithic hominids in Siberia. In: ThePaleolithic of Siberia. Univ. of Illinois Press, Urbana, IL, pp. 329–335.
Alpysbaev, H.A. (1979) Pamiatniki nizhnego paleolita Yuzhnogo Kazahstana. Nauka Kaz.SSR, Alma-Ata.
Amirhanov, H.A. (1991) Paleolit Yuga Aravii. Nauka, Moscow.Astahov, S.N. (1998) Paleolit Tuvy. In: Drevnie kultury Tsentralnoi Azii i Sankt-Peterburg.
Kult-inform-press, St Petersburg, pp. 109–114.Bar-Yosef, O. (1994) The Lower Palaeolithic of the Near East. J.World Prehist. 8(3), 211–265.Bar-Yosef, O. (1995) The Lower and Middle Paleolithic in the Mediterranean Levant:
chronology and cultural entities. In: Man and Environment in the Paleolithic. Univ. deLiege, Liege, pp. 247–263. (ERAUL, 62).
Bar-Yosef, O. and Meignen, L. (1992) Insights into Levantine Middle Paleolithic culturalvariability. In: The Middle Paleolithic: Adaptation, Behavior, and Variability. Univ.Museum, Univ. of Pennsylvania, Philadelphia, PA, pp. 163–182. (Univ. Museum Mono-graph; 72. Univ. Mus. Symp. Ser.; 4).
Bosinski, G. (1982) The transition Lower/Middle Paleolithic in North-Western Germany. In:The Transition from Lower to Middle Paleolithic and the Origin of Modern Man. BritishArchaeological Reports, Oxford, pp. 165–177. (BAR. International Ser.; 151).
Derevianko, A.P. and Petrin V.T. (1987) Kompleks kamennoi industrii s yuzhnogo fasaMongolskogo Altaia. In: Arkheologia, etnografia i antropologia Mongolii. Nauka,Novosibirsk, pp. 5–27.
Derevianko, A.P. and Shunkov,M.V. (2002)Middle Paleolithic industries with foliate bifacesin Gorny Altai. Archaeol. Ethnol. Anthropol. Eurasia 1, 16–42.
404 A. P. Derevianko, M. V. Shunkov
Derevianko, A.P. and Shunkov, M.V. (2005) The Karama Lower Paleolithic site in the Altai:initial results. Archaeol. Ethnol. Anthropol. Eurasia 3, 52–69.
Derevianko, A.P., Dorj, D., Vasilevskii, R.S., Larichev, V.E., Petrin, V.T., Deviatkin, E.V.andMalaeva, E.M. (1990) Kamennyi vekMongolii: Paleolit i neolit Mongolskogo Altaia.Nauka, Novosibirsk.
Derevianko,A.P., Olsen, J.W., Tseveendorj, D., Petrin, V.T., Zenin, A.N.,Krivoshapkin, A.I.,Reeves, R.W., Deviatkin, E.V. and Mylnikov, V.P. (1996) Archaeological Studies CarriedOut by the JointRussian–Mongolian–AmericanExpedition inMongolia in 1995. IAETSORAN, Novosibirsk.
Derevianko, A.P., Olsen, J.W., Tseveendorj, D., Krivoshapkin, A.I., Petrin. V.T. andBrantingham P.J. (2000a) The Stratified Cave site of Tsagaan Agui in the Gobi Aita i(Mongolia). Archaeol. Ethnol. Anthropol. Eurasia 1, 23–36.
Derevianko, A.P., Petrin, V.T. and Rybin, E.P. (2000b) The Kara-Bom Site and char-acteristics of the Middle-Upper Paleolithic Transition in the Altai. Archaeol. Ethnol.Anthropol. Eurasia 2, 33–51.
Derevianko,A.P., Petrin, V.T., Tseveendorj, D.,Deviatkin, E.V., Larichev, V.E., Vasilevskii, R.S.,Zenin, A.N. and Gladyshev, S.A. (2000c) Kamennyi vek Mongolii: Paleolit i neolit severnogopoberezhia Doliny Ozer. IAET SO RAN, Novosibirsk.
Derevianko, A.P., Petrin, V.T., Gladyshev, S.A., Zenin, A.N. and Taimagambetov, Z.K.(2001) Acheulian complexes from the Mugodjari Mountains (North-Western Asia).Archaeol. Ethnol. Anthropol. Eurasia 2, 20–36.
Derevianko, A.P., Shunkov, M.V., Agadjanian, A.K., Baryshnikov, G.F., Malaeva, E.M.,Ulianov, V.A., Kulik, N.A., Postnov, A.V. and Anoikin, A.A. (2003) Prirodnaya sreda Ichelovek v paleolite Gornogo Altaya. IAET SO RAN, Novosibirsk.
Gao, X. (2000) Core reduction at Zhoukoudian locality 15. Archaeol. Ethnol. Anthropol.Eurasia 3, 2–12.
Hours, F. (1975) The Lower Paleolithic of Lebanon and Syria. In: Problems in Prehistory:North Africa and the Levant. Southern Methodist Univ. Press, Dallas, pp. 249–271.
Jelinek, A.J. (1982) The Tabun Cave and Palaeolithic man in the Levant. Science 216,1369–1375.
Jia, L. andHuang,W. (1991) The Paleolithic cultures of China. Quatern. Sci. Rev. 10, 519–521.Laville, H. (1982) On the transition from ‘‘Lower’’ to ‘‘Middle’’ Paleolithic in South-West
France. In: The transition from Lower to Middle Paleolithic and the origin of ModernMan. British Archaeological Reports, Oxford, pp. 131–137. (BAR. International Ser.; 151).
Liubin, V.P. (1998) Ashelskaia epoha na Kavkaze. Peterburgskoe Vostokovedenie,St Petersburg.
Marks, A. (1992) Typological variability in the Levantine Middle Paleolithic. In: The MiddlePaleolithic: Adaptation, Behavior, and Variability. Univ. MuseumUniv. of Pennsylvania,Philadelphia, PA, pp. 127–142.
Medvedev, G.I. (1983) Paleoliticheskie obitateli iuga Sibirskogo ploskogoria i drevnie kulturySevernoi Ameriki. In: Pozdnepleistotsenovye i rannegolotsenovye kulturnye sviazi Azii iAmeriki. Nauka, Novosibirsk, pp. 36–41.
Mercier, N., Valladas, H. and Valladas, G. (1995) Flint thermoluminescence dates from theCFR Laboratory at GIF: contributions to the study of the chronology of the MiddlePalaeolithic. Quatern. Sci. Rev. 14, 351–364.
Okladnikov, A.P. (1986) Paleolit Mongolii. Nauka, Novosibirsk.Ranov, V.A. (2001) Loess-paleosoil formation of Southern Tajikistan and the loess Palaeo-
lithic. Praehistoria 2, 7–27.Ranov, V.A. and Nesmeianov, S.A. (1973) Paleolit i stratigrafia antropogena Srednei Azii.
Donish, Dushanbe.Rust, A. (1950) Die Hohlenfunde von Jabrud (Syrien). Karl Wachholtz, Neumunster.Shpakova, E.G. (2001) Paleolithic human dental remains from Siberia. Archaeol. Ethnol.
Anthropol. Eurasia 4, 64–76.
The Settling of the Ancient Man 405

Tuffreau, A. (1982) The transition Lower/Middle Paleolithic in Northern France. In: Thetransition from Lower to Middle Paleolithic and the origin of Modern Man. BritishArchaeological Reports, Oxford, pp. 137–151. (BAR. International Ser.; 151).
Turner, C.G. (1990) Paleolithic Siberian dentition from Denisova and Okladnikov Caves,Altaiskiy Kray, USSR. Curr. Res. Pleistocene 7, 65–66.
406 A. P. Derevianko, M. V. Shunkov

Evolutionary History ofWheats—theMain Cereal
of Mankind
N. P. Goncharov, K. A. Golovnina, B. Kilian, S. Glushkov,
A. Blinov and V. K. Shumny
Abstract An attempt in integrating the results of different comparative-geneticanalyses of wheats and their molecular taxonomy has been made; thecorrespondence of earlier evolutionary specifications to the phylogeny withinthe genus Triticum species has been estimated. The relationships have beenestablished based on chloroplast and nuclear DNA sequence data. Onephylogenetic tree has been constructed based on the chloroplast sequences,and several phylogenetic groups have been found within the genera Triticumand Aegilops. It has been shown that Aegilops speltoides was a donor of theplasmon for all polyploid wheat species, whereas the chloroplast genomes of thediploid Triticum species are close to other Aegilops species. Nuclear Acc-1 andPgk-1 genes have been used as molecular markers for the A and B genomes ofthe Triticum species. No variability has been found in these genes withinpolyploid wheats. In contrast, three variants of these genes have been detectedin diploid A genome Triticum. The detailed analysis showed that one of thesevariants was a progenitor for all A genomes of all polyploid Triticum species;the second variant is close to the B genomes of Ae. speltoides; and the third oneis unique for wild diploid wheats. The inheritance of two domesticated andtaxonomically important characters was studied in the ancient hexaploid wheatTriticum antiquorum. It was shown that the recessive gene controlling sphericalgrain was allelic to the s gene determining the same character in the endemicIndian species T. sphaerococcum. The dominant genes of T. antiquorum andT. sphaerococcum controlling compact ears were proved to be non-allelic to thecorresponding T. compactum gene. Results of molecular analysis indicated theclose relationship of all hexaploid wheat species.
Annual, self-pollinated coarse-grained plants spread over vast territories inthe Mediterranean climate. Their grains are ‘‘convenient’’ for intensive gather-ing and, what is not less important, for long-term preservation. The transition
N. P. GoncharovInstitute of Cytology and Genetics, Siberian Branch of the Russian Academy of Sciences,Novosibirsk, Russiae-mail: [email protected]
N. Dobretsov et al. (eds.), Biosphere Origin and Evolution.� Springer 2008
407

from gathering wild cereals towards modern plant breeding is complex and stilla matter of discussion.
The history of cultivated plants is closely interwoven with that of mankind.Many investigations based on genetic, comparative-genetic, molecular, arche-ological and geographobotanical analysis have succeeded in identifying theprogenitors of cultivated species, their phylogeny and place of domestication(Goncharov et al., 2007). Independent domestications of four main cerealswheat, barley, rice, and maize produced similar results (Harlan, 1992). Theearliest signs of domestication appear in Pre-pottery Neolithic B (Nesbitt,2001). Archeological data provided evidence that barley (Hordeum ssp.) andwheat (Triticum ssp.) were among the first domesticated plants. Their cultivationwas commenced on the threshold of late Stone Age (Nesbitt, 2001).
In the course of time, wheat became the main cultivated crop covering thelargest area among all cultivated plants. Curiously, diploid cultivated einkornwheat Triticum monococcum L. was the basic crop of the Shumer culture,whereas tetraploid emmer wheat T. dicoccum was cultivated in ancient Egypt.
De Candole (1885) already considered the problem on the origin of wheatspecies separately having no data for resolving this point on the origin ofcultivated wheat species in general. Since then it is still a matter of discussion.
Timid attempts in the complex consideration of wheat species origin faltereddue to the absence of large and representative Triticum collections. Only theworld wheat collection of the N.I. Vavilov Institute of Plant Industry(St. Petersburg, Russia) and the Kyoto University (Kyoto, Japan), have beenscrupulously collected and studied during 100 years. These comprehensivecollections are a unique possibility for researchers to look deeper into theTriticum phylogeny.
Several wheat domestication schemes suggested in the past do not presentour knowledge today. Some of them are misleading or contrary.
On the other hand, modern comparative-genetic and molecular methodsmight allow us to get deeper insights into phylogenetic relationships withinTriticum and the related species.
The aim of our research was to provide new data to reconstruct the wheatevolution based on chloroplast and nuclear gene loci.
1 Material and Methods
1.1 Plant Materials
Plants used for chloroplast sequences are indicated in Golovnina et al. (2007).Ten T. urartu Thum. ex Gandil. accessions (K-33869, PI 428217, PI 428297,
PI 427328, PI 428197, PI 538736, Ig-44829, Ig-45296, Ig-116196, Ig-116198),fourT. boeoticumBoiss. accessions (K-14384, K-20741, K-25811, K-28300) and14 T. monococcum accessions (K-20970, K-20400, K-18105, KT3-5, G-1777,
408 N. P. Goncharov et al.

PI 355517, PI 277137, PI 427927, PI 428175, PI 362610, PI 355523, PI 349049,
PI 326317, PI 94743) were used for nuclear sequence analysis. Additional
sequence data were obtained from Kilian et al. (2007).Two T. antiquorum Heer ex Udach. accessions K-56397 and K-56398 from
Tajikistan and two T. sphaerococcum Perciv. accessions K-23790 from India
and K-23824 from Pakistan were used for comparative-genetic analyses. The
genes determining the compact spike were tested for allelism using the Finnish
cultivar Vakka, Buryatian (Russia) accession WAG 8226, and the American
accession CI 3090 of T. compactum Host.
1.2 Total DNA Isolation and PCR Amplification
Total DNA was isolated from 50–170 mg of fresh leaves using the standard
CTAB method (Rogers and Bendich, 1985). The primer combinations to
amplify the chloroplast trnT–trnL intergenic spacer, the trnL intron and the
trnK intron are those described in Golovnina et al. (2007).In order to amplify A and B genome specific fragments of nuclear DNA, two
multiple alignmentsweredevelopedusing sequencedataofAcc-1andPgk-1genes
(GenBank accession numbersAF343496–AF343536 andAF343474–AF343495,
respectively, and those fromKilian et al. (2007):DQ290259–DQ290360; DQ290363–DQ290375; DQ364823–DQ364846;
DQ290658–DQ290757; DQ290760–DQ290771; DQ364891–DQ364912for different genomes available among Triticum and Aegilops L. representatives.
Based on these alignments, one pair of B genome specific primers (Acc 3T sense
50-GCTCATATGGTATATTATGTTCC-30, Acc 3T antisense 50-TTTAGGCA-
CAGAAATAACAT-30) and six different primers for genome A (AccT1s
50-GGACTTAGTTTTTTGTCGTCAGTT-30, AccT1a 50-GAAAAAAACGCA-
GCCCAATT-30, AccT1a new 50-CTTCCAAACGTAAGGACCAATACA-30,PgkT4s 50-GCTTGGCTCCCCTTGTGCCCCG-30, PgkT1s new 50-GGCAT-
TGAGGTATTCTTTTGTTCCACTTCCAC-30, PgkT1a 50-CACACTTCTCC-AGCAGGGATTCGA-30) were designed.
All PCR reactions were performed in a 20 ml volume containing 65 mM Tris-
HCl (pH 8.9), 16 mM (NH4)2SO4, 1.5 mM MgCl2, 200 mM of each dNTP,
0.5 mM of each primer, 20–50 ng genomic DNA template, and 1 U of Taq
DNA polymerase. The PCR program had an initial strand separation step at
948C for 3min followed by 30 cycles of denaturation at 948C for 30 s, annealing at
428C for 42 s for chloroplast sequences and at 528C for 42 s for nuclear sequence,
and elongation at 728C for 1 min.The PCR products were analyzed in agarose electrophoresis and extracted
from gel with a Qiaquick Gel Extraction Kit (Qiagene; according to the
manufacturer’s protocol).
Evolutionary History of Wheats 409

1.3 DNA Sequencing and Phylogenetic Analysis
200 ng of the PCR product was used in a 10 ml cycle sequencing reaction with theABI BigDye Terminator Kit on an ABI 377 DNA sequencer. The nucleotidesequences were aligned using ClustalX software (Thompson et al., 1997) editedusing the GenDoc Version 2.6.002 (Nicholas et al., 1997). The phylogenetic treewas generated by the Neighbor-Joining method using MEGA 3.1 program(Kumar et al., 2004). Statistical support for the tree was evaluated by boot-strapping (1000 replications) (Felsenstein, 1985).
2 Results and Discussion
The origin of polyploid wheat species is almost like a ‘‘detective story,’’ not allparts are understood so far.
Besides, wild diploid (T. boeoticum AbAb genome–T. urartu AuAu genome)as well as wild tetraploid wheat species T. dicoccoides (Korn. ex Aschers.et Graebn.) Schweinf. (BBAA genome) and T. araraticum Jakubz. (GGAAgenome) are morphologically not differentiated from one another and notdistinguishable in archeological excavations (Nesbitt, 2001).
It is further unknown whether the first cultivated naked wheat species inEurope was tetraploid or hexaploid.
At the same time, the possibility of their identification is connected with asearch for possible wild species involved in cultivated wheat origin and theirdomestication.
2.1 Pile-Dwelling Wheat
Heer (1865) was the first who described T. antiquorum (BBAADD genome) onthe basis of grain remains in archeological excavations in Switzerland. It ispossible that T. antiquorum was among the first cultivated hexaploid wheatspecies in Europe.
T. antiquorum could have played an important role during the early cultivationof hexaploid wheats and it is possible that Asia occupied a central place in thisprocess (Udachin, 1982). The drawback of wheat phylogenetic schemes currentlyproposed consists in the absence of data on the character (type) of genetic controlof morphological taxonomically important traits that are identical in their phe-notypic manifestation. Since living T. antiquorum has been found in Tajikistan(Udachin, 1982), it is maybe possible to solve some phylogenetic-related problemsfor the origin of cultivated hexaploid wheat in Europe. The inheritance oftaxonomically important characters was therefore studied in pile-dwellingwheat T. antiquorum and two additional contemporary hexaploid wheat species.
410 N. P. Goncharov et al.

These external morphological traits are very often arbitrary. Two basictraits—spherical grains and compact spike—make this wheat distinct from allthe other ones.
2.1.1 Spherical Grains
Table 1 summarizes the data on the segregation with respect to the grain shapein F2 hybrids of T. sphaerococcum and T. antiquorum accessions and the resultsof checking the hypothesis that spherical grain genes of these species are allelic.Likewise, no segregation by grain shape was detected in F2 plants for crosses ofK-56397 T. antiquorum � K-23790 T. sphaerococcum. Monogenic segregationwas observed in F2 hybrids with common wheat (Table 1). This character iscontrolled monogenically by a recessive gene in K-23790 of T. sphaerococcum.Since the character is determined by recessive alleles in both species, F1 hybridswould express the wild-type (normal) phenotype in the case of non-allelic genes;i.e., the grains would be non-spherical. All 15 grains were spherical in the F1
hybrid of K-56398 T. antiquorum and K-23790 T. sphaerococcum. Therefore,the recessive gene determining spherical grain in K-56398 of T. antiquorum isallelic to that of K-23790 of T. sphaerococcum.
2.1.2 Compact Spike
The segregations observed in the F2 hybrids of T. compactum cultivar Vakkawith accession K-56397 of T. antiquorum and accession K-23790 ofT. sphaerococcum with CI 3090 of T. compactum are shown in Table 2. Theresults suggest that the dominant genes, controlling compact spike forT. compactum are non-allelic to the genes determining compact spike inT. antiquorum and T. sphaerococcum. Thus, the relevant T. antiquorum andT. sphaerococcum genes are different from the dominant C gene, which isresponsible for compact ear in T. compactum.
We designated it as C2. The origin of the dominant genes C and C2 inhexaploid wheats is unknown because compact spike accessions of
Table 1 Inheritance of grain shape in F2 hybrids of hexaploid wheats with T. antiquorum andthe test for allelic genes controlling spherical grains in T. antiquorum and T. sphaerococcum,respectively
Number of F2
hybrid plants with grain x2
Cross combination spherical normal 1:3 1:15
Triple Dirk D � K-23790
T. sphaerococcum 14 44 0.02 31.67Vrn8 � K-56398 T. antiquorum 18 82 2.61 23.56
K-56397 T. antiquorum � K-23790T. sphaerococcum 238 0 – –
Evolutionary History of Wheats 411

Ae. squarrosa, the D genome donor of hexaploid wheats, have not been dis-covered (Goncharov, 2002). However, the presence of different non-allelicdominant genes in T. antiquorum and T. compactum does not indicate a singleoccurrence of this taxonomically important mutation in hexaploid wheats.Furthermore, based on the data obtained for non-allelism of genes controllingcompact spike in studied hexaploid wheat species, we cannot use the earliersuggested schemes of hexaploid wheat species origin, as non-allelism of genesimplies their independent origin. Hence, making up new phylogenetic schemes(for example, see Udachin (1982) among others) of wheat origin and new meth-ods are necessary. For this purpose molecular markers for all wheat genomeswould be useful in order to detect and to understand their relationships. Here weprovide new sequence data for two chloroplast and two nuclear gene loci.
2.2 Chloroplast Evidence of Wheat Evolution
The analysis using all known wheat species including also Aegilops species wasbased on chloroplast matK gene comparison along with trnL (tRNA-Leu) intronsequences of some species (Fig. 1). Based on the neighbor-joining tree, all analyzedwheat and Aegilops species are subdivided into four related groups (Fig.1). Poly-ploid wheat species are divided only into two groups-Emmer I (T. dicoccoides andother BBAA Triticum species, not shown) and Timopheevii II (T. araraticum,T. timopheevii, other G genome wheats, and Ae. speltoides) dividing B and Ggenome wheat species. This result corroborates with the previous suggestion of adiphyletic origin of polyploid wheats based on earlier hybridological, cytologicalandmolecular analyses (Kilian et al., 2007; Lilienfeld andKihara, 1934;Mori et al.,1995). Group III comprises the diploid AA genome wheats (T. boeoticum,T. monococcum, T. urartu). Aegilops section Sitopsis and Vertebrata members(not shown) and artificial Aegilotricum and T. palmovae are within group IV.Each group I–III includes both wild and cultivated wheat species.
Various Triticum andAegilops species were implicated as donors of genomesof these polyploid wheats (Kerby and Kuspira, 1986). Among all the speciesanalyzed for the Sitopsis section of Aegilops in this study, Aegilops speltoides
Table 2 Inheritance of compact spike in T. compactum, T. sphaerococcum, and T. antiquorum
Number of F2 hybridplants x2
Cross combination Compact Normal 3:1 15:1
Vakka T. compactum � K-20900 T. aestivum 47 19 0.51 57.22
Vakka T. compactum � K-56397 T. antiquorum 79 3 19.92 0.94
K-23790 T. sphaerococcum � CI 3090
T. compactum 105 17 7.97 1.86
412 N. P. Goncharov et al.

Tausch (included in group II) is most closely related to the polyploid B or G
genome. Based on the data presented, both trnL and trnK intron sequences of
Ae. speltoides are more variable than the corresponding sequences from all
other Aegilops and diploid Triticum species. Sequences were previously
obtained (Golovnina et al., 2007) and submitted in GenBank.This observation strongly coincideswith the previous results based onnucleotide
variations of the four other chloroplast non-coding regions and microsatellite
repeat motifs (Yamane and Kawahare, 2005) and the ndhF gene (Kilian et al.,
2007).The topology of the trees in both studies clearly demonstrates that the
Ae. speltoides ancestor branched out before a separation of wild diploid Triticum
and Aegilops species (Fig. 1).Based on our results (Golovnina et al., 2007), it is proposed that one
Ae. speltoides ancestor was involved the first polyploidization event of wheat
species. It is likely that therewere two ancestor forms ofAe. speltoides involved in
a two-step hybridization, i.e. independent events (Emmer and Timopheevii
groups). The high degree of intraspecific variation observed amongAe. speltoides
accessions and differentiation into B andG genome of polyploid wheats support
this hypothesis. The G genome and plasmon of the section Timopheevii species
(clade II) appears evolutionarily younger and is closely related to the
Fig. 1 Neighbor-Joining phylogenetic tree based on the comparison of matK sequences.Four observed clusters are shown by solid lines on the right. The genome composition for eachspecies is indicated. Synthetic wheats are represented in bold letters. For all species belongingto the Emmer group (24 representatives, see Table 1 in Golovnina et al., (2007)) are indicatedas ‘‘Polyploids with B genome.’’ Based on the indel event in the trnL intron sequence of someanalyzed species, representatives with observed insertions are marked by solid boxes and therest ones by dotted boxes. Asterisks denote species from which the matK sequence wasobtained from the GenBank. Bootstrap values are shown
Evolutionary History of Wheats 413

contemporary Ae. speltoides, whereas the polyploid Triticum species (clade I)with the B genome occurred as a result of one more ancient hybridization eventwith the Ae. speltoides ancestor.
2.3 Nuclear Loci
The presence of four different wheat genomes—A, B, D, and G whose variouscombinations form three groups ofTriticum species on their ploidy (di-, tetra- andhexaploids)—are well known. The origin of wheat genomes was a matter ofdiscussion sincemore than seven decades. TheAgenome is found only inTriticumspecies and is subdivided into two genomes—Au andAb, according to the sourcesof their origin, i.e. two wild diploid wheat species—T. urartu and T. boeoticum.T. urartu was the A genome donor.Ae. speltoideswas the donor of both B and Ggenomes, and Ae. squarrosa L. (syn. =Ae. tauschiiCoss.) was that of D genome.
In the present study we have focused our research on the genome A andgenome B. We selected two nuclear gene loci Acc-1 and Pgk-1, because com-prehensive datasets were available in gene banks and we provided new datafrom so far not investigated species.
Total DNA from different Triticum and Aegilops species has been ampli-fied with A and B genome specific primer combinations. These primers weredesigned based on unique indels and nucleotide substitutions. The sequencingprocedure was conducted with primers complementary to the flankingregions of specificity. The results of PCR analysis of both Aegilops andpolyploid Triticum species completely confirmed the correct choice ofprimers. The PCR fragments of the expected size have been obtained forhomologous genes tested in the samples where the corresponding genomeswere present.
In contrast to the polyploid Triticum species, some samples of the diploid Agenome wheat species (T. urartu, T. boeoticum, and T. monococcum, showedunexpected results. PCR amplification with non-A genome specific primersamplified the A genome fragments also successfully, vice versa, PCR amplifica-tion with A genome specific primers appeared to be negative. Such results havebeen obtained for both Acc-1 and Pgk-1 genes. The results of PCR amplifica-tion with B genome specific Acc-1 primer combinations are shown in Fig. 2.
In the next step, we took amore detailed analysis and focused first on differentgeographical variants of diploid wheat species of T. urartu, T. boeoticum, andT. monococcum. At the same time, Kilian et al. (2007) published data on Acc-1andPgk-1 gene sequences obtained from different wheat species, which were alsoused for our analysis. The results of these comparative analysis for Acc-1 andPgk-1 gene sequences are summarized in Figs. 3a and b.
All analyzed Acc-1 sequences can be divided into two groups due to a 46 bpdeletion from position 1067 to position 1151, and some nucleotide substitutionsspecific for each group (Fig. 3a). The first group with the deletion comprises the
414 N. P. Goncharov et al.

sequences from polyploid wheat A genomes and also from all three diploid
A genome wheat species. The second group integrates the sequences of Acc-1
genes from Ae. speltoides, those of polyploid wheat B, G, and D genomes and
also the sequences of all three diploid A genome Triticum species.Thus, diploidA genomewheat sequences are found in both groups. To explain
these results, it is necessary to postulate that the wheat genomeA originated after
the separation of the genus Triticum progenitor from the common progenitor
with Aegilops. Later, both A- and B-like A genomes spread among the three
diploid wheat species—T. urartu, T. boeoticum, and T. monococcum (Fig. 4).The analysis of the Pgk-1 gene sequences is even more phylogenetically
informative, and it allows us to divide all the obtained sequences into several
groups. First, four groups are definitely outlined in Pgk-1 sequence compar-
isons according to their position to one of the polyploid wheat genomes A, B,G,
or D by the presence of specific indels and specific nucleotide substitutions (Fig.
3b). Among the diploid Triticum species we have found three different
sequences of the Pgk-1 gene fragment. One of these sequences was found in
T. urartu, which is identical to those from the A genomes of the polyploid
wheats. This fact supports that T. urartu was the donor of genome A in all
polyploid wheats. Two other variants of the Pgk-1 gene were determined in (1)
T. boeoticum and T. monococcum and (2) T. urartu and T. boeoticum, respec-
tively. These sequences are unique and different from the others found in
both Triticum and Aegilops genomes, although the first group (1) is closer to
the Pgk-1 gene from Ae. speltoides.Finally, based on the analyses of Acc-1 and Pgk-1 sequences, we can
conclude that three diploid Triticum species may contain several different
genomes in contrast to the polyploid species in which no heterogeneity has
been found. The real significance of these results may be confirmed by genetic
experiments for crossing diploid species with different genomes selected in our
analysis.
Fig. 2 PCR amplification with primers Acc 3T sense/Acc 3T antisense which were initiallyconsidered to be specific for genome B
Evolutionary History of Wheats 415

(a)
(b)
Fig. 3a Structure of the plastid Acc-1 gene together with the alignment of the region investi-gated. Numbers at the top on each column indicate positions in the whole alignment. Asterisksdenote sequences obtained in the present study, others were included from Kilian et al. (2007).TAU–Ae. tauchii, TAE–T. aestivum, SEA–Ae. searsii, SPE–Ae. speloides, TIM–T. timopheevii,ARA–T. araraticum, DIC–T. diccocoides, TDU–T. durum, TM–T. monococcum, TB–T. boeoti-cum, TU–T. urartu. Letters at the end of the sequence name indicate the genome
416 N. P. Goncharov et al.
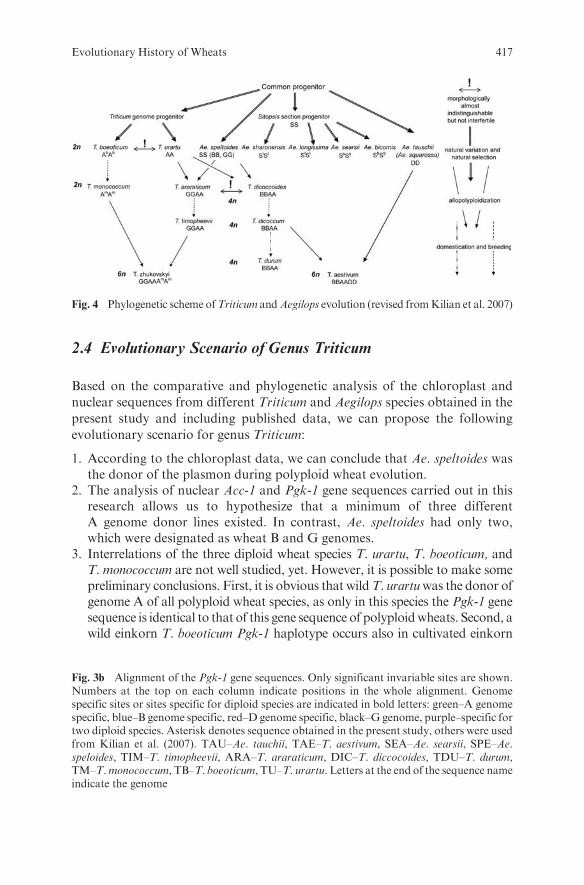
2.4 Evolutionary Scenario of Genus Triticum
Based on the comparative and phylogenetic analysis of the chloroplast and
nuclear sequences from different Triticum and Aegilops species obtained in the
present study and including published data, we can propose the following
evolutionary scenario for genus Triticum:
1. According to the chloroplast data, we can conclude that Ae. speltoides wasthe donor of the plasmon during polyploid wheat evolution.
2. The analysis of nuclear Acc-1 and Pgk-1 gene sequences carried out in thisresearch allows us to hypothesize that a minimum of three differentA genome donor lines existed. In contrast, Ae. speltoides had only two,which were designated as wheat B and G genomes.
3. Interrelations of the three diploid wheat species T. urartu, T. boeoticum, andT. monococcum are not well studied, yet. However, it is possible to make somepreliminary conclusions. First, it is obvious that wildT. urartuwas the donor ofgenome A of all polyploid wheat species, as only in this species the Pgk-1 genesequence is identical to that of this gene sequence of polyploidwheats. Second, awild einkorn T. boeoticum Pgk-1 haplotype occurs also in cultivated einkorn
Fig. 4 Phylogenetic scheme ofTriticum andAegilops evolution (revised fromKilian et al. 2007)
Fig. 3b Alignment of the Pgk-1 gene sequences. Only significant invariable sites are shown.Numbers at the top on each column indicate positions in the whole alignment. Genomespecific sites or sites specific for diploid species are indicated in bold letters: green–A genomespecific, blue–B genome specific, red–D genome specific, black–G genome, purple–specific fortwo diploid species. Asterisk denotes sequence obtained in the present study, others were usedfrom Kilian et al. (2007). TAU–Ae. tauchii, TAE–T. aestivum, SEA–Ae. searsii, SPE–Ae.speloides, TIM–T. timopheevii, ARA–T. araraticum, DIC–T. diccocoides, TDU–T. durum,TM–T.monococcum, TB–T. boeoticum, TU–T. urartu. Letters at the end of the sequence nameindicate the genome
Evolutionary History of Wheats 417

T. monococcum. This supports former findings that T. monococcum originatedfrom T. boeoticum (Beijerinck, 1884; Salamini et al., 2002).
Further experiments are still necessary in the future to get deeper insights
into the relationships of A genome wheats.
Acknowledgment We are grateful to Prof. N.A. Kolchanov for rapt attention to this inves-tigation and critical reading of the manuscript; Dr. H. Bockelman (the National Small GrainsCollection, Aberdeen, USA), Dr. T. Kawahara (Graduate School of Agriculture of KyotoUniversity, Kyoto, Japan), Drs. R.A. Udachin, O.P. Mitrofanova and N.A. Anfilova (N.I.Vavilov All-Russian Institute of Plant Industry, St.-Petersburg, Russia) and Dr. J. Valkoun(International Centre for Agriculture Research in theDry Areas, Aleppo, Syria) for supplyingthe seeds of wheat species. The research was partially financed on the Subprogram II ofProgram basic research N25 of the Russian Academy of Sciences ‘‘The Origin and Evolutionof Biosphere.’’
References
Beijerinck, M.W. (1884) Uber die Dastarde ruischen Triticum monococcum x Triticumdicoccum. Nederl. Krint. Arch. II. Serv., 189–255.
De Candole, A. (1885) Origin of cultivated plants. K. Rikker, St.-Petersburg, 490pp. (in Russian).
Felsenstein, J. (1985) Confidence limits on phylogenies: an approach using the bootstrap.Evolution 39, 783–791.
Golovnina, K.A., Glushkov, S.A., Blinov, A.G., Mayorov, V.I., Adkison, L.R. andGoncharov N.P. (2007) Molecular phylogeny of the genus Triticum L. Plant. Syst. Evol.264, 195–216.
Goncharov, N.P. (2002) Comparative genetics of wheats and their related species. SiberianUniversity Press, Novosibirsk, 252 pp. (in Russian with English Summary).
Goncharov, N.P. Glushkov, S.A. and Shumny, V.K. (2007) Domestication of cereal crops inOldWorld: in search of a new approach to solving old problem. Zhournal Obschei Biologii68, 125–147.
Harlan, J.R. (1992) Crops and Man, 2nd ed. Am. Soc. Agronomy, CSSA, Madison,Wisconsin, 284 p.
Heer, O. (1865) Die Pflanzen der Pfahlbauten. Neujahrsblatt der NaturforschendenGesellschaft (Zrich fr das Jahr 1866). 68, 1–54.
Kerby, K. andKuspira, J. (1986) The phylogeny of polyploid wheatsTriticum aestivum (breadwheat) and Triticum turgidum (macaroni wheat). Genome 29, 722–737.
Kilian, B., Ozkan, H., Deusch, O., Effgen, S., Brandolini, A., Kohl, J., Martin, W. andSalamini, F. (2007). Independent wheat B and G genome origins in outcrossing Aegilopsprogenitor haplotypes. Mol. Biol. Evol. 24, 217–227.
Kumar, S., Tamura, K. and Nei, M. (2004) MEGA3: Integrated software for molecularevolutionary genetics analysis and sequence alignment. Briefings Bioinfomat. 5, 150–163.
Lilienfeld, F. and Kihara, H. (1934) Genomanalyse bei Triticum und Aegilops. V. Triticumtimopheevi Zhuk. Cytologia 6, 87–122.
Mori, N., Liu, Y.-G. and Tsunewaki, T. (1995) Wheat phylogeny determined by RFLPanalysis of nuclear DNA. 2. Wild tetraploid wheats. Theor. Appl. Genet. 90, 129–134.
Nesbitt, M. (2001) Wheat evolution: integrating archaeological and biological evidence. TheLinnean. 3, 37–59. Special issue.
418 N. P. Goncharov et al.

Nicholas, K.B., Nicholas, H.B., Jr. and DeerWeld II D.W. (1997) GeneDoc: analysis andvisualization of genetic variation. EMBnet News 4, 14.
Rogers, S.O. and Bendich, A.J. (1985) Extraction of DNA from milligram amounts of fresh,herbarium and mummified plant tissues. Plant Mol. Biol. 5, 69–76.
Salamini, F., Ozkan, H., Brandolini, A., Schafer-Pregl, R. and Martin, W. (2002) Geneticsand geography of wild cereal domestication in the Near East. Nat. Rev. Genetics 3,429–441.
Thompson, J.D., Gibson, T.J., Plewniak, F., Jeanmougin, F. and Higgins, D.G. (1997) TheCLUSTAL_Xwindows interface: flexible strategies for multiple sequence alignment aidedby quality analysis tools. Nucleic Acids Res. 15, 4876–4882.
Udachin, R.A. (1982) On the possible current existence of Triticum antiquorum Heer,Nauch.-Tekhn. Byul. VNII Rastenievod 119, 72–73.
Yamane, K. and Kawahara, T. (2005) Intra- and interspecific phylogenetic relationshipsamong diploid Triticum-Aegilops species (Poaceae) based on base-pair substitutions,indels, and microsatellites in chloroplast non-coding sequences. Am. J. Bot. 92,1887–1898.
Evolutionary History of Wheats 419
Subject Index
aaRS, see Aminoacyl-tRNA synthetasesAAS, see Atom absorption spectroscopyAcc-1 genes, 403, 412Aegilops species, 408Aldohexose-2,4,6-triphosphates, 105Aldopentoses, 103Aldotetrose- and aldopentose-2,
4-diphophates, 105Allose-2,4,6-triphosphate, 105Alticola strelzovi, 382g-alumina, 105Amidotriphosphate, 105Aminoacyl-tRNA synthetases, 254–255,
257, 259Ammonia and carbohydrates, heterocycles
synthesis and, 108Ammonium chloride (NH4Cl), 333Anaerobic lithotrophic eubacteria, see
CarboxydothermusAnhysteretic remanence (ARM), 230Anui drainage basin, 380–381Apatite Ca5(OH, F, Cl)(PO4)3, 106Apodemus uralensis, 381Aquifex, 28Arabinocytidine-30-phosphate, 111Archaean concretions, isotopic composition
of, 169–173Archaeoglobus, 28Archean atmosphere, origin, 26Archetype, 5Asioscalops altaica, 381Astrocatalysis hypothesis
and planetology, 45–46‘‘RNA world’’ and life origin, 46–50universe evolution and life
origin, 43–45Atom absorption spectroscopy, 229Autocatalytic systems evolution, in flow
reactor, 115
auto-oligomerase reaction, 122computer model and conditions of real
experiment, 120–122computer simulation, results, 122–123phase-separated systems (PSS), 118–122presuppositions for problem
elimination, 117
Baikal rift zone, microbial mats in lakes andhydrotherms of, 185
hot spring phototrophic, 187–192non-phototrophic biofilms, 192–193of saline and soda lakes, 193–194terminal destruction processes in, 194types of, 186
Banded iron formations, 29, 31, 168associated carbonates, 179–180
Banding sequences, in genus Chironomus,346–347
dispersal of species and, 360–362divergence of, 348–353, 355–360as markers of evolutionary divergence of
species genomes, 353–355Barlagiin-Gol-1 site, 397Barley (Hordeum ssp.), 404Batrachuperus, 301BIFs, see Banded iron formationsBinary hammerhead ribozymes (binRz), 144
rate constants, for stages of catalyticcycles of, 147–148
RNA cleavage by, 145–146Biological cycle closure
closure coefficients, 332–334, 340ecological principle of, 335‘‘evolutionary’’ type of closure, 335–337general degree of, 339–341microevolutionary population
parameters, interaction of,337–339
421

Biological life support systems, 326, 334Biological realm, hierarchical scale-free
representation, 65referents
architecture of complexity, twodirections in, 73–75
evolutionary equation, 77–79hierarchy, growing of, 79–81identification, 67–70from linnaean hierarchy to hierarchy
of complexity, 71–73signs, space of, 76–77transition thresholds and
irreversibility of transition, 75–76synthetic theory of evolution (STE) and,
66, 72, 75Biomineralization, 228
composition, structure, and functions,evolution, 211–213
modern understanding and types of,209–211
silicon,see Silicon biomineralizationBiotic matter cycle, 325–327
establishment, conditions for, 329–332Bistate system, as prototype of living
organism, 158–161BLSS, see Biological life support systemsBlue-green algae, see CyanobacteriaBMC, see Biotic matter cycleBSs, see Banding sequencesButlerov reaction, see Formose reaction
Caenorhabditis elegans, 17, 275CAGE analysis, 278Calcium phosphate Ca3(PO4)2, 106Calderobacterium, 28Calothrix sp., 216Cambridge reference sequence, 370Cannizzaro reaction, 101Carbohydrates, 99
C2-C3, prebiotic synthesis of, 102–104cytidine ribonucleotides synthesis, on
sugar phosphate, 110–111formose reaction, 100–102, 104heterocycles synthesis from, 108ribose, 100selective prebiotic synthesis of, 104
of carbohydrates phosphates,105–106
catalyzed by natural minerals, 105co-condensation of lower
carbohydrates and formaldehyde,106–107
putative prebiotic synthesis of,107–108
‘‘sugar model’’ by A.L. Weber, 108–110Carbonaceous meteorites and comets,
biosphere origin and, 53–54filamentous cyanobacteria and sulfur
bacteria, 55Orgueil and Murchison, cyanobacteria
microfossils in, 58–61origin and distribution of life, 56–58
Carboxydothermus, 28d13Ccarb, of Early Precambrian carbonates,
167–168Central Antarctic Ice Sheet, 54Central Asia and Volga–Ural region, genetic
landscape of, 369materials and methods, 370–371mtDNA variation, 371–374Y-chromosome variation, 374–375
Chaetoceros muelleri, 221Chetverikov’s principle, 300Chironomus, genus
basic BSs, as markers of evolutionarydivergence of species genomes,353–355
BSs divergence, 348–353, 355–360chromosome evolution and speciation,
362–363karyotype structure, 346–347species dispersal and BSs, 360–362
Chloroflexus aurantiacus, 187–188Chromosomes
and continents, see Chironomus, genusevolution
cytogenetic analysis of, 346and speciation, 362–363
and speciation, 311S. murinus (house musk shrew),
314–316Sorex araneus (common shrew),
316–319Thrichomys, South American
caviomorph rodent, 312–314Chroococcalean cyanobacteria, 59Clethrionomys rutilus, 381Closure coefficients, 332–334Co-condensation, of lower carbohydrates
and formaldehyde, 106–107CO2- dominated atmosphere, 27Coevolution, 207
biomineralizationcomposition, structure, and functions,
evolution, 211–213
422 Subject Index
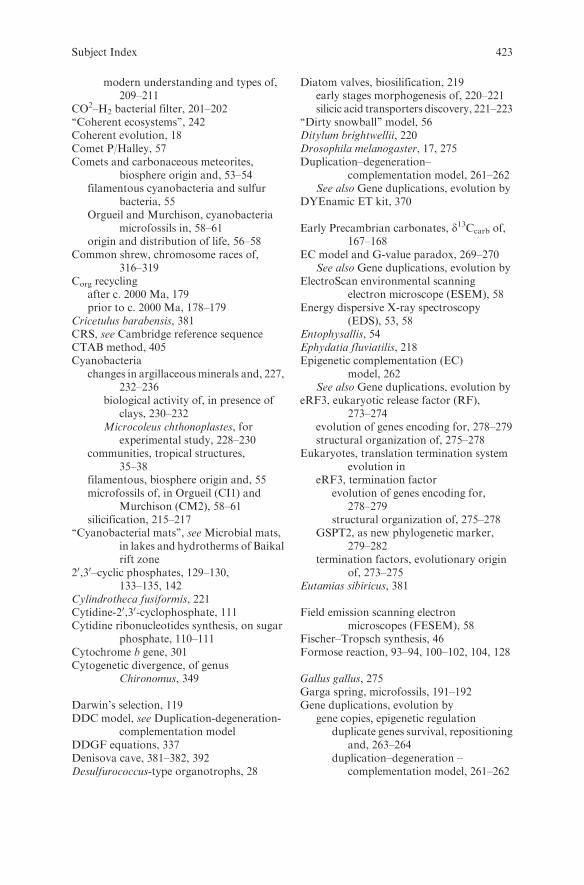
modern understanding and types of,209–211
CO2–H2 bacterial filter, 201–202‘‘Coherent ecosystems’’, 242Coherent evolution, 18Comet P/Halley, 57Comets and carbonaceous meteorites,
biosphere origin and, 53–54filamentous cyanobacteria and sulfur
bacteria, 55Orgueil and Murchison, cyanobacteria
microfossils in, 58–61origin and distribution of life, 56–58
Common shrew, chromosome races of,316–319
Corg recyclingafter c. 2000 Ma, 179prior to c. 2000 Ma, 178–179
Cricetulus barabensis, 381CRS, see Cambridge reference sequenceCTAB method, 405Cyanobacteria
changes in argillaceousminerals and, 227,232–236
biological activity of, in presence ofclays, 230–232
Microcoleus chthonoplastes, forexperimental study, 228–230
communities, tropical structures,35–38
filamentous, biosphere origin and, 55microfossils of, in Orgueil (CI1) and
Murchison (CM2), 58–61silicification, 215–217
‘‘Cyanobacterial mats’’, see Microbial mats,in lakes and hydrotherms of Baikalrift zone
20,30–cyclic phosphates, 129–130,133–135, 142
Cylindrotheca fusiformis, 221Cytidine-20,30-cyclophosphate, 111Cytidine ribonucleotides synthesis, on sugar
phosphate, 110–111Cytochrome b gene, 301Cytogenetic divergence, of genus
Chironomus, 349
Darwin’s selection, 119DDC model, see Duplication-degeneration-
complementation modelDDGF equations, 337Denisova cave, 381–382, 392Desulfurococcus-type organotrophs, 28
Diatom valves, biosilification, 219early stages morphogenesis of, 220–221silicic acid transporters discovery, 221–223
‘‘Dirty snowball’’ model, 56Ditylum brightwellii, 220Drosophila melanogaster, 17, 275Duplication–degeneration–
complementation model, 261–262See also Gene duplications, evolution by
DYEnamic ET kit, 370
Early Precambrian carbonates, d13Ccarb of,167–168
EC model and G-value paradox, 269–270See also Gene duplications, evolution by
ElectroScan environmental scanningelectron microscope (ESEM), 58
Energy dispersive X-ray spectroscopy(EDS), 53, 58
Entophysallis, 54Ephydatia fluviatilis, 218Epigenetic complementation (EC)
model, 262See also Gene duplications, evolution by
eRF3, eukaryotic release factor (RF),273–274
evolution of genes encoding for, 278–279structural organization of, 275–278
Eukaryotes, translation termination systemevolution in
eRF3, termination factorevolution of genes encoding for,
278–279structural organization of, 275–278
GSPT2, as new phylogenetic marker,279–282
termination factors, evolutionary originof, 273–275
Eutamias sibiricus, 381
Field emission scanning electronmicroscopes (FESEM), 58
Fischer–Tropsch synthesis, 46Formose reaction, 93–94, 100–102, 104, 128
Gallus gallus, 275Garga spring, microfossils, 191–192Gene duplications, evolution by
gene copies, epigenetic regulationduplicate genes survival, repositioning
and, 263–264duplication–degeneration –
complementation model, 261–262
Subject Index 423

Gene duplications, evolution by (cont.)EC model and G-value paradox,
269–270epigenetic complementation
model, 262mutational asymmetry, repositioning
and, 265–266young duplicates, adaptive evolution
of, 266–269genetic code origin, duplication in tRNA
tRNA aminoacylation, simultaneoussense–antisense coding and,257–260
tRNAs domains and paradox of twocodes, 253–256
tRNAs points to ancient duplication,dual complementarity in, 256–257
Genetic code, origin, see tRNA, duplicationGeosphere and biosphere evolution,
stages, 3–20, 15–16archetype, canalization of, 5cacosphere, 20climate evolution, stages of, 9coherent evolution, 18cyanobacteria, emergence of, 12DNA/RNA/protein-based life and, 4energy-producing enzyme systems and, 15K/Na ratio and, 12mantle, evolution of, 6moon-like stage of Earth, 4–5‘‘plume dropper’’ formation, 12Rayleigh number (Ra), 10SELEX experiments, 7World Ocean, 10, 11, 14
Gli/Ci genes expression, 289Global paleogeographical reconst-ructions,
303Glycolaldehyde phosphate synthesis, 105–106GSPT1 protein, 275GSPT2 genes, 278–282GSPT2, as new phylogenetic marker, 275,
279–282
Hamersley basin, 169Hbs1 protein, 274Hedgehog (Hh) signaling cascade system,
285–286genes, evolutionary mode of, 292modeling of, 287–289molecular evolution of, 290–292
Hexose-2,4,6-triphosphates, 105Holarctic basic BSs (hb0BSs), 351Homo erectus, 391
Homo sapiens, 19, 87Homo sapiens sapiens, 398Hot spring phototrophic microbial mats,
187–192See also Microbial mats, in lakes and
hydrotherms of Baikal rift zoneHouse musk shrew, chromosome races of,
314–316ht15 haplotype, 375Hydrocarbon-oxidizing bacterial filter,
200–201Hydrogenobacter, 28Hydrogenotrophic chemosynthetic
microbes, 27–282-Hydroxymethyl glycerol, 103Hynobius, 301
‘‘Incoherent ecosystems’’, 242
Kaufmann’s theory, 88Kimura’s neutral evolution theory, 286K-23790 T. sphaerococcum, 407
Levallois technique, 393Lobry de Bruyn Alberda van Ekenstein
reaction, 101Lomagundi-Jatuli isotopic event, OM
recycling and, 180Lubomirskia baicalensis, 217–218
Magnetite, 28Mammalian phylogeny, divergence events,
302–304Marmot bones, from Betovo Paleolithic
site, 380Mastigocladus laminosus, 29matK gene, 408–409Metanosaeta thermoacetophila, 29Michaelis–Menten constant, 337Microbial biosphere, 23
actualistic principle, limits,26–27
post-prokaryotic evolution, 25prokaryotic evolution, 24relict microbial communities
acidophilic, 29anaerobic lithotrophic eubacteria, 28cyano-bacterial community, trophic
structure of, 35–38hydrogenotrophic chemosynthetic
microbes, 27–28landscape formation, in prokaryotic
biosphere, 30–35
424 Subject Index

thermophilic cyanobacterialcommunity, 30
Microbial mats, in lakes and hydrotherms ofBaikal rift zone, 185
hot spring phototrophic, 187–192non-phototrophic biofilms, 192–193of saline and soda lakes, 193–194terminal destruction processes in, 194types of, 186
Microfossils, 31, 57of cyanobacteria, in Orgueil (CI1) and
Murchison (CM2), 58–61Microtus arvalis, 381Miller’s theory, 88Mitochondrial DNA (mtDNA), 369
variation, among Volga–Uralpopulations, 371–374
Murchison (CM2) and Orgueil (CI1),cyanobacterial microfossils in,58–61
Mutational asymmetry, of duplicate genes,265–266
Mycoplasma genitalium, 17, 69Myospalax myospalax, 381Myotis lucifugus, 279
Nanobacteria, 210Naphthidiobiosis, zone, 202–203‘‘Natural selection’’, 88, 90–91, 95–96, 300Natural minerals, carbohydrates synthesis
and, 105Navicula salinarum, 220NJ-phylogenetic AEF tree, 359Non-phototrophic biofilms, 192–193North-western Altai
ancient man settling and, 391–400Paleolithic man habitats reconstruction
and, 379Anui valley, contemporaneous
animals of, 380–381Denisova cave, small mammals from,
381–382mammal fauna and activity of
Paleolithic man, 383–389Ust’-Karakol site, small mammals
from, 383Nostoc sp., 60Notch-denticulate tools, 399Novosibirsk–Tomsk F1 hybrids, 317–318
Ochromonas ovalis, 222OM recycling, Lomagundi-Jatuli isotopic
event and, 180
Oparin–Holdane–Bernal theory, 88Ordovician period, 241–242
biota of, evolution, 245–248ecological quilds of, 243global geological events, 244
Orgueil (CI1) and Murchison (CM2),cyanobacterial microfossils in, 58
cyanobacteria morphotypes in, 59–61Origin of life, prebiotic phase of
autocatalytic system, 89, 95capacity for self-replication
phenomenon, 87DNA and RNA, 87Engels theory, 85–86formosa reaction, 93–94Kaufmann’s theory, 88Miller’s theory, 88natural selection, 88, 90–92, 95–96Oparin–Holdane–Bernal theory, 88physicochemical definition for, 96
Orkhon-1 stratified site, 397
Palaeoproterozoic concretions, isotopiccomposition, 173–177
Paleolithic man habitats reconstruction,Northwestern Altai and, 379
Anui valley, contemporaneous animalsof, 380–381
Denisova cave, small mammals from,381–382
mammal fauna and activity of, 383–389Ust’-Karakol site, small mammals
from, 383Particulated organic matter, 36PCA, see Principal component analysisPDMPO, fluorescent, 220Peach latent mosaic viroid (PLMVd), 133PFD, see Prion forming domainPgk-1 genes, 403Phormidium laminosum, 29, 33Phylogenetic reconstruction, 299
Chetverikov’s principle, 300mammalian faunas, basic events in,
304–306mammalian phylogeny, divergence events
in, 302–304zoogeographical dating and, 306–308
Phylogeographic reconstructions, 369Planetology, astrocatalysis hypothesis and,
45–46‘‘Plume dropper’’ formation, 12POC, see Particulated organic matterPodospora anserina, 276
Subject Index 425

Prebiotic organic microsystem, 153bistate system, as prototype of living
organism, 158–161fundamental properties, 154–155stabilized bifurcation, as starting point of
life, 155chemical system, properties, 156–157living cell, characteristics of, 157–158
Principal component analysis, 373Prion forming domain, 276Prokaryotic biosphere, landscape
formation, 30amphibial landscapes, 31, 33halophilic community and, 34Precambrian soils and, 32stromatolites formation and, 33–34
Pseudohynobius, 301‘‘Purple and greenmats’’, seeMicrobial mats,
in lakes and hydrotherms of Baikalrift zone
R1b3 Y-chromosomes, 375Rayleigh number (Ra), 10RCPs, see Repeat-containing proteinsReal enzymatic ‘‘bottleneck’’ reaction,
337–338Recombination reaction, RNA molecules
formation and, 132intramolecular transesterification
reaction, 133ligation reaction, 133–134Watson–Crick base pairing, 135–136See also RNA world, evolution
Referent concept, hierarchical scale-freerepresentation of biologicalrealm and
architecture of complexity,two directions in, 73–75
evolutionary equation, 77–79hierarchy, growing of, 79–81identification, 67–70from linnaean hierarchy to hierarchy of
complexity, 71–73signs, space of, 76–77transition thresholds and irreversibility of
transition, 75–76two-dimensional schema of, 74
Repeat-containing proteins, 277Restriction fragment length polymorphism
analysis (RFLP analysis), 370, 375Rhodamine 123 (R 123), 220Ribose-2,4-diphosphate, 93–94, 105, 128Ribozymes, trans hammerhead, 139–140
binary hammerhead ribozymes and, seeBinary hammerhead ribozymes(binRz)
RNA ligation by, 141–144variants of, 142
RNA ligation, by trans hammerheadribozymes, 141–144
RNA world, evolution, 44, 100astrocatalysis and life origin, 46–50catalytic RNAs emergence, 131–132first RNA monomers, 127–129recombination reaction, 132–136RNA oligomers, prebiotic synthesis of,
129–131trans hammerhead ribozymes and, see
Trans hammerhead ribozymesWatson–Crick base pairing, 129, 131,
135–136RS-space, evolutionary equation on, 77–79
Saline and soda lakes, microbial mats,193–194
See also Microbial mats, in lakes andhydrotherms of Baikal rift zone
Satellite tobacco ringspot virus, 141–142S. cerevisiae, 274, 276Shizosaccharomyces pombe, 276Silica deposition vesicles (SDVs), 216,
220–221Silicic acid transporter protein, 221–223Silicon biomineralization
cyanobacteria, silicification, 215–217diatoms, 219
early stages morphogenesis, of diatomvalves, 220–221
silicic acid transporters discovery,221–223
sponges, 217–219Simple homogenous closed ecosystem, on
matter supplybase model description, 327–329BMC establishment, conditions for,
329–332SIT, see Silicic acid transporter proteinsit genes, 222–223Slmb genes, 290, 294smo gene, 290SOPM method, 277Sorex araneus, see Common shrew,
chromosome races ofSpeciation, chromosomes and, 311
S. murinus (house musk shrew), 314–316Sorex araneus (common shrew), 316–319
426 Subject Index

Thrichomys, South Americancaviomorph rodent, 312–314
‘‘SPECTROSCAN MAKC-GV’’ XRFcrystal diffraction scanningspectrometer, 229
Spermophilus undulatus, 381Spirulina platensis, 332–333Sponges, silicon biomineralization and,
217–219SRB, see Sulphate-reducing bacteriaSTE, see Synthetic theory of evolutionStenocranius gregalis, 382sTRSV, see Satellite tobacco ringspot virusSubsurface microbiology, 199
CO2–H2 bacterial filter zone, 201–202evaluation of, 203hydrocarbon-oxidizing bacterial filter,
zone of, 200–201naphthidiobiosis zone, 202–203structural organization of, 200
Su(fu) and fu genes, 290‘‘Sugar model’’ by A.L. Weber, 108–110‘‘Sulfuric mats’’, see Microbial mats, in lakes
and hydrotherms of Baikal rift zoneSulphate-reducing bacteria, 36, 167Suncus murinus, see House musk shrew,
chromosome races ofSynthetic hydroxylapatite Ca5(OH)(PO4)3,
106Synthetic theory of evolution, 66, 72, 75Synura petersenii, 222
Template-directed synthesis model, 130See also RNA world, evolution
Tethya aurantia, 218Thalassiosira weissflogii, 220Thermodesulfobacterium, 29Thrichomys, South American rodent,
312–314Trans hammerhead ribozymes, 139–140
binary hammerhead ribozymes and,seeBinary hammerhead ribozymes(binRz)
RNA ligation by, 141–144variants of, 142
Translation termination system evolution, ineukaryotes
eRF3, termination factorevolution of genes encoding for,
278–279structural organization of, 275–278
GSPT2, as new phylogenetic marker,279–282
termination factors, evolutionary originof, 273–275
Triticum ssp., see Wheat, evolutionaryhistory
tRNA, duplicationtRNA aminoacylation, simultaneous
sense–antisense coding and,257–260
tRNAs domains and paradox of twocodes, 253–256
tRNAs points to ancient duplication,dual complementarity in,256–257
See also Gene duplications, evolution bytrnT–trnL intergenic spacer, 405
Uracil, 128Ust’-Karakol site, 383, 392
Vega Dust Mass Spectrometer, 57Vibrating sample magnetometer (VSM), 230Vivianite Fe3(PO4)2, 106Volga–Ural region and Central Asia, genetic
landscape of, 369materials and methods, 370–371mtDNA variation, 371–374Y-chromosome variation, 374–375
Watson–Crick base pairing, 129, 131,135–136
Wheat, evolutionary history, 403chloroplast evidence of, 408–410DNA sequencing and phylogenetic
analysis, 406genus Triticum, 413–414nuclear loci, 410–413pile-dwelling wheat, 406–408plant materials, 404–405total DNA isolation and PCR
amplification, 405Wollastonit equilibrium, 27
X-ray diffraction (XRD), 229
Y-chromosomemarkers, 369variation, in Volga–Ural and Central
Asian populations, 374–375Young duplicates, adaptive evolution, 266–269
See also Gene duplications, evolution by
Zoogeographical dating, phylogeneticreconstruction and, 306–308
Subject Index 427