Embed Size (px)
Citation preview
The extraction and
fractionation of
waxes from biomass
Emily H. K. Sin
PhD
University of York
Department of Chemistry
June 2012


3
Abstract
The aim of this project was to extract and fractionate waxes from abundant and low-cost
under-utilised renewable resources using a green alternative technology. Through a review
of the literature, the waxes covering agricultural by-products such as straw were identified as
a potential source of high value chemicals for a wide range of applications.
Wheat straw waxes were extracted using organic solvents to demonstrate that straw
contained high value wax compounds including free fatty acids, fatty alcohols, alkanes, wax
esters, sterols, aldehydes and β-diketones. The solvent properties did not affect the
composition of the extracts but changed the relative abundance of the different compounds.
Linear solvation energy relationship (LSER) was used to model the extraction selectivity
relating to total extraction yield and the various wax compounds. Lipophilic and aqueous
fractions were separated and LSER results identified that the solvent properties affect only
on the quantity of aqueous fraction recovered indicating the selectivity of the solvent.
Extraction of wheat straw wax was carried out using a more environmentally friendly
supercritical CO2 extraction. The compositional profiles can be tuned by the manipulation of
temperature and pressure and compared with the organic solvent extractions. Optimisation of
temperature and pressure was carried out and the total crude yields and wax chemical group
yields were modelled using the Chrastil equation to gain a better understanding of conditions
required to achieve optimum extraction. The optimisation was used as part of the industrial
collaboration scale up with Sundown Products Limited and Evonik Industries where a total
of three tonnes of wheat, barley and oat straws were extracted using supercritical CO2 which
yielded approximately 60 kg of wax. The three cereal straws were selected based on yield
and composition as raw materials for the scale up from the biomass screen of seven different
straws using hexane and ethanol extractions.
Economical assessment was carried out based on the scale up trial and it was concluded that
currently the cereal straw wax would cost £12 per kg which is about 2 – 3 times higher than
commercial waxes. The straw waxes were characterised and physical properties such as
melting point were determined and found to be similar to commercial waxes such as
beeswax. Fractionation by scCO2, GPC and saponification were used to further separate the

4
wax products for formulation trials and product tests with the project sponsor, Croda. The
crude wax products were deeply coloured and highly hydrophobic with no emulsification
properties therefore applications such as coatings and polishes were suggested.
5
Table of Contents
Abtract 3
List of tables, figure and equations 9
List of abbreviations 17
Acknowledgements 21
Declaration 23
1. INTRODUCTION 27
1.1 Scope of the project 27
1.2 Sustainable development 28
1.2.1 Bio-refinery Concept 29
1.2.2 The twelve principles of Green Chemistry 31
1.2.3 Biorefinery and Green Chemistry as sustainable future 33
1.3 Agricultural waste 33
1.3.1 Availability 33
1.3.2 Straw and husk 36
1.3.3 The plant cuticle 37
1.4 Plant waxes 39
1.4.1 Classes of plant epicuticular waxes 39
1.5 Biosynthetic pathway of plant cuticular wax 42
1.5.1 Biosynthetic pathway 42
1.5.2 Cereal waxes 49
1.6 Commercial waxes 52
1.6.1 Manufacturing of commercial waxes 52
1.6.2 Chemical composition and physical properties 56
1.6.3 Wax market and applications 57
1.6.4 Wax market outlook and opportunities 58
1.7 Introduction to work in thesis 60
2. SOLVENT EXTRACTION OF WHEAT STRAW WAX 65
2.1 Introduction 65
2.2 Solvent selection and extraction 65
2.2.1 Solvent parameters and linear solvation energy relationships 65
2.2.2 Solvent green guides 67
2.2.3 Biomass pre-treatment techniques 69
2.2.4 Solvent extraction techniques 70
2.3 Optimisation of solvent extraction using LSER 72
2.4 Chemical composition identification using GC and GC-MS 84

6
2.4.1 Free fatty acids 87
2.4.2 Hydrocarbons 91
2.4.3 Free fatty alcohols 94
2.4.4 Aldehydes 96
2.4.5 Wax Esters 99
2.4.6 Sterols 104
2.4.7 Beta-diketones 113
2.4.8 Chemical composition of wheat straw wax summary 117
2.5 Quantification of key wax components in wheat straw wax 117
2.5.1 Quantification of key wax components by calibration 119
2.5.2 Free fatty acids 121
2.5.3 Hydrocarbons 123
2.5.4 Free fatty alcohols 125
2.5.5 Aldehydes 126
2.5.6 Wax esters 127
2.5.7 Sterols 130
2.5.8 β-Diketones 132
2.5.9 Summary of wax components quantified in organic solvent extracts
2.6 Conclusion and future work 141
3. SUPERCRITICAL CARBON DIOXIDE EXTRACTION OF WHEAT
STRAW WAX 141
3.1 Introduction 141
3.2 Carbon dioxide extraction of wheat straw 151
3.2.1 Raw materials, pre-treatment and moisture content 151
3.2.2 Comparison of organic solvents and carbon dioxide extraction yields
152
3.2.3 Effect of temperature and pressure in supercritical carbon dioxide
crude extraction yields by first order polynomial modelling 154
3.2.4 Effect of temperature and pressure in supercritical carbon dioxide
extraction yields of different wax groups 159
3.2.5 Optimisation of wheat straw wax extraction using supercritical carbon
dioxide by Chrastil modelling 164
3.3 Identification and quantification of key wax components in wheat straw wax
171
3.3.1 Free fatty acids 172
3.3.2 Hydrocarbons 175
3.3.3 Fatty alcohols 177
3.3.4 Aldehydes 178
3.3.5 Wax esters 179
3.3.6 Sterols 180
3.3.7 β-Diketones 182
3.3.8 Summary of wax components quantified in CO2 extracts 183
3.4 Conclusion and future work 189
7
4. STRAW WAX SCREEN AND PRODUCTION SCALE
SUPERCRITICAL CARBON DIOXIDE EXTRACTION OF CEREAL STRAW
WAXES 196
4.1 Introduction 196
4.2 Raw materials selection 196
4.2.1 Raw materials 196
4.2.2 Identification of hexane and ethanol extraction of raw materials 197
4.2.3 Quantification of hexane and ethanol extraction of raw materials
213
4.3 Production scale extraction of cereal straw wax 226
4.3.1 Raw materials 226
4.3.2 Laboratory extraction trials at York Green Chemistry Centre 227
4.3.3 Production scale extraction trials at Evonik Industries 229
4.4 Conclusion and future work 241
5. STRAW WAX PROCESSING, PHYSICAL PROPERTIES AND
ECONOMIC CONSIDERATIONS 245
5.1 Introduction 245
5.2 Straw wax processing 245
5.2.1 Co-extraction of water 245
5.2.2 Fractionation by supercritical carbon dioxide 248
5.2.3 Fractionation by gel permeation chromatography (GPC) 253
5.2.4 Saponification 263
5.3 Physical properties 271
5.3.1 Melting point 271
5.3.2 Acid value, saponification value and drop point 281
5.3.3 Appearance and aroma 284
5.3.4 Water absorption 286
5.4 Applications and costs 287
5.4.1 Potential applications 287
5.4.2 Economic considerations 288
5.5 Conclusion and future work 293
6. EXPERIMENTAL PROCEDURES 299
6.1 Materials and reagents 299
6.2 Pre-treatment, extraction and fractionation procedures 300
6.2.1 Moisture content of raw materials 300
6.2.2 Pre-treatment of raw materials 300
6.2.3 Soxhlet extraction 301
6.2.4 FexIKA® extraction 301
6.2.5 Supercritical fluid extraction 302
6.2.6 Purification and fractionation of wax extracts 304
6.2.7 Saponification 305
8
6.3 Chemical compositions analysis procedures 306
6.3.1 GC analysis 306
6.3.2 GC-MS analysis 307
6.3.3 Derivatisation for GC analysis 307
6.3.4 FAME analysis 307
6.3.5 IR analysis 308
6.3.6 GPC analysis 308
6.3.7 MALDI TOF MS analysis and synthesis of LiDHB matrix 309
6.4 Physical properties of wax extracts 310
6.4.1 Decomposition by STA analysis 310
6.4.2 Thermal transition temperatures by DSC analysis 310
6.4.3 Acid value 310
6.4.4 Saponification value 311
6.4.5 Drop point 312
6.4.6 Slip point 312
6.4.7 Gardner colour 312
6.4.8 Water absorption 313
6.4.9 Base value 313
7. CONCLUSION AND FUTURE WORK 317
8. REFERENCES 325

9
List of tables, figures and equations
1. INTRODUCTION
Figure 1.1: Comparison of oil-refinery vs. bio-refinery (originally in colour) 30
Figure 1.2: Straw bio-refinery (originally in colour) 31
Figure 1.3: The “Twelve Principles of Green Chemistry” (originally in colour) 32
Figure 1.4: Total breakdown of cereal and oilseed crops in UK in 2007 (originally in colour)
34
Figure 1.5: Breakdown of wheat, barley, oat and oilseed rape straw in the UK in 2007
(originally in colour) 35
Figure 1.6: Cereal straw and its botanical components (originally in colour) 36
Figure 1.7: The structure of the plant cuticle (originally in colour) 38
Figure 1.8: Molecular structure of cuticular waxes 39
Table 1.1: Common wax classes 41
Figure 1.9: Fatty acids de novo synthetic pathway 44
Figure 1.10: Wax biosynthesis including acyl reduction, fatty acids elongation and alkane
pathways 46
Figure 1.11: Beta-diketone biosynthetic pathway 47
Figure 1.12: A simplified sterol biosynthetic pathway from the isoprenoid pathway 48
Table 1.2: Epicuticular wax of cereal plants 49
Table 1.3: Epicuticular wax from cereal waste 51
Figure 1.13: Wool grease retrieval from sheep wool 54
Figure 1.14: Wool grease processing at Croda 55
Table 1.4: Chemical composition and physical properties of four commercial waxes 57
Figure 1.15: Global wax applications 58
Figure 1.16: Wax market outlook in 2020 59
Figure 1.17: A poster by B&T Company at In-Cosmetics® 2010 (Picture taken at the
exhibition) (originally in colour) 60
2. SOLVENT EXTRACTION OF WHEAT STRAW WAX
Table 2.1: List of selected solvents and their Reichardt’s number (ETN) and Kamlet-Taft
polarity parameters (α, β and π*) 67
Equation 2.1: Kamlet-Taft linear solvation energy relationships 67
Table 2.2: List of selected solvents and their environmental, health and safety issues1
(originally in colour) 69
Figure 2.1: Soxhlet extractor (originally in colour) 70
Figure 2.2: FexIKA® Vario Control Series Extractor (originally in colour) 71
Equation 2.2: Calculation of percentage crude yield 72
Table 2.3: Percentage crude yield with percentage of DCM and water soluble fractions 73
Figure 2.3: Percentage crude yield with percentage of DCM and water soluble fractions
(originally in colour) 73
Equation 2.3: Calculation of percentage selectivity 74
Figure 2.4: The selectivity of different organic solvent extractions (originally in colour) 74
Table 2.4: Comparison of data with literature values 75
Equation 2.4: New Gibbs free energy equation 76
Equation 2.5: New normalised temperature LSER equation with percentage crude yield 76

10
Table 2.5: Solvent parameters in LSER equation 2.5 77
Figure 2.5: A 3D plot of the percentage crude yield of the solvents (originally in colour) 78
Figure 2.6: A comparison of experimental and predicted percentage crude yield (originally in
colour) 79
Equation 2.6: New normalised temperature LSER equation with percentage aqueous yield
80
Equation 2.7: Calculation for residual error 80
Figure 2.7: Residual error plot for experimental and predicted percentage crude yield
(originally in colour) 81
Figure 2.8: A comparison of experimental and predicted percentage aqueous soluble yield
81
Figure 2.9: Residual error plot for experimental and predicted percentage aqueous soluble
yield (originally in colour) 82
Figure 2.10: A comparison of DCM soluble, aqueous soluble and crude yield (originally in
colour) 83
Equation 2.8: LSER equation for percentage crude yield 83
Equation 2.9: LSER equation for percentage DCM soluble yield 83
Equation 2.10: LSER equation for percentage aqueous yield 83
Figure 2.11: GC chromatogram of whole heptane wheat straw extract (originally in colour)
84
Figure 2.12: GC chromatogram of ethanol wheat straw extract (originally in colour) 85
Equation 2.11: Kovats Index (KI) calculation as modified by Van Den Dool and Dec Kratz
85
Figure 2.13: Reference alkane mix analysed by two different capillary columns (originally in
colour) 87
Figure 2.14: Formation of EI fragment ion m/z = 60 88
Figure 2.15a: EI mass spectrum of hexadecanoic acid (C16:0) (magnified three times from m/z
213 - 260) (originally in colour) 88
Figure 2.15b: EI mass spectrum of hexadecanoic acid (C16:0) from the NIST library
Figure 2.16: Formation of EI fragment ion m/z = 73 88
Table 2.6: Identification of free fatty acids presented in solvent extracts including the EI
fragmentation pattern with percentage base peak intensity and KI values 90
Table 2.7: Aliphatic alkyl chain fragmentation peaks in mass spectra 90
Figure 2.17a: EI mass spectrum of nonacosane (C29) (magnified two times from m/z 100 –
400) (originally in colour) 92
Figure 2.17b: EI mass spectrum of nonacosane (C29) from the NIST library (originally in
colour) 93
Table 2.8: Identification of n-alkanes presented in solvent extracts including the EI
fragmentation pattern with percentage base peak intensity and KI values 93
Figure 2.18a: EI mass spectrum of octacosanol (C28) (magnified five times from m/z 126 –
410) (originally in colour) 95
Figure 2.18b: EI mass spectrum of octacosanol (C28) from the NIST library 95
Table 2.9: Identification of octacosanol in solvent extracts including the EI fragmentation
pattern with percentage base peak intensity and KI values 95
Figure 2.20: Formation of EI fragment ion m/z = 393 and m/z = 365for octacosanol (C28) 96
Figure 2.21: EI mass spectrum of octacosanal (C28) (magnified five times from m/z 125 –
410) (originally in colour) 97
Figure 2.22: Mass fragment ion of aliphatic aldehyde (originally in colour) 97
Figure 2.23: Formation of mass fragment ion m/z = 390 98
Figure 2.24: FI mass spectrum of octacosanal (C28) 98

11
Table 2.10: Identification of octacosanal in solvent extracts including the EI fragmentation
pattern with percentage base peak intensity and calculated KI 99
Figure 2.25: Formation of base peak ion m/z = 57 for aliphatic aldehydes 99
Figure 2.26: GC chromatogram of wheat straw wax esters (originally in colour) 100
Figure 2.27: Formation of EI fragment ions m/z = 393, 257 and 256 for octacosanyl
hexadecanoate (C28:C16) 101
Figure 2.28: EI mass spectrum of octacosanyl hexdecanoate (C28:C16) (originally in colour)
101
Table 2.11: Identification of wax esters in solvent extracts including EI fragmentation pattern
with percentage base peak intensity and calculated KI 103
Table 2.12: List of characteristic fragment ions for even-numbered wax 104
Figure 2.29: Four cycloalkane carbon skeleton rings found in sterols and 3’-ketosteroid 105
Figure 2.30: Structure of sterols present in wheat straw wax 106
Figure 2.31a: EI mass spectrum of stigmasterol (magnified four times from m/z 400 – 415)
(originally in colour) 107
Figure 2.31b: EI mass spectrum of stigmasterol from the NIST library 107
Figure 2.32: Fragmentation of a sterol to give characteristic mass ions 108
Figure 2.33: Dehydration step of a sterol to give characteristic ion 108
Table 2.13: List of characteristic fragment ions for sterols 109
Figure 2.35: EI mass spectrum of ∆4-Sitosten-3-one (originally in colour) 110
Figure 2.36: FI mass spectrum of ∆4-Sitosten-3-one 110
Figure 2.37: Formation of base peak ion m/z = 124 111
Figure 2.38: Formation of fragment ions m/z = 230 and m/z = 149 112
Table 2.14: Identification of sterols and sterol derivatives in solvent extracts including EI
fragmentation pattern with percentage base peak intensity and calculated KI 113
Figure 2.39: Keto-enol tautomerism of β-diketones 114
Figure 2.40a: EI spectrum of hentriacontane-14,16-dione (magnified two times from m/z 212
– 500) (originally in colour) 115
Figure 2.40b: EI spectrum of hentriacontane-14,16-dione from the NIST library 115
Figure 2.41: Characteristic fragment ions for β-diketones 116
Table 2.15: Identification of β-diketones in solvent extracts including EI fragmentation
pattern with percentage base peak intensity and calculated KI 116
Figure 2.42: Mass fragmentation of the 14,16 hentriacontanedione (C31) and 16,18
triatriacontanedione (C33) (originally in colour) 117
Figure 2.43: Typical GC chromatogram of solvent wheat straw wax (Viscount 09) extract
(originally in colour) 118
Figure 2.44: Calibration graph for octadecanoic acid (free fatty acid representative)
(originally in colour) 119
Equation 2.12: Calculation of area ratio 120
Equation 2.13: Calculation of mass ratio 120
Table 2.16: List of standards and its calibration range with r2 and calculated response factor
value 120
Equation 2.14: Calculation of response factor value using ECN method 121
Table 2.17: List standards with the calculated response factor value from ECN method 121
Figure 2.45: Percentage of total fatty acids in solvent crude extracts (originally in colour)
122
Figure 2.46: Percentage of individual free fatty acids in solvent crude extracts (originally in
colour) 123
Figure 2.47: Percentage of total n-alkanes in solvent crude extracts (originally in colour)
124
12
Figure 2.48: Percentage of individual n-alkanes in solvent crude extracts (originally in
colour) 125
Figure 2.49: Percentage of octacosanol (C28) in solvent crude extracts (originally in colour)
126
Figure 2.50: Percentage of octacosanal (C28) in solvent crude extracts (originally in colour)
127
Figure 2.51: Percentage of wax esters in solvent crude extracts (originally in colour) 128
Equation 2.15: New normalised LSER equation with percentage wax ester 129
Figure 2.52: Percentage of wax esters in solvent crude extracts (originally in colour) 130
Figure 2.53: A comparison of experimental and predicted percentage wax esters in crude
extracts (originally in colour) 130
Figure 2.54: Residual error plot for experimental and predicted percentage wax esters in
crude extracts (originally in colour) 131
Figure 2.55: Percentage of sterols in solvent crude extracts (originally in colour) 132
Figure 2.56: Percentage of individual sterols and its derivatives in solvent crude extracts
(originally in colour) 132
Figure 2.57: Percentage of β-diketones in solvent crude extracts (originally in colour)
132
Figure 2.58: Percentage of individual β-diketones in solvent crude extracts (originally in
colour) 133
Figure 2.59: The lipophilic fraction of the wheat straw wax in various crude solvent extracts
(originally in colour) 134
Figure 2.60: FAME analysis of wheat straw wax (originally in colour) 135
Figure 2.61a: EI spectrum of methyl octadecanoate (magnified two times from m/z 260 – 300)
(originally in colour) 136
Figure 2.61b: EI spectrum of methyl octdecanoate from the NIST library 136
Equation 2.16: Calculation for percentage solvent efficiency 137
Table 2.18: Quantification of wheat straw wax components in various solvent extracts
139
Table 2.19: Normalised percentage solvent efficiency for different wax grou 140
3. SUPERCRITICAL CARBON DIOXIDE EXTRACTION OF WHEAT STRAW
WAX
Figure 3.1: Phase Diagram for supercritical fluid 148
Table 3.1: Physical properties of gaseous, supercritical and liquid CO2 149
Table 3.2: Physical properties of CO2 compared with organic solvents 149
Figure 3.2: Density of CO2 with change in temperature and pressure 150
Figure 3.3: Comparison of percentage crude yields on organic solvents and carbon dioxide
152
Table 3.3: CO2 extraction conditions outlined in figure 3.3 153
Table 3.4: Comparison of supercritical CO2 and hexane lipids extraction yields 154
Figure 3.4: Experimental design for extraction conditions optimisation 155
Table 3.5: Experimental design with the coded coordinate values 156
Table 3.6: Experimental design for optimisation 156
Equation 3.1: First order polynomial function 156
Figure 3.5: Percentage crude yields for scCO2 extraction at different pressure and
temperature (originally in colour) 157
Equations 3.2, 3.3, 3.4 and 3.5: Calculation for coefficients of the first order polynomial
function 158

13
Equation 3.6: First order function modelling the scCO2 extraction of wheat straw waxes
158
Table 3.7: Percentage of different wax groups extracted from wheat straw 160
Table 3.8: Coefficients for different wax groups 160
Table 3.9: Prediction of percentage yield for different wax groups 161
Equation 3.7 and 3.8: First order function modelling the wax esters and β-diketones
extraction in wheat straw waxes 161
Figure 3.6: Coefficients in first order modelling for wax ester and β-diketone 163
Equation 3.9: Chrastil equation 165
Table 3.10: Extraction conditions and percentage crude yield for Chrastil modelling 166
Figure 3.7: Percentage crude yield of wheat straw waxes from scCO2 extraction 166
Equation 3.10: Chrastil equation modelling the scCO2 extraction of wheat straw waxes 167
Figure 3.8: Experimental ln(c) against predicted ln(c) for percentage crude yield 168
Table 3.11: Chrastil modelling for different wax groups 169
Equation 3.11: Chrastil equation modelling the scCO2 extraction of wax esters in the wheat
straw waxes 170
Figure 3.9: Experimental ln(c) against predicted ln(c) for percentage wax esters 170
Figure 3.10: Percentage of total free fatty acids in CO2 crude extracts 172
Figure 3.11: Percentage of individual free fatty acids in CO2 extracts 174
Table 3.12: Published solubility data for fatty acids in CO2 175
Figure 3.12: Percentage of total n-alkanes in CO2 crude extracts 176
Figure 3.13: Percentage of individual n-alkanes in CO2 extracts 176
Table 3.13: Published solubility data for n-alkanes in CO2 177
Figure 3.14: Percentage of total octacosanol (C28) in CO2 crude extracts 178
Figure 3.15: Percentage of total octacosanal (C28) in CO2 crude extracts 178
Figure 3.16: Percentage of wax esters in CO2 crude extracts 179
Figure 3.17: Percentage of individual wax esters in CO2 extracts 180
Figure 3.18: Percentage of sterols and its derivatives in CO2 crude extracts 181
Figure 3.19: Percentage of individual sterols and its derivatives in CO2 extracts 181
Figure 3.20: Percentage of β-diketones in CO2 crude extracts 182
Figure 3.21: Percentage of individual β-diketones in CO2 extracts 183
Figure 3.22: The lipophilic fraction of the wheat straw wax in various crude CO2 extracts
186
Table 3.14: Quantification of wheat straw wax components in various solvent extracts 187
4. STRAW WAX SCREEN AND PRODUCTION SCALE SUPERCRITICAL
CARBON DIOXIDE EXTRACTION OF CEREAL STRAW WAXES
Figure 4.1: Straw samples (wheat, oilseed rape, miscanthus, bagasse and sunflower) used for
wax screening (originally in colour) 197
Figure 4.2: Hexane and ethanol extracts of the seven different straws (originally in colour)
198
Table 4.1: Description of straw 199
Figure 4.3: Percentage crude yield of hexane and ethanol extracts of different straws
(originally in colour) 200
Figure 4.4: GC chromatogram of hexane extract for wheat straw (Oakley 08) (WS4)
(originally in colour) 201
Figure 4.5: GC chromatogram of hexane extract for barley straw (Carat 08) (BS1) (originally
in colour) 202
Figure 4.6: GC chromatogram of hexane extract for oat straw (OS) (originally in colour)
203
14
Figure 4.7: GC chromatogram of hexane extract for oilseed rape straw (RS1) (originally in
colour) 204
Figure 4.8: GC chromatogram of hexane extract for sunflower straw (SS) (originally in
colour) 205
Figure 4.9: GC chromatogram of hexane extract for miscanthus straw (MS) (originally in
colour) 206
Figure 4.10: GC chromatogram of hexane extract for bagasse (Bag) (originally in colour)
207
Table 4.2: List of wax compounds identified in straw waxes 208
Figure 4.11: Structures of sterols presented in sunflower oil 210
Figure 4.12: EI spectrum of nonacosan-15-one (magnified eight times from m/z 400 – 425)
(originally in colour) 212
Figure 4.13: FI mass spectrum of nonacosan-15-one 212
Figure 4.14: Characteristic fragment ions m/z = 225 for nonacosan-15-one (originally in
colour) 212
Figure 4.16: Characteristic fragment ions m/z = 240 and m/z = 241 for nonacosan-15-one
207
Table 4.3: Identification of noncosan-15-one presented in oilseed rape straw including the EI
fragmentation pattern with percentage base peak intensity and KI value 207
Table 4.4: Quantification of hexane Soxhlet straw waxes (% in extracts) 211
Table 4.5: Quantification of hexane Soxhlet straw waxes (µgg-1
of biomass) 213
Table 4.6: Quantification of ethanol Soxhlet straw waxes (% in extract) 215
Table 4.7: Quantification of ethanol Soxhlet straw waxes (µgg-1
of biomass) 217
Table 4.8: Quantification of laboratory scale heptane Soxhlet extraction wheat, barley and
oat straw wax components 222
Table 4.9: Summary of production scale scCO2 extraction conditions 224
Table 4.10: Summary of carrier oil-containing wheat straw waxes 224
Figure 4.17: Laboratory heptane/ hexane Soxhlet and production scale supercritical CO2
percentage crude yields 226
Figure 4.18: Comparison of supercritical CO2 and heptane re-extracted yields against
heptane Soxhlet yields 226
Table 4.11: Quantification of industrial scale scCO2 extraction of cereal straw waxes 229
Table 4.12: Quantification of laboratory scale re-heptane Soxhlet extraction of cereal straw
waxes 230
Table 4.14: Comparison of the chemical compositions from heptane Soxhlet, supercritical
CO2 and heptane re-extracted wax extracts 212
5. STRAW WAX PROCESSING, PHYSICAL PROPERTIES AND
ECONOMIC CONSIDERATIONS
Table 5.1: Percentage moisture level of biomass before and after extraction 246
Figure 5.1: Co-extraction of water in industrial scale supercritical CO2 extraction (originally
in colour) 246
Figure 5.2: Co-extracted water separated from molten wheat straw wax (originally in colour)
247
Figure 5.3: Coloured co-extracted water from cereal straw waxes (originally in colour)
248
Figure 5.4: Percentage of co-extracted water within the cereal straw waxes (originally in
colour) 248
Figure 5.5: Wheat and oat wax fractions separated from scCO2 fractionation 249
Figure 5.6: Percentage of wax present in each separator after scCO2 fractionation 251

15
Table 5.2: Identification and quantification of wheat and oat straw fractions from scCO2
fractionation 252
Figure 5.7: A plot of retention time against Ln (molecular weight) 253
Figure 5.8: GPC trace showing DAD signal of wool grease (originally in colour) 254
Figure 5.9: GPC separation of wool grease and wheat straw wax by size (originally in
colour) 255
Figure 5.10: Mass balance for preparative GPC fractions (originally in colour) 255
Figure 5.11: IR spectra (full) of selected wheat straw wax fractions (originally in colour)
257
Figure 5.12: IR spectra (1800 – 1550 cm-1
) of selected wheat straw wax fractions (originally
in colour) 259
Figure 5.13: MALDI-TOF mass spectrum for wool grease fraction 5 (originally in colour)
262
Figure 5.14: MALDI-TOF mass spectrum for wheat straw wax fraction 5 (originally in
colour) 262
Figure 5.15: MALDI-TOF mass spectrum for oat straw wax fraction 5 (originally in colour)
263
Figure 5.16: Saponification reaction scheme for triglycerides and wax esters 264
Figure 5.17: Wheat alcohol and acid fractions of wheat straw wax (originally in colour)
264
Figure 5.18: GC chromatograms of saponified wheat alcohol and acid fractions (originally in
colour) 266
Figure 5.19: EI mass spectrum of 2-heptadecanone (originally in colour) 267
Figure 5.20: Formation of EI fragment ion of m/z = 58 267
Table 5.4: Identification of ketones presented in wheat alcohol fraction 267
Figure 5.21: Proposed structures for odd-numbered C41 wax ester in wheat straw wax
269
Table 5.5: Wax compounds presented in crude wheat straw wax, wheat alcohol and acid
fraction 269
Figure 5.22: An example of the Retro-Claisen reaction on β-diketone 270
Figure 5.23: STA thermogram of wheat straw wax (originally in colour) 271
Figure 5.24: DSC thermograms of four commercial waxes (originally in colour) 273
Table 5.6: The melting points of wheat straw wax compounds 274
Figure 5.25: DSC thermograms of scCO2 extracts compared with organic solvent extracts
(originally in colour) 275
Figure 5.26: DSC thermograms of scCO2 extracts under different temperature and pressure
(originally in colour) 276
Table 5.7: Percentage of wax groups in crude extracts from CO2 and organic solvent
extractions 277
Table 5.8: Percentage of wax group in the three cereal straw waxes 277
Figure 5.27: DSC thermograms of wheat, barley and oat straw waxes from scale up trials
(originally in colour) 280
Figure 5.28: DSC thermograms of wheat alcohols and acids fractions compared to wheat
straw wax (originally in colour) 281
Table 5.9: Acid value and saponification value for commercial and cereal straw waxes
283
Table 5.10: Drop point for commercial and cereal straw waxes 284
Figure 5.29: Production scale cereal straw waxes 285
Table 5.11: Gardner colour for commercial and cereal straw waxes 285
Figure 5.30: Barley straw wax and super-refined barley straw wax 286

16
Table 5.12: Potential applications for different wax groups identified in cereal straw waxes
288
Figure 5.31: The breakdown of operation costs for CO2 extraction 290
Table 5.13: Costs of raw materials and palletisation 290
Equation 5.1: Cost of pelletised materials 291
Equation 5.2: Calculation of net cost of pelletised straw 291
Table 5.14: Estimated net costs for pelletised raw materials 292
Table 5.15: Costs for CO2 extraction 292
6. EXPERIMENTAL PROCEDURES
Equation 6.1: Calculation of moisture level 300
Figure 6.1: Alternative pre-treatment processes: milled, chopped, pellets and briquettes
(originally in colour) 301
Table 6.1: Extraction information for ethanol and hexane 302
Figure 6.2: Thar SFE 500 system used for carbon dioxide extractions (originally in colour)
303
Equation 6.2: Calculation for quantity of sodium hydroxide 305
Equation 6.3: Calculation of extra sodium hydroxide for low base value 305
Equation 6.4: Calculation of acid value 311
Equation 6.5: Calculation of saponification number 311
Equation 6.6: Calculation for water absorption 313
Equation 6.7: Calculation for base value 314

17
List of abbreviations
The following abbreviations are included in the thesis in addition to the Mendeleev periodic
table symbols:
ACP - Acyl Carrier Protein
AMP - Adenosine Mono-Phosphate
ASTM - American Society for Testing and Materials
ASE - Accelerated Solvent Extraction
ATR - Attenuated Total Reflectance
bp - Boiling point
CI - Chemical Ionisation
DAD - Diode Array Detector
Dardni - Department of Agriculture and Rural Development (Northern
Ireland)
DCM - Dichloromethane
Defra - Department of Environment, Food and Rural Affairs
DHB - Dihydroxybenzoic acid
DMAPP - Dimethylalkyl diphosphate
DMC - Dimethyl Carbonate
DMSO - Dimethyl Sulphoxide
DSC - Differential Scanning Calorimetry
ECN - Effective Carbon Number
EHS - Environment, Health and Safety
EI - Electron Impact
ER - Endoplasmic Reticulum
18
FAE - Fatty Acid Elongases
FAME - Fatty Acid Methyl Ester
FAO - Food and Agriculture Organization of the United Nations
FAS - Fatty Acid Synthase
FI - Field Ionisation
FID - Flame ionisation detector
FPP - Farnesyl pyrophosphate
FT-IR - Fourier Transform Infra-Red
GC - Gas Chromatography
GC-MS - Gas Chromatography coupled with Mass Spectroscopy
gL - Gigalitres
GPC - Gel Permeation Chromatography
HβD - Hydroxy β-diketone
HDL - High Density Lipoprotein
HTGC - High Temperature Gas Chromatography
IEA - International Energy Agency
IMS - Industrial Methylated Spirits
IPP - Isopentenyl pyrophosphate
IR - Infra Red
IUCN - International Union for Conservation of Nature and Natural
Resources
KAS - β-Ketoacyl Synthase
KI - Kovats Index
LCA - Life Cycle Assessment
lCO2 - Liquid Carbon Dioxide
LDL - Low Density Lipoprotein
LOQ - Limit of quantification

19
LSER - Linear Solvation Energy Relationship
MALDI - Matrix-Assisted Laser Desorption/Ionisation
MeTHF - 2-Methyl Tetrahydrofuran
M∙+
- Molecular Ion
mp - Melting Point
MS - Mass Spectroscopy
MTBE - Methyl tert-butyl ether
MW - Molecular weight
m/z - Mass-to-charge ratio
ppm - Parts Per Million
PTFE - PolytetraFluoroethylene
Rf - Response factor
RT - Room Temperature
R2 - Correlation Coefficient
scCO2 - Supercritical carbon dioxide
SFE - Supercritical fluid extraction
STA - Simultaneous Thermal Analysis
ster - Sterol and Sterol Derivatives
TFA - Trifluoroacetic Acid
TGA - Thermal Gravimetric Analysis
THF - Tetrahydrofuran
TMS - Trimethylsilyl
TOF - Time-Of-Flight
Tr - Trace level
Unesco - United Nations Educational Scientific and Cultural Organization
UNEP - United Nations Environment Programme
UK - United Kingdom

20
US - United States
Vm - Molar Volume
VOC - Volatile Organic Carbon
v/v - Volume/volume
v/v/v - Volume/volume/volume
WCED - World Commission on Environment and Development
WWF - World Wildlife Fund
w/v - Weight/volume

21
Acknowledgements
Firstly, I would like to make a special thank you to Professor Ray Marriott for the continuous
help and guidance through my PhD. He was a true inspiration to me and I feel very lucky to
have him as my supervisor for 2 years. I would to thank my supervisor Professor James
Clark for giving me the opportunity to do such a great PhD in his group. His advices and
support had been invaluable to me. I am very grateful for all the chances I was provided with
to attend and present in conferences. I would also like to thank my other supervisor Dr. Andy
Hunt for his help towards the end of my PhD and being understanding and patient with me.
For financial assistance, I would like to thank Croda Enterprises Limited and BBSRC. Thank
you to everyone especially Graham Atkinson, Julie Humphrey and Richard Cawthorne in
Croda Rawcliffe Bridge for the assistance whilst working there. Thank you to Dass Chalal,
Kim Carmichael, Helen Sarginson, Will Cannon and Damian Kelly from Croda for being
part of my project.
I want to thank Trevor Dransfield, Karl Heaton and Adam Dowle for all the mass
spectroscopy help. I would also like to thank David Cubitt from Sundown Products Limited
for giving opportunity to work on the scale up trials. I would also like thank Grant Coupland
and his team in Colep UK Limited for the wax formulations experience.
For proof-reading this thesis, I would like to thank Professor Ray Marriott, Dr. Duncan
Macquarrie, Dr. Andy Hunt, Professor James Clark and Paul Brown. I would like to thank
Dr. Simon Breeden, Paul Elliott and Owain Samuels for general laboratory help. Another
thank you must to go to Dr. Peter Shuttleworth and James Sherwood for the data analysis
help and Dr. Colin Ellis for all the computer help he has given me.
Huge thanks must go to the past and present members of the group for the ideas, support,
laboratory help and general office banter in particular Leona and Alice. I would also like to
send special thanks all my amazing friends (you know who you are!) pushing me to write
during the stressful period. A special thanks to my housemate James for reminding me that I
have to write and listen to me complaining every day.
Last but most certainly not least, massive thanks go to my family especially my parents,
grandma and brother for their unconditional support and believing in me.

22

23
Declaration
Some of the results presented in this thesis were obtained by, in collaboration with other
workers, who are fully acknowledged in the text. All other results are the work of the author.
Miss Emily H. K. Sin
2012

24

Chapter 1 Introduction

27
1. INTRODUCTION
1.1 Scope of the project
The scope of this study is the extraction of waxes from biomass in a sustainable manner to
meet tighter legislation and higher demand for natural waxes to replace some of the existing
petroleum and synthetic waxes that are currently in the market. Through literature review,
agricultural waste was found to be an abundant and low cost renewable resource that
contains valuable waxes which can be a new potential high value source of natural wax for
many industrial products. Six distinct areas of research were identified:
Extraction of wheat straw waxes using organic solvents – Wheat straw waxes were
extracted using a traditional extraction method (Soxhlet apparatus). Linear solvation energy
relationship (LSER) was applied to correlate yields of extracts from wheat straw with
solvent parameters. The effect and significance of solvent parameters and their selectivity
were determined and discussed.
Raw materials screening – Seven different crops were extracted using ethanol and hexane
with an automated FexIKA® extractor to compare the yield and chemical composition. New
compounds not found in wheat straw waxes were highlighted. The potential for the raw
materials extracted as renewable resources for waxes is discussed.
Characterisation and quantification of straw waxes - Qualitative characterisation and
quantification of the key wax components of the straw extracts was carried out using GC-
FID and GC-MS. The wax classes of commercial interest were prioritised in order to
identify potential applications for this new novel wax product.
Alternative green extraction of wheat straw waxes using scCO2 – For a sustainable
extraction of waxes from biomass, an environmentally-benign technology, supercritical CO2
extraction was employed. The Chrastil model was applied to the extraction of wheat straw
waxes to determine the relationship between solvent density and solvating power on
extraction yields to obtain an optimised extraction temperature and pressure.

28
Production scale scCO2 extraction of cereal straw waxes – Following successful
laboratory scCO2 trials, production scale on a total of three tonnes of wheat, barley and oat
straw were successfully extracted using scCO2 and the effect of scale up is discussed.
Wax processing and physical properties – Wax from the production scale extraction was
processed using similar methods to current commercial wax lanolin e.g.: saponification.
Fractionation using GPC and scCO2 were explored as potential new methods to separate the
complex mixtures. Physical properties such as melting point were determined and compared
with existing commercial waxes. The potential for straw wax to compete in the current wax
market is considered.
1.2 Sustainable development
From the growing environmental concerns in the 1960s and 1970s, debates across the world
on sustainability arose.2 The term “sustainable development” was first used by the World
Conservation Strategy in 1980.3 However, this term was firstly expressed and defined in the
Brundtland Report in 1987. The definition of sustainable development is “development that
meets the needs of the present without compromising the ability of future generations to
meet their needs”.4 The concept of sustainable development is an attempt to combine
growing concerns about a range of environmental issues with socio-economic issues.2
Current industrial economies are heavily dependent on crude oil for both energy and
chemical products. With the depletion of crude oil at an increasing rate and a higher world
demand, sustainable development by government, industries and the public is necessary.5
Tighter legislation means industries are forced to switch to alternative processes and
minimise waste in order to battle climate change.6 To supply the changing world demands
without further damage to the environment, the current oil-based economy must be switched
to a bio-based economy.7 Bio-based industrial products can be developed to replace existing
petroleum-based products.7 Waxes extracted from renewable resources using an
environmental benign technology to replace petroleum waxes are recognised to be
sustainable. Due to the decrease in petroleum waxes, the production of synthetic waxes must
be increased in order to maintain a stable wax market. To achieve a sustainable
development, it is important to assess and identify the natural resources that are in sufficient
quantity and readily available.8

29
1.2.1 Bio-refinery Concept
The bio-refinery concept is the development of bio-based industrial products from
waste biomass. Comparable to the well-established oil-refinery, the bio-refinery will
be an integrated system for securing renewable materials to convert into bio-
chemicals, bio-energy and bio-materials in order to maximise the valuable products
and minimise the waste as shown in Figure 1.1.8 The challenge is to minimise the
strong dependence on fossil fuels and migrate to renewable natural resources globally.
There is a prediction of an average of 84% global increase in fossil fuels usage
between 2005 and 2030.9 The world’s primary source for chemicals and energy is oil,
with a demand of approximately 84 million barrels per day in 2007.9 With efforts
across the globe, the level of oil consumption was similar in 2009 but despite the rate
of increase of oil usage slowing; it is still predicted to increase to 99 million barrels
per day by 2035.10
Targets have been made to cut oil usage by 4.7 million barrels per
day by 2020 globally and in 2009 help, government support of $20 billion per year
was made and this is set to rise up to $45 billion per year by 2020.10
Governments
across different countries are attempting to push forward the idea of bio-refinery and
setting goals for bio-based products industries.11
An agreement by G8 leaders to cut
global emissions by 50% by 2050 was taken at their summit in July 2009.10
With
government support, targets set and the rising oil price, bio-based products such as
biofuels are set to be in competition with petroleum-derived products. Biofuel
production of 1 million barrels per day in 2010 is projected to grow to 4.4 million
barrels per day in 2035.10
The bio-feedstocks must be extensively and optimally exploited using sustainable
processes to be in competition with petroleum-derived products. There are four types
of bio-feedstocks from distinct sectors: agriculture, forestry, industries or household
and aquaculture.12
The raw materials are very different to crude oil which is a mixture
of hydrocarbons and small amounts of impurities. These can be removed and
fractional distillation can be carried out to manufacture a full range of products from
gasoline to lubricating oils.12
In contrast, biomass is not homogeneous and mainly
consists of C, H and O. 12
With the vast range of biomass waste, that differs
seasonally, there is need for a large range of refining and processing is needed by
comparison. Based on the oil refinery concept, a list of target bio-platform molecules

30
must be identified for the development of a series of chemicals.12
The idea of bio-
platform molecules is to replace the existing petroleum-derived ethylene, propylene,
C4-olefines and aromatics.12
A list of twelve bio-platform molecules was identified by
the US Department of Energy in 2004 which can be used for further reactions to
create new and existing key molecules.13
Figure 1.1: Comparison of oil-refinery vs. bio-refinery (originally in colour)
The main drawbacks for using biomass as bio-feedstock are the wide distribution
geographically with very low bulk density and relatively high water contents making
transportation costly and complicated.14
The bulk density is intensively increased by
pre-treatments of biomass such as pelletisation prior to distribution and this is
necessary for both economic and conversion processing reasons.15
Alternatively,
localised bio-refineries beside farmlands can be established to stimulate local
industries, create new markets and generate job opportunities.16, 17
Other challenges
include the developing conversion processes and acceptance of new products.8
Using wheat straw as bio-feedstock for whole crop bio-refinery has been
demonstrated by Deswarte et al.15
The study showed the agricultural waste being fully
exploited by extracting the high value wax products using scCO2 in the initial stage of
bio-refinery prior to converting the lignocellulosic fraction into paper, strawboard,
mulch or energy as illustrated in fig 1.2.15, 18, 19, 20
The University of York and a
number of collaborators (Velcourt Group Plc and Botanix Limited) have demonstrated
the success of a pilot scale scCO2 extraction of wheat straw in 2005.16
Calorimetric
studies showed that dewaxing the straw does not affect its calorific value as the scCO2
processing step also removes most of the water that is present in the straw.15, 19
The
negative effect of wax removal is compensated by the positive effect of water removal
Oil-refinery
Bio-refinery
Fossil fuels
- crude oil,
natural gas etc.
Petroleum-derived
products
- energy, chemicals,
materials etc.
Biomass
- Straw, wood,
grass etc.
Bio-based products
- energy, chemicals,
materials, feed, food
etc.

31
in the process giving the same calorific value.15, 19
This new valuable wax product has
shown high potential to replace some commercial waxes. Bio-materials such as
strawboards have also shown added strength when waxes were removed.15
Figure 1.2: Straw bio-refinery (originally in colour)
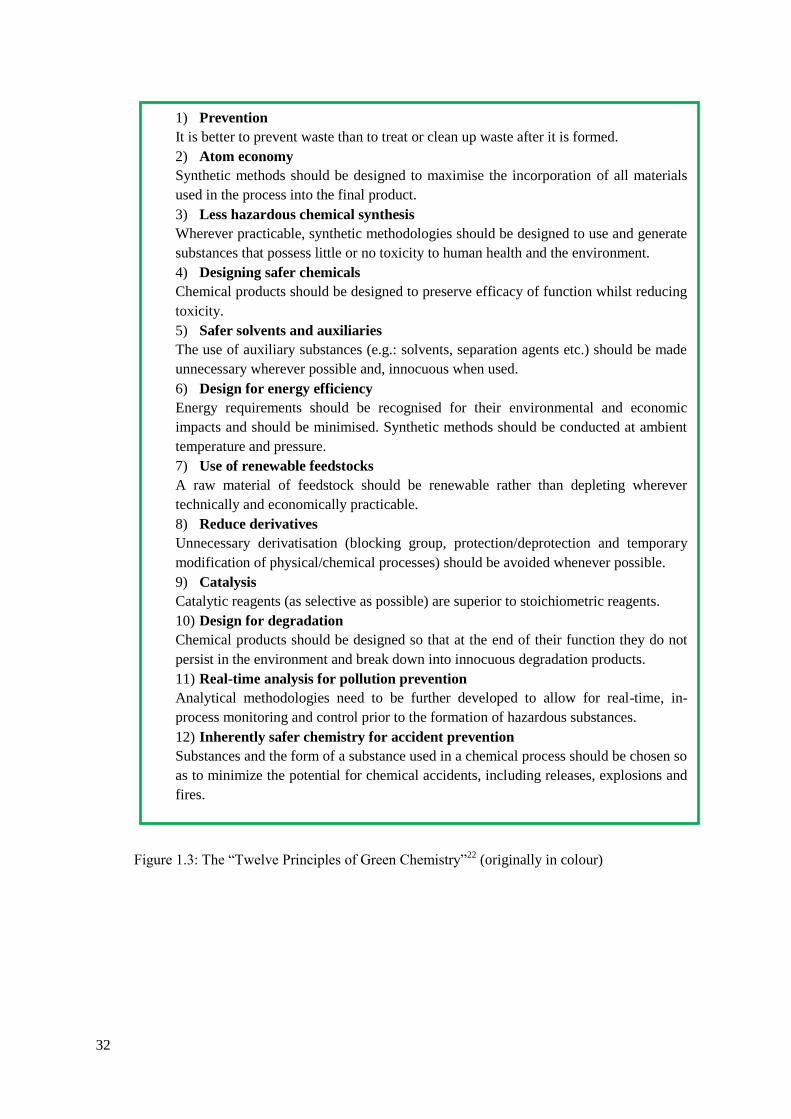
1.2.2 The twelve principles of Green Chemistry
Green Chemistry is a term which describes environmentally benign chemical
synthesis and processes.21
This is a field of chemistry based on the utilisation of a set
of principles that reduces or eliminates hazardous waste by design, manufacture and
application of chemical products.22
The “Twelve Principles of Green Chemistry”
(Figure 1.3) was established by Paul Anastas and John Warner in 1998 to help
chemists to achieve sustainable chemical designs.22, 23
Cereals
Grain
Straw
Straw residues
Food and feed
Energy,
chemicals and
materials
Wax products
32
Figure 1.3: The “Twelve Principles of Green Chemistry”22
(originally in colour)
1) Prevention
It is better to prevent waste than to treat or clean up waste after it is formed.
2) Atom economy
Synthetic methods should be designed to maximise the incorporation of all materials
used in the process into the final product.
3) Less hazardous chemical synthesis
Wherever practicable, synthetic methodologies should be designed to use and generate
substances that possess little or no toxicity to human health and the environment.
4) Designing safer chemicals
Chemical products should be designed to preserve efficacy of function whilst reducing
toxicity.
5) Safer solvents and auxiliaries
The use of auxiliary substances (e.g.: solvents, separation agents etc.) should be made
unnecessary wherever possible and, innocuous when used.
6) Design for energy efficiency
Energy requirements should be recognised for their environmental and economic
impacts and should be minimised. Synthetic methods should be conducted at ambient
temperature and pressure.
7) Use of renewable feedstocks
A raw material of feedstock should be renewable rather than depleting wherever
technically and economically practicable.
8) Reduce derivatives
Unnecessary derivatisation (blocking group, protection/deprotection and temporary
modification of physical/chemical processes) should be avoided whenever possible.
9) Catalysis
Catalytic reagents (as selective as possible) are superior to stoichiometric reagents.
10) Design for degradation
Chemical products should be designed so that at the end of their function they do not
persist in the environment and break down into innocuous degradation products.
11) Real-time analysis for pollution prevention
Analytical methodologies need to be further developed to allow for real-time, in-
process monitoring and control prior to the formation of hazardous substances.
12) Inherently safer chemistry for accident prevention
Substances and the form of a substance used in a chemical process should be chosen so
as to minimize the potential for chemical accidents, including releases, explosions and
fires.

33
1.2.3 Biorefinery and Green Chemistry as sustainable future
The University of York have previously demonstrated that the incorporation of green
chemistry into the bio-refinery concept could help towards a sustainable future for the
21st century.
24 The group showed a number of green technologies such as scCO2
extraction being implemented into conversion processes, use of agricultural waste
such as wheat straw and incorporation of renewable starch as chromatography
stationary phase into biorefineries.24
For a sustainable future, it is therefore the aim of
this thesis to incorporate an intermediate step in existing uses of agricultural waste
with a green technology, scCO2 extraction, in the extraction of valuable waxes. This
concept will prevent waste by utilisation of renewable agricultural wastes and CO2,
use safer and greener solvents to minimise pollution and reduce and replace existing
petroleum-derived wax products.
1.3 Agricultural waste
1.3.1 Availability
For every tonne of cereal produced worldwide, approximately 1.5 tonnes of straw is
produced as an agricultural by-product. This give a world production of 1000 million
tonnes of cereals per annum and about 1500 million tonnes of cereal straw is obtained.
China is the main contributor of this enormous amount of straw as this single country
can produce more than 700 million tonnes of cereal straw per year.25
Reported by the NNFCC, there were 11.8 million tonnes of cereal straws in the UK in
2007 and of which 8.3 million tonnes are from cereals and 2.5 million tonnes are from
oilseeds. Wheat, the most abundant cereal crop in the UK, covers 2 million hectares
which can produce about 3.5 tonnes per hectare of straw giving approximately 7.5
million tonnes of wheat straw alone.26
Other cereal crops such as rye and triticale are
also grown. Figure 1.4 shows the individual breakdown of each crop grown in UK in
2007.

34
Figure 1.4: Total breakdown of cereal and oilseed crops in UK in 200726
(originally in
colour)
These four crops are grown in all parts of the UK as shown in Figure 1.5.
Approximately 1.6 million tonnes of wheat straw is produced in eastern England
which makes it the greatest amount of wheat straw yielded in a single region. Barley
is also predominately grown in eastern England giving 3.6 million tonnes of barley
straw making this region the highest straw producing region. Oat tends to be grown in
south England and can produce about 1700 tonnes in total. Oilseed rape is the major
oilseed crops grown and is located mainly in the midlands which can produce about
1.1 million tonnes of straw just in this region.26
53.2%
8.8%
11.5%
4.3%
0.92%
0.09%
21.3% Wheat
Winter Barley
Spring barley
Oat
Other cereals
Linseed
Oilseed Rape

35
Figure 1.5: Breakdown of wheat, barley, oat and oilseed rape straw in the UK in 200726
(originally in colour)
Wheat
straw
Barley
straw
Oat
Oilseed rape
straw
Straw production in the UK
(tonnes) in 2007:

36
1.3.2 Straw and husk
The main agricultural waste in cereal crops are its straw and husk. Straw is the stalk of
the cereal plant that is left after the grains or seeds are removed and husk is the
protective outer layer of the grains or seeds and is left as a by-product after dehulling
as shown in Figure 1.6. The straw alone can make up more than 50% of the dry
weight of the crop.27
Figure 1.6: Cereal straw and its botanical components (originally in colour)
Straw consists of mainly three groups of organic compounds which are cellulose,
hemicellulose and lignin and together these three components add up to more than
80% of the dry weight.28
The minor constituents include waxes, protein, sugars, salts
and ash. As discussed in Section 1.3.1, there is an enormous quantity of straw
available worldwide; utilisation of this major agricultural by-product is paramount.
The price of straw fluctuates on a yearly basis due to demand, weather and harvesting
results. Straw prices were higher in 2010 compared to 2009 and the value of straw
production rose by 15% to £346 million in the UK.29
Traditionally, straw is used as an animal feedstock due to its high cellulose content.
About 40% of straw is cellulose which makes it a great energy source but the
digestibility is limited to about 30% due to the chemical structure of straw.30, 31
In
1800, straw was being used as source of non-wood fibre for paper for the first time.
With the shrinking forests and dramatic increase in demands for paper, there was a
rise in the use of non-wood fibres derived pulp from 6.7% to 10.6% from 1970 to
1993.27
With the growing demand for energy and a declining supply of petroleum,
straw is becoming important as an alternative and renewable energy source. Straw can
Straw
Seed head
Root
Cereal grain covered by husk
Leaf
Internodes
Nodes

37
be converted to a useful energy source via thermochemical conversion (combustion,
pyrolysis, gasification and liquefaction) or biochemical processing (digestion and
fermentation). A potential total of 442 gL of bio-ethanol can be produced with
agricultural waste (corn stover, wheat straw, barley straw, oat straw, rice straw,
sorghum straw and bagasse) worldwide, as reported in 2004.32
Other applications of
straw include bio-based materials such as particleboards, bio-degradable plastics and
adsorbents. Successful straw boards have been manufactured as a replacement in the
wood-based panel industries.33
Straw can be decomposed to soluble sugars and
chemicals such as lactic acid which is a critical chemical for producing bio-degradable
plastics.34
The market for bio-degradable plastics grew five-fold between 1996 and
2001.35
As well as using straw as animal feed, paper, energy, particle boards and
biodegradable plastics, it is also used as an absorbent to battle water pollution
problems. Traditionally, activated carbons are used for the absorption of dyes and
heavy metals in waste water but bio-derived activated carbons have been synthesised
from different straw and husk.36, 37
The excess straw is also being incorporated into the
soil and research shows that incorporation can change the soil properties both
positively e.g.: nutrient gain and negatively e.g.: in clay-based soil.38, 39
Other current
uses include animal bedding, garden mulch, bio-composites, oil spillage clean-up,
mushroom compost control of the algae and cyanobacteria growth in aquatic
reservoir.40, 41, 42, 43, 44, 45
Although there are many uses of straw, it has been mainly
used as a whole form and not as individual components that can be utilised separately.
Waxes can be extracted to create another bio-based product prior to its current uses
e.g.: energy, which can add value to this low cost, high volume biomass.19
1.3.3 The plant cuticle
The plant cuticle is a multi-layered structure as shown in Figure 1.7. The epidermal
cells are highly protected by the cell wall and a pectin cuticular layer. This pectin
layer provides the surface for a layer of semi-crystalline epicuticular wax, the main
function of which is to minimise water loss. Its reflective property also helps to
protect the plant from ultra-violet radiation.46, 47
. This protective waxy layer also helps
in plant defence against bacterial and fungal pathogens.46
Its hydrophobicity can help
with the reduction of water retention on the surfaces and therefore minimise a build-
up of air pollutants.46, 47
It was also shown that there are small amounts of embedded

38
wax particles in the cutin making it a support for both intracuticular and epicuticular
wax.48
The content of the wax in the straw is low and only comprised of 0.5 – 1.0% of
the dry weight but with the huge volume of this agricultural by-product worldwide, a
potential of 7.5 – 25 million tonnes of valuable waxes can be obtained each year. 49
Epicuticular wax on straw consists of three structurally distinctive fractions with
varied degrees of order and composition: crystalline, solid amorphous and liquid
amorphous.48
The crystalline fraction consists of regularly aligned long aliphatic
chains of the wax which are packed in an orderly fashion. As the chain length of the
different wax constituent compounds vary so some of the crystalline regions would
result in a less ordered fraction which is the solid amorphous region within the layers
as shown in Figure 1.8. 48
The cuticular wax is a dynamic structure therefore the
crystalline and solid amorphous can break and undergo rearrangement. The packed
array of aliphatic chains are surrounded by the solid amorphous region and with
elevated temperature, this would convert into liquid amorphous.50
The crystalline
regions are assembled as orthorhombic crystal lattice at a lower temperature and is
rearranged to an hexagonal structure with increased temperature but prior to melting
point.50, 51
Figure 1.7: The structure of the plant cuticle (originally in colour)
Epicuticular wax Lamellate region of the
cuticle (Cutin and
embedded wax)
Reticulate region of the
cuticle
Pectin layer
Cell wall
Plasma membrane
Tonoplast
Vacuole
Middle
lamella
Upper
epidermal
cell

39
Figure 1.8: Molecular structure of cuticular waxes
1.4 Plant waxes
1.4.1 Classes of plant epicuticular waxes
Plant epicuticular waxes are complex mixtures of both aliphatic and cyclic compounds
with various functional groups, chain lengths and abundance in different species.
Table 1.1 shows the common wax classes with emphasis on the major components.
Hydrocarbons in plant waxes can exist as n-alkanes, branched- chain alkanes and
alkenes. n-Alkanes are a universal wax class and account for more than 50% of the
wax.52
They predominately exist as odd-chain numbers and include chains of C27, C29,
C31 and C33.53
Even-chain n-alkanes are also present in some species but it is at much
lower proportions in comparison.53
Branched-chain alkanes found are usually even-
numbered but it has been reported that both odd and even-numbered are present.53
Alkenes in plant lipids tend to be mono-unsaturated with the double bond in position
1.54
Wax esters are another ubiquitous class of compounds which can exist up to 80%.
Mono-esters are the most common and are typically made up of saturated long even-
chain acids (C12 - C30) and alcohols (C20 – C32).55
Unsaturation of wax esters has been
reported and the double bond(s) are usually found in the acid moiety.56
The wax ester
fractions are found to be constituted by the esterification of the homologous acids and
alcohols of several isomers and/or a single homologue acid or alcohol.55
Free fatty
Crystalline Crystalline Solid amorphous
Solid
amorphous
Liquid
amorphous

40
acids in plants can be found unbranched, branched, saturated and unsaturated but
usually exist as even-chain saturated forms and have carbon numbers of about C16 to
C34.57
These are quite dominant in some plants and up to 40% of free fatty acids can
be found 58
Primary alcohols are commonly found and can be up to 60% of the total wax. These
molecules are usually straight chain and comprise of chain lengths of C20 to C34. In
cereal crops, a single primary alcohol tends to be predominant and in wheat,
hexacosanol (C26) or octacosanol (C28). 59, 60, 61
Secondary alcohols are also identified
in plants, however they are predominately odd-chain numbers and the hydroxyl group
is commonly found in the 10th or 15
th position in a C29 alkyl chain and 9
th or 16
th
position in a C31 chain.62, 63, 64, 65
Ketones are also found in a similar pattern as these
are formed from the oxidation of the corresponding alcohol.65
Aldehydes are
intermediates formed from oxidation of alcohols to fatty acids and are usually found
in small quantities. If aldehydes are observed, its compositional pattern tends to be
similar to the fatty alcohols.66
β-Diketones can be present as a major wax constituent of up to 70% in some plant
species. About 10-50% of β-diketones have been reported in cereals such as wheat,
barley, oats and rye.67
The 1,3-dicarbonyl group is usually situated on positions 12,14-
, 14,16- and 16,18- in C31 and C33 alkyl chains.68
Hydroxy-β-diketones are also mainly
found in cereals as the two groups are closely related and are mostly derived from the
most abundant hentriacontane-14,16-dione.67
The cyclic components consist mainly of sterols and triterpenoids. Plant sterols, also
called phytosterols, are tetracyclic groups of molecules found in plants and the most
common are stigmasterol, β-sitosterol and campesterol.69
Plants can contain up to 3
mg of sterols per gram dry weight.70
Sterols in plants tend to be membrane
constituents with main functions in regulation of its fluidity and water permeability.71
These sterols can react with free fatty acids present on the plant surfaces and form an
ester bond to make steryl esters.70
It has been reported that the structures of steryl
esters are formed from the three major free sterols identified.72
The fatty acid moieties
have been reported to be in the range of C12 to C22.72
. Hexadecanoic, octadecanoic and
octadecenoic acids are predominately found and poly-unsaturated fatty acids have also

41
previously been reported as a moiety of steryl esters.73
Esterification of free sterols
and free fatty acids to form steryl esters is a way to regulate the levels these wax
constituents in plants and assist the intracellular and extracellular movement of free
sterols.72, 74
Triterpenoids are pentacyclic compounds and often exist as triterpene
alcohols, ketones and acids and the most common are amyrins, ursanes, lupanes and
oleane.75, 76, 77, 78
The pattern and abundance of the different wax classes in various
species presented in the plant cuticle are dependent on the genetic expression via the
biosynthetic pathway and environmental influences.59, 79
Table 1.1: Common wax classes80
Compounds
Carbon number and
range of major
components
Major components
Aliphatic wax classes
n-Alkanes Odd C21 - C35 C27, C29, C31
Wax esters Even C34 - C62 C40, C50
Free fatty acids Even C16 - C32 C22, C24, C26, C28
Primary fatty alcohols Even C22 - C32 C26, C28, C30, C32
Aldehydes Even C22 - C32 C26, C28, C30, C32
Ketones Odd C23 - C33 C29, C31
Secondary fatty alcohols Odd C23 - C33 C29, C31
β-Diketones Odd C27 - C33 C31, C33
Hydroxy-β-diketones Odd C27 - C33 C31, C33
Cyclic components
Sterols
β-Sitosterol, stigmasterol, campesterol
Steryl ester
β-Sitosteryl esters
Triterpenols
α-Amyrin, β-amyrin, lupeol
Triterpenoid acids
Ursolic acid, oleanoic acid
Triterpenoid ketones
Taraxerone, lupen-3-one, oleanen-3-
one, ursen-3-one
42
1.5 Biosynthetic pathway of plant cuticular wax
1.5.1 Biosynthetic pathway
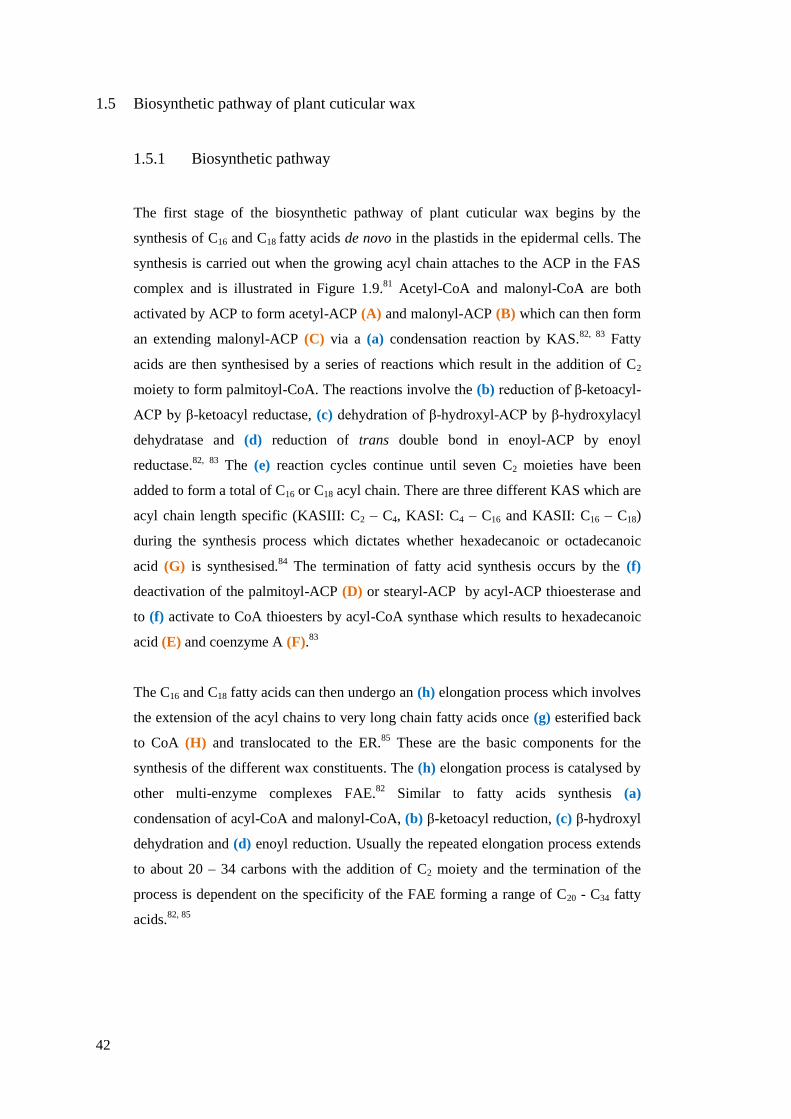
The first stage of the biosynthetic pathway of plant cuticular wax begins by the
synthesis of C16 and C18 fatty acids de novo in the plastids in the epidermal cells. The
synthesis is carried out when the growing acyl chain attaches to the ACP in the FAS
complex and is illustrated in Figure 1.9.81
Acetyl-CoA and malonyl-CoA are both
activated by ACP to form acetyl-ACP (A) and malonyl-ACP (B) which can then form
an extending malonyl-ACP (C) via a (a) condensation reaction by KAS.82, 83
Fatty
acids are then synthesised by a series of reactions which result in the addition of C2
moiety to form palmitoyl-CoA. The reactions involve the (b) reduction of β-ketoacyl-
ACP by β-ketoacyl reductase, (c) dehydration of β-hydroxyl-ACP by β-hydroxylacyl
dehydratase and (d) reduction of trans double bond in enoyl-ACP by enoyl
reductase.82, 83
The (e) reaction cycles continue until seven C2 moieties have been
added to form a total of C16 or C18 acyl chain. There are three different KAS which are
acyl chain length specific (KASIII: C2 – C4, KASI: C4 – C16 and KASII: C16 – C18)
during the synthesis process which dictates whether hexadecanoic or octadecanoic
acid (G) is synthesised.84
The termination of fatty acid synthesis occurs by the (f)
deactivation of the palmitoyl-ACP (D) or stearyl-ACP by acyl-ACP thioesterase and
to (f) activate to CoA thioesters by acyl-CoA synthase which results to hexadecanoic
acid (E) and coenzyme A (F).83
The C16 and C18 fatty acids can then undergo an (h) elongation process which involves
the extension of the acyl chains to very long chain fatty acids once (g) esterified back
to CoA (H) and translocated to the ER.85
These are the basic components for the
synthesis of the different wax constituents. The (h) elongation process is catalysed by
other multi-enzyme complexes FAE.82
Similar to fatty acids synthesis (a)
condensation of acyl-CoA and malonyl-CoA, (b) β-ketoacyl reduction, (c) β-hydroxyl
dehydration and (d) enoyl reduction. Usually the repeated elongation process extends
to about 20 – 34 carbons with the addition of C2 moiety and the termination of the
process is dependent on the specificity of the FAE forming a range of C20 - C34 fatty
acids.82, 85

43
The fatty acids of various chain lengths can convert back to CoA (H) or ACP and
undergo one of the two downstream biosynthetic pathways as shown in Figure 1.9.85
First is the acyl reduction pathway in which a (i) reduction reaction occurs to form
aldehyde intermediates (J) and can further (j) reduce to primary fatty alcohols (K).
The aldehydes usually have similar carbon number to primary alcohols.85
The primary
alcohols are then either exported directly to the plant cuticle or (k) esterify with the
pool of fatty acids (I) available to form wax esters (L).86
Second is the alkane pathway
which explains the existence of odd numbered carbon chains which were extensively
reported in plant cuticular waxes.87, 88, 89
A typical (i) reduction reaction occurs to give
the aldehyde intermediates (J) in the acyl reduction pathway followed by (l)
decarbonylation to form odd-numbered alkanes (M).85
In many species, this is the end
product of the pathway but in some cases, the alkanes can carry out further
downstream conversions as the corresponding secondary alcohols and ketones have
been observed.85
The alkanes can undergo a (m) hydroxylation to secondary alcohols
(N) which can then follow by an (n) oxidation into ketones (O).85

44
Figure 1.9: Fatty acids de novo synthetic pathway85
(originally in colour)
The biosynthesis of fatty acids, fatty alcohols, wax esters, aldehydes and alkanes are
widely accepted. Odd-numbered β-diketones and hydroxy β-diketones have also been
reported in various plant species.90, 91, 92
As the diketones observed are odd-numbered,
it was suggested that the synthesis of the β-diketones and hydroxy β-diketones must
derive from the alkane pathway of the wax biosynthesis similar to the synthesis of
secondary alcohols and ketones.92
Wettstein-Knowles et al. investigated the origins of
-CO2
(f)
(a)
CoA-SH
(A)
(E)
(F)
(b)
+ H2O
(B)
(C)
(D)
(c)
(d)
(e)
ACP
NADPH + H+ NADP+
- H2O
ACP-SH + CO2
NADPH + H+NADP+
ACPACP
ACP
ACP
ACP
ACP
ACP

45
β-diketone specifically hentriacontan-14,16-dione in barley spike wax by
radioactively labelling the acetate.93
The study concluded that the two carbonyl groups
were built into the carbon skeleton during the elongation rather than downstream
reactions after the termination like secondary alcohols and ketones as shown in Figure
1.10.94
This was supported by the lack of abundance correlation between alkanes and
β-diketones.94
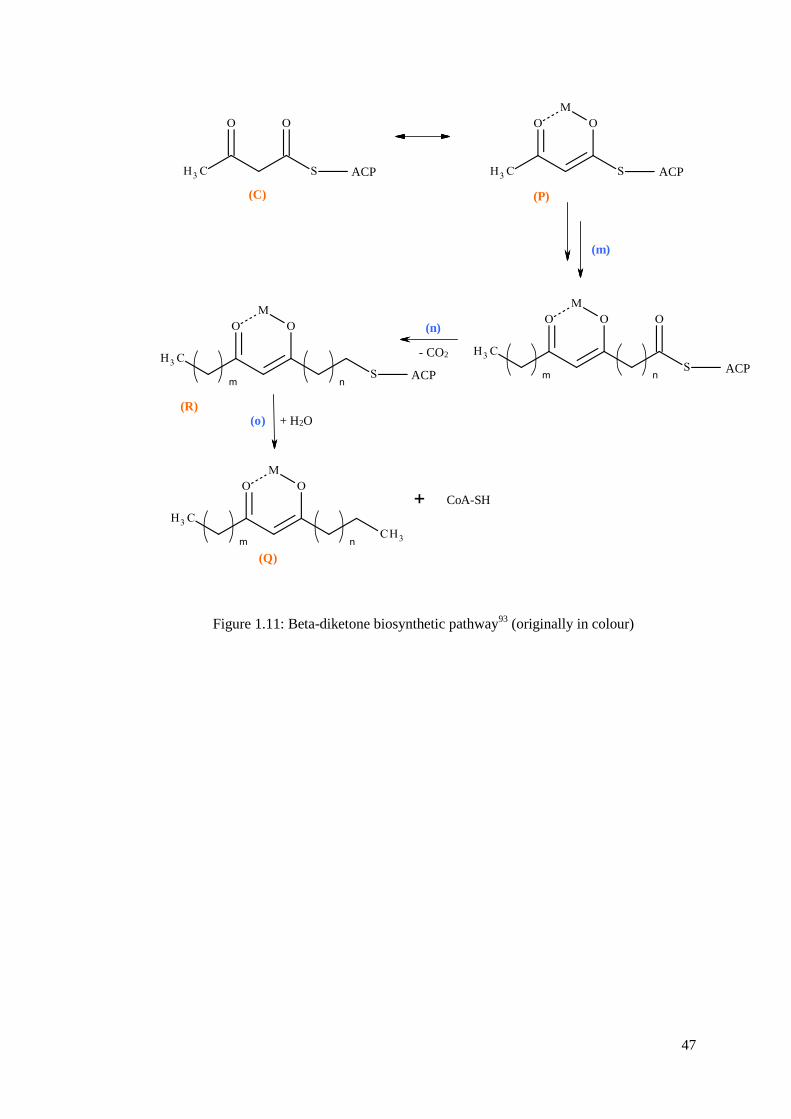
The β-keto group is introduced into the acyl chain when a C2 moiety is
added to the palmitoyl-CoA but in this case, the β-keto group is not reduced like the
fatty acid elongation pathway.93
The group is (P) protected by a metal ion e.g.: copper
and this could be a metal ion from an enzyme. Further elongation would occur by the
(m) addition of another C2 moiety and the protecting metal ion would remain until the
number of carbon units have been added to the chain.93
A (n) decarboxylation of the
β-keto acyl chain and a (o) deactivation process occurs which results in an (Q) odd-
numbered β-diketone.93
The (R) β-diketone precursors can then further react and
synthese hydroxyl β-diketones via a reduction reaction in one of the carbonyl
groups.94
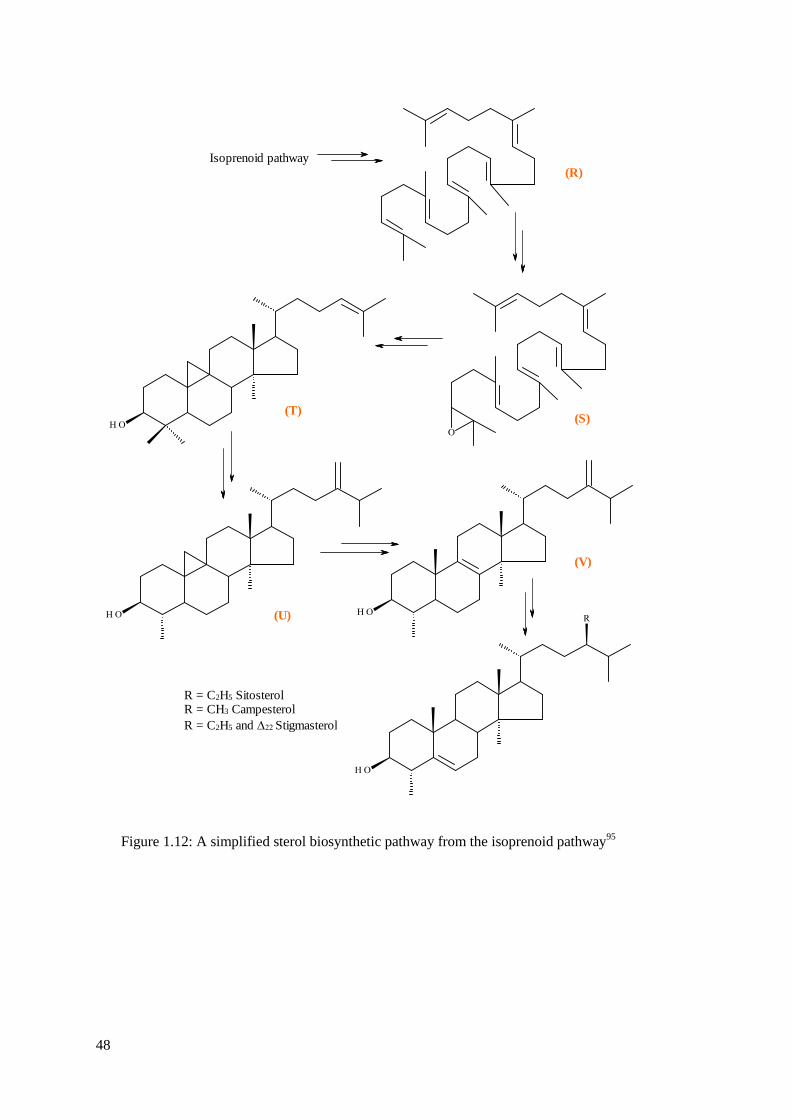
The biosynthetic pathway for cyclic compounds such as sterols is different as it
derives from the isoprenoid pathway where IPP and DMAPP are the main building
blocks. These two molecules react to form FPP by FPP synthetase which is an
important precursor for sterol synthesis that occurs in the plastid.95
More than 30
enzymes and steps are reported to be involved in the sterol synthetic pathway but this
is controlled by a key enzyme, squalene synthetase.96
Squalene (R) forms and then
converts to squalene oxide (S) where cyclisation occurs to create cycloartenol (T) then
cycloeucalenol (U) and followed by obtusifoliol (V).95
A series of different reactions
then occur for the synthesis of various sterols but studies showed that sitosterol is the
first sterol to be made in the sequence.95
Various chemical reactions further
downstream lead to a matrix of very complex sterols. Sterols are an important class of
molecules that regulate the fluidity of membranes.95
Sterols can also exist in bound
form as the reactive 3’ OH group can react and interact with other molecules such as
fatty acids to form steryl fatty acid esters and sugars to form sterol glycosides.95
These
are also components that are commonly found in plant waxes both as free and bound
forms.95
The biosynthetic pathways for the aliphatic and cyclic wax constituents give
a good explanation in the various wax classes that have been reported in the
literatures.

46
Figure 1.10: Wax biosynthesis including acyl reduction, fatty acids elongation and alkane
pathways85
(originally in colour)
+ H2O
- CoA-SH- CoA-SH
- CO2
- H2O
- H2O
Acyl reduction pathway
Alkane pathway
Fatty acids elongation pathway
(i)
(j)
(k)
(l)
(e)
(m)
(g)
(h)
(i)
(n)
(H)
- 1
(J)
(K)
(E)
(G)
(I)
(L)
(N)
(O)
(M)
(J)
- 1
- 1
47
- CO2
+ H2O
CoA-SH
(C)
(m)
ACP ACP
ACPACP
(P)
(n)
(R)
(Q)
(o)
Figure 1.11: Beta-diketone biosynthetic pathway93
(originally in colour)
48
Figure 1.12: A simplified sterol biosynthetic pathway from the isoprenoid pathway95
Isoprenoid pathway
R = C2H5 SitosterolR = CH3 Campesterol
R = C2H5 and Stigmasterol
(R)
(S)
(U)
(T)
(V)
49
1.5.2 Cereal waxes
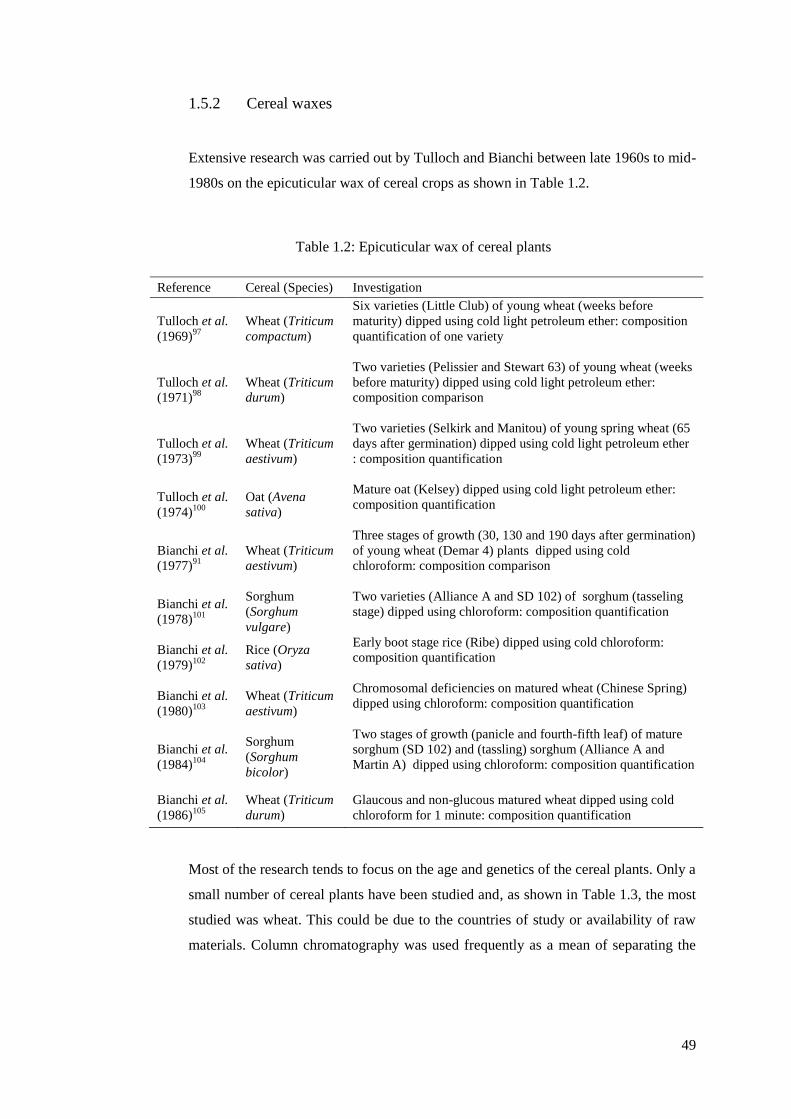
Extensive research was carried out by Tulloch and Bianchi between late 1960s to mid-
1980s on the epicuticular wax of cereal crops as shown in Table 1.2.
Table 1.2: Epicuticular wax of cereal plants
Reference Cereal (Species) Investigation
Tulloch et al.
(1969)97
Wheat (Triticum
compactum)
Six varieties (Little Club) of young wheat (weeks before
maturity) dipped using cold light petroleum ether: composition
quantification of one variety
Tulloch et al.
(1971)98
Wheat (Triticum
durum)
Two varieties (Pelissier and Stewart 63) of young wheat (weeks
before maturity) dipped using cold light petroleum ether:
composition comparison
Tulloch et al.
(1973)99
Wheat (Triticum
aestivum)
Two varieties (Selkirk and Manitou) of young spring wheat (65
days after germination) dipped using cold light petroleum ether
: composition quantification
Tulloch et al.
(1974)100
Oat (Avena
sativa)
Mature oat (Kelsey) dipped using cold light petroleum ether:
composition quantification
Bianchi et al.
(1977)91
Wheat (Triticum
aestivum)
Three stages of growth (30, 130 and 190 days after germination)
of young wheat (Demar 4) plants dipped using cold
chloroform: composition comparison
Bianchi et al.
(1978)101
Sorghum
(Sorghum
vulgare)
Two varieties (Alliance A and SD 102) of sorghum (tasseling
stage) dipped using chloroform: composition quantification
Bianchi et al.
(1979)102
Rice (Oryza
sativa)
Early boot stage rice (Ribe) dipped using cold chloroform:
composition quantification
Bianchi et al.
(1980)103
Wheat (Triticum
aestivum)
Chromosomal deficiencies on matured wheat (Chinese Spring)
dipped using chloroform: composition quantification
Bianchi et al.
(1984)104
Sorghum
(Sorghum
bicolor)
Two stages of growth (panicle and fourth-fifth leaf) of mature
sorghum (SD 102) and (tassling) sorghum (Alliance A and
Martin A) dipped using chloroform: composition quantification
Bianchi et al.
(1986)105
Wheat (Triticum
durum)
Glaucous and non-glucous matured wheat dipped using cold
chloroform for 1 minute: composition quantification
Most of the research tends to focus on the age and genetics of the cereal plants. Only a
small number of cereal plants have been studied and, as shown in Table 1.3, the most
studied was wheat. This could be due to the countries of study or availability of raw
materials. Column chromatography was used frequently as a mean of separating the

50
complex mixtures for compound identification and quantification with GC.97, 98, 99
Major classes of wax compound have been clearly identified as fatty acids, fatty
alcohols, alkanes, wax esters, sterols, aldehydes and β-diketones, however most of the
data collected was based on young plants and there is a lack of data on mature plants.
91, 97, 99, 100 Due to the high molecular weight of many wax compounds, a lot of the
studies only showed partial characterisation. High temperature GC-MS tends to be the
technique of choice when analysing the wax components.18
The wax samples are
sometimes derivatised (usually silylation) prior to analysis to make the compounds
more volatile, improve peak shapes, reduced adsorption losses and shorten retention
times.18
In the 1990s, there was a lack of interest in the field of cereal waxes and limited
research took place until the 2000s. The raw materials of interest then were cereal
wastes and not young plants. As shown in Table 1.2, a lot of research was carried out
on cereal straws. This could be part of sustainable development and adding value to
waste products. In the early 2000s, organic solvent extractions were studied on
various cereal straws and full characterisation was carried out. Physical properties of
these valuable extracts became an interest not only in the academic field but also in
the commercial field. A lot of physical properties (particularly thermal properties)
were determined for the extracts and compared to existing commercial waxes as part
of the sustainable development and bio-refinery concept. 107, 108 Alternative plant
waxes were needed to replace some of the existing synthetic and petroleum waxes so
there was a real drive in the research. From the mid-2000s until 2012, industries were
not only trying to secure a more sustainable wax source but also attempting to modify
the existing extraction method. Supercritical CO2 is being introduced as a green
alternative solvent for the extraction of cereal straw wax.18, 88, 90
Supercritical CO2 is
not a new technology; it has been used extensively in commercial extraction such as
decaffeination of coffee and extraction of hops.106, 107
Despite this, the solubility of
wax compounds in CO2 is not well understood compared to tradition organic solvents
so many attempted to compare scCO2 with organic solvent properties. Optimisation of
CO2 conditions for extraction had been modelled using various established equations,
however none have yet to apply to cereal wax.90
Using CO2 to fractionate the wax
extracts has been developed so that extraction and fractionation can be carried out as a
one step process.16

51
Table 1.3: Epicuticular wax from cereal waste
Reference Cereal (Species) Investigation
Sun et al.
(2001)108
Rice (Oryza sativa)
Rice straw extracted in six solvents (toluene/ethanol (2/1,
v/v), chloroform, petroleum ether (bp: < 318 K), DCM,
hexane and MTBE, Soxhlet): physical properties and
composition quantification
Sun et al.
(2001)89
Barley (Hordeum
vulgare)
Barley straw extracted in four solvents (toluene/ethanol (2/1,
v/v), chloroform, MTBE, hexane/acetone (2/1, v/v) and
DCM, Soxhlet): physical properties and composition
quantification
Sun et al.
(2001)109
Rye (Secale
cereale) and rice
(Oryza sativa)
Rye and rice straw extracted with MTBE (Soxhlet): physical
properties and composition quantification
Weller et al.
(2002)110
Sorghum (Sorghum
bicolor)
Sorghum straw dipped in three organic solvents (light
petroleum ether, hexane, chloroform) for 1 minute: physical
properties and composition quantification
Sun et al.
(2003)111
Wheat (Triticum
aestivum)
Wheat straw extracted in four solvents (toluene/ethanol (2/1,
v/v), toluene/ethanol/ methanol (1/1/1, v/v/v), MTBE and
chloroform/methanol (2/1, v/v), Soxhlet): physical properties
and composition quantification
Morrison et
al. (2005)112
Flax/linseed (Linum
usitatissimum)
Flax dusk from flax fiber processing extracted with hexane
(Soxhlet), scCO2 and scCO2 with ethanol (333 K and 55.2
MPa and sequential extraction with addition of ethanol at 1%,
5% and 10%): composition quantification
Deswarte et
al. (2006)18
Wheat (Triticum
aestivum)
Wheat straw extracted in five solvents (hexane, toluene,
MeTHF, ethanol and acetone, Soxhlet), scCO2 (313 K and
10/30 MPa) and lCO2 (283 K and 6 MPa) : physical
properties and composition identification
Mazza et al.
(2009)88
Flax/Linseed
(Linum
usitatissimum)
Three varities of flax straw (AC, McDuff, NorLin and
Flanders) extracted with hexane (Soxhlet) and scCO2 (343 K
and 30 MPa): physical properties and composition
quantification
Mazza et al.
(2010)90
Triticale
(Triticosecale
wittmack)
Triricale straw (AC Ultima) extracted with hexane (Soxhlet)
and scCO2 (343 K and 25/30/35/40 MPa): physical properties
and composition quantification
From the literature review, it is clear that optimisation of CO2 and solvent extraction of
cereal waxes is needed. Alternative purification and fractionation techniques must be
adopted instead of traditional column chromatography for a greener process. The influence
of chemical composition on physical properties must also be understood so that the
extraction conditions can be optimised for commercialisation and replacement of existing
commercial waxes.

52
1.6 Commercial waxes
The word “wax” is actually originally derived from the Anglo-Saxon “waex” for the
material found in the honeycomb of the bee. However, beeswax is not the only type of
commercial wax available. The competition in the wax business is high with many
traditional waxes as well as new waxes and they can be natural or synthetically produced.
There are broadly five different categories of waxes: animal, insect, vegetable, mineral and
synthetic.
1.6.1 Manufacturing of commercial waxes
Waxes from different sources can be extracted by various methods depending on
many factors such as chemical compositions, yield and location of the wax. The most
common animal waxes are beeswax and lanolin and they are both by-products of other
industries.113
Beeswax is a valuable wax that is projected from the wax glands under
the abdomen of the honey bee (usually European bees Apis mellifera in UK) for the
application of honeycomb.114
The wax can be recovered by melting when the honey is
removed from the honeycomb and is classed as a by-product from honey
production.113
It is then filtered through a steam-jacketed filter press and washed with
water to remove impurities.113
Wool grease is another common type of animal wax which is a by-product from the
textiles industries.115
The shorn wool tends to have wool wax from 5 – 16% by weight
of the fleece depending on the quality and breed.115
The wax is secreted from the
sebaceous gland of the sheep to protect the animal against wetting.116
The Australian
or New Zealand wool is washed in a mixture of cold and warm water with detergents
for the textiles industries.117
Heavy solids such as sand are removed to give clean
wool. The wool grease can be recovered from the “dirty” washings with a vortex and
centrifuge step.117
Project sponsor Croda Europe Limited is a global leader in lanolin
supply and the manufacturing process described is based on communications with the
company during a site visit. The wool grease from scouring mills arrives at Croda site
for lanolin processing.
53
The wool grease is then recovered by the addition of sulphuric acid to about pH 2.5 –
3.5 to remove any pesticides and sodium hexametaphosphate added to remove any
metal salts and for bleaching purposes.117
The wax is further bleached by hydrogen
peroxide to a specified Gardner colour and then followed by an alkaline wash to
remove any free acids. Any soap created during the free acid removal process would
be removed by washing in isopropanol and water. At this stage of the process, the wax
can undergo various processing routes to create different forms and grades of lanolin.
The wax can be steam deodourised to give the “undistilled” lanolin, molecular
distilled to yield the “distilled” lanolin, winterised using ethyl acetate to create “hard”
and “liquid” lanolin fractions or saponified to give the lanolin acid and lanolin
alcohol.117
A few types of the lanolin can then be super-refined using flash
chromatography to give super-refined lanolin.117
Other important waxes include candelilla and carnauba waxes, which are two of the
key vegetable waxes and both are grown in South and Central America.113
Carnauba
wax originates from carnauba palms (Copernicia cerifera) in Brazil but as the
Brazilian government is protective and tightly controls their production, the
manufacturing processes are carried out only in that country.113
The wax is removed
by threshing when the leaves are cut and dried. Approximately 5 – 8% of wax can be
retrieved depending on the size of leaf, age, growing conditions etc.118
Candelilla wax
is also derived from a regional specific candelilla shrub (Euphorbia antisiphilitica,
Euphobia cerifera and Pedilanthus pavonis) which is grown predominately in
Mexico. The wax is extracted out by heating the plant in boiling water with 1%
sulphuric acid which is added to enhance the wax recovery and reduce foaming.113
The waxy layer located on top of the aqueous layer is removed and strained and gently
heated to remove the excess water.113
The yields vary from 1.5 – 2.5% depending on
age, growing conditions etc.119

54
Figure 1.13: Wool grease retrieval from sheep wool115, 117
Heavy solids
Scouring
Process
“Washing
Sheep wool
1st Bowl
Cold water
wash (RT)
2nd
Bowl
Damp wool in warm
water (338 K) and
detergent
Series of
Bowls
Counter-current of clean water
Wool grease
“Dirty”
washings
Emulsion
s
Hydrocyclone vortex and centrifuge at
351 K
Waste
Clean sheep
wool
Textiles

5
5
Figure 1.14: Wool grease processing at Croda
Wool grease
Mild acid wash Pesticides
Calgon (Sodium
hexametaphosphate) wash Metal salts
Bleach by hydrogen
peroxide
Steam
Deodouriser
Molecular
Distillation
Flash chromatography
“Distilled”
lanolin
Alkaline NaOH wash Free acids
Isopropanol and water
wash
Soap
Ethyl acetate
winterisation
“Undistilled”
lanolin
“Hard”
lanolin
“Liquid”
lanolin
“Super-refined
undistilled” lanolin
“Super-refined
liquid” lanolin

56
1.6.2 Chemical composition and physical properties
The four waxes consist of predominately esters and hydrocarbons. Beeswax, carnauba
wax and lanolin are ester-based with at least 80% in its composition. Candelilla wax is
distinctly different to the other two commercial waxes as it has a high content of
hydrocarbon. Wheat straw wax had been reported to contain aliphatic wax esters,
alkanes, free fatty acids, free fatty alcohols, sterols and β-diketones but the quantity of
each lipid class has not been identified.16
The identification of the chemical
compounds in the wax is important as it is directly related to its physical properties
which can influence its applications. Commercial waxes are graded, characterised by a
number of properties and tested according to various pharmacopeia guidelines
depending on its application. The colour, odour and taste of waxes are tested and
usually decolourisation and deodorisation steps are carried out to fit with the wax
application. For applications such as cosmetics, it is undesirable for the wax to be
heavily coloured or have strong odour. Beeswax is commonly bleached by hydrogen
peroxide to a satisfying colour.120
The unpleasant sheep odour is removed from
lanolin by vacuum deodorisation at 0.2 – 0.5 KPa and 373 – 393 K with steam
purging.115
The waxes are usually taste-free after purification and processing and this
is particularly important for candelilla wax as one of the major applications is as a
binder for chewing gums.113
Thermal properties such as melting and softening points
are necessary for the functionality of certain applications such as depilatory waxes.121
Water absorption levels for emulsion formation in cosmetics and waterproofing
properties in coatings must be balanced for applications performance.122, 123
Other
physical characteristics that are also important include penetration, shrinkage, drop
point and density.113, 117
Chemical constants such as acid value, saponification value
and iodine value are commonly determined for waxes as they give an overview into
the chemical components. Acid value is the number of mg of KOH needed to
neutralise 1 g of the wax, saponification value is the number of mg of KOH required
to hydrolyse 1 g of wax and iodine value is the amount of iodine that is reacted with
the double bonds in the wax so it would give an indication of the degree of
unsaturation.113
Some of the key physical properties for the commercial waxes are
expressed in Table 1.4. The physical properties for the commercial waxes are
distinctively different to serve different applications.

57
Table 1.4: Chemical composition and physical properties of four commercial waxes113, 116
1.6.3 Wax market and applications
Waxes are the basis of many different applications and are important raw materials for
many industries. In 2010, there was a global demand of 4.35 million tonnes of waxes
of which 85% was petroleum waxes, 11% was synthetic waxes and 4% animal or
vegetable waxes.124
Synthetic and vegetable waxes are the fastest growing products in
the 2010 wax market with a massive increase in production from Asia.124
Petroleum
wax is by far the most important in the wax market as the main application for this
wax is candles which accounts for 43% of the application of waxes.113
The second
biggest application is board sizing which holds 15% of the wax market. Impregnation
of petroleum wax consisting C30 - C50 hydrocarbons are typical for the paper
industries.113
Another major application for waxes is coatings and this includes
coatings for wires, food packaging, fruits, paper, tablets and wrapping as some waxes
are very hydrophobic and can provide water proofing of the products.113
This holds
about 14% of the global wax market as shown in Figure 1.15. Waxes are also used in
adhesives as a laminator and protective coating and a number of different polishes
Beeswax
Carnauba
wax
Candelilla
wax Lanolin
Lipid classes
Aliphatic wax esters 70 - 80% 84 - 85% 28 -29% 48 - 59%
Steryl esters - - - 32 - 35%
Hydrocarbons 10 - 15% 1.5 - 3% 50 - 51% 0.4 - 2%
Free fatty acids 12 - 15% 3 - 3.5% 7 - 9% 1 - 4%
Fatty fatty alcohols - 2 - 3% 12- 14%
(Total)
-
Resins - 4 - 6% -
Sterols - - 0.8 - 1.5%
Triterpene alcohols - - - 4.5 - 5.5%
Lactides - 2 - 3% - -
Lactones - - - 6 - 6.6%
Physical properties
Acid value (mg of KOH
per g) 17 - 36 2.9 - 9.7 12 - 22 7 - 15
Iodine value (g iodine per
100 g) 7 - 16 7 - 14 19 - 45 15 - 30
Saponification value (mg
of KOH per g) 90 - 149 79 - 95 43 - 65 100 - 110
Melting point (K) 335 - 338 351 - 358 339 - 344 308 - 315

58
from shoes to cars.113
A large number of cosmetics also have waxes in their
formulations for different purposes including lip-sticks, skin cream, depilatory wax
etc.113, 121
Lanolin can self-emulsify into a stable water-in-oil emulsion and has
emollient properties which are ideal as a cosmetic ingredient for skin creams.115
Waxes can also be blended into different products for improved performance. Paraffin
wax is added to rubber to increase the stiffness of the product; carnauba wax is
blended into candles at a low percentage as a hardener and beeswax is incorporated
into coatings to increase flexibility.113
Many formulations or applications involve
more than one wax as there are advantages and disadvantages to each wax. In a
typical lip-stick formulation, a combination of waxes is formulated into the stick for
various functions.125
Candelilla wax is formulated in as a harder; lanolin serves as an
emollient and helps the stick to remain as an homogeneous mass whereas carnauba
wax is added in order to increase the toughness of the stick.125
Figure 1.15: Global wax applications124
(originally in colour)
1.6.4 Wax market outlook and opportunities
The demand for wax is predicted to grow from 4.35 million tonnes in 2010 to 5.46
million tonnes in 2020 with an average annual growth of 2.3%. However, the wax
supply will not be growing at the same rate. Wax supply is forecasted to grow at just
1.4% which gives a predicted wax supply of only 5 million tonnes so as a result there
would be 0.47 million tonnes of wax shortage as shown in Figure 1.16. This is mainly
due to a zero increase in petroleum waxes from the shortage of crude oil. By 2015, the
43%
15%
14%
10%
3% 16%
Candles
Board sizing
Coatings
Packaging
Health industries
Other
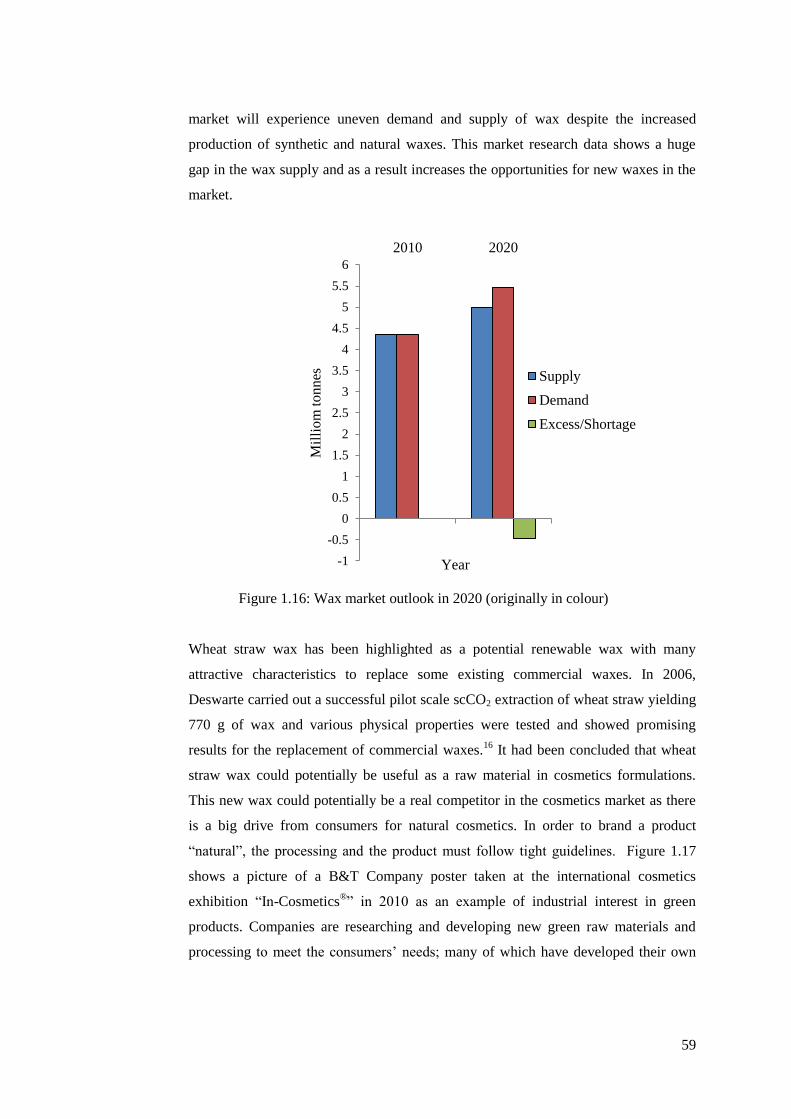
59
market will experience uneven demand and supply of wax despite the increased
production of synthetic and natural waxes. This market research data shows a huge
gap in the wax supply and as a result increases the opportunities for new waxes in the
market.
Figure 1.16: Wax market outlook in 2020 (originally in colour)
Wheat straw wax has been highlighted as a potential renewable wax with many
attractive characteristics to replace some existing commercial waxes. In 2006,
Deswarte carried out a successful pilot scale scCO2 extraction of wheat straw yielding
770 g of wax and various physical properties were tested and showed promising
results for the replacement of commercial waxes.16
It had been concluded that wheat
straw wax could potentially be useful as a raw material in cosmetics formulations.
This new wax could potentially be a real competitor in the cosmetics market as there
is a big drive from consumers for natural cosmetics. In order to brand a product
“natural”, the processing and the product must follow tight guidelines. Figure 1.17
shows a picture of a B&T Company poster taken at the international cosmetics
exhibition “In-Cosmetics®” in 2010 as an example of industrial interest in green
products. Companies are researching and developing new green raw materials and
processing to meet the consumers’ needs; many of which have developed their own
-1
-0.5
0
0.5
1
1.5
2
2.5
3
3.5
4
4.5
5
5.5
6
2010 2020
Mil
lio
m t
on
nes
Year
Supply
Demand
Excess/Shortage
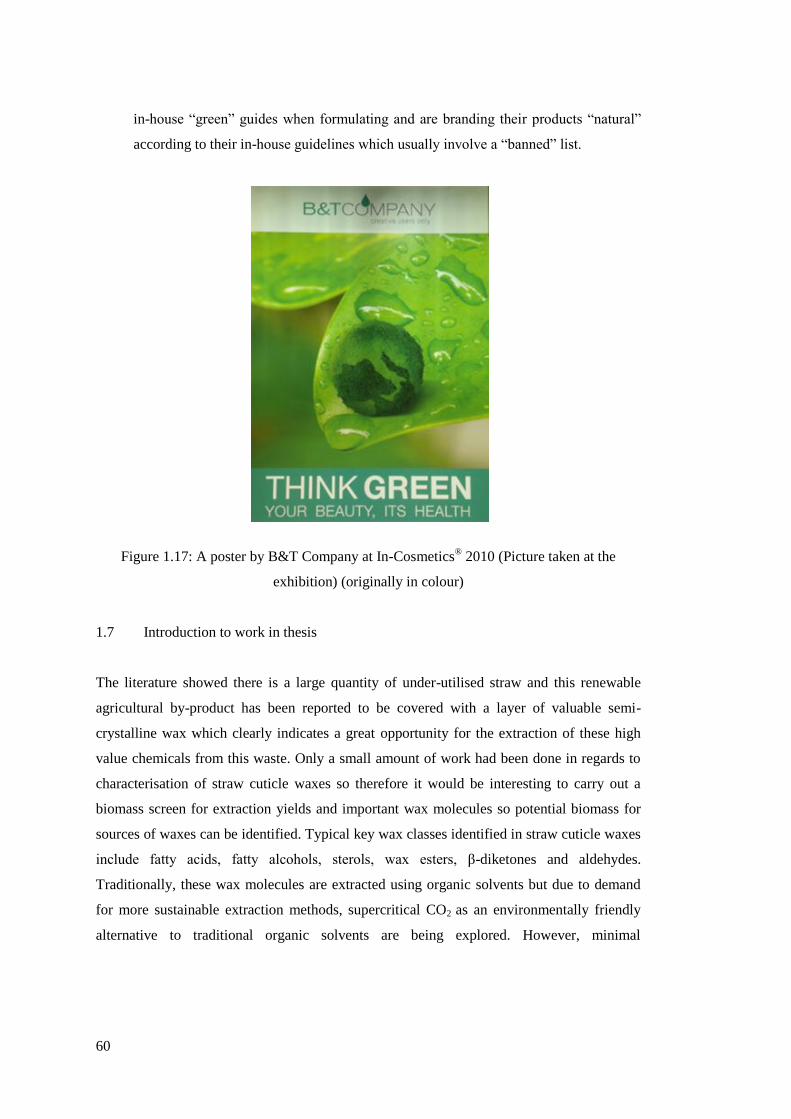
60
in-house “green” guides when formulating and are branding their products “natural”
according to their in-house guidelines which usually involve a “banned” list.
Figure 1.17: A poster by B&T Company at In-Cosmetics® 2010 (Picture taken at the
exhibition) (originally in colour)
1.7 Introduction to work in thesis
The literature showed there is a large quantity of under-utilised straw and this renewable
agricultural by-product has been reported to be covered with a layer of valuable semi-
crystalline wax which clearly indicates a great opportunity for the extraction of these high
value chemicals from this waste. Only a small amount of work had been done in regards to
characterisation of straw cuticle waxes so therefore it would be interesting to carry out a
biomass screen for extraction yields and important wax molecules so potential biomass for
sources of waxes can be identified. Typical key wax classes identified in straw cuticle waxes
include fatty acids, fatty alcohols, sterols, wax esters, β-diketones and aldehydes.
Traditionally, these wax molecules are extracted using organic solvents but due to demand
for more sustainable extraction methods, supercritical CO2 as an environmentally friendly
alternative to traditional organic solvents are being explored. However, minimal

61
optimisation of solvent and scCO2 extractions had been carried out. In solvent extractions,
mathematical modelling can be applied on natural product extractions so a relationship
between solvent parameters and extraction yields can be established. The different wax
components can be characterised and quantified and develop extraction models for specific
wax classes. Optimisation of CO2 extraction on straw waxes carried out previously was
limited so it would be interesting to further develop the optimisation using different scCO2
models. Extraction and fractionation methods can alter the chemical compositions of the
wax products so it is crucial to examine the physical properties and performance of the novel
renewable wax products. This would give an indication on the similarities and differences in
physical properties between existing commercial waxes so the potential applications can be
identified. With the research gaps highlighted, the work in this thesis had been split into four
main areas:
Chapter 2 describes the extraction of wheat straw wax using various organic solvents and
mathematical modelling was carried out to relate the solvent parameters to selectivity.
Characterisation of the chemical composition of the wheat straw wax was described and
highlighted potential applications for the compounds identified. Quantification of the
extracts was studied and mathematical modelling for different wax classes was investigated.
Chapter 3 examines the use of carbon dioxide as an environmentally friendly alternative to
traditional organic solvents. Carbon dioxide was compared with the organic solvents and the
similarities and differences were highlighted. The effect of temperature and pressure on
scCO2 extraction was investigated extensively. Optimisation of temperature and pressure
was carried out using two different methods. Qualitative and quantification analysis of the
wheat straw wax were completed for different extraction conditions so conclusions can be
drawn on optimal extraction conditions for both total crude extraction yields and specific
wax classes. The influence of chemical composition on physical properties was considered.
Chapter 4 investigates the potential biomass for wax sources by carrying out a straw
screening using hexane and ethanol extractions. The extraction yields and new molecules
found were highlighted. The chemical composition of the different types of straw wax was
compared and the potential biomass for further investigation was selected. Selected cereal
straws were scaled up to production scale and the chemical compositions of the straw waxes
were compared and analysed. Comparison between laboratory and production scale was
drawn.

62
Chapter 5 focuses on downstream processing after scCO2 extraction. The co-extraction of
water with the waxes was the first initial processing step and was noted as new potential
waste materials for different markets. Other processing steps such as fractionation and
saponification were discussed. The physical properties such as melting point were
determined so potential applications can be selected for formulation trials. Economic
analysis was carried out based on the production scale trial and was used to conclude for
further scale ups and potential commercialisation.

Chapter 2
Solvent extraction of wheat straw wax
V.L. Budarin, P.S. Shuttleworth, J.R. Dodson, A.J. Hunt, B. Lanigan, R. Marriott, K.J.
Milkowski, A.J. Wilson, S.W. Breeden, J. Fan, E.H.K. Sin and J.H. Clark, Energy
Environ. Sci., 2011, 4, 471-479
Poster given at 6th International Conference on Renewable Resources and Biorefineries 6
(RRB6), Düsseldorf, Germany, June 2010
Poster given at Vice Chancellor visit to Department of Chemistry, University of York,
August 2010
Oral presentation given at 1st
NORthern Sustainable Chemistry meeting (NORSC), York,
UK, October 2010
Poster given at Dechema’s Green Solvents for Synthesis conference, Berchtesgaden,
Germany, October 2010
Poster given at Shell poster competition, University of York, January, 2011
Oral presentation given at 7th International Conference on Renewable Resources and
Biorefineries (RRB7), Bruges, Belgium, June 2011


65
2. SOLVENT EXTRACTION OF WHEAT STRAW
WAX
2.1 Introduction
A semi-crystalline layer of valuable wax is located on the surface of plants which can be
removed mechanically or by solvent extraction. In this Chapter, a number of solvents
(heptane, ethanol, diethyl ether, 2-methyl tetrahydrofuran, acetone, toluene, ethyl acetate,
propanol, butan-2-ol, dimethyl carbonate and methanol) were investigated for their abilities
to selectively Soxhlet extract waxes from winter wheat straw (Viscount 09). Chemical
compositions of the wheat straw wax extracted were characterised using KI and GC-MS.
The main components in the extracts were quantified using GC FID. Potential applications
of the key high value wax groups are discussed. LSER modelling was applied to the
extraction crude yield and individual wax groups for future solvent extractions. The
environmental impact of the solvents is considered when identifying the “ideal” solvent.
2.2 Solvent selection and extraction
2.2.1 Solvent parameters and linear solvation energy relationships (LSER)
Solvent is a liquid substance that serves the purpose of dissolving chemicals in
applications such as extractions and can be removed unchanged after the applications
(unless solvent is one of the reactants).126
In extractions, the purpose of the solvents is
to solubilise solutes selectively and effectively as well as easily separate and recover
solvents and solutes. The dissolution of a compound in a solvent can only occur when
the attractive forces between solute and solvent outweighs both solvent-solvent and
solute-solute interactions.127
The extent of solubility is dependent on the
intermolecular interactions between solvent and solute molecules giving the overall
mutual solubility. Typically molecules of “similar” structures and properties would
have greater solvent-solute interactions resulting in high dissolution. The forces that
determine this are the dipole-induced dipole forces, instantaneous dipole-induced
dipole forces and hydrogen bonding.128
Solvent is a major part of extractions with
most of the 8 million tonnes of oils isolated per year from seeds and grain

66
commodities being extracted by hexane in the US.129
Solvents must be selected in
consideration of solvent properties, environmental impact, economic issues and
associated hazards. Solvents can be classified by different ways and in an extraction;
it is the solvent-solute interaction that is considered the main driver of the outcome. A
list of physical constants namely melting point, boiling point, heat of vapourisation,
index of refraction, density, viscosity, molar volume, surface tension, dipole moment,
relative permittivity, polarisability, etc. are compiled which can describe the
behaviour of each solvent.
Solvent polarity is a measurement to describe the strength of the solvent including all
the solvent-solute interactions and cannot be defined by a single physical parameter
alone.128
Researchers attempted to measure solvent polarity quantitatively and
introduced empirical scales of solvent polarity.128
In 1951, Brooker was first to have
thought of the idea of the use of solvatochromic dyes to measure solvent polarity but
it was Kosower who was the first to establish the first polarity scale (Z values) in
1958.130, 131
In 1963, Reichardt devised a normalised polarity scale using the
solvatochromatic pyridinium-N-phenoxide betaine dye (non-protonic dye) from 0
(TMS) to 1 (water).132
Kamlet and Taft developed a comprehensive set of
solvatochromic parameters α, β and π* using various solvatochromic dyes (e.g.: N, N-
diethyl 4-nitroaniline (non-protonic indicator), 3, 5 dinitroaniline (protonic indicator),
4-amino 7-methyl coumarine (hydrogen bond donor indicator), where α is the
hydrogen bond donating ability, β is the hydrogen bond accepting ability and π* is the
polarisability of the solvent.133, 134, 135, 136
The π* scale was derived from the shift of the
wavelength absorption maximum in the dyes that was caused by the solvent-solute
interactions which was normalised to cyclohexane (π* = 0) and DMSO (π* = 1).132, 134
The α and β scales were also derived using a similar method but π* interactions tend
to occur as well as α or β interactions so the π* interactions must be subtracted from
all solvent-solute interactions in order to give only the α or β values. The β scale was
normalised to cyclohexane (β = 0) and hexamethylphosphoramide (β = 1). ).132, 134
Table 2.1 shows the parameters of selected solvents for extraction.
Linear solvation energy relationships have been proposed to correlate physical and
chemical properties of solvents and can relate to the solvent-solute interactions.136
Many have been proposed but the LSER had been one of the most successful as
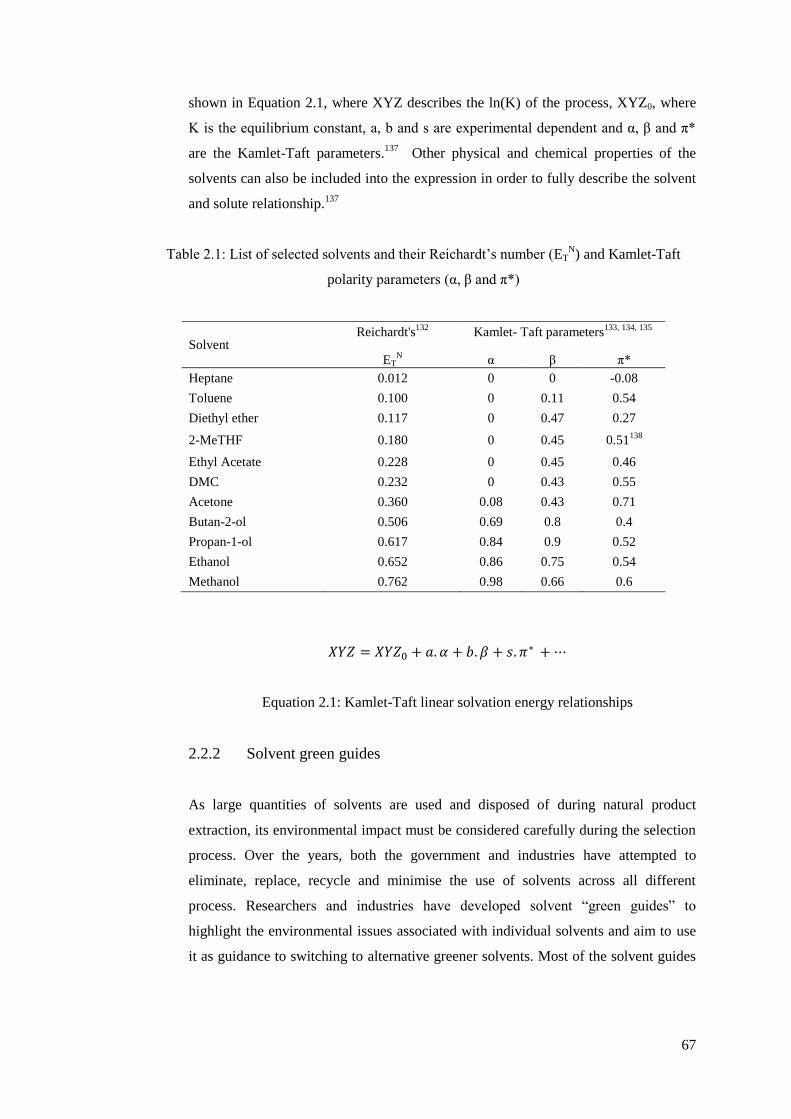
67
shown in Equation 2.1, where XYZ describes the ln(K) of the process, XYZ0, where
K is the equilibrium constant, a, b and s are experimental dependent and α, β and π*
are the Kamlet-Taft parameters.137
Other physical and chemical properties of the
solvents can also be included into the expression in order to fully describe the solvent
and solute relationship.137
Table 2.1: List of selected solvents and their Reichardt’s number (ETN) and Kamlet-Taft
polarity parameters (α, β and π*)
Solvent Reichardt's
132 Kamlet- Taft parameters
133, 134, 135
ETN α β π*
Heptane 0.012 0 0 -0.08
Toluene 0.100 0 0.11 0.54
Diethyl ether 0.117 0 0.47 0.27
2-MeTHF 0.180 0 0.45 0.51138
Ethyl Acetate 0.228 0 0.45 0.46
DMC 0.232 0 0.43 0.55
Acetone 0.360 0.08 0.43 0.71
Butan-2-ol 0.506 0.69 0.8 0.4
Propan-1-ol 0.617 0.84 0.9 0.52
Ethanol 0.652 0.86 0.75 0.54
Methanol 0.762 0.98 0.66 0.6
Equation 2.1: Kamlet-Taft linear solvation energy relationships
2.2.2 Solvent green guides
As large quantities of solvents are used and disposed of during natural product
extraction, its environmental impact must be considered carefully during the selection
process. Over the years, both the government and industries have attempted to
eliminate, replace, recycle and minimise the use of solvents across all different
process. Researchers and industries have developed solvent “green guides” to
highlight the environmental issues associated with individual solvents and aim to use
it as guidance to switching to alternative greener solvents. Most of the solvent guides

68
broadly take account of three main areas: environmental, health and safety impacts
associated with each solvent. In 1999, SmithKline Beecham (now known as GSK)
conducted solvent selection guidelines based on a number of key categories
(incineration, recycle, bio-treatment, VOC, environmental impact to water,
environmental impact to air exposure potential and safety hazard) on thirty-five
different solvents.139
The guides consider each of the categories and apply a score
system for four categories (waste, impact, health and safety) from 1 (major issues) to
10 (no issues).139
The environmental impact of distillation of solvents was compared.
In 2004, GSK improved the solvent guide and expanded its solvent list to forty seven
solvents and reviewed the reported solvents.140
A similar scoring system applied but
an extra category of LCA has been introduced. The guide was also more user friendly
by introducing a colour coding system of red (Unacceptable), yellow (average) and
green (acceptable). Fischer et al. developed an environmental assessment of twenty
six solvents through EHS (identify potential substance hazards) and LCA (quantify of
emissions and resource use over the whole life cycle) method in 2007. By considering
nine different categories (water hazard, air hazard, persistency, chronic toxicity,
irritation, acute toxicity, reactivity, potential for fire or explosion and release
potential), an EHS score has been allocated and added together to indicate the overall
environmental impact of each solvent. In 2008, Pfizer produced a solvent selection
guide which clearly divided the solvents into three groups as green (preferred), yellow
(useable) and red (undesirable). This guide not only clearly indicated the problems of
“undesirable” solvents but it also highlighted the solvents that can be used to replace
them e.g.: heptane can be used to replace hexane. GSK also produced a similar but
more comprehensive solvent guide in 2011. The solvents are grouped into three
categories as green (few issues), yellow (some issues) and red (major issues).1 Like
the previous versions of the GSK guides, a scoring system from 1 – 10 was adopted
on a more extensive list of categories (waste, environmental impact, health,
flammability and explosion, reactivity or stability and life cycle score) as shown in
Table 2.2.1 This solvent guide will be used when comparing the solvents used for the
wheat straw extractions as it is the most recent and detailed.1

69
Table 2.2: List of selected solvents and their environmental, health and safety issues1
(originally in colour)
Solvent Waste Environmental
impact Health
Flammability
& Explosion
Reactivity/
Stability
Life
Cycle
Score
Heptane 6 3 8 3 10 7
Toluene 6 3 4 4 10 7
Diethyl ether 4 4 5 2 4 6
2-MeTHF 4 5 4 3 6 4
Ethyl Acetate 4 8 8 4 8 6
DMC 4 8 7 6 10 8
Acetone 3 9 8 4 9 7
Butan-2-ol 4 6 8 7 9 6
Propan-1-ol 4 7 5 7 10 7
Ethanol 3 8 8 6 9 6
Methanol 4 9 5 5 10 9
Solvents are colour coded according to the GSK solvent guide1
2.2.3 Biomass pre-treatment techniques
A large number of pre-treatment processes have been developed for lignocellulosic
biomass such as wheat straw to enhance the extraction efficiency and lower
processing costs.141
The pre-treatment steps aim to cause physical and/or chemical
change to the biomass.142
Pre-treatments are either physical or chemical and in some
cases, both are incorporated for added positive effects. Physical pre-treatments tend to
be applied to make raw materials easier to handle and reduce particle size for better
solvent diffusivity to achieve better extraction efficiency. These include comminution,
steam explosion and hydrothermolysis.143, 144, 145
Comminution is carried out to reduce
particle size by dry, wet or vibratory milling.142
Chemical treatments are commonly used to help with the recovery of targeted
molecules by chemical modification or disruption of the biomass structure. Acids
and bases such as sulphuric acid and sodium hydroxide can be added to improve the
extraction yield by enhancing the recovery of targeted molecules.146, 147
As well as
acid and base treatment, ammonium-based solvents (e.g.: ammonia), aprotic solvents
(e.g.: DMSO), metal complexes (e.g.: ferric sodium tartrate) and water oxidation are

70
also commonly used as a mean to disrupt the cellulose structure of biomass.148, 149, 150,
151 For the extraction of wheat straw, physical pre-treatment is necessary to increase
the extraction efficiency so hammer milling was the chosen technique to reduce the
particle size.
2.2.4 Solvent extraction techniques
Waxes can be extracted using various solvent extraction techniques such as Soxhlet. It
is important to select a solvent technique for this investigation. Soxhlet extraction is a
traditional continuous extractor that is originally designed for the extraction of lipids.
The pre-treated sample is filled into a porous cellulose thimble which is then slotted
into the Soxhlet extractor as shown in Figure 2.1. During the extraction, the solvent
was heated to boiling point and the Soxhlet extractor then slowly filled with
condensed solvent. When the solvent has reached the siphon top, the filled Soxhlet
extractor empties back into the solvent reservoir directly below. During this process,
the extracted solvent carries the materials extract with it. This cycle is repeated
continuously until heating is stopped. Typically, the extraction uses a large amount of
solvent and needs to be run for several hours.
Figure 2.1: Soxhlet extractor (originally in colour)
FexIKA® extraction is designed to tackle the main disadvantages of Soxhlet such as
the large volume of solvent usage and long extraction times. It is a multi-point solid-
Condenser
Cellulose
thimble
Round bottomed
flask
Soxhlet
extract
Siphon
Solvent Heating mantle

71
liquid extractor (Figure 2.2) that is based on the fluidised bed extraction principle with
the aim of the design to reduce solvent and extraction time. IKA® claim that this
technique can reduce the extraction times by 90%. The sample is loaded in to the
extractor where the solvent vapour penetrates the filter, permeates through the sample
and comes into contact with the cooling finger. The condensed solvent remains in the
extraction tube whilst the solvent level in the base vessel is continuously being
reduced as the heating proceeds. This enables electronic online monitoring of
temperature changes and feedback controls over the entire process. When the heating
is switched off after a set time, the cooling water enters the device to cool the system.
The induced cooling and condensing creates a vacuum and the resulting differential
pressure and atmospheric pressure pulls the solvent along with the extract through the
filter and into the base vessel. This process can be repeated continuously.
Figure 2.2: FexIKA® Vario Control Series Extractor (originally in colour)
ASE® is also a common extraction technique which is designed to extract at an
elevated temperature and pressure in order to reduce the solvent usage and minimise
extraction time. This technique enables the solvent extractions to be carried out at the
same temperature with elevated pressure. With this technique, solvent consumption
can be reduced by 90% making it both cheaper and more environmentally friendly. It
is an automated multi-cell extractor which makes it ideal for sequential extractions
and extraction of a large number of samples. Ultrasound-assisted extraction is an
alternative method for solid-liquid extraction. It is very similar to Soxhlet extraction
with the assistance of ultrasound for the enhancement of solubility of solutes in
solvents. The advantage is that the extraction time is shortened by this enhancement,
and ultrasound can help with cell disruption if a biological sample is used which could
Cooling finger
Raw material
Solvent resistant
adaptor
Magnetic stirrer
Stirrer hotplate
Solvent
PTFE filter
Flask
Extraction
tube

72
enable better penetration of solvent through the sample. All the techniques described
rely on conventional heating but microwave-assisted extraction is an efficient
extraction process without conventional heating. The extraction can be carried out
under pressure with controlled internal temperature. This advanced technology is
more environmentally friendly compared with traditional Soxhlet extraction with
shorter extraction times and 90% less solvent usage. After careful consideration,
Soxhlet extraction method was chosen for the investigation as it is a traditional
method that is quick and easy to set up.
2.3 Optimisation of solvent extraction using LSER
The wheat straw (Viscount 09) was physically pre-treated, extracted and moisture
determined using methods in Sections 6.2.2, 6.2.3 and 6.2.1 respectively. The water content
of the milled wheat straw was checked to ensure it is less than 10% prior to extraction. The
percentage crude yields were calculated using Equation 2.2 and found to lie between 1.22 –
5.13% (with a ±0.11% error) depending on solvent used.
Equation 2.2: Calculation of percentage crude yield
Solvent extractions tend to be very unselective and can lead to the extraction of many
different unwanted molecules. It had previously been reported that phenolic acids, resin
acids, glycerides, phospholipids, pigments, low molecular weight carbohydrates, ash and
salts were found in plant extracts.152, 153, 154, 155
The extracts were partitioned using DCM and
water to retrieve just the lipophilic fraction of the extract. Table 2.3 and Figure 2.3 show a
graph of the average percentage crude yields from different organic solvents (with DCM and
water soluble fractions).

73
Table 2.3: Percentage crude yield with percentage of DCM and water soluble fractions
Figure 2.3: Percentage crude yield with percentage of DCM and water soluble fractions
(originally in colour)
From Figure 2.3, methanol has the highest percentage crude yield for wheat straw
extraction and can be considered as the solvent with the most extracting ability for the
various molecules that are presented in the biomass. On the other extreme, diethyl
Solvent Crude Yield (%) DCM soluble (%) Water soluble (%)
Methanol 5.13 1.07 4.06
Propan-1-ol 4.07 1.22 2.85
Ethanol 3.87 1.01 2.87
Butan-2-ol 3.38 1.32 2.06
MeTHF 2.53 1.79 0.73
DMC 2.36 1.30 1.06
Ethyl Acetate 2.31 1.89 0.42
Toluene 2.16 1.51 0.65
Acetone 1.80 0.62 1.18
Heptane 1.26 0.96 0.30
Diethyl ether 1.22 0.46 0.76
1.1 1.2 1.0 1.3
1.8 1.3
1.9 1.5
0.6 1.0
0.5
4.1
2.9 2.9 2.1
0.7 1.1
0.4 0.6
1.2 0.3 0.8
0.0
0.5
1.0
1.5
2.0
2.5
3.0
3.5
4.0
4.5
5.0
5.5
% C
rude
yie
ld
Solvent
Water soluble
DCM soluble
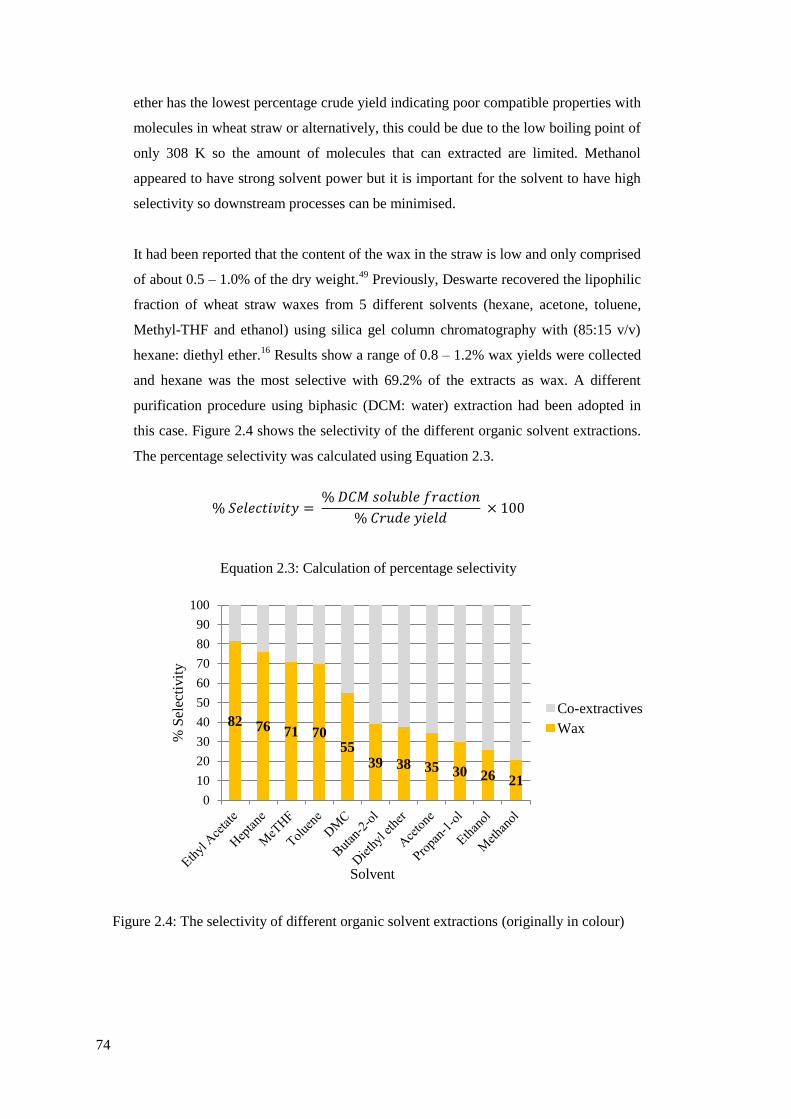
74
ether has the lowest percentage crude yield indicating poor compatible properties with
molecules in wheat straw or alternatively, this could be due to the low boiling point of
only 308 K so the amount of molecules that can extracted are limited. Methanol
appeared to have strong solvent power but it is important for the solvent to have high
selectivity so downstream processes can be minimised.
It had been reported that the content of the wax in the straw is low and only comprised
of about 0.5 – 1.0% of the dry weight.49
Previously, Deswarte recovered the lipophilic
fraction of wheat straw waxes from 5 different solvents (hexane, acetone, toluene,
Methyl-THF and ethanol) using silica gel column chromatography with (85:15 v/v)
hexane: diethyl ether.16
Results show a range of 0.8 – 1.2% wax yields were collected
and hexane was the most selective with 69.2% of the extracts as wax. A different
purification procedure using biphasic (DCM: water) extraction had been adopted in
this case. Figure 2.4 shows the selectivity of the different organic solvent extractions.
The percentage selectivity was calculated using Equation 2.3.
Equation 2.3: Calculation of percentage selectivity
Figure 2.4: The selectivity of different organic solvent extractions (originally in colour)
82 76 71 70 55
39 38 35 30 26 21
0
10
20
30
40
50
60
70
80
90
100
% S
elec
tivit
y
Solvent
Co-extractives
Wax
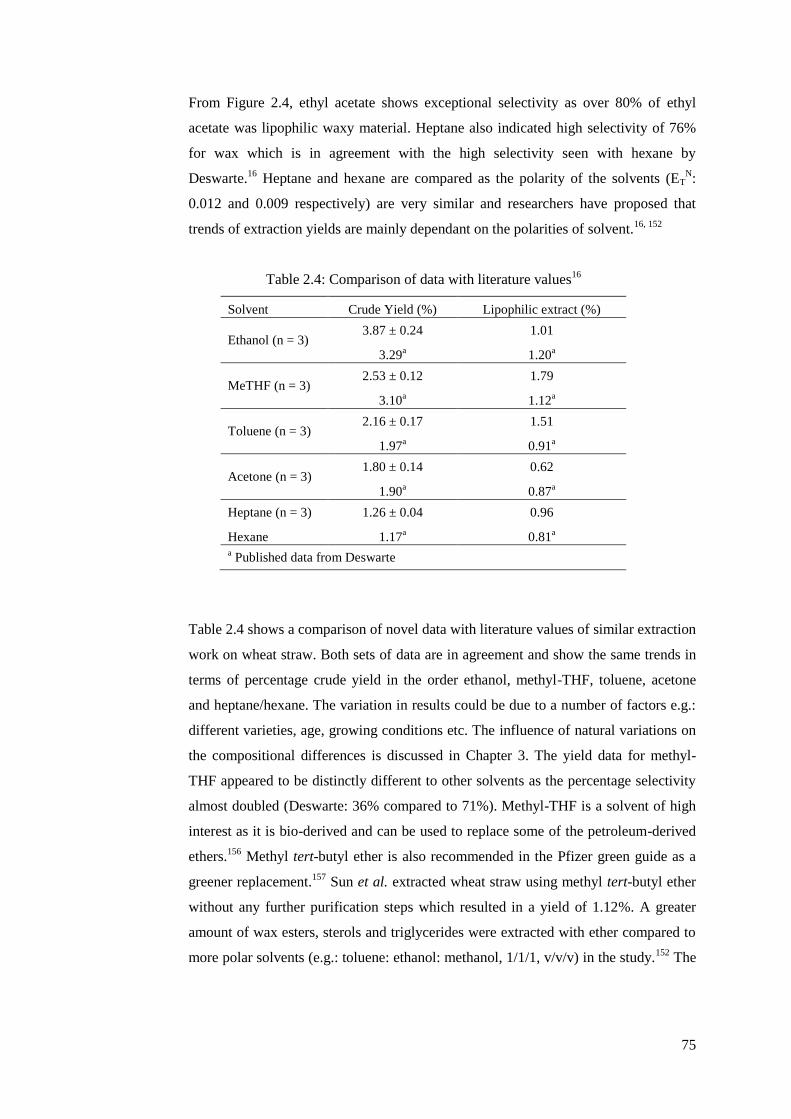
75
From Figure 2.4, ethyl acetate shows exceptional selectivity as over 80% of ethyl
acetate was lipophilic waxy material. Heptane also indicated high selectivity of 76%
for wax which is in agreement with the high selectivity seen with hexane by
Deswarte.16
Heptane and hexane are compared as the polarity of the solvents (ETN:
0.012 and 0.009 respectively) are very similar and researchers have proposed that
trends of extraction yields are mainly dependant on the polarities of solvent.16, 152
Table 2.4: Comparison of data with literature values16
Solvent Crude Yield (%) Lipophilic extract (%)
Ethanol (n = 3) 3.87 ± 0.24 1.01
3.29a 1.20
a
MeTHF (n = 3) 2.53 ± 0.12 1.79
3.10a 1.12
a
Toluene (n = 3) 2.16 ± 0.17 1.51
1.97a 0.91
a
Acetone (n = 3) 1.80 ± 0.14 0.62
1.90a 0.87
a
Heptane (n = 3) 1.26 ± 0.04 0.96
Hexane 1.17a 0.81
a
a Published data from Deswarte
Table 2.4 shows a comparison of novel data with literature values of similar extraction
work on wheat straw. Both sets of data are in agreement and show the same trends in
terms of percentage crude yield in the order ethanol, methyl-THF, toluene, acetone
and heptane/hexane. The variation in results could be due to a number of factors e.g.:
different varieties, age, growing conditions etc. The influence of natural variations on
the compositional differences is discussed in Chapter 3. The yield data for methyl-
THF appeared to be distinctly different to other solvents as the percentage selectivity
almost doubled (Deswarte: 36% compared to 71%). Methyl-THF is a solvent of high
interest as it is bio-derived and can be used to replace some of the petroleum-derived
ethers.156
Methyl tert-butyl ether is also recommended in the Pfizer green guide as a
greener replacement.157
Sun et al. extracted wheat straw using methyl tert-butyl ether
without any further purification steps which resulted in a yield of 1.12%. A greater
amount of wax esters, sterols and triglycerides were extracted with ether compared to
more polar solvents (e.g.: toluene: ethanol: methanol, 1/1/1, v/v/v) in the study.152
The
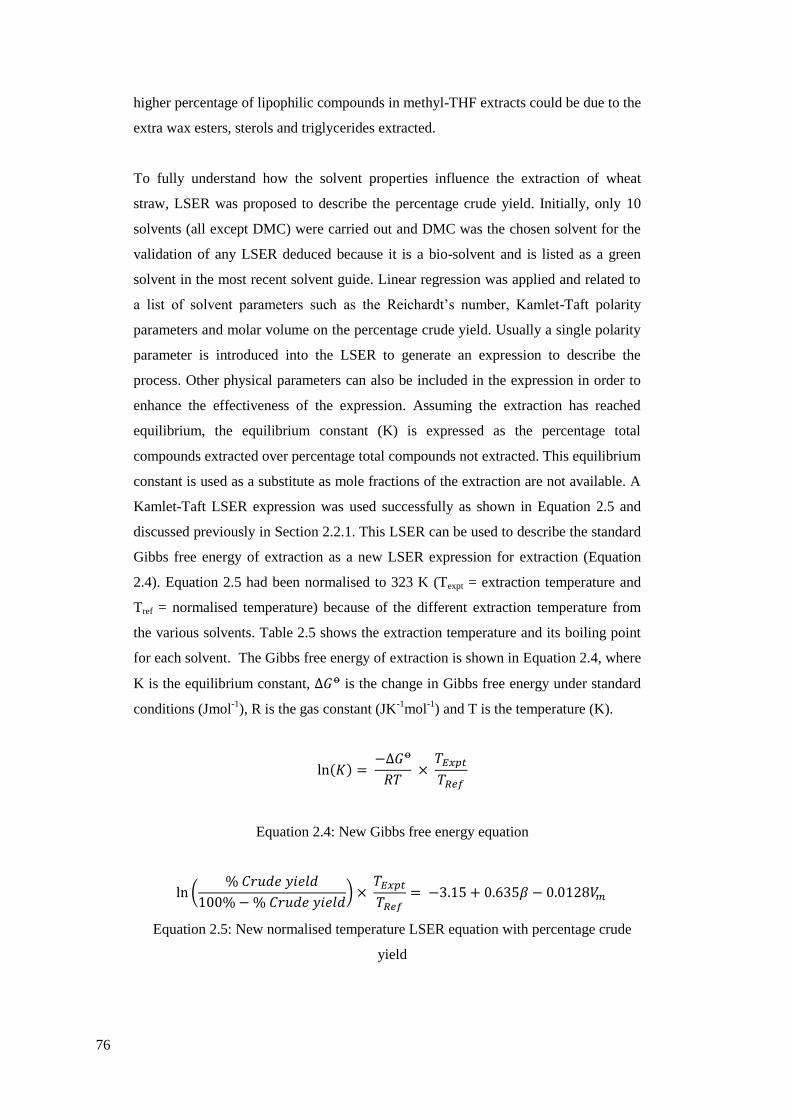
76
higher percentage of lipophilic compounds in methyl-THF extracts could be due to the
extra wax esters, sterols and triglycerides extracted.
To fully understand how the solvent properties influence the extraction of wheat
straw, LSER was proposed to describe the percentage crude yield. Initially, only 10
solvents (all except DMC) were carried out and DMC was the chosen solvent for the
validation of any LSER deduced because it is a bio-solvent and is listed as a green
solvent in the most recent solvent guide. Linear regression was applied and related to
a list of solvent parameters such as the Reichardt’s number, Kamlet-Taft polarity
parameters and molar volume on the percentage crude yield. Usually a single polarity
parameter is introduced into the LSER to generate an expression to describe the
process. Other physical parameters can also be included in the expression in order to
enhance the effectiveness of the expression. Assuming the extraction has reached
equilibrium, the equilibrium constant (K) is expressed as the percentage total
compounds extracted over percentage total compounds not extracted. This equilibrium
constant is used as a substitute as mole fractions of the extraction are not available. A
Kamlet-Taft LSER expression was used successfully as shown in Equation 2.5 and
discussed previously in Section 2.2.1. This LSER can be used to describe the standard
Gibbs free energy of extraction as a new LSER expression for extraction (Equation
2.4). Equation 2.5 had been normalised to 323 K (Texpt = extraction temperature and
Tref = normalised temperature) because of the different extraction temperature from
the various solvents. Table 2.5 shows the extraction temperature and its boiling point
for each solvent. The Gibbs free energy of extraction is shown in Equation 2.4, where
K is the equilibrium constant, is the change in Gibbs free energy under standard
conditions (Jmol-1
), R is the gas constant (JK-1
mol-1
) and T is the temperature (K).
Equation 2.4: New Gibbs free energy equation
(
)
Equation 2.5: New normalised temperature LSER equation with percentage crude
yield
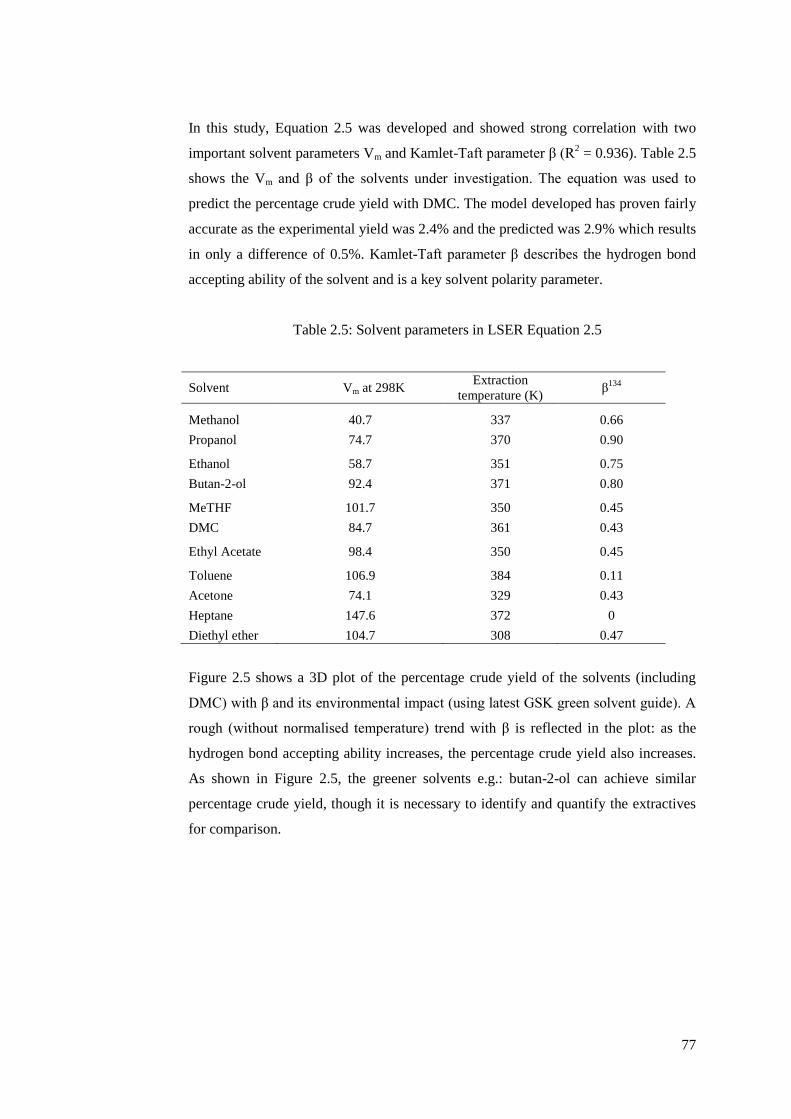
77
In this study, Equation 2.5 was developed and showed strong correlation with two
important solvent parameters Vm and Kamlet-Taft parameter β (R2 = 0.936). Table 2.5
shows the Vm and β of the solvents under investigation. The equation was used to
predict the percentage crude yield with DMC. The model developed has proven fairly
accurate as the experimental yield was 2.4% and the predicted was 2.9% which results
in only a difference of 0.5%. Kamlet-Taft parameter β describes the hydrogen bond
accepting ability of the solvent and is a key solvent polarity parameter.
Table 2.5: Solvent parameters in LSER Equation 2.5
Solvent Vm at 298K Extraction
temperature (K) β
134
Methanol 40.7 337 0.66
Propanol 74.7 370 0.90
Ethanol 58.7 351 0.75
Butan-2-ol 92.4 371 0.80
MeTHF 101.7 350 0.45
DMC 84.7 361 0.43
Ethyl Acetate 98.4 350 0.45
Toluene 106.9 384 0.11
Acetone 74.1 329 0.43
Heptane 147.6 372 0
Diethyl ether 104.7 308 0.47
Figure 2.5 shows a 3D plot of the percentage crude yield of the solvents (including
DMC) with β and its environmental impact (using latest GSK green solvent guide). A
rough (without normalised temperature) trend with β is reflected in the plot: as the
hydrogen bond accepting ability increases, the percentage crude yield also increases.
As shown in Figure 2.5, the greener solvents e.g.: butan-2-ol can achieve similar
percentage crude yield, though it is necessary to identify and quantify the extractives
for comparison.

78
Figure XXX: A 3D plot of the percentage crude yield with Kamlet-Taft polarity parameter β
and environmental impact colour categories from GSK green solvent guide1
Figure 2.5: A 3D plot of the percentage crude yield of the solvents (originally in colour)
Welton et al. shows by that using ionic liquids the anion basicity which can be
described by Kamlet-Taft parameter β correlated with the ability to expand pine
lignocellulose. The anions in ionic liquids are the most important determinant for β.158
It was also reported that the anion in ionic liquids has an impact on the ability to
dissolve cellulose.159
Wheat straw is high in lignocellulose, it comprised of 35 – 40% cellulose, 20 – 30%
hemicellulose and 8 – 15% lignin.160
It is possible that as the hydrogen bond basicity
(β) increases, the lignocellulose in the wheat straw behaves similarly to pine and
expands, therefore enabling the embedded wax in the plant cuticle to be extracted out
into the solvent. Alternative argument is that the lignocellulosic molecular structure of
the straw breaks down as β increases so the solvent molecules can penetrate through
the straw more easily therefore leading to enhanced extraction. The diffusivities of
molecules in and out of the straw would be easier hence for solvents of higher β, the
selectivity will be lower due to the extraction of other unwanted molecules e.g.: low
molecular weight carbohydrates. If the lignocellulose structure is expanded, solvent
with higher Vm will be able to reach the inner structure of the straw and more wax
molecules would be extracted as penetration through the biomass is easier. The
extraction of the epicuticular wax on the surface of straw is also inversely proportional
Heptane
Toluene
Diethyl
ether
Ethyl acetate
2-MeTHF Acetone
Ethanol
Propan-1-ol
Butan-2-ol
Dimethyl
carbonate

79
to Vm. As molar volume is the volume of one mole of solvent and the lower the Vm,
the more the solvent molecules in a specific volume so more β interactions would
occur. Both the Vm and β are cooperative and together they describe the relationship
of the solvent to solutes in wheat straw as the new LSER expression Equation 2.5.
Figure 2.6 shows a plot of experimental data and expected data from the LSER
described in Equation 2.5 and the axis represents the y term (left) of the Equation.
DMC was added onto the plot as a validation of the result and it showed that the
experimental data of DMC are similar to predicted data. This indicated that the LSER
developed can be used to predict the percentage crude yield on a wide range of
solvents with known Vm and β. To achieve highest percentage crude yield sustainably,
the solvent must have a low Vm and a high β and these parameters are usually found in
small aliphatic alcohols.
Figure 2.6: A comparison of experimental and predicted percentage crude yield (originally
in colour)
The same linear regression and normalised temperature were also applied to the
percentage aqueous yield and a similar relationship between Vm and β was identified.
Equation 2.6 shows a newly established relationship between percentage aqueous
yield with Vm and β (r2 = 0.89). DMC was also used for data validation and the
experimental and predicted data were compared. The experimental and predicted
-5.5
-5
-4.5
-4
-3.5
-3
-5.5 -5 -4.5 -4 -3.5 -3
Pre
dic
ted
dat
a
Experimental data
DMC

80
aqueous yields were 1.3% and 1.1% respectively giving only a 15% error. The
residual errors for the correlation of experimental and predicted data are calculated
using Equation 2.7. The residual error plot is shown in Figure 2.7 and the data was
evenly distributed both positively and negatively which means there is no bias
towards over or under estimation. Figure 2.8 shows a comparison of the experimental
and predicted data using the new LSER Equation 2.6.
(
)
Equation 2.6: New normalised temperature LSER equation with percentage aqueous
yield
Equation 2.7: Calculation for residual error
As a new LSER equation had been established, the percentage of aqueous soluble
components can be minimised and the selective solvents can be identified. A high Vm
and a low β parameter are required to minimise the aqueous soluble extraction which
means the selectivity of the solvent can be increased and further downstream
processing steps can be reduced.
The residual error was also calculated for the aqueous soluble yield using Equation
2.7 which is shown on Figure 2.9. The data was evenly distributed both positively and
negatively as previously which means there is no bias over or under estimation.

81
Figure 2.7: Residual error plot for experimental and predicted percentage crude yield
(originally in colour)
Figure 2.8: A comparison of experimental and predicted percentage aqueous soluble yield
(originally in colour)
-7
-6.5
-6
-5.5
-5
-4.5
-4
-3.5
-3-7 -6.5 -6 -5.5 -5 -4.5 -4 -3.5 -3
Pre
dic
ted
dat
a
Experimental data
DMC
-0.3
-0.2
-0.1
0
0.1
0.2
0.3
0 2 4 6 8 10 12
Res
idual
err
or
Solvent trials

82
Figure 2.9: Residual error plot for experimental and predicted percentage aqueous soluble
yield (originally in colour)
The same linear regression was also applied to the percentage DCM soluble yield,
however no correlation was found as expected. Both newly established LSER
equations for percentage crude yield and aqueous soluble yield have similar
coefficients for β and Vm suggesting lipophilic fraction extraction had gone to
completion as shown in Figure 2.10 (with all eleven solvents). A horizontal trend line
for the different solvents (saturation) is displayed with percentage DCM soluble yield.
It can be concluded that the same trends were observed from percentage crude yield
and aqueous yield and the newly established aqueous yield equation (Equation 2.6)
would be useful in highlighting the highly selective solvents for lipophilic fraction of
the extracts. Figure 2.10 is plotted using the values derived from linear regression and
the values used are shown in Equations 2.8, 2.9 and 2.10. Equations 2.8 and 2.9 show
strong correlation with r2 = 0.92 and 0.89 respectively.
-0.8
-0.6
-0.4
-0.2
0
0.2
0.4
0.6
0.8
1
0 2 4 6 8 10 12
Res
idual
err
or
Solvent trials

83
(
)
Figure 2.10: A comparison of DCM soluble, aqueous soluble and crude yield (originally in
colour)
(
)
Equation 2.8: LSER equation for percentage crude yield
(
)
Equation 2.9: LSER equation for percentage DCM soluble yield
(
)
Equation 2.10: LSER equation for percentage aqueous yield
y term x term
-7
-6.5
-6
-5.5
-5
-4.5
-4
-3.5
-3
-5.5 -5 -4.5 -4 -3.5 -3
y t
erm
x term
DCM soluble
Crude Aqueous soluble

84
2.4 Chemical composition identification using GC and GC-MS
Extensive research had been carried out on the characterisation of waxes from young wheat
plants and only limited composition data were found on wheat straw extracts. Sun et al.
explored the compositional differences between different solvent extractions which included
the use of solvent mixtures. Deswarte also successfully identified the different wax
components in wheat straw wax, though no quantification data were available so the relative
abundance of each compound from different solvent extractions was not compared.16
Initially, each of the extracts was analysed using GC-FID and GC-MS using the method
described in Sections 6.3.1 and 6.3.2. The GC chromatograms for all the different solvent
extractions showed similar patterns indicating that the chemical compositions are
comparable so therefore only selected extracts were analysed using GC-MS. This suggests
that the differences between the extracts are mostly due to the relative abundance of each
component present. A representative GC chromatogram of heptane wheat straw extract is
shown in Figure 2.11.
Figure 2.11: GC chromatogram of whole heptane wheat straw extract (originally in colour)
The DCM soluble extracts were also compared with the full extracts using GC. Figure 2.12
shows that the full ethanol extract consisted of highly similar components as the DCM
soluble fraction so full extracts were identified using GC-MS.
The retention index system (known as the Kovats Index) was originally developed by
Kovats in 1958 using n-paraffinic series as reference materials for gas chromatography.
Kovats used the logarithms of the retention times and identified a linearity relationship with
Solvent
Internal standard Heptane

85
ramp temperature for programmed GC. In 1963, Van Den Dool and Dec Kratz modified the
equation to also include linear temperature programmed GC. Equation 2.11 shows the
Kovats Index calculation as modified by Van Den Dool and Dec Kratz, where KI is Kovats
Index, n is the number of carbons in the smaller reference alkane, N is the number of
carbons in the larger reference alkane, tN is the retention time for larger reference alkane, tn
is the retention time for smaller reference alkane and tunknown is the retention time of the
compound of interest.
Figure 2.12: GC chromatogram of ethanol wheat straw extract (originally in colour)
The compounds in the wheat straw extracts were identified using the combination of
the fragmentation pattern from the mass spectra, NIST mass spectra library, authentic
standards and the Kovats Index.
[ (
)]
Equation 2.11: Kovats Index (KI) calculation as modified by Van Den Dool and Dec
Kratz161, 162
Solvent
Internal standard Ethanol
Solvent
Internal standard Ethanol DCM soluble fraction
86
Two different capillary columns (ZB-5HT, 30 m x 0.25 mm I. D. X 0.25 µm film
thickness, Phenomenex and ZB-5 HT, 15 m x 0.25 mm I.D. x 0.25 μm film thickness
Phenomenex) were used to analyse the wax extracts. The 15 m column was used for
the identification of larger molecules (up to 60 carbons) as these molecules would
struggle to elute off the 30 m column in a reasonable retention time. Figure 2.13
shows differences in retention times between the two columns for reference alkane
mix C12 - C60.
The NIST Library is a database of mass spectra where the chemical structures of the
different components can be predicted by the mass fragmentation. The Library was
used to search for the best possible match mass spectra which can help with the
identification. As many of the EI spectra do not show the molecular ion, FI was used
to obtain some molecular ions to confirm the identification. Calculated KI was
compared with literature KI for the calculation of the chain length of the aliphatic
molecules. The quantification of the wax components were discussed in Section 2.5.

87
C12
C18 C
24
C30
C
40
C60
C12
C18
C24
C30
C40
C50
DB-5HT, 15 m x 0.25 mm I. D. X 0.25
µm film thickness
ZB-5HT, 30 m x 0.25 mm I. D. X 0.25 µm
film thickness
Figure 2.13: Reference alkane mix analysed by two different capillary columns (originally in
colour)
2.4.1 Free fatty acids
Free fatty acids identified in wheat straw waxes by GC-MS were exclusively n-
alkanoic acids of chain length ranging from C14 – C18 with different degrees of
unsaturation which is in agreement with past literature.16, 152
Three saturated free fatty
acids were identified: tetradecanoic acid (C14:0), hexadecanoic acid (C16:0) and
octadecanoic acid (C18:0). Figure 2.15a shows the EI spectrum of hexadecanoic acid.
The other fatty acids all have a similar EI fragmentation pattern. Figure 2.15b shows
the NIST library match of hexadecanoic acid to Figure 2.15a.
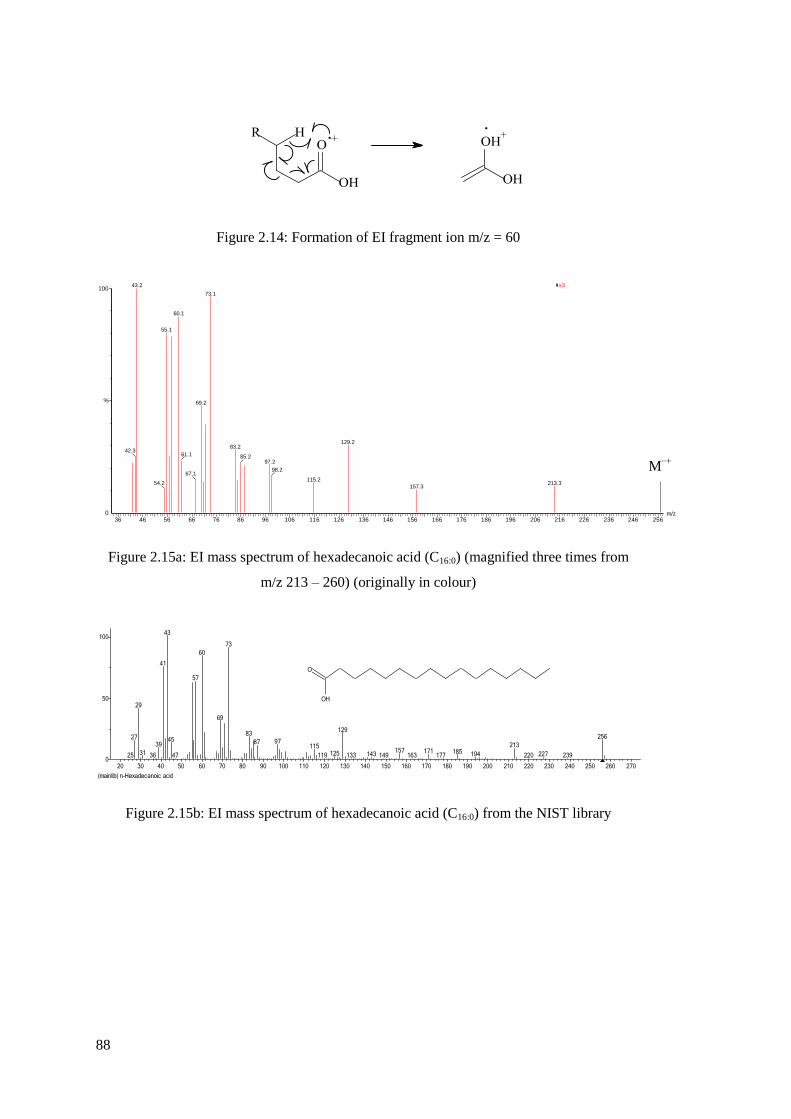
88
Figure 2.14: Formation of EI fragment ion m/z = 60
Figure 2.15a: EI mass spectrum of hexadecanoic acid (C16:0) (magnified three times from
m/z 213 – 260) (originally in colour)
Figure 2.15b: EI mass spectrum of hexadecanoic acid (C16:0) from the NIST library
, 04-Apr-2011 + 14:55:0832C 400 bar WSW SCO2
36 46 56 66 76 86 96 106 116 126 136 146 156 166 176 186 196 206 216 226 236 246 256m/z0
100
%
es157 1-4-11 2582 (20.236) Cm (2575:2613-(2641:2652+2531:2536)) Scan EI+ 3.16e6x343.2
42.3
73.1
60.1
55.1
54.2
69.2
61.1
67.1
129.283.2
85.297.2
98.2
115.2 256.5213.3
157.3
(mainlib) n-Hexadecanoic acid
20 30 40 50 60 70 80 90 100 110 120 130 140 150 160 170 180 190 200 210 220 230 240 250 260 2700
50
100
25
27
29
31 36
39
41
43
45
47
57
60
69
73
83
87 97115
119 125
129
133 143 149157
163171
177185 194
213
220 227 239
256
OH
O
M∙∙+

89
Main distinct EI fragment m/z = 60 is formed as a result of McLafferty Rearrangment
as shown in Figure 2.14. The abundant fragment ion m/z = 73 is generated through the
migration of a hydrogen atom. This fragment ion is part of the series of oxygen-
containing fragments of m/z = 45, 59, 73 and 87. Table 2.6 shows a list of fragment
ions and its percentage base peak intensity as well as calculated and published KI
values that assist in the identification.
Due to the nature of EI mass spectra, a weak molecular ion of the fatty acids is
formed, and sometimes, the ion is not detected so therefore the molecular weight was
assigned using calculated KI. Other abundant series of ions in the saturated free fatty
acids series include m/z = 43, 55, 57 and 71. This series of ions are indication of alkyl
chain with the difference of 14 mass units in the molecule as shown in Table 2.7. The
ions at m/z = 55 and 69 occur due to the elimination of two hydrogens in the alkyl
chain.
Figure 2.16: Formation of EI fragment ion m/z = 73
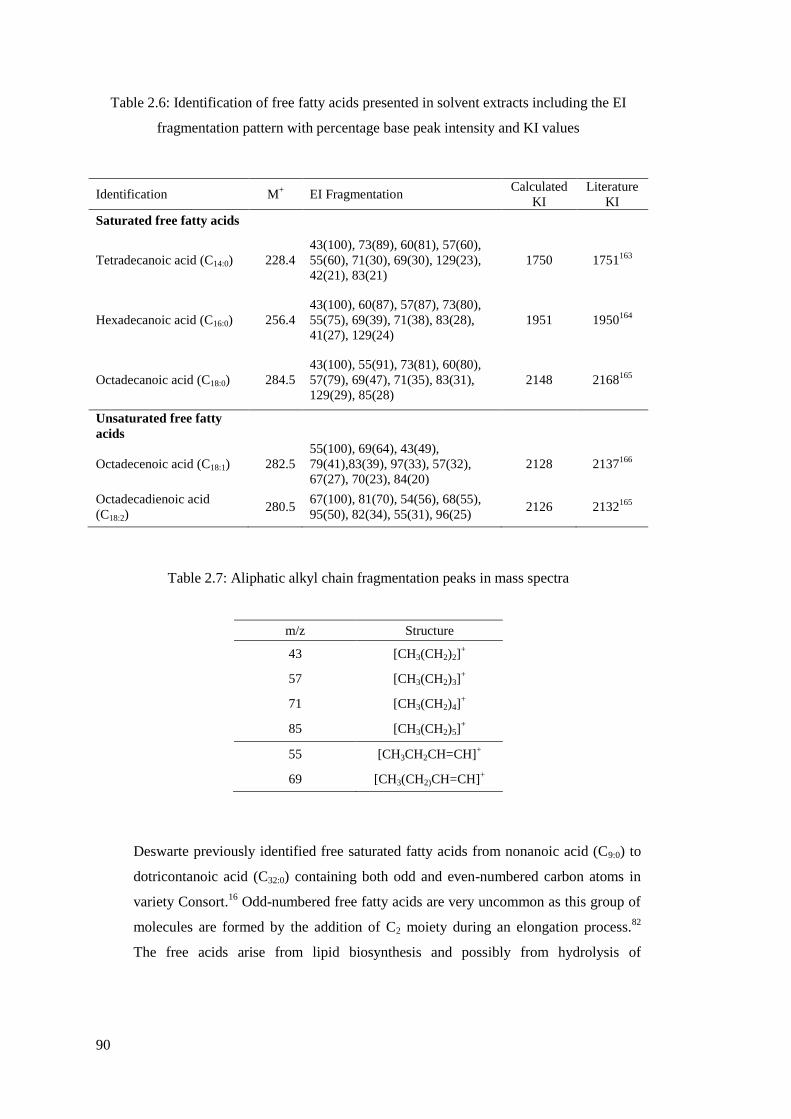
90
Table 2.6: Identification of free fatty acids presented in solvent extracts including the EI
fragmentation pattern with percentage base peak intensity and KI values
Identification M+ EI Fragmentation
Calculated
KI
Literature
KI
Saturated free fatty acids
Tetradecanoic acid (C14:0) 228.4
43(100), 73(89), 60(81), 57(60),
55(60), 71(30), 69(30), 129(23),
42(21), 83(21)
1750 1751163
Hexadecanoic acid (C16:0) 256.4
43(100), 60(87), 57(87), 73(80),
55(75), 69(39), 71(38), 83(28),
41(27), 129(24)
1951 1950164
Octadecanoic acid (C18:0) 284.5
43(100), 55(91), 73(81), 60(80),
57(79), 69(47), 71(35), 83(31),
129(29), 85(28)
2148 2168165
Unsaturated free fatty
acids
Octadecenoic acid (C18:1) 282.5
55(100), 69(64), 43(49),
79(41),83(39), 97(33), 57(32),
67(27), 70(23), 84(20)
2128 2137166
Octadecadienoic acid
(C18:2) 280.5
67(100), 81(70), 54(56), 68(55),
95(50), 82(34), 55(31), 96(25) 2126 2132
165
Table 2.7: Aliphatic alkyl chain fragmentation peaks in mass spectra
m/z Structure
43 [CH3(CH2)2]+
57 [CH3(CH2)3]+
71 [CH3(CH2)4]+
85 [CH3(CH2)5]+
55 [CH3CH2CH=CH]+
69 [CH3(CH2)CH=CH]+
Deswarte previously identified free saturated fatty acids from nonanoic acid (C9:0) to
dotricontanoic acid (C32:0) containing both odd and even-numbered carbon atoms in
variety Consort.16
Odd-numbered free fatty acids are very uncommon as this group of
molecules are formed by the addition of C2 moiety during an elongation process.82
The free acids arise from lipid biosynthesis and possibly from hydrolysis of
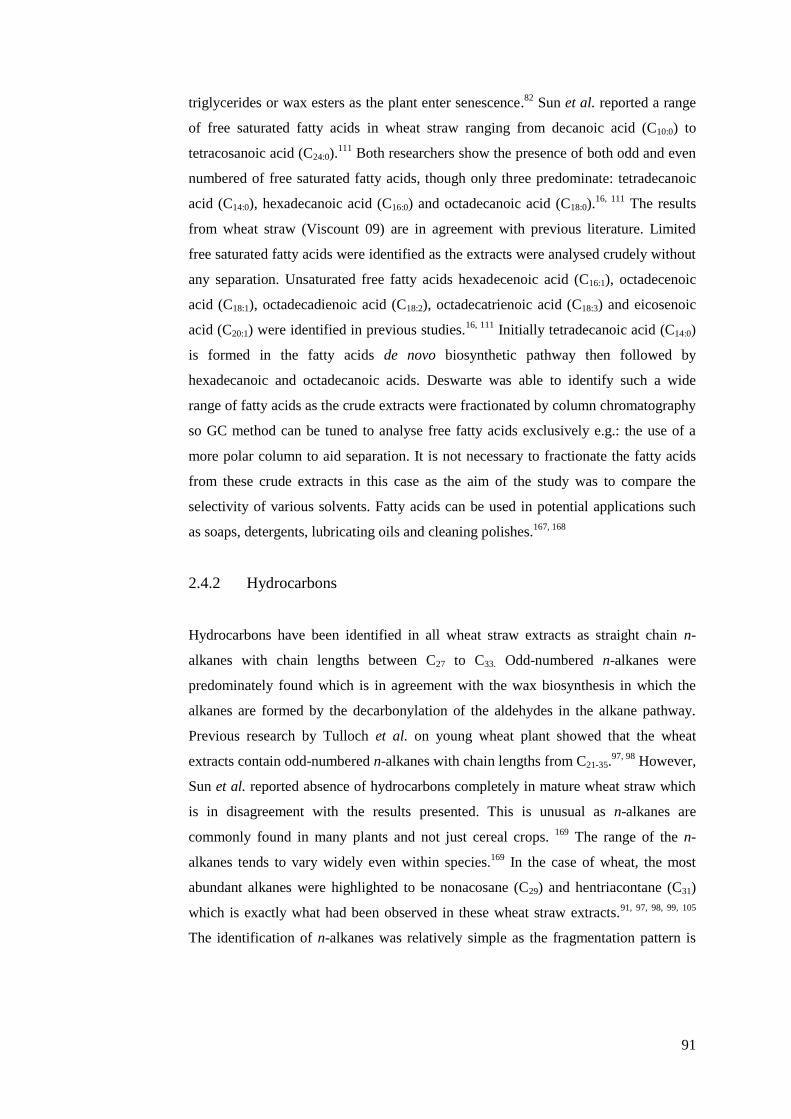
91
triglycerides or wax esters as the plant enter senescence.82
Sun et al. reported a range
of free saturated fatty acids in wheat straw ranging from decanoic acid (C10:0) to
tetracosanoic acid (C24:0).111
Both researchers show the presence of both odd and even
numbered of free saturated fatty acids, though only three predominate: tetradecanoic
acid (C14:0), hexadecanoic acid (C16:0) and octadecanoic acid (C18:0).16, 111
The results
from wheat straw (Viscount 09) are in agreement with previous literature. Limited
free saturated fatty acids were identified as the extracts were analysed crudely without
any separation. Unsaturated free fatty acids hexadecenoic acid (C16:1), octadecenoic
acid (C18:1), octadecadienoic acid (C18:2), octadecatrienoic acid (C18:3) and eicosenoic
acid (C20:1) were identified in previous studies.16, 111
Initially tetradecanoic acid (C14:0)
is formed in the fatty acids de novo biosynthetic pathway then followed by
hexadecanoic and octadecanoic acids. Deswarte was able to identify such a wide
range of fatty acids as the crude extracts were fractionated by column chromatography
so GC method can be tuned to analyse free fatty acids exclusively e.g.: the use of a
more polar column to aid separation. It is not necessary to fractionate the fatty acids
from these crude extracts in this case as the aim of the study was to compare the
selectivity of various solvents. Fatty acids can be used in potential applications such
as soaps, detergents, lubricating oils and cleaning polishes.167, 168
2.4.2 Hydrocarbons
Hydrocarbons have been identified in all wheat straw extracts as straight chain n-
alkanes with chain lengths between C27 to C33. Odd-numbered n-alkanes were
predominately found which is in agreement with the wax biosynthesis in which the
alkanes are formed by the decarbonylation of the aldehydes in the alkane pathway.
Previous research by Tulloch et al. on young wheat plant showed that the wheat
extracts contain odd-numbered n-alkanes with chain lengths from C21-35.97, 98
However,
Sun et al. reported absence of hydrocarbons completely in mature wheat straw which
is in disagreement with the results presented. This is unusual as n-alkanes are
commonly found in many plants and not just cereal crops. 169 The range of the n-
alkanes tends to vary widely even within species.169
In the case of wheat, the most
abundant alkanes were highlighted to be nonacosane (C29) and hentriacontane (C31)
which is exactly what had been observed in these wheat straw extracts.91, 97, 98, 99, 105
The identification of n-alkanes was relatively simple as the fragmentation pattern is
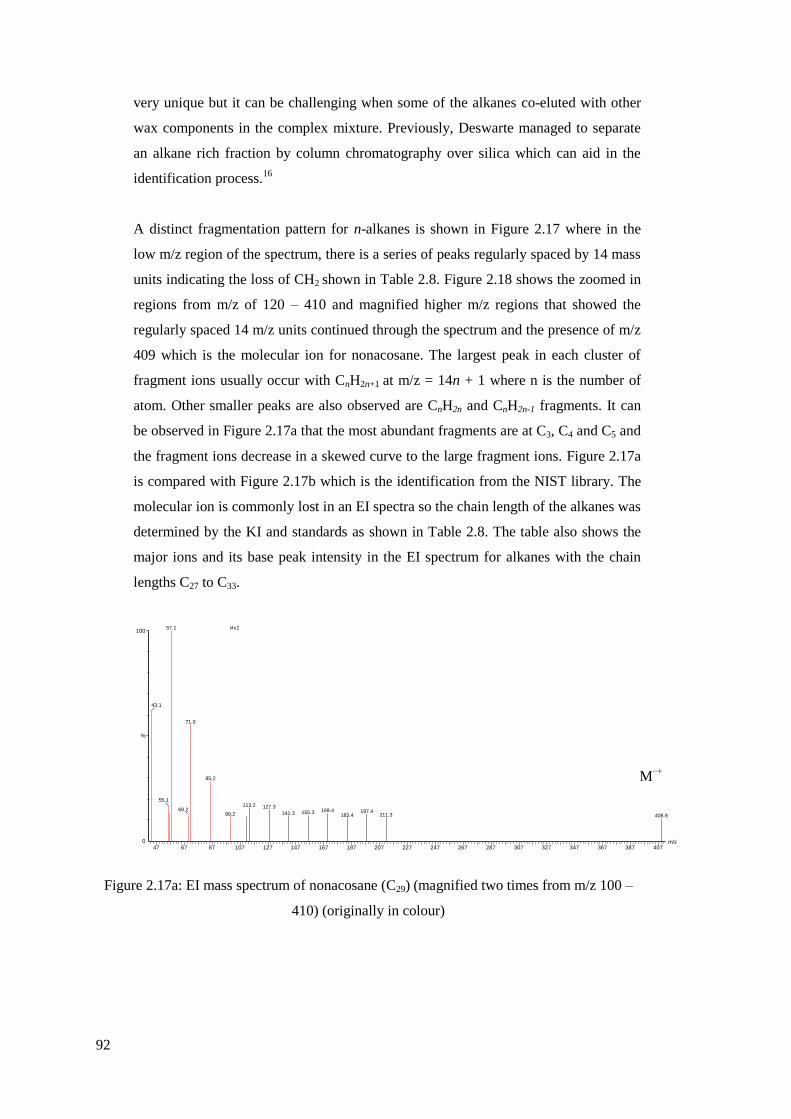
92
very unique but it can be challenging when some of the alkanes co-eluted with other
wax components in the complex mixture. Previously, Deswarte managed to separate
an alkane rich fraction by column chromatography over silica which can aid in the
identification process.16
A distinct fragmentation pattern for n-alkanes is shown in Figure 2.17 where in the
low m/z region of the spectrum, there is a series of peaks regularly spaced by 14 mass
units indicating the loss of CH2 shown in Table 2.8. Figure 2.18 shows the zoomed in
regions from m/z of 120 – 410 and magnified higher m/z regions that showed the
regularly spaced 14 m/z units continued through the spectrum and the presence of m/z
409 which is the molecular ion for nonacosane. The largest peak in each cluster of
fragment ions usually occur with CnH2n+1 at m/z = 14n + 1 where n is the number of
atom. Other smaller peaks are also observed are CnH2n and CnH2n-1 fragments. It can
be observed in Figure 2.17a that the most abundant fragments are at C3, C4 and C5 and
the fragment ions decrease in a skewed curve to the large fragment ions. Figure 2.17a
is compared with Figure 2.17b which is the identification from the NIST library. The
molecular ion is commonly lost in an EI spectra so the chain length of the alkanes was
determined by the KI and standards as shown in Table 2.8. The table also shows the
major ions and its base peak intensity in the EI spectrum for alkanes with the chain
lengths C27 to C33.
Figure 2.17a: EI mass spectrum of nonacosane (C29) (magnified two times from m/z 100 –
410) (originally in colour)
, 04-Apr-2011 + 14:55:0832C 400 bar WSW SCO2
47 67 87 107 127 147 167 187 207 227 247 267 287 307 327 347 367 387 407m/z0
100
%
es157 1-4-11 4003 (29.720) Scan EI+ 7.65e7x2 x4 x10 x1257.1
43.1
55.1
71.0
69.2
85.2
113.2
99.2
127.3169.4155.3141.3 197.4
183.4 211.3 408.8
M∙∙+

93
Figure 2.17b: EI mass spectrum of nonacosane (C29) from the NIST library
Table 2.8: Identification of n-alkanes presented in solvent extracts including the EI
fragmentation pattern with percentage base peak intensity and KI values
Identification M+ EI Fragmentation Calculated KI Literature KI
n-Alkanes
Heptacosane (C27) 380.7
57(100), 43(81), 71(62),
85(41), 55(35), 69(27),
56 (23)
2685 2700161
Nonacosane (C29) 408.8 57(100), 71(69), 43(59),
85(36), 55(25), 56(20) 2884 2900
161
Hentriacontane (C31) 436.9 57(100), 71(72), 43(68),
85(39), 55(22), 56(21) 3083 3100
161
Triatriacontane (C33) 464.9 57(100), 43(55), 71(49),
85(34), 55(28) 3282 3300
161
Due to these long hydrocarbon chain structures, hydrocarbons are very hydrophobic
and can be used to replace existing paraffin waxes and various coatings
applications.170
This distinct group of odd-numbered alkanes have been reported to be
involved with semiochemical functions on different insects.171, 172, 173
Semiochemicals
(from Greek simeon as “a mark or signal”) are biochemical compounds that contain
“messages” which are used by insects and other organisms to communicate and these
chemicals can be divided into two groups: pheromones and allelochemics.174
Pheromone (from Greek phereum as “to carry” and horman as “to stimulate”)
involved in intraspecific interactions and allelochemics (from Greek allelon as “one
another” involved in interspecific interactions.174
In 2009, Tina Han (student in green
chemistry group) separated a high alkane fraction and carried out aphid control tests in
collaboration with Rothamsted Research. It was concluded that the alkane fraction in
wheat straw wax can be used as an effective aphid semiochemical.
(mainlib) Nonacosane
20 30 40 50 60 70 80 90 100 110 120 130 140 150 160 170 180 190 200 210 220 230 240 250 260 270 280 290 300 310 320 330 340 350 360 370 380 390 400 410 4200
50
100
29
43
57
71
85
99113
127 141 155 169 183 197 211 225 239 253 267 281 295 309 323 337 351 365 378408

94
2.4.3 Free fatty alcohols
Free fatty alcohols of exclusively n-alkanols with chain lengths from C20 to C30 in
wheat waxes in young plants have been extensively reported in the literature. 91, 98, 99
Octacosanol (C28) was defined as the most abundant homologue in young wheat
plants. 91, 98, 99
The range of free fatty alcohols identified in the young plants is in
agreement with the composition in wheat straw extracts carried out by Deswarte.
Deswarte identified n-alkanols with chain length from C22 to C34 in wheat straw after
fractionation. Only octacosanol (C28) was identified in the wheat straw in the crude
extracts and in many cases, there is co-elution of octacosanol (C28) with
hentriacontane (C31) which made identification more difficult. Fractionation of free
fatty acids appeared to be an important step for identification and quantification.
Figure 2.18a shows an EI spectrum for octacosanol (C28) which is compared with the
EI spectrum from the NIST library (Figure 2.18b). As EI is a relatively harsh
ionisation technique, molecular ions are rarely observed so in order to calculate the
number of carbons in the aliphatic chain, the KI was calculated and compared with
literature value. The octacosanol standard was also analysed to confirm the
identification. Table 2.9 shows the fragments and its percentage base peak intensity
and from both Figure 2.19 and Table 2.9, the fragmentation pattern appeared to be
extremely similar to standard n-alkanes. The regular pattern of 14 mass units
differences indicated the progressive loss of CH2 meaning there is no unsaturation in
the molecule and the assignment for the aliphatic alkyl chain is shown in Table 2.7.
Due to the harsh ionisation technique used, most of the time, the larger ions are
fragmented and therefore have low peak intensity and for this reason the region
around the molecular ion was magnified as shown in Figure 2.18a. Sometimes a
distinct prominent peak of [M – 18]+ can be observed from the loss of water. The loss
of the H2O occurs when a δ-hydrogen is lost as shown in Figure 2.20 and in the case
of octacosanol (C28), a fragment ion of m/z = 393 would be observed. As well as just
the elimination of water, the elimination of alkene from primary fatty alcohols also
tends to happen which will result in a peak of [M – 18 – 28]+. Octacosanol (C28)
would show a peak at m/z = 364 which represents the elimination processes shown in
Figure 2.20.

95
Figure 2.18a: EI mass spectrum of octacosanol (C28) (magnified five times from m/z 126 –
410) (originally in colour)
Figure 2.18b: EI mass spectrum of octacosanol (C28) from the NIST library
Table 2.9: Identification of octacosanol in solvent extracts including the EI fragmentation
pattern with percentage base peak intensity and KI values
Octacosanol is not just an ordinary component identified on plant waxy surfaces as it
has many nutritious and health benefits such as cholesterol lowering effects, anti-
aggregatory properties, cytoprotective uses and ergogenic properties.176
Due to the
(mainlib) Octacosanol
10 20 30 40 50 60 70 80 90 100 110 120 130 140 150 160 170 180 190 200 210 220 230 240 250 260 270 280 290 300 310 320 330 340 350 360 370 380 390 400 410 4200
50
100
17
29
43
57
69
83 97
111
125
139153 167 181 195 209 223 237 251 265 279 293 308 321 335 348
364
392
409
HO
Identification M+ EI Fragmentation Calculated KI Literature KI
Free fatty alcohol
Octacosanol (C28) 410.8
57(100), 43(82), 55(76),
97(65), 69(64), 83(57),
71(50), 56(39), 111(30),
85(27)
3083 3118175
, 04-Apr-2011 + 16:10:0450C 350 bar WSW SCO2
45 65 85 105 125 145 165 185 205 225 245 265 285 305 325 345 365 385 405m/z0
100
%
es110 1-4-11 4255 (31.403) Cm (4253:4256-(4221:4241+4272:4298)) Scan EI+ 4.40e7x5 x10 x15057.1
55.1
43.1
97.2
83.2
69.1
68.2
67.2
82.2
81.2
85.2
96.2
95.2
139.3111.2
126.3
125.3138.3
153.3
140.3 390.6181.4167.3 195.3
[M – 18]+

96
low amount that is actually ingested, policosanol (natural mixture of primary fatty
alcohols) containing mainly octacosanol has been made into dietary supplements.177
Policosanols supplied derived from sugarcane wax, grasses, cereal grains and
beeswax.178
There has been much research on the extraction of wheat leaf wax and the
isolation of octacosanol. In 1933, Pollard et al. first reported the isolation of
octacosanol from wheat wax and Tulloch et al. also identified this valuable group of
molecules in young wheat plants.97, 179
Dunford et al. have studied the policosanol
composition in many wheat grains of different varieties and have identified a
policosanol range with chain lengths from C20 to C30, predominantly tetracosanol (C24)
and hexacosanol (C26).180
The data reported for wheat grains are different to wheat
straw where octacosanol (C28) is the predominant fatty alcohol. Different fractions of
the wheat grain have also been investigated and wheat bran has been highlighted as
the highest policosanol containing fraction which shows that the level of policosanols
vary between different parts of the wheat plant.180
Figure 2.20: Formation of EI fragment ion m/z = 393 and m/z = 365 for octacosanol (C28)
2.4.4 Aldehydes
Aldehydes have also been previously identified and in this particular variety of wheat,
only the aldehyde octacosanal (C28) was identified which is in agreement with the
biosynthetic route.82
Aldehydes are the intermediates between alcohols and fatty acids
precursors and as octacosanol (C28) is the only fatty alcohol identified, this suggests
that the octacosanal (C28) may be present due to partial oxidation of the alcohol.82
Aldehydes can be used as flavourings but many have reported that aldehydes are only
minor constituents in wheat extracts.16, 98, 99, 181
A few have also reported a complete
absence of aldehydes in the extracts which means that any purification steps for
applications exclusively for aldehydes will probably be not viable.111, 152
Figure 2.21
shows the EI mass spectrum of octacosanal (C28) and in this case molecular ion was
not observed due to the harsh EI ionisation technique used for analysis but when the

97
region was magnified, the [M – 18]+ ion can be observed. The fragmentation pattern
for aliphatic aldehydes are very similar to aliphatic primary fatty alcohols as both
compounds would undergo a dehydration step giving [M – 18]+ ion. The fragment ion
of [M – 28]+ ion can also be observed due to the loss of CO with aliphatic aldehydes
but not primary fatty alcohols. Other characteristic ions [M – 1]+, [M – 29]
+ and [M
– 44]+ might be observed due the cleavage of the C – H bond and cleavage of C – C
bond to release just the functional group CHO and CH3CHO respectively as shown in
Figure 2.22.
Figure 2.21: EI mass spectrum of octacosanal (C28) (magnified five times from m/z 125 –
410) (originally in colour)
Figure 2.22: Mass fragment ion of aliphatic aldehyde (originally in colour)
A softer FI technique was used for the mass spectrometry to give less fragmentation is
shown in Figure 2.24 to confirm the identification.
, 04-Apr-2011 + 16:10:0450C 350 bar WSW SCO2
45 65 85 105 125 145 165 185 205 225 245 265 285 305 325 345 365 385 405m/z0
100
%
es110 1-4-11 4180 (30.902) Cm (4176:4184-(4195:4205+4149:4168)) Scan EI+ 9.25e6x5 x10 x20 x5057.1
43.1
55.1
44.1
82.2
71.1
68.1
81.2
96.2
83.2
95.2
85.2
97.2137.4
125.3
109.2
124.3
390.8
152.3 362.7166.3 180.3 250.5194.4
[M - 44]+
[M - 29]+
[M - 1]+
M∙∙+

98
Figure 2.23: Formation of mass fragment ion m/z = 390
Figure 2.24: FI mass spectrum of octacosanal (C28)
The molecular ion and fragment ion [M – 18]+ can be identified for octacosanal. The
[M – 18]+ ion corresponds to the loss of water as shown in Figure 2.23. The extra
information gathered from the FI mass spectrum confirmed the identification of
aliphatic aldehyde and the number of carbons on the alkyl chain. Table 2.10 shows the
EI fragment ions with the percentage base peak and the calculated KI but
unfortunately, there are no published literature KI for comparison. The base peak ion
is a result of a combination of fragment ion from the alkyl chain [CH3(CH2)3]+ and
McLafferty rearrangement and then followed by an α-cleavage as shown in Figure
2.25.
ES42C
m/z40 60 80 100 120 140 160 180 200 220 240 260 280 300 320 340 360 380 400 420 440 460 480 500 520 540 560 580 600 620 640 660 680 700 720 740
%
0
100
jhc33880es 1139 (30.551) Cm (1137:1140-1108:1128) TOF MS FI+ 915390.3840
362.333743.0525278.2418
56.052292.0673
349.3183292.1996
391.3902
408.4234
409.4237
410.4205
411.3571
M∙+
[M – 18]+
390.4
391.4
408.4
409.4

99
Table 2.10: Identification of octacosanal in solvent extracts including the EI fragmentation
pattern with percentage base peak intensity and calculated KI
Identification M+ EI Fragmentation Calculated KI
Aldehyde
Octacosanal 408.7
57(100), 43(99), 82(97), 55(66),
96(63), 69(57), 71(52), 83(51),
81(48), 97(45)
3024
Figure 2.25: Formation of base peak ion m/z = 57 for aliphatic aldehydes
2.4.5 Wax Esters
Wax esters are one of the most important groups of molecules found in plant waxes as
the high molecular weight molecules have many valuable applications such as
cosmetics, hard wax polishes, lubricants, coatings and plasticisers.182
Structures of
wax esters in wheat are derived from esterification of saturated primary even-
numbered chain fatty alcohol and fatty acids to give the ester chain lengths from C40
to C56. The analysis of high molecular weight compounds using GC-FID and GC-MS
is difficult because of the low volatility so wax esters are usually analysed by
hydrolysis of the wax esters into fatty alcohols and fatty acids. The benefit is that this
would ensure that all the high molecular weight wax esters are eluted off the column
although the original wax ester structures are lost. To combat this problem, the wheat
straw wax extracts were analysed using a shorter column (DB-5HT, 15 m x 0.25 mm
I. D. X 0.25 µm film thickness) as described in Section 6.3.1 for the identification of
the wax esters. The method enabled carbon chain lengths of up to 60 with the KI of
6000 to be analysed. Figure 2.26 shows the GC chromatogram of the identified wax
esters from wheat straw wax. The trace displays that even- numbered saturated wax
esters predominately found in wheat straw wax tend to consist of hexadecanoic acid

100
(C16:0) and octacosanol (C28). These two compounds were identified as a “free” form
in the extracts which is in agreement with the biosynthetic pathway of wax esters.82
Figure 2.26: GC chromatogram of wheat straw wax esters (originally in colour)
As can be observed from Figure 2.26, the most abundant wax ester is octacosanyl
hexadecanoate (C28:C16). The EI mass spectrum of octacosanyl hexadecanoate
(C28:C16) as a representative of the saturated wax ester group is shown in Figure 2.28.
A small molecular ion is observed and distinct characteristic ion of [R2CO2H2]+ was
generated by the β-cleavage at the oxygen on the ester group and McLafferty
rearrangement with double hydrogen transfer which is shown in Figure 2.27. In the
case of hexadecanoate esters, the fragment ion [R2CO2H2]+ with m/z = 257 is
generated and sometimes this is the base peak ion. Figure 2.27 also shows that another
important ion of [R2CO2H]+ could also be identified and is also believed to be
generated by McLafferty rearrangement. Weak ions of [R1CO2]+ and [R1 – 1]
+
arising from the fatty alcohol moiety can sometimes be observed. Table 2.11 shows a
list of distinct characteristic fragment ion for the even-numbered wax esters identified.
Other fragment ions found in a long chain aliphatic wax ester have a regularly spaced
14 m/z units apart and this is due to the long alkane chain and the corresponding ions
are identified in Table 2.7.
Even-numbered wax esters
Odd-numbered wax esters
Unknown wax esters
C24
:C16
C26
:C16
C28
:C18
C28
:C16
C28
:C20
C28
:C22
C28
:C24
C
28:C
26
C28
:C28

101
Figure 2.27: Formation of EI fragment ions m/z = 393, 257 and 256 for octacosanyl
hexadecanoate (C28:C16)
Figure 2.28: EI mass spectrum of octacosanyl hexdecanoate (C28:C16) (magnified four times
from m/z 600 – 650) (originally in colour)
Table 2.11 shows a list of saturated wax esters identified, corresponding EI
fragmentation and percentage base peak intensity. It was apparent from the KI that it
, 04-Apr-2011 + 16:10:0450C 350 bar WSW SCO2
42 62 82 102 122 142 162 182 202 222 242 262 282 302 322 342 362 382 402 422 442 462 482 502 522 542 562 582 602 622 642m/z0
100
%
es110 1-4-11 5801 (41.722) Cm (5798:5806-(5751:5773+5833:5934)) Scan EI+ 9.68e6x4057.1
43.1
55.1
71.1 83.1
257.597.2
111.2
98.2125.2
649.1
M∙+

102
is a series of wax esters with increasing two carbons in chain length. However, the
difficulties of identifying the exact structure arise as the observed molecular ions are
very weak so therefore the distinct fragment ion [R2CO2H2]+ was used to identify the
length of the fatty acid moiety. The chain length of the fatty alcohol can be calculated
by the known fatty acid chain length so therefore the wax esters can be identified.
All the wax esters identified in wheat straw are saturated which is in agreement with
literature.16, 111, 152
Limited identification work had been carried out on the wax esters
due to the high molecular weight so therefore only Deswarte had managed to also
identify wax esters of up to C56. As shown in Figure 2.26, odd-numbered aliphatic
esters were also found in the wheat straw waxes. It was reported that odd chain wax
esters found in barley had carbon chains in the range C31 - C37 where the alcohol
moieties are secondary alcohols of C11 - C17 and wheat straw waxes may possess the
same homologous series.183
Odd-numbered wax esters in wheat straw have also
previously been reported by Deswarte.16

103
Table 2.11: Identification of wax esters in solvent extracts including EI fragmentation
pattern with percentage base peak intensity and calculated KI
Identification M+ EI Fragmentation Calculated KI
Wax esters
Tetracosanyl hexadecanoate
(C24:C16) 592.6
43(100), 57(88), 69(64), 55(59),
71(58), 83(44), 97(43), 68(34),
85(30), 56(29),
4137
Hexacosanyl hexadecanoate
(C26:C16) 620.6
57(100), 43(83), 69(67), 71(64),
55(61), 97(55), 83(55), 85(37),
257(34), 70(30)
4335
Octacosanyl hexdecanoate
(C28:C16) 648.7
57(100), 43(82), 71(65), 69(62),
83(54), 55(54), 97(49), 85(30),
111(27), 70(27)
4513
Octacosanyl octadecanoate
(C28:C18) 676.7
57(100), 43(80), 71(70), 69(61),
83(53), 55(50), 97(49), 85(31),
70(28), 111(26)
4699
Octacosanyl eicosanoate
(C28:C20) 704.7
57(100), 43(69), 71(61), 83(51),
69(51), 97(47), 55(45), 85(33),
70(27), 111(25)
4953
Octacosanyl docosanoate
(C28:C22) 732.8
57(100), 43(78), 71(70), 69(58),
83(53), 55(52), 97(47), 85(34),
82(28), 111(26)
-
Octacosanyl tetracosanoate
(C28:C24) 760.8
57(100), 43(76), 71(64), 69(57),
55(50), 83(46), 97(43), 85(32),
73(30), 96(30)
-
Octacosanyl hexacosanoate
(C28:C26) 788.8
57(100), 43(78), 71(54), 83(46),
96(46), 97(43), 55(40), 85(36),
70(27), 73(26)
-
Octacosanyl octacosanoate
(C28:C28) 816.9
57(100), 71(68), 43(46), 83(43),
97(40), 85(34), 55(33), 111(25),
70(23)
-
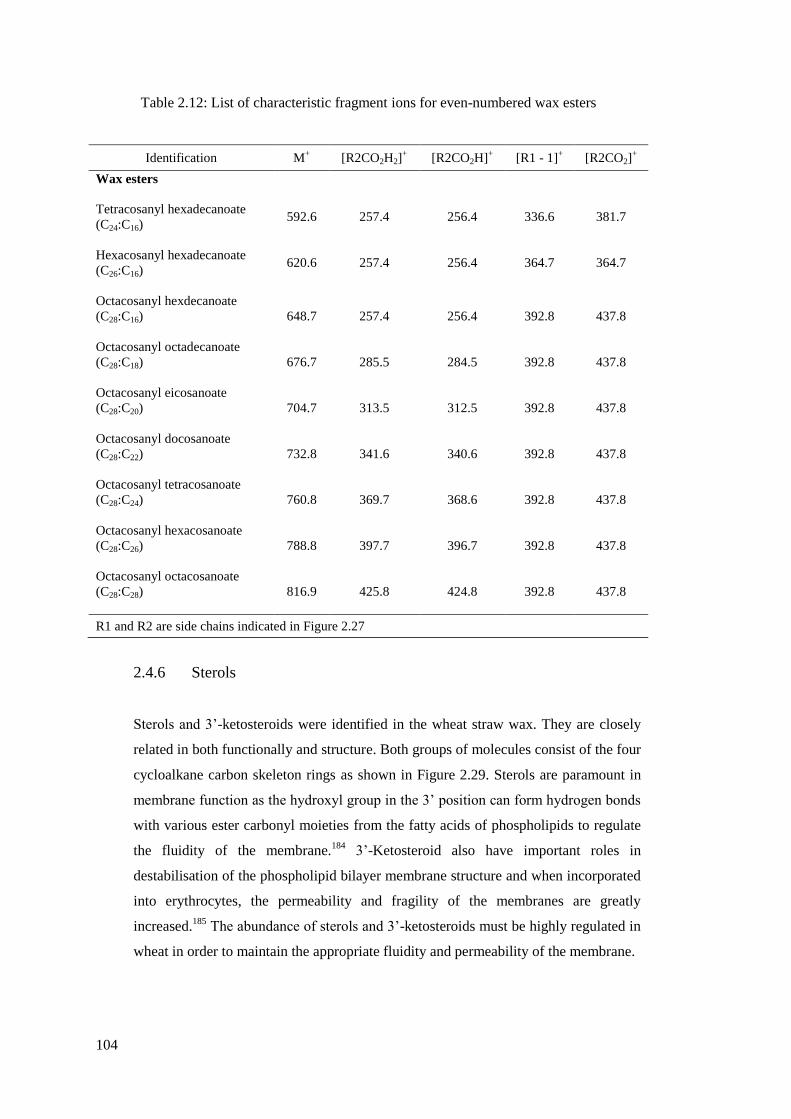
104
Table 2.12: List of characteristic fragment ions for even-numbered wax esters
Identification M+ [R2CO2H2]
+ [R2CO2H]
+ [R1 - 1]
+ [R2CO2]
+
Wax esters
Tetracosanyl hexadecanoate
(C24:C16) 592.6 257.4 256.4 336.6 381.7
Hexacosanyl hexadecanoate
(C26:C16)
620.6 257.4 256.4 364.7 364.7
Octacosanyl hexdecanoate
(C28:C16)
648.7 257.4 256.4 392.8 437.8
Octacosanyl octadecanoate
(C28:C18)
676.7 285.5 284.5 392.8 437.8
Octacosanyl eicosanoate
(C28:C20)
704.7 313.5 312.5 392.8 437.8
Octacosanyl docosanoate
(C28:C22)
732.8 341.6 340.6 392.8 437.8
Octacosanyl tetracosanoate
(C28:C24)
760.8 369.7 368.6 392.8 437.8
Octacosanyl hexacosanoate
(C28:C26)
788.8 397.7 396.7 392.8 437.8
Octacosanyl octacosanoate
(C28:C28)
816.9 425.8 424.8 392.8 437.8
R1 and R2 are side chains indicated in Figure 2.27
2.4.6 Sterols
Sterols and 3’-ketosteroids were identified in the wheat straw wax. They are closely
related in both functionally and structure. Both groups of molecules consist of the four
cycloalkane carbon skeleton rings as shown in Figure 2.29. Sterols are paramount in
membrane function as the hydroxyl group in the 3’ position can form hydrogen bonds
with various ester carbonyl moieties from the fatty acids of phospholipids to regulate
the fluidity of the membrane.184
3’-Ketosteroid also have important roles in
destabilisation of the phospholipid bilayer membrane structure and when incorporated
into erythrocytes, the permeability and fragility of the membranes are greatly
increased.185
The abundance of sterols and 3’-ketosteroids must be highly regulated in
wheat in order to maintain the appropriate fluidity and permeability of the membrane.

105
Figure 2.29: Four cycloalkane carbon skeleton rings found in sterols and 3’-
ketosteroids
Sterols such as stigmasterol, campesterol and β-sitosterol were identified in wheat
straw wax and these compounds are structurally similar as they are all derived from β-
sitosterol.82
These are three predominant cereal phytosterols that have been identified
in wheat and other cereal crops such as barley and oat in previous studies.186, 187
Cholesterol, ergosterol, and stigmastanol were also identified in wheat straw but these
phytosterols were not found in the organic solvent extracts. 16, 111, 152
Phytosterols have
been reported to be found in other wheat by-products such as wheat bran and germ.69
As well as the three common sterols, brassicasterol, avenasterol and campestanol were
also identified in the wheat by-products.69
The wheat straw wax extracts were
analysed directly without further purification and fractionation so there is a chance
that the sterols may co-elute with other wax components as the extracts consist of
many compounds of around 30 carbons. Phytosterols are an important class of
compounds and have nutritional benefits and are used as food supplements for
reducing blood cholesterol level.188, 189
As highlighted previously, polycosanols are
capable of reducing blood cholesterol level even though the mode of action for both
phytosterols and policosanols are very different. Policosanols can lower total and LDL
cholesterol by inhibition of cholesterol synthesis from activation of AMP kinase.190
Phytosterols reduce the total and HDL cholesterol level by minimising intestinal
cholesterol absorption and increase faecal excretion of cholesterol.191, 192
Due to the
different lowering cholesterol mechanisms, it had been reported that a combination of
both policosanols and phytosterols can give an enhanced effect.193, 194
However, Jones
A B
C D1
2
3
4
5
6
7
8
910
19
11
12
13
14 15
16
17
18

106
et al. showed that there is not a significant amount of benefit when both of these
groups of molecules are applied together in hamsters.195
Extensive research has taken
place in order to find new potential sources and to separate these high value sterols.69,
196 It would be interesting to fractionate the phytosterols and policosanols and test for
cholesterol lowering effects. Previous studies indicated that sterols can also exist as
bound forms such as steryl esters within wheat straw however, no steryl esters were
found in this case.183
Figure 2.30: Structures of sterols present in wheat straw wax
The three predominant sterols were identified using a combination of NIST library
2008, standard compounds, EI fragmentation pattern and published KI data. The EI
mass spectrum of stigmasterol is shown in Figure 2.31a which is compared with the
EI spectrum from the NIST library (Figure 2.31b). Other sterols have a similar
fragmentation pattern and the molecular ion is weak but can be observed which is
extremely useful when distinguishing between different sterols.
The ion m/z = 57 forms from the β-cleavage of the ring, followed by the formation of
a diene. Characteristic ion m/z = 357 for β-sitosterol followed the same β-cleavage of
the ring then a hydrogen migration occurred to give a 3-rings ion. Sterols can also
undergo the cleavage of three rings giving a stable tertiary cation m/z = 272. The 3’
OH group on the sterols can also undergo a dehydration step with carbon 4 on ring A
giving a stable conjugated cation as indicated in Figure 2.32.
β-Sitosterol Stigmasterol Campesterol

107
Figure 2.31a: EI mass spectrum of stigmasterol (magnified two times from m/z 400 – 415)
(originally in colour)
Figure 2.31b: EI mass spectrum of stigmasterol from the NIST library
Table 2.13 shows the characteristic fragment ions for the three important sterols in
wheat straw. A total of five sterols are found in the wheat straw wax but sterol 1 and 2
were not identified as it is not present in all the different solvent extracts. The
presence and relative abundance of sterols between various solvent extracts are
discussed in Section 2.5.7.
, 04-Apr-2011 + 16:10:0450C 350 bar WSW SCO2
40 60 80 100 120 140 160 180 200 220 240 260 280 300 320 340 360 380 400m/z0
100
%
es110 1-4-11 4536 (33.278) Cm (4532:4541-4711:4727) Scan EI+ 2.32e6x243.1
41.4
55.1
107.257.2
95.281.167.2
79.1
69.1
85.2
97.1
145.3
121.3131.2
143.2
159.2
147.3
149.2
213.3161.2
173.3
199.3
255.5
231.4 329.5303.5 414.7396.7
(mainlib) Stigmasterol
10 20 30 40 50 60 70 80 90 100 110 120 130 140 150 160 170 180 190 200 210 220 230 240 250 260 270 280 290 300 310 320 330 340 350 360 370 380 390 400 410 4200
50
100
15
29
43
55
6983
91 105
119
133145 159
173185 199
213
229 241
255 271
285
300
314 327 336
351369 379 397
412
HO
M∙∙+

108
Figure 2.32: Fragmentation of a sterol to give characteristic mass ions
Figure 2.33: Dehydration step of a sterol to give characteristic ion

109
Table 2.13: List of characteristic fragment ions for sterols
Identification M+ [M - H2O]
+ [M - CH3]
+ [M - R - OH]
+
[M - C1,
C3 - OH]+
[C1, C3 + OH]+
Sterols
Campesterol
400.7 382.7 385.7 255.2 343.3 57.0
Stigmasterol
412.7 394.7 397.7 255.2 355.3 57.0
β-Sitosterol 414.7 396.7 399.7 255.2 357.3 57.0
An interesting 3’-ketosteroid was identified in wheat which is in contradiction to all
the previous studies on both plants and straw.16, 87, 97, 98, 99, 103, 152
The 3’-ketosteroid
found was confirmed to be ∆4-sitosten-3-one using a combination of the EI
fragmentation pattern in Figure 2.35, the molecular ion information from the FI mass
spectrum in Figure 2.36 and the NIST library 2008. The EI fragment ions and peak
intensities are shown in Table 2.14. The base peak ion m/z = 124 is generated by two
different mechanisms as shown in Figure 2.37. One of which is the fission of the
carbon 9 – 10 bond with the cation remaining on carbon 5 then followed by the
migration of hydrogen on carbon 11 (left mechanism). Alternatively, the base peak
ion can be generated by the migration of two hydrogen atoms from carbon 11 and 6 so
the charge remains on the oxygen (right mechanism). This base peak ion is unique and
characteristic of a ∆4-sterone. Other important fragment ions include m/z = 149 which
is the consequence of the fission of the 9 – 10 bond which is similar to the generation
of m/ z = 124 shown in the left mechanism. Both proposed mechanisms for the
generation of m/ z = 149 ion involve the migration of a hydrogen atom on carbon 8.
On the left mechanism, the formation of m/z = 149 ion is driven by the fission of the
allylically labilised carbon 6 – 7 bond whereas the right mechanism is driven by the
formation of the ionised carbon 8 – 9 bond. In Figure 2.38, a mechanism for the
formation of m/z = 230 ion was proposed, this ion was not observed initially but the
ion can be found when the higher m/z region was magnified. The fragment ion is
formed by a four-membered ring formation in ring A of the steroid skeleton.

110
Figure 2.35: EI mass spectrum of ∆4-sitosten-3-one (magnified two times from m/z 230 –
415) (originally in colour)
Figure 2.36: FI mass spectrum of ∆4-Sitosten-3-one
, 04-Apr-2011 + 16:10:0450C 350 bar WSW SCO2
44 64 84 104 124 144 164 184 204 224 244 264 284 304 324 344 364 384 404m/z0
100
%
es110 1-4-11 4690 (34.305) Cm (4684:4695-4658:4676) Scan EI+ 3.26e6x3124.2
43.1
41.4
55.1
95.257.2
81.1
69.2
67.1
71.2
93.2
85.2
107.2
97.1
123.3
119.2
207.2
147.2
135.2
137.2
149.2
229.4289.5
253.3271.5
282.3
412.7327.4
370.6355.4
M∙∙+
413.4
412.4
M∙∙+

111
Figure 2.37: Formation of base peak ion m/z = 124197

112
Figure 2.38: Formation of fragment ions m/z = 230 and m/z = 149197

113
Table 2.14: Identification of sterols and sterol derivatives in solvent extracts including EI
fragmentation pattern with percentage base peak intensity and calculated KI
2.4.7 Beta-diketones
Another interesting class of molecule in the wheat straw extracts are the β-diketones
which are commonly identified as a component in plant cuticle wax. β-Diketones have
been identified in many other cereal crops such as barley, oat and flax.88, 92, 100
Hentriacontane-14,16-dione (C31) occurs as one of the major wax components in
wheat straw which is in agreement with a previous study carried out by Deswarte.16
This is a common wax component and had been reported extensively as the key β-
diketone in young wheat plant.91, 97, 98, 99, 105
Triatriacontane-16,18-dione (C33) was
also identified in the extracts which is in contradiction to other publications on
wheat.16, 97
However, this had been identified as one of the major β-diketone in
Eucalyptus spp.201
It commonly has the 1,3-dicarbonyl group in positions, 12 and 14
or 14 and 16 or 16 and 18 of C29, C31 and C33 alkyl chains.68
These odd-numbered β-
Identification M+ EI Fragmentation Calculated KI Literature KI
Sterols
Campesterol 400.7
43(100), 55(73), 57(62), 105(55),
81(50), 107(48), 95(48), 91(44),
93 (38), 145(37)
3238 3193198
Stigmasterol 412.7
55(100), 83(67), 43(53), 81(51),
69(42), 91(33), 57(33), 93(32),
95(32), 107(28)
3272 3249199
β-sitosterol 414.7
43(100), 55(76), 57(62), 81(51),
107(50), 105(47), 93(45), 69(45),
145(40), 91(39)
3334 3408200
Sterol 1 -
55(100), 69(61), 43(40), 81(37),
67(32), 79(31), 83(29), 97(25),
109(22) 105(22)
3400 -
∆4-Sitosten-3-one 413.7
124(100), 43(70), 55(53), 57(31),
95(30), 229 (29), 105(25),
109(23), 69(23), 147(23)
3476 -
Sterol 2 -
43(100), 55(86), 57(60), 69(49),
81(41), 95(36), 93(34), 107(31),
67(31), 137(30)
3636 -

114
diketones are synthesised during the elongation process in making the fatty acids
precursors.93
The β-keto group is protected by metal ions such as copper in various
enzymes which can have important applications as metal chelators.93, 202
These
diketones can also be used for making super-hydrophobic coatings.203
The β-diketones
only exist as odd-numbered as a similar decarboxylation step to alkanes also occurs
when the molecules are formed.93
β-Diketones have tautomeric structures and can
undergo keto-enol tautomerism as shown in Figure 2.39. The tautomerism occurs by
the migration of a hydrogen atom between a carbon atom and the oxygen on an
adjacent carbon to form an equilibrium mixture of keto and enol tautomers. As the R
groups on the β-diketone are long alkyl chains and the carbon between the two
carbonyl groups are unbranched, the equilibrium can be predicted to lie towards the
enol tautomer.204
Due to their tautomeric structure, β-diketones can undergo a
derivitisation step such as silylation and be converted into TMS enol ethers to
improve chromatography and assist in characterisation. However, this step was not
necessary as it was possible to deduce the structures of the β-diketones from direct
analysis.
Figure 2.39: Keto-enol tautomerism of β-diketones
Both of the β-diketones were identified using published KI data, EI fragmentation
pattern and NIST library 2008. The molecular ion is usually not observed for these
compounds but due to its distinct fragmentation pattern, the structure can be deduced
easily. When the higher m/z region was magnified, the molecular ion of 492 can be
seen at a low intensity as shown in Figure 2.40. With the help of KI values, the
number of carbons in the aliphatic alkyl chain can be calculated. It was apparent that
there were two CH2 difference between the two β-diketones as there are about 200 KI
unit differences which reflects the two extra carbons in the alkyl chain. Figure 2.40a
shows an EI spectrum of hentriacontane-14,16-dione and some distinctive fragment
ions which is compared with an EI spectrum from the NIST library (Figure 2.40b).
The fragment ion m/z = 100 is a strong characteristic ion for β-diketones. The ion is
Enol EnolKeto Enol EnolKeto

115
formed by a McLafferty rearrangement at the first carbonyl group, cleaving the R
group. A series of keto-enol tautomerism can occur after the first McLafferty
rearrangement so the second carbonyl is charged. A second McLafferty rearrangement
took place as before but on the second carbonyl group and cleaving the second R
group which can result in fragment ion m/z = 100 as shown in Figure 2.41. The ion
then rearranged and cleaved off a methyl group to give a fragment ion m/z = 85.
Figure 2.40a: EI spectrum of hentriacontane-14,16-dione (magnified two times from m/z
212– 500) (originally in colour)
Figure 2.40b: EI spectrum of hentriacontane-14,16-dione from the NIST library
, 04-Apr-2011 + 16:10:0450C 350 bar WSW SCO2
46 66 86 106 126 146 166 186 206 226 246 266 286 306 326 346 366 386 406 426 446 466 486m/z0
100
%
es110 1-4-11 4579 (33.565) Cm (4573:4588-4902:5059) Scan EI+ 1.96e7x2 x3 x1057.2
43.1
41.4
55.1
100.2
71.2
69.1
67.1
85.1
83.2
81.2
95.2
109.2211.3
138.3113.2
124.2
309.5
278.5239.4 250.5
(mainlib) 14,16-Hentriacontanedione
40 60 80 100 120 140 160 180 200 220 240 260 280 300 320 340 360 380 400 420 440 4600
50
10043
57
71
8395
100
113124
138
154 169
192
211
220239
253
268
281
296309 320 334 351
446 464
O O

116
Figure 2.41: Characteristic fragment ions for β-diketones204
In order to locate the two carbonyl groups on the alkyl chain, the fragmentation
around the functional group is important which is shown in Figure 2.42. Table 2.15
shows the calculated KI values for both β-diketones and shows that the there are two
carbons KI difference between the two molecules so the total aliphatic carbon chains
can be predicted for 16,18 triatriacontanedione (C33). In 14,16 hentriacontanedione
(C31), fragment ions m/z = 253 and m/z = 281 were apparent from the EI mass
spectrum whereas for 16,18 triatriacontanedione (C33) a single ion of m/z = 281 was
observed.205
Table 2.15: Identification of β-diketones in solvent extracts including EI fragmentation
pattern with percentage base peak intensity and calculated KI
Identification M+ EI Fragmentation Calculated KI Literature KI
β-Diketones
14,16 hentriacontanedione
(C31) 492.9
100(100), 43(94), 57(82),
71(66), 55(47), 85(41),
69(31), 95(30), 97(28),
83(27)
3377 3375198
16,18 triatriacontanedione
(C33) 520.9
43(100), 57(87), 69(80),
69(80), 71(63), 100(60),
83(50), 95(49), 85(45),
81(44)
3581 -
. +

117
Figure 2.42: Mass spectral fragmentation of the 14,16 hentriacontanedione (C31) and 16,18
triatriacontanedione (C33) (originally in colour)
Hydroxyl-β-diketones were also common wax component in plant cuticle waxes and
had previously been reported to be found in wheat plant, though this had never been
reported in wheat straw.16, 103, 206, 207
2.4.8 Chemical composition of wheat straw wax summary
The main components on wheat straw cuticle wax can be identified as two main
groups: alkyl chain with function group(s) and sterol and its derivatives. The chain
lengths of aliphatic wax groups identified followed the pattern from the wax
biosynthetic pathway discussed in Section 1.5 where all the components initially stem
from a pool of acyl CoAs.82
The number of carbons of the different compounds is
either predominantly all even or all odd-numbered pathway which is expected due to
the mechanisms of each wax groups are synthesisd in plant.82
Figure 2.43 summaries
the main components identified in the wheat straw wax.
14,16 hentriacontanedione (C31) 16,18 triatriacontanedione (C33)
m/z = 253
m/z = 85
m/z = 281
m/z = 281
m/z = 281
m/z = 85

11
8
1 Hexadecanoic acid (C16:0) 6 Nonacosane (C29) 11 Triatriacontane (C33) 17 Tetracosanyl hexadecanoate (C40)
2 Octadecadienoic acid (C18:2) 7 Octacosanal (C28) 12 Stigmasterol 18 Hexacosanyl hexadecanoate (C42)
3 Octadecenoic acid (C18:1) 8 Hentriacontane (C31) 13 14,16-hentriacontanedione (C31) 19 Octacosanyl hexadecanoate (C44)
4 Octadecanoic acid (C18:0) 9 Octacosanol (C28) 14 β-Sitosterol 20 Octacosanyl octadecanoate (C46)
5 Heptacosane (C27) 10 Campesterol 15 16,18-triatriacontanedione (C33) 21 Octacosanyl eicosanoate (C48)
16 Δ
4-Sitosten-3-one 22 Octacosanyl docosanoate (C50)
Figure 2.43: Typical GC chromatogram of solvent wheat straw wax (Viscount 09) extract (originally in colour)
10
1
2, 3, 4
5
6
7
8
9
11
12
13
14
15 17
19
18 20
22
Ketone
Fatty acid
Alkane
Aldehyde
Fatty alcohol
β-Diketone
Sterol
Wax Ester
21
16

119
2.5 Quantification of key wax components in wheat straw wax
It can be observed using GC-FID that the various wax extracts from different organic
solvent extractions consist of identical wax components so therefore it is important to
calculate the relative abundance of the different wax components.
2.5.1 Quantification of key wax components by calibration
The different key wax components have successfully been identified and are then
quantified using the method described in Section 6.3.1. The calibration graphs for
alkane, free fatty acid, free fatty alcohol, sterol, wax ester, aldehyde and β-diketone
have been established using a minimum of eight different standard concentrations
along with tetradecane as the internal standard. Figure 2.44 shows a calibration graph
for octadecanoic acid as an example. The area and mass ratio were calculated using
Equations 2.12 and 2.13 respectively to generate a list of directly proportional area
and mass ratio so a line of best fit can be generated. The response factor can be
deduced from the gradient of the best fit line. Table 2.16 shows the list of standards
along with the calibration range analysed for the quantification of wax components in
the extracts. The lowest concentration of the calibration range of the standard is used
as the LOQ for that specific wax group.
Figure 2.44: Calibration graph for octadecanoic acid (free fatty acid representative)
(originally in colour)
y = 0.4667x - 0.0556
R² = 0.9945
0.0
0.1
0.2
0.3
0.4
0.5
0.6
0.7
0.0 0.2 0.4 0.6 0.8 1.0 1.2 1.4 1.6
Are
a ra
tio
Mass ratio
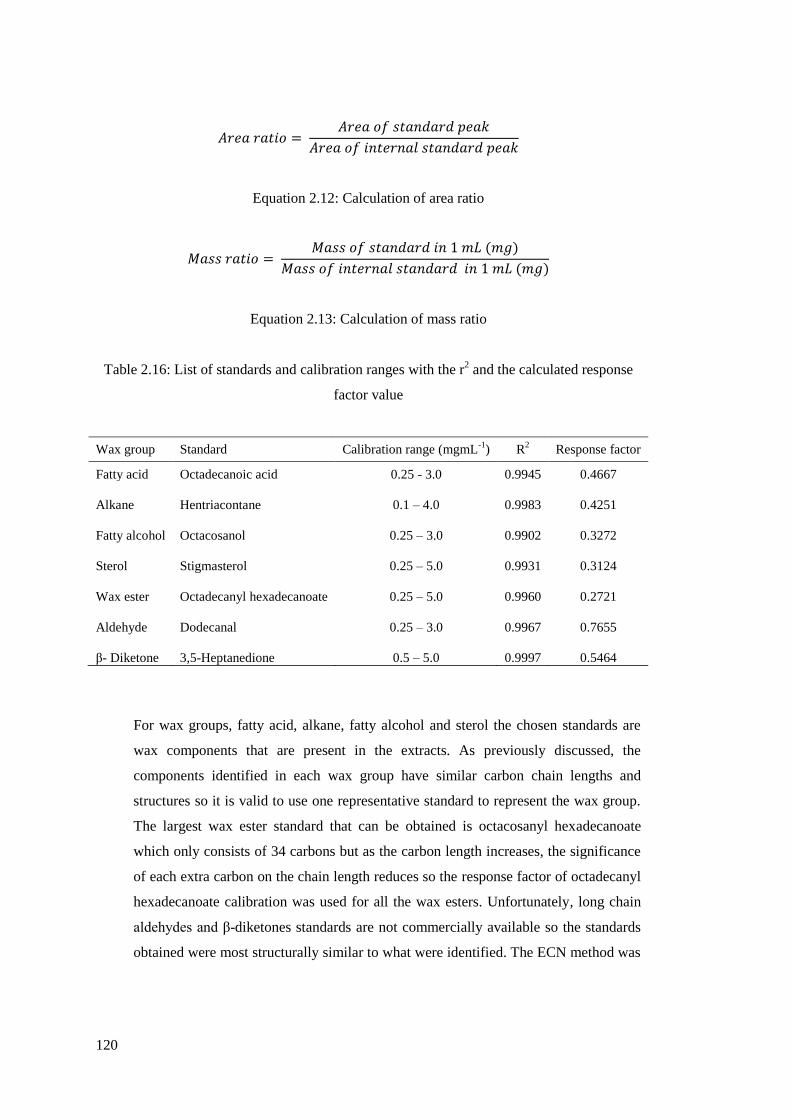
120
Equation 2.12: Calculation of area ratio
Equation 2.13: Calculation of mass ratio
Table 2.16: List of standards and calibration ranges with the r2 and the calculated response
factor value
Wax group Standard Calibration range (mgmL-1
) R2 Response factor
Fatty acid Octadecanoic acid 0.25 - 3.0 0.9945 0.4667
Alkane Hentriacontane 0.1 – 4.0 0.9983 0.4251
Fatty alcohol Octacosanol 0.25 – 3.0 0.9902 0.3272
Sterol Stigmasterol 0.25 – 5.0 0.9931 0.3124
Wax ester Octadecanyl hexadecanoate 0.25 – 5.0 0.9960 0.2721
Aldehyde Dodecanal 0.25 – 3.0 0.9967 0.7655
β- Diketone 3,5-Heptanedione 0.5 – 5.0 0.9997 0.5464
For wax groups, fatty acid, alkane, fatty alcohol and sterol the chosen standards are
wax components that are present in the extracts. As previously discussed, the
components identified in each wax group have similar carbon chain lengths and
structures so it is valid to use one representative standard to represent the wax group.
The largest wax ester standard that can be obtained is octacosanyl hexadecanoate
which only consists of 34 carbons but as the carbon length increases, the significance
of each extra carbon on the chain length reduces so the response factor of octadecanyl
hexadecanoate calibration was used for all the wax esters. Unfortunately, long chain
aldehydes and β-diketones standards are not commercially available so the standards
obtained were most structurally similar to what were identified. The ECN method was
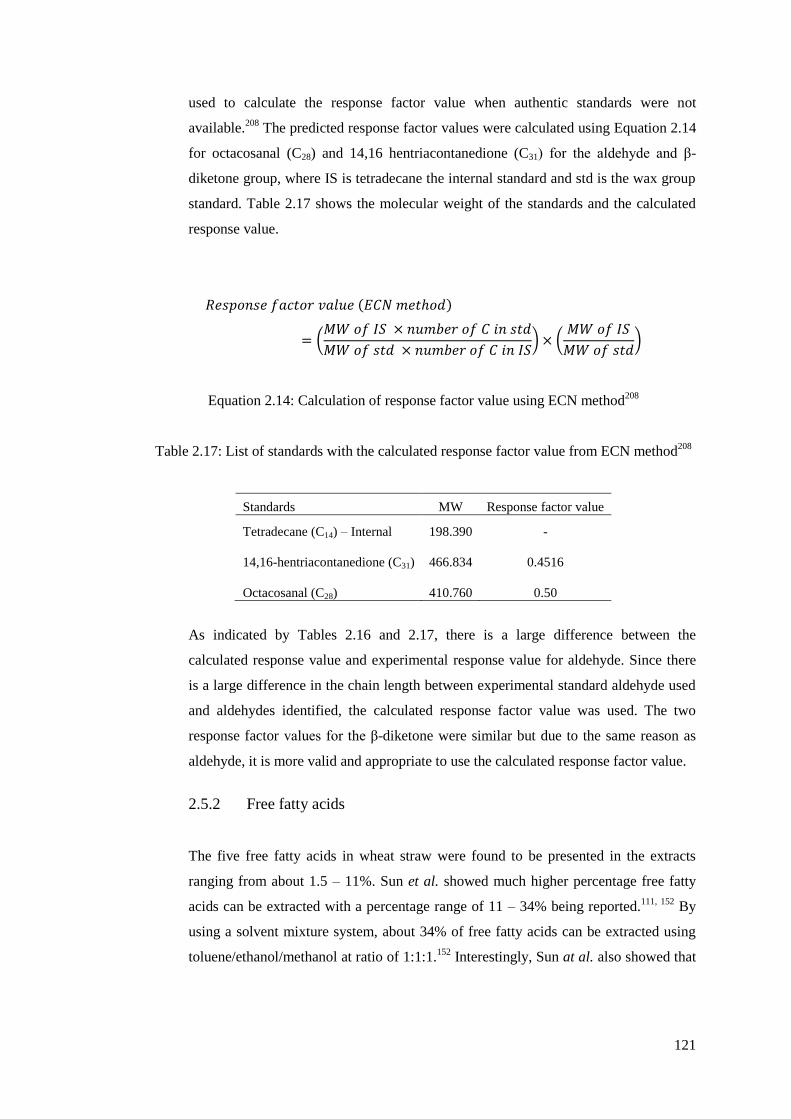
121
used to calculate the response factor value when authentic standards were not
available.208
The predicted response factor values were calculated using Equation 2.14
for octacosanal (C28) and 14,16 hentriacontanedione (C31) for the aldehyde and β-
diketone group, where IS is tetradecane the internal standard and std is the wax group
standard. Table 2.17 shows the molecular weight of the standards and the calculated
response value.
(
) (
)
Equation 2.14: Calculation of response factor value using ECN method208
Table 2.17: List of standards with the calculated response factor value from ECN method208
Standards MW Response factor value
Tetradecane (C14) – Internal 198.390 -
14,16-hentriacontanedione (C31) 466.834 0.4516
Octacosanal (C28) 410.760 0.50
As indicated by Tables 2.16 and 2.17, there is a large difference between the
calculated response value and experimental response value for aldehyde. Since there
is a large difference in the chain length between experimental standard aldehyde used
and aldehydes identified, the calculated response factor value was used. The two
response factor values for the β-diketone were similar but due to the same reason as
aldehyde, it is more valid and appropriate to use the calculated response factor value.
2.5.2 Free fatty acids
The five free fatty acids in wheat straw were found to be presented in the extracts
ranging from about 1.5 – 11%. Sun et al. showed much higher percentage free fatty
acids can be extracted with a percentage range of 11 – 34% being reported.111, 152
By
using a solvent mixture system, about 34% of free fatty acids can be extracted using
toluene/ethanol/methanol at ratio of 1:1:1.152
Interestingly, Sun at al. also showed that
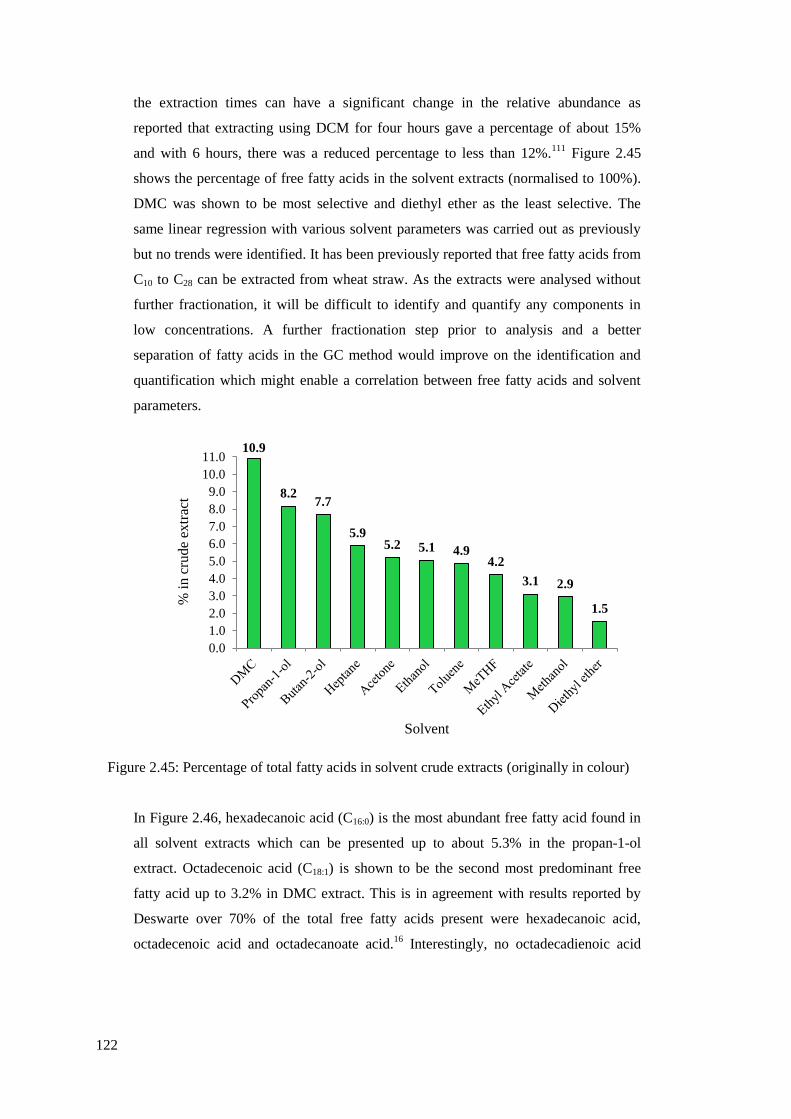
122
10.9
8.2 7.7
5.9 5.2 5.1 4.9
4.2
3.1 2.9
1.5
0.0
1.0
2.0
3.0
4.0
5.0
6.0
7.0
8.0
9.0
10.0
11.0
% i
n c
rude
extr
act
Solvent
the extraction times can have a significant change in the relative abundance as
reported that extracting using DCM for four hours gave a percentage of about 15%
and with 6 hours, there was a reduced percentage to less than 12%.111
Figure 2.45
shows the percentage of free fatty acids in the solvent extracts (normalised to 100%).
DMC was shown to be most selective and diethyl ether as the least selective. The
same linear regression with various solvent parameters was carried out as previously
but no trends were identified. It has been previously reported that free fatty acids from
C10 to C28 can be extracted from wheat straw. As the extracts were analysed without
further fractionation, it will be difficult to identify and quantify any components in
low concentrations. A further fractionation step prior to analysis and a better
separation of fatty acids in the GC method would improve on the identification and
quantification which might enable a correlation between free fatty acids and solvent
parameters.
Figure 2.45: Percentage of total fatty acids in solvent crude extracts (originally in colour)
In Figure 2.46, hexadecanoic acid (C16:0) is the most abundant free fatty acid found in
all solvent extracts which can be presented up to about 5.3% in the propan-1-ol
extract. Octadecenoic acid (C18:1) is shown to be the second most predominant free
fatty acid up to 3.2% in DMC extract. This is in agreement with results reported by
Deswarte over 70% of the total free fatty acids present were hexadecanoic acid,
octadecenoic acid and octadecanoate acid.16
Interestingly, no octadecadienoic acid

123
was reported which is in contradiction to data shown in Figure 2.46.16
Sun et al.
reported that the most abundant free fatty acids were tetradecanoic acid and
pentadecanoic acid in wheat straw.111, 152
This is unexpected as odd-numbered free
fatty acids are usually found in low concentrations as a C2 moiety is added during the
free fatty acids biosynthetic pathway.82
Figure 2.46: Percentage of individual free fatty acids in solvent crude extracts (originally in
colour)
2.5.3 Hydrocarbons
The hydrocarbons identified were all exclusively n-alkanes with odd-numbered
carbon chains between C27 to C33. Hentriacontane (C31) sometimes co-elutes with
octacosanol (C28) using the GC method described in Section 6.3.1 due to the similarity
in the retention index. Figure 2.47 shows the percentage of total alkanes in the extracts
but the bars highlighted in patterns are a combination of both hentriacontane (C31) and
octacosanol (C28). The alkane fraction in wheat straw can be separated using column
chromatography as demonstrated by Deswarte.16
For the purpose of this work, this
was not necessary as further greener extraction and fractionation techniques are
0.0
0.5
1.0
1.5
2.0
2.5
3.0
3.5
4.0
4.5
5.0
5.5
% i
n c
rud
e ex
trac
t
Free fatty acids
DMC
Propan-1-ol
Butan-2-ol
Heptane
Acetone
Ethanol
Toluene
MeTHF
Ethyl Acetate
Methanol
Diethyl ether
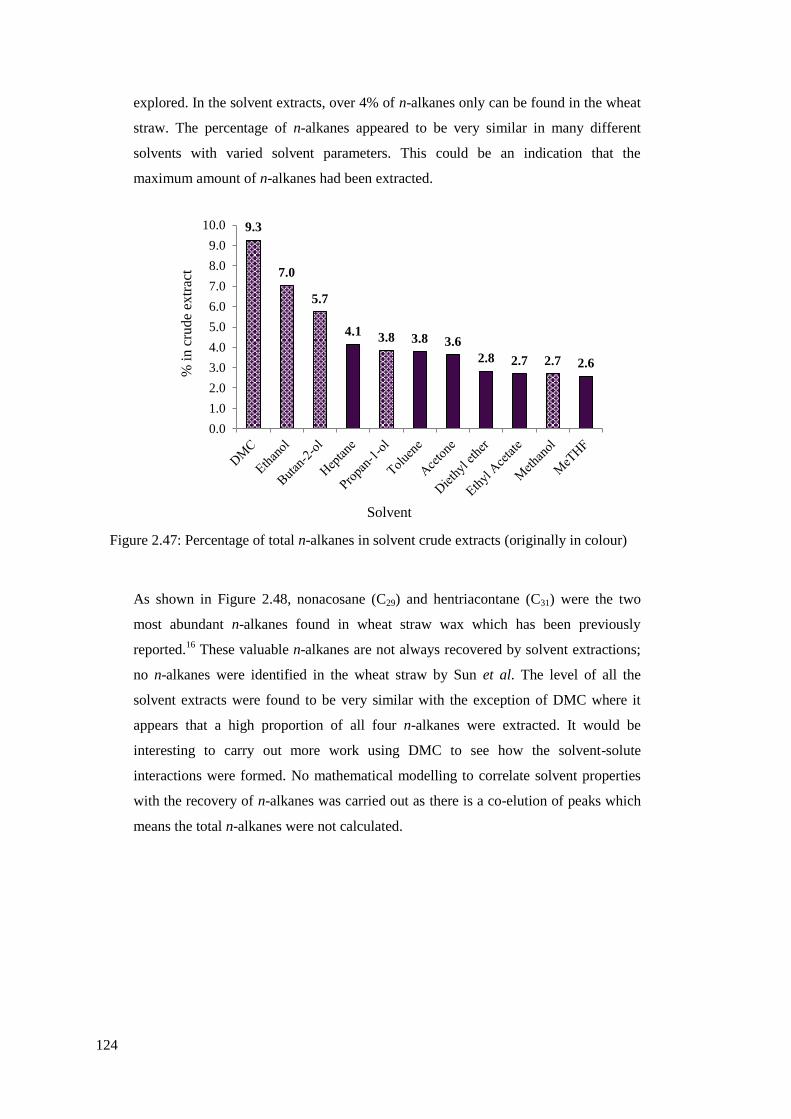
124
explored. In the solvent extracts, over 4% of n-alkanes only can be found in the wheat
straw. The percentage of n-alkanes appeared to be very similar in many different
solvents with varied solvent parameters. This could be an indication that the
maximum amount of n-alkanes had been extracted.
Figure 2.47: Percentage of total n-alkanes in solvent crude extracts (originally in colour)
As shown in Figure 2.48, nonacosane (C29) and hentriacontane (C31) were the two
most abundant n-alkanes found in wheat straw wax which has been previously
reported.16
These valuable n-alkanes are not always recovered by solvent extractions;
no n-alkanes were identified in the wheat straw by Sun et al. The level of all the
solvent extracts were found to be very similar with the exception of DMC where it
appears that a high proportion of all four n-alkanes were extracted. It would be
interesting to carry out more work using DMC to see how the solvent-solute
interactions were formed. No mathematical modelling to correlate solvent properties
with the recovery of n-alkanes was carried out as there is a co-elution of peaks which
means the total n-alkanes were not calculated.
9.3
7.0
5.7
4.1 3.8 3.8 3.6
2.8 2.7 2.7 2.6
0.0
1.0
2.0
3.0
4.0
5.0
6.0
7.0
8.0
9.0
10.0
% i
n c
rud
e ex
trac
t
Solvent

125
Figure 2.48: Percentage of individual n-alkanes in solvent crude extracts (originally in
colour)
2.5.4 Free fatty alcohols
Only octacosanol (C28) was identified and as mentioned previously. Octacosanol (C28)
co-eluted with hentriacontane (C31) in some cases which made the quantification more
difficult. It would be beneficial to separate the fatty alcohol from the other wax
components or derivitise it for more accurate quantification but the results presented
in Figure 2.49 gives an indication of the quantity of the octacosanol in the extracts.
Same as Figure 2.48, the patterned bars indicate the co-elution of two compounds.
More than 5% of pure octacosanol can be found in the butan-2-ol extract. Policosanols
of C24 to C32 have been reported in wheat straw after separation by column
chromatography with octacosanol being the most abundant fatty alcohol.16
As
policosanol is a very high value product, the content has been well studied. Dunford et
al. studied the effect of policosanol content in different wheat varieties and under
different growing environment.180, 209
It was shown that policosanols of chain length
0.0
1.0
2.0
3.0
4.0
5.0
6.0
7.0
Heptacosane Nonacosane Hentriacontane Triatriacontane
% i
n c
rud
e ex
trac
t
Hydrocarbons
DMC
Ethanol
Butan-2-ol
Heptane
Propan-1-ol
Toluene
Acetone
Diethyl ether
Ethyl Acetate
Methanol
MeTHF

126
C20 to C36 can be found and the most predominant were tetracosanol (C24),
hexacosanol (C26) and octacosanol (C28).
A similar trend can be observed with the fatty alcohol and the n-alkanes as DMC,
ethanol, propan-1-ol and heptane extract the highest percentage of compounds in the
crude extracts. Again, no mathematical modelling to correlate solvent properties with
the recovery of fatty alcohol was carried out as there is a co-elution of octacosanol
(C28).
Figure 2.49: Percentage of octacosanol (C28) in solvent crude extracts (originally in colour)
2.5.5 Aldehydes
Octacosanal (C28) was the only aldehyde found in the wax extracts and this aldehyde
was a minor component in wheat straw wax. As shown in Figure 2.50, less than 1% of
the extracts are octacosanal except in the DMC extract. Surprisingly, DMC showed an
exceptional solvent power for octacosanal in which 5.7% of the extract was
octacosanal. It would be interesting to further investigate the DMC-octacosanal
interactions in details. Sun et al. reported that aldehydes are completely absent and
Deswarte identified the presence of octacosanal but did not carry out any
quantification work so this is the first time in which aldehyde was quantified in the
8.7
6.3
5.1
3.5 3.0
2.8 2.5 2.3
2.1 1.6 1.4
0.0
1.0
2.0
3.0
4.0
5.0
6.0
7.0
8.0
9.0
% i
n c
rud
e ex
trac
t
Solvent

127
wheat straw extracts.16, 87, 152
Due to the very low concentration of octacosanal in the
extracts, no mathematical modelling to correlate solvent properties was carried out.
Figure 2.50: Percentage of octacosanal (C28) in solvent crude extracts (originally in colour)
2.5.6 Wax esters
Wax esters are one of the most valuable groups of compounds in the wheat straw
extracts. A range of 2.8 – 13% of the extracts was found to be wax esters depending
on the organic solvents used as shown in Figure 2.51.
Figure 2.51: Percentage of wax esters in solvent crude extracts (originally in colour)
5.7
0.9 0.9
0.4 0.4 0.3 0.3 0 0 0 0
0.0
1.0
2.0
3.0
4.0
5.0
6.0
% i
n c
rud
e ex
trac
t
Solvent
13.0 12.0
9.9
7.7 7.2 7.1
6.6 6.6
4.5
3.2 2.8
0.0
2.0
4.0
6.0
8.0
10.0
12.0
14.0
% i
n c
rude
extr
act
Solvent

128
Figure 2.52: Percentage of wax esters in solvent crude extracts (originally in colour)
Figure 2.52 shows the breakdown of the percentage of individual wax ester in the
extracts. Octacosanyl hexadecanoate (C28:C16) is the most predominant wax ester and
represents up to 4.2% of the whole extract. The distribution of the wax esters were
consistent with results reported by Deswarte where octacosanyl hexadecanoate was
the most predominant then followed by octacosanyl octadecanoate. It was noted that
the two highest percentages of wax esters in the extracts derived from the free fatty
acids (hexadecanoic and octadecanoic acid) and fatty alcohol (octacosanol) identified
previously. Octacosanyl octadecanoate (C28:C18), octacosanyl eicosanoate (C28:C20)
and octasanyl docosanoate (C28:C22) are similar which suggests that high levels of
octacosanol (C28) are synthesised by the plant. Hexadecanyl hexadecanoate (C16:C16),
0.0
0.5
1.0
1.5
2.0
2.5
3.0
3.5
4.0
4.5%
in
cru
de
extr
act
Wax esters
Heptane
Toluene
DMC
MeTHF
Butan-2-ol
Acetone
Diethyl ether
Ethyl Acetate
Propan-1-ol
Ethanol
Methanol

129
octadecenyl hexadecanoate (C18:1:C16) and octadecenyl octadecenoate (C18:1:C18:1)
were the three wax esters previously identified in wheat straw by Sun et al. which is in
contradiction to the results shown in Figure 2.52. About 2 – 14% of wax esters were
identified in the extracts with both petroleum ether and hexane extracting up to
14%.111, 152
Fractionation of wax esters might be necessary to ensure the shorter wax
esters have been recovered and there is no co-elution with other compounds. Deswarte
fractionated the extracts and the shortest chain length identified was C40.16
It would be
interesting to quantify the odd-numbered wax esters and compare the distribution,
though they represent at such low level, the focus had been based solely on even-
numbered wax esters.
LSER have been proposed to correlate the properties of solvents in order to
understand the solvent-wax ester interactions. Different physical and chemical
properties of the solvents were included into the expression as described in Section
2.5. Again, DMC was the chosen solvent for any validation of the results produced.
Strong correlation with two important parameters Vm and Kamlet-Taft parameter α
(R2= 0.903) was developed giving a new normalised LSER equation shown as
Equation 2.15 for wax esters presented in wheat straw.
(
)
Equation 2.15: New normalised LSER equation with percentage wax ester
The equation was used to predict the percentage of wax esters in DMC. The model
has proved to be accurate as the experimental percentage of wax esters was 9.88% and
the predicted value from Equation 2.15 was 8.88% which results in only 10% error.
Kamlet-Taft α parameter describes the hydrogen bond donating ability of the solvent
and is highly significant when extracting wax esters from wheat straw. The residual
errors were calculated using Equation 2.7 and the plot is shown in Figure 2.54 with
the data evenly distributed both positively and negatively meaning that there is no bias
over or under estimation.

130
Figure 2.53: A comparison of experimental and predicted percentage wax esters in crude
extracts (originally in colour)
Figure 2.54: Residual error plot for experimental and predicted percentage wax esters in
crude extracts (originally in colour)
2.5.7 Sterols
A range of 2.6 – 10.6% of sterols were found in the solvent extracts and interestingly,
DMC can extract the highest level of sterols as shown in Figure 2.55. Figure 2.56
shows the breakdown percentage of the individual sterols. Sun et al. reported that
approximately 3 – 25% of total sterols were found in the extracts with both petroleum
-4
-3.5
-3
-2.5
-2
-4 -3.5 -3 -2.5 -2
Pre
dic
ted
dat
a
Experimental data
DMC
-0.3
-0.2
-0.1
0
0.1
0.2
0.3
0.4
0 2 4 6 8 10 12Res
idual
err
or
Solvent trials
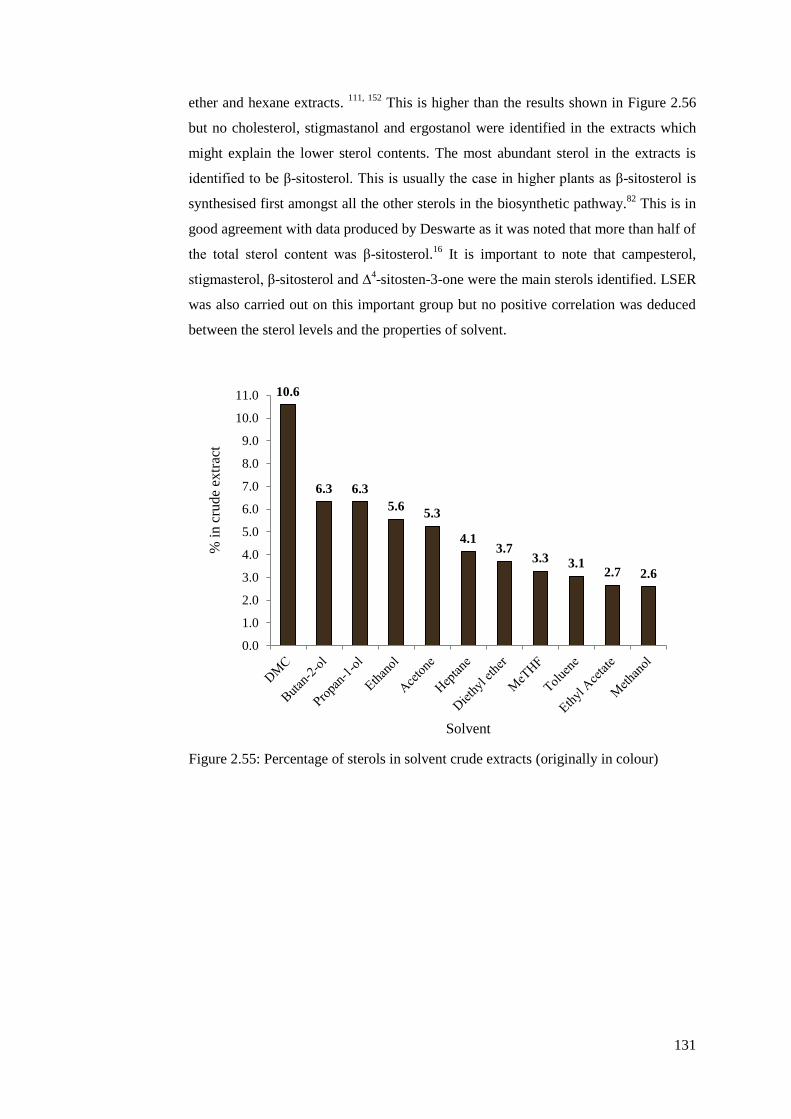
131
ether and hexane extracts. 111, 152
This is higher than the results shown in Figure 2.56
but no cholesterol, stigmastanol and ergostanol were identified in the extracts which
might explain the lower sterol contents. The most abundant sterol in the extracts is
identified to be β-sitosterol. This is usually the case in higher plants as β-sitosterol is
synthesised first amongst all the other sterols in the biosynthetic pathway.82
This is in
good agreement with data produced by Deswarte as it was noted that more than half of
the total sterol content was β-sitosterol.16
It is important to note that campesterol,
stigmasterol, β-sitosterol and ∆4-sitosten-3-one were the main sterols identified. LSER
was also carried out on this important group but no positive correlation was deduced
between the sterol levels and the properties of solvent.
Figure 2.55: Percentage of sterols in solvent crude extracts (originally in colour)
10.6
6.3 6.3
5.6 5.3
4.1 3.7
3.3 3.1 2.7 2.6
0.0
1.0
2.0
3.0
4.0
5.0
6.0
7.0
8.0
9.0
10.0
11.0
% i
n c
rude
extr
act
Solvent
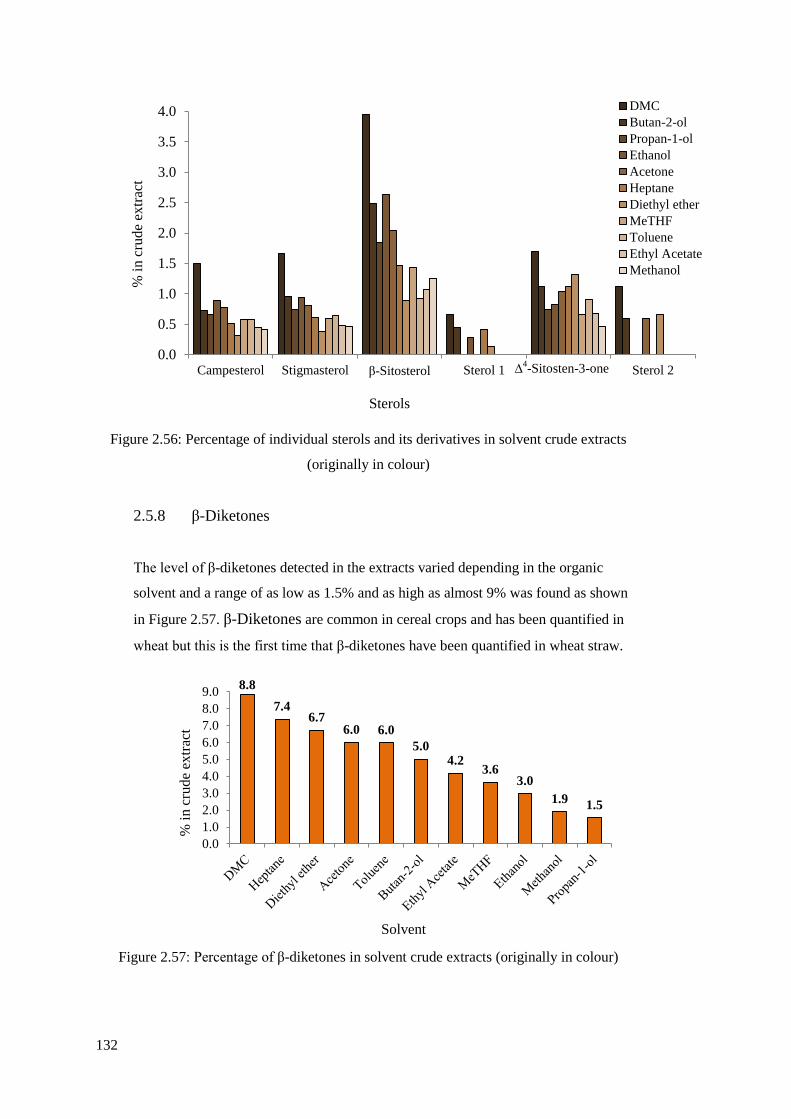
132
Figure 2.56: Percentage of individual sterols and its derivatives in solvent crude extracts
(originally in colour)
2.5.8 β-Diketones
The level of β-diketones detected in the extracts varied depending in the organic
solvent and a range of as low as 1.5% and as high as almost 9% was found as shown
in Figure 2.57. β-Diketones are common in cereal crops and has been quantified in
wheat but this is the first time that β-diketones have been quantified in wheat straw.
Figure 2.57: Percentage of β-diketones in solvent crude extracts (originally in colour)
8.8
7.4 6.7
6.0 6.0
5.0 4.2
3.6 3.0
1.9 1.5
0.0
1.0
2.0
3.0
4.0
5.0
6.0
7.0
8.0
9.0
% i
n c
rud
e ex
trac
t
Solvent
0.0
0.5
1.0
1.5
2.0
2.5
3.0
3.5
4.0
Campesterol Stigmasterol β-Sitosterol Sterol 1 Sterol 2
% i
n c
rud
e ex
trac
t
Sterols
DMC
Butan-2-ol
Propan-1-ol
Ethanol
Acetone
Heptane
Diethyl ether
MeTHF
Toluene
Ethyl Acetate
Methanol
∆4-Sitosten-3-one

133
0.0
1.0
2.0
3.0
4.0
5.0
6.0
7.0
8.0
14,16-Hentriacontanedione 16,18-Triatriacontanedione
% i
n c
rud
e ex
trac
t
β-Diketones
DMC
Heptane
Diethyl ether
Acetone
Toluene
Butan-2-ol
Ethyl Acetate
MeTHF
Ethanol
Methanol
Propan-1-ol
Two main β-diketones have been identified in wheat straw (Figure 2.58) which is in
agreement with the literatures on wheat and that 14,16- hentriacontanedione is the sole
β-diketone.16, 91, 98, 99
Almost 8% of the DMC extract was only 14,16-
hentriacontanedione which makes it a very significant component in the wheat straw
wax. 16,18-Triatriacontanedione is only present at very low level and under some
solvents, there is a complete absence of the compound. Despite that β-diketones is a
common group of compound found in Gramineae, there have been reports that no β-
diketones were found in wheat straw.111, 152
LSER was carried out with the β-diketone
groups but no positive correlation was found between solvent properties and
percentage of β-diketones extracted.
Figure 2.58: Percentage of individual β-diketones in solvent crude extracts (originally in
colour)
2.5.9 Summary of wax components quantified in organic solvent extracts
The lipophilic fraction of the wheat straw wax from different organic solvent extracts
have similar composition so a quantitative analysis of the different wax groups was
carried out. The quantified components were grouped and plotted into a chart against
the percentage yield as shown in Figure 2.59. The result showed a deeper insight into
the chemical composition of the extracts and the lipophilic components are only a
minor portion of the extracts. Only a range of 14 – 57% of the extracts were identified
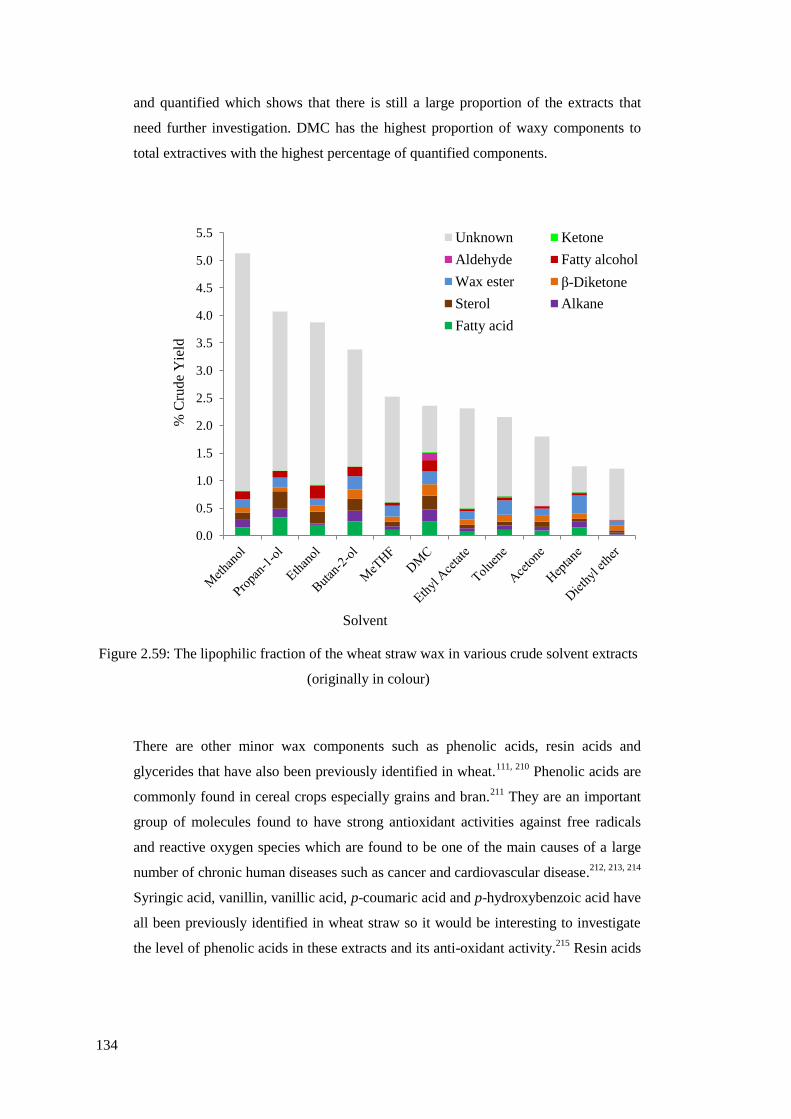
134
and quantified which shows that there is still a large proportion of the extracts that
need further investigation. DMC has the highest proportion of waxy components to
total extractives with the highest percentage of quantified components.
Figure 2.59: The lipophilic fraction of the wheat straw wax in various crude solvent extracts
(originally in colour)
There are other minor wax components such as phenolic acids, resin acids and
glycerides that have also been previously identified in wheat.111, 210
Phenolic acids are
commonly found in cereal crops especially grains and bran.211
They are an important
group of molecules found to have strong antioxidant activities against free radicals
and reactive oxygen species which are found to be one of the main causes of a large
number of chronic human diseases such as cancer and cardiovascular disease.212, 213, 214
Syringic acid, vanillin, vanillic acid, p-coumaric acid and p-hydroxybenzoic acid have
all been previously identified in wheat straw so it would be interesting to investigate
the level of phenolic acids in these extracts and its anti-oxidant activity.215
Resin acids
0.0
0.5
1.0
1.5
2.0
2.5
3.0
3.5
4.0
4.5
5.0
5.5
% C
rud
e Y
ield
Solvent
Unknown Ketone
Aldehyde Fatty alcohol
Wax ester β-Diketone
Sterol Alkane
Fatty acid

135
have also been reported in wheat straw with the most common being azelaic acid,
which is frequently used in medical creams and polymers.215, 216, 217
Glycerides have
been reported in wheat straw and are mostly found as triglycerides but can
occasionally exist as diglycerides.111
FAME analysis was carried out using the method
described in Section 6.3.4 (Figure 2.60) on the ethanol extract to check for the
presence of glycerides in wheat straw. FAME of hexadecanoic, octadecanoic,
octadecadienoic and octadecatrienoic acids were identified and can be confirmed that
the FAME were the products from glycerides as the wax esters can still be observed.
Figure 2.61a shows an EI spectrum of methyl octadecanoate comparing with Figure
2.61b which is an EI spectrum from the NIST library. However, the FAME only
indicated the presence of glycerides and not the level of substitution of the glycerol
(mono, di or triglycerides). In the ethanol extract, only up to 2.7% of glycerides in the
extract can be found which shows that there are still a lot of unknown compounds in
the extracts. Previously, dipalmitin, tripalmitin and dipalmitoyl-oleylglycerol were
reported to be found in wheat straw.111
Other compounds that could also be co-
extracted are free sugars and pigments which are also not detectable by GC.
Figure 2.60: FAME analysis of wheat straw wax (originally in colour)
, 17-Jan-2012 + 12:01:34ES703FAME
22.45 22.50 22.55 22.60 22.65 22.70 22.75 22.80 22.85 22.90 22.95 23.00 23.05 23.10 23.15 23.20 23.25Time0
100
%
es703fame1701 Scan EI+ TIC
1.74e922.72
22.65
22.8622.99
, 17-Jan-2012 + 12:01:34ES703FAME
17.46 19.46 21.46 23.46 25.46 27.46 29.46 31.46 33.46 35.46 37.46 39.46 41.46 43.46 45.46Time0
100
%
0
100
%
es703fame1701 Scan EI+ TIC
1.74e922.72
22.65
20.59
20.31
30.61
22.86
28.8325.19 27.23 30.08
43.6943.1741.5734.3132.31
32.27
31.81
33.84
33.43
40.0439.37 44.87 45.62
es 703-1-12 bs Scan EI+ TIC
7.96e830.83
21.24
19.81
20.53
30.31
29.0623.35
34.7232.53
32.48
32.02 34.52
34.0733.64
43.9041.7640.0436.2535.57
36.72
With FAME analysis
Without FAME analysis
C16
C18:2 Methyl esters
C18:1 C18:0

136
Figure 2.61a: EI spectrum of methyl octadecanoate (magnified two times from m/z 260–
300) (originally in colour)
Figure 2.61b: EI spectrum of methyl octadecanoate from the NIST library
In summary, the quantified components were expressed in µg.g-1
of wheat straw in
Table 2.18. This gives a different dimension to the data as it shows the amount of
extractives from the biomass. Alkanes, fatty alcohols, wax esters, sterols and β-
diketones are the most valuable components amongst the complex extract so it is
important to highlight the highest level that can be extracted from the various
solvents. As the total amount of wax components in the biomass is unknown, this
quantitative work can be used as a rough guideline on the level of compounds are
presented for future extractions. This allowed the percentage solvent efficiency to be
calculated as shown in Table 2.19 in which the data are all normalised to the highest
quantity of the wax group being extracted. The percentage solvent efficiency values
expressed in Table 2.19 are calculated using Equation 2.16. Table 2.19 shows that
DMC is the most efficient solvent as it can extract above 70% of the wax components.
, 17-Jan-2012 + 12:01:34ES703FAME
36 46 56 66 76 86 96 106 116 126 136 146 156 166 176 186 196 206 216 226 236 246 256 266 276 286 296m/z0
100
%
es703fame1701 2995 (22.989) Cm (2993:2997-3026:3033) Scan EI+ 1.97e7x274.1
43.2
41.3
55.1
57.269.2
87.1
75.2
143.2298.3
255.3199.2
(mainlib) Octadecanoic acid, methyl ester
10 20 30 40 50 60 70 80 90 100 110 120 130 140 150 160 170 180 190 200 210 220 230 240 250 260 270 280 290 300 3100
50
100
1529
41
4355
5769
74
83
87
97111
129
135
143
149 157 164 171 185199
205 213 227 241 248
255
267
298
O
O

137
Equation 2.16: Calculation for percentage solvent efficiency

138
Table 2.18: Quantification of wheat straw wax components in various solvent extracts
Identification
µgg-1
of wheat straw (n ≥ 2)
Methanol Propan-1-ol Ethanol Butan-2-ol MeTHF DMC Ethyl
acetate Toluene Acetone Heptane
Diethyl
ether
Tetradecanoic acid 220 ± 23 229 ± 45 248 ± 44 322 ± 31 64 ± 6 142 ± 7 67 ± 14 66 ± 43 60 ± 23 134 ± 34 17 ± 7
Hexdecanoic acid 719 ± 13 2140 ± 11 1019 ± 20 904 ± 12 484 ± 48 1050 ± 12 498 ± 66 570 ± 50 433 ± 19 925 ± 54 129 ± 37
Octadecadienoic acid 209 ± 45 298 ± 90 175 ± 33 420 ± 23 173 ± 19 449 ± 11 Tr 108 ± 25 136 ± 37 70 ± 13 22 ± 2
Octadecenoic acid 363 ± 50 533 ± 78 372 ± 51 766 ± 46 274 ± 41 764 ± 23 83 ± 13 223 ± 13 246 ± 12 224 ± 27 Tr
Octadecanoic acid Tr 124 ± 12 143 ± 16 184 ± 32 73 ± 28 166 ± 19 71 ± 23 82 ± 10 62 ± 29 133 ± 32 18 ± 7
Total free fatty acids
1511 ± 131
3324 ± 236
1957 ± 164
2596 ± 144
1067 ± 142
2572 ± 72
719 ± 116
1049 ±
141
937 ± 120
1485 ± 160
186 ± 53
Heptacosane Tr Tr 206 ± 38 151± 12 98 ± 23 Tr 67 ± 22 91 ± 29 88 ± 43 116 ± 31 34 ± 4
Nonacosane 275 ± 33 327 ± 21 445 ± 34 336 ± 32 183 ± 54 407 ± 34 170 ± 59 226 ± 57 170 ± 34 318 ± 19 98 ± 12
Hentriacontane 1111 ± 98a 1239 ± 43
a 1874 ± 112
a 1327 ± 149 323 ± 18 1588 ± 80
a 338 ± 47 437 ± 27 351 ± 57 500 ± 26 183± 10
Triatriacontane Tr Tr 202 ± 12 127 ± 40 49 ± 19 193 ± 50 50 ± 11 65 ± 13 47 ± 10 114 ± 32 30 ± 5
Total hydrocarbons
1386 ± 50
1567 ± 64
2726 ± 196
1940 ± 233
653 ± 114
2188 ± 164
625 ± 139
818 ± 126
656 ± 144
1048 ± 108
345 ± 31
Octacosanol 1436 ± 42a 1239 ± 59
a 2422 ± 71
a 1716 ± 52 527 ± 57 2053 ± 30
a 380 ± 21 501 ± 11 449 ± 43 444 ± 36 174 ± 24
Total fatty alcohol
1436 ± 42
1239 ± 59
2422± 71
1716 ± 52
527 ± 57
2053 ± 30
380 ± 21
501 ± 11
449 ± 43
444 ± 36
174 ± 24
Octacosanal Tr Tr Tr Tr 82 ± 5 1343 ± 59 87 ± 14 195 ± 27 59 ± 11 117 ± 13 43 ± 14
Total aldehyde
Tr
Tr
Tr
Tr
82 ± 5
1343 ± 59
87 ± 14
195 ± 27
59 ± 11
117 ± 13
43 ± 14
Tetracosanyl hexadecanoate 123 ± 27 132 ± 34 Tr 127 ± 17 120 ± 20 85 ± 25 75 ± 5 140 ± 23 102 ± 10 157 ± 32 65 ± 10
Hexacosanyl hexadecanoate 119 ± 24 204 ± 11 232 ± 22 223 ± 23 201 ± 52 191 ± 67 146 ± 15 238 ± 12 169 ± 27 291 ± 19 97 ± 7

139
Table 2.18 (continued)
Octacosanyl hexdecanoate 533 ± 19 634 ± 25 659 ± 22 656 ± 45 532 ± 23 800 ± 14 536 ± 34 748 ± 24 458 ± 17 1064 ± 70 299 ± 22
Octacosanyl octadecanoate 309 ± 25 369 ± 15 330 ± 13 391 ± 16 427 ± 25 493 ± 15 309 ± 11 490 ± 12 312 ± 32 588 ± 11 119 ± 19
Octacosanyl eicosanoate 186 ± 18 265 ± 23 Tr 353 ± 25 324 ± 14 345 ± 23 245 ± 26 444 ± 37 174 ± 23 520 ± 23 98 ± 3
Octacosanyl docosanoate 166 ± 37 222 ± 12 Tr 375 ± 23 267 ± 19 297 ± 22 150 ± 45 408 ± 28 67 ± 12 473 ± 19 81 ± 15
Octacosanyl tetracosanoate Tr Tr Tr 164 ± 17 84 ± 38 120 ± 5 59 ± 3 127 ± 15 Tr 134 ± 15 29 ± 2
Octacosanyl hexacosanoate Tr Tr Tr 62 ± 2 Tr Tr Tr Tr Tr 65 ± 15 13 ± 0
Octacosanyl octacosanoate Tr Tr Tr 87 ± 6 Tr Tr Tr Tr Tr Tr Tr
Total wax esters
1435 ± 150
1825 ± 120
1221 ± 57
2439 ± 174
1955 ± 191
2331 ± 171
1520 ±
189
2595 ±
151
1283 ±
121
3291 ± 204
802 ± 78
Campesterol 214 ± 23 271 ± 17 343 ± 17 246 ± 11 148 ± 58 352 ± 15 102 ± 9 123 ± 15 139 ± 36 65 ± 13 39 ± 2
Stigmasterol 238 ± 11 301 ± 29 364 ± 15 323 ± 5 151 ± 44 392 ± 24 109 ±13 140 ± 26 146 ± 34 77 ± 14 46 ± 5
β-Sitosterol 638 ± 24 749 ± 38 1022 ± 25 840 ± 28 362 ± 12 933 ± 33 247 ± 23 199 ± 36 367 ± 15 186 ± 38 109 ± 13
Sterol 1 Tr Tr 106 ± 14 152 ± 16 Tr 156 ± 5 Tr Tr Tr 52 ± 4 16 ± 5
Δ4-Sitosten-3-one 240 ± 14 305 ± 11 319 ± 12 377 ± 26 168 ± 22 400 ± 17 156 ± 23 196 ± 29 186 ± 29 142 ± 32 161 ± 23
Sterol 2 Tr Tr Tr 201 ± 22 Tr 265 ± 14 Tr Tr 108 ± 34 Tr 80 ± 26
Total sterols
1330 ± 58
3192 ± 95
2154 ± 83
2138 ± 108
829 ± 136
2498 ± 108
614 ± 68
659 ± 106
945 ± 148
522 ± 101
451 ± 74
14,16 hentriacontanedione 974 ± 45 624 ± 58 1148 ± 60 1491 ± 13 919 ± 45 1832 ± 87 882 ± 45 1196 ± 34 950 ± 14 814 ± 21 689 ± 14
16,18 triatriacontanedione Tr Tr Tr 204 ± 21 Tr 248 ± 6 81 ± 29 90 ± 27 129 ± 23 116 ± 11 129 ± 13
Total β-diketones
974 ± 45
624 ± 58
1148 ± 60
1695 ± 34
919 ± 45
2080 ± 93
963 ± 74
1287 ± 61
1079 ± 37
930 ± 32
818 ± 27
Total identified 8072 ± 476 11770 ± 632 11627 ±
631 12524 ± 745 6032 ± 690
15066 ±
697
4910 ±
621
7104 ±
623
5408 ±
624 7837 ± 654 2821 ± 301
a = co-elution and values shown are the combined quantities, Tr = Trace levels < LOQ, LOQ shown in Section 2.5.1

140
Table 2.19: Normalised percentage solvent efficiency for different wax group
Solvent/ wax group
µgg-1
of
wheat
straw
% Solvent efficiency
Methanol Propan-1-ol Ethanol Butan-2-ol MeTHF DMC Ethyl
acetate Toluene Acetone Heptane
Diethyl
ether
Propan-1-ol/
Free fatty acids 3324 45 100 59 78 32 77 22 32 28 45 6
Ethanol/
Hydrocarbons
2726 51 57 100 71 24 80 23 30 24 38 13
Ethanol/
Free fatty alcohols
2422 59 51 100 71 22 85 16 21 19 18 7
DMC/
Aldehydes
1343 0 0 0 0 6 100 6 15 4 9 3
Heptane/
Wax esters
3291 44 55 37 74 59 71 46 79 39 100 24
Propan-1-ol/
Sterols
3192 42 100 67 67 26 78 19 21 30 16 14
DMC/
β-Diketones
2080 47 30 55 81 44 100 46 62 52 45 39

141
2.6 Conclusion and future work
Wheat straw (Triticum aestivum) has been highlighted as a low cost, high volume
agricultural waste that needed added value applications. From the straw bio-refinery
concept, an opportunity to extract of wheat straw for high value chemicals arises. In this
chapter, the use of eleven different organic solvents (heptane, ethanol, diethyl ether, 2-
methyl tetrahydrofuran, acetone, toluene, ethyl acetate, propanol, butan-2-ol, dimethyl
carbonate and methanol) on wheat straw wax extraction was investigated. Linear solvation
energy relationships were successfully developed to describe the relationship between
properties of solvent and extraction crude and lipophilic yields. It was found that there is a
strong correlation of both the percentage of crude and lipophilic yields with Kamlet-Taft
parameter β (hydrogen bond accepting ability and molar volume. Two new normalised
LSER equations were established for the prediction of percentage crude and lipophilic
yields. This aids the understanding between the solvent-solute interactions which can be
extremely useful during solvent selection. Ethyl acetate showed the best selectivity for wax
components, closely followed by heptane.
A qualitative analysis by HTGC-MS with the assistance of KI and NIST Library 2008
demonstrated that organic solvents had almost no effect on the chemical composition, which
means that the important point to note is that various different solvents extract different
quantities of each wax components as there is a large variation with the yields. The
lipophilic fraction of the wheat straw wax composed mainly of free fatty acids, free fatty
alcohols, aldehydes, wax esters, alkanes, β-diketones and sterols. The main components
were identified successfully but fractionation of the extracts would enable compounds of
lower concentrations to be identified. Phytosterols and policosanols have been highlighted as
potential sources for dietary supplements or food additives that can reduce blood cholesterol
levels. Alkanes have been shown to have insect repellent properties which are interesting as
an additive in insecticides. Wax esters, fatty alcohols, sterols and alkanes are components
commonly identified in commercial waxes for many applications in the personal care and
cosmetics industry. Wax esters and alkanes are highly hydrophobic which have the potential
to be used in wax polishes and coatings. Beta-diketones are an interesting group of
molecules that can be used as metal chelators. The above components identified in wheat
straw wax have tremendous commercial potential as a UK-sourced alternative or an addition
to the continuous growing existing wax market. In order to push this to a commercial
142
success, physical properties of this new product must be determined to understand the actual
market potential and how it can be compared with the existing commercial waxes.
A quantitative analysis of the different wax groups is paramount due to similarities in
chemical composition. A comprehensive quantitative analysis was carried out for all the
various solvent extracts. LSER was also carried out on some key wax groups but
unfortunately no correlation was established between any of the wax groups except the wax
esters. This is the first time that a relationship with properties of solvents and specific groups
of compounds was successfully established. The newly developed LSER equation
specifically for wax esters within a complex mixture is important as it showed that there is a
potential in defining the relationship of organic solvents and wax groups. This will prove to
be extremely useful in solvent selection for higher selective extractions. It is difficult to
understand the solvent-solute interactions as natural products are typically very complex.
Fractionation of wax groups and fine tuning of GC methods to the specific groups would
give a more accurate quantification analysis which may assist the establishment of any
further mathematical modelling.
As with all extraction from a plant material, the total extractives in the biomass originally
are unknown but from the solvent study, a deeper understanding of the “potential” quantities
of each key wax components was achieved. With this new information, the efficiency of the
solvent for the extraction of specific wax groups can be reviewed. It was concluded that
DMC is the solvent with the highest efficiency for all the wax groups as it can extract over
70% of the “potential” quantities presented on the wheat straw.
As wheat straw has shown such great potential biomass for wax products, it would be
interesting to investigate other possible biomass for natural wax sources. This will give
opportunities for other biomasses as well as locating the “best” biomass for extraction by
comparison of extraction yields, chemical compositions and yields for specific wax groups.
Sourcing wax products from a number of renewable sources can be advantageous when wax
blending needs to be applied to achieve various physical properties for different applications.
For these reasons, different potential biomasses would be screened for waxes, which is
discussed in Chapter 3.

143
It has been noted that this high value wax product can be produced from a natural, readily
available renewable resource but due to tighter legislations and consumers’ demands, there
is a big drive towards “greener” products. The levels of residual solvent in natural extracts as
well as solvent emissions into the atmosphere are of more concern so it has become
increasingly restricted over the past few years. This is a great opportunity for both
environmental reasons and new marketing opportunity to establish a 100% natural wax
product. Alternative environmentally friendly extraction techniques such as supercritical
carbon dioxide would not only leave the wax product completely solvent- free but is also a
by-product from industrial processes. According to the principles of green chemistry,
existing renewable resources should be utilised where it can, so this is an area of research of
high interest in this process. Due to all these reasons, this alternative extraction technique is
investigated in Chapter 4. With this preliminary organic solvent extraction work, the green
extraction technique can be compared so conclusions can be made on whether the use of
carbon dioxide is feasible.

Chapter 3 Supercritical carbon dioxide extraction of
wheat straw waxes
A.J. Hunt, E.H.K. Sin, R. Marriott and J.H. Clark, ChemSusChem. , 2010, 3, 306-322
V.L. Budarin, P.S. Shuttleworth, J.R. Dodson, A.J. Hunt, B. Lanigan, R. Marriott, K.J.
Milkowski, A.J. Wilson, S.W. Breeden, J. Fan, E.H.K. Sin and J.H. Clark, Energy
Environ. Sci., 2011, 4, 471-479
Oral presentation given at 1st
NORthern Sustainable Chemistry meeting (NORSC), York,
UK, October 2010
Interview for BBC World Services “Can Chemistry Save the World”, March 2011
Oral presentation given at 7th International Conference on Renewable Resources and
Biorefineries (RRB7), Bruges, Belgium, June 2011
Poster given at 11th International Conference on Carbon Dioxide Utilisation (ICCDU XI),
Dijon, France, June 2011
Book chapter titled “Supercritical CO2 as an environmentally benign medium for
biorefinery” for book called “The role of green chemistry in biomass processing and
conversion” (authored by R. Marriott and E.H.K. Sin, edited by Haibo Xie and Nick
Gathergood) in John Wiley & Sons. Inc.


147
3. SUPERCRITICAL CARBON DIOXIDE
EXTRACTION OF WHEAT STRAW WAX
3.1 Introduction
Components in straw wax have been successfully identified and quantified by organic
solvent extraction and preliminary results showe that some of the wax compounds has
real commercial potential to replace some existing waxes or as a green alternative wax
for many applications such as flavourings, cosmetics, food supplements, coatings
etc.181, 218, 219, 220
Many of these applications are strictly regulated, for example
legislation is already in place restricting extraction solvent usage and residues in
cosmetics, flavour and fragrances.221, 222, 223, 224, 225, 226
Lipids are traditionally extracted
using an organic solvent such as hexane but with growing environmental concerns
over organic solvents, extensive research has been taking place into using greener
alternative solvents.1, 157
Hexane has been recognised as a hazardous air pollutant by
the US EPA and the EPA Toxic Release Inventory (TRI) indicated that more than
20,000 tonnes of hexane are released into the atmosphere from extraction.129, 227
As
well as the warnings issued by various government bodies, hexane is also reported to
be neurotoxic and can potentially greatly affect the central nervous system.228, 229
One
option is to use CO2 as a greener replacement solvent for hexane.230, 231
With the amount of CO2 generated and emitted into the atmosphere continuing to rise,
it is apparent that a major effort is needed across the world in order to reduce
atmospheric CO2 levels including carbon dioxide capture and storage.232
Reductions in
energy use and an increase in the use of carbon neutral biofuels are already in place in
order to tackle global warming.233, 234
However, despite the negative association of
CO2, this can be a valuable renewable resource for use in many industrial processes.235
Carbon dioxide is usually obtained as a recovered by-product from industrial
processes such as fermentation, ammonia production and the generation of
hydrogen.235
The production of bioethanol in particular generates significant quantities
of CO2 and utilisation of this should be considered in preference to capture and storage
in oceans or terrestrial sinks.232
This is especially the case when CO2 is used as a
reactant as it would be omitted and converted to other products. CO2 generated as a

148
by-product is relatively pure and can be easily dried, re-compressed and stored before
being used to extract valuable chemicals or used as a reaction solvent.236
Due to tighter legislation on solvent usage, the use of supercritical CO2 is slowly
being implemented to replace many industrial applications due to its many advantages
compared with organic liquid solvents.221, 222, 223, 224, 225, 237
It is also very well-known
for its environmental benefits e.g.: it does not contribute to smog, cause ozone
depletion, create acute eco-toxicity and most importantly it generates no liquid
wastes.238, 239, 240, 241
It also fulfils many health and safety issues such as being non-
carcinogenic, non- toxic, non-mutagenic and non-flammable. Carbon dioxide is
commonly used as a SCF due to its low critical point of 304 K and 7.3 MPa. 238, 239, 240,
241 The properties of SCFs have been compared with both gases and liquids; they are
often described as the intermediate between these two states as shown in Table 3.1.
Due to these physical properties, SCF is a defined state that is neither a gas nor liquid.
Above the critical point, a substance is at a higher temperature and pressure range than
a gas and liquid in equilibrium so giving this special state as shown in Figure 3.1. 238,
239, 240, 241
Figure 3.1: Phase Diagram for supercritical fluid
Triple Point
Critical
Point
SOLID LIQUID SCF
GAS
Temperature (K)
Pressure
(MPa)
Tc
Pc

149
Table 3.1: Physical properties of gaseous, supercritical and liquid CO2
State Density (gL-1
) Viscosity (Pa.s) Diffusivity (m2s
-1)
Gaseous 1 10-5
10-4
SCF 100 - 900 10-4
10-6
Liquid 1000 10-3
10-8
- 10-9
As well as its low critical point, it is also non-flammable, non-toxic and renewable
which makes supercritical CO2 the most common SCF used. The critical point for
each substance has its own specific critical pressure (Pc) and temperature (Tc). 238, 239,
240, 241 Supercritical fluids have many unique and unusual properties which make them
of interest to many chemists and industries. 238, 239, 240, 241
The most crucial properties
of a SCF are its density, viscosity, diffusivity and heat capacity. The physical
properties of supercritical CO2 and liquid CO2 are highlighted in Table 3.2 where they
are compared with common organic solvents. High densities generally means
enhanced solubilisation of compounds and low viscosities mean greater penetration
into solids and easier flow with minimal friction. 238, 239, 240, 241
The properties can be
manipulated by temperature and pressure and it has been reported that scCO2 is a
good solvent for the extraction of lipids and gives a very high recovery. 238, 239, 240, 241
Under scCO2 conditions, the temperature of extraction tends to be lower than of
organic solvent extraction which minimises thermal destruction of the raw materials.
As the extraction is carried out under pressure, the system can be depressurised after
completion, leaving both the raw materials and extracts completely solvent-free.
Table 3.2: Physical properties of CO2 compared with organic solvents
Solvent Density
(gL-1
)
Viscosity
(Pa.s)
Heat capacity
(kJkg-1
K-1
)
Reichardt's polarity
scale ETN
DCM 1326 4.06 x 10⁻⁴
1.19 0.309
Hexane 655 2.95 x 10⁻⁴
2.27 0.009
Water 1000 8.94 x 10⁻⁴
4.18 1
Ethanol 789 1.074 x 10⁻³
2.44 0.654
Ethyl
acetate 894 4.31 x 10
-4 1.9 0.228
scCO2 956 (at 313 K and 40
MPa)
1.06 x 10⁻⁴
(at 313
K)
0.846 (at 313
K) 0.09 (variable)
lCO2 1000 (298 K and 40
MPa)
1.2 x 10⁻⁴
(at 298
K)
3.14 (at 283
K) 0.09 (variable)
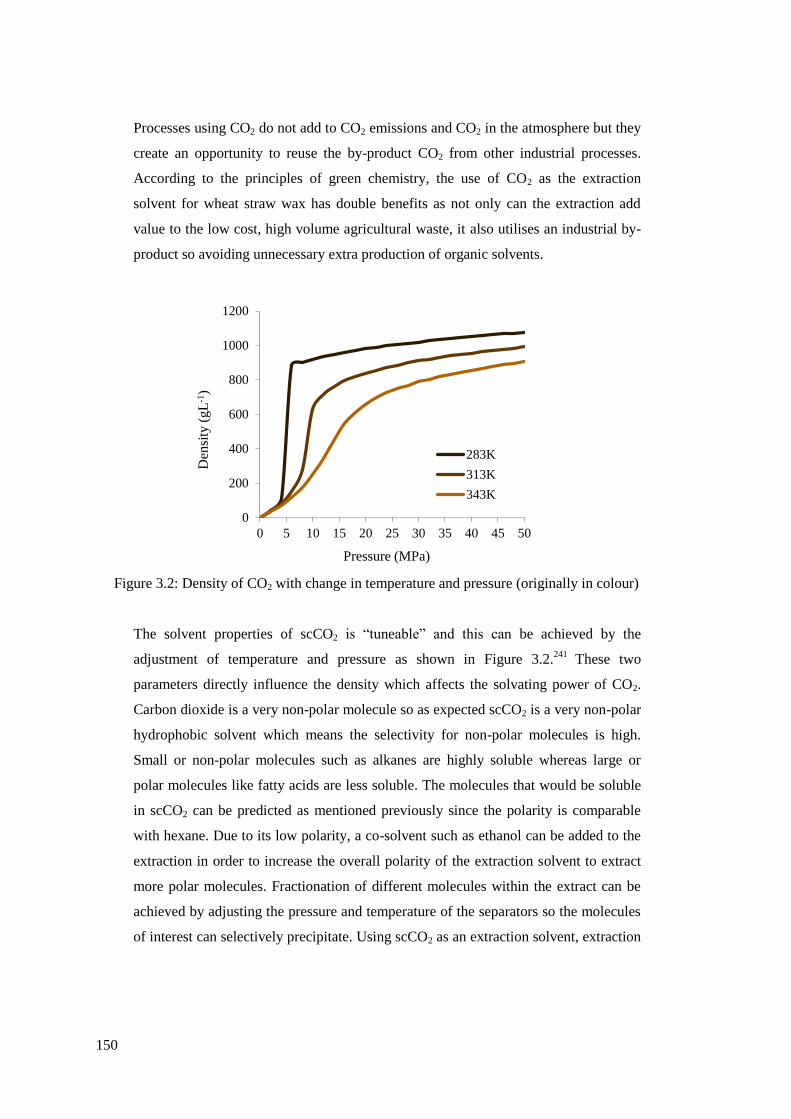
150
Processes using CO2 do not add to CO2 emissions and CO2 in the atmosphere but they
create an opportunity to reuse the by-product CO2 from other industrial processes.
According to the principles of green chemistry, the use of CO2 as the extraction
solvent for wheat straw wax has double benefits as not only can the extraction add
value to the low cost, high volume agricultural waste, it also utilises an industrial by-
product so avoiding unnecessary extra production of organic solvents.
Figure 3.2: Density of CO2 with change in temperature and pressure (originally in colour)
The solvent properties of scCO2 is “tuneable” and this can be achieved by the
adjustment of temperature and pressure as shown in Figure 3.2.241
These two
parameters directly influence the density which affects the solvating power of CO2.
Carbon dioxide is a very non-polar molecule so as expected scCO2 is a very non-polar
hydrophobic solvent which means the selectivity for non-polar molecules is high.
Small or non-polar molecules such as alkanes are highly soluble whereas large or
polar molecules like fatty acids are less soluble. The molecules that would be soluble
in scCO2 can be predicted as mentioned previously since the polarity is comparable
with hexane. Due to its low polarity, a co-solvent such as ethanol can be added to the
extraction in order to increase the overall polarity of the extraction solvent to extract
more polar molecules. Fractionation of different molecules within the extract can be
achieved by adjusting the pressure and temperature of the separators so the molecules
of interest can selectively precipitate. Using scCO2 as an extraction solvent, extraction
0
200
400
600
800
1000
1200
0 5 10 15 20 25 30 35 40 45 50
Den
sity
(g
L-1
)
Pressure (MPa)
283K
313K
343K

151
and fractionation can be combined in one step. Previously, supercritical CO2 had been
demonstrated as an environmentally friendly alternative solvent for the extraction of
these valuable wheat straw waxes.18
The extraction trials investigated both liquid and
supercritical CO2 as a solvent as well as the addition of a co-solvent. Due to the
success of the laboratory trials, the extraction of wheat straw wax using supercritical
CO2 was carried out in pilot scale in collaboration with Botanix. However,
optimisation of the extraction conditions was not fully completed so a lot of the
parameters used were recommendations from the company.
In this chapter, the use of CO2 as an environmentally friendly alternative to organic
solvents is investigated thoroughly. The same winter wheat straw (Viscount 09) was
used for the CO2 experiments so it can be compared with results from Chapter 2. The
effects of different pressure and temperature on extraction yields as well as chemical
composition would be studied. A quantitative analysis was carried out to understand
the relationship between solute solubility in CO2. Finally, optimisation of wheat straw
wax extraction was carried using Chrastil model to identify the “ideal” extraction
conditions for various wax groups.
3.2 Carbon dioxide extraction of wheat straw
3.2.1 Raw materials, pre-treatment and moisture content
Wheat straw (Viscount 09) was used for all the CO2 extractions and was milled to
reduce particle size using the procedure described in Section 6.2.2 prior to extraction.
The milled wheat straw was stored in paper sacks in a cool dry place until the
extraction was carried out. Prior to the each extraction, the moisture content was
determined using the method described in Section 6.2.1 to ensure it was below 10%.
The moisture level must be 10% or less because CO2 can co-extract residual water in
the biomass. The effect of moisture level and the co-extraction of water is discussed in
Section 5.2.1 in Chapter 5.

152
3.2.2 Comparison of organic solvents and carbon dioxide extraction yields
Carbon dioxide is a relatively non- polar solvent and quite often its polarity is
compared with hexane. Heller et al. compared the solubility parameters of CO2 with
n-alkanes in the 1980s.230
In the 1990s, Ikushima et al. carried out scCO2 polarity
measurement using IR spectroscopy and concluded that supercritical CO2 has a very
similar solvent polarity to hexane and heptane.231
Extensive research had taken place
to compare and understand the differences between hexane and scCO2 extraction of
lipids. Traditionally, lipids are extracted using hexane but scCO2 has been adopted as
a more environmentally friendly alternative extraction method. One of the biggest
worldwide industrial scCO2 plants for the extraction of sesame oil was built in South
Korea.242
An extractor volume of 2 x 3800 L and a pressure of up to 55 MPa is used
for this edible oil production.242
In this study, extraction of wheat straw wax by liquid, supercritical CO2 and
supercritical CO2 with co-solvent were compared with traditional organic solvents.
The extractions were carried out using the procedure described in Section 6.2.5. The
extraction times were selected based on previous investigation with wheat straw wax
carried out by Deswarte.16
Extraction of scCO2 is quite often being compared with
hexane or heptane extraction. Table 3.4 shows a comparison of extraction yields
between scCO2 and heptane.
Figure 3.3: Comparison of percentage crude yields of organic solvents and carbon
dioxide (originally in colour)
0.3
1.0 1.3
1.6 1.8
3.9
0
0.5
1
1.5
2
2.5
3
3.5
4
4.5
Heptane Ethanol
% C
rud
e yie
ld
Solvent
lCO2 scCO2 F scCO2 and
ethanol
scCO2 B

153
Table 3.3: CO2 extraction conditions outlined in Figure 3.3
Temperature (K) Pressure (MPa) Co-solvent
lCO2 278 6.5 -
scCO2 F 323 35 -
scCO2 B 373 40 -
scCO2 + ethanol 323 35 10%
As shown in Figure 3.3, it can be observed that the extraction yields varied, depending
on temperature and pressure and the addition of ethanol co-solvent with carbon
dioxide. The CO2 conditions for the different extractions presented in Figure 3.3 are
shown in Table 3.3. The yield for heptane is in between the two scCO2 conditions and
scCO2 with ethanol which is expected as scCO2 is more selective for non-polar
molecules compared to heptane but with the addition of a polar co-solvent, the
polarity increases and it is capable of extracting more polar molecules. The addition of
co-solvents with CO2 means the total overall polarity would alter and this is dependent
on the percentage of co-solvent added and the polarity of the organic solvent. Due to
the co-extraction of more polar molecules, the increase in the relative proportion of
polar to non-polar molecules means a reduction in selectivity.243
Previously, it was
shown from the extraction of wheat straw wax that any co-solvents added to the
system would provide enhanced extraction efficiency and the extraction yield is
directly related to the polarity of the co-solvent. In this case, ethanol is chosen as the
co-solvent and has ETN of 0.654, it can be expected that a co-solvent with higher ET
N
such as methanol (ETN= 0.762) would give rise to a higher extraction yield.
16 In this
experiment, heptane was used as a more environmentally friendly alternative to
hexane due to lower toxicity.157
Table 3.4 shows some literature that suggested hexane
and scCO2 extraction yields are highly comparable in lipid extraction but it is common
to find that hexane yields tend to be higher than scCO2 yields unless a higher pressure
is used.244
In a separate experiment where the conditions were at 373 K and 40 MPa, a
1.8% extraction yield was observed for wheat straw wax. The yield for liquid CO2 is a
lot different to heptane as the properties of the solvent completely changes when CO2
is used in liquid phase. Due to the higher viscosity, the penetration through the
biomass is more difficult which can greatly reduce the compounds being extracted due
to poorer penetration and reduced solubility.245
Less work has been carried out using
liquid CO2 compared to supercritical CO2 even though it has a relatively high density

154
and therefore high solvent power although in some cases, liquid CO2 can lead to
extraction of unwanted contaminants compared to scCO2.246
The compositional
difference between lCO2 and scCO2 extracts will be discussed later in the Chapter.
Table 3.4: Comparison of supercritical CO2 and hexane lipids extraction yields
Extract scCO2 Hexane
Pressure (MPa) Temperature (K) Yield (%) Yield (%)
Soy bean oil227
30 313 16.4 19.9
Sunflower seed oil245
32 - 35 313 - 323 36.0 38.4
Rape seed oil 245
35 313 39.3 40.1
Soybean oil245
34.5 323 20.0 19.9
Rice bran wax/oil247
28 343 7.1 12.0
Flax dust wax112
55.2 333 7.4 4.0
Wheat straw wax16
30 313 0.63 1.0
Triticale straw wax90
25 343 0.82 0.8
3.2.3 Effect of temperature and pressure in supercritical carbon dioxide
crude extraction yields by first order polynomial modelling
As discussed previously, the temperature and pressure in scCO2 determines the
density of CO2 which is one of the most crucial physical properties in extraction.
Milled wheat straw was extracted using a range of temperatures and pressures in an
experimental 2 x 2 plot as shown in Figure 3.4. The main advantage of carrying out
the experimental design is that two variable parameters can be investigated
simultaneously unlike the traditional method of only changing one variable parameter
at any single time.248
The plot was designed to give a working range for temperature
and pressure. The temperature was set at 305 K and 373 K and the pressure was set at
7.5 MPa and 40 MPa. Traditionally, there is a limitation with the working pressure as
older commercial plants cannot usually operate above 30 MPa. Due to advances in
engineering, some of the bigger and newer plants built nowadays can operate up to 55
MPa.236, 249
A total of four experimental points at the minimum and maximum
operating temperature and pressure were obtained with the exact conditions shown as
points A, B, C and D in Figure 3.4. An extra point at the centre of the working ranges
was also carried out (labelled E: 338K and 25 MPa) to clarify any relationships
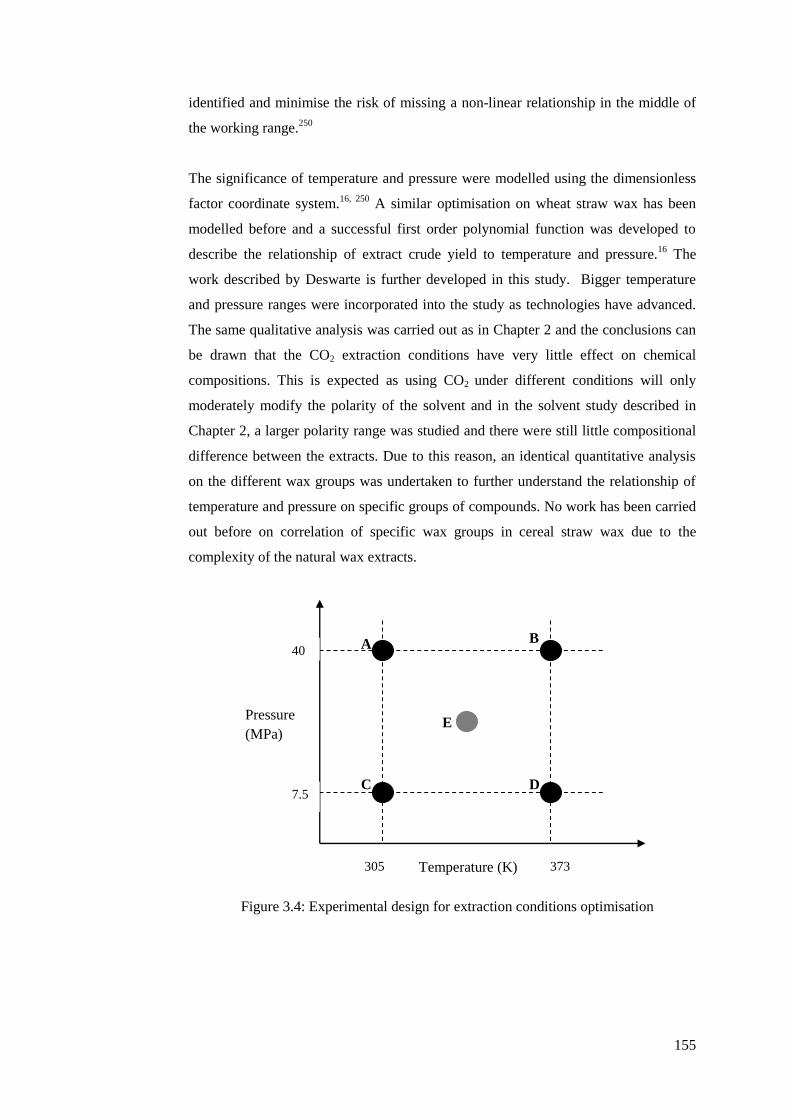
155
identified and minimise the risk of missing a non-linear relationship in the middle of
the working range.250
The significance of temperature and pressure were modelled using the dimensionless
factor coordinate system.16, 250
A similar optimisation on wheat straw wax has been
modelled before and a successful first order polynomial function was developed to
describe the relationship of extract crude yield to temperature and pressure.16
The
work described by Deswarte is further developed in this study. Bigger temperature
and pressure ranges were incorporated into the study as technologies have advanced.
The same qualitative analysis was carried out as in Chapter 2 and the conclusions can
be drawn that the CO2 extraction conditions have very little effect on chemical
compositions. This is expected as using CO2 under different conditions will only
moderately modify the polarity of the solvent and in the solvent study described in
Chapter 2, a larger polarity range was studied and there were still little compositional
difference between the extracts. Due to this reason, an identical quantitative analysis
on the different wax groups was undertaken to further understand the relationship of
temperature and pressure on specific groups of compounds. No work has been carried
out before on correlation of specific wax groups in cereal straw wax due to the
complexity of the natural wax extracts.
Figure 3.4: Experimental design for extraction conditions optimisation
E
Temperature (K)
Pressure
(MPa)
40
7.5
305 373
A B
C D

156
A dimensionless factor coordinate system has the convention of “-1” for the low level
and “+1” for the high level of each parameter. The coordinate for the centre point was
“0” as it coincided with the origin of the system. The newly coded coordinate values
are shown in Tables 3.5 and 3.6. As the centre point E was 338 K and 25 MPa which
is not exactly central, in the calculations the coordinate “0” used were exact calculated
values to increase accuracy. The values were adjusted and resulted in x1 = 0.0097 and
x2 = 0.107.
Table 3.5: Experimental design with the coded coordinate values
Factor Experimental variable Coded coordinate values
-1 0 +1
X1 Temperature (K) 306 338 373
X2 Pressure (MPa) 7.5 25 40
Table 3.6: Experimental design for optimisation
Experiment
point
Coded coordinate values Experimental conditions
X1 X2 Temperature (K) Pressure (MPa)
A -1 +1 305 40
B +1 +1 373 40
C -1 -1 305 7.5
D +1 -1 373 7.5
E 0 0 338 25
A total of five experiments were carried out for the optimisation and the relationship
between percentage crude yield and temperature and pressure were deduced using
multiple linear regression. Equation 3.1 shows the first order polynomial function
used for the multiple linear regression where Y was the total percentage extraction
yield, b1 and b2 account for the main effects of the coded coordinate values of x1
(temperature) and x2 (pressure), b12 represents the second order interaction term and b0
is the response at “zero” level which corresponds to the yield at experiment point E.
Equation 3.1: First order polynomial function
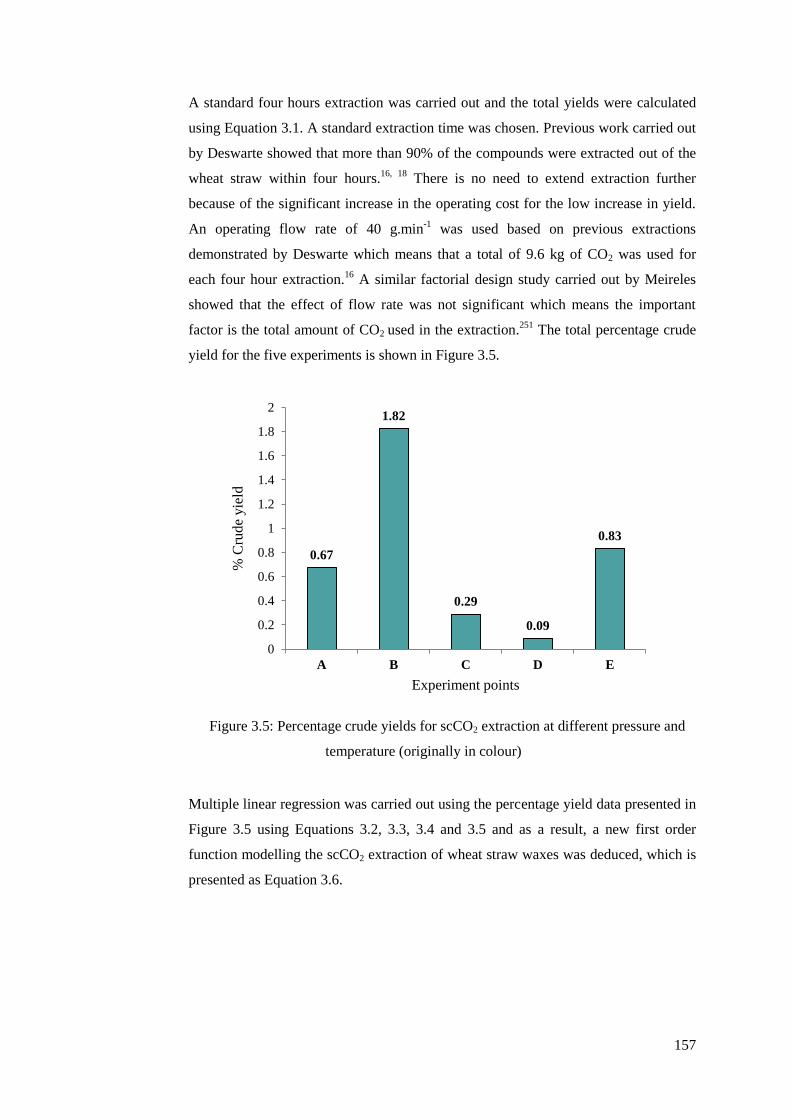
157
A standard four hours extraction was carried out and the total yields were calculated
using Equation 3.1. A standard extraction time was chosen. Previous work carried out
by Deswarte showed that more than 90% of the compounds were extracted out of the
wheat straw within four hours.16, 18
There is no need to extend extraction further
because of the significant increase in the operating cost for the low increase in yield.
An operating flow rate of 40 g.min-1
was used based on previous extractions
demonstrated by Deswarte which means that a total of 9.6 kg of CO2 was used for
each four hour extraction.16
A similar factorial design study carried out by Meireles
showed that the effect of flow rate was not significant which means the important
factor is the total amount of CO2 used in the extraction.251
The total percentage crude
yield for the five experiments is shown in Figure 3.5.
Figure 3.5: Percentage crude yields for scCO2 extraction at different pressure and
temperature (originally in colour)
Multiple linear regression was carried out using the percentage yield data presented in
Figure 3.5 using Equations 3.2, 3.3, 3.4 and 3.5 and as a result, a new first order
function modelling the scCO2 extraction of wheat straw waxes was deduced, which is
presented as Equation 3.6.
0.67
1.82
0.29
0.09
0.83
0
0.2
0.4
0.6
0.8
1
1.2
1.4
1.6
1.8
2
A B C D E
% C
rude
yie
ld
Experiment points

158
Equations 3.2, 3.3, 3.4 and 3.5 (top to bottom): Calculation for coefficients of the
first order polynomial function
Equation 3.6: First order function modelling the scCO2 extraction of wheat straw
waxes
Equation 3.6 shows the coefficients for both temperature and pressure which give
further details on the influence of the individual parameters and the combination of
the two parameters that determine the density of CO2 and hence solvent strength.241
It
is important to note that temperature, pressure and density are not the only factors that
can have an effect on extraction yield. Other factors such as viscosity, diffusivity and
polarity of the scCO2 have also been reported to have an important role in terms of
extractions.252
In general, the coefficient can give a rough idea on the influence of
temperature and pressure on the yields. Here, the coefficient for x2 (pressure) is
double the value for x1 (temperature) which indicates the pressure of the extraction is
more influential in giving higher crude yields. From the coefficient, it is apparent that
the density of the CO2 is important. An inverse effect of the temperature with constant
pressure can be seen. The increase in temperature leads to a decrease in CO2 density
under identical pressure conditions which can cause a drop in the solubility of the wax
compounds. This is the case when the system is under low pressure as shown by
experimental points C and D. The density dropped from 311.5 gL-1
to 130.4 gL-1
and
this was reflected in the massive decrease in yields from 0.29% to 0.09%. As a result
of reduced solubility, the yields should also decrease from experimental points A and
B but the opposite occurred as the system did not behave as predicted. The increase in
temperature from 306 K to 373 K at 40 MPa means the density would drop from

159
978.7 gL-1
to 756.7 gL-1
. This indicates that there are other factors that come into play
when describing the influence of temperature and pressure. The increased temperature
would provide sufficient energy to break the crystal lattice of the wax compounds
which can lead to enhanced solubility. It can be concluded that the effects of
temperature on wax extraction yield are controlled by two opposing factors. At high
temperatures, the vapour pressures for the wax compounds are high and the wax on
the straw surfaces are molten meaning that this factor overrides the negative influence
of reduced density. Research carried out by Lucas also suggests that increased
solubility of lipids at high temperatures was more important than the density giving a
higher yield.247
In contrast, the effect of density dominated at low temperatures where
the wax remained crystalline on the straw surfaces. The percentage crude yield for
extraction point E in the middle of the experimental design was calculated using
Equation 3.6 and compared with the experimental value. The predicted value was
calculated to be 0.73% and the average actual experimental value was 0.83% giving a
0.1% difference with a 13% error. The model shows relatively good prediction for
percentage crude yield in wheat straw wax extraction which is in agreement with
previous first order polynomial modelling work carried out by Deswarte.16
3.2.4 Effect of temperature and pressure in supercritical carbon dioxide
extraction yields of different wax groups
The five extractions described in Section 4.3.4 were characterised following the
procedure described in Section 6.3.2. Identical wax compounds were identified in the
scCO2 extracts compared to the solvent extracts so it is necessary to carry out a
quantitative analysis. In this section, the effect of temperature and pressure on
individual wax groups is discussed and the details of the breakdown of the individual
compounds within each wax groups are described later in the chapter. The calibration
and methods used are identical to Chapter 2 and Table 3.7 shows the percentage of the
different wax groups within the extracts.
The physical properties such as colour and texture of the scCO2 extracts ranged from
soft pale yellow to harder light green at different extraction conditions, already
suggesting that there are compositional differences between the extracts. The purpose
of using experimental design was to optimise the extraction conditions for groups of

160
compounds and single compounds. This proved successful and this is the first time,
correlation of wax groups has been carried out using such experimental design.250, 253
Table 3.7: Percentage of different wax groups extracted from wheat straw
Experimental point
Percentage of wax group in wheat straw
Fatty acid Nonacosane Aldehyde Wax ester Sterol β-Diketone
A 0.079 0.019 0.009 0.179 0.083 0.125
B 0.103 0.028 0.0108 0.320 0.113 0.170
C 0.0079 0.02 0.0033 0.004 0.029 0.099
D 0.013 0.001 0.0006 0.015 0.0004 0.0004
E 0.097 0.023 0.017 0.133 0.097 0.125
In order to understand the relationship between the relative abundance of various wax
groups with temperature and pressure, the same multiple linear regression was carried
out for each individual wax group using Equation 3.6. In these cases, Y represents the
normalised percentage of different wax groups in the crude extracts. Table 3.8 shows
the coefficients from the multiple linear regression method. Hydrocarbons and fatty
alcohols were omitted from the modelling as there were co-elutions between
hentriacontane (C31) and octacosanol (C28). Nonacosane (C29) is one of the most
predominant n-alkanes in wheat straw wax so this was used to represent the
hydrocarbon wax group in the first order polynomial modelling. As octacosanol (C28)
is the only fatty alcohol which was measurable because of co-elution, the fatty alcohol
was not investigated.
Table 3.8: Coefficients for different wax groups
Wax group Coefficients
b0 b1 b2 b12
Fatty acid 0.0254 0.00465 -0.000476 -0.0134
Nonacosane 0.0170 -0.00260 0.00643 0.00705
Aldehyde 0.00267 -0.000826 0.0000205 -0.000162
Wax ester 0.0456 0.00520 0.0181 -0.0182
Sterol 0.0211 -0.0115 0.00570 0.00255
β-Diketone 0.0453 -0.0312 -0.00504 0.01780
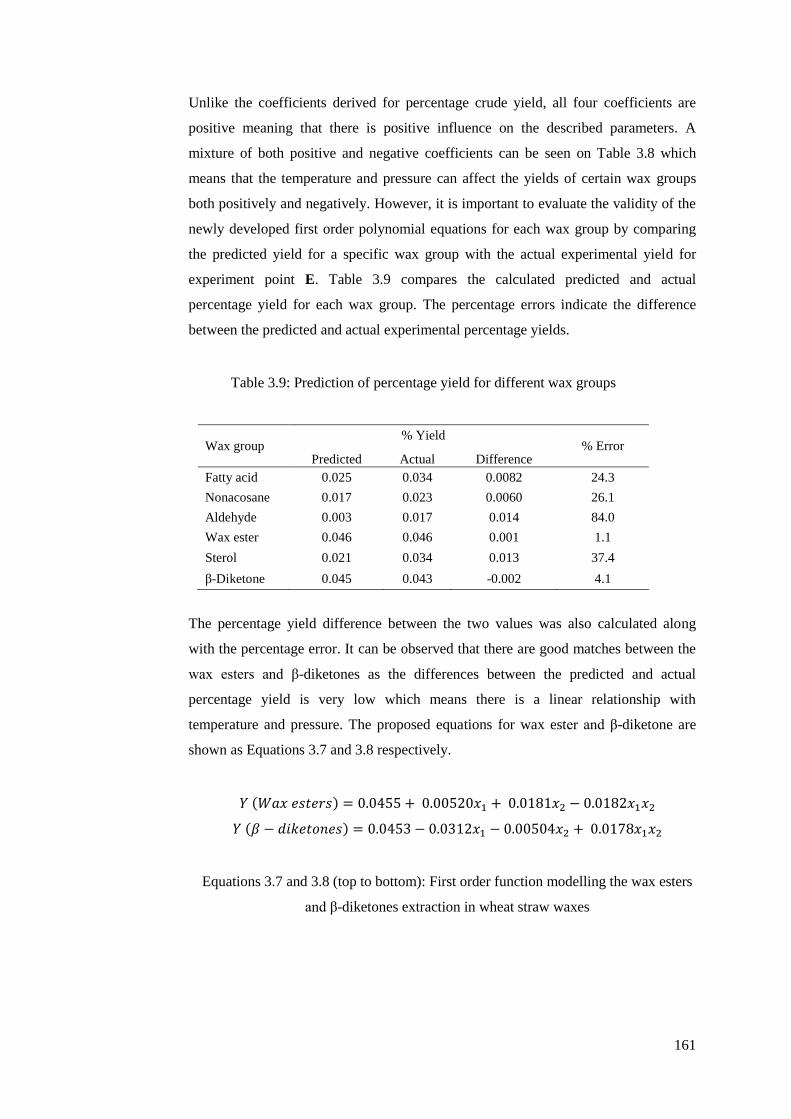
161
Unlike the coefficients derived for percentage crude yield, all four coefficients are
positive meaning that there is positive influence on the described parameters. A
mixture of both positive and negative coefficients can be seen on Table 3.8 which
means that the temperature and pressure can affect the yields of certain wax groups
both positively and negatively. However, it is important to evaluate the validity of the
newly developed first order polynomial equations for each wax group by comparing
the predicted yield for a specific wax group with the actual experimental yield for
experiment point E. Table 3.9 compares the calculated predicted and actual
percentage yield for each wax group. The percentage errors indicate the difference
between the predicted and actual experimental percentage yields.
Table 3.9: Prediction of percentage yield for different wax groups
Wax group % Yield
% Error Predicted Actual Difference
Fatty acid 0.025 0.034 0.0082 24.3
Nonacosane 0.017 0.023 0.0060 26.1
Aldehyde 0.003 0.017 0.014 84.0
Wax ester 0.046 0.046 0.001 1.1
Sterol 0.021 0.034 0.013 37.4
β-Diketone 0.045 0.043 -0.002 4.1
The percentage yield difference between the two values was also calculated along
with the percentage error. It can be observed that there are good matches between the
wax esters and β-diketones as the differences between the predicted and actual
percentage yield is very low which means there is a linear relationship with
temperature and pressure. The proposed equations for wax ester and β-diketone are
shown as Equations 3.7 and 3.8 respectively.
Equations 3.7 and 3.8 (top to bottom): First order function modelling the wax esters
and β-diketones extraction in wheat straw waxes
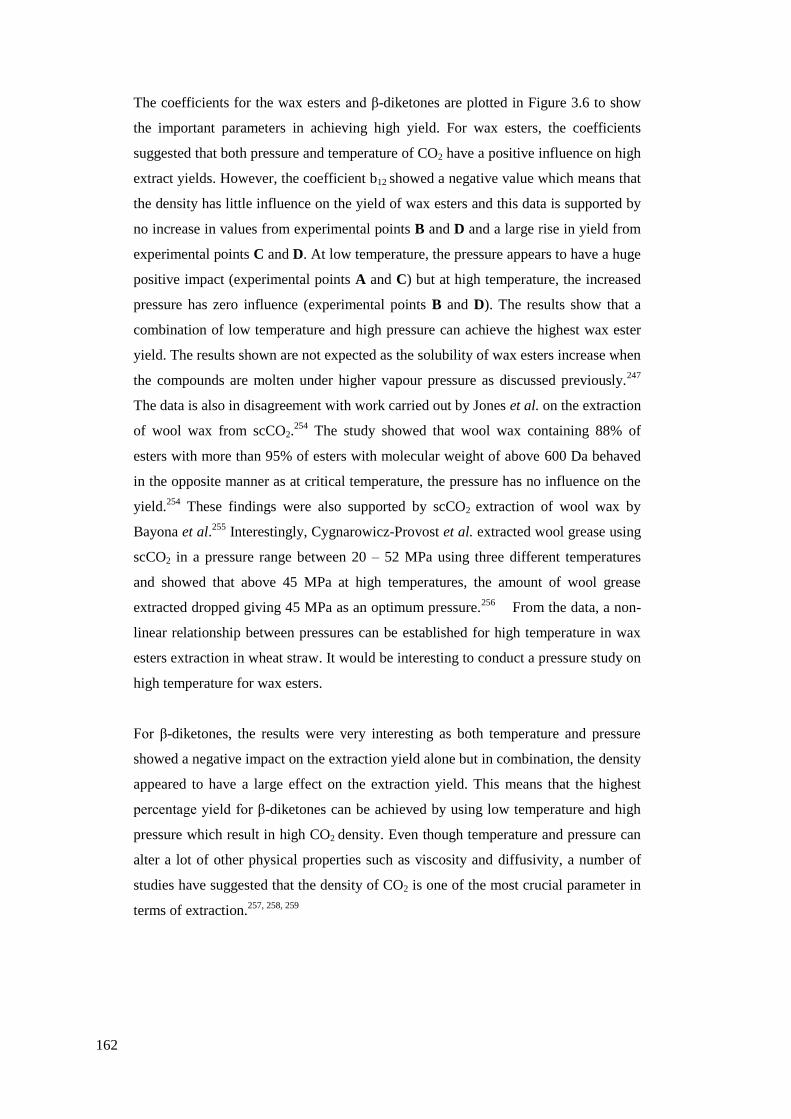
162
The coefficients for the wax esters and β-diketones are plotted in Figure 3.6 to show
the important parameters in achieving high yield. For wax esters, the coefficients
suggested that both pressure and temperature of CO2 have a positive influence on high
extract yields. However, the coefficient b12 showed a negative value which means that
the density has little influence on the yield of wax esters and this data is supported by
no increase in values from experimental points B and D and a large rise in yield from
experimental points C and D. At low temperature, the pressure appears to have a huge
positive impact (experimental points A and C) but at high temperature, the increased
pressure has zero influence (experimental points B and D). The results show that a
combination of low temperature and high pressure can achieve the highest wax ester
yield. The results shown are not expected as the solubility of wax esters increase when
the compounds are molten under higher vapour pressure as discussed previously.247
The data is also in disagreement with work carried out by Jones et al. on the extraction
of wool wax from scCO2.254
The study showed that wool wax containing 88% of
esters with more than 95% of esters with molecular weight of above 600 Da behaved
in the opposite manner as at critical temperature, the pressure has no influence on the
yield.254
These findings were also supported by scCO2 extraction of wool wax by
Bayona et al.255
Interestingly, Cygnarowicz-Provost et al. extracted wool grease using
scCO2 in a pressure range between 20 – 52 MPa using three different temperatures
and showed that above 45 MPa at high temperatures, the amount of wool grease
extracted dropped giving 45 MPa as an optimum pressure.256
From the data, a non-
linear relationship between pressures can be established for high temperature in wax
esters extraction in wheat straw. It would be interesting to conduct a pressure study on
high temperature for wax esters.
For β-diketones, the results were very interesting as both temperature and pressure
showed a negative impact on the extraction yield alone but in combination, the density
appeared to have a large effect on the extraction yield. This means that the highest
percentage yield for β-diketones can be achieved by using low temperature and high
pressure which result in high CO2 density. Even though temperature and pressure can
alter a lot of other physical properties such as viscosity and diffusivity, a number of
studies have suggested that the density of CO2 is one of the most crucial parameter in
terms of extraction.257, 258, 259
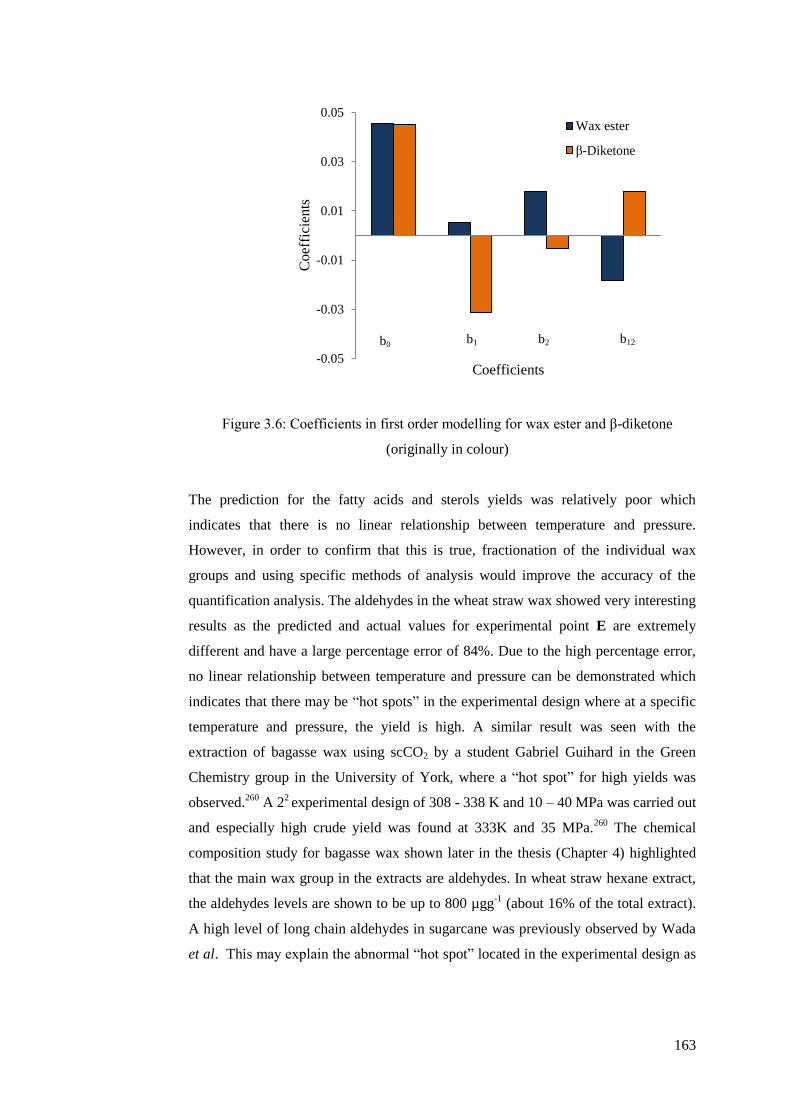
163
Figure 3.6: Coefficients in first order modelling for wax ester and β-diketone
(originally in colour)
The prediction for the fatty acids and sterols yields was relatively poor which
indicates that there is no linear relationship between temperature and pressure.
However, in order to confirm that this is true, fractionation of the individual wax
groups and using specific methods of analysis would improve the accuracy of the
quantification analysis. The aldehydes in the wheat straw wax showed very interesting
results as the predicted and actual values for experimental point E are extremely
different and have a large percentage error of 84%. Due to the high percentage error,
no linear relationship between temperature and pressure can be demonstrated which
indicates that there may be “hot spots” in the experimental design where at a specific
temperature and pressure, the yield is high. A similar result was seen with the
extraction of bagasse wax using scCO2 by a student Gabriel Guihard in the Green
Chemistry group in the University of York, where a “hot spot” for high yields was
observed.260
A 22 experimental design of 308 - 338 K and 10 – 40 MPa was carried out
and especially high crude yield was found at 333K and 35 MPa.260
The chemical
composition study for bagasse wax shown later in the thesis (Chapter 4) highlighted
that the main wax group in the extracts are aldehydes. In wheat straw hexane extract,
the aldehydes levels are shown to be up to 800 µgg-1
(about 16% of the total extract).
A high level of long chain aldehydes in sugarcane was previously observed by Wada
et al. This may explain the abnormal “hot spot” located in the experimental design as
-0.05
-0.03
-0.01
0.01
0.03
0.05
Co
effi
cien
ts
Coefficients
Wax ester
β-Diketone
b0 b1 b2 b12
164
aldehydes in waxes do not behave as predicted. It would be interesting to carry out
further extractions to try and understand the relationship of aldehyde extraction with
scCO2 extraction parameters.
3.2.5 Optimisation of wheat straw wax extraction using supercritical carbon
dioxide by Chrastil modelling
The effect of temperature and pressure on the wheat straw wax yield has been
previously analysed using first order polynomial function in order to establish any
relationship between temperature and pressure. The established first order functions
showed the positive and negative influence of temperature and pressure on the
extractions which are useful information when designing optimised scCO2 conditions
for maximum yields. Although the change in temperature and pressure of the system
ultimately reflects the change in density, as highlighted before other parameters such
as diffusivity and viscosity may also be altered. The yield of extracts is strongly
dependent on the solubility of the different compounds in scCO2 at specific
temperatures and pressures. Effectively, the wax compounds are assumed to be in
equilibrium between the straw and scCO2 so the supercritical solubility behaviour can
be calculated. In the past, many density-based supercritical models have been
explored to describe this behaviour (Chrastil, Del Valle and Aguilera, Adachi and Lu,
Méndez-Santiago and Teja, Bartle).261, 262, 263, 264
The most well-known density-based
empirical supercritical model was developed by Chrastil in 1982 and it is one of the
first models proposed which directly relates the solubility of solute and the density of
CO2.261
Many of the others are derived from the Chrastil model but modified to
improve their suitability for different circumstances. Del Valle and Aguilera
highlighted the limitations of the model such as high solute solubility and limited
temperature range in their study of extraction of vegetable oil and created an
“improved” equation to account for the variations of heat of vaporisation with
temperature.262
Adachi and Lu modified the Chrastil equation for more density
dependable functions within the model.265
Here, the original density-based Chrastil
equation was used to model the behaviour of wheat straw wax in scCO2 from nine
different extraction conditions in order to understand the behaviour of solvent and
solute interactions. The Chrastil model describes the association of solvent and solute
molecules in equilibrium resulting in the formation of a solvated complex. The
165
Chrastil equation is shown as Equation 3.9, where c is the mass of the extract (g)
divided by the volume of CO2 (g), k is the average number of solvent molecules in a
solvated complex, a is a function of the enthalpy of solvation and enthalpy of
vapourisation, b is a function of k, T is the temperature (K) and d is the density of
carbon dioxide (g.L-1
).261
Equation 3.9: Chrastil equation
Table 3.10 shows the nine different extraction conditions used for the Chrastil
modelling and the average mass of extracts recovered. The extractions are labelled as
experimental points A – I (with A – E corresponding to the previous first order
polynomial function). As a standard extraction time and flow rate were used in all the
extractions a total of 9.6 kg of CO2 was being used for each extraction. The total crude
yields for the nine experiment points are also listed in Table 3.10 and displayed as a
contour graph as Figure 3.7.
The content of the wax in the straw is low and only comprised 0.5 – 1.0% of the dry
weight so in order to achieve 1% crude yield, the extraction data showed that a
minimum temperature of 320 K and pressure of 25 MPa (density = 848.7 g.L-1
) is
required for the extraction.49
If a 1% crude yield can be achieved in the straw
extraction then a potential of 7.5 – 25 million tons of valuable waxes can be obtained
each year worldwide.49
By modelling the scCO2 extraction, this can ensure that a
certain crude yield can be achieved by applying specific temperature and pressure. A
full economic assessment must be carried out to establish the most financially viable
extraction conditions for the highest percentage crude yield. From Figure 3.7, it can be
observed that it is a combination of high pressure and temperature that enhanced the
percentage crude yield and these results are in agreement with other scCO2 straw wax
extractions.90
A temperature of 305 K and a pressure of 40 MPa results in a CO2
density of 982.4 g.L-1
and only gives a low yield of 0.67% confirming that the density
of CO2 is important. There are other factors that dictate the solubility of wax
constitutes in CO2. Both temperature and pressure dictate the density and dielectric
constant of the CO2 which influence the solvating power, thereby increasing the

166
solubility of solutes in the extracting fluid.266
Cuticular wax is semi-crystalline and
enough thermal energy is required in order to overcome the lattice energy and increase
the solubility of wax components.48
Table 3.10: Extraction conditions and percentage crude yield for Chrastil modelling
Experimental point Temp (K) Presure (MPa) Mass (g) Density (gL-1
) Crude yield (%)
A (n = 3) 305 40 0.87 981.9 0.67 ± 0.15
B (n = 3) 373 40 2.37 756.7 1.82 ± 0.22
C (n = 3) 305 7.5 0.37 365.9 0.29 ± 0.08
D (n = 3) 373 7.5 0.05 130.4 0.09 ± 0.02
E (n = 3) 338 25 1.25 761.9 0.83 ± 0.11
F (n = 3) 323 35 1.26 899.2 0.97 ± 0.14
G (n = 3) 373 25 1.27 588.5 0.98 ± 0.09
H (n = 3) 373 10 0.24 188.6 0.18 ± 0.02
I (n = 3) 323 7.5 0.2 193.9 0.15 ± 0.04
Figure 3.7: Percentage crude yield of wheat straw waxes from scCO2 extraction
(originally in colour)
According to the Chrastil model, ln(d) versus ln(c) at constant temperature should
give a straight line if the system obeys the theory.261
This model was applied to the
scCO2 extraction of the total crude yield and it was found that the extraction of wheat
straw wax obeys the model well. The coefficient can be improved when other
functions are incorporated into the Chrastil equation. Multiple linear regression was
300 310 320 330 340 350 360 370 3805
10
15
20
25
30
35
40
45
Pre
ssure
(M
Pa)
Temperature (K)
0
0.2
0.4
0.6
0.8
1.0
1.2
1.4
1.6
1.8
2.0
% Crude yield1%
167
applied to the ln(d) and ln(c) crude yield data to obtain the coefficients k, a and b. The
crude yield of wheat straw waxes extracted using scCO2 can be predicted using
equation 3.10 with r2 = 0.96.
Equation 3.10: Chrastil equation modelling the scCO2 extraction of wheat straw
waxes
Figure 3.8 shows a linear relationship between experimental ln(c) and predicted ln(c)
between (305 K and 7.5 MPa) to (373 K and 40 MPa) which indicated the extraction
can be modelled using Equation 3.10 derived from the Chrastil model. From Figure
3.7, it can be concluded that high temperature and pressure would favour the
extraction of waxes from wheat straw. This finding is in agreement with previous first
order polynomial modelling of temperature and pressure.
However, as part of the straw bio-refinery, it is crucial that the straw remained in a
usable condition for exploitation such as co-firing for energy or microwave pyrolysis
for bio-oil so the high temperature and pressure conditions must not alter the physical
condition of the straw residues.19
This is where the use of CO2 as a solvent is superior
to traditional organic solvents as the straw residues are left completely solvent-free,
unlike solvent extractions where an extra drying step may be required after extraction.
The limitation of the model (temperature 305 - 373K and pressure 7.5 - 40 MPa)
might mean that the optimum wax extraction conditions may not have been reached.
Most large commercial plants built in the 1980s and 1990s will not operate above 35
MPa due to equipment design so the maximum pressure would be limited. However,
modern plants have been designed to operate at up to 55 MPa so the extraction times
can be significantly reduced. Operating at a high pressure means scCO2 extraction is
an energy intensive and costly process, so a full economic assessment must be carried
out to calculate the extra costs against extra wax yield. The total wax content present
on the straw surfaces is unknown at this stage so it is difficult to conclude that the
straw has been completely de-waxed and extraction has gone to completion. Further
extending the models extraction limits would be of interest from an academic point,

168
but would add limited commercial value due to the added cost of production scale
extractions at higher pressures.
Figure 3.8: Experimental ln(c) against predicted ln(c) for percentage crude yield
(originally in colour)
For the first time, the Chrastil equation has been applied to just a single group of
molecules within a complex mixture of molecules. As in previous first order
polynomial modelling, hydrocarbons and fatty alcohols were omitted due to co-elution
of hentriacontane (C31) and octacosanol (C28). Nonacosane (C29) was used to represent
hydrocarbon wax group and the fatty alcohol wax group was not investigated. The
same multiple linear regression was applied with the mass of wax group extracted in
ln(c) with ln(d) to calculate new k, a and b for the development of a new model that is
specific to the different wax groups. Table 3.11 shows the values for coefficients k, a
and b for the selected wax groups.
-11.5
-11
-10.5
-10
-9.5
-9
-8.5
-8
-11.5 -11 -10.5 -10 -9.5 -9 -8.5 -8
Pre
dic
ted
ln
(c)
Experimental ln(c)
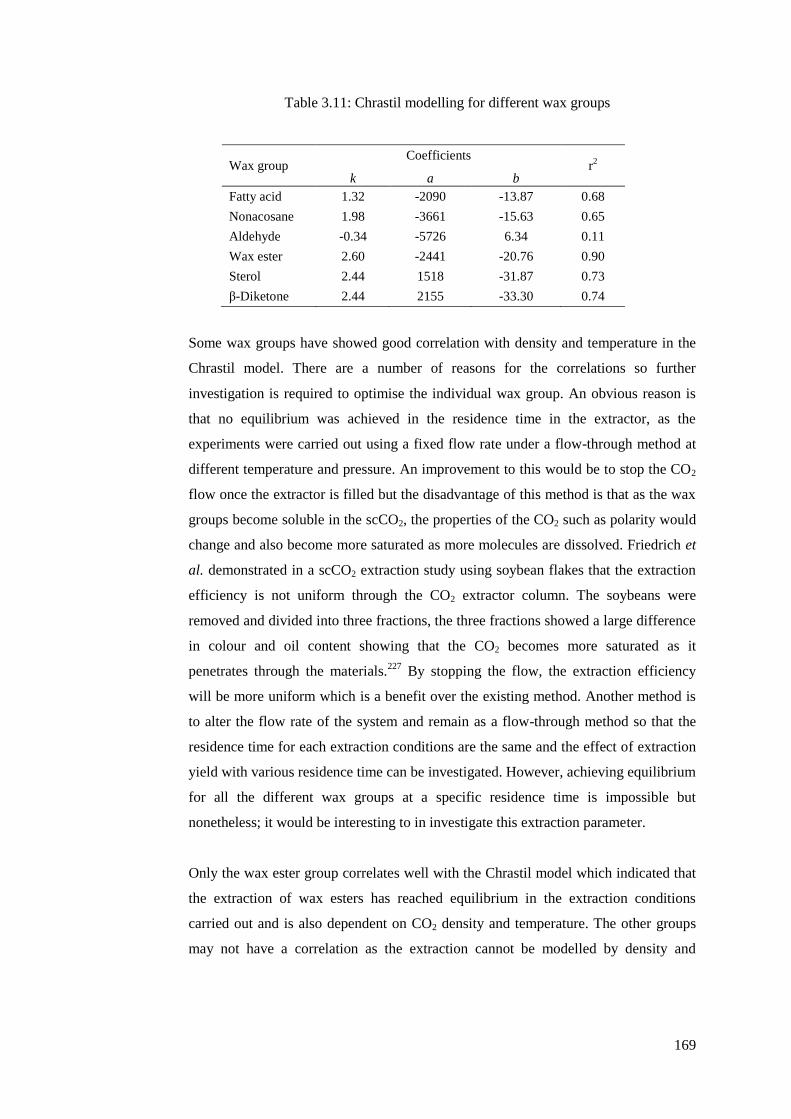
169
Table 3.11: Chrastil modelling for different wax groups
Wax group Coefficients
r2
k a b
Fatty acid 1.32 -2090 -13.87 0.68
Nonacosane 1.98 -3661 -15.63 0.65
Aldehyde -0.34 -5726 6.34 0.11
Wax ester 2.60 -2441 -20.76 0.90
Sterol 2.44 1518 -31.87 0.73
β-Diketone 2.44 2155 -33.30 0.74
Some wax groups have showed good correlation with density and temperature in the
Chrastil model. There are a number of reasons for the correlations so further
investigation is required to optimise the individual wax group. An obvious reason is
that no equilibrium was achieved in the residence time in the extractor, as the
experiments were carried out using a fixed flow rate under a flow-through method at
different temperature and pressure. An improvement to this would be to stop the CO2
flow once the extractor is filled but the disadvantage of this method is that as the wax
groups become soluble in the scCO2, the properties of the CO2 such as polarity would
change and also become more saturated as more molecules are dissolved. Friedrich et
al. demonstrated in a scCO2 extraction study using soybean flakes that the extraction
efficiency is not uniform through the CO2 extractor column. The soybeans were
removed and divided into three fractions, the three fractions showed a large difference
in colour and oil content showing that the CO2 becomes more saturated as it
penetrates through the materials.227
By stopping the flow, the extraction efficiency
will be more uniform which is a benefit over the existing method. Another method is
to alter the flow rate of the system and remain as a flow-through method so that the
residence time for each extraction conditions are the same and the effect of extraction
yield with various residence time can be investigated. However, achieving equilibrium
for all the different wax groups at a specific residence time is impossible but
nonetheless; it would be interesting to in investigate this extraction parameter.
Only the wax ester group correlates well with the Chrastil model which indicated that
the extraction of wax esters has reached equilibrium in the extraction conditions
carried out and is also dependent on CO2 density and temperature. The other groups
may not have a correlation as the extraction cannot be modelled by density and
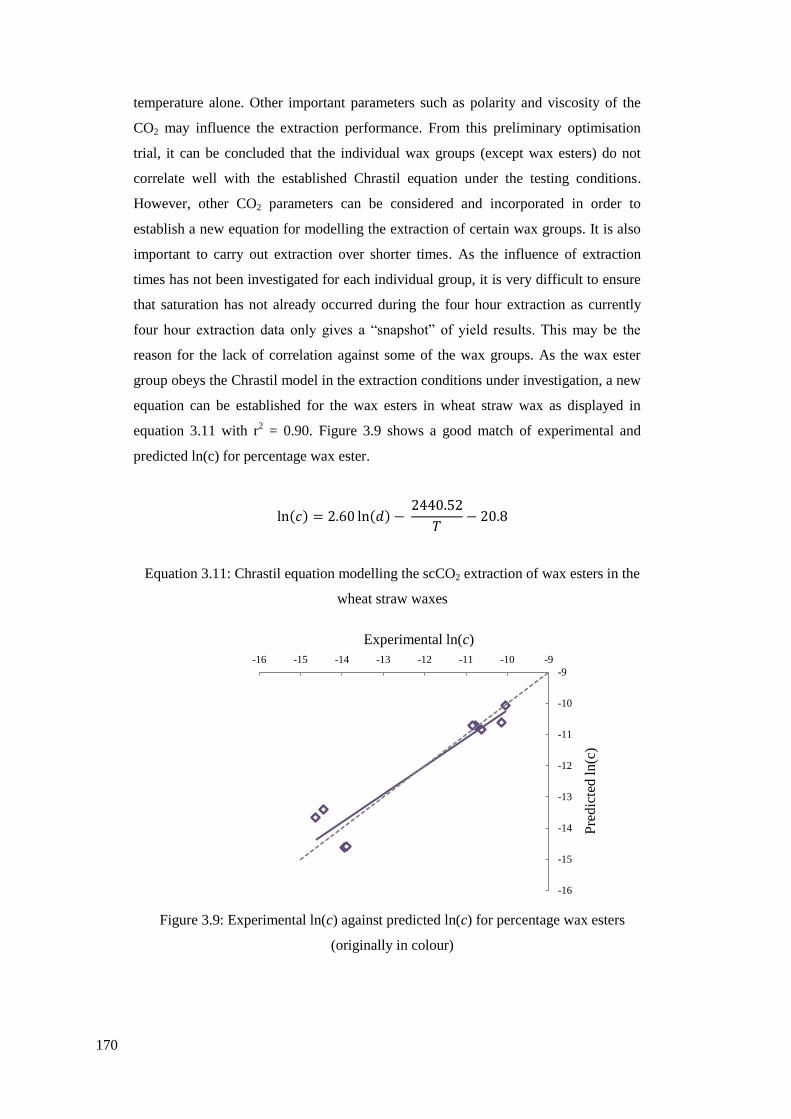
170
temperature alone. Other important parameters such as polarity and viscosity of the
CO2 may influence the extraction performance. From this preliminary optimisation
trial, it can be concluded that the individual wax groups (except wax esters) do not
correlate well with the established Chrastil equation under the testing conditions.
However, other CO2 parameters can be considered and incorporated in order to
establish a new equation for modelling the extraction of certain wax groups. It is also
important to carry out extraction over shorter times. As the influence of extraction
times has not been investigated for each individual group, it is very difficult to ensure
that saturation has not already occurred during the four hour extraction as currently
four hour extraction data only gives a “snapshot” of yield results. This may be the
reason for the lack of correlation against some of the wax groups. As the wax ester
group obeys the Chrastil model in the extraction conditions under investigation, a new
equation can be established for the wax esters in wheat straw wax as displayed in
equation 3.11 with r2 = 0.90. Figure 3.9 shows a good match of experimental and
predicted ln(c) for percentage wax ester.
Equation 3.11: Chrastil equation modelling the scCO2 extraction of wax esters in the
wheat straw waxes
Figure 3.9: Experimental ln(c) against predicted ln(c) for percentage wax esters
(originally in colour)
-16
-15
-14
-13
-12
-11
-10
-9
-16 -15 -14 -13 -12 -11 -10 -9
Pre
dic
ted
ln(c
)
Experimental ln(c)

171
As shown in Figure 3.9, there were two distinct clusters of points in which low ln(c)
indicated high wax esters yield and high ln(c) showed low wax esters yield. The trend
cannot be explained by density of CO2 alone. It can be noted that extractions carried
out using 25 MPa or higher belonged to the higher wax esters yield. There are two
opposing factors that are important for wax esters extraction. The elevated extraction
temperature leads to high Tm long chain wax esters melting on straw surfaces so
therefore increasing the solubility in CO2. However, the increase of temperature
would result in the decrease in CO2 density leading to reduced solvating power of
solvent so therefore it is vital to understand and optimise the influence of extraction
conditions through modelling.
It can be concluded that using the existing extraction conditions, the percentage crude
yield and wax ester yield can be predicted using the Chrastil model. More work is
needed to investigate extraction time and establishing equilibrium of wax molecules
between CO2 and straw. New density-based models may need to be developed in
order to describe the extraction of wheat straw wax completely.
3.3 Identification and quantification of key wax components in wheat straw wax
The different key wax components have been successfully identified with the full
identification process described in Chapter 2. The compounds found in the scCO2 extracts
were identical to the wax components identified in the solvent extracts. The use of scCO2 at
different temperatures and pressures has been used to replace traditional organic solvents so
it is not surprising that the wax compounds identified are identical. The calibrations used for
the quantification of the scCO2 extracts are detailed in Section 2.5.1. The percentages are all
normalised to 100% for the percentage of wax groups within the extracts. Liquid CO2 and
scCO2 with co-solvent ethanol are labelled with different colours (dark grey and light grey)
in order to distinguish between the extracts. Co-elution of compounds often occurs when
analysing crude samples directly and without fractionation. In the wheat straw wax,
hentriacontane (C31) and octacosanol (C28) eluted with the same retention times so the
quantified percentage of both compounds is indicated as patterned bars in the Figures. The
use of CO2 as a solvent at different temperatures and pressures has often been compared
with different traditional organic solvents. Since it is the first time that any quantification of
wax components has been carried out in wheat straw waxes extracted using CO2 so no

172
comparison with previous literature were made thus the results are compared with data
previously reported from solvent extracts in Chapter 2.
3.3.1 Free fatty acids
A total of five free fatty acids were identified in the CO2 extracts and these are
tetradecanoic acid (C14:0), hexadecanoic acid (C16:0), octadecadienoic acid (C18:2),
octadecenoic acid (C18:1) and octadecanoic acid (C18:0). The fatty acids presented in the
CO2 extracts are all even-numbered and are one of the shortest aliphatic carbon chain
wax compounds identified in the wheat straw wax. Due to their relatively short
aliphatic carbon chain, it can be expected the compounds are highly soluble in CO2.
This was reflected by the quantities of the total free fatty acids presented which varied
depending on extraction conditions and this is displayed as Figure 3.10. Percentages
ranged of 5.6 – 29.5% of free fatty acids were reported in the scCO2 extracts and
liquid CO2 and scCO2 with ethanol consist of a low percentage of 7.2% and 3.6%
respectively.
Figure 3.10: Percentage of total free fatty acids in CO2 crude extracts (originally in
colour)
5.6
12.5
16.0
11.7
7.6
17.9
29.5
20.0
7.2
3.6
0.0
5.0
10.0
15.0
20.0
25.0
30.0
% i
n c
rude
extr
act
CO2 conditions

173
From Figure 3.11, hexadecanoic acid (C16:0) is shown to be the most abundant free
fatty acids in the CO2 extracts which is the same as identified in the solvent extracts.
About 14.5% of hexadecanoic acid (C16:0) in 373 K and 10 MPa scCO2 extract and the
yield data suggested that low CO2 density tend to lead to relatively high free fatty
acid extracts due to other wax components identified in the extracts not being soluble
at such low CO2 density. It is difficult to predict the extent of solubility of free fatty
acids in scCO2 under different conditions from wheat straw but significant studies
have been carried out to establish the solubility of free fatty acids in scCO2. Other
factors will affect the solubility behaviour of free fatty acids in wheat straw wax
extraction as properties such as polarity of the CO2 will alter as wax molecules
become soluble in the solvent and other issues such as diffusivity of CO2 which would
impact on the penetration of CO2 through the straw to solubilise the compounds. In a
multi-component system, the solubility of compounds may be impeded or enhanced
when other compounds become soluble in the CO2 which can then effectively act as a
“co-solvent” and the extent of this effect is highly dependent on the other wax
compounds, its quantities and the location of various wax compounds in the straw.267
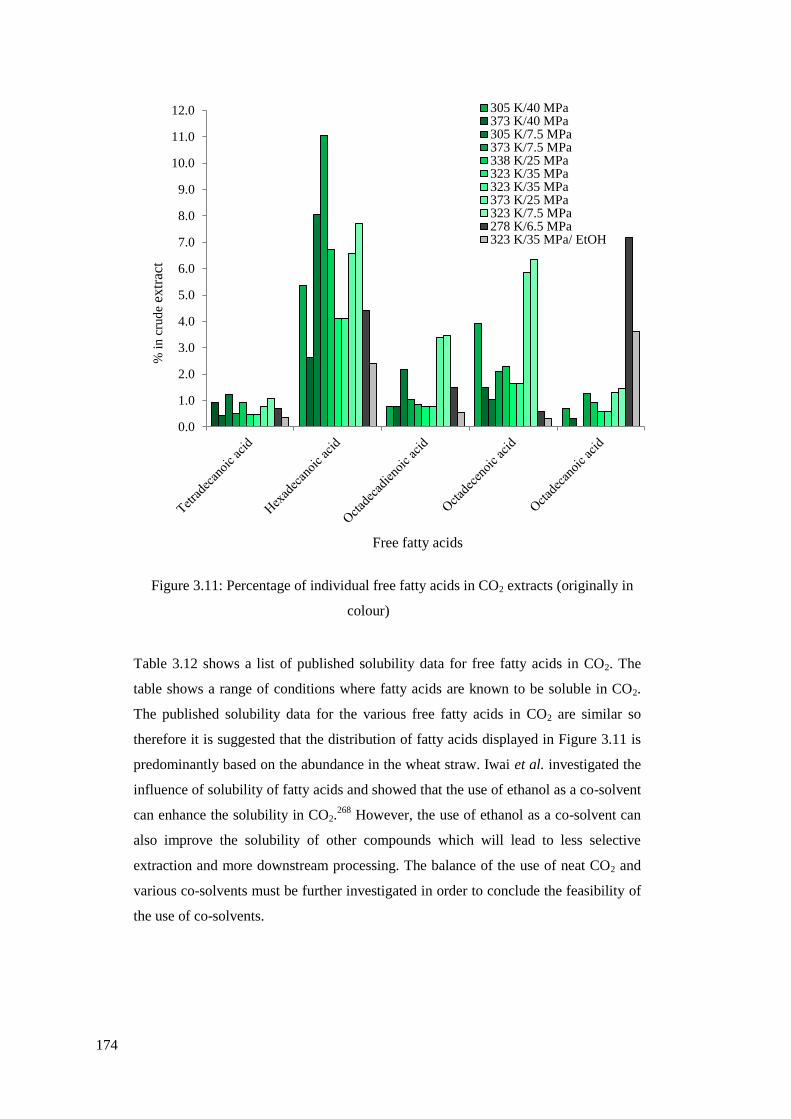
174
Figure 3.11: Percentage of individual free fatty acids in CO2 extracts (originally in
colour)
Table 3.12 shows a list of published solubility data for free fatty acids in CO2. The
table shows a range of conditions where fatty acids are known to be soluble in CO2.
The published solubility data for the various free fatty acids in CO2 are similar so
therefore it is suggested that the distribution of fatty acids displayed in Figure 3.11 is
predominantly based on the abundance in the wheat straw. Iwai et al. investigated the
influence of solubility of fatty acids and showed that the use of ethanol as a co-solvent
can enhance the solubility in CO2.268
However, the use of ethanol as a co-solvent can
also improve the solubility of other compounds which will lead to less selective
extraction and more downstream processing. The balance of the use of neat CO2 and
various co-solvents must be further investigated in order to conclude the feasibility of
the use of co-solvents.
0.0
1.0
2.0
3.0
4.0
5.0
6.0
7.0
8.0
9.0
10.0
11.0
12.0
% i
n c
rud
e ex
trac
t
Free fatty acids
305 K/40 MPa373 K/40 MPa305 K/7.5 MPa373 K/7.5 MPa338 K/25 MPa323 K/35 MPa323 K/35 MPa373 K/25 MPa323 K/7.5 MPa278 K/6.5 MPa323 K/35 MPa/ EtOH

175
Table 3.12: Published solubility data for fatty acids in CO2269
Fatty acids Temperature
range (K)
Pressure range
(MPa)
Density range
(gL-1
)
Solubility (kg/kg
of CO2)
Tetradecanoic acid
(C14:0) 308 - 333 14 - 41.9 563 - 980 0.5 x 10
2 - 63 x 10
2
Hexadecanoic acid
(C16:0) 308 - 328 13.8 - 41.4 620 - 976 1.9 x 10
3 - 76 x 10
3
Octadecadienoic acid
(C18:2) 313 - 333 13.8 - 27.6 563 - 899
0.11 x 10² - 2.7 x
102
Octadecenoic acid
(C18:1) 313 - 333 13.8 -27.6 563 - 899
0.048 x 10² - 2.3 x
102
Octadecanoic acid
(C18:0) 308 - 328 13.8 - 41.2 620 - 976
0.28 x 10³ - 33 x
103
3.3.2 Hydrocarbons
As identified previously, the hydrocarbons in the solvent extracts were all exclusively
n-alkanes with odd-numbers due to the wax biosynthetic mechanism.82
The four main
n-alkanes identified were heptacosane (C27), nonacosane (C29), hentriacontane (C31)
and triatriacontane (C33) which were also identified in the solvent extracts. Figure 3.12
shows the percentage of total alkanes in the extracts and the co-elution has been
highlighted. Further work of fractionation is needed to be carried out for alkane
fractions. In Figure 3.13, the breakdown of the individual alkanes is displayed and
nonacosane (C29) and hentriacontane (C31) were found to be the most abundant n-
alkanes which is also consistent with the solvent data in Chapter 2.

176
Figure 3.12: Percentage of total n-alkanes in CO2 crude extracts (originally in
colour)
Figure 3.13: Percentage of individual n-alkanes in CO2 extracts (originally in colour)
0.0
2.0
4.0
6.0
8.0
10.0
12.0
14.0
16.0
18.0
% i
n c
rud
e ex
trac
t
CO2 conditions
0.0
1.0
2.0
3.0
4.0
5.0
6.0
7.0
8.0
9.0
10.0
11.0
12.0
13.0
14.0
15.0
16.0
Heptacosane Nonacosane Hentriacontane Triatriacontane
% i
n c
rude
extr
act
Hydrocarbons
305 K/40 MPa
373 K/40 MPa
305 K/7.5 MPa
373 K/7.5 MPa
338 K/25 MPa
323 K/35 MPa
373 K/25 MPa
323 K/7.5 MPa
373 K/10 MPa
278 K/6.5 MPa
323 K/35 MPa/ EtOH
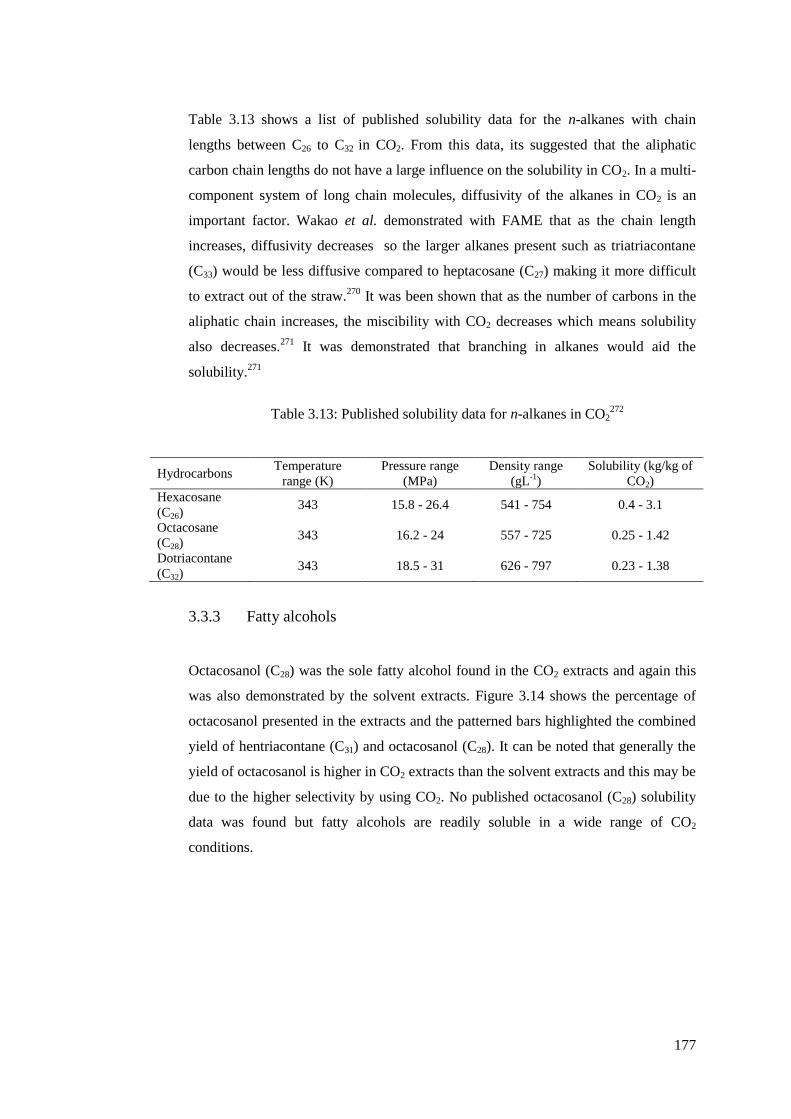
177
Table 3.13 shows a list of published solubility data for the n-alkanes with chain
lengths between C26 to C32 in CO2. From this data, its suggested that the aliphatic
carbon chain lengths do not have a large influence on the solubility in CO2. In a multi-
component system of long chain molecules, diffusivity of the alkanes in CO2 is an
important factor. Wakao et al. demonstrated with FAME that as the chain length
increases, diffusivity decreases so the larger alkanes present such as triatriacontane
(C33) would be less diffusive compared to heptacosane (C27) making it more difficult
to extract out of the straw.270
It was been shown that as the number of carbons in the
aliphatic chain increases, the miscibility with CO2 decreases which means solubility
also decreases.271
It was demonstrated that branching in alkanes would aid the
solubility.271
Table 3.13: Published solubility data for n-alkanes in CO2272
Hydrocarbons Temperature
range (K)
Pressure range
(MPa)
Density range
(gL-1
)
Solubility (kg/kg of
CO2)
Hexacosane
(C26) 343 15.8 - 26.4 541 - 754 0.4 - 3.1
Octacosane
(C28) 343 16.2 - 24 557 - 725 0.25 - 1.42
Dotriacontane
(C32) 343 18.5 - 31 626 - 797 0.23 - 1.38
3.3.3 Fatty alcohols
Octacosanol (C28) was the sole fatty alcohol found in the CO2 extracts and again this
was also demonstrated by the solvent extracts. Figure 3.14 shows the percentage of
octacosanol presented in the extracts and the patterned bars highlighted the combined
yield of hentriacontane (C31) and octacosanol (C28). It can be noted that generally the
yield of octacosanol is higher in CO2 extracts than the solvent extracts and this may be
due to the higher selectivity by using CO2. No published octacosanol (C28) solubility
data was found but fatty alcohols are readily soluble in a wide range of CO2
conditions.
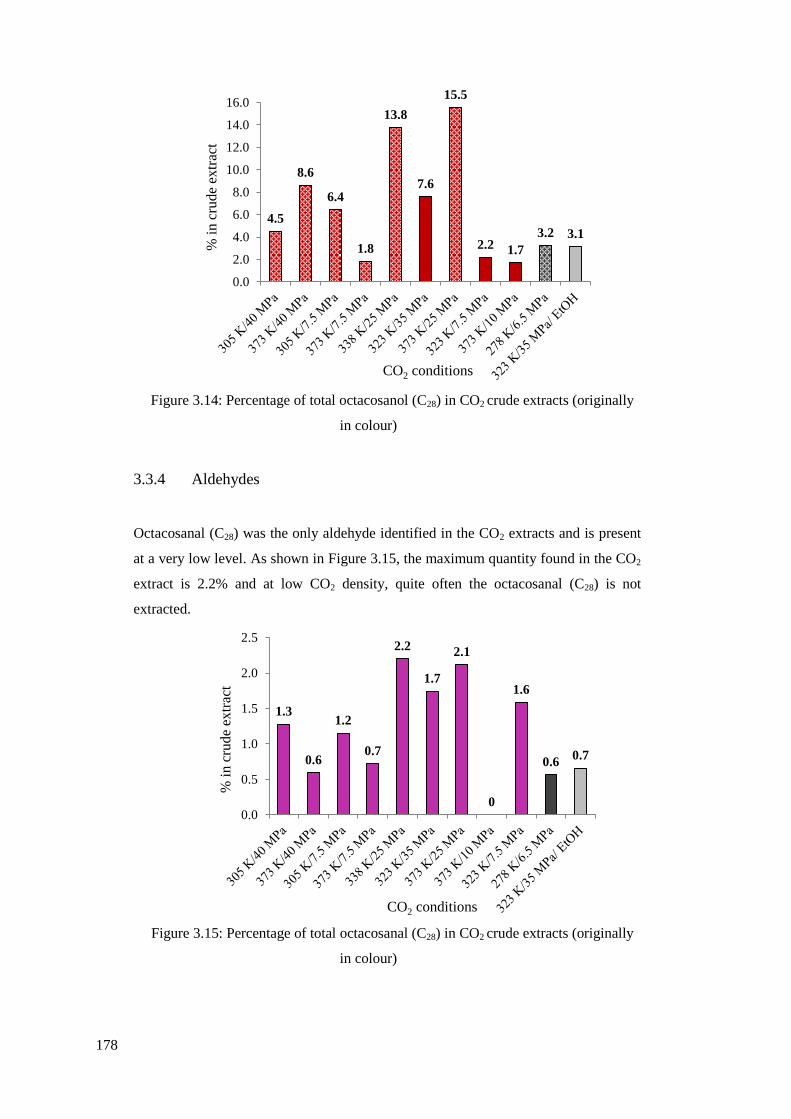
178
Figure 3.14: Percentage of total octacosanol (C28) in CO2 crude extracts (originally
in colour)
3.3.4 Aldehydes
Octacosanal (C28) was the only aldehyde identified in the CO2 extracts and is present
at a very low level. As shown in Figure 3.15, the maximum quantity found in the CO2
extract is 2.2% and at low CO2 density, quite often the octacosanal (C28) is not
extracted.
Figure 3.15: Percentage of total octacosanal (C28) in CO2 crude extracts (originally
in colour)
4.5
8.6
6.4
1.8
13.8
7.6
15.5
2.2 1.7
3.2 3.1
0.0
2.0
4.0
6.0
8.0
10.0
12.0
14.0
16.0
% i
n c
rud
e ex
trac
t
CO2 conditions
1.3
0.6
1.2
0.7
2.2
1.7
2.1
0
1.6
0.6 0.7
0.0
0.5
1.0
1.5
2.0
2.5
% i
n c
rude
extr
act
CO2 conditions

179
3.3.5 Wax esters
Aliphatic wax esters are the main wax group presented in the CO2 extracts at levels up
to 30.1% of the extracts. The percentage yields of wax esters found in the CO2
extracts are displayed in Figure 3.16. Wax esters of C40 – C56 chain length were found
in the CO2 extracts as shown in Figure 3.17. As discussed previously the wax esters
were predominantly octacosanol (C28) and hexadecanoic acid (C16) and these are some
of the most abundant wax compounds in their free form. Octacosanyl hexadecanoate
(C28:C16) and octacosanyl octadecanoate (C28:C18) were the main aliphatic wax esters
identified. No published solubility data was found for long chain wax esters but
Dandge et al. published data on methyl and ethyl esters and found that the presence of
the ester functional group can increase the solubility of the equivalent chain length
compound.271
The solubility would be lower in the wax esters present in wheat straw
as the aliphatic carbon chain lengths are much higher. The scCO2 with co-solvent
ethanol showed a very high percentage of wax esters in the extract and it has been
demonstrated that the use of co-solvent can enhance of the solubility of esters.273
The
use of ethanol as an addition to supercritical CO2 does not have any economic
advantages over the use of neat scCO2 as high temperatures and pressures are both
still required for the increased yield.
Figure 3.16: Percentage of wax esters in CO2 crude extracts (originally in colour)
26.6
17.6
1.4
18.4 16.1
30.1
14.6
1.8
4.6
0.7
26.0
0.0
5.0
10.0
15.0
20.0
25.0
30.0
35.0
% i
n c
rude
extr
act
CO2 conditions

180
Figure 3.17: Percentage of individual wax esters in CO2 extracts (originally in
colour)
3.3.6 Sterols
Sterols and their derivatives were found at between 0.5 – 27.4% in the CO2 extracts as
shown in Figure 3.18. The 3 main plant sterols, campesterol, stigmasterol and β-
sitosterol were identified again in the CO2 extracts with β-sitosterol being the most
abundant which is in agreement with the solvent extracts. The relative abundance for
the individual molecule and the percentage presented in the crude extracts is shown in
Figure 3.19. The second most abundant sterol derivative in the extracts was the
oxidised form of β-sitosterol: ∆4
-sitosten-3-one, which was also found to be a
molecule of high abundance in the solvent extracts.
0.0
1.0
2.0
3.0
4.0
5.0
6.0
7.0
8.0
9.0
10.0
% i
n c
rud
e ex
trac
t
Wax esters
373 K/7.5 MPa
373 K/40 MPa
373 K/7.5 MPa
373 K/40 MPa
338 K/25 MPa
323 K/35 MPa
373 K/25 MPa
373 K/10 MPa
323 K/7.5 MPa
278 K/6.5 MPa
323 K/35 MPa/ EtOH
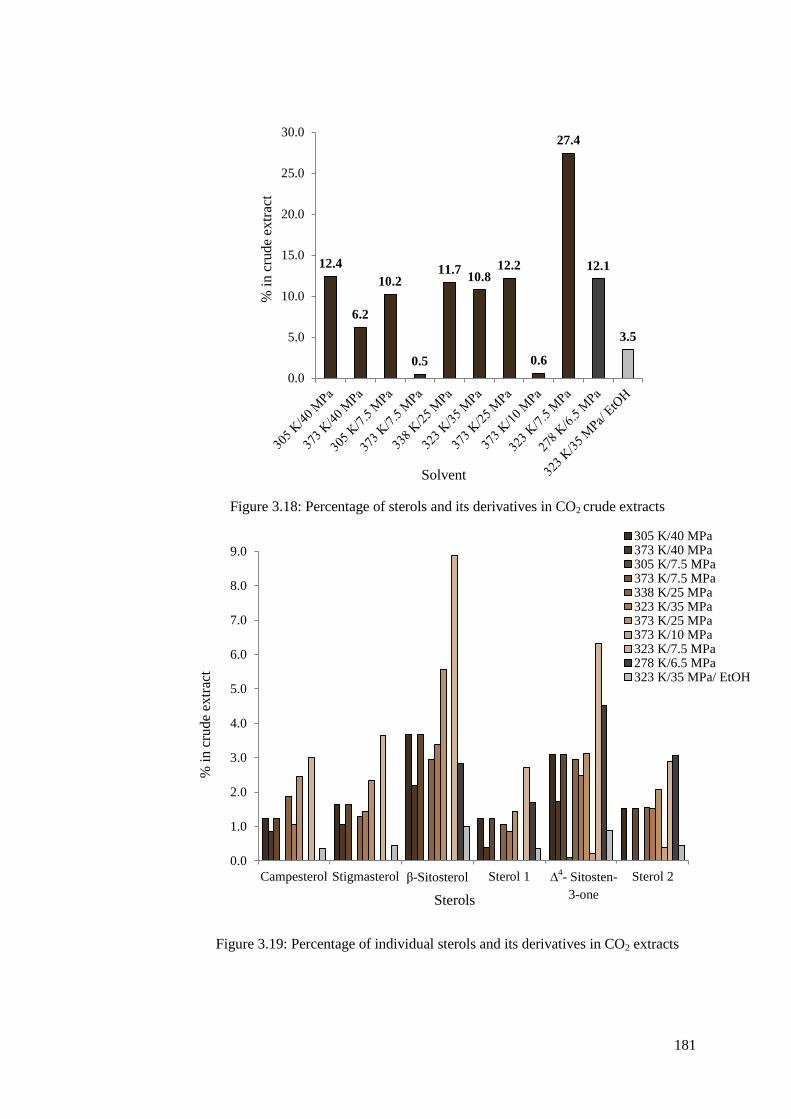
181
Figure 3.18: Percentage of sterols and its derivatives in CO2 crude extracts
Figure 3.19: Percentage of individual sterols and its derivatives in CO2 extracts
12.4
6.2
10.2
0.5
11.7 10.8
12.2
0.6
27.4
12.1
3.5
0.0
5.0
10.0
15.0
20.0
25.0
30.0
% i
n c
rud
e ex
trac
t
Solvent
0.0
1.0
2.0
3.0
4.0
5.0
6.0
7.0
8.0
9.0
Campesterol Stigmasterol β-Sitosterol Sterol 1 Sterol 2
% i
n c
rude
extr
act
Sterols
305 K/40 MPa373 K/40 MPa305 K/7.5 MPa373 K/7.5 MPa338 K/25 MPa323 K/35 MPa373 K/25 MPa373 K/10 MPa323 K/7.5 MPa278 K/6.5 MPa323 K/35 MPa/ EtOH
∆4- Sitosten-
3-one
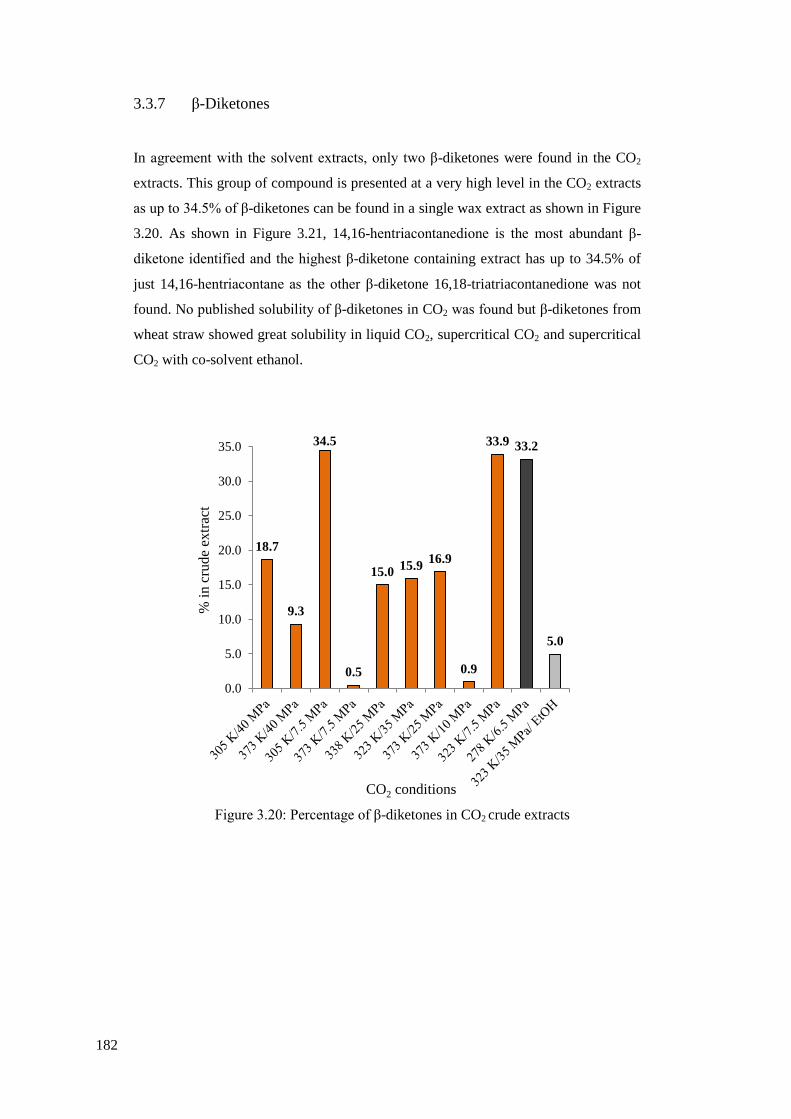
182
3.3.7 β-Diketones
In agreement with the solvent extracts, only two β-diketones were found in the CO2
extracts. This group of compound is presented at a very high level in the CO2 extracts
as up to 34.5% of β-diketones can be found in a single wax extract as shown in Figure
3.20. As shown in Figure 3.21, 14,16-hentriacontanedione is the most abundant β-
diketone identified and the highest β-diketone containing extract has up to 34.5% of
just 14,16-hentriacontane as the other β-diketone 16,18-triatriacontanedione was not
found. No published solubility of β-diketones in CO2 was found but β-diketones from
wheat straw showed great solubility in liquid CO2, supercritical CO2 and supercritical
CO2 with co-solvent ethanol.
Figure 3.20: Percentage of β-diketones in CO2 crude extracts
18.7
9.3
34.5
0.5
15.0 15.9
16.9
0.9
33.9 33.2
5.0
0.0
5.0
10.0
15.0
20.0
25.0
30.0
35.0
% i
n c
rude
extr
act
CO2 conditions

183
Figure 3.21: Percentage of individual β-diketones in CO2 extracts
3.3.8 Summary of wax components quantified in CO2 extracts
The lipophilic fraction of the wheat straw wax from different CO2 extracts were
successfully identified and quantified. The wax compounds identified were identical
to the solvent extracts so it can be concluded that the difference between both organic
solvent and CO2 extracts obtained under different conditions is the relative abundance
of the wax compounds. The quantified components were grouped and plotted against
the percentage yield as shown in Figure 3.22 and the data is also displayed in Table
3.14. Unlike the solvent extracts where up to 84% of the extracts were not identified
using GC-FID, only 43% of unidentified compounds were present in CO2 extracts.
This suggests that using CO2 as a solvent is more selective for wax extracts. By
simply manipulating the temperature and pressure of the CO2 conditions, it is possible
to change the solubility of wax compounds to give a distinct mixture of wax
compounds which was apparent through colour, texture and odour. The colour of the
straw waxes ranged from light yellow to a darker brown-yellow. The liquid CO2
0.0
5.0
10.0
15.0
20.0
25.0
30.0
35.0
14,16-Hentriacontanedione 16,18-Triatriacontanedione
% i
n c
rud
e ex
trac
t
β-Diketones
305 K/40 MPa
373 K/40 MPa
305 K/7.5 MPa
373 K/7.5 MPa
338 K/25 MPa
323 K/35 MPa
373 K/25 MPa
373 K/10 MPa
323 K/7.5 MPa
278 K/6.5 MPa
323 K/35 MPa/ EtOH

184
extract was the lightest and the supercritical CO2 extract was the darkest in colour and
this can reflect the selectivity of wax compounds in Figure 3.22.
Liquid CO2 is selective for smaller molecular weight compounds as the solubility of
wax compounds in liquid CO2 was lower compared to CO2 under supercritical
conditions and this was reflected by the lack of wax esters in the extract. For this
reason, it can be concluded that the use of liquid CO2 is not ideal for the extraction of
wheat straw waxes but could be used as a pre-treatment process to extract some of the
wax compounds selectively and then increasethe temperature and pressure of the CO2
above its critical point to extract the wax esters remaining on the straw. This would
result in one fraction containing the majority of wax groups (free fatty acids,
hydrocarbons, fatty alcohols, aldehydes, sterols and β-diketones) and another high
wax esters-containing fraction. A 10% co-solvent ethanol was also explored and it
showed the solubility of compounds increased due to the increased polarity. This can
be seen from the rise in extraction yield from 1% to 1.6% but the percentage of
identified lipophilic compounds remain the same so it can be concluded that the use of
10% ethanol as a co-solvent has no advantage over the use of neat CO2 under the
same conditions. However, the use of ethanol has been shown to increase the
solubility of wax esters by giving the highest percentage of wax esters presented in the
extract.
The identified wax compounds were shown as µg per g of wheat straw in Table 3.15
and some important trends have been noted. In hydrocarbons, at medium pressure
(338K/373K and 25 MPa), the elevated temperature does not appear to have any
beneficial effect on the yield. When the temperature was increased from 305 K to 373
K at 40 MPa, the level of alkanes almost tripled. This highlighted the importance of
increased pressure on alkane extraction. For sterols, the data from Table 1 shows
increased pressure from 25 to 40 MPa does not have a significant effect on sterol yield
which indicated that increasing the CO2 density to above 600 g.L-1
would not benefit
sterol extraction. Up to 30% of long chain aliphatic wax esters are extracted at high
temperature (373 K). The data showed that a higher proportion of wax esters have
been extracted at higher temperature which could be due to the high melting points.
The melting point (Tm) of wax esters are much higher than other compounds found in
the extracts due to the extended chain length. Saturated wax ester tetracosanyl
tetracosanate (C24:0 – C24:0) has a Tm of > 348 K and an increase of 1 – 2 °C per extra

185
carbon on the molecules.274
The main factor influencing the Tm was shown to be the
chain length of the wax esters.274
The smallest wax ester identified was tetracosanyl
hexacosanoate (C24:0 – C26:0) and this means that the fraction is not molten until the
extraction temperature is at least 348 K. At high (373 K) temperature, it is believed
that the wax esters melt on the surface of the straw which can enhance the solubility
of these long chain wax esters (> C40) in scCO2. With β-diketones, it is important to
note that about 1000 µg.g-1
of 14,16 hentriacontanedione in straw can be extracted at
critical temperature and pressure and the level remained similar at increased
temperature of up to 373 K and increased pressure of 35 MPa. This indicates that the
solubility of β-diketone in scCO2 is very high. The data showed that this valuable
molecule can potentially be isolated at the critical point of CO2 (at about 35% purity),
then increasing the temperature and pressure for the extraction of the other wax
components.
As well as the identified wax components, there are other molecules that were
expected to be present in the extracts which were discussed in Chapter 2. Since the
polarity of CO2 is similar to hexane, the extractives can be predicted to be similar.231
Other minor wax components such as phenolic acids, resin acids and glycerides were
identified in wheat.111, 210
The presence of glycerides was assessed using FAME
analysis as per the method described in Section 6.3. The highest CO2 density extract
(373 K/ 40 MPa) and the extract carried out using co-solvent ethanol under the same
conditions, both contain the highest percentage of unknown compounds. In the
extracts obtained using scCO2 condition (373 K/ 40 MPa) and scCO2 with ethanol, the
level of glycerides was quantified using the method described in Section 6.3.1giving
up to 5.5% and 14.5% respectively. The calibration for the fatty acids can be found in
Section 2.5.1. Further investigations need to be carried out to fully characterise these
whole extracts.

186
Figure 3.22: The lipophilic fraction of the wheat straw wax in various crude CO2
extracts
0.0
0.1
0.2
0.3
0.4
0.5
0.6
0.7
0.8
0.9
1.0
1.1
1.2
1.3
1.4
1.5
1.6
1.7
1.8
1.9
2.0
% C
rud
e Y
ield
CO2 extraction conditions
Unknown
Ketone
Aldehyde
Fatty Alcohol
Wax ester
β-Diketone
Sterol
Alkane
Fatty Acid
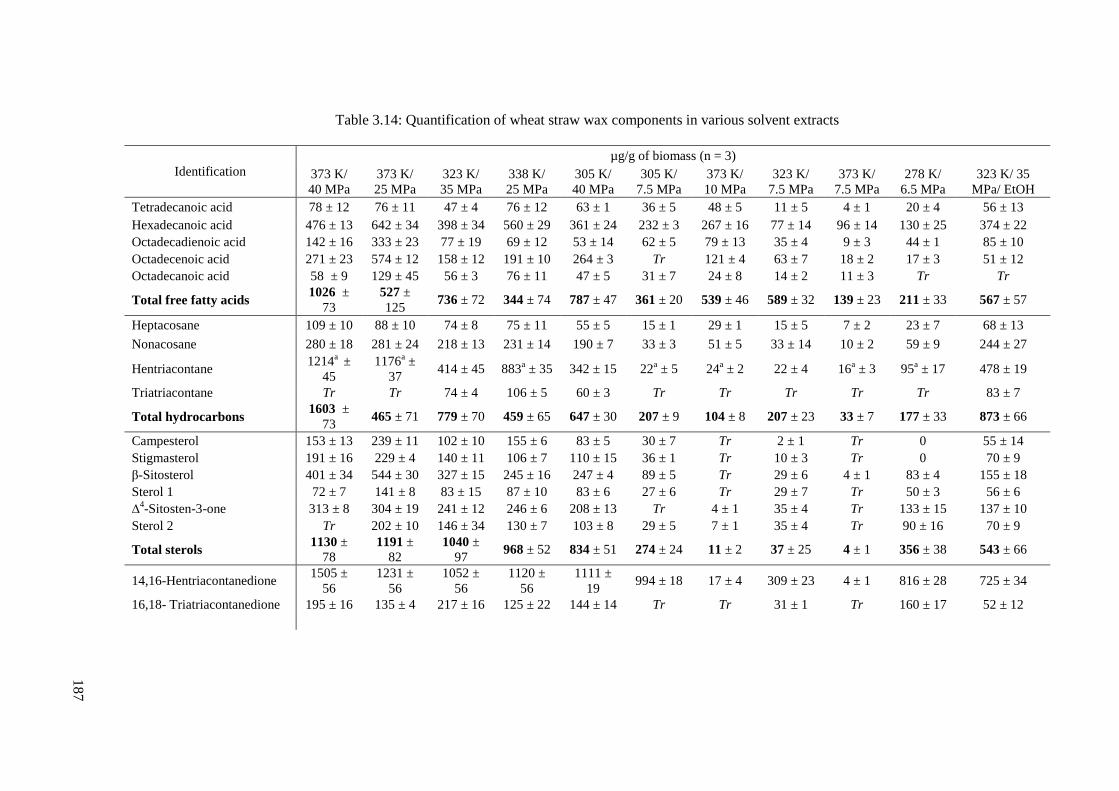
18
7
Table 3.14: Quantification of wheat straw wax components in various solvent extracts
Identification
µg/g of biomass (n = 3)
373 K/
40 MPa
373 K/
25 MPa
323 K/
35 MPa
338 K/
25 MPa
305 K/
40 MPa
305 K/
7.5 MPa
373 K/
10 MPa
323 K/
7.5 MPa
373 K/
7.5 MPa
278 K/
6.5 MPa
323 K/ 35
MPa/ EtOH
Tetradecanoic acid 78 ± 12 76 ± 11 47 ± 4 76 ± 12 63 ± 1 36 ± 5 48 ± 5 11 ± 5 4 ± 1 20 ± 4 56 ± 13
Hexadecanoic acid 476 ± 13 642 ± 34 398 ± 34 560 ± 29 361 ± 24 232 ± 3 267 ± 16 77 ± 14 96 ± 14 130 ± 25 374 ± 22
Octadecadienoic acid 142 ± 16 333 ± 23 77 ± 19 69 ± 12 53 ± 14 62 ± 5 79 ± 13 35 ± 4 9 ± 3 44 ± 1 85 ± 10
Octadecenoic acid 271 ± 23 574 ± 12 158 ± 12 191 ± 10 264 ± 3 Tr 121 ± 4 63 ± 7 18 ± 2 17 ± 3 51 ± 12
Octadecanoic acid 58 ± 9 129 ± 45 56 ± 3 76 ± 11 47 ± 5 31 ± 7 24 ± 8 14 ± 2 11 ± 3 Tr Tr
Total free fatty acids 1026 ±
73
527 ±
125 736 ± 72 344 ± 74 787 ± 47 361 ± 20 539 ± 46 589 ± 32 139 ± 23 211 ± 33 567 ± 57
Heptacosane 109 ± 10 88 ± 10 74 ± 8 75 ± 11 55 ± 5 15 ± 1 29 ± 1 15 ± 5 7 ± 2 23 ± 7 68 ± 13
Nonacosane 280 ± 18 281 ± 24 218 ± 13 231 ± 14 190 ± 7 33 ± 3 51 ± 5 33 ± 14 10 ± 2 59 ± 9 244 ± 27
Hentriacontane 1214
a ±
45
1176a ±
37 414 ± 45 883
a ± 35 342 ± 15 22
a ± 5 24
a ± 2 22 ± 4 16
a ± 3 95
a ± 17 478 ± 19
Triatriacontane Tr Tr 74 ± 4 106 ± 5 60 ± 3 Tr Tr Tr Tr Tr 83 ± 7
Total hydrocarbons 1603 ±
73 465 ± 71 779 ± 70 459 ± 65 647 ± 30 207 ± 9 104 ± 8 207 ± 23 33 ± 7 177 ± 33 873 ± 66
Campesterol 153 ± 13 239 ± 11 102 ± 10 155 ± 6 83 ± 5 30 ± 7 Tr 2 ± 1 Tr 0 55 ± 14
Stigmasterol 191 ± 16 229 ± 4 140 ± 11 106 ± 7 110 ± 15 36 ± 1 Tr 10 ± 3 Tr 0 70 ± 9
β-Sitosterol 401 ± 34 544 ± 30 327 ± 15 245 ± 16 247 ± 4 89 ± 5 Tr 29 ± 6 4 ± 1 83 ± 4 155 ± 18
Sterol 1 72 ± 7 141 ± 8 83 ± 15 87 ± 10 83 ± 6 27 ± 6 Tr 29 ± 7 Tr 50 ± 3 56 ± 6
∆4-Sitosten-3-one 313 ± 8 304 ± 19 241 ± 12 246 ± 6 208 ± 13 Tr 4 ± 1 35 ± 4 Tr 133 ± 15 137 ± 10
Sterol 2 Tr 202 ± 10 146 ± 34 130 ± 7 103 ± 8 29 ± 5 7 ± 1 35 ± 4 Tr 90 ± 16 70 ± 9
Total sterols 1130 ±
78
1191 ±
82
1040 ±
97 968 ± 52 834 ± 51 274 ± 24 11 ± 2 37 ± 25 4 ± 1 356 ± 38 543 ± 66
14,16-Hentriacontanedione 1505 ±
56
1231 ±
56
1052 ±
56
1120 ±
56
1111 ±
19 994 ± 18 17 ± 4 309 ± 23 4 ± 1 816 ± 28 725 ± 34
16,18- Triatriacontanedione 195 ± 16 135 ± 4 217 ± 16 125 ± 22 144 ± 14 Tr Tr 31 ± 1 Tr 160 ± 17 52 ± 12

18
8
Table 3.14 (continued)
Total β-diketones
1700 ±
72
1366 ±
60
1270 ±
72
1245 ±
78
1254 ±
33
994 ± 18
17 ± 4
339 ± 34
4 ± 1
976 ± 45
777 ± 46
Tetracosanyl hexadecanoate 113 ± 11 51 ± 4 126 ± 16 Tr 79 ± 5 Tr Tr 3 ± 1 26 ± 5 20 ± 4 88 ± 11
Hexacosanyl hexadecanoate 274 ± 15 137 ± 8 233 ± 18 49 ± 10 194 ± 14 40 ± 3 10 ± 4 6 ± 2 17 ± 5 Tr 260 ± 14
Octacosanyl hexdecanoate 1160 ±
45 526 ± 19 857 ± 39 123 ± 8 863 ± 6 Tr 9 ± 4 4 ± 2 13 ± 4 Tr 1500 ± 56
Octacosanyl octadecanoate 630 ± 25 314 ± 19 577 ± 27 507 ± 24 358 ± 35 Tr 9 ± 3 22 ± 4 29 ± 7 Tr 728 ± 35
Octacosanyl eicosanoate 438 ± 33 225 ± 15 445 ± 26 231 ± 17 156 ± 3 Tr 6 ± 1 11 ± 1 52 ± 18 Tr 599 ± 33
Octacosanyl docosanoate 378 ± 31 229 ± 20 417 ± 24 158 ± 13 83 ± 5 Tr Tr Tr 24 ± 4 Tr 551 ± 17
Octacosanyl tetracosanoate 137 ± 13 Tr 131 ± 13 176 ± 18 53 ± 8 Tr Tr Tr Tr Tr 192 ± 12
Octacosanyl hexacosanoate 72 ± 11 Tr Tr 89 ± 5 Tr Tr Tr Tr Tr Tr 70 ± 13
Octacosanyl octacosanoate Tr Tr 63 ± 19 Tr Tr Tr Tr Tr Tr Tr 76 ± 15
Total wax esters 3203 ±
184 430 ± 85
2906 ±
182 472 ± 95
1787 ±
76 40 ± 3 33 ± 12 46 ± 10 160 ± 43 20 ± 4 4062 ± 206
Octacosanol 1570
a ±
78
1521a ±
56 733 ± 26
1142a ±
37 303 ± 24 185
a ± 17 31
a ± 5 22 ± 3 16
a ± 3 95 ± 10 491 ± 34
Total fatty alcohol 1570 ±78 1521 ±
56 733 ± 26
1142 ±
37 303 ± 24 185 ± 17 31 ± 5 22 ± 3 16 ± 3 95 ± 10 491 ± 34
Octacosanal 108 ± 6 207 ± 33 168 ± 15 182 ± 17 86 ± 11 33 ± 4 Tr 16 ± 3 6 ± 1 17 ± 1 67 ± 13
Total aldehyde 108 ± 6 207 ± 33 168 ± 15 182 ± 17 86 ± 11 33 ± 4 Tr 16 ± 3 6 ± 1 17 ± 1 67 ± 13
Total identified 8770 ±
564 4186 ±
6898 ±
534
3670 ±
418
5395 ±
272
1908 ±
95 704 ± 77
1322 ±
130 565 ± 79
1566 ±
164 6411 ± 488
a = co-elution and values shown are the combined quantities, Tr = Trace levels < LOQ, LOQ shown in Section 2.5.1

189
3.4 Conclusion and future work
Following the solvent extraction study in Chapter 2, the use of CO2 as a green alternative
solvent instead of traditional organic solvents for the extraction of low cost, high volume
agricultural waste wheat straw (Triticum aestivum) has been studied. Qualitative analysis by
GC-MS and quantitative analysis by GC-FID were proved to be successful. The analysis can
be improved by fractionation of the individual wax groups so that a tailored analytical
method could be applied to improve separation and precision. Liquid CO2, neat
supercritical CO2 and supercritical CO2 with ethanol were examined. The chemical
composition of the CO2 extracts were found to be identical to the solvent extracts which is
expected so the key wax molecules were quantified. Liquid CO2 extraction give a very low
selective wax yield which consist of free fatty acids, hydrocarbons, fatty alcohols,
aldehydes, sterols and β-diketones but no wax esters. It can be concluded that liquid CO2 can
be used as part of a pre-treatment on wheat straw to selectively extract high wax esters
extract by using scCO2. The addition of co-solvent ethanol with scCO2 lead to complete
extraction but failed to extract wax molecules relatively which means the extraction overall
is unselective. Supercritical CO2 extracts showed both high extraction yields with optimised
temperature and pressure and selectivity towards wax components so therefore the effect of
temperature and pressure was investigated.
Supercritical CO2 conditions namely temperature and pressure were investigated and
optimised using 22 factorial design. Temperature and pressure both have direct influence on
CO2 density which was found to be the main parameter that drives the extractions. However,
it is important to note that other parameters such as viscosity, diffusivity and polarity are
also affected by the modification of temperature and pressure. A first order polynomial
equation was applied to both the percentage crude extraction yield and the individual wax
groups. The percentage crude yield, wax ester and β-diketone yield correlate well and no
correlation was found with free fatty acid, hydrocarbon, aldehyde and sterol yield. This
suggested that wax esters and β-diketones have a linear behaviour with CO2 temperature and
pressure. Strangely, the percentage crude yield showed astrong correlation even though not
all the wax groups behave linearly. Further work is needed to understand the behaviour of
the wax molecules in CO2 by carrying out solubility tests. Extraction times and flow rate
have not been investigated so the experiments can be extended to 23 or 2
4 factorial design in
order to establish any relationship between extraction times and flow rate.
190
The most well-established density-based model, the Chrastil model, for supercritical CO2
was explored for the first time with the extraction of wheat straw wax. This model was used
by assuming that equilibrium extraction of wax in a flow system has been achieved and that
the scCO2 would form solvated solute complexes with the wax molecules. In the case of
applying this model to this extraction, it proved difficult as this is a multi-component
system. Again, the model was applied to both the percentage crude extraction yield and the
individual wax groups. The model will only have a correlation if there is a CO2 density
relationship with the extraction yields. As the extractions were carried out on a flow system
at a fixed extraction time for all nine different scCO2 conditions, it is difficult to gather if the
system was in equilibrium. Further work must be carried out at different extraction times and
flow rates in order to gain more understanding of the different extractions as the current data
only provide a “snapshot” of the investigation. The experiments may need to switch from
flow-through to fixed volume at specific temperature and pressure but new problems could
arise as the CO2 properties, such as polarity, may change as molecules are dissolved or
saturation of the solvent can occur due to, the vast mixtures of different molecules. As the
raw materials is a natural product containing semi-crystallised layered cuticular wax, the
different wax molecules would align differently on different layers of the straw surfaces so
therefore it may prove difficult to model. Diffusivity of CO2 through the straw is very
important and further investigation on the physical pre-treatment will be needed to optimise
the best method for pre-treatment and particle size for CO2 extraction. However, it is
important to be aware that the extracted straw residues is a valuable product and not a waste
as it can be used for further processing such as microwave pyrolysis which was discussed in
the as the concept of straw bio-refinery in Chapter 1. The Chrastil model was successfully
applied to percentage crude yield and wax ester yield based on the extraction conditions,
which suggested that equilibrium was achieved during its residence time. Again, strangely,
a strong correlation was found with percentage crude yield as the majority of the wax groups
do not have any correlations. Even though there is a lack of correlation with the majority of
the wax groups, this study had shown the potential to use a density-based model to establish
optimised conditions for a specific blend of chemical composition of wax. New improved
models have been developed and adapted over the years to suit the extraction process so for
future work, this will need to be investigated and draw some correlation between CO2
conditions and solubility of wax compounds.

191
Solubility data for the key wax compounds were gathered. The majority are based on binary
systems which give only limited information on the behaviour of the wax molecules in the
scCO2 phase at different conditions. In a multi-component system such as in the case of
extraction of wheat straw waxes, the solubility of the wax compounds would alter. It would
be of great interest to investigate the variation in behaviour of wax molecules in both
situations. This would provide important solubility information that has not only benefit in
extraction but also would assist in process development in using CO2 for fractionation.
The promising preliminary results show that supercritical CO2 can be used as a green
alternative to traditional organic solvents from the chemical compositional analysis. Wax
compounds have shown a vast range of potential applications as discussed in Chapter 2.
There is a real interest both academically and industrially to bring the product and process to
commercialisation following the success of the use of CO2 as a green solvent. The effect of
temperature and pressure for CO2 has been studied and conditions have been optimised but
further work is needed on the investigation of extraction time and flow rate. It can be
concluded that the next stage is pilot scale trials. With the initial optimisation data and
success with pilot scale by Deswarte, carried out previously, it would be interesting to
increase scale to production scale to examine any scaling up effect.16
By scaling up, the
feasibility of using supercritical CO2 for straw wax extraction would be assessed and the
physical properties of the resulting wax products can be tested and any further downstream
processing can be investigated.


Chapter 4 Straw wax screen and production scale
supercritical carbon dioxide extraction of
cereal straw waxes
Oral presentation given at 1st
NORthern Sustainable Chemistry meeting (NORSC), York,
UK, October 2010
Oral presentation given at 7
th International Conference on Renewable Resources and
Biorefineries (RRB7), Bruges, Belgium, June 2011


195
4. STRAW WAX SCREEN AND PRODUCTION SCALE
SUPERCRITICAL CARBON DIOXIDE EXTRACTION
OF CEREAL STRAW WAXES
4.1 Introduction
The extraction of wheat straw wax has been demonstrated successfully both by organic
solvents and a greener alternative, supercritical CO2. After assessing the potential of both, it
can be concluded that supercritical CO2 under optimised conditions is the most selective and
environmentally friendly method for straw wax extraction so scale up trials were carried out
using supercritical CO2. In this chapter, a number of other low cost straws were screened
using the selected organic solvents ethanol and hexane to give an insight into the wax
content as well as interesting new molecules that could potentially have a high commercial
value. The ethanol and hexane extracts were also quantified by GC-FID to compare the
relative abundance of the key important wax groups. It was highlighted previously that the
crude wax yield and the chemical composition from hexane extractions are highly
comparable with supercritical CO2 so the data collected from the hexane extractions were
used for the selection of raw materials for the production scale supercritical CO2 extraction.
Solvent extraction was used as in preliminary trials instead of scCO2 extraction due to
shorter set up time. Wheat, barley and oat were selected from the seven different biomass
screens for the scale up trials which were carried out in collaboration with Sundown
Products Limited and Evonik Industries. Three tonnes of cereal straw one 1 tonne of wheat,
barley and oat straw wax each) was extracted using optimised scCO2 conditions and the
scale up effect is discussed. The chemical compositions of the waxes were analysed
qualitatively and quantitatively. Physical properties such as melting point were analysed in
order to gain a greater understanding of the potential for commercialisation and selected for
relevant product formulations. The main advantage of using scCO2 as the extraction solvent
is its low environmental impact. As the extraction of waxes requires high pressure it is an
expensive technology which can raise many concerns industrially. For this reason, an
economic assessment was carried out for the extraction of wax from cereal straw as part of
the consideration of using scCO2 extraction.

196
4.2 Raw materials selection
4.2.1 Raw materials
Cuticular waxes exist on all the plant surfaces. In this section, different biomass
wastes are explored as a new source of wax by screening using hexane and ethanol
extraction. The focus on the biomass screen is solely based on straw as this part of the
plant makes up more than 50% of the dry weight of the crop.27
Straw ‘waxes’ from
other plant families have also been examined with flax (Linum usitatissimum) straw
first being first extracted in 1931.275
However, little work has been carried out on
other agricultural straws. The main agricultural crops wheat (Triticum aestivum),
barley (Hordeum vulgare), oat (Avena sativa) and oilseed rape (Brassica napus), were
considered as potential sources of straw as together, the four crops make up about
99% of the total cereal crops grown in the UK.26
Bagasse was considered as a source
of biomass for wax as this is the biggest waste after pressing for its juice in the sugar
cane industry. Sugarcane wax has long been of interest and highlighted as a potential
new wax, with many attempts to study its chemical composition as far back as 1935
but, yet to be commercialised.61, 276, 277
Currently, the waste bagasse (Saccharum
officinarum) is being utilised as a source of bio-ethanol however, if the bagasse can
firstly be extracted using scCO2 to create wax products prior to bio-ethanol production
then it creates a new idea of the bio-refinery concept.278
Miscanthus (Miscanthus
giganteus) is another bio-energy crop and therefore of interest for its potential as a
novel source of wax by adding value to the biomass prior to fuel production.279
Another potential biomass is sunflower (Helianthus annuus) and this is of increasing
growing volume due to the rise in bio-diesel production.280
The resulting sunflower
straw currently does not have any high value applications so this was a great
opportunity to add value to sunflower straw by extraction of high value chemicals.
Almost no work had been carried out on the extraction of miscanthus and sunflower
straw so this would be an interesting study on potential extraction crops. For these
reasons, wheat, barley, oat, oilseed rape, bagasse, miscanthus and sunflower straw
were screened for wax content and composition. Figure 4.1 shows pictures of the
biomass being studied. All the samples were milled to increase the bulk density
following the procedure described in Section 6.2.2. The moisture content of the air-
dried milled straw was determined using the method in Section 6.2.1 and it was

197
ensured that the moisture was no greater than 10% (w/w). All the milled straw was
stored in paper sacks in a dry, cool place to keep the samples ventilated.
Figure 4.1: Straw samples (wheat, oilseed rape, miscanthus, bagasse and sunflower) used for
wax screening (originally in colour)
4.2.2 Identification of chemical compositions from different raw materials
Hexane and ethanol were chosen as the two solvents for the biomass screen due to the
distinctly different polarities. The comparison of n-alkanes extracted with scCO2 was
also demonstrated by wheat straw discussed in Chapter 3. Ethanol is a relatively green
polar solvent which is capable of extracting more polar molecules hence the increased
yield shown in Chapter 2. With these two solvent systems, a full extraction yield and
composition profile for each biomass was obtained. As a large number of straw
materials are required to be screened, the multi-point FexIKA® extractor was chosen
as the extraction technique as many extractions can be carried out simultaneously. The
detail of this extraction method is discussed in Section 6.2.4. Figure 4.2 shows
pictures of the hexane and ethanol wax extracts. From the colour and the texture of
each extract, it was apparent that the compositions are different. The colour of the

198
hexane extracts are usually lighter than the ethanol extracts as it is more selective so
therefore contains less co-extracted pigments.
Figure 4.2: Hexane and ethanol extracts of the seven different straws (originally in colour)

199
Table 4.1 shows the list of straws that are under investigation and their descriptions.
The yields for the hexane and ethanol extracts are displayed in Figure 4.3 and the
biomass label corresponds to the biomass in Table 4.1.
Table 4.1: Description of straw
Straw code Straw description
WS1 Winter wheat straw (Triticum aestivum) (Claire 07)
WS2 Winter wheat straw (Triticum aestivum) (Claire 08)
WS3 Winter wheat straw (Triticum aestivum) (Charger 08)
WS4 Winter wheat straw (Triticum aestivum) (Oakley 08)
WS5 Spring wheat straw (Triticum aestivum) (Hereward 08)
BS1 Winter barley straw (Hordeum vulgare) (Carat 08)
BS2 Spring barley straw (Hordeum vulgare) (Optic 08)
OS Oat straw (Mixed varieties 08) (Avena sativa)
RS1 High docosenoic acid oilseed rape straw (Brassica napus)
RS2 Low docosenoic acid oilseed rape straw (Brassica napus)
SS High octadecenoic acid sunflower straw (Helianthus annuus)
MS Miscanthus straw (Miscanthus giganteus)
Bag Bagasse straw (Saccharum officinarum)
The hexane yields indicate mainly the lipophilic fraction of the extract and were found
to be between 0.3 – 1.4% with oat straw having the highest yield at 1.4%. All the
cereal and oilseed rape straws have a consistent hexane yield about 1%. The
sunflower, miscanthus and bagasse have very low hexane yields and this could be due
to the larger cross-section of the straw meaning that the surface area of cuticular wax
would be smaller per gram sample being extracted. For example, it can be observed in
Figure 4.1, the sunflower straw has a very large cellulosic inner core which is
completely wax free so it would be interesting to separate the straw surface from its
inner core for future extractions. All the ethanol yields were considerably higher than
the hexane yields as expected and these extracts are suspected to contain more polar
compounds such as sugar molecules. In order to determine which of the straw are
potentially good as new sources of wax, and can be scaled up for commercialisation,
the chemical composition is determined and quantified to give a full wax assessment.
Wheat straw (Oakley 08), barley straw (Carat 08) and high docosenoic acid oilseed
rape straw were chosen for further analysis to represent their species types. The
identification and quantification were carried out by following the procedures

200
described in Sections 6.3.1 and 6.3.2 respectively. Figures 4.4, 4.5, 4.6, 4.7, 4.8, 4.9
and 4.10 show the GC chromatograms of the hexane extracts for wheat, barley, oat,
oilseed rape, sunflower, miscanthus and bagasse straw respectively.
Figure 4.3: Percentage crude yield of hexane and ethanol extracts of different straws
(originally in colour)
1.0 0.9 1.1 1.2 1.2 1.1 1.0
1.4
0.7 1.0
0.3 0.3 0.5
4.2
2.7 2.7
3.4 3.6
4.0
2.4
8.8
1.8 1.5
2.0
2.6
3.0
0
1
2
3
4
5
6
7
8
9
WS1 WS2 WS3 WS4 WS5 BS1 BS2 OS RS1 RS2 SS MS Bag
% C
rude
yie
ld
Straw
Hexane
Ethanol

20
1
1 Hexadecanoic acid (C16:0) 7 Octacosanal (C28) 13 14,16-hentriacontanedione (C31) 20 Octacosanyl octadecanoate (C46)
2 Octadecadienoic acid (C18:2) 8 Octacosanol (C28) 14 β-Sitosterol 21 Octacosanyl eicosanoate (C48)
3 Octadecenoic acid (C18:1) 9 Hentriacontane (C31) 15 16,18-triatriacontanedione (C33) 22 Octacosanyl docosanoate (C50)
4 Octadecanoic acid (C18:0) 10 Campesterol 16 Δ4-Sitosten-3-one 23 Octacosanyl tetracosanoate (C52)
5 Heptacosane (C27) 11 Campesterol 18 Hexacosanyl hexadecanoate (C42) 24 Octacosanyl hexacosanoate (C54)
6 Nonacosane (C29) 12 Triatriacontane (C33) 19 Octacosanyl hexadecanoate (C44) 25 Hexacosanal (C26)
Figure 4.4: GC chromatogram of hexane extract for wheat straw (Oakley 08) (WS4) (originally in colour)
1
2, 3, 4
5 25
6
7
9
8
10
11
12
13
16 15
Ketone
Fatty acid
Alkane
Aldehyde
Fatty alcohol
β-Diketone
Sterol
Wax Ester
14
18 19
20
21 22 23 24
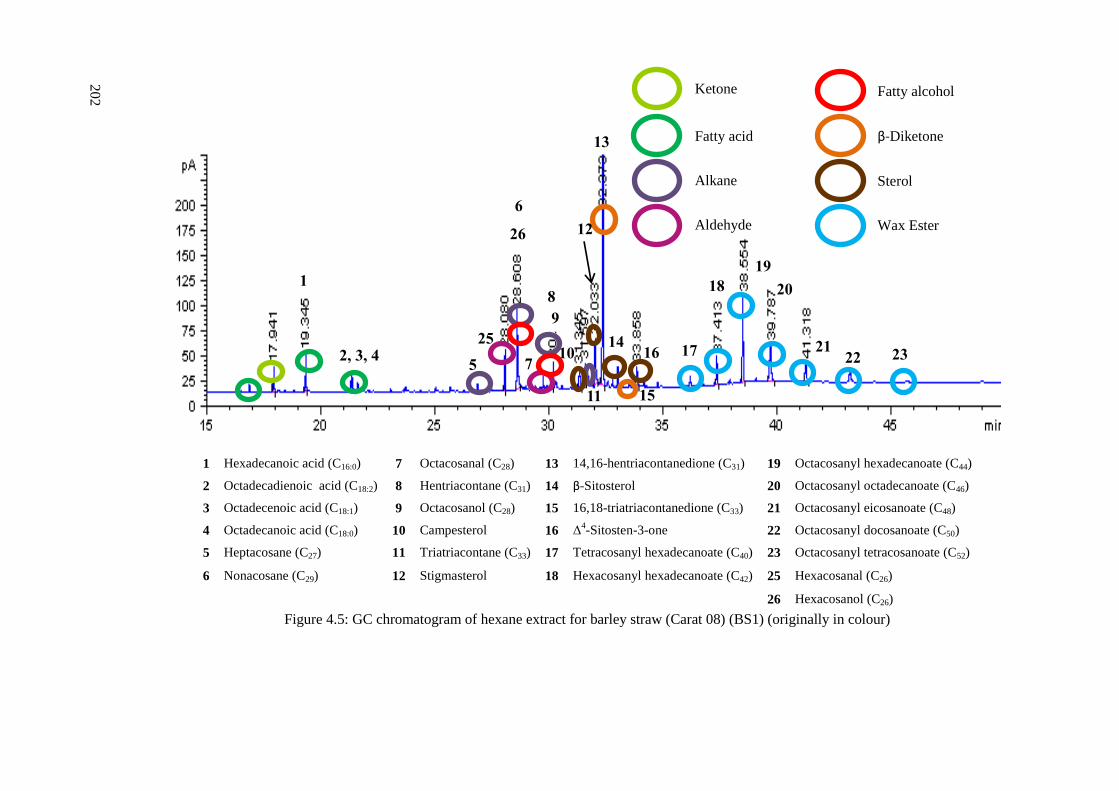
20
2
1 Hexadecanoic acid (C16:0) 7 Octacosanal (C28) 13 14,16-hentriacontanedione (C31) 19 Octacosanyl hexadecanoate (C44)
2 Octadecadienoic acid (C18:2) 8 Hentriacontane (C31) 14 β-Sitosterol 20 Octacosanyl octadecanoate (C46)
3 Octadecenoic acid (C18:1) 9 Octacosanol (C28) 15 16,18-triatriacontanedione (C33) 21 Octacosanyl eicosanoate (C48)
4 Octadecanoic acid (C18:0) 10 Campesterol 16 Δ4-Sitosten-3-one 22 Octacosanyl docosanoate (C50)
5 Heptacosane (C27) 11 Triatriacontane (C33) 17 Tetracosanyl hexadecanoate (C40) 23 Octacosanyl tetracosanoate (C52)
6 Nonacosane (C29) 12 Stigmasterol 18 Hexacosanyl hexadecanoate (C42) 25 Hexacosanal (C26)
26 Hexacosanol (C26)
Figure 4.5: GC chromatogram of hexane extract for barley straw (Carat 08) (BS1) (originally in colour)
17
12
15
13
16
1
2, 3, 4 25
5 7
9
11
10
6
26
8 18 20
19
21 22
Ketone
Fatty acid
Alkane
Aldehyde
Fatty alcohol
β-Diketone
Sterol
Wax Ester
14
23

20
3
1 Hexadecanoic acid (C16:0) 6 Nonacosane (C29) 12 Stigmasterol 21 Octacosanyl eicosanoate (C48)
2 Octadecadienoic acid (C18:2) 7 Octacosanal (C28) 14 β-Sitosterol 22 Octacosanyl docosanoate (C50)
3 Octadecenoic acid (C18:1) 8 Hentriacontane (C31) 16 Δ4-Sitosten-3-one 23 Octacosanyl tetracosanoate (C52)
4 Octadecanoic acid (C18:0) 9 Octacosanol (C28) 18 Hexacosanyl hexadecanoate (C42) 24 Octacosanyl hexacosanoate (C54)
5 Heptacosane (C27) 10 Campesterol 19 Octacosanyl hexadecanoate (C44) 25 Hexacosanal (C26)
20 Octacosanyl octadecanoate (C46) 26 Hexacosanol (C26)
Figure 4.6: GC chromatogram of hexane extract for oat straw (OS) (originally in colour)
Ketone
Fatty acid
Alkane
Aldehyde
Fatty alcohol
β-Diketone
Sterol
Wax Ester
1
2, 3, 4
25
6
26
9
9
8
10, 12, 14, 16 18 19
20
23 24
22 21
Ketone
Fatty acid
Alkane
Aldehyde
Fatty alcohol
Sterol
Wax Ester
5

20
4
1 Hexadecanoic acid (C16:0) 6 Nonacosane (C29) 14 β-Sitosterol 22 Octacosanyl docosanoate (C50)
2 Octadecadienoic acid (C18:2) 7 Octacosanal (C28) 16 Δ4-Sitosten-3-one 23 Octacosanyl tetracosanoate (C52)
3 Octadecenoic acid (C18:1) 8 Hentriacontane (C31) 19 Octacosanyl hexadecanoate (C44) 25 Hexacosanal (C26)
4 Octadecanoic acid (C18:0) 9 Octacosanol (C28) 20 Octacosanyl octadecanoate (C46) 26 Hexacosanol (C26)
5 Heptacosane (C27) 12 Stigmasterol 21 Octacosanyl eicosanoate (C48) 27 Nonacosan-15-one (C29)
28 Triacontanal (C30)
Figure 4.7: GC chromatogram of hexane extract for oilseed rape straw (RS1) (originally in colour)
26
1
2, 3, 4
5 25
6
27
9
8 16
19
28
12
14
20 21 22 23
Ketone
Fatty acid
Alkane
Aldehyde
Fatty alcohol
Sterol
Wax Ester
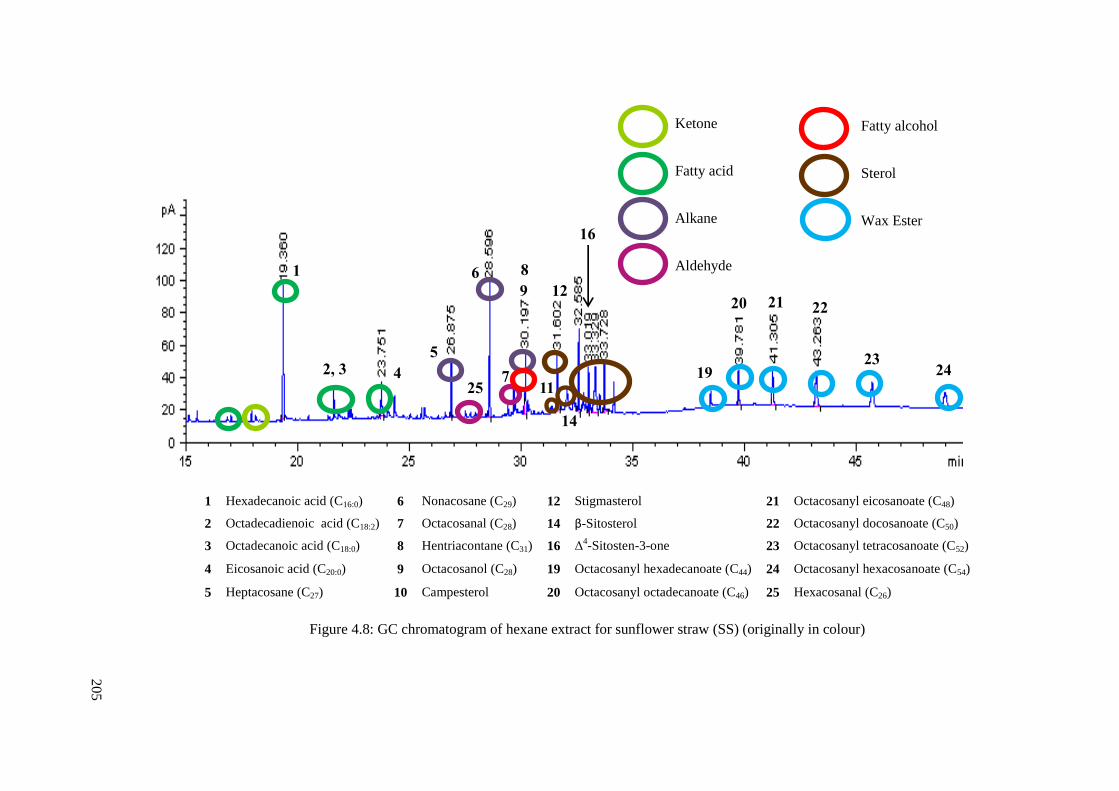
20
5
1 Hexadecanoic acid (C16:0) 6 Nonacosane (C29) 12 Stigmasterol 21 Octacosanyl eicosanoate (C48)
2 Octadecadienoic acid (C18:2) 7 Octacosanal (C28) 14 β-Sitosterol 22 Octacosanyl docosanoate (C50)
3 Octadecanoic acid (C18:0) 8 Hentriacontane (C31) 16 Δ4-Sitosten-3-one 23 Octacosanyl tetracosanoate (C52)
4 Eicosanoic acid (C20:0) 9 Octacosanol (C28) 19 Octacosanyl hexadecanoate (C44) 24 Octacosanyl hexacosanoate (C54)
5 Heptacosane (C27) 10 Campesterol 20 Octacosanyl octadecanoate (C46) 25 Hexacosanal (C26)
Figure 4.8: GC chromatogram of hexane extract for sunflower straw (SS) (originally in colour)
1
2, 3
4
5
6
25 7
9
11
12
14
8
20
19
16
24 23
22 21
Ketone
Fatty acid
Alkane
Aldehyde
Fatty alcohol
Sterol
Wax Ester

20
6
1 Hexadecanoic acid (C16:0) 7 Octacosanal (C28) 12 Stigmasterol 20 Octacosanyl octadecanoate (C46)
3 Octadecenoic acid (C18:1) 8 Hentriacontane (C31) 13 14,16-hentriacontanedione (C31) 21 Octacosanyl eicosanoate (C48)
4 Octadecanoic acid (C18:0) 9 Octacosanol (C28) 14 β-Sitosterol 22 Octacosanyl docosanoate (C50)
5 Heptacosane (C27) 10 Campesterol 18 Hexacosanyl hexadecanoate (C42) 23 Octacosanyl tetracosanoate (C52)
6 Nonacosane (C29) 11 Triatriacontane (C33) 19 Octacosanyl hexadecanoate (C44) 25 Hexacosanal (C26)
Figure 4.9: GC chromatogram of hexane extract for miscanthus straw (MS) (originally in colour)
1
2, 3 5
25
6
7
9
8
12
10 14
11
18 19
20
21 22 23
Ketone
Fatty acid
Alkane
Aldehyde
Fatty alcohol
β-Diketone
Sterol
Wax Ester
13

20
7
1 Hexadecanoic acid (C16:0) 8 Hentriacontane (C31) 19 Octacosanyl hexadecanoate (C44) 25 Hexacosanal (C26)
4 Octadecanoic acid (C18:0) 9 Octacosanol (C28) 20 Octacosanyl octadecanoate (C46) 26 Hexacosanol (C26)
5 Heptacosane (C27) 11 Triatriacontane (C33) 21 Octacosanyl eicosanoate (C48) 28 Triacontanal (C30)
6 Nonacosane (C29) 14 β-Sitosterol 22 Octacosanyl docosanoate (C50) 29 Dotriacontanal (C32)
7 Octacosanal (C28) 16 Δ4-Sitosten-3-one 23 Octacosanyl tetracosanoate (C52) 30 Tetratriacontanal (C34)
31 Hexatriacontanal (C36)
Figure 4.10: GC chromatogram of hexane extract for bagasse (Bag) (originally in colour)
1
5 4 25
7
26
6
9
8
11
28
19
14
13 30
16 31 21 20
22 23
Fatty acid
Alkane
Aldehyde
Fatty alcohol
Sterol
Wax Ester

208
As discussed in Chapter 2, the solvent used during the extraction has very little
influence on the chemical composition but the relative abundance of the wax
compounds is highly dependent on the organic solvent. For this reason, only the
chromatograms of the hexane extracts are shown. Table 4.2 shows a list of wax
compounds that were identified in the straw waxes and highlights the new wax
compounds found compared to wheat straw wax (Viscount 09) which was discussed
in Chapter 2. The identification was carried out by using a combination of EI
fragmentation pattern, FI mass spectra, NIST library and KI values.
Table 4.2: List of wax compounds identified in straw waxes
Wheat straw wax (Viscount 09) New wax molecules
Free fatty acids Eicosanoic acid (C20:0)
Hexadecanoic acid (C16:0) Octadecadienoic acid (C18:2) Octadecenoic acid (C18:1) Octadecanoic acid (C18:0)
Hydrocarbons
Heptacosane (C27) Nonacosane (C29)
Hentriacontane (C31)
Triatriacontane (C33)
Fatty alcohols
Octacosanol (C28) Hexacosanol (C26)
Aldehydes
Octacosanal (C28) Hexacosanal (C26)
Triacontanal (C30)
Dotriacontanal (C32)
Tetratriacontanal (C34)
Hexatriacontanal (C36)
Wax esters
Tetracosanyl hexadecanoate (C24:C16) Wax ester 1 (C41) Hexacosanyl hexadecanoate (C26:C16) Wax ester 2 (C43) Octacosanyl hexdecanoate (C28:C16) Wax ester 3 (C45)
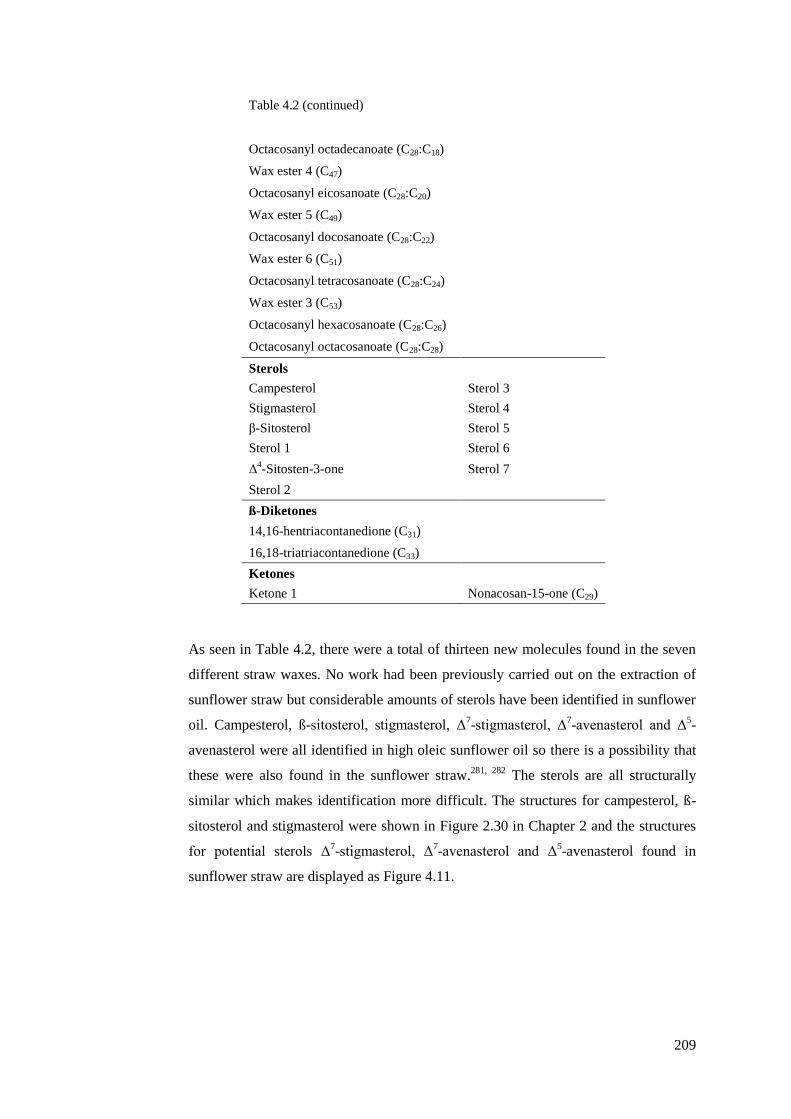
209
Table 4.2 (continued)
Octacosanyl octadecanoate (C28:C18) Wax ester 4 (C47) Octacosanyl eicosanoate (C28:C20) Wax ester 5 (C49) Octacosanyl docosanoate (C28:C22) Wax ester 6 (C51) Octacosanyl tetracosanoate (C28:C24) Wax ester 3 (C53) Octacosanyl hexacosanoate (C28:C26) Octacosanyl octacosanoate (C28:C28)
Sterols
Campesterol Sterol 3
Stigmasterol Sterol 4
β-Sitosterol Sterol 5
Sterol 1 Sterol 6
Δ4-Sitosten-3-one Sterol 7
Sterol 2
ß-Diketones
14,16-hentriacontanedione (C31) 16,18-triatriacontanedione (C33)
Ketones
Ketone 1 Nonacosan-15-one (C29)
As seen in Table 4.2, there were a total of thirteen new molecules found in the seven
different straw waxes. No work had been previously carried out on the extraction of
sunflower straw but considerable amounts of sterols have been identified in sunflower
oil. Campesterol, ß-sitosterol, stigmasterol, Δ7-stigmasterol, Δ
7-avenasterol and Δ
5-
avenasterol were all identified in high oleic sunflower oil so there is a possibility that
these were also found in the sunflower straw.281, 282
The sterols are all structurally
similar which makes identification more difficult. The structures for campesterol, ß-
sitosterol and stigmasterol were shown in Figure 2.30 in Chapter 2 and the structures
for potential sterols Δ7-stigmasterol, Δ
7-avenasterol and Δ
5-avenasterol found in
sunflower straw are displayed as Figure 4.11.

210
Figure 4.11: Structures of sterols presented in sunflower oil
A new interesting molecule, nonacosan-15-one was found in oilseed rape straw wax
as indicated in Figure 4.14. The aliphatic compounds identified in the cuticular waxes
from the seven different straws all contain functional groups in the primary position
except the β-diketones. Secondary fatty alcohols with odd-numbered carbon chain
lengths of C23 - C33 are commonly found in plant epicuticular waxes and
predominantly consist of C29 and C31. The primary alcohols series are usually even-
numbered as these molecules are derived from the complete reduction reaction of
even-numbered fatty acids in the acyl reduction synthetic pathway. 80, 85
The
secondary alcohols found in epicuticular waxes are derived from the alkane pathway
hence the odd-numbered carbon chain length.85
The biosynthetic schemes for both of
these reactions are illustrated in Figure 1.11 in Chapter 1. Secondary alcohols are
much less commonly found compared to primary alcohols and sometimes these
secondary alcohols can undergo an oxidation reaction to form ketones so occasionally,
a series of alkanes, secondary alcohols and ketones with the same chain length can be
found.85
In barley, a combination of heptacosan-9-ol, nonacosan-10, -11-ols and
hentriacontain-10, -11, -12 and -13-ols have been reported.283
It has been reported by a
number of researchers that the addition of the hydroxyl group to the alkanes that
forms the secondary alcohols usually occurs in the middle of the carbon chains but the
location of the hydroxylation is strictly controlled by enzymes.64, 283, 284, 285, 286
The
secondary alcohols mostly occur freely in plant waxes but it has been reported to be
esterified with fatty acids in rose and pine waxes.65, 286
Δ7
-Stigmasterol Δ7
-Avenasterol Δ5
-Avenasterol

211
In oilseed rape straw wax, nonacosan-15-one was identified as well as nonacosane but
no nonacosan-15-ol was found. Kolattukudy et al. proved the biosynthetic relationship
between these three related wax compounds in broccoli leaf waxes.64, 287
In the study,
both nonacosan-14 and -15-ols were identified at approximately 4:6 ratio however the
study showed there is a high preferential oxidation to the ketone with 92% of the
ketones is nonacosan-15-one in the wax.64
The oxidation of the secondary alcohols
shows that the reaction is tightly controlled and regulated by enzymes. 64
In oilseed
rape straw wax, this could explain why no nonacosan-15-ol was identified as
oxidation at the 15th position is highly preferable. This suggested that in oilseed rape
straw wax, nonacosane undergoes hydroxylation to form the nonacosan-15-ol which is
then quickly oxidised to nonacosan-15-one so in the GC analysis, only the alkane and
ketone were found. The identification of nonacosan-15-one was carried out using the
EI fragmentation pattern and FI mass spectrum. Figure 4.12 shows the EI
fragmentation pattern of nonacosan-15-one. As EI is a harsh ionisation technique, the
molecular ion was not observed. Characteristic fragment ions at m/z = 225 and m/z =
241 were seen in the EI mass spectrum. Another characteristic ion was also observed
when the high m/z region was magnified; fragment ion of m/z = 240 was also present.
The fragmentation pattern for secondary alcohols is very similar to ketones however
in ketones, there is a cleavage of the C – C bond adjacent to the carbonyl group which
results in a distinct fragment ion of m/z = 225 as shown in Figure 4.14. The formation
of m/z = 240 is as a result of McLafferty rearrangement and fragment ion m/z = 241 is
generated via McLafferty rearrangement then followed by the migration of a hydrogen
atom which is shown in Figure 4.15. Other fragment ions presented in the mass
spectrum include m/z = 43, 57, 71 and 85 which are from the alkyl chain as shown in
Table 2.7 in Chapter 2. This series of ions showed a difference of 14 mass units in the
molecule which suggested the presence of alkyl chain. As the published literature KI
for nonacosan-15-one is not available to determine the chain length of the molecule,
the molecular ion is required. The molecular ion was observed from the FI mass
spectrum which is shown in Figure 4.13. Table 4.3 shows the fragment ions and its
percentage base peak intensity as well as the calculated KI value.

212
Figure 4.12: EI mass spectrum of nonacosan-15-one (magnified eight times from m/z 400 –
425) (originally in colour)
Figure 4.13: FI mass spectrum of nonacosan-15-one
m/z = 225
m/z = 225
Figure 4.14: Characteristic fragment ions m/z = 225 for nonacosan-15-one (originally in
colour)
, 16-Nov-2011 + 13:22:24ES39b
48 68 88 108 128 148 168 188 208 228 248 268 288 308 328 348 368 388 408m/z0
100
%
es39b1511 4414 (32.486) Cm (4409:4418-4573:4586) Scan EI+ 2.68e7x8057.0
43.0
42.3
55.0
71.1
58.0
69.0
59.1
67.1
85.1
83.1
225.2
96.2
95.1 97.1
109.1 241.3
422.6
ES39B
m/z40 60 80 100 120 140 160 180 200 220 240 260 280 300 320 340 360 380 400 420 440 460 480 500 520 540 560 580 600 620 640 660 680 700 720 740
%
0
100
jhc33883es 1154 (30.913) Cm (1153:1154-(1141:1142+1179:1180)) TOF MS FI+ 3.69e3422.4509
43.0499421.4854
380.3168225.200068.9965 284.4587257.2437 296.2298324.5164
423.4626
424.4605
425.4460502.0067
M·+
422.5
423.5
M·+

213
m/z = 241
Figure 4.15: Characteristic fragment ions m/z = 240 and m/z = 241 for nonacosan-15-one
Table 4.3: Identification of noncosan-15-one in oilseed rape straw including the EI
fragmentation pattern with percentage base peak intensity and KI value
Identification M+ EI Fragmentation
Calculated
KI
Ketone
Nonacosan-15-one 422.7 57(100), 43(84), 71(79), 58(65), 85(44), 225(42),
96(33), 59(29), 83(25), 81(24) 3088
4.2.3 Quantification of hexane and ethanol extraction of raw materials
The hexane and ethanol straw wax extracts were quantified using calibration data
presented in Section 2.5.1 and the method described in Section 6.3.2. The quantities of
the different wax components in the extracts are normalised to percentage in the
extracts and in µg per gram of biomass. The quantification data for the hexane

214
extracts are shown in Tables 4.4 and 4.5 whereas the data for the ethanol extracts are
shown in Tables 4.6 and 4.7. No purification or fractionation was carried out prior to
quantification analysis therefore the results shown are data from the crude extracts.
The two solvent extracts were quantified in order to gain an insight into the quantities
of each wax group from each different type of straw. As expected and observed
previously in Chapter 2, the total lipophilic fraction of the ethanol extracts is very
small, and in the case of bagasse ethanol extract, only 6% of the extract was lipophilic
compounds which suggests that bagasse consists of a high percentage of non-volatile
polar compounds. The percentage of identified compounds for oat and miscanthus
ethanol extracts were both less than 10% which indicated a high proportion of non-
volatile polar compounds.
The fatty acid levels present in the different straw hexane extracts ranged from 2.3 –
8.5% which equates to about 120 – 640 µgg-1
of fatty acids in the straws. Miscanthus,
oilseed rape and sunflower straw extracts contain a high proportion of fatty acids. It is
expected that there may be high levels of free fatty acids in oilseed rape and sunflower
extracts as these are both oilseed crops that contain large amounts of free fatty acids in
their seeds. Sunflower straw extract is the only wax that consists of a considerable
amount of eicosanoic acid (C20). Sunflower straw wax is particularly interesting as it
also contains a high percentage of sterols. Sunflower straw contained eleven different
sterols and their derivatives, of which four are identified. Campesterol, stigmasterol
and β-sitosterol are the typical phytosterols found across all seven different straws.
Interestingly, a high level of wax esters is also present in the sunflower straw as over
18% of the extract is aliphatic wax esters. Currently, sunflower straw is being
developed for use as a major component of particle boards to replace wood-based
panels so extraction of sunflower straw for sterols and wax esters prior to particle
board manufacture means adding value to the low cost agricultural by-product.288
Sunflower appears to be a good potential biomass for scale up extraction due to its
high sterol and wax ester content in its straw but the crude yield of sunflower straw
hexane extract is only a very low 0.3%. With such low extraction yield, it is possible
that extraction is not very economically viable as there would be less kg of product
extracted per kg of CO2. However, if the sunflower straw was to be sorted and pre-
treated to remove the large cellulosic core and then solely extract the straw surfaces
then it may improve the economics but a full economic analysis must be carried out

215
due to the extra cost in processing step. As an extra pre-treatment step will have to be
added, the overall economics of the whole process needs to be assessed. Sunflower
straw wax does not contain any fatty alcohols which is an important group of
compounds in many cosmetics applications such as cosmetic creams but oat straw
wax showed an exceptionally high fatty alcohol content.289
Above 1700 µgg-1
of fatty
alcohols can be found in oat straw which is 2.5 times higher than the second highest,
barley straw. About 17% of the oat straw hexane extract was fatty alcohols which
makes it the biggest identified wax group found in oat. The results are in agreement
with results from oat leaf wax where 45% of the identified compounds is fatty
alcohols.100
Wax esters are the main wax group found in sunflower straw as almost of
the half of the quantified hexane extract is found to be wax esters with chain lengths
of up to at least 56 carbons. This could potentially be a good source of biomass for the
extraction high wax esters-based waxes. It was reported that at least 65% of the
sunflower seed wax was found to be aliphatic wax esters with the most predominant
being wax esters with 42 total alkyl chain length.290
Wheat and barley which showed a high hexane yield of about 1% do not have
distinctive high levels of a specific wax group but both of these cereal straws are the
only biomass to contain β-diketones which are interesting molecules with potential to
be metal chelators.93, 202
Both of the hexane extracts contain at least 2000 µgg-1
of β-
diketones with the predominant β-diketone being 14,16-hentriacontanedione. Bagasse
hexane extract contains the lowest amount of identified compounds and aldehydes
were mainly found in this extract with carbon chain length from C26 – C36 which is in
agreement with data from sugarcane wax.291
Most of the other straw waxes only
contain long chain aldehydes with chain lengths C26 – C30. Aldehydes are usually the
intermediates between alcohols and fatty acids. The low amount of identified
compounds in the bagasse extracts suggests that the majority of the compounds were
too non-volatile to be analysed by GC therefore it would be interesting to carry out
HPLC or GPC fractionation on the extract and identify the higher molecular weight
compounds. Derivatisation can also be carried out on the waxes to improve peak
shape and increase volatility. No wax esters have been reported previously in
sugarcane wax however, large triglycerides of C51 – C57 have been identified.291
The
study of sugarcane wax showed that the wax contains mainly aldehydes, fatty alcohols
and n-alkanes which are the three main groups identified. Aldehydes can be useful in

216
the flavour industry and from the identified compounds; the major wax group in the
extract is the long chain aldehydes which means the purity is high, and therefore less
downstream processing is required for the recovery of these aldehydes.
Considering the biomass availability, percentage crude yield and the chemical
composition profile (high in sterols, fatty alcohols and wax esters), wheat, barley and
oat straw were chosen for the scale up trials. These three agricultural crops are the top
three cereals grown in the UK and as the chemical compositions were somewhat
similar, wax blending at a later stage can be considered for formulations. Wheat and
barley straw were selected due to the extracts containing unique β-diketones as well as
relatively high levels of other valuable wax groups such as wax esters, sterols and
fatty alcohols. Oat straw wax showed exceptionally high quantities of wax esters,
sterols and fatty alcohols which have many important applications such as cosmetics.

21
7
Table 4.4: Quantification of hexane straw waxes (% in extracts)
Identification Hexane (% in extract) (n ≥ 2)
Wheat Barley Oat Oilseed Rape Sunflower Miscanthus Bagasse
Tetradecanoic acid (C14) 0.4 ± 0.07 0.4 ± 0.02 0.3 ± 0.02 0.2 ± 0.02 0.1 ± 0.06 0.2 ± 0.02 Tr
Hexadecanoic acid (C16) 3.3 ± 0.5 1.8 ± 0.1 3.1 ± 0.3 3.8 ± 0.2 3.8 ± 0.3 6.7 ± 0.9 1.8 ± 0.03
Octadecadienoic acid (C18:2) 0.7 ± 0.02 0.5 ± 0.02 0.5 ± 0.03 0.3 ± 0.08 0.1 ± 0.07 Tr Tr
Octadecenoic acid (C18:1) Tr 1.1 ± 0.01 0.2 ± 0.05 0.2 ± 0.01 Tr 0.8 ± 0.05 Tr
Octadecanoic acid (C18:0) 0.5 ± 0.01 0.4 ± 0.04 0.6 ± 0.01 1.4 ± 0.2 0.8 ± 0.02 0.8 ± 0.05 0.5 ± 0.08
Eicosanoic acid (C20) Tr Tr Tr Tr 1.3 ± 0.1 Tr Tr
Total free fatty acids 4.9 ± 0.6 4.2 ± 0.28 4.7 ± 0.4 6.0 ± 0.5 6.1 ± 0.55 8.5 ± 1.0 2.3 ± 0.11
Heptacosane (C27) 0.5 ± 0.1 0.4 ± 0.01 0.2 ± 0.02 0.4 ± 0.07 1.5 ± 0.08 1.3 ± 0.4 0.9 ± 0.1
Nonacosane (C29) 2.3 ± 0.4 7.4a ± 0.2 11.0
a ± 0.3 16.2 ± 1.1 3.3 ± 0.2 2.5 ± 0.3 1.0
a ± 0.2
Hentriacontane (C31) 1.9a ± 0.3 1.4
a ± 0.3 1.4
a ± 0.1 4.5 ± 0.2 1.8 ± 0.08 1.8 ± 0.08 5.3
a ± 0.3
Triatriacontane (C33) 1.0 ± 0.02 1.0 ±0.2 Tr Tr Tr 1.0 ± 0.05 0.4 ± 0.02
Total hydrocarbons 5.6a ± 0.82 10.2
a ± 0.71 12.6
a ± 0.42 25.9 ± 1.4 6.6 ± 0.4 6.5 ± 0.83 7.5 ± 0.69
Hexacosanol (C26) Tr 9.5a ± 0.9 14.2
a ± 0.8 Tr Tr Tr 1.2
a ± 0.04
Octacosanol (C28) 7.3a ± 0.2 1.9
a ± 0.1 2.8
a ± 0.1 Tr Tr 3.2 ± 0.1 6.9
a ± 0.2
Total fatty alcohols 7.3a ± 0.2 11.4
a ± 1 17.1
a ± 0.9 Tr Tr 3.2 ± 0.1 8.1 ± 0.24
Hexacosanal (C26) 0.1 ± 0.02 1.2 ± 0.03 2.5 ± 0.1 13.7 ± 0.3 0.2 ± 0.02 0.5 ± 0.05 0.3 ± 0.1
Octacosanal (C28) 1.1± 0.05 0.4 ± 0.02 0.4 ± 0.05 3.8 ± 0.2 0.8 ± 0.08 6.1 ± 1.3 5.6 ± 0.4
Triacontanol (C30) Tr Tr Tr 2.2 ± 0.03 Tr Tr 1.7 ± 0.02
Dotriacontanal (C32) Tr Tr Tr Tr Tr Tr 1.1 ± 0.08
Tetratriacontanal (C34) Tr Tr Tr Tr Tr Tr 1.2 ± 0.06
Hexatriacontanal (C36) Tr Tr Tr Tr Tr Tr 0.2 ± 0.02
Total aldehydes 1.3 ± 0.07 1.5 ± 0.05 2.9 ± 0.15 19.7 ± 0.53 0.9 ± 0.1 6.6 ± 1.4 10.1 ± 0.68
Tetracosanyl hexadecanoate (C24:C16) 0.3 ± 0.02 1.0 ± 0.1 0.4 ± 0.04 Tr Tr 0.2 ± 0.01 Tr
Hexacosanyl hexadecanoate (C26:C16) 0.8 ± 0.2 3.1 ± 0.3 0.4 ± 0.12 Tr 0.7 ± 0.08 0.7 ± 0.09 0.3 ± 0.1

21
8
Table 4.4 (continued)
Octacosanyl hexadecanoate (C28:C16) 0.8 ± 0.2 3.1 ± 0.3 1.1 ± 0.03 0.5 ± 0.05 2.2 ± 0.08 2.1 ± 0.09 1.1 ± 0.08
Wax ester 3 and 4 Tr Tr Tr 1.3 ± 0.4 Tr Tr Tr
Octacosanyl octadecanoate (C28:C18) 3.2 ± 0.4 9.0 ± 0.5 2.8 ± 0.9 0.6 ± 0.09 2.8 ± 0.8 1.5 ± 0.04 0.6 ± 0.09
Octacosanyl eicosanoate (C28:C20) 1.7 ± 0.03 7.7 ± 2.1 1.8 ± 0.4 0.8 ± 0.04 3.6 ± 1.2 1.6 ± 0.02 0.6 ± 0.06
Wax ester 5 Tr Tr Tr 0.4 ± 0.01 Tr Tr Tr
Octacosanyl dosanoate (C28:C22) 2.1 ± 0.3 2.3 ± 0.4 0.8 ± 0.2 0.5 ± 0.02 3.4 ± 0.9 1.1 ± 0.03 0.5 ± 0.01
Octacosanyl tetracosanoate (C28:C24) 0.7 ± 0.08 0.7 ± 0.3 1.8 ± 0.08 0.5 ± 0.03 2.5 ± 0.6 0.5 ± 0.02 0.5 ± 0.03
Octacosanyl hexacosanoate (C28:C26) 0.5 ± 0.09 0.6 ± 0.1 1.1 ± 0.02 0.4 ± 0.08 1.5 ± 0.4 0.2 ± 0.06 0.4 ± 0.04
Octacosanyl octacosanoate (C28:C28) 1.3 ± 0.1 0.4 ± 0.07 0.8 ± 0.4 Tr 1.7 ± 0.1 0.4 ± 0.1 1.6 ± 0.5
Total wax esters 12.1 ± 1.4 28.0 ± 5.22 12.9 ± 2.2 4.8 ± 0.76 18.4 ± 4.1 8.4 ± 0.3 5.8 ± 0.81
Campesterol 1.2 ± 0.3 2.9 ± 0.09 0.9 ± 0.03 Tr 0.2 ± 0.03 3.6 ± 0.2 Tr
Stigmasterol 1.4 ± 0.2 2.8 ± 0.1 0.7 ± 0.08 3.5 ± 0.3 5.0 ± 0.1 2.1 ± 0.1 Tr
β-sitosterol 1.0 ± 0.08 6.1 ± 0.3 0.9 ± 0.2 6.3 ± 0.4 3.0 ± 0.2 5.3 ± 0.6 0.8 ± 0.02
Sterol 1 0.7 ± 0.02 Tr Tr Tr 3.2 ± 0.08 5.3 ± 1.8 Tr
∆4-Sitosten-3-one 2.0 ± 0.14 1.9 ± 0.1 0.6 ± 0.1 2.4 ± 0.4 1.7 ± 0.1 Tr 1.1 ± 0.08
Sterol 2 0.9 ± 0.03 Tr 0.6 ± 0.05 1.6 ± 0.1 1.2 ± 0.1 1.6 ± 0.2 Tr
Sterol 3 Tr Tr 1.0 ± 0.2 Tr 1.4 ± 0.4 Tr Tr
Sterol 4 Tr Tr Tr Tr 1.0 ± 0.01 Tr Tr
Sterol 5 Tr Tr Tr Tr 4.2 ± 0.1 Tr Tr
Sterol 6 Tr Tr Tr Tr 0.8 ± 0.02 Tr Tr
Sterol 7 Tr Tr Tr Tr 2.0 ± 0.04 Tr Tr
Total sterols 7.2 ± 0.8 13.7 ± 0.6 4.6 ± 0.69 13.8 ± 1.2 10.6 ± 1.4 17.9 ± 2.9 1.9 ± 0.1
14,16 hentriacontanedione (C31) 14.8 ± 3.4 19.5 ± 2.9 Tr Tr Tr 2.0 ± 0.2 Tr
16,18 triatriacontanedione (C33) 3.0 ± 0.3 2.3 ± 0.4 Tr Tr Tr Tr Tr
Total β-diketones 17.8 ± 3.7 21.8 ± 3.3 Tr Tr Tr 2.0 ± 0.2 Tr
Nonacosan-15-one (C29) Tr Tr Tr 5.0 ± 1.4 Tr Tr Tr
Total ketone Tr Tr Tr 5.0 ± 1.4 Tr Tr Tr

21
9
Table 4.4 (continued)
Total identified 38.4 ± 6.8 69.2 ± 10.9 55.0 ± 4.9 75.3 ± 5.8 42.6 ± 6.3 53.2 ± 7.8 35.7 ± 2.6 a = co-elution and values shown are the combined quantities, Tr = Trace levels < LOQ, LOQ shown in Section 2.5.1
Table 4.5: Quantification of hexane straw waxes (µgg-1
of biomass)
Identification Hexane µgg
-1 of biomass (n ≥ 2)
Wheat Barley Oat Oilseed Rape Sunflower Miscanthus Bagasse
Tetradecanoic acid (C14) 41 ± 7.2 46 ± 2.3 42 ± 2.8 11 ± 1.1 3 ± 1.8 6 ± 0.6 Tr
Hexadecanoic acid (C16) 380 ± 57.6 194 ± 10.8 422 ± 40.8 276 ± 14.5 128 ± 10.1 222 ± 29.8 94 ± 1.6
Octadecadienoic acid (C18:2) 84 ± 2.4 48 ± 1.9 71 ± 7.1 25 ± 6.7 5 ± 3.5 Tr Tr
Octadecenoic acid (C18:1) Tr 115 ± 10.5 30 ± 1.5 15 ± 0.4 Tr 25 ± 1.7 Tr
Octadecanoic acid (C18:0) 54 ± 1.1 46 ± 4.6 78 ± 2.6 102 ± 14.6 26 ± 0.7 28 ± 1.8 24 ±3.8
Eicosanoic acid (C20) Tr Tr Tr Tr 44 ± 3.4 Tr Tr
Total free fatty acids 559 ± 68.4 449 ± 29.9 643 ± 54.7 430 ± 35.8 207 ± 18.7 282 ± 33.8 117 ± 5.6
Heptacosane (C27) 55 ± 11 41 ± 1 30 ± 3 27 ± 4.7 52 ± 2.8 43 ± 13.2 44 ± 4.9
Nonsacosane (C29) 265 ± 46.1 782a ± 21.1 1498
a ± 40.9 1170 ± 79.4 112 ± 6.8 81 ± 9.7 49
a ± 11.3
Hentriacontane (C31) 215a ± 33.9 153
a ± 32.8 192
a ± 13.7 322 ± 14.3 60 ± 3 59 ± 2.6 270
a ± 17.3
Triatriacontane (C33) 113 ± 2.3 108 ± 21.6 Tr Tr Tr 33 ± 1.7 22 ± 1.1
Total hydrocarbons 649a ± 95 1084
a ± 75.5 1720
a ± 57.3 1865 ± 98.7 224 ± 12.6 216 ± 27.6 384
a ± 35.3
Hexacosanol (C26) Tr 1011a ± 1937
a ± Tr Tr Tr 63
a ± 2.1
Octacosanol (C28) 843a ± 198
a ± 249
a ± Tr Tr 104 ± 350
a ± 10.1
Total fatty alcohols 843a ± 1209
a ± 2186
a ± Tr Tr 104 ± 412
a ± 12.2
Hexacosanal (C26) 20 ± 4 174 ± 4.4 524 ± 21 990 ± 21.7 5 ± 0.5 17 ± 1.7 15 ± 5
Octacosanal (C28) 202 ± 9.2 62 ± 3.1 83 ± 10.4 272 ± 14.3 26 ± 2.6 200 ± 42.6 288 ± 20.6
Triacontanal (C30) Tr Tr Tr 157 ± 2.1 Tr Tr 86 ± 1

22
0
Table 4.5 (continued)
Dotriacontanal (C32) Tr Tr Tr Tr Tr Tr 54 ± 3.9
Tetratriacontanal (C34) Tr Tr Tr Tr Tr Tr 62 ± 3.1
Hexatriacontanal (C36) Tr Tr Tr Tr Tr Tr 10 ± 1
Total aldehydes 222 ± 12 236 ± 7.9 607 ± 31.4 1419 ± 38.2 31 ± 3.4 217 ± 44.4 515 ± 34.7
Tetracosanyl hexadecanoate (C24:C16) 39 ± 2.6 110 ± 11 58 ± 5.8 Tr Tr 6 ± 0.3 Tr
Hexacosanyl hexadecanoate (C26:C16) 94 ± 24.7 326 ± 358 145 ± 43.5 Tr 25 ± 2.9 25 ± 3.2 18 ± 6
Octacosanyl hexdecanoate (C28:C16) 366 ± 91.5 955 ± 95.5 385 ± 10.5 33 ± 3.3 75 ± 2.7 71 ± 3 58 ± 4.2
Wax ester 3 and 4 Tr Tr Tr 88 ± 29.8 Tr Tr Tr
Octacosanyl octadecanoate (C28:C18) 190 ± 23.8 811 ± 44.2 248 ± 79.7 41 ± 6.2 95 ± 27.1 51 ± 1.4 31 ± 4.7
Octacosanyl eicosanoate (C28:C20) 180 ± 3.2 352 ± 96 302 ± 73.8 60 ± 3 123 ± 41 51 ± 0.6 31 ± 3.1
Wax ester 5 Tr Tr Tr 26 ± 0.7 Tr Tr Tr
Octacosanyl dosanoate (C28:C22) 240 ± 35.4 239 ± 41.6 107 ± 30.8 36 ± 1.4 116 ± 30.7 37 ± 1 26 ± 0.5
Octacosanyl tetracosanoate (C28:C24) 80 ± 9.1 70 ± 30 248 ± 11 37 ± 2.2 85 ± 20.4 16 ± 0.6 25 ± 1.5
Octacosanyl hexacosanoate (C28:C26) 54 ± 9.7 68 ± 15.9 155 ± 2.8 26 ± 5.2 52 ± 13.9 8 ± 1 21 ± 2.1
Octacosanyl octacosanoate (C28:C28) 150 ± 11.5 39 ± 6.8 113 ± 56.5 Tr 58 ± 3.4 13 ± 3.3 83 ± 25.9
Total wax esters 1394 ± 163.5 2970 ± 553.7 1761 ± 303.1 346 ± 54.8 627 ± 139 277 ± 9.9 294 ± 41.1
Campesterol 138 ± 35.7 312 ± 9.7 119 ± 4 Tr 7 ± 1.1 118 ± 7.9 Tr
Stigmasterol 160 ± 26.3 297 ± 12.7 90 ± 10.3 252 ± 20.9 170 ± 4.8 69 ± 3.3 Tr
β-sitosterol 112 ± 9 649 ± 28.7 122 ± 31.2 455 ± 31.8 102 ± 8.2 175 ± 18.5 42 ± 1.1
Sterol 1 83 ± 2.4 Tr Tr Tr 108 ± 2.7 176 ± 59.7 Tr
∆4-Sitosten-3-one 228 ± 16 200 ± 13.7 84 ± 14 173 ± 29.6 57 ± 4 Tr 55 ± 4
Sterol 2 105 ± 3.5 Tr 76 ± 6.3 117 ± 5.9 42 ± 4.6 52 ± 7.2 Tr
Sterol 3 Tr Tr 139 ± 27.8 Tr 47 ± 13.8 Tr Tr
Sterol 4 Tr Tr Tr Tr 32 ± 0.3 Tr Tr
Sterol 5 Tr Tr Tr Tr 143 ± 4.4 Tr Tr
Sterol 6 Tr Tr Tr Tr 28 ± 0.7 Tr Tr
Sterol 7 Tr Tr Tr Tr 67 ± 1.3 Tr Tr

22
1
Table 4.5 (continued)
Total sterols 827 ± 93 1457 ± 64.9 631 ± 94.7 996 ± 88.1 360 ± 45.8 591 ± 95.6 97 ± 5.1
14,16 hentriacontanedione (C31) 1707 ± 392.1 1931 ± 287.2 Tr Tr Tr 68 ± 7.8 Tr
16,18 triatriacontanedione (C33) 343 ± 35.4 228 ± 38.7 Tr Tr Tr Tr Tr
Total β-diketones 2051 ± 427.5 2160 ± 325.9 Tr Tr Tr 68 ± 7.8 Tr
Nonacosan-15-one (C29) Tr Tr Tr 363 ± 101.6 Tr Tr Tr
Total ketone Tr Tr Tr 363 ± 101.6 Tr Tr Tr
Total identified 6544 ± 1160.5 9565 ± 1506.6 7547 ± 680 5419 ± 414.5 1449 ± 212.6 1582 ± 232.5 1820 ± 132.5 a = co-elution and values shown are the combined quantities, Tr = Trace levels < LOQ, LOQ shown in Section 2.5.1
Table 4.6: Quantification of ethanol straw waxes (% in extract)
Identification Ethanol (% in extract) (n ≥ 2)
Wheat Barley Oat Oilseed Rape Sunflower Miscanthus Bagasse
Tetradecanoic acid (C14) 0.3 ± 0.04 0.8 ± 0.03 Tr Tr Tr 0.8 ± 0.3 ± 0.04
Hexadecanoic acid (C16) 2.7 ± 0.1 2.8 ± 0.1 0.9 ± 0.01 4.1 ± 0.03 1.6 ± 0.03 1.3 ± 0.6 ± 0.05
Octadecadienoic acid (C18:2) 0.4 ± 0.1 1.1 ± 0.1 0.1 ± 0.03 3.5 ± 0.2 Tr Tr Tr
Octadecenoic acid (C18:1) 1.0 ± 0.08 1.6 ± 0.2 0.4 ± 0.1 3.7 ± 0.2 Tr 0.1 ± 0.01 0.1 ± 0.01
Octadecanoic acid (C18:0) 0.4 ± 0.02 0.6 ± 0.07 0.2 ± 0.06 1.3 ± 0.07 0.3 ± 0.04 0.1 ± 0.02 0.1 ± 0.02
Eicosanoic acid (C20) Tr Tr Tr Tr 0.4 ± 0.07 Tr Tr
Total free fatty acids 4.8 ± 0.4 6.8 ± 0.59 1.6 ± 0.22 12.6 ± 0.55 2.3 ± 0.14 2.4 ± 0.17 1.1 ± 0.12
Heptacosane (C27) 0.2 ± 0.01 0.2 ± 0.02 2.3 ± 0.1 Tr 0.4 ± 0.03 0.2 ± 0.03 0.1 ± 0.02
Nonacosane (C29) 0.9 ± 0.07 0.1a ± 0.03 1.1
a ± 0.04 3.7
a ± 0.2 0.7 ± 0.02 0.6 ± 0.01 0.1 ± 0.03
Hentriacontane (C31) 2.7 ± 0.04 0.6a ± 0.01 0.3 ± 0.02 1.6
a ± 0.06 0.3 ± 0.01 0.2 ± 0.01 1.4 ± 0.09
Triatriacontane (C33) 0.4 ± 0.03 0.4 ± 0.05 Tr Tr Tr Tr Tr
Total hydrocarbons 4.2 ± 0.15 1.4 ± 0.1 3.7 ± 0.16 5.2 ± 0.23 3.6 ± 0.06 1.0 ± 0.05 1.7 ± 0.14

22
2
Table 4.6 (continued)
Hexacosanol (C26) Tr 4.9a ± 0.2 1.4
a ± 0.1 4.7
a ± 0.1 Tr Tr Tr
Octacosanol (C28) 3.5 ± 0.2 0.8a ± 0.09 0.3 ± 0.02 2.0
a ± 0.09 Tr 0.4 ± 0.03 Tr
Total fatty alcohols 3.5 ± 0.21 5.7a ± 0.32 1.7
a ± 0.14 6.8
a ± 0.21 Tr 0.4 ± 0.03 Tr
Hexacosanal (C26) Tr 0.1 ± 0.02 0.3 ± 0.04 Tr Tr Tr 0.1 ± 0.03
Octacosanal (C28) Tr Tr Tr Tr 0.3 ± 0.01 0.5 ± 0.04 1.1 ± 0.12
Triacontanal (C30) Tr Tr Tr 0.3 ± 0.03 Tr Tr 0.4 ± 0.09
Dotriacontanal (C32) Tr Tr Tr Tr Tr Tr 0.2 ± 0.02
Tetratriacontanal (C34) Tr Tr Tr Tr Tr Tr 0.2 ± 0.03
Total aldehydes Tr 0.1 ± 0.02 0.3 ± 0.04 0.3 ± 0.03 0.3 ± 0.01 0.5 ± 0.04 1.9 ± 0.29
Tetracosanyl hexadecanoate (C24:C16) Tr 0.3 ± 0.01 Tr Tr Tr Tr Tr
Hexacosanyl hexadecanoate (C26:C16) 0.3 ± 0.04 1.0 ± 0.02 0.2 ± 0.03 0.4 ± 0.02 0.3 ± 0.01 0.1 ± 0.02 Tr
Octacosanyl hexdecanoate (C28:C16) 1.0 ± 0.03 1.2 ± 0.03 0.4 ± 0.02 1.0 ± 0.03 0.3 ± 0.02 0.3 ± 0.04 Tr
Octacosanyl octadecanoate (C28:C18) 0.8 ± 0.01 0.9 ± 0.02 0.2 ± 0.02 Tr 0.4 ± 0.02 0.3 ± 0.05 Tr
Octacosanyl eicosanoate (C28:C20) 0.5 ± 0.02 0.8 ± 0.01 0.2 ± 0.08 Tr 0.4 ± 0.05 0.2 ± 0.06 Tr
Octacosanyl dosanoate (C28:C22) 0.7 ± 0.03 0.3 ± 0.09 0.1 ± 0.01 Tr 0.3 ± 0.06 0.1 ± 0.08 Tr
Octacosanyl tetracosanoate (C28:C24) 0.2 ± 0.01 0.2 ± 0.08 0.1 ± 0.04 Tr 0.2 ± 0.08 Tr Tr
Octacosanyl hexacosanoate (C28:C26) 0.2 ± 0.01 Tr Tr Tr 0.2 ± 0.09 Tr Tr
Octacosanyl octacosanoate (C28:C28) 0.4 ± 0.04 Tr Tr Tr 0.2 ± 0.01 Tr Tr
Total wax esters 4.1 ± 0.19 4.7 ± 0.26 1.2 ± 0.2 1.4 ± 0.05 4.4 ± 0.34 1.0 ± 0.25 Tr
Campesterol 0.6 ± 0.04 1.3 ± 0.1 Tr 0.5 ± 0.04 0.3 ± 0.003 0.5 ± 0.04 Tr
Stigmasterol 0.8 ± 0.05 1.3 ± 0.02 Tr 1.8 ± 0.5 1.3 ± 0.04 0.4 ± 0.02 Tr
β-sitosterol 1.7 ± 0.09 3.9 ± 0.3 0.4 ± 0.03 0.7 ± 0.01 0.8 ± 0.02 1.0 ± 0.03 0.5 ± 0.02
Sterol 1 0.3 ± 0.08 0.6 ± 0.02 Tr Tr 0.8 ± 0.02 0.8 ± 0.09 Tr
∆4-Sitosten-3-one 1.1 ± 0.02 Tr Tr Tr 0.6 ± 0.03 Tr 0.4 ± 0.03
Sterol 2 0.5 ± 0.01 Tr Tr 0.4 ± 0.01 0.3 ± 0.1 Tr 0.3 ± 0.04
Sterol 3 Tr Tr Tr Tr 0.3 ± 0.1 Tr Tr
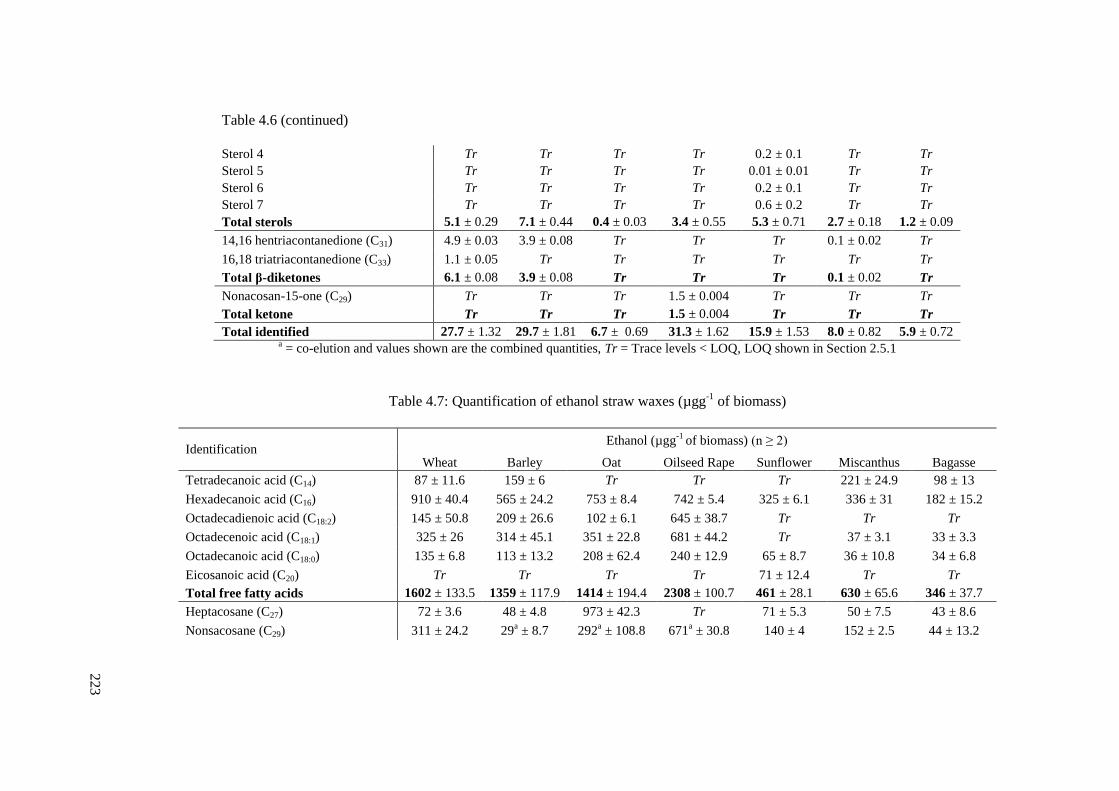
22
3
Table 4.6 (continued)
Sterol 4 Tr Tr Tr Tr 0.2 ± 0.1 Tr Tr
Sterol 5 Tr Tr Tr Tr 0.01 ± 0.01 Tr Tr
Sterol 6 Tr Tr Tr Tr 0.2 ± 0.1 Tr Tr
Sterol 7 Tr Tr Tr Tr 0.6 ± 0.2 Tr Tr
Total sterols 5.1 ± 0.29 7.1 ± 0.44 0.4 ± 0.03 3.4 ± 0.55 5.3 ± 0.71 2.7 ± 0.18 1.2 ± 0.09
14,16 hentriacontanedione (C31) 4.9 ± 0.03 3.9 ± 0.08 Tr Tr Tr 0.1 ± 0.02 Tr
16,18 triatriacontanedione (C33) 1.1 ± 0.05 Tr Tr Tr Tr Tr Tr
Total β-diketones 6.1 ± 0.08 3.9 ± 0.08 Tr Tr Tr 0.1 ± 0.02 Tr
Nonacosan-15-one (C29) Tr Tr Tr 1.5 ± 0.004 Tr Tr Tr
Total ketone Tr Tr Tr 1.5 ± 0.004 Tr Tr Tr
Total identified 27.7 ± 1.32 29.7 ± 1.81 6.7 ± 0.69 31.3 ± 1.62 15.9 ± 1.53 8.0 ± 0.82 5.9 ± 0.72 a = co-elution and values shown are the combined quantities, Tr = Trace levels < LOQ, LOQ shown in Section 2.5.1
Table 4.7: Quantification of ethanol straw waxes (µgg
-1 of biomass)
Identification Ethanol (µgg
-1 of biomass) (n ≥ 2)
Wheat Barley Oat Oilseed Rape Sunflower Miscanthus Bagasse
Tetradecanoic acid (C14) 87 ± 11.6 159 ± 6 Tr Tr Tr 221 ± 24.9 98 ± 13
Hexadecanoic acid (C16) 910 ± 40.4 565 ± 24.2 753 ± 8.4 742 ± 5.4 325 ± 6.1 336 ± 31 182 ± 15.2
Octadecadienoic acid (C18:2) 145 ± 50.8 209 ± 26.6 102 ± 6.1 645 ± 38.7 Tr Tr Tr
Octadecenoic acid (C18:1) 325 ± 26 314 ± 45.1 351 ± 22.8 681 ± 44.2 Tr 37 ± 3.1 33 ± 3.3
Octadecanoic acid (C18:0) 135 ± 6.8 113 ± 13.2 208 ± 62.4 240 ± 12.9 65 ± 8.7 36 ± 10.8 34 ± 6.8
Eicosanoic acid (C20) Tr Tr Tr Tr 71 ± 12.4 Tr Tr
Total free fatty acids 1602 ± 133.5 1359 ± 117.9 1414 ± 194.4 2308 ± 100.7 461 ± 28.1 630 ± 65.6 346 ± 37.7
Heptacosane (C27) 72 ± 3.6 48 ± 4.8 973 ± 42.3 Tr 71 ± 5.3 50 ± 7.5 43 ± 8.6
Nonsacosane (C29) 311 ± 24.2 29a ± 8.7 292
a ± 108.8 671
a ± 30.8 140 ± 4 152 ± 2.5 44 ± 13.2

22
4
Table 4.7 (continued)
Hentriacontane (C31) 904 ± 13.4 117a ± 11.7 Tr 288
a ± 10.8 62 ± 2.1 54 ± 2.7 418 ± 94.1
Triatriacontane (C33) 119 ± 8.9 79 ± 3 Tr Tr Tr Tr Tr
Total hydrocarbons 1407 ± 50.3 273a ± 21.5 1266
a ± 54.3 959
a ± 16 710 ± 11.8 256 ± 12.8 505 ± 41.6
Hexacosanol (C26) Tr 984a ± 46.2 1256
a ± 107.7 867
a ± 22.1 Tr Tr Tr
Octacosanol (C28) 1169 ± 70.1 152a ± 17.1 241 ± 16.1 373
a ± 16.8 Tr 93 ± 7 Tr
Total fatty alcohols 1169 ± 70.1 1136a ± 63.8 1497
a ± 123.3 1240 ± 38.3 Tr 93 ± 7 Tr
Hexacosanal (C26) Tr 296 ± 59.2 180 ± 24 Tr Tr Tr 16 ± 4.8
Octacosanal (C28) Tr Tr Tr Tr 59 ± 2 127 ± 10.2 327 ± 35.7
Triacontanal (C30) Tr Tr Tr 52 ± 5.2 Tr Tr 107 ± 24.1
Dotriacontanal (C32) Tr Tr Tr Tr Tr Tr 48 ± 4.8
Tetratriacontanal (C34) Tr Tr Tr Tr Tr Tr 60 ± 9
Total aldehydes Tr 296 ± 59.2 180 ± 24 52 ± 5.2 59 ± 2 127 ± 10.2 559 ± 8.5
Tetracosanyl hexadecanoate (C24:C16) Tr 57 ± 1.9 Tr Tr Tr Tr Tr
Hexacosanyl hexadecanoate (C26:C16) 103 ± 13.7 207 ± 4.1 Tr 81 ± 4.1 39 ± 1.3 21 ± 4.2 Tr
Octacosanyl hexdecanoate (C28:C16) 336 ± 10 243 ± 6.1 191 ± 28.7 183 ± 5.5 58 ± 3.9 79 ± 10.5 Tr
Octacosanyl octadecanoate (C28:C18) 253 ± 3.2 177 ± 3.9 380 ± 19 Tr 68 ± 3.4 67 ± 11.2 Tr
Octacosanyl eicosanoate (C28:C20) 166 ± 6.6 150 ± 1.9 182 ± 18.2 Tr 77 ± 9.6 62 ±18.6 Tr
Octacosanyl dosanoate (C28:C22) 229 ± 9.8 57 ± 7.1 182 ± 18.2 Tr 71 ± 14.2 32 ± 25.6 Tr
Octacosanyl tetracosanoate (C28:C24) 81 ± 4.1 48 ± 9.2 66 ± 78.8 Tr 56 ± 22.4 Tr Tr
Octacosanyl hexacosanoate (C28:C26) 51 ± 2.6 Tr 101 ± 40.4 Tr 32 ± 14.4 Tr Tr
Octacosanyl octacosanoate (C28:C28) 145 ± 14.5 Tr Tr Tr 36 ± 5.1 Tr Tr
Total wax esters 1363 ± 63.2 938 ± 49.9 1102 ± 183.7 264 ± 9.6 436 ± 57.5 261 ± 65.3 Tr
Campesterol 213 ± 14.2 256 ± 19.7 Tr 98 ± 7.8 65 ± 0.7 124 ± 9.9 Tr
Stigmasterol 282 ± 17.6 267 ± 4.1 Tr 335 ± 93.1 260 ± 8 100 ± 5 Tr
β-sitosterol 557 ± 29.5 775 ± 59.6 321 ± 24.1 119 ± 1.7 153 ± 3.8 261 ± 7.8 146 ± 5.8
Sterol 1 114 ± 30.4 113 ± 3.8 Tr Tr 157 ± 17.7 222 ± 25 Tr
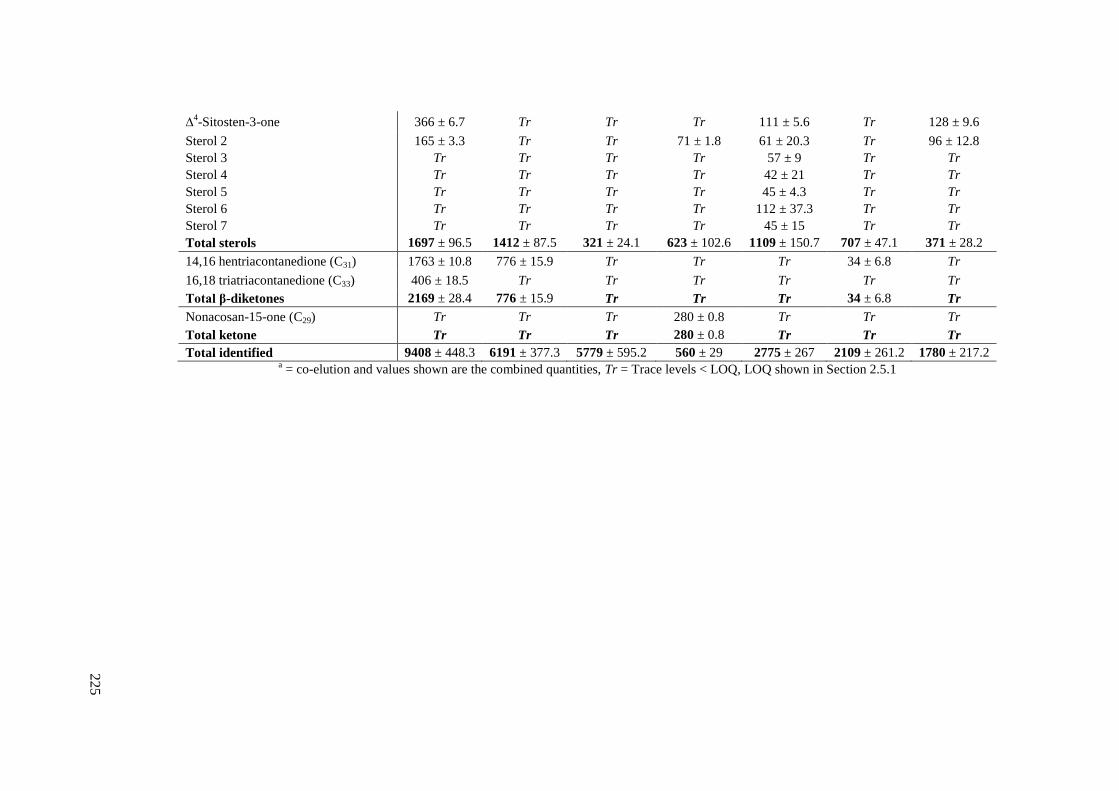
22
5
∆4-Sitosten-3-one 366 ± 6.7 Tr Tr Tr 111 ± 5.6 Tr 128 ± 9.6
Sterol 2 165 ± 3.3 Tr Tr 71 ± 1.8 61 ± 20.3 Tr 96 ± 12.8
Sterol 3 Tr Tr Tr Tr 57 ± 9 Tr Tr
Sterol 4 Tr Tr Tr Tr 42 ± 21 Tr Tr
Sterol 5 Tr Tr Tr Tr 45 ± 4.3 Tr Tr
Sterol 6 Tr Tr Tr Tr 112 ± 37.3 Tr Tr
Sterol 7 Tr Tr Tr Tr 45 ± 15 Tr Tr
Total sterols 1697 ± 96.5 1412 ± 87.5 321 ± 24.1 623 ± 102.6 1109 ± 150.7 707 ± 47.1 371 ± 28.2
14,16 hentriacontanedione (C31) 1763 ± 10.8 776 ± 15.9 Tr Tr Tr 34 ± 6.8 Tr
16,18 triatriacontanedione (C33) 406 ± 18.5 Tr Tr Tr Tr Tr Tr
Total β-diketones 2169 ± 28.4 776 ± 15.9 Tr Tr Tr 34 ± 6.8 Tr
Nonacosan-15-one (C29) Tr Tr Tr 280 ± 0.8 Tr Tr Tr
Total ketone Tr Tr Tr 280 ± 0.8 Tr Tr Tr
Total identified 9408 ± 448.3 6191 ± 377.3 5779 ± 595.2 560 ± 29 2775 ± 267 2109 ± 261.2 1780 ± 217.2 a = co-elution and values shown are the combined quantities, Tr = Trace levels < LOQ, LOQ shown in Section 2.5.1
226
4.3 Production scale extraction of cereal straw waxes
4.3.1 Raw materials
Wheat (Triticum aestivum), barley (Hordeum vulgare) and oat (Avena sativa) were the three
cereal straws selected for the scale up trials from the preliminary straw wax screen. Air-dried
cereal straws were physically pre-treated by Sundown Products Limited as described in Section
6.2.2. The moisture levels of the straw pellets were confirmed to be less than 10% by following
the procedure described in Section 6.2.1 prior to extraction. It must be noted that the varieties
of the straws were mixed so there may be variation in any of the initial biomass screens,
organic solvent or CO2 extraction data compared with that discussed in Chapter 2 and Chapter
3. As well as variation in varieties, the raw material is a natural product so other variations
such as regional and seasonal must be considered when comparing the results. Although much
effort was made to keep the materials the same in the extraction process itself, these
uncontrolled parameters could influence both positively and negatively the quality of the raw
materials, therefore indirectly affecting the quality of the wax products. Deswarte investigated
the wax content of wheat straw variety Sabre in 2003 and 2005, and highlighted the differences
in extraction yield for two different harvesting years and suggested it was due to environmental
factors. Environmental factors such as rainfall have shown to have a big influence on wax
production in plants.47, 292, 293
As shown in Section 4.2.2, straw of different varieties from the
same season and region can also have different wax content and this is due to the genetics of
the plants.47
There are controllable factors that could also influence the wax content and
chemical composition and these include storage conditions and pre-treatment methods.47, 294
Deswarte showed that the particle size of wheat straw can affect the scCO2 extraction efficiency
as small particle sizes can aid the diffusion of CO2 through the straw and solubilise the wax
compounds.16
As many factors can influence the wax content, chemical composition and
extraction efficiency, the three different cereal straws used were all winter cereals grown in the
East Midlands in the UK and were harvested in summer 2009. To minimise any variables, the
straws all underwent the same physical pre-treatment and storage conditions described in
Section 6.2.2. The processed straw pellets were first investigated at laboratory scale to ensure
good extraction yield. It would be interesting to investigate the influence on straw waxes of
various environmental factors and pre-treatment methods. From the preliminary solvent and
CO2 extraction study, it was concluded that supercritical CO2 behaved very similarly to both
hexane and heptane. 231

227
4.3.2 Laboratory extraction trials at York Green Chemistry Centre
Prior to the laboratory extractions, the moisture level of wheat, barley and oat straw pellets
were recorded as 9.5%, 8.4% and 9.4% respectively. The straw pellets were Soxhlet extracted
using heptane following the procedure described in Section 6.2.3. The wax compounds were
identified using GC-MS using the method described in Section 6.3.2 and the key wax
compounds were quantified using calibration data discussed in Section 2.5.1 using the GC
method described in Section 6.3.1. The percentage crude yield for wheat, oat and barley were
1.4%, 1.8% and 2.1% respectively. These yields were generally higher than the percentage
heptane yield presented in the biomass screen in Section 4.2. This could be due to a number of
reasons such as the variety of straw, particle size of straw pellets, and quality of straw. From
this initial heptane laboratory extraction trial, the percentage recovery of wax from the straw
showed promising results for supercritical CO2 scale up trials. The chemical composition of the
straw waxes were found to be almost identical which was not expected as from the straw wax
screen, there were distinct differences between the three different cereal crops. The chemical
composition profile is highly comparable with Figure 2.43 shown for wheat straw (Viscount
09) and no new molecules were identified. To investigate this further, quantitative analysis was
carried out to calculate the percentage of individual wax compound in the extracts. Table 4.8
displays the normalised percentage wax compound in extract (100%) and as µg of wax
compound per g of cereal straw. The quantities for the different wax groups are very similar
with about 7 – 12% of free fatty acids, 7 – 9% of hydrocarbons, 2% of octacosanol, 1 – 2% of
aldehydes, 9 – 10% of wax esters, 5 – 8% of sterols and 3 – 14% of 14,16-hentriacontanedione
in the straw waxes. Barley straw showed the highest level of sterol content out of the three
cereal straws which are in agreement of a sterol study on the three identical mature cereal
straws.187
However, the study showed that oat straw contains a higher sterol content compared
to wheat straw which is not the case with the raw materials used for the industrial scale trials.187
It was also reported that cholesterol was also identified as one of the main wax components but
no cholesterol was found in any extracts from all seven biomasses.187
The total identified
compounds varied between 38 – 47% and taken into the crude extraction yield, the percentage
of lipophilic fraction in wheat; oat and barley straw heptane extracts are 0.5%, 0.9% and 1%
respectively. This showed that oat and barley straw have higher wax content and can yield a
higher value product however, wheat straw is the most abundant and cheapest agricultural
cereal crop in the UK so offers the greatest potential source of renewable wax.26
All three

228
straws were used for the supercritical CO2 scale up trial with no pre-treatment modification
other than initial milling and pelleting.
Table 4.8: Quantification of laboratory scale heptane Soxhlet extraction wheat, barley and oat straw
wax components
Identification % in extract (n ≥ 2) µgg
-1 of biomass (n ≥ 2)
Wheat Barley Oat Wheat Oat Barley
Tetradecanoic acid (C14) 0.5 ±
0.02
0.7 ±
0.02
0.9 ±
0.02 66 ± 2.6 126 ± 3.6 184 ± 4.1
Hexadecanoic acid (C16) 1.6 ±
0.01
5.4 ±
0.12
4.4 ±
0.07 224 ± 1.4 974 ± 21.6 922 ± 14.7
Octadecadienoic acid (C18:2) 1.1 ±
0.03
1.7 ±
0.01
0.2 ±
0.004 161 ± 4.4 301 ± 1.8 40 ± 1.1
Octadecenoic acid (C18:1) 2.9 ±
0.08
3.6 ±
0.03
1.3 ±
0.03
403 ±
11.1 639 ± 5.8 274 ± 6.8
Octadecanoic acid (C18:0) 0.6 ±
0.01
0.9 ±
0.04 0.7 ± 0.0 87 ± 1.5 154 ± 6.8 139 ± 4.6
Total free fatty acids 6.7 ±
0.15
12.2 ±
0.11
7.4 ±
0.15
942 ±
21.1
2195 ±
19.8 1559 ± 31.6
Heptacosane (C27) 0.6 ±
0.04
0.6 ±
0.02
0.6 ±
0.02 78 ± 5.2 100 ± 3.3 136 ± 5.3
Nonsacosane (C29) 1.7 ±
0.01
5.9 ±
0.14
4.0 ±
0.04 232 ± 1.4 1057 ± 6.3 840 ± 8.9
Hentriacontane (C31) 4.2 ± 0.1 2.0 ±
0.01
2.4 ±
0.03 593 ± 190 355 ± 1.8 502 ± 6.7
Triatriacontane (C33) 0.6 ±
0.01
0.5 ±
0.01
0.6 ±
0.02 90 ± 1.7 92 ± 1.8 127 ± 5.1
Total hydrocarbons 7.1 ±
0.19
8.9 ±
0.18
7.6 ±
0.11
994 ±
27.1
1605 ±
32.5 1605 ± 23.5
Octacosanol (C28) 2.0 ± 0.1 2.4 ±
0.07
2.0 ±
0.04
287 ±
17.2 440 ± 12.8 428 ± 8.8
Total fatty alcohol 2.0 ±
0.12
2.4 ±
0.07
2.0 ±
0.04
287 ±
17.2 440 ± 12.8 428 ± 8.8
Hexacosanal (C26) 0.2 ±
0.01
1.3 ±
0.05
0.5 ±
0.03 29 ± 1.6 240 ± 10 109 ± 6.5
Octacosanal (C28) 1.4 ±
0.03
0.9 ±
0.01
0.7 ±
0.04 191 ± 4.4 162 ± 2.2 148 ± 8.7
Total aldehydes 1.6 ±
0.04
2.2 ±
0.06
1.2 ±
0.07 219 ± 6 401 ± 12.2 257 ± 15.2
Tetracosanyl hexadecanoate
(C24:C16)
0.5 ±
0.02
0.6 ±
0.01
0.7 ±
0.01 64 ± 3 110 ± 1.8 151 ± 2.7
Hexacosanyl hexadecanoate
(C26:C16)
1.3 ±
0.05
1.4 ±
0.03
1.5 ±
0.04 184 ± 7.1 250 ± 5.4 309 ± 8.9
Octacosanyl hexdecanoate
(C28:C16)
1.6 ±
0.03
1.9 ±
0.02 2.0 ± 0.1 224 ± 4.8 338 ± 6.2 423 ± 23.3
Octacosanyl octadecanoate
(C28:C18)
1.4 ±
0.02
1.3 ±
0.01
1.7 ±
0.03 194 ± 3.2 230 ± 2.2 366 ± 6.9
Octacosanyl eicosanoate
(C28:C20)
1.2 ±
0.01
1.4 ±
0.02
1.4 ±
0.09
165 ±
15.3 245 ± 4.2 297 ± 19.5
Octacosanyl dosanoate
(C28:C22)
2.1 ±
0.03
1.1 ±
0.01
1.1 ±
0.02 287 ± 8.1 195 ± 2.4 234 ± 4.5
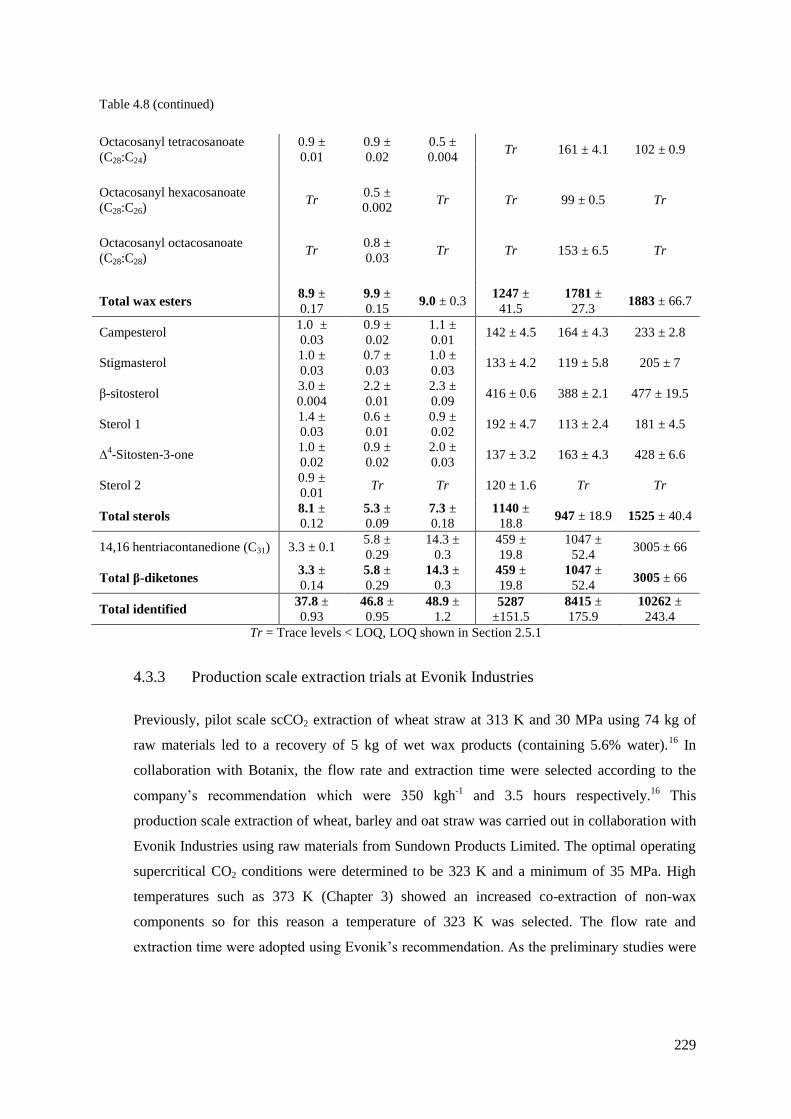
229
Table 4.8 (continued)
Octacosanyl tetracosanoate
(C28:C24)
0.9 ±
0.01
0.9 ±
0.02
0.5 ±
0.004 Tr 161 ± 4.1 102 ± 0.9
Octacosanyl hexacosanoate
(C28:C26) Tr
0.5 ±
0.002 Tr Tr 99 ± 0.5 Tr
Octacosanyl octacosanoate
(C28:C28) Tr
0.8 ±
0.03 Tr Tr 153 ± 6.5 Tr
Total wax esters 8.9 ±
0.17
9.9 ±
0.15 9.0 ± 0.3
1247 ±
41.5
1781 ±
27.3 1883 ± 66.7
Campesterol 1.0 ±
0.03
0.9 ±
0.02
1.1 ±
0.01 142 ± 4.5 164 ± 4.3 233 ± 2.8
Stigmasterol 1.0 ±
0.03
0.7 ±
0.03
1.0 ±
0.03 133 ± 4.2 119 ± 5.8 205 ± 7
β-sitosterol 3.0 ±
0.004
2.2 ±
0.01
2.3 ±
0.09 416 ± 0.6 388 ± 2.1 477 ± 19.5
Sterol 1 1.4 ±
0.03
0.6 ±
0.01
0.9 ±
0.02 192 ± 4.7 113 ± 2.4 181 ± 4.5
∆4-Sitosten-3-one
1.0 ±
0.02
0.9 ±
0.02
2.0 ±
0.03 137 ± 3.2 163 ± 4.3 428 ± 6.6
Sterol 2 0.9 ±
0.01 Tr Tr 120 ± 1.6 Tr Tr
Total sterols 8.1 ±
0.12
5.3 ±
0.09
7.3 ±
0.18
1140 ±
18.8 947 ± 18.9 1525 ± 40.4
14,16 hentriacontanedione (C31) 3.3 ± 0.1 5.8 ±
0.29
14.3 ±
0.3
459 ±
19.8
1047 ±
52.4 3005 ± 66
Total β-diketones 3.3 ±
0.14
5.8 ±
0.29
14.3 ±
0.3
459 ±
19.8
1047 ±
52.4 3005 ± 66
Total identified 37.8 ±
0.93
46.8 ±
0.95
48.9 ±
1.2 5287
±151.5
8415 ±
175.9
10262 ±
243.4
Tr = Trace levels < LOQ, LOQ shown in Section 2.5.1
4.3.3 Production scale extraction trials at Evonik Industries
Previously, pilot scale scCO2 extraction of wheat straw at 313 K and 30 MPa using 74 kg of
raw materials led to a recovery of 5 kg of wet wax products (containing 5.6% water).16
In
collaboration with Botanix, the flow rate and extraction time were selected according to the
company’s recommendation which were 350 kgh-1
and 3.5 hours respectively.16
This
production scale extraction of wheat, barley and oat straw was carried out in collaboration with
Evonik Industries using raw materials from Sundown Products Limited. The optimal operating
supercritical CO2 conditions were determined to be 323 K and a minimum of 35 MPa. High
temperatures such as 373 K (Chapter 3) showed an increased co-extraction of non-wax
components so for this reason a temperature of 323 K was selected. The flow rate and
extraction time were adopted using Evonik’s recommendation. As the preliminary studies were

230
carried out with four hour extraction time, it was suggested the production scale extraction
should be a similar extraction time. Table 4.9 summarises the extraction conditions for the
production scale scCO2 extraction of three tonnes of straw waxes (one tonne wheat straw, one
tonne oat straw and one tonne barley straw) using 2 x 200 L extractors. As the maximum
operating pressure for the plant used is only 28 MPa, the operating extraction pressure for wax
extraction was dropped to 26 MPa. The bulk densities, hexane Soxhlet extraction yields and
moisture levels of the three straw waxes were completed by Evonik Industries prior to
production scale extraction as part of the standard operating procedure. The bulk density of the
straw pellets allows the estimation of number of batches required for total extraction therefore
predicting the total extraction time. Due to the size of the extractors used, the extractions must
be carried out in batches. Currently, all industrial extractions are carried out in batch processes.
An extraction of 200 L can accommodate a minimum of 90 kg of straw pellets with bulk
density of about 0.6 gcm-3
. Hexane Soxhlet extraction of the straw pellets was carried out to
check for percentage wax recovery as hexane and scCO2 extraction yields are typically very
similar. Moisture level of the straw pellets was determined as scCO2 can co-extract any water in
the raw material therefore if the level of moisture is too high the physical properties of the CO2
such as polarity can be modified. When the conditions from the production scale was compared
to the optimisation carried out as described in Chapter 3, the estimated yield was highly
comparable. This shows that the model in Chapter 3 is relatively accurate when predicting
extraction yields and would be useful for future scale up trials.
During the process, one significant problem was encountered as the wax product has a high
melting point which means the extract can solidify easily. After ten extractions without
emptying the separator, the wax had solidified after the depressurisation valve and in the
separator. The separator temperature was only set at 323 K so the wax was not molten. This
problem was not apparent in laboratory scale extractions as the quantity of wax in the separator
was not enough to block the pipes and also the separator was emptied after each extraction. To
overcome the blockage problem, Evonik Industries decided that a ratio of 0.7 – 1.5 parts of
rapeseed oil needed to be added as a carrier oil to clear the pipes as indicated in Table 4.10.
This was carried out by injecting the oil into the high pressure line between the extractor and
separator. This additional oil is not ideal as it leads to wheat straw wax diluted with rapeseed oil
which means separation is required prior to any analysis and further processing. A total of five
batches of wheat straw waxes (in addition to the 10 batches retrieved without oil) were diluted

231
with rapeseed oil and details for the weight of wheat straw and percentage yields for these
batches are shown below.
Table 4.9: Summary of production scale scCO2 extraction conditions
Straw Wheat Oat Barley
Total weight of raw materials (kg) 895 1095 1080
Bulk density (gcm-3
) 0.61 - 0.64 0.63 0.63
Extraction temperature (K) 323 - 343 323 - 343 323 - 343
Extraction pressure (MPa) 26 26 26
Flow rate (kg of CO2 per kg of straw pellets) 50 - 60 50 - 60 50 - 60
Extraction time (hours) 4 4 4
Number of batches 10 12 12
Extraction crude yields (%) 1.3 1.8 2.5
Table 4.10: Summary of carrier oil-containing wheat straw waxes
Straw Wheat Wheat Wheat Wheat
Total weight of raw materials (kg) 95 95 190 90
Extraction temperature (K) 323 - 343 323 - 343 323 - 343 323 - 343
Extraction pressure (MPa) 26 26 26 26
Flow rate (kg of CO2 per kg of straw pellets) 50 - 60 50 - 60 50 - 60 50 - 60
Extraction time (hours) 4 4 4 4
Wax: rapeseed oil (carrier oil) ratio 1:1.5 1:1.2 1:0.7 Low
Percentage yields (including carrier oil) (%) 7.28 8.12 4.24 2.0
Due to blockage problems from solidifying waxes, the separator temperature had to be
increased to ensure the wax remains molten in the pipelines and separator so the wax can be
recovered easily. The majority of the wheat straw wax was fully melted at about 343 K so the
temperature of the separator for the remaining batches of straw was set to 343 K and this was
shown to be a good way to retrieve the wax. In this scale up trial, the extraction pressure had to
be lowered due to the limited capability of the plant and the separator temperature was
increased to enable easier handling of the extracted wax.

232
The waxes collected from the scCO2 production scale trials were different to those from scCO2
laboratory scale waxes as the volume of co-extracted water was larger. Wet waxes were also
recovered in the pilot scale extraction of wheat straw waxes.16
Water is not co-extracted during
solvent extractions so this is not a problem that needs to be dealt with when using traditional
non-polar organic solvents. The co-extraction of water is discussed in more detail in Section
5.2.1. Figure 4.16 shows the percentage crude yields for the laboratory solvent extractions
carried out both in York and in Evonik Industries. The graph also shows the supercritical CO2
wet and dry yield from production scale extractions. The supercritical CO2 yields looked highly
comparable when the co-extracted water was included however, once the water is removed, the
percentage crude yield dropped to a range of only 0.8 – 1.5%. These yields were much lower
than expected as the solvent extraction trials were between 1.4 – 2.3%. One explanation for the
difference in percentage yield could be due to the lower pressure used for the scale up. A drop
in extraction pressure is equivalent to a decrease in CO2 density and it was concluded in
Chapter 3 that the percentage crude yield is highly dependent on the density of CO2. The lower
efficiency of the extraction may also be due to the presence of water altering the solubility of
the different wax components in scCO2. It is possible to carry out a second scCO2 extraction
using higher pressure in order to gain more understanding of the chemical composition of the
“missing” yield. As the preliminary trials were carried out using hexane/ heptane, the straw
residues after the production scale scCO2 extraction were re-extracted using heptane Soxhlet
extraction.
The scCO2 extracted straw residues appeared almost identical to the virgin cereal straw pellets.
However, the extracted straw residues were re-pelletised using the procedure described in
Section 4.2.2 by Sundown Products Limited for animal feed. Figure 4.17 shows a comparison
graph for the supercritical CO2 and heptane re-extracted crude yields with heptane Soxhlet
crude yields. The combined total yields for heptane re-extracted and supercritical CO2 are
highly comparable with heptane Soxhlet yields which suggests that the straw residues still
contain unextracted waxes. This indicates that the CO2 density used for the extraction was not
high enough to recover the full quantity of the lipophilic fraction. In order to improve the wax
recovery, the extraction pressure must be increased. Increasing the pressure will lead to an
increase in the cost of the process significantly so it must be considered carefully by carrying
out an economical assessment to investigate whether increase in yield is sufficient to justify the
increased extraction pressure.
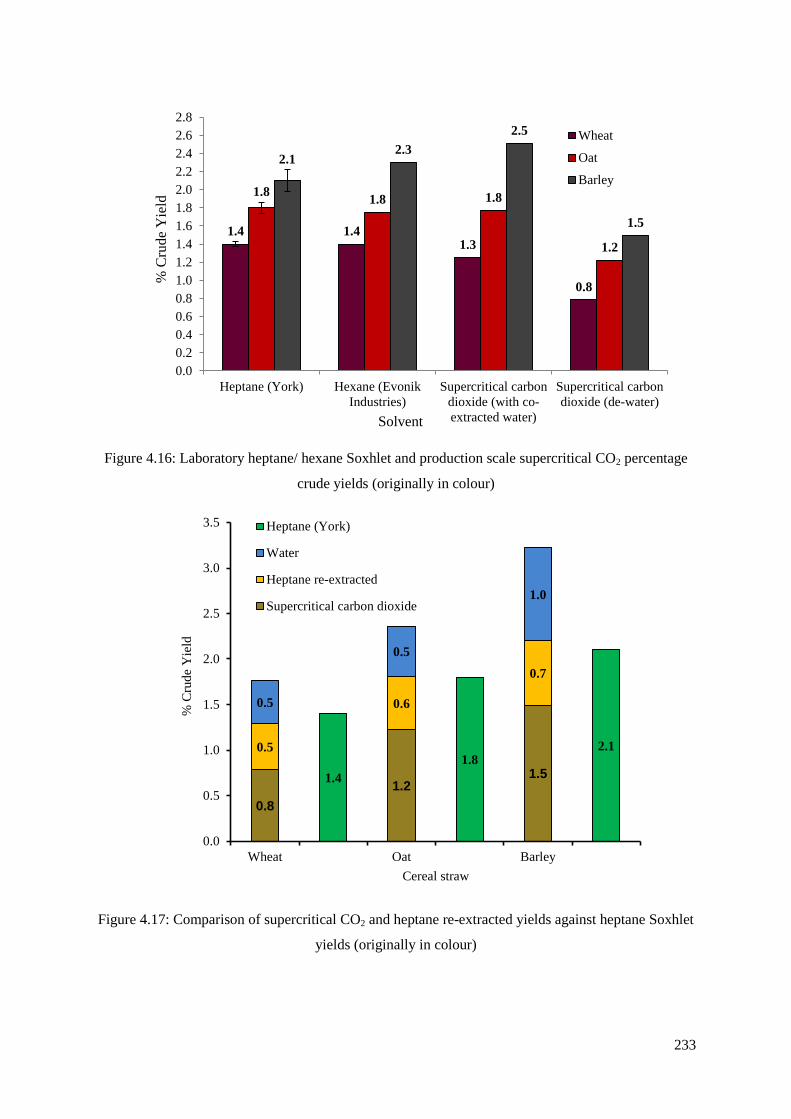
233
Figure 4.16: Laboratory heptane/ hexane Soxhlet and production scale supercritical CO2 percentage
crude yields (originally in colour)
Figure 4.17: Comparison of supercritical CO2 and heptane re-extracted yields against heptane Soxhlet
yields (originally in colour)
0.8
1.2 1.5
0.5
0.6
0.7
0.5
0.5
1.0
1.4
1.8 2.1
0.0
0.5
1.0
1.5
2.0
2.5
3.0
3.5
Wheat Oat Barley
% C
rud
e Y
ield
Cereal straw
Heptane (York)
Water
Heptane re-extracted
Supercritical carbon dioxide
1.4 1.4 1.3
0.8
1.8 1.8 1.8
1.2
2.1 2.3
2.5
1.5
0.0
0.2
0.4
0.6
0.8
1.0
1.2
1.4
1.6
1.8
2.0
2.2
2.4
2.6
2.8
Heptane (York) Hexane (Evonik
Industries)
Supercritical carbon
dioxide (with co-
extracted water)
Supercritical carbon
dioxide (de-water)
% C
rud
e Y
ield
Solvent
Wheat
Oat
Barley
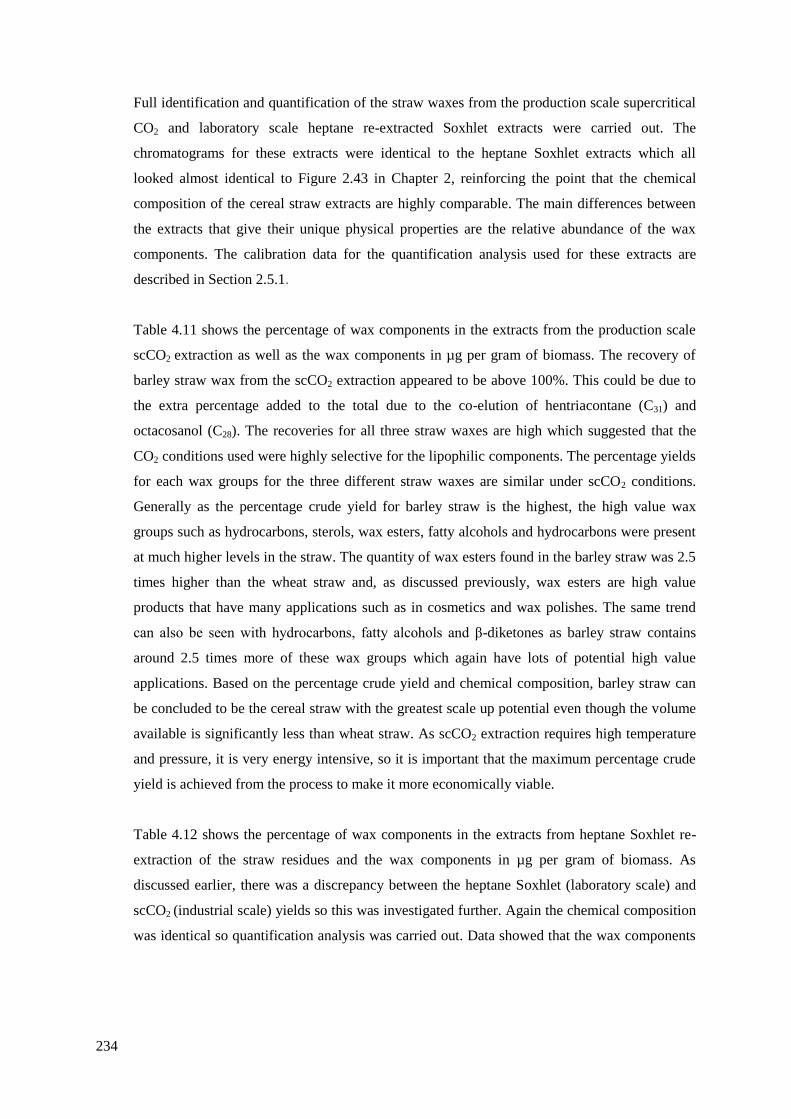
234
Full identification and quantification of the straw waxes from the production scale supercritical
CO2 and laboratory scale heptane re-extracted Soxhlet extracts were carried out. The
chromatograms for these extracts were identical to the heptane Soxhlet extracts which all
looked almost identical to Figure 2.43 in Chapter 2, reinforcing the point that the chemical
composition of the cereal straw extracts are highly comparable. The main differences between
the extracts that give their unique physical properties are the relative abundance of the wax
components. The calibration data for the quantification analysis used for these extracts are
described in Section 2.5.1.
Table 4.11 shows the percentage of wax components in the extracts from the production scale
scCO2 extraction as well as the wax components in µg per gram of biomass. The recovery of
barley straw wax from the scCO2 extraction appeared to be above 100%. This could be due to
the extra percentage added to the total due to the co-elution of hentriacontane (C31) and
octacosanol (C28). The recoveries for all three straw waxes are high which suggested that the
CO2 conditions used were highly selective for the lipophilic components. The percentage yields
for each wax groups for the three different straw waxes are similar under scCO2 conditions.
Generally as the percentage crude yield for barley straw is the highest, the high value wax
groups such as hydrocarbons, sterols, wax esters, fatty alcohols and hydrocarbons were present
at much higher levels in the straw. The quantity of wax esters found in the barley straw was 2.5
times higher than the wheat straw and, as discussed previously, wax esters are high value
products that have many applications such as in cosmetics and wax polishes. The same trend
can also be seen with hydrocarbons, fatty alcohols and β-diketones as barley straw contains
around 2.5 times more of these wax groups which again have lots of potential high value
applications. Based on the percentage crude yield and chemical composition, barley straw can
be concluded to be the cereal straw with the greatest scale up potential even though the volume
available is significantly less than wheat straw. As scCO2 extraction requires high temperature
and pressure, it is very energy intensive, so it is important that the maximum percentage crude
yield is achieved from the process to make it more economically viable.
Table 4.12 shows the percentage of wax components in the extracts from heptane Soxhlet re-
extraction of the straw residues and the wax components in µg per gram of biomass. As
discussed earlier, there was a discrepancy between the heptane Soxhlet (laboratory scale) and
scCO2 (industrial scale) yields so this was investigated further. Again the chemical composition
was identical so quantification analysis was carried out. Data showed that the wax components

235
remaining in the scCO2 extracted straw residues were very rich in fatty acids. In the straw
waxes, a range of 16% – 33% of the free fatty acids were not extracted with the scCO2
conditions applied. Some wax esters, sterols and β-diketones were also present in the heptane
re-extracted waxes showing that there is more potential to increase the percentage wax yield by
manipulating the scCO2 extraction conditions. Table 4.13 compares the wax components in µg
per gram of biomass of heptane Soxhlet (laboratory scale) and the combined values of scCO2
and heptane re-extracted Soxhlet. Small variation in wax composition can be due to random
sampling, different ratios of straw leaf and stalk has been shown that by Deswarte that wheat
straw leaf contains of higher wax content compared to stalk, therefore it may not be surprising
to see different wax profiles.16
Mazza compared the wax content of triticale straw extracted
from both supercritical CO2 and hexane and showed that the abundance of the main
compounds were different.90
It was suggested that this could be due to the intermolecular forces
between hexane and scCO2 being different. Hexane is a non-polar solvent so no hydrogen
bonding can be formed whereas in scCO2, polar and hydrogen bonding can occur. As
demonstrated in Chapter 3, the relative abundance of main wax compounds can vary depending
on scCO2 conditions so it is not surprising that there is not an exact match of heptane and
scCO2 compositional profile. The combined scCO2 and heptane yields were higher than heptane
and scCO2 yields alone which also suggested that the two solvents can form potentially
different solute-solvent interactions. Mazza extracted flax straw using a combination of both
hexane and scCO2 and the solvents individually and also showed that the combined percentage
hexane and scCO2 crude yields were highest.88
The β-diketones in the heptane Soxhlet extract
of wheat straw wax was almost three times less than the combined values for scCO2 and
heptane re-extracted in which at least 98% was extracted by scCO2. It is important to note that
the total identified wax compounds were higher than heptane extracts which showed that
despite the higher heptane yield, scCO2 is more selective in the extraction of waxes. Since there
was still a relatively high quantity of free fatty acids remaining in the straw residues as
discussed earlier, this shows another added benefit to using scCO2 as the solvent. The lower
level of free fatty acids means less downstream processing is required to reduce the fatty acid
contents of the products.

236
Table 4.11: Quantification of industrial scale scCO2 extraction of cereal straw waxes
Identification % in extract µgg
-1 of biomass
Wheat Oat Barley Wheat Oat Barley
Tetradecanoic acid (C14) 0.5 0.4 0.2 276 54 33
Hexadecanoic acid (C16) 3.5 5.8 4.7 110 713 699
Octadecadienoic acid (C18:2) 1.4 2.5 1.9 172 303 278
Octadecenoic acid (C18:1) 2.2 4.7 3.8 Tr 572 575
Octadecanoic acid (C18:0) 0.5 1.3 0.9 37 159 129
Total free fatty acids 8.1 6.0 11.5 634 731 1714
Heptacosane (C27) 0.7 1.0 1.2 58 118 183
Nonacosane (C29) 2.4 8.6 11.6 187 1053 1726
Hentriacontane (C31) 6.8a 4.6
a 6.6
a 531
a 562
a 981
a
Triatriacontane (C33) Tr 0.4 Tr Tr Tr Tr
Total hydrocarbons 9.9a 14.6
a 19.3
a 776
a 1783
a 2889
a
Octacosanol (C28) 8.9a 11.9
a 10.2
a 698
a 1454
a 1519
a
Total fatty alcohol 8.9a 11.9
a 10.2
a 698
a 1454
a 1519
a
Hexacosanal (C26) Tr 2.8 Tr Tr 343 Tr
Octacosanal (C28) 0.3 1.8 2.2 39 222 327
Total aldehydes 0.3 4.6 2.2 39 565 327
Tetracosanyl hexadecanoate (C24:C16) 0.6 Tr Tr 45 Tr Tr
Hexacosanyl hexadecanoate (C26:C16) 1.0 1.4 0.8 80 168 127
Octacosanyl hexdecanoate (C28:C16) 1.0 1.6 1.5 81 190 218
Octacosanyl octadecanoate (C28:C18) 0.7 4.0 3.8 53 488 560
Octacosanyl eicosanoate (C28:C20) 0.7 2.4 3.2 57 288 484
Octacosanyl dosanoate (C28:C22) 0.6 2.4 2.8 45 288 417
Octacosanyl tetracosanoate (C28:C24) 1.4 1.3 2.3 111 159 344
Octacosanyl hexacosanoate (C28:C26) 6.0 1.1 1.3 473 136 191
Octacosanyl octacosanoate (C28:C28) 0.7 0.4 1.3 58 55 188
Total wax esters 12.8 14.5 16.9 1003 1771 2530
Campesterol 2.4 2.5 3.0 184 310 455
Stigmasterol 2.4 1.6 2.1 187 191 320
β-sitosterol 6.3 4.4 5.8 490 532 873
Sterol 1 1.9 Tr 1.6 152 Tr 238
∆4-Sitosten-3-one 7.8 4.0 8.4 609 488 1252
Sterol 2 1.2 Tr 0.0 92 Tr Tr
Total sterols 21.9 12.5 21.0 1715 1521 3138
14,16 hentriacontanedione (C31) 16.0 10.9 21.2 1257 1337 3164
16,18 triatriacontanedione (C33) Tr 0.6 Tr Tr 79 Tr
Total β-diketones 16.0 11.6 21.2 1257 1416 3164
Total identified 67.5 75.7 102.3 5306 9240 15281 a = co-elution and values shown are the combined quantities, Tr = Trace levels < LOQ, LOQ shown in Section
2.5.1

237
Table 4.12: Quantification of laboratory scale re-heptane Soxhlet extraction of cereal straw waxes
Identification % in extract µgg
-1 of biomass
Wheat Oat Barley Wheat Oat Barley
Tetradecanoic acid (C14) 0.4 0.5 0.4 21 29 29
Hexadecanoic acid (C16) 2.8 3.0 2.4 145 174 170
Octadecadienoic acid (C18:2) 0.4 0.5 0.4 20 29 29
Octadecenoic acid (C18:1) 1.2 1.5 1.8 64 89 127
Octadecanoic acid (C18:0) 0.9 0.6 0.7 44 35 47
Total free fatty acids 5.7 6.1 5.7 295 356 401
Heptacosane (C27) 0.3 0.2 0.2 15 11 12
Nonacosane (C29) 0.1 0.4 0.3 7 26 23
Hentriacontane (C31) 0.4a 0.5 0.3
a 19
a 30 22
a
Triatriacontane (C33) Tr Tr Tr Tr Tr Tr
Total hydrocarbons 0.8a 1.1 0.8
a 40
a 67 58
a
Octacosanol (C28) 0.6a 0.7 0.4
a 23
a 38 29
a
Total fatty alcohol 0.6a 0.7 0.4
a 23
a 38 29
a
Hexacosanal (C26) Tr 0.1 Tr Tr 5 Tr
Octacosanal (C28) Tr 0.2 Tr Tr 12 Tr
Total aldehydes Tr 0.3 Tr Tr 16 Tr
Tetracosanyl hexadecanoate (C24:C16) 0.4 0.6 0.7 Tr Tr 48
Hexacosanyl hexadecanoate (C26:C16) 0.4 0.6 0.8 22 34 55
Octacosanyl hexdecanoate (C28:C16) 0.3 0.5 0.8 23 35 57
Octacosanyl octadecanoate (C28:C18) Tr 0.5 0.6 15 29 43
Octacosanyl eicosanoate (C28:C20) Tr 0.6 0.7 Tr 32 48
Octacosanyl dosanoate (C28:C22) Tr 0.6 0.4 Tr 35 31
Octacosanyl tetracosanoate (C28:C24) Tr Tr Tr Tr 33 Tr
Total wax esters 1.2 3.4 4.0 60 197 281
Campesterol 0.6 0.5 0.4 31 30 30
Stigmasterol 0.5 0.5 0.4 25 29 29
β-sitosterol 1.5 2.0 1.4 79 118 102
Sterol 1 0.3 0.2 0.3 17 13 21
∆4-Sitosten-3-one 0.5 0.3 0.3 25 16 21
Total sterols 3.5 3.5 2.8 178 206 202
14,16 hentriacontanedione (C31) 0.5 1.4 1.6 23 81 141
Total β-diketones 0.5 1.4 1.6 23 81 141
Total identified 12.2 16.4 15.3 619 962 1112 a = co-elution and values shown are the combined quantities, Tr = Trace levels < LOQ, LOQ shown in Section
2.5.1

23
8
Table 4.13: Comparison of the chemical compositions from heptane Soxhlet, supercritical CO2 and heptane re-extracted wax extracts
Identification Heptane Soxhlet (n ≥ 2) Supercritical CO2 Heptane re-extracted
sxCO2 and heptane re-
extracted
µgg-1
of biomass µgg-1
of biomass µgg-1
of biomass µgg-1
of biomass
Wheat Oat Barley Wheat Oat Barley Wheat Oat Barley Wheat Oat Barley
Tetradecanoic acid (C14) 66 ± 2.6 126 ± 3.6 184 ± 4.1 276 54 33 21 29 29 298 83 62
Hexadecanoic acid (C16) 224 ±
1.4 974 ± 21.6 922 ± 14.7 110 713 699 145 174 170 255 887 869
Octadecadienoic acid (C18:2) 161 ±
4.4 301 ± 1.8 40 ± 1.1 172 303 278 20 29 29 192 332 307
Octadecenoic acid (C18:1) 403 ±
11.1 639 ± 5.8 274 ± 6.8 Tr 572 575 64 89 127 64 661 701
Octadecanoic acid (C18:0) 87 ± 1.5 154 ± 6.8 139 ± 4.6 37 159 129 44 35 47 81 194 176
Total free fatty acids 942 ±
21.1
2195 ±
19.8 1559 ± 31.6 595 1802 1714 295 356 401 890 2157 2115
Heptacosane (C27) 78 ± 5.2 100 ± 3.3 136 ± 5.3 58 118 183 15 11 12 73 129 195
Nonsacosane (C29) 232 ±
1.4 1057 ± 6.3 840 ± 8.9 187 1053 1726 7 26 23 194 1079 1749
Hentriacontane (C31) 593 ±
190 355 ± 1.8 502 ± 6.7 531
a 562
a 981
a 19
a 30 22
a 550
a 591
a 1003
a
Triatriacontane (C33) 90 ± 1.7 92 ± 1.8 127 ± 5.1 Tr Tr Tr Tr Tr Tr Tr Tr Tr
Total hydrocarbons 994 ±
27.1
1605 ±
32.5 1605 ± 23.5 776
a
1783a
2889a 40
a 67 58
a 816
a 1849
a 2947
a
Octacosanol (C28) 287 ±
17.2 440 ± 12.8 428 ± 8.8 698
a
1454a
1519a 23
a 38 29
a 722
a 1492
a 1547
a
Total fatty alcohol 287 ±
17.2 440 ± 12.8 428 ± 8.8 698
a
1454a
1519a 23
a 38 29
a 722
a 1492
a 1547
a
Hexacosanal (C26) 29 ± 1.6 240 ± 10 109 ± 6.5 Tr 343 Tr Tr 5 Tr Tr 348 Tr

239
Table 4.13 (continued)
Octacosanal (C28) 191 ±
4.4 162 ± 162 148 ± 8.7 39 222 327 Tr 12 Tr 39 234 327
Total aldehydes 219 ± 6 401 ± 12.2 257 ± 15.2 39 565 327 Tr 16 Tr 39 582 327
Tetracosanyl hexadecanoate
(C24:C16) 64 ± 3 110 ± 1.8 151 ± 2.7 45 Tr Tr Tr Tr 48 45 Tr 48
Hexacosanyl hexadecanoate
(C26:C16)
184 ±
7.1 250 ± 5.4 309 ± 8.9 80 168 127 22 34 55 102 202 182
Octacosanyl hexdecanoate
(C28:C16)
224 ±
4.8 338 ± 6.2 423 ± 23.3 81 190 218 23 35 57 104 224 276
Octacosanyl octadecanoate
(C28:C18)
194 ±
3.2 230 ± 2.2 366 ± 6.9 53 488 560 15 29 43 68 517 603
Octacosanyl eicosanoate
(C28:C20) 165 ± 245 ± 4.2 297 ± 19.5 57 288 484 Tr 32 48 57 319 532
Octacosanyl dosanoate (C28:C22) 287 ± 195 ± 2.4 234 ± 4.5 45 288 417 Tr 35 31 45 324 448
Octacosanyl tetracosanoate
(C28:C24) Tr 161 ± 4.1 102 ± 0.9 111 159 344 Tr 33 Tr 111 192 344
Octacosanyl hexacosanoate
(C28:C26) Tr 99 ± 0.5 Tr 473 136 191 Tr Tr Tr 473 136 191
Octacosanyl octacosanoate
(C28:C28) Tr 153 ± 6.5 Tr 58 55 188 Tr Tr Tr 58 55 188
Total wax esters 1247 ± 1781 ±
27.3 1883 ± 66.7 1003 1771 2530 60 197 281 1063 1968 2812
Campesterol 142 ± 164 ± 4.3 233 ± 2.8 184 310 455 31 30 30 215 340 485
Stigmasterol 133 ± 119 ± 5.8 205 ± 7 187 191 320 25 29 29 212 220 348
β-sitosterol 416 ± 388 ± 2.1 477 ± 19.5 490 532 873 79 118 102 569 650 975
Sterol 1 192 ± 113 ± 2.4 181 ± 4.5 152 Tr 238 17 13 21 168 Tr 259
∆4-Sitosten-3-one 137 ± 163 ± 4.3 428 ± 6.6 609 488 1252 25 16 21 635 503 1272
Sterol 2 120 ± Tr Tr 92 Tr Tr Tr Tr Tr 270 Tr Tr

24
0
Table 4.13 (continued)
Total sterols 1140 ± 947 ± 18.9 1525 ± 40.4 1715 1521 3138 178 206 202 1738 1602 3278
14,16 hentriacontanedione (C31) 459 ± 1047 ±
52.4 3005 ± 66 1257 1337 3164 23 81 141 1281 1418 3305
16,18 triatriacontanedione (C33) Tr Tr Tr Tr Tr Tr Tr 79 Tr Tr 79 Tr
Total β-diketones 459 ± 1047 ±
52.4 3005 ± 66 1257 1337 3164 23 161 141 1280 1498 3305
Total identified 5287 ± 8415 ±
175.9
10262 ±
243.4 6083
1023
2 15281 619
102
5 1112 6564 10657 16004
a = co-elution and values shown are the combined quantities, Tr = Trace levels < LOQ, LOQ shown in Section 2.5.1
241
4.4 Conclusion and future work
Previously, it was demonstrated that renewable and valuable waxes can be extracted using
scCO2 successfully and was chosen as a greener alternative for the extraction of straw waxes.
Wheat straw wax had been shown to a provide valuable wax product but as there are a vast
amount of waste straw worldwide, it was important to explore other potential biomass. A
total of seven different straws were chosen for the biomass screen and the aim was to select
three of the straws for further scale up. The epicuticular wax of wheat, barley, oat, oilseed
rape, sunflower, miscanthus and bagasse were investigated. From the organic solvent study
discussed in Chapter 2, hexane and ethanol Soxhlet extractions were selected to use as a
quick screening method for the percentage crude yield and chemical composition. Due to the
similarities in the chemical composition profiles, quantitative analysis was required in order
to give a deeper insight into the epicuticular waxes of each biomass. It can be noted that as
with all natural products, many natural variations will play a role such as seasonal variation
therefore it was not necessary to identify all the wax compounds as it is most likely that the
different batches of straw would result in a range of wax products. The aim of the screen
was only to give an insight into the various waxes of the potential biomass. By considering
different aspects such as biomass availability, percentage crude yield and chemical
composition, wheat, barley and oat were selected for the scCO2 scale up trials as laboratory
scale work showed promising valuable wax products which can be used in many different
markets.
Following successful laboratory study on the three selected cereal straws, the process was
scaled up in collaboration with Sundown Products Limited and Evonik Industries. A total of
three tonnes of wheat, barley and oat straw wax were extracted using scCO2 in an industrial
scale plant. Process conditions (temperature and pressure) requested were the optimised
conditions investigated in Chapter 3 which were 323 K and 35 MPa. However, due to the
limitations of the scCO2 equipment at Evonik Industries, the extraction pressure was
dropped to 28 MPa. The extraction temperature was between 333 K – 343K which was also
higher than optimised conditions which means the CO2 density was lower than expected.
The extraction process was very successful except that blockage at the separator occurred
due to the high melting point of the waxes. Oilseed rape oil was used as a carrier oil to
lubricant the pipe work in order to retrieve the wax. Originally the temperature of the
seprator was set at 323 K but from the blockages, it was apparent that the temperature is
required to be higher than at laboratory scale so the latter extractions were carried using a

242
higher sepator temperature of 343 K. The percentage crude yields were lower than expected
from the laboratory scale work but this was mainly due to the decrease in CO2 density during
the extraction process. For this reason, the straw residues were re-extracted using heptane. It
was concluded that there was still a considerable amount of wax remaining in the straw
residues so therefore it is important to increase the CO2 density to maximise the extraction
yield. Qualitative analysis was carried out on the straw waxes (both biomass screen and
production scale trials) which found that the wax compounds were highly similar so
therefore quantitative analysis was carried out so that extracts can be compared. A mixture
of fatty acids, n-alkanes, sterols, fatty alcohols, wax esters, aldehydes and β-diketones were
identified as straw wax extracts. As this is a complex mixture, the system could behave
differently as the properties of the CO2 are prone to changes as an increasing amount of wax
compounds are dissolved into the supercritical fluid. The laboratory scale work
demonstrated that small scale extraction can successfully predict the yield and chemical
compoistion of scale up trials on larger scCO2 extraction plants. The optimisation of scCO2
conditions proved to be useful when selecting extraction conditions for the production scale
trials but more work may be required for an optimised flow rate. Overall, the production
scale up trials of straw waxes were successful and post-processing steps on the 60 kg of wax
products are discussed in Chapter 5.

Chapter 5 Straw wax processing, physical properties
and economic considerations
Oral presentation given at 1st
NORthern Sustainable Chemistry meeting (NORSC), York,
UK, October 2010
Poster winner at Plants as Providers as Fine Chemicals, Bangor, Wales, September 2011


245
5. STRAW WAX PROCESSING, PHYSICAL
PROPERTIES AND ECONOMIC CONSIDERATIONS
5.1 Introduction
Wax extracts from the scCO2 production scale extraction were firstly processed to remove
the co-extracted water from the biomass. Fractionation by CO2 and GPC and saponification
were explored to create fractions containing different chemical compositions to aid future
wax blending and formulations. The benefit of using CO2 as a fractionation technique is that
it can be incorporated with the scCO2 extraction to make a one step process. Physical
properties such as melting point are paramount for potential applications. Wet analytical
methods such as acid value gives a greater understanding on the possible potential for
commercialisation and apply to relevant products formulations. The chemical compositional
profiles of the wax extracts are matched with the resulting physical properties to enable the
tuning of properties by fractionation or chemical modification of the straw waxes.
In Chapter 4, the extraction of scCO2 extraction was successfully carried out in production
scale. The main advantage of using scCO2 as the extraction solvent is its low environmental
impact however, as the extraction of waxes requires high pressure it is an expensive
technology which can raise many concerns industrially. For this reason, an economic
assessment was carried out for the extraction of wax from cereal straw as part of the
consideration of using scCO2 extraction in future.
5.2 Straw wax processing
5.2.1 Co-extraction of water
Air-dried pelletised cereal straw contains residual water of less than 10% which is
frequently co-extracted with the wax components under scCO2 conditions as
illustrated in Figure 5.1. The moisture content was calculated using Equation 6.1 and
the moisture level before and after the extraction are shown in Table 5.1.

246
Table 5.1: Percentage moisture level of biomass before and after extraction
Cereal % Moisture level
Before extraction After extraction
Wheat 9.9 4.2
Oat 9.5 3.8
Barley 7.9 3.3
Figure 5.1: Co-extraction of water in industrial scale supercritical CO2 extraction (originally
in colour)
When CO2 is applied to the biomass that contains water, there is a tendency for the
CO2 to form carbonic acid which can alter the solubility of different molecules in CO2
by acting as a “co-solvent”. In the laboratory trial, this is not so important as the
quantity of water is not high enough to change the behaviour. However, this is
especially crucial in terms of production scale extraction, as the presence of water can
act as a modifier during the extraction process which can manipulate the polarity of
the solvent and lead to a higher recovery of polar molecules.
Pilot scale extraction of rice bran oil also demonstrated the problems with the co-
extraction of water from the biomass and centrifugation was adopted as a means to
remove the water.295
The problems of co-extraction of water only become apparent
and problematic in scale ups when large quantities of water accumulated in the
separator.295
Evelein et al. studied the solubility of pure water in CO2 and showed that
scCO2 extraction
Cereal straw pellets with
7.9% - 9.9% of water
Cereal straw residues with
3.3% - 4.2% of water
Straw waxes with 29% -
40% of water

247
at 323 K and pressure from 20 – 60 MPa, the solubility of water in CO2 is about
0.3%.296
The interesting point to note from the study is that the solubility is almost
independent of pressure when it is above 20 MPa.296
This suggest that water is almost
completely soluble with scCO2 conditions of 323 K and 20 MPa.
The water from the wax extracts was separated manually by melting the waxes using
the procedure described in Section 6.2.5 but, it would be advantageous if an additional
separator is added to separate the water from the wax extract. Figure 5.2 shows the
molten wax being separated from the coloured co-extracted water. All three co-
extracted waters were coloured. Wheat and barley water were both light yellow and
interestingly oat water was light pink as shown in Figure 5.3. The water retrieved
from the DCM and aqueous liquid-liquid extractions with the solvent extracted wheat
straw extracts discussed in Chapter 2 were also light yellow in colour. Any water
soluble compounds in the cereal straw can be co-extracted with the water present in
the biomass and this could include any pigments, phenolics, resin acids and
flavonoids that occur in the plants. Carotenoids such as xanthophylls and flavonoids
such as anthrocyanins known to produce colours have been identified in cereal crops
previously.297, 298
The co-extracted water can be utilised by identifying any valuable
water soluble compounds. This would not only provide cleaner waste water but also
adds value to a potentially large waste stream. It would be interesting to identify and
quantify any commercially valuable compounds as it can also improve the economics
of the overall process. Figure 5.4 shows the overall percentage of co-extracted water
with the individual straw wax. Barley straw wax was the wettest as it contained
double the quantities of co-extracted water compared to the wheat and oat straw
waxes.
Figure 5.2: Co-extracted water separated from molten wheat straw wax (originally in
colour)
Molten wax
Coloured co-extracted
water

248
Figure 5.3: Coloured co-extracted water from cereal straw waxes (originally in
colour)
Figure 5.4: Percentage of co-extracted water within the cereal straw waxes
(originally in colour)
5.2.2 Fractionation by supercritical carbon dioxide
From the qualitative and quantitative analysis of the three cereal straw waxes from the
large scale trials, wheat and barley straw waxes showed similar compositional
profiles. Wheat and oat straw waxes were selected to demonstrate that scCO2 can be
used to successfully fractionate as well as extract these renewable and valuable waxes.
The use of scCO2 to extract wheat straw waxes has been reported by Deswarte but this
is the first time that straw waxes have been fractionated using scCO2.18
Reverchon et
al. successfully conducted extraction and fractionation of lavender oil and waxes
0.8
1.2 1.5
0.5
0.5
1.0
0.0
0.2
0.4
0.6
0.8
1.0
1.2
1.4
1.6
1.8
2.0
2.2
2.4
2.6
Wheat Oat Barley
% C
rud
e Y
ield
Cereal straw
Water
Wax
Wheat Barley Oat

249
using CO2 where a high alkane fraction of the wax was separated. The wheat and oat
straw waxes from the large scale trials were loaded onto glass beads and fractionated
using a laboratory scale CO2 extractor as described in Section 6.2.6. As there were
only two separators, the conditions chosen for each of the separators were distinctly
different. The extractor was set at 323 K and 35 MPa which is higher than the
industrial extraction conditions in order to ensure that all the wax compounds are
highly soluble at the specific temperature and pressure for fractionation efficiency.
Separator 1 was set at 305 K and 7.5 MPa which is just above the critical point of CO2
so that any wax compounds that are insoluble at the critical point of CO2 would
precipitate and remain in the separator. The second separator was at atmospheric
pressure so that all the remaining wax compounds not precipitated in separator 1 could
be captured. Figure 5.5 shows that the fractionated waxes were very different in
colour, the waxes removed from separator 1 was darker in colour compared to the
fraction retrieved from separator 2. The fractions separated at the critical point of CO2
are also appeared harder than the fractions recovered at atmospheric pressure.
Figure 5.5: Wheat and oat wax fractions separated from scCO2 fractionation (originally in
colour)
250
Table 5.2 shows the percentage of waxes present in the extractor and the two
separators after four hours of fractionation. Wheat straw wax was fractionated first
and about 60 g of crude wheat straw wax was loaded into the 500 mL extractor and
fractionated for four hours and as shown in Figure 5.6, about 34% of the wax still
remained in the extractor which suggested that the quantities of wax loaded was too
large. For this reason, the second fractionation with oat straw wax was reduced to
about 50 g and also fractionated over a period of four hours and it was found that the
fractionation was almost completed with only 4% of the crude wax remaining in the
extractor. Fraction 1 for both of the waxes was the biggest which suggested almost
80% of the crude oat straw wax ended up in separator 1. This is expected as the
temperature and pressure change in separator 1 results in the CO2 density being
reduced dramatically therefore many of the molecules will only be partially soluble or
insoluble at the critical point and precipitate from the supercritical fluid. The
fractionation can be improved by increasing the number of separators so that more
different scCO2 conditions can be incorporated into the fractionation process. By
taking the advantage of the different solubilities of different wax compounds at
various temperatures and pressures, a series of fractions of different composition can
be achieved. The fractionation time and flow rate must also be optimised for any
further scale up. The aim of this study was to demonstrate that the straw waxes can be
extracted and fractionated in a single step process successfully. In a real extraction
model, the extractor would be filled with biomass rather than the wax product but for
the purpose of this demonstration, waxes were loaded into the extractor coated onto
glass beads.
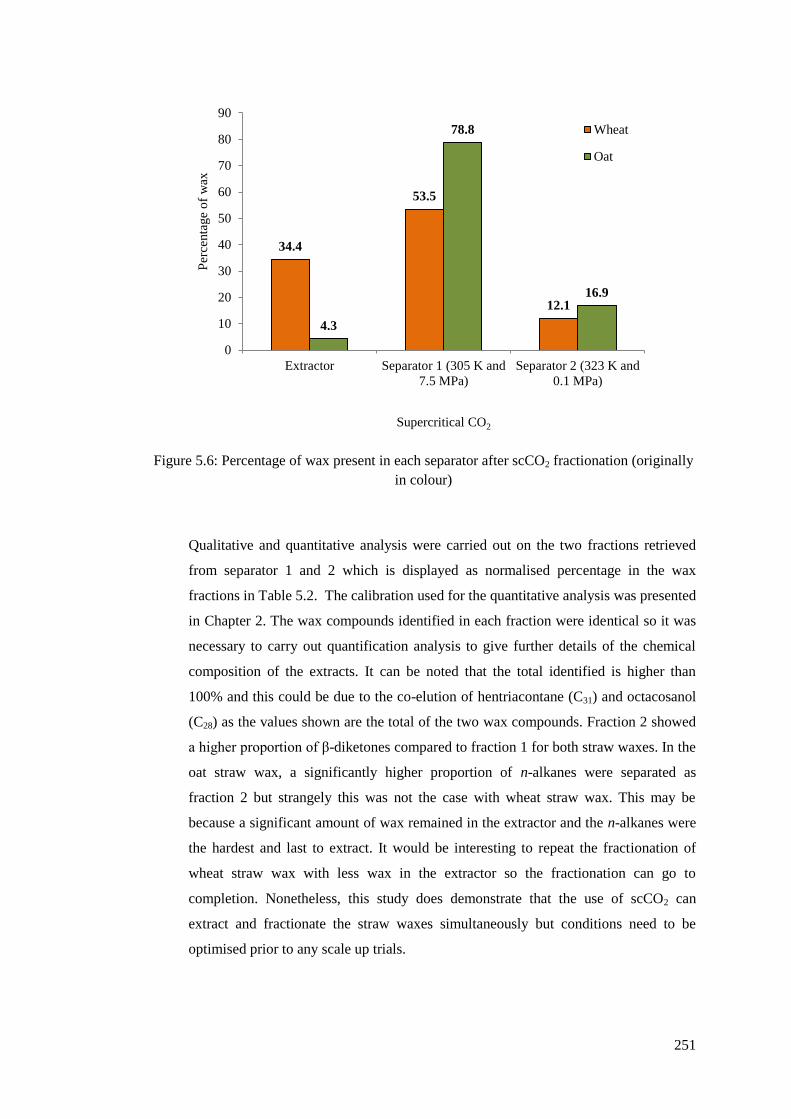
251
Figure 5.6: Percentage of wax present in each separator after scCO2 fractionation (originally
in colour)
Qualitative and quantitative analysis were carried out on the two fractions retrieved
from separator 1 and 2 which is displayed as normalised percentage in the wax
fractions in Table 5.2. The calibration used for the quantitative analysis was presented
in Chapter 2. The wax compounds identified in each fraction were identical so it was
necessary to carry out quantification analysis to give further details of the chemical
composition of the extracts. It can be noted that the total identified is higher than
100% and this could be due to the co-elution of hentriacontane (C31) and octacosanol
(C28) as the values shown are the total of the two wax compounds. Fraction 2 showed
a higher proportion of β-diketones compared to fraction 1 for both straw waxes. In the
oat straw wax, a significantly higher proportion of n-alkanes were separated as
fraction 2 but strangely this was not the case with wheat straw wax. This may be
because a significant amount of wax remained in the extractor and the n-alkanes were
the hardest and last to extract. It would be interesting to repeat the fractionation of
wheat straw wax with less wax in the extractor so the fractionation can go to
completion. Nonetheless, this study does demonstrate that the use of scCO2 can
extract and fractionate the straw waxes simultaneously but conditions need to be
optimised prior to any scale up trials.
34.4
53.5
12.1
4.3
78.8
16.9
0
10
20
30
40
50
60
70
80
90
Extractor Separator 1 (305 K and
7.5 MPa)
Separator 2 (323 K and
0.1 MPa)
Per
centa
ge
of
wax
Supercritical CO2
Wheat
Oat

252
Table 5.2: Identification and quantification of wheat and oat straw fractions from scCO2
fractionation
Identification
% in extract
Wheat
fraction 1
Wheat
fraction 2
Oat
fraction 1
Oat
fraction 2
Tetradecanoic acid (C14) 0.2 2.1 0.3 2.8
Hexadecanoic acid (C16) 5.2 8.4 5.5 11.5
Octadecadienoic acid (C18:2) 2.2 3.1 2.5 4.4
Octadecenoic acid (C18:1) 4.5 5.9 4.7 7.6
Octadecanoic acid (C18:0) 1.0 1.4 1.2 0.4
Total free fatty acids 13.0 7.3 14.1 26.7
Heptacosane (C27) 1.2 0.5 0.9 1.7
Nonsacosane (C29) 11.4 2.6 2.1 13.2
Hentriacontane (C31) 12.5a 0.9
a 9.8
a 6.5
a
Triatriacontane (C33) 0.5 Tr Tr Tr
Total hydrocarbons 25.6a 4.0
a 12.8
a 21.4
a
Octacosanol (C28) 6.8a 8.3
a 12.6
a 8.4
a
Total fatty alcohol 6.8a 8.3
a 12.6
a 8.4
a
Hexacosanal (C26) 0.5 1.3 1.8 2.6
Octacosanal (C28) 0.6 0.9 1.0 0.9
Total aldehydes 1.1 2.2 2.8 3.4
Tetracosanyl hexadecanoate (C24:C16) Tr Tr Tr 0.4
Hexacosanyl hexadecanoate (C26:C16) 2.1 0.7 1.0 0.9
Octacosanyl hexdecanoate (C28:C16) 2.4 1.4 1.8 1.0
Octacosanyl octadecanoate (C28:C18) 3.9 1.6 5.4 1.3
Octacosanyl eicosanoate (C28:C20) 6.3 0.8 2.8 0.4
Octacosanyl dosanoate (C28:C22) 4.3 0.2 1.9 Tr
Octacosanyl tetracosanoate (C28:C24) 1.9 0.2 0.5 Tr
Octacosanyl hexacosanoate (C28:C26) 0.9 Tr Tr Tr
Octacosanyl octacosanoate (C28:C28) Tr Tr Tr Tr
Total wax esters 21.8 13.5 13.5 4.1
Campesterol 3.1 2.7 2.1 2.0
Stigmasterol 3.0 2.8 1.8 2.2
β-sitosterol 7.9 6.7 5.0 5.5
Sterol 1 2.1 2.3 1.4 1.7
∆4-Sitosten-3-one 12.2 10.5 5.0 5.2
Sterol 2 Tr Tr Tr Tr
Total sterols 28.2 25.1 15.3 16.7
14,16 hentriacontanedione (C31) 26.4 40.9 7.6 17.9
16,18 triatriacontanedione (C33) 0.4 0.6 0.6 1.2
Total β-diketones 26.8 41.5 8.1 19.1
Total identified
123.3
101.8
79.3
99.8 a = co-elution and values shown are the combined quantities, Tr = Trace levels < LOQ, LOQ shown in
Section 2.5.1
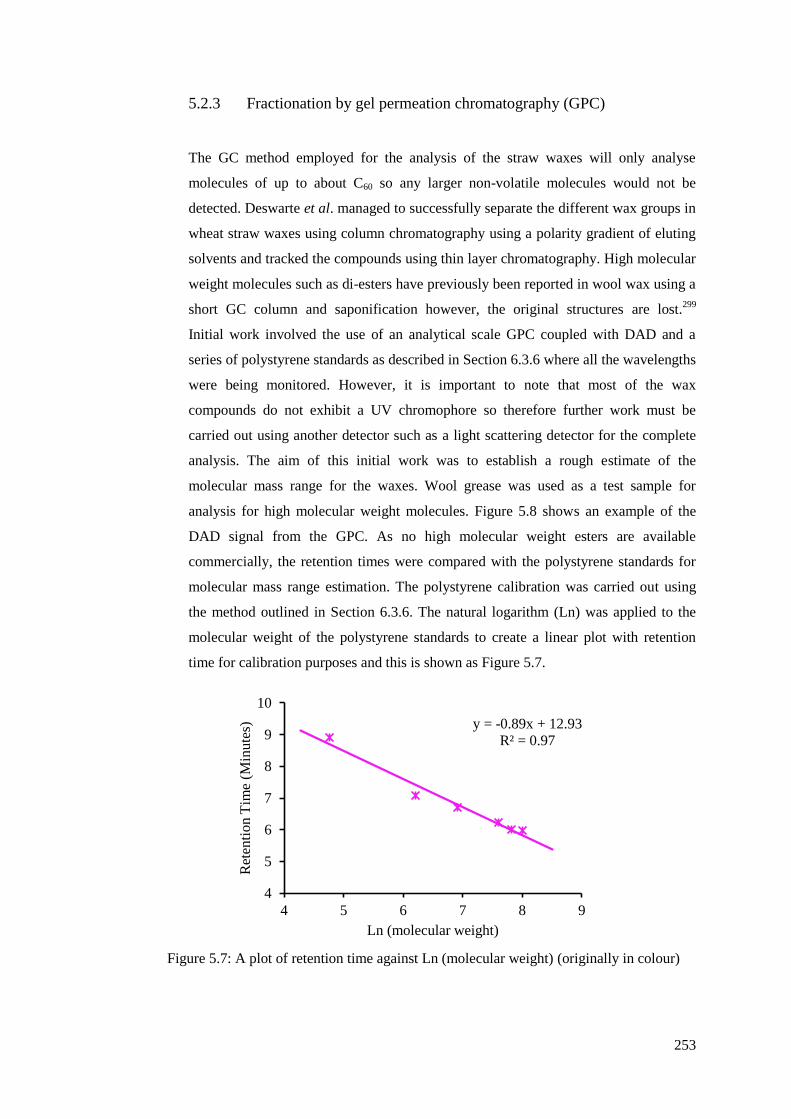
253
5.2.3 Fractionation by gel permeation chromatography (GPC)
The GC method employed for the analysis of the straw waxes will only analyse
molecules of up to about C60 so any larger non-volatile molecules would not be
detected. Deswarte et al. managed to successfully separate the different wax groups in
wheat straw waxes using column chromatography using a polarity gradient of eluting
solvents and tracked the compounds using thin layer chromatography. High molecular
weight molecules such as di-esters have previously been reported in wool wax using a
short GC column and saponification however, the original structures are lost.299
Initial work involved the use of an analytical scale GPC coupled with DAD and a
series of polystyrene standards as described in Section 6.3.6 where all the wavelengths
were being monitored. However, it is important to note that most of the wax
compounds do not exhibit a UV chromophore so therefore further work must be
carried out using another detector such as a light scattering detector for the complete
analysis. The aim of this initial work was to establish a rough estimate of the
molecular mass range for the waxes. Wool grease was used as a test sample for
analysis for high molecular weight molecules. Figure 5.8 shows an example of the
DAD signal from the GPC. As no high molecular weight esters are available
commercially, the retention times were compared with the polystyrene standards for
molecular mass range estimation. The polystyrene calibration was carried out using
the method outlined in Section 6.3.6. The natural logarithm (Ln) was applied to the
molecular weight of the polystyrene standards to create a linear plot with retention
time for calibration purposes and this is shown as Figure 5.7.
Figure 5.7: A plot of retention time against Ln (molecular weight) (originally in colour)
y = -0.89x + 12.93
R² = 0.97
4
5
6
7
8
9
10
4 5 6 7 8 9
Ret
enti
on
Tim
e (M
inute
s)
Ln (molecular weight)
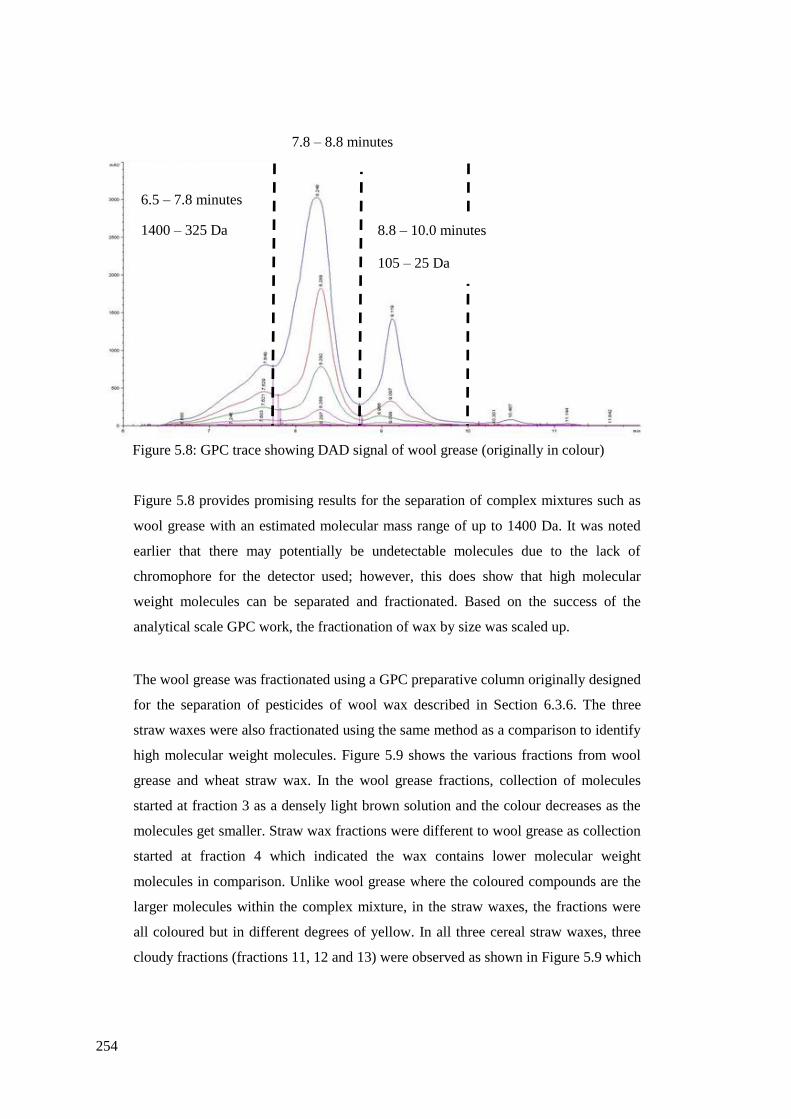
254
Figure 5.8: GPC trace showing DAD signal of wool grease (originally in colour)
Figure 5.8 provides promising results for the separation of complex mixtures such as
wool grease with an estimated molecular mass range of up to 1400 Da. It was noted
earlier that there may potentially be undetectable molecules due to the lack of
chromophore for the detector used; however, this does show that high molecular
weight molecules can be separated and fractionated. Based on the success of the
analytical scale GPC work, the fractionation of wax by size was scaled up.
The wool grease was fractionated using a GPC preparative column originally designed
for the separation of pesticides of wool wax described in Section 6.3.6. The three
straw waxes were also fractionated using the same method as a comparison to identify
high molecular weight molecules. Figure 5.9 shows the various fractions from wool
grease and wheat straw wax. In the wool grease fractions, collection of molecules
started at fraction 3 as a densely light brown solution and the colour decreases as the
molecules get smaller. Straw wax fractions were different to wool grease as collection
started at fraction 4 which indicated the wax contains lower molecular weight
molecules in comparison. Unlike wool grease where the coloured compounds are the
larger molecules within the complex mixture, in the straw waxes, the fractions were
all coloured but in different degrees of yellow. In all three cereal straw waxes, three
cloudy fractions (fractions 11, 12 and 13) were observed as shown in Figure 5.9 which
6.5 – 7.8 minutes
1400 – 325 Da
7.8 – 8.8 minutes
325 – 105 Da
8.8 – 10.0 minutes
105 – 25 Da
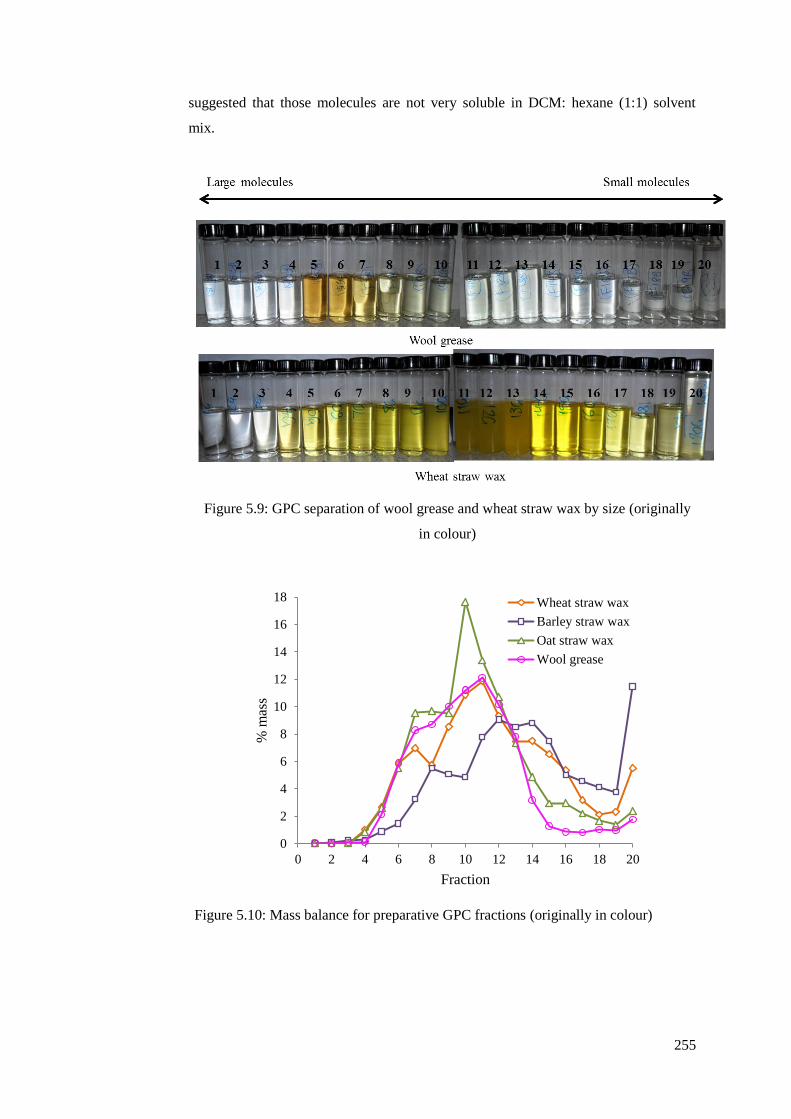
255
suggested that those molecules are not very soluble in DCM: hexane (1:1) solvent
mix.
Figure 5.9: GPC separation of wool grease and wheat straw wax by size (originally
in colour)
Figure 5.10: Mass balance for preparative GPC fractions (originally in colour)
0
2
4
6
8
10
12
14
16
18
0 2 4 6 8 10 12 14 16 18 20
% m
ass
Fraction
Wheat straw wax
Barley straw wax
Oat straw wax
Wool grease
256
It can be concluded that the fractionation of waxes was very successful as the
recovery for all the waxes was over 95%. Figure 5.10 shows the mass balance for the
various fractions of all four samples. It would be interesting to take all the fractions
and carry out further compositional analysis but the aim of this fractionation using
GPC is to separate any potential high molecular weight molecules for further analysis.
In this case, wheat and oat straw waxes showed the highest amount of high molecular
weight compounds as shown in figure 5.10. It can be observed that both of these
waxes have similar mass balance curves compared to wool grease suggesting that
there may possibly be di-esters in the waxes which would not have been seen by the
standard GC method. For this reason, all the wheat and oat straw wax fractions were
scanned using IR spectroscopy which is a quick technique to identify any high esters
containing fractions. All the IR spectra for the two straw waxes are comparable and
almost indistinguishable. Figure 5.11 shows the IR spectra for selected fractions in
order to identify the main functional groups in the fractions.
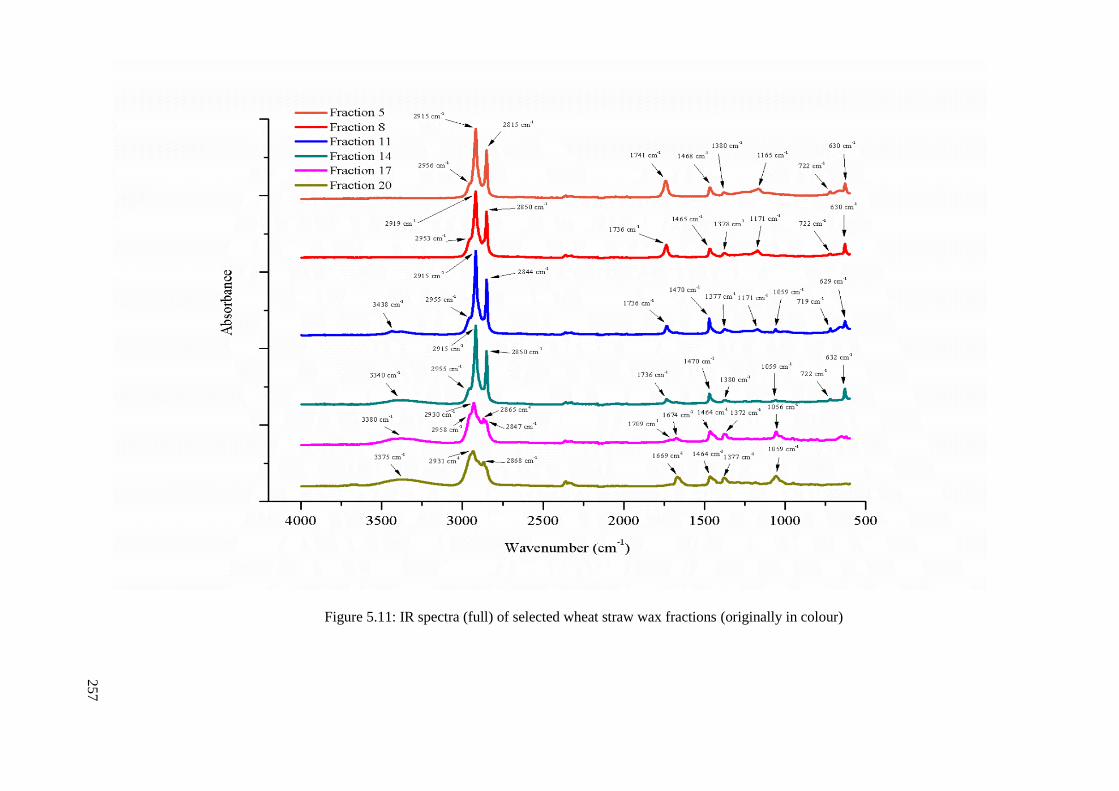
25
7
Figure 5.11: IR spectra (full) of selected wheat straw wax fractions (originally in colour)
258
The intense narrow peaks at around 2915 cm-1
and 2850 cm-1
can be assigned to the
anti-symmetric and symmetric stretching bands of CH2 respectively.300
There is also a
higher frequency shoulder at 2955 cm-1
which is due to the stretching of CH3
groups.300
These groups are highlighted due to the large number of molecules
containing long aliphatic carbon chains within the complex mixture. However, as the
molecular weight of the fractions changes, the intensity of these CH2 and CH3
stretches also changes and probably due to the reduced aliphatic carbon chains to
other functional groups ratio. There is also a peak within the region of 1470 – 1430
cm-1
which represented CH2 and CH3 bends.300
The peak at around 1378 cm-1
could be
due to the C-H bend adjacent to a carbonyl group and the weak peak at 733 cm-1
is
also due to CH2 present in the aliphatic carbon chains.301
There are peaks around
1160cm-1
and 1059 cm-1
which could be due to the C-O stretch from any phenolic and
sugar molecules extracted.302, 303
It is important to note that these bands are apparent in
all the fractions. From fraction 11 and higher, a broad peak at around 3380 cm-1
started to appear which represents the presence of OH groups which are commonly
found in the regions of 3100 – 3500 cm-1
.301, 304
This could indicate the presence of
fatty alcohol, sterols and fatty acids. In order to check for presence of fatty acids in the
fraction, the carbonyl stretch must be presented. Figure 5.12 shows the IR spectra
which highlights the carbonyl region as from the qualitative analysis, it was apparent
that there are many compounds that contain the carbonyl group (esters, aldehydes,
ketones, di-ketones and fatty acids). This region is particularly important as it helps to
identify not only the high fatty acid fractions but also the high esters fractions.
As shown in Figure 5.12, the carbonyl stretch shifts to a lower frequency as
fractionation proceeded i.e.: from large to small molecules. The carbonyl stretch at
around 1740 cm-1
in fractions 5 and 8 could arise from both ester and aldehyde but it
is more likely that these are ester carbonyl stretch bands due to the high molecular
weight.305
In fractions 11 and 14, the carbonyl stretch occurs at much lower frequency
of 1734 cm-1
which suggests the presence of aldehydes.304
There is also a weak
shoulder around 1720 cm-1
which indicates the presence of ketones and carboxylic
acids.306
In fractions 14, 17 and 20, there is also a broad weak OH stretch as well as
carboxylic acids stretch that showed a high probability of fatty acids. Peaks at the
lower frequency of 1675 cm-1
could be due to 1,3-diketones which have shown to be
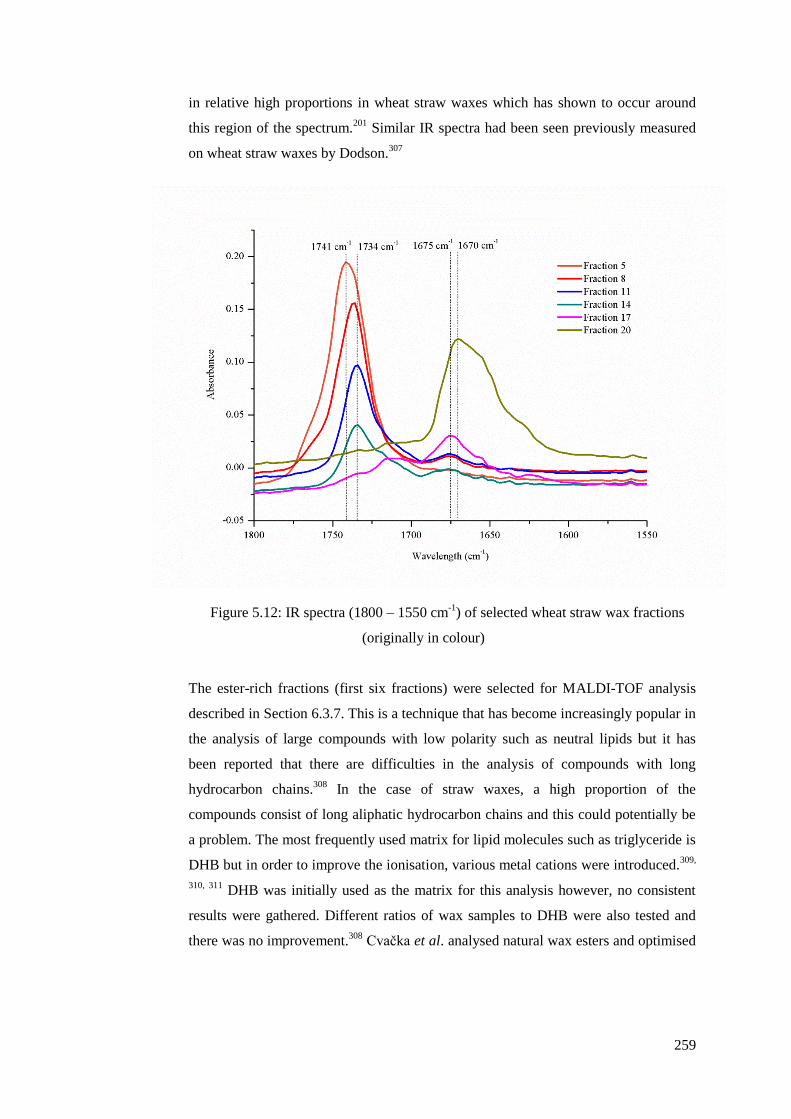
259
in relative high proportions in wheat straw waxes which has shown to occur around
this region of the spectrum.201
Similar IR spectra had been seen previously measured
on wheat straw waxes by Dodson.307
Figure 5.12: IR spectra (1800 – 1550 cm-1
) of selected wheat straw wax fractions
(originally in colour)
The ester-rich fractions (first six fractions) were selected for MALDI-TOF analysis
described in Section 6.3.7. This is a technique that has become increasingly popular in
the analysis of large compounds with low polarity such as neutral lipids but it has
been reported that there are difficulties in the analysis of compounds with long
hydrocarbon chains.308
In the case of straw waxes, a high proportion of the
compounds consist of long aliphatic hydrocarbon chains and this could potentially be
a problem. The most frequently used matrix for lipid molecules such as triglyceride is
DHB but in order to improve the ionisation, various metal cations were introduced.309,
310, 311 DHB was initially used as the matrix for this analysis however, no consistent
results were gathered. Different ratios of wax samples to DHB were also tested and
there was no improvement.308
Cvačka et al. analysed natural wax esters and optimised
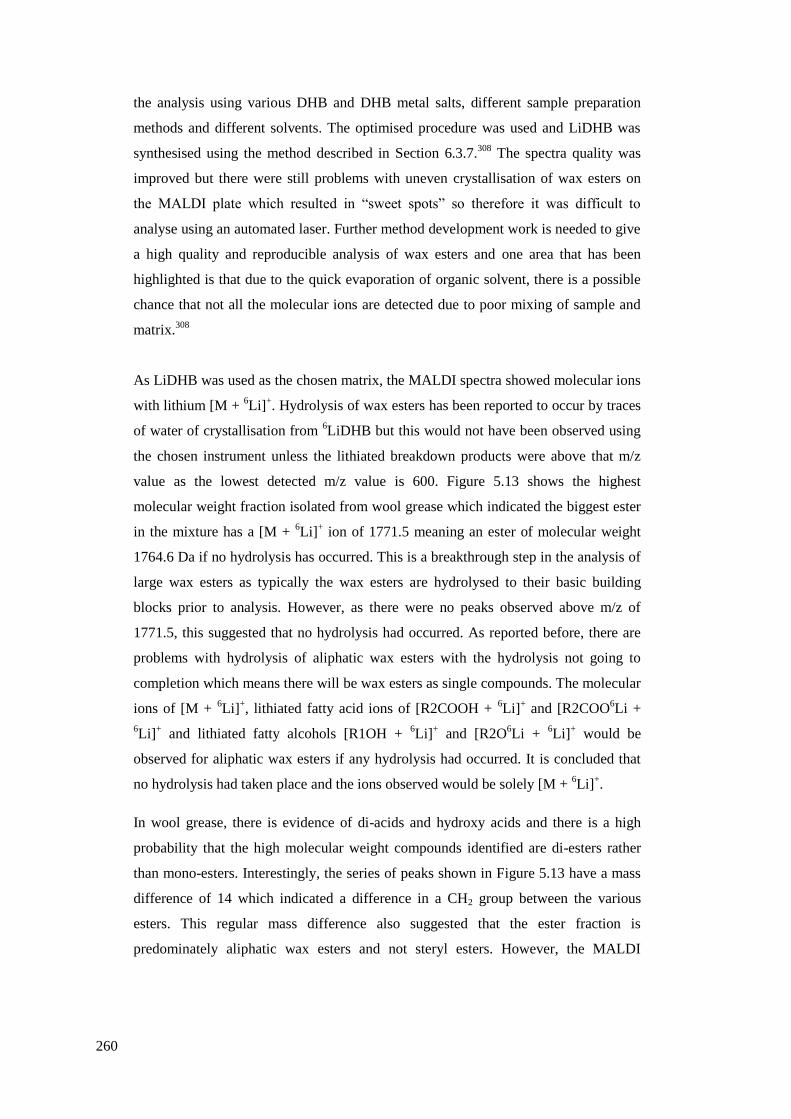
260
the analysis using various DHB and DHB metal salts, different sample preparation
methods and different solvents. The optimised procedure was used and LiDHB was
synthesised using the method described in Section 6.3.7.308
The spectra quality was
improved but there were still problems with uneven crystallisation of wax esters on
the MALDI plate which resulted in “sweet spots” so therefore it was difficult to
analyse using an automated laser. Further method development work is needed to give
a high quality and reproducible analysis of wax esters and one area that has been
highlighted is that due to the quick evaporation of organic solvent, there is a possible
chance that not all the molecular ions are detected due to poor mixing of sample and
matrix.308
As LiDHB was used as the chosen matrix, the MALDI spectra showed molecular ions
with lithium [M + 6Li]
+. Hydrolysis of wax esters has been reported to occur by traces
of water of crystallisation from 6LiDHB but this would not have been observed using
the chosen instrument unless the lithiated breakdown products were above that m/z
value as the lowest detected m/z value is 600. Figure 5.13 shows the highest
molecular weight fraction isolated from wool grease which indicated the biggest ester
in the mixture has a [M + 6Li]
+ ion of 1771.5 meaning an ester of molecular weight
1764.6 Da if no hydrolysis has occurred. This is a breakthrough step in the analysis of
large wax esters as typically the wax esters are hydrolysed to their basic building
blocks prior to analysis. However, as there were no peaks observed above m/z of
1771.5, this suggested that no hydrolysis had occurred. As reported before, there are
problems with hydrolysis of aliphatic wax esters with the hydrolysis not going to
completion which means there will be wax esters as single compounds. The molecular
ions of [M + 6Li]
+, lithiated fatty acid ions of [R2COOH +
6Li]
+ and [R2COO
6Li +
6Li]
+ and lithiated fatty alcohols [R1OH +
6Li]
+ and [R2O
6Li +
6Li]
+ would be
observed for aliphatic wax esters if any hydrolysis had occurred. It is concluded that
no hydrolysis had taken place and the ions observed would be solely [M + 6Li]
+.
In wool grease, there is evidence of di-acids and hydroxy acids and there is a high
probability that the high molecular weight compounds identified are di-esters rather
than mono-esters. Interestingly, the series of peaks shown in Figure 5.13 have a mass
difference of 14 which indicated a difference in a CH2 group between the various
esters. This regular mass difference also suggested that the ester fraction is
predominately aliphatic wax esters and not steryl esters. However, the MALDI

261
technique is classed as soft ionisation so no fragmentation would have been observed
and it would be interesting to further separate the mixture or hydrolyse the mixture
and carry out further MS analysis in order to assist in structure elucidation.
Figures 5.14 and 5.15 show the mass spectra for the biggest fractions in wheat and oat
straw waxes. The crucial information from this data is that there are high molecular
weight esters detected above molecular weight compounds of 800 Da. The biggest
peak in wheat and oat straw waxes showed m/z values of 995.9 and 1498.1
respectively. As before these represent the molecular ions with lithium [M + 6Li]
+
which reflects a molecular weight of 989 and 1491.2 Da respectively. The initial
chemical composition of the straw waxes using GC-MS showed a range of aliphatic
wax esters range from C40 – C56 with molecular weight of 592.6 – 816.9 Da so
therefore the [M + 6Li]
+ ions should be observed using this technique. These wax
esters were observed and are highlighted in Figures 5.14 and 5.15. Table 5.3 shows a
list of ions found from m/z of 600 and higher, indicated in previous work using GC-
MS and their corresponding identification. Some of the wax esters can be identified
using MALDI and this is highlighted in the table. Due to the poor quality in the low
mass region of the spectra, the intensity of peaks was low and not reproducible. This
again could potentially be due to crystallisation problems of wax esters on the MALDI
plate for which further method development is needed. The unidentified large
molecules could potentially be glycerides or bigger wax esters and currently, at this
stage, with only limited [M + 6Li]
+ ion data and without any fragmentation pattern, it
is difficult to deduce the exact structures of these compounds. The aim of the
investigation was to fractionate the waxes by size, which was achieved successfully.
However, it would be interesting to further separate and analyse the large molecules
possibly by hydrolysis of the esters. This work has proved that fractionation of waxes
by GPC is a good way of separating high molecular weight compounds and also
showed the potential of using MALDI TOF MS as a wax ester analytical technique
but further method optimisation is required.

262
Figure 5.13: MALDI-TOF mass spectrum for wool grease fraction 5 (originally in
colour
Figure 5.14: MALDI-TOF mass spectrum for wheat straw wax fraction 5 (originally in
colour)
C40 – C56 wax esters

263
Figure 5.15: MALDI-TOF mass spectrum for oat straw wax fraction 5 (originally in
colour)
5.2.4 Saponification
Saponification is a common process that is used to produce soap from fats. In the case
of straw waxes, the glycerides and esters are both prone to saponification to form the
sodium salts, glycerol and fatty alcohols as shown as the reaction scheme in Figure
5.16. Wheat straw wax from the scale up trial was saponified into wheat alcohol and
acid fractions using the procedure shown in Section 6.2.7.
The aim of saponifying the crude wax into its fractions was to investigate the change
in physical properties such as melting point and to check for any new undetected wax
esters. During the saponification process, the yield is about 75% and within the
recovered fractions 63% was wheat alcohols and 37% was wheat acids. The properties
for the new fractions are discussed within the physical properties in Section 5.4. Due
to the improved water absorption from the fatty alcohol fraction, the saponification
process was scaled up in order to gain enough wheat alcohols for personal care
applications trials which will be carried out by the applications team at Croda. The
C40 – C56 wax
esters
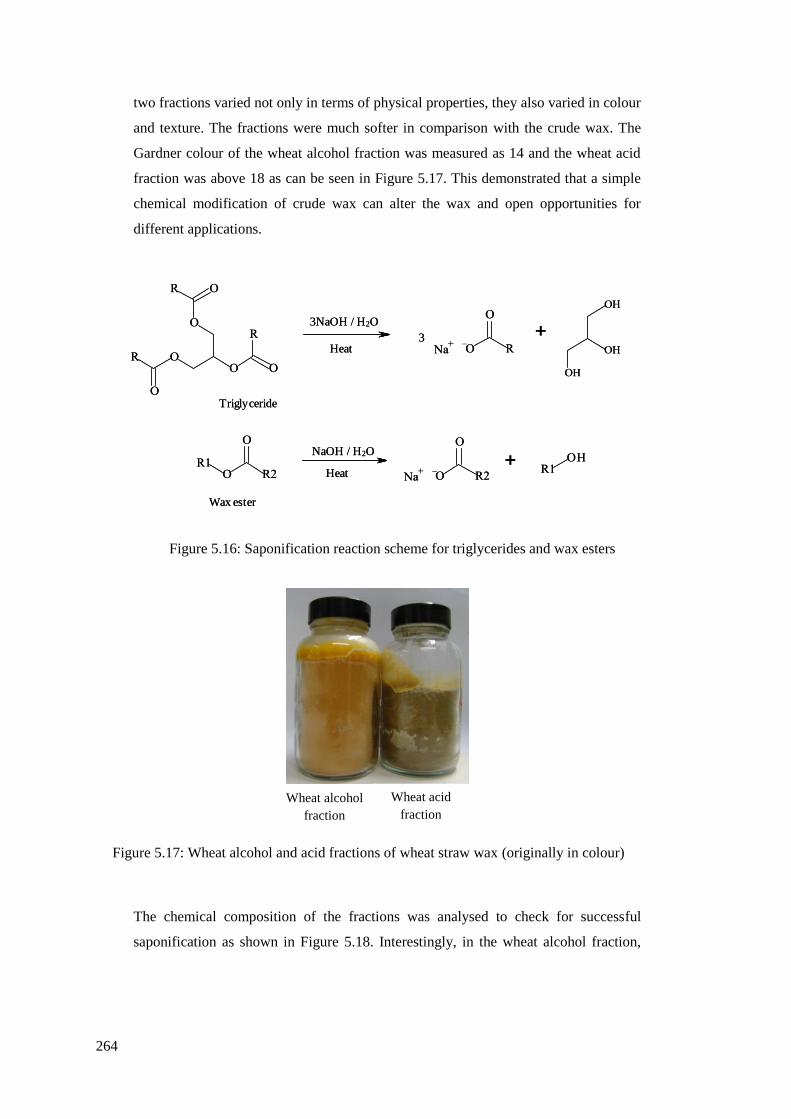
264
two fractions varied not only in terms of physical properties, they also varied in colour
and texture. The fractions were much softer in comparison with the crude wax. The
Gardner colour of the wheat alcohol fraction was measured as 14 and the wheat acid
fraction was above 18 as can be seen in Figure 5.17. This demonstrated that a simple
chemical modification of crude wax can alter the wax and open opportunities for
different applications.
Figure 5.16: Saponification reaction scheme for triglycerides and wax esters
Figure 5.17: Wheat alcohol and acid fractions of wheat straw wax (originally in colour)
The chemical composition of the fractions was analysed to check for successful
saponification as shown in Figure 5.18. Interestingly, in the wheat alcohol fraction,
Wheat alcohol
fraction
Wheat acid
fraction
Triglyceride
Wax ester
3
Heat
NaOH / H2O
3NaOH / H2O
Heat
Triglyceride
Wax ester
3
Heat
NaOH / H2O
3NaOH / H2O
Heat

265
two extra peaks were observed, as highlighted. The other compounds found in the
fractions have already been identified previously in Chapter 2 so these were expected
to be seen in the chromatogram and this is shown as a summary in Table 5.5.
However, hexacosanol (C26) and hexacosanoic acid (C26) were expected to be
identified in the saponified fractions as hexacosanyl hexadecanoate (C42) and
octacosanyl hexacosanoate (C54) were previously identified in the crude wheat straw
wax in the scale up trial. As these compounds were present only at an extremely low
level, the saponified products would also be present at low concentrations and may
only show as very small peaks in the chromatogram. The two new peaks highlighted
in the alcohol fraction were identified to be ketones with the carbonyl group on the
second carbon which give a distinct fragmentation pattern as shown in Figure 5.18.
Figure 5.19 shows the EI spectra with the large m/z region magnified as the molecular
ion was lacking in the original trace. The identification was achieved by a
combination of the EI fragmentation pattern and KI values. Table 5.4 shows the
fragments and their percentage base peak intensity along with the calculated KI values
against literature values and it appears to be a good match. The ketones differ
structurally by only two carbon units and this is reflected in the 200 KI values
difference between them. The pattern shown in Figure 5.19 has a base peak of m/z =
58 which is the result of a McLafferty rearrangement as shown in Figure 5.20. The ion
m/z = 196 can be observed in the EI fragmentation pattern for 2-heptadecanone which
is due to [M – 58]+
ion as a result of the loss of the McLafferty rearrangement
fragment ion. When the higher m/z region was magnified, the molecular ion was
observed which confirmed the carbon chain length of the molecules. The regular
fragment ions of 43, 57, 71 and 85 arise from the aliphatic alkyl chain as described in
Table 2.7.
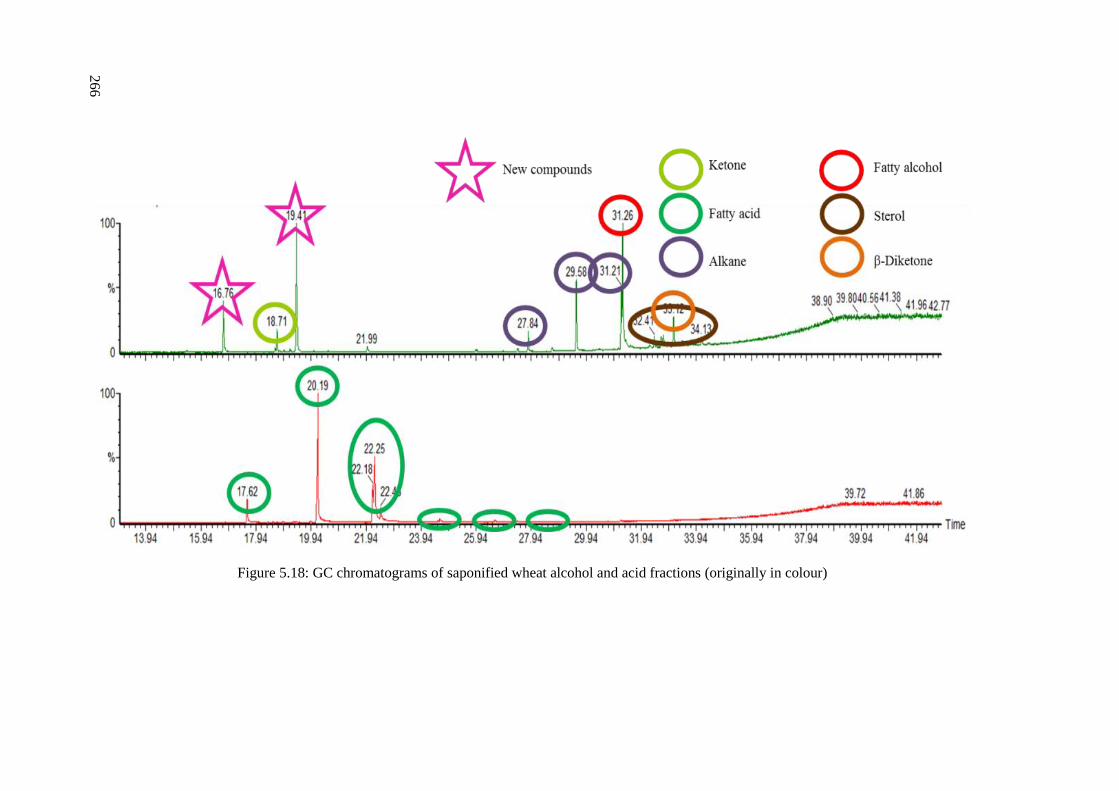
26
6
Figure 5.18: GC chromatograms of saponified wheat alcohol and acid fractions (originally in colour)
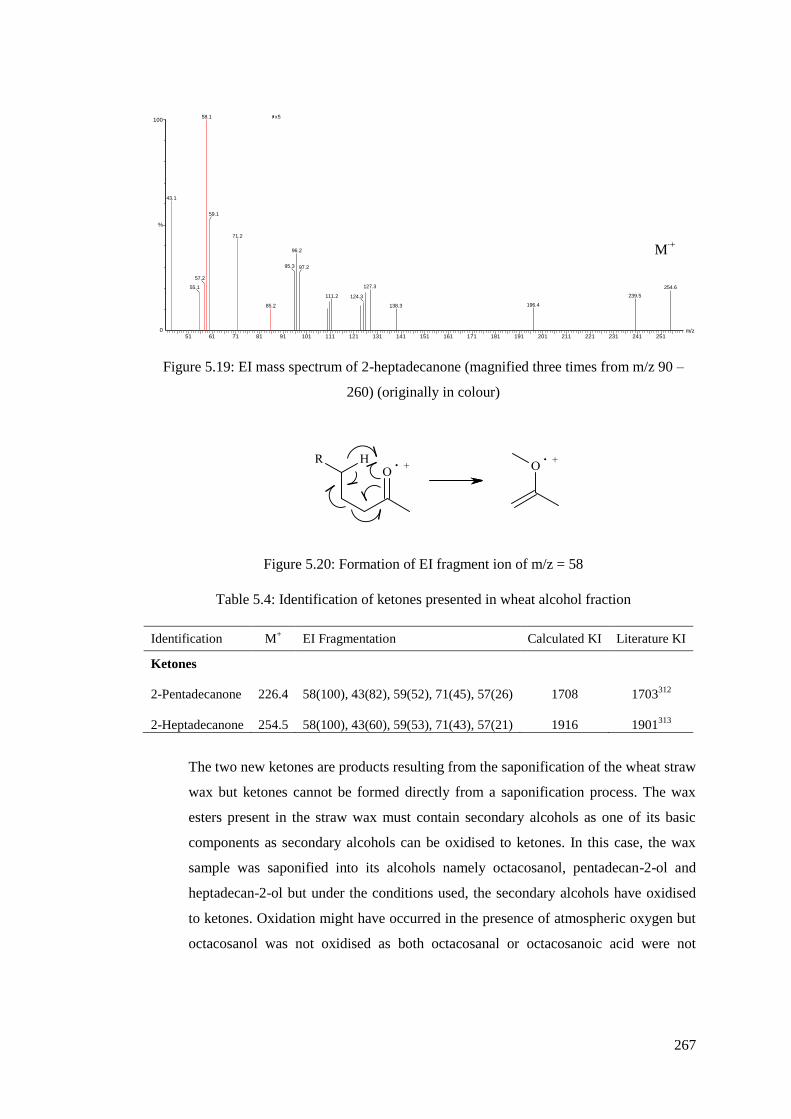
267
Figure 5.19: EI mass spectrum of 2-heptadecanone (magnified three times from m/z 90 –
260) (originally in colour)
Figure 5.20: Formation of EI fragment ion of m/z = 58
Table 5.4: Identification of ketones presented in wheat alcohol fraction
Identification M+ EI Fragmentation Calculated KI Literature KI
Ketones
2-Pentadecanone 226.4 58(100), 43(82), 59(52), 71(45), 57(26) 1708 1703312
2-Heptadecanone 254.5 58(100), 43(60), 59(53), 71(43), 57(21) 1916 1901313
The two new ketones are products resulting from the saponification of the wheat straw
wax but ketones cannot be formed directly from a saponification process. The wax
esters present in the straw wax must contain secondary alcohols as one of its basic
components as secondary alcohols can be oxidised to ketones. In this case, the wax
sample was saponified into its alcohols namely octacosanol, pentadecan-2-ol and
heptadecan-2-ol but under the conditions used, the secondary alcohols have oxidised
to ketones. Oxidation might have occurred in the presence of atmospheric oxygen but
octacosanol was not oxidised as both octacosanal or octacosanoic acid were not
, 29-Jun-2011 + 12:14:32WSW alcohols sap
51 61 71 81 91 101 111 121 131 141 151 161 171 181 191 201 211 221 231 241 251m/z0
100
%
es wsw coh sap 2459 (19.409) Cm (2453:2472-(2164:2238+2691:2734)) Scan EI+ 5.94e7x5 x10 x2058.1
43.1
57.2
55.1
59.1
71.2
96.2
95.3
85.2
97.2
127.3
111.2 124.3
254.6
239.5
196.4138.3
M∙+

268
observed. To minimise oxidation of compounds in future, the sample can be stored
under vacuum or an inert gas at all times.
This is the first time that secondary alcohols may have been identified and generally
in plants, secondary alcohols occur freely rather than esterified.80
Secondary alcohols
found in cuticular waxes are all typically odd-numbered as they are biosynthesised via
the alkane pathway.82
The most abundant free secondary alcohols identified are
usually from C23 – C33 and predominantly C29 and C31 and the functional groups are
usually found in the middle of the carbon chain.80
This group of compounds are not
often found in Gramineae species but a mixture of heptacosan-9-ol, nonacosan-10 and
-11-ols and hentriacontan-10, -11, -12 and -13-ols were identified in barley.283
Shorter
alkan-2-ols with 17 and 19 carbon chain lengths are reported to occur as aliphatic
monomer that is covalently bound to the cutin and suberin polymer and has also been
reported in barley.314, 315
No alkan-2-ols were found in the barley straw wax from the
scale up trial. However, it would be interesting to saponify the wax to look for any
esterified alkan-2-ols and compare this with wheat straw wax. However, as the
secondary alcohols in wheat straw wax are bound with various fatty acids to form wax
esters, they appeared to have a shorter alkyl carbon chain. In Figure 2.26, the GC
analysis showed the presence of a series of unidentified odd-numbered wax esters
from C41 – C52. As odd-numbered primary alcohols are not found in plant cuticular
waxes, there is a high probability that these are formed from the odd-numbered
secondary alcohols. Fatty acids are rarely present as odd-numbered because the
elongation step in the biosynthetic pathway extends the carbon chain with the addition
of C2 moiety.82, 85
From this reaction, the alcohol moieties of these wax esters are
suggested to be either pentadecan-2-ol or heptadecan-2-ol. However, at this stage the
exact structures of the series of odd-numbered wax esters cannot be found without the
EI fragmentation pattern of the compounds so as an example the proposed structures
for C41wax esters are displayed as Figure 5.21. In order to acquire an accurate EI
mass spectra of the odd esters, the concentration must be increased and the use of a
shorter column (e.g.: 15 m) will be necessary to gain better resolution.
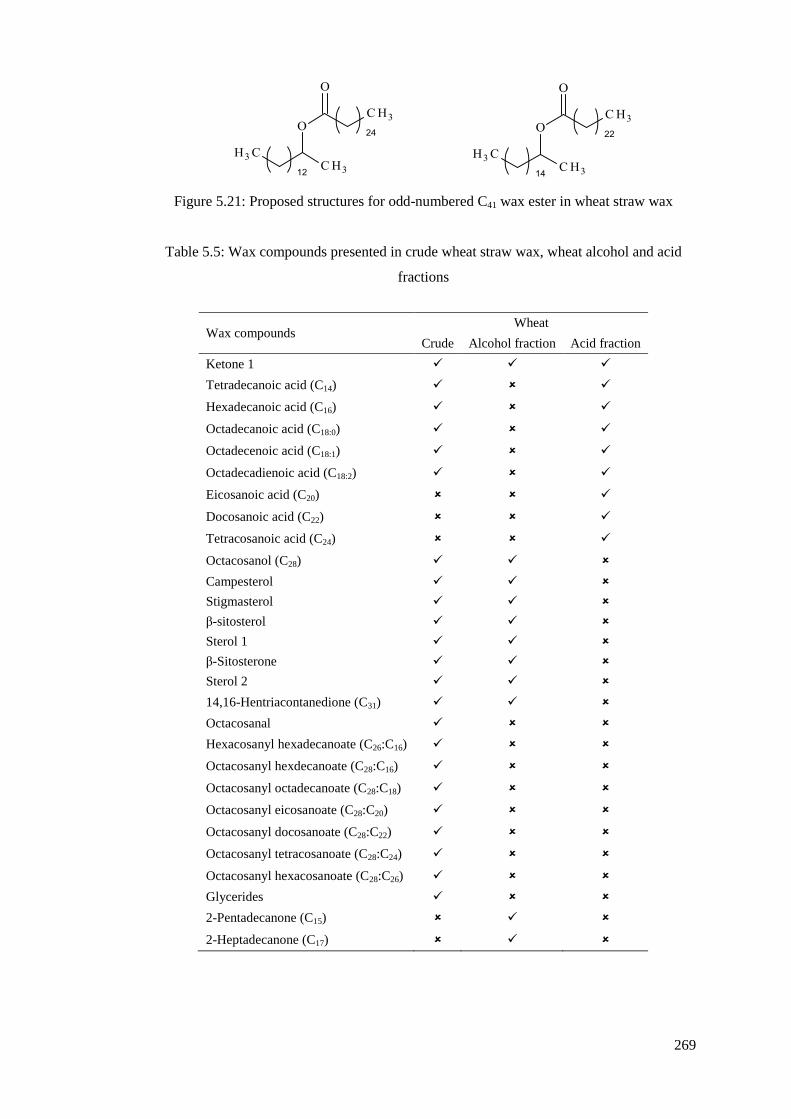
269
Figure 5.21: Proposed structures for odd-numbered C41 wax ester in wheat straw wax
Table 5.5: Wax compounds presented in crude wheat straw wax, wheat alcohol and acid
fractions
Wax compounds Wheat
Crude Alcohol fraction Acid fraction
Ketone 1
Tetradecanoic acid (C14)
Hexadecanoic acid (C16)
Octadecanoic acid (C18:0)
Octadecenoic acid (C18:1)
Octadecadienoic acid (C18:2)
Eicosanoic acid (C20)
Docosanoic acid (C22)
Tetracosanoic acid (C24)
Octacosanol (C28)
Campesterol
Stigmasterol
β-sitosterol
Sterol 1
β-Sitosterone
Sterol 2
14,16-Hentriacontanedione (C31)
Octacosanal
Hexacosanyl hexadecanoate (C26:C16)
Octacosanyl hexdecanoate (C28:C16)
Octacosanyl octadecanoate (C28:C18)
Octacosanyl eicosanoate (C28:C20)
Octacosanyl docosanoate (C28:C22)
Octacosanyl tetracosanoate (C28:C24)
Octacosanyl hexacosanoate (C28:C26)
Glycerides
2-Pentadecanone (C15)
2-Heptadecanone (C17)

270
Another explanation for the presence of these ketones is the breakdown products of
14, 16-hentriacontanedione via a Retro-Claisen reaction shown in Figure 5.22. The
nucleophile OH group from the NaOH in the saponification mixture can attack both
carbonyl groups which would give a total of four breakdown products. In the wheat
straw wax from the large scale trial, only the C31 β-diketone was present so therefore
if this reaction was to proceed, it would result in tetradecanoic acid (C14:0),
hexadecanoic acid (C16:0), 2-pentadecanone (C15) and 2-heptadecanone (C17) which
were all identified. Interestingly, 14, 16-hentriaconatane was also found in the wheat
alcohol fraction which means that if this reaction did occur, the reaction had not gone
to completion. In order to conclude the origin of the 2-ketones, quantification would
suggest whether the Retro-Claisen reaction had occurred.
Figure 5.22: An example of the Retro-Claisen reaction on β-diketone

271
5.3 Physical properties
5.3.1 Melting point
DSC was used as to investigate phase transitions in the straw waxes and one of the
most important physical properties of waxes is their melting point(s). The phase
transition of melting is endothermic and therefore shows a negative heat flow. The
decomposition temperature was first determined using STA by following the method
described in Section 6.4.1. STA is a combination of TGA and DSC but in this case,
the TGA thermogram was of interest. The decomposition temperature was determined
so that during DSC analysis, the maximum temperature does not exceed its
decomposition point. All the waxes were found to have a decomposition temperature
above 463 K so that a temperature of 393 K was set for the maximum DSC
temperature. Figure 5.23 shows an example of the STA thermogram of a wheat straw
wax.
Figure 5.23: STA thermogram of wheat straw wax (originally in colour)
The samples analysed were initially heated and then cooled to remove any prior
thermal character so all the thermograms shown are from the second heating cycle of
the analysis. Lanolin, beeswax, candelilla wax and carnauba wax were analysed as
they are popular waxes with very distinct applications. The DSC thermogram for the
four commercial waxes is shown in Figure 5.24. These waxes are finished products
and have been refined so their melting range is fairly sharp. Lanolin is a soft wax and
1.5
1.0
0.5
0.0
100
80
60
373 473 573 673 773 873 0
Temperature (K)
Hea
t F
low
Mass p
ercenta
ge
Decomposition point (Mass
percentage of approximately
99%) TGA
DSC
Exothermic up
272
has a melting temperature of 313 K which is body temperature. This makes the wax
especially good for skin care formulations. Beeswax, candelilla and carnauba waxes
are much harder waxes and have much higher melting ranges which make excellent
cosmetic ingredients for lip-sticks, mascara formulations and many others.125, 316, 317
In
the case of beeswax and carnauba wax, there are multiple peaks which indicate
multiple groups of compounds going through thermal transition at different
temperatures. There is still an opportunity to replace some of these waxes that are not
UK-sourced which would be ideal in terms of reducing carbon footprint from
transportation. According to recent market trends, especially in the personal care
sector, there is a big consumer-driven trend for natural cosmetics products and the
removal of animal derived ingredients so this is an opportunity to develop the market
for new plant-derived waxes as the launching of such ingredients would be widely
accepted.
The melting range for the straw waxes was determined in an attempt to correlate the
composition and the melting range. As the chemical compositions of the extracts are
too complex and often with over 100 different compounds, it is impossible to identify
which single compound is corresponding to which particular thermal transition. Even
if this was possible, it would not give useful information as it has been shown that
different wax groups within complex mixtures interact and behave differently to
expectations. Patel et al. analysed the melting points of wax ester and alkane mixtures
and discovered that there are some packing disruptions when the two molecules are
forced into interactions which was reflected in a 3 – 5 °C decrease in the melting
points compared to expected.274
Nemoto et al. carried out DSC on mixtures of ketones
and n-alkanes and also showed interactions between the two molecules and a mixture
of both physical properties depending on the ratio of the two.318
However, it has been
reported by Bonsor et al. that if the chain lengths for n-alkanes do not differ
excessively, the mixtures would form mixed crystals and would exhibit straight
forward predictable physical properties.319
Gibbs also analysed the influence of
melting points of two mixed n-alkanes and found that the melting point lies between
the melting points of the two individual n-alkanes therefore making prediction
possible.320
Similar work was also carried out in the same study on mixtures of
branched alkanes and n-alkanes and the co-crystallised molecules so making the
melting points possible to calculate.320
Since there is more than one wax group in the
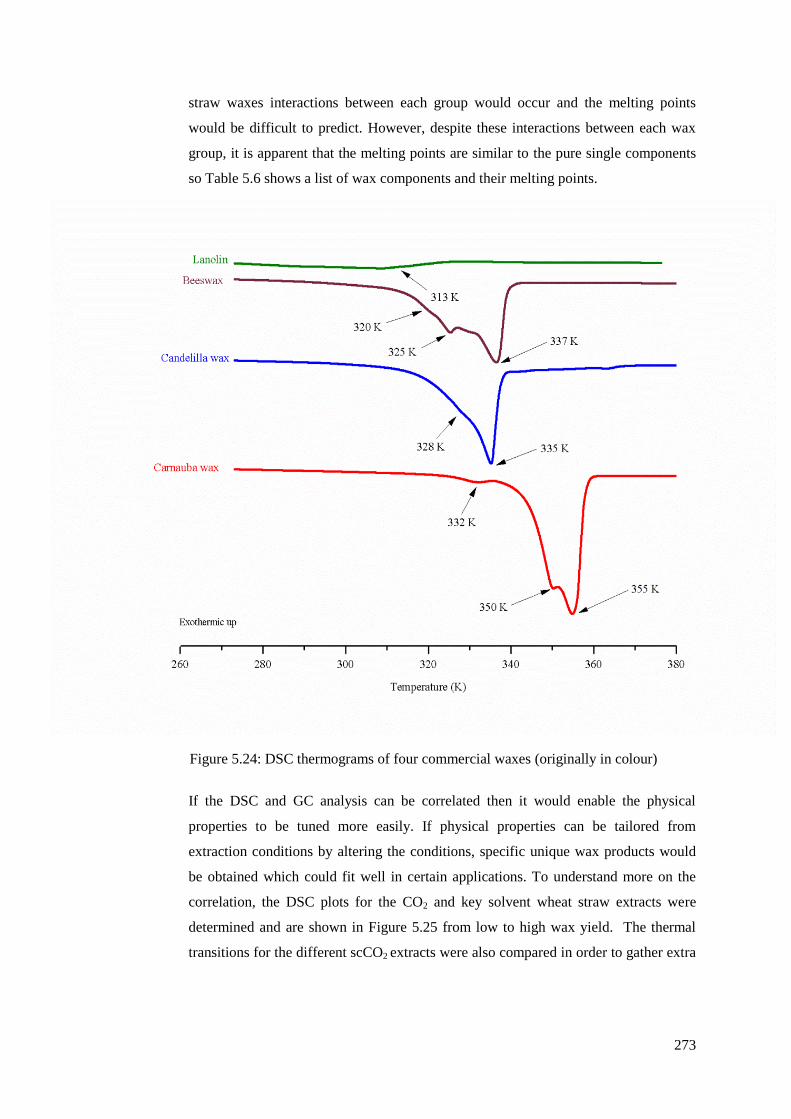
273
straw waxes interactions between each group would occur and the melting points
would be difficult to predict. However, despite these interactions between each wax
group, it is apparent that the melting points are similar to the pure single components
so Table 5.6 shows a list of wax components and their melting points.
Figure 5.24: DSC thermograms of four commercial waxes (originally in colour)
If the DSC and GC analysis can be correlated then it would enable the physical
properties to be tuned more easily. If physical properties can be tailored from
extraction conditions by altering the conditions, specific unique wax products would
be obtained which could fit well in certain applications. To understand more on the
correlation, the DSC plots for the CO2 and key solvent wheat straw extracts were
determined and are shown in Figure 5.25 from low to high wax yield. The thermal
transitions for the different scCO2 extracts were also compared in order to gather extra

274
information on links between composition and melting ranges. The DSC thermograms
are shown as Figure 5.26 in order of CO2 density. It is important to note that the
thermogram displayed for scCO2 B in both figures are the same sample. The
extraction conditions for Figures 5.25 and 5.26 can be found in Tables 3.3 and 3.6.The
relative abundance of each wax group in each extract is listed in Table 5.7 to allow for
easy comparison of chemical composition to DSC thermograms. It must be noted that
there was co-elution between hentriacontane (C31) and octacosanol (C28) in some
analyses and these numbers have been highlighted in the table.
Table 5.6: The melting points of wheat straw wax compounds
Wheat straw wax compounds Melting point (K)
Tetradecanoic acid (C14:0)a 328
Hexdecanoic acid (C16:0)a
336
Octadecadienoic acid (C18:2)a 268
Octadecenoic acid (C18:1)a 286
Octadecanoic acid (C18:0)a 343
Heptacosane (C27)a 332
Nonsacosane (C29)a 336
Hentriacontane (C31)a 341
Triatriacontane (C33)a 345
Campesterola 432
Stigmasterola 445
β-sitosterola 405
14,16 Hentriacontanedione (C31)b 382
16,18 Triatriacontanedione (C33)b 388
Tetracosanyl hexadecanoate (C24:C16)b 364
Hexacosanyl hexadecanoate (C26:C16)b 370
Octacosanyl hexdecanoate (C28:C16)b 376
Octacosanyl octadecanoate (C28:C18)b 381
Octacosanyl eicosanoate (C28:C20)b 386
Octacosanyl docosanoate (C28:C22)b 391
Octacosanyl tetracosanoate (C28:C24)b 396
Octacosanyl hexacosanoate (C28:C26)b 401
Octacosanyl octacosanoate (C28:C28)b 406
Octacosanola 353
Octacosanalb 342
a Data collected from MSDS in Sigma-Aldrich UK Limited
b Data
predicted from software ICAS 12 using Merrero and Gani method

275
Figure 5.25: DSC thermograms of scCO2 extracts compared with organic solvent extracts
(originally in colour)
A number of important similarities can be highlighted from Figures 5.25 and 5.26.
First, the lCO2 and scCO2 C extracts both exhibited a sharper endotherm and melted
over a smaller range compared to other extracts indicating a high percentage of a
single group of compounds within the extracts. Similarly, both have a melting point of
around 320 K and 330 K. which is most likely the 30% β-diketones, n-alkanes and
fatty acids as they appeared to be most predominant. The scCO2 E extract consists of
roughly equal proportions of the different wax groups and this is apparent in the DSC
thermogram as it has a very broad melting range and five distinct melting points.
Another interesting point to note is the scCO2 D and F extracts have almost identical
melting curves compared to Soxhlet heptane extract. The Soxhlet ethanol and scCO2
with ethanol extracts can be compared as both have a very broad melting range but do
have similar melting points which showed that even the addition of just 10% ethanol

276
to the scCO2 is enough to manipulate the solvent polarity and its extraction behaviour.
The scCO2 extract extracted using the highest CO2 density contain higher molecular
weight compounds that would be more soluble in the scCO2 and this is reflected in the
high melting point of 352 K. The scCO2 B was extracted using the identical pressure
but at higher temperature compared to scCO2 A and exhibited a much lower melting
range compared to scCO2 A. Tt can be explained by the lower CO2 density (scCO2 B)
used during extraction so higher molecular weight compounds may still be insoluble
in the scCO2. From low to high density CO2, the melting range increases which
showed that larger and higher melting compounds are being extracted as CO2 density
increases.
Figure 5.26: DSC thermograms of scCO2 extracts under different temperature and pressure
(originally in colour)

277
Table 5.7: Percentage of wax groups in crude extracts from CO2 and organic solvent extractions
Extraction
conditions
Percentage of wax group in crude extracts
Fatty acids Wax esters Hydrocarbons Sterols β-Diketones Fatty alcohol Aldehyde Ketones Unknown
lCO2 7.2 0.7 6.0a 12.1 33.2 3.2 0.6 1.3 35.7
scCO2 F 7.6 30.1 8.1 10.8 13.1 7.6 1.1 0.9 20.7
Heptane 5.9 13.0 4.1 4.1 7.4 3.5 0.9 0.7 60.3
CO2 + Ethanol 3.6 26.0 5.6 3.5 5.0 3.1 0.7 0.5 52.1
scCO2 B 5.6 17.6 8.8a 6.2 9.3 8.6 0.6 0.6 42.7
Ethanol 5.1 3.2 7.0a 5.6 3.0 6.3 0.0 0.4 69.6
scCO2 A 11.7 26.6 9.6 12.4 18.7 4.5 1.3 1.2 14.0
scCO2 B 5.6 17.6 8.8 6.2 9.3 8.6 0.6 0.6 42.7
scCO2 C 12.5 1.4 13.6 10.2 34.5 6.4 1.2 1.2 18.9
scCO2 D 16.0 18.4 3.7 0.5 0.5 1.8 0.7 0.2 58.2
scCO2 E 11.7 16.1 15.6 11.7 15.0 13.8 2.2 0.9 13.1
Table 5.8: Percentage of wax group in the three cereal straw waxes
Straw Percentage of wax group in crude extract
Fatty acids Wax esters Hydrocarbons Sterols β-Diketones Fatty alcohols Aldehydes Ketones Unknown
Wheat 8.1 2.4 9.9a 21.9 16.0 8.9
a 0.3 0.0 41.1
Barley 11.5 16.9 19.3a 21.0 21.2 10.2
a 2.2 0.7 7.4
Oat 6.0 14.5 14.6a 12.5 11.6 11.9
a 4.6 0.5 35.1
a Co-elution of hentriacontane (C31) and octacosanol (C28) giving the total percentage of hydrocarbons and fatty alcohols

278
From the DSC thermograms, it can be concluded that physical properties like melting
ranges can be tuned by extraction conditions and many extracts can be refined to
match the melting ranges of commercial waxes e.g.: the scCO2 A extract has a DSC
thermogram similar to carnauba wax. It would be beneficial to fractionate some of the
extracts to understand how the different wax groups interact with one another in order
to correlate chemical composition to melting ranges more easily. As can be observed
in Figures 5.24, 5.25 and 5.26, wheat straw waxes do have a real potential to replace
some of the existing commercial waxes.
The melting ranges can also be altered by a blend of different waxes or other natural
ingredients as well as further downstream processes such as flash chromatography.
Figure 5.27 shows the melting ranges of wheat, barley and oat straw waxes from the
scale up trial described in Chapter 4. Both wheat and oat straw waxes exhibit minor
endothermic events prior to the main melt for the wax which suggested that there are
some low melting compounds within the complex mixture. The wheat and barley
straw waxes are very similar as there are two main peaks at 315 K, 327 K and 333 K
suggesting that the chemical compositions for the two are comparable. Table 5.8
shows the breakdown of the different wax groups within the three straw waxes. As
previously, there are co-elution of hentriacontane (C31) and octacosanol (C28) and this
has been highlighted in the table. The chemical composition for both wheat and barley
wax are similar but do differ in terms of hydrocarbon and wax ester content. Barley
straw wax has a much higher hydrocarbon and wax ester content compared to wheat
straw wax, both wax groups melt at temperatures between 360 K to 432 K. This
higher proportion of hydrocarbons and wax esters in the barley straw wax is reflected
in the DSC thermogram as the second melting peaks at 327 K and 334 K are much
higher than wheat straw wax which means more energy is needed to create the
endotherm indicating a bigger proportion of higher melting wax compounds. This also
suggested that the first peak at 315 K may be due to other wax groups such as fatty
acids. The thermogram for oat straw wax is distinctly different to the other two cereals
as it appears that the peak at 315 K has disappeared. However, it does exhibit the
same second broad peak at 334 K and with a shoulder at 327 K. The oat straw wax
does have the smallest proportion of free fatty acids in the extract which may lead to
the 315 K being extremely small blending into the second peak.

279
To investigate this further, fractionation of the wax into different wax groups would
assist in the correlation between chemical compositions and physical properties. It
would be interesting to analyse wax blends at different proportions to observe the
influence of chemical composition on thermal properties. As can be seen in Table 5.8,
not all the wax compounds in the extracts are identified and quantified so it is
important to be aware that there is still a proportion of the extracts that is unknown in
terms of chemical compositions which could be responsible for the thermal properties
observed. To enhance the arguments from before, it would be beneficial if all the wax
compounds were identified so the compounds responsible for certain endotherms can
be allocated which can make tuning of thermal properties for specific applications
easier.
The wheat straw wax from the scale up trial was saponified using the method
described in Section 6.2.7. From the discussion in Section 5.2.4, the saponification
proved to be successful as the fatty alcohol fraction does not contain any ester
molecules and the fatty acid fraction only consists of free fatty acids. The
identification of compounds within each fraction is discussed in Section 5.2.4. Figure
5.28 shows the DSC thermogram of how the saponifcation fractions compared with
the original crude wheat straw wax. Wheat straw wax consists of multiple endotherms
indicating various groups of compounds within the complex mixture melting. The
wheat alcohol and acid fractions together showed a rough representation of the DSC
thermogram of the crude wheat straw wax as the main peak shown at 315 K is clearly
due to the fatty acids within the mixture. The DSC thermogram of wheat alcohols
fraction is more complex as more endotherm peaks can be seen and this could be due
to two newly identified 2-ketones in the fraction. The peaks are more defined as at
least three lipid groups (fatty acids, wax esters and glycerides) have been removed.
The thermogram also highlighted that the peak present at 333 K in the crude wheat
straw wax is due to the fatty alcohols, sterols and β-diketones. The large peak at 327
K in the crude wheat straw wax has now been reduced to only a small shoulder in the
wheat alcohols fraction which suggests that this could be due to the saponifiable
compounds such as glycerides or wax esters. This work has clearly demonstrated that
simple saponification can assist in correlating the wax groups with their thermal
properties which is valuable information when tuning the physical properties of wax
for specific applications. It would be interesting to carry out some blending

280
experiments with not only the crude waxes but also various fractions in order to create
various thermal profiles and generate many different wax products for many
applications.
Figure 5.27: DSC thermograms of wheat, barley and oat straw waxes from scale up trials
(originally in colour)
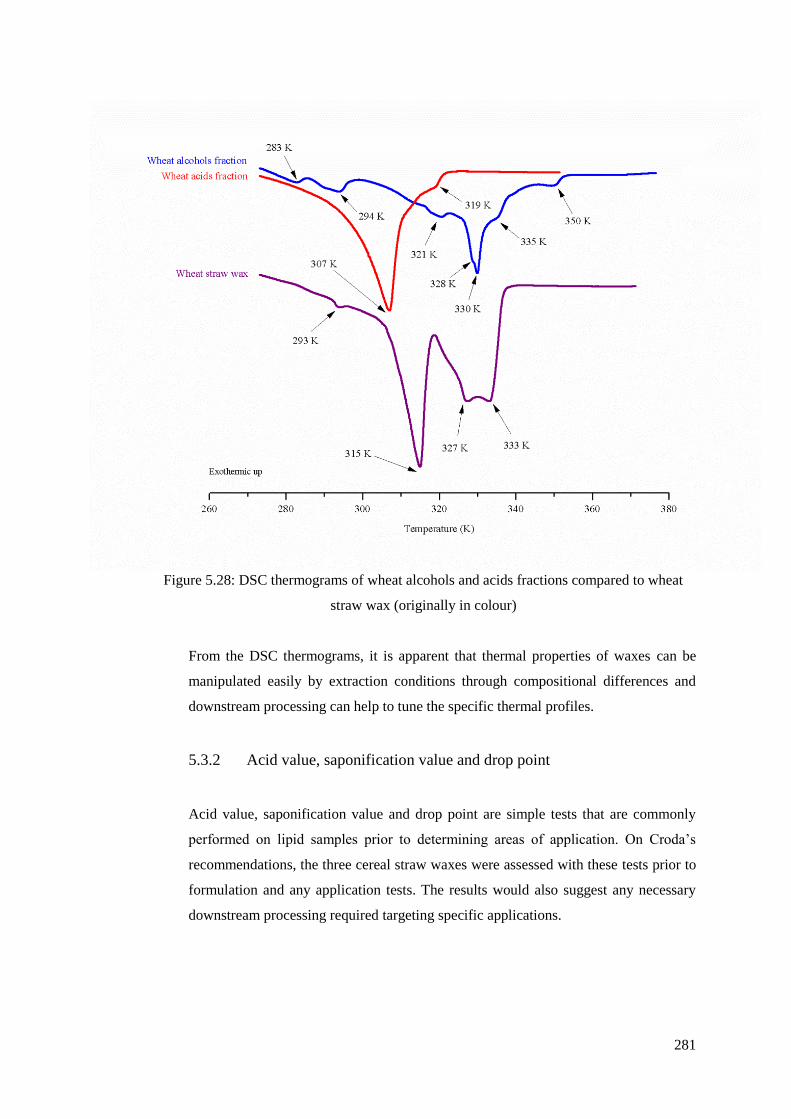
281
Figure 5.28: DSC thermograms of wheat alcohols and acids fractions compared to wheat
straw wax (originally in colour)
From the DSC thermograms, it is apparent that thermal properties of waxes can be
manipulated easily by extraction conditions through compositional differences and
downstream processing can help to tune the specific thermal profiles.
5.3.2 Acid value, saponification value and drop point
Acid value, saponification value and drop point are simple tests that are commonly
performed on lipid samples prior to determining areas of application. On Croda’s
recommendations, the three cereal straw waxes were assessed with these tests prior to
formulation and any application tests. The results would also suggest any necessary
downstream processing required targeting specific applications.

282
Acid value is a common wet technique used to determine the amount of carboxylic
acid groups in the sample. In the case of lipids, this would determine the amount of
fatty acids in a complex mixture or any di-acids if present. For the cereal straw waxes,
only fatty acids were identified and this is a useful and quick method to determine the
level of acids in the extracts and compare them with the existing commercial waxes.
The acid number was determined using the method described in Section 6.4.3 which
represents the mass of potassium hydroxide required to neutralise 1 g of straw wax.
Saponification value is another common wet technique used by lipid chemists to
determine the amount of potassium hydroxide required to saponify 1 g of wax. In the
case of triglycerides, glycerol is also formed in the saponification process as well as
the potassium salt. In straw waxes, both glycerides and wax esters are present which
will undergo saponification and the saponification number is calculated using the
method described in Section 6.4.4. No steryl esters or diesters were found using the
GC method which would analyse molecules up to about 6000 KI units. It is not clear
whether larger molecules such as di-esters would also undergo saponification. Di-
esters such as steryl di-esters, diol di-esters and hydroxyacid diesters have been
reported to be present in lanolin and these are very large molecules that cannot be
detected using a standard GC method.321
Table 5.9 shows how the acid and
saponification values for the three cereal waxes from the scale up trial compared to
four existing commercial waxes. The acid value for commercial waxes tends to be
lower though the cereal straw waxes do have similar acid values to beeswax. The acid
value can be reduced depending on demand by fractionating the fatty acids out. In a
separate experiment described in Section 5.2.4, the wheat straw wax was saponified
into two different fractions: fatty alcohols and fatty acids. The fatty alcohol fraction
that contains no fatty acids has an acid value of just 1 and the acid value for the fatty
acids containing fraction is 165. From this experiment, it can be shown that
downstream processing such as saponification can reduce the acid levels. The
saponification values of the straw waxes fit well in the current commercial waxes and
no modification is required.

283
Table 5.9: Acid value and saponification value for commercial and cereal straw
waxes113, 116
Waxes (mg of KOH per g)
Acid value Saponification value
Lanolin 7 - 15 100 - 110
Beeswax 17 - 36 90 - 149
Candelilla wax 12 - 22 43 - 65
Carnauba wax 2.9 - 9.7 79 - 95
Wheat straw wax 30.8 89.3
Barley straw wax 28.1 95.4
Oat straw wax 34.5 97.2
The drop point of the straw waxes was also measured prior to lip-stick formulation
trials which will be carried out by Croda Europe Limited. The drop point of a wax is
the temperature at which the solid wax turns into a liquid and drips from the
experimental cup described in Section 6.4.5. The temperature suggests the change in
solid to liquid phase of a wax and this is especially critical in specific formulations
such as lip-sticks. According to Croda’s recommendation, for a lip-stick
formulation, the wax must have a drop point of around 343 - 358 K. A basic lip-
stick formulation typically consists of a combination of waxes for different
functionality. The harder waxes such as candelilla wax within the formulation can
offer the wax its structure and the softer waxes such as lanolin would give the lip-
stick its emollient and the body temperature melting point. Table 5.10 shows the
drop points for the cereal straw waxes as well as the fatty alcohols and fatty acids
from the wheat saponification. It was found that the drop points for the cereal straw
waxes were all at around 337 K. Candelilla and carnauba waxes are commonly used
as a structural ingredient in lip-sticks and showed the appropriate drop point for
formulation. The wheat alcohols fraction from the saponification showed a
promising drop point as the lower melting point acids have been removed. However,
other physical properties such as colour must be determined in order to proceed to
the formulation phase.
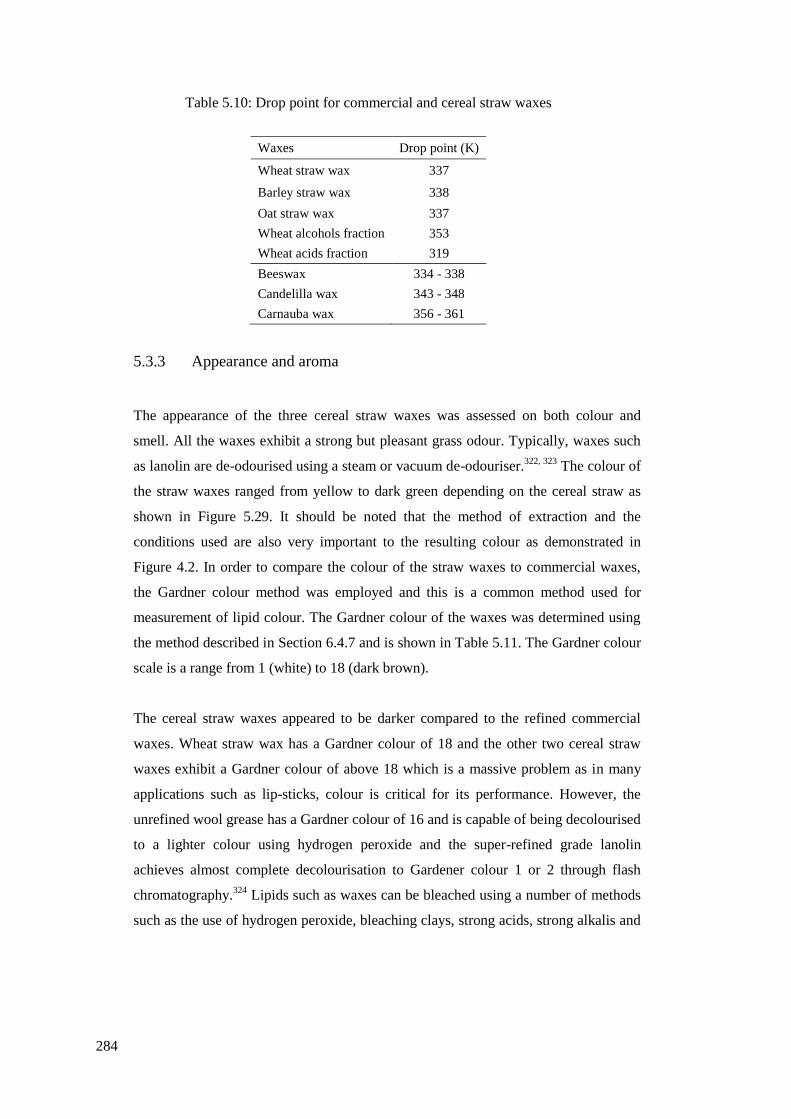
284
Table 5.10: Drop point for commercial and cereal straw waxes
Waxes Drop point (K)
Wheat straw wax 337
Barley straw wax 338
Oat straw wax 337
Wheat alcohols fraction 353
Wheat acids fraction 319
Beeswax 334 - 338
Candelilla wax 343 - 348
Carnauba wax 356 - 361
5.3.3 Appearance and aroma
The appearance of the three cereal straw waxes was assessed on both colour and
smell. All the waxes exhibit a strong but pleasant grass odour. Typically, waxes such
as lanolin are de-odourised using a steam or vacuum de-odouriser.322, 323
The colour of
the straw waxes ranged from yellow to dark green depending on the cereal straw as
shown in Figure 5.29. It should be noted that the method of extraction and the
conditions used are also very important to the resulting colour as demonstrated in
Figure 4.2. In order to compare the colour of the straw waxes to commercial waxes,
the Gardner colour method was employed and this is a common method used for
measurement of lipid colour. The Gardner colour of the waxes was determined using
the method described in Section 6.4.7 and is shown in Table 5.11. The Gardner colour
scale is a range from 1 (white) to 18 (dark brown).
The cereal straw waxes appeared to be darker compared to the refined commercial
waxes. Wheat straw wax has a Gardner colour of 18 and the other two cereal straw
waxes exhibit a Gardner colour of above 18 which is a massive problem as in many
applications such as lip-sticks, colour is critical for its performance. However, the
unrefined wool grease has a Gardner colour of 16 and is capable of being decolourised
to a lighter colour using hydrogen peroxide and the super-refined grade lanolin
achieves almost complete decolourisation to Gardener colour 1 or 2 through flash
chromatography.324
Lipids such as waxes can be bleached using a number of methods
such as the use of hydrogen peroxide, bleaching clays, strong acids, strong alkalis and

285
activated carbon.325, 326, 327, 328
It would be interesting to test these bleaching methods
on the straw waxes and observe the decolourisation process.
Figure 5.29: Production scale cereal straw waxes (originally in colour)
Table 5.11: Gardner colour for commercial and cereal straw waxes
Waxes Gardener colour
Lanolin 9
Beeswax 3
Candellila wax 9
Carnauba wax 9
Wheat straw wax 18
Barley straw wax > 18
Oat straw wax > 18
Hydrogen peroxide bleaching was carried out on the wheat straw wax using a Croda
in-house method (confidential) that is currently used in the decolourisation of
lanolin. Unfortunately, no decolourisation occurred and the colour of the wax
remained the same. Barley straw wax was super-refined by Croda Japan Limited
using the same flash chromatography method (confidential) being carried out on
lanolin commercially to produce super-refined lanolin for applications such as
nipple creams. Figure 5.30 shows a large improvement in the colour of the barley
straw wax as it changed from a Gardner colour of over 18 to 13 with 85% yield.
Wheat straw wax
Barley straw wax
Oat straw wax
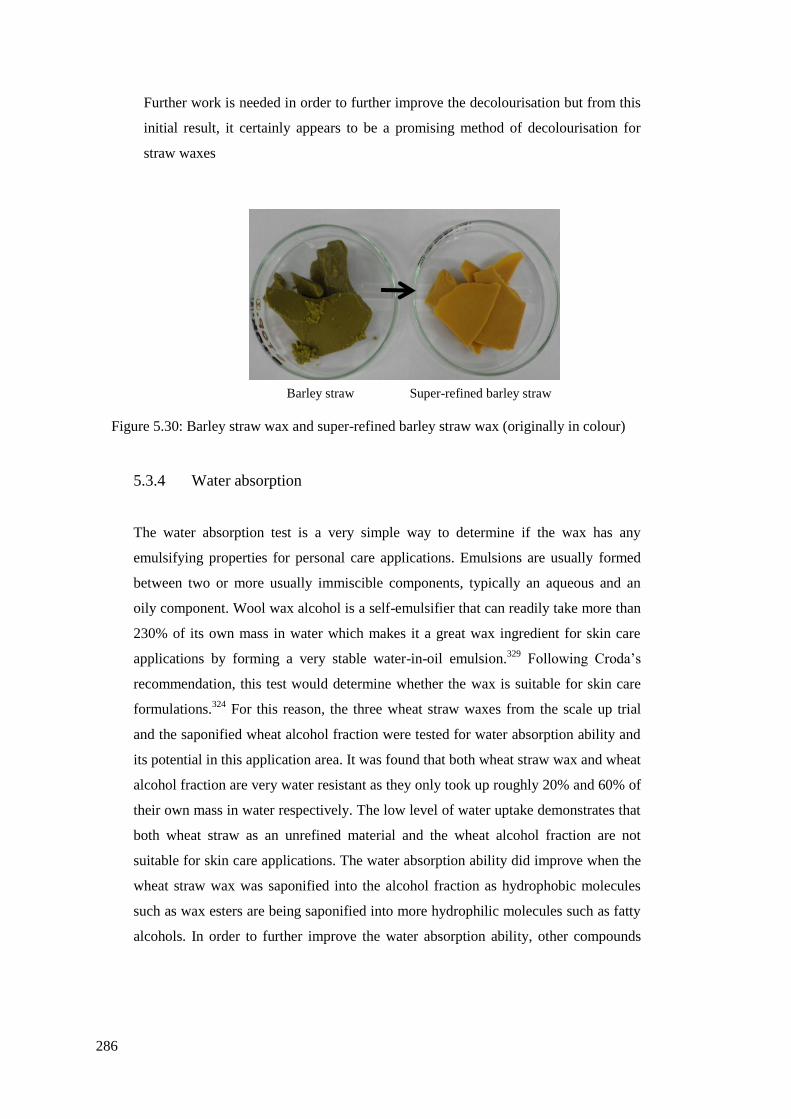
286
Further work is needed in order to further improve the decolourisation but from this
initial result, it certainly appears to be a promising method of decolourisation for
straw waxes
Figure 5.30: Barley straw wax and super-refined barley straw wax (originally in colour)
5.3.4 Water absorption
The water absorption test is a very simple way to determine if the wax has any
emulsifying properties for personal care applications. Emulsions are usually formed
between two or more usually immiscible components, typically an aqueous and an
oily component. Wool wax alcohol is a self-emulsifier that can readily take more than
230% of its own mass in water which makes it a great wax ingredient for skin care
applications by forming a very stable water-in-oil emulsion.329
Following Croda’s
recommendation, this test would determine whether the wax is suitable for skin care
formulations.324
For this reason, the three wheat straw waxes from the scale up trial
and the saponified wheat alcohol fraction were tested for water absorption ability and
its potential in this application area. It was found that both wheat straw wax and wheat
alcohol fraction are very water resistant as they only took up roughly 20% and 60% of
their own mass in water respectively. The low level of water uptake demonstrates that
both wheat straw as an unrefined material and the wheat alcohol fraction are not
suitable for skin care applications. The water absorption ability did improve when the
wheat straw wax was saponified into the alcohol fraction as hydrophobic molecules
such as wax esters are being saponified into more hydrophilic molecules such as fatty
alcohols. In order to further improve the water absorption ability, other compounds
Barley straw
wax
Super-refined barley straw
wax

287
such as n-alkanes present in the wheat straw wax that would have a water repelling
effect, need to be fractionated off so that the wax would be more hydrophilic. This
would not only improve its water absorbing property, it would also add value to the
wax by creating an alkane-rich fraction. The waxes will be tested for home care
applications such as furniture wax polishes instead.
5.4 Applications and costs
5.4.1 Potential applications
Cereal straw waxes contain a complex mixture of molecules which can be separated
and refined for potentially important applications. From the literature review of
existing commercial waxes, it was apparent that waxes are not a single group of
compounds but a blend of different wax groups at different concentrations. It is this
varied composition that give its unique physical properties that are especially
favourable for specific applications. For example one of the biggest wool wax
producers, Croda Europe Limited, refined wool grease to lanolin alcohols so it is high
in fatty alcohols and sterols to give it its extra emollient and emulsification properties
in cosmetics applications. After the identification of the crude cereal waxes, it can be
concluded that there are a mixture of both aliphatic and cyclic compounds with good
opportunities for many applications. However, it is important to consider both single
groups of compounds and a blend of compounds in order to achieve its functionality
to fit with existing applications. Table 5.12 summarises the potential applications for
the different wax groups identified in cereal straw waxes. The potential applications
were discussed in more details in Chapter 2.
One of the biggest global wax applications is candles with over 450,000 tonnes of
wax used solely for candle production in the USA.124
A sample of barley straw wax
from the scale up trial was tested for its potential in candles applications in
collaboration with Oakbank Products. The congealing point was 329 – 330 K which
was too low and unsuitable for use and casting solid pillar candles and in addition the
hardness of the wax was found to be unsuitable for casting.330
The congealing point
also showed that the wax has a melting point slightly too high to use in container
candles which means that the crude wax has properties in between that required for

288
container wax and casting wax but from the testing, it was concluded that the barley
straw wax was more suited for container wax. The next stage of the trials would be to
input additives into the crude wax and carry out performance tests.330
However, in
order to keep the products as natural as possible, bio-derived ingredients would be
considered first. It would be interesting to incorporate some wheat alcohols and
observe the effects of melting point.
Table 5.12: Potential applications for different wax groups identified in cereal straw
waxes
Wax group Top compounds Potential applications
Fatty acids
Hexadecanoic acid (C16:0), octadecadienoic acid
(C18:2), octadecenoic acid (C18:1), octadecanoic
acid (C18:0)
Soaps, detergents, lubricating
grease/ oils, cleaning compounds/
polishes167, 168
Hydrocarbons
Nonacosane (C29), hentriacontane (C31)
Paraffine waxes, coatings170
Fatty alcohols
Octacosanol (C28)
Surfactants, cosmetics167, 331
Aldehydes
Octacosanal (C28)
Food flavouring181
Wax esters
Octacosanyl hexadecanoate (C28:C16),
octacosanyl octdecanoate (C28:C18)
Hard wax polishes, coatings,
cosmetics, plasticisers182
Sterols
β-Sitosterol, stigmasterol, campesterol
Nutrient supplements, cosmetics,
surfactants332
β-Diketones
14, 16-hentriacontanedione (C31)
Metal chelators333
From the water absorption tests, the waxes were shown to have great water-proofing
properties so for this reason, the samples of wheat, barley and oat are currently
waiting to be tested by the home care applications team in Croda Europe Limited for
applications such as water-proofing furniture polishes and coatings.324
Also for the
same reason, the company has concluded that the crude cereal waxes are unsuitable
for skin care creams to substitute current commercial products such as lanolin
alcohols.324
5.4.2 Economic considerations
The use of CO2 as an extraction method is well-known for its environmental benefits
but this green alternative technology does struggle to replace some of the existing

289
processes and one of the main reasons is due to its high capital and operating costs.
With scCO2 systems running at high pressure, large energy consumption is inevitable
and is reflected in high energy costs. This is one of the biggest arguments against
using scCO2 as a commercial process for extraction even though now almost all the
CO2 extraction plants are designed to deliver optimum performance and reduced
energy consumption. One major concern with extraction of cereal straw waxes is that
the bulk density of the raw material is low so extra costs would be added to increase
the bulk density of the biomass so increasing the volume of feedstock per batch
extraction. However, if the raw materials are too dense, diffusion problems might
arise and CO2 would struggle to penetrate through the cereal straw pellets resulting in
low extraction efficiency. The right balance between densification and extraction
efficiency must be achieved to result in the most economic extraction process. To
date, all the commercial extraction plants are run on batch processes even though
continuous extraction would offer a great energy saving so the high throughput batch
processes must be taken into account.334
Brunner showed that by switching batch to
continuous processes, the operation costs could be reduced by about 30%.334
As the
current commercial extractors are all batch processes, it is important to design the
plant to allow easy loading and unloading of the materials from possibly multiple
extractors. The operating costs of a supercritical CO2 extraction plant are inversely
proportional to the size of the plant and these can be broken down to eight different
categories as indicated in Figure 5.31. Labour was shown to be the main operating
cost as skilled engineers are required to operate high pressure plants.
As well as the consideration of the process itself, a crucial point to be noted is that
even though cereal straw is an agricultural by-product and that there is excess quantity
with no current commercial uses, the raw materials are not free. Waste generated from
one process is essentially a new feedstock for another so fitting this idea into the
straw-based bio-refinery, the costs of the net raw materials would be lowered.
Extraction can be carried out using virgin cereal straw and any de-waxed straw
residues could potentially have a range of applications such as fuels.19
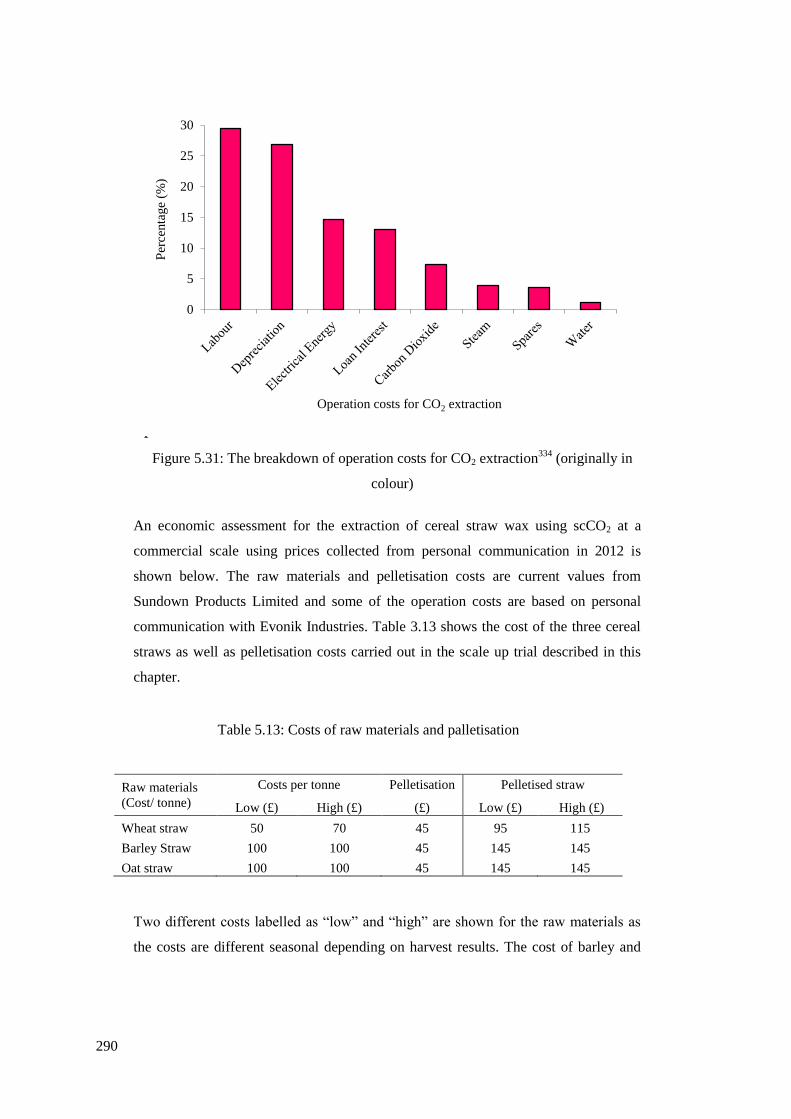
290
F
Figure 5.31: The breakdown of operation costs for CO2 extraction334
(originally in
colour)
An economic assessment for the extraction of cereal straw wax using scCO2 at a
commercial scale using prices collected from personal communication in 2012 is
shown below. The raw materials and pelletisation costs are current values from
Sundown Products Limited and some of the operation costs are based on personal
communication with Evonik Industries. Table 3.13 shows the cost of the three cereal
straws as well as pelletisation costs carried out in the scale up trial described in this
chapter.
Table 5.13: Costs of raw materials and palletisation
Raw materials
(Cost/ tonne)
Costs per tonne Pelletisation Pelletised straw
Low (£) High (£) (£) Low (£) High (£)
Wheat straw 50 70 45 95 115
Barley Straw 100 100 45 145 145
Oat straw 100 100 45 145 145
Two different costs labelled as “low” and “high” are shown for the raw materials as
the costs are different seasonal depending on harvest results. The cost of barley and
0
5
10
15
20
25
30
Per
centa
ge
(%)
Operation costs for CO2 extraction
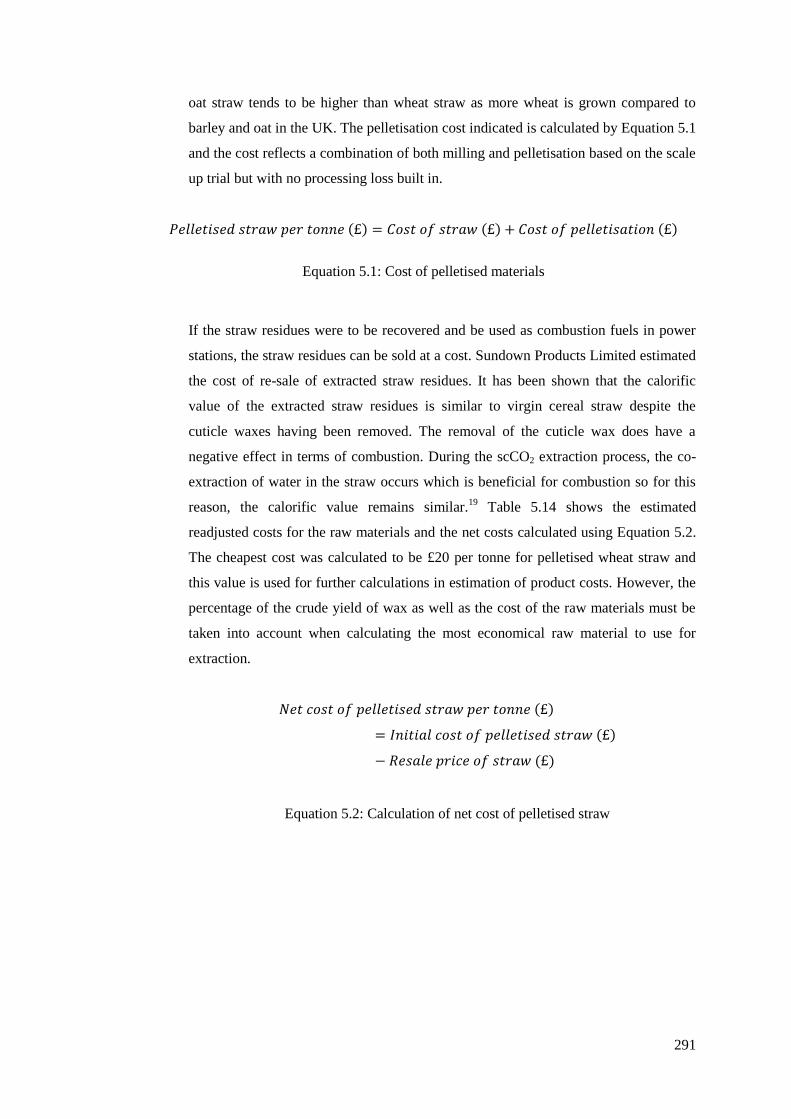
291
oat straw tends to be higher than wheat straw as more wheat is grown compared to
barley and oat in the UK. The pelletisation cost indicated is calculated by Equation 5.1
and the cost reflects a combination of both milling and pelletisation based on the scale
up trial but with no processing loss built in.
Equation 5.1: Cost of pelletised materials
If the straw residues were to be recovered and be used as combustion fuels in power
stations, the straw residues can be sold at a cost. Sundown Products Limited estimated
the cost of re-sale of extracted straw residues. It has been shown that the calorific
value of the extracted straw residues is similar to virgin cereal straw despite the
cuticle waxes having been removed. The removal of the cuticle wax does have a
negative effect in terms of combustion. During the scCO2 extraction process, the co-
extraction of water in the straw occurs which is beneficial for combustion so for this
reason, the calorific value remains similar.19
Table 5.14 shows the estimated
readjusted costs for the raw materials and the net costs calculated using Equation 5.2.
The cheapest cost was calculated to be £20 per tonne for pelletised wheat straw and
this value is used for further calculations in estimation of product costs. However, the
percentage of the crude yield of wax as well as the cost of the raw materials must be
taken into account when calculating the most economical raw material to use for
extraction.
Equation 5.2: Calculation of net cost of pelletised straw

292
Table 5.14: Estimated net costs for pelletised raw materials
Power station Low (£) High (£)
Costs of straw (£/t) include
repelletisation 75 85
Raw materials (Cost/ tonne) Pelletised straw
Net cost of pelletised straw after
re-sale
Low (£) High (£) Low (£) High (£)
Wheat 95 115 20 30
Barley 145 145 60 70
Oat 145 145 60 70
As discussed before there is a high operational cost when dealing with high pressure
extractors and the costs of extraction is scale dependent. Table 5.15 shows a summary
of the estimated costs for three different CO2 scale with the less than 10 tonnes scale
values based on the scale up trial carried out in collaboration with Evonik Industries
including the costs of CO2. It is noted that the displayed currency is in Euros (€) as the
scale up trial was carried out in Germany. Typically, the cost of food grade CO2 is
approximately £90 per tonne but CO2 can be easily recompressed, recycled and reused
with only less than 0.03% of CO2 being lost during the decompression stage.236
Table 5.15: Costs for CO2 extraction236
CO2 scale Cost/kg of straw for extraction (€) Crude yield (€/ kg of wax)
1% 2% 3%
< 10 tonnes (Scale up trial) 3 300 150 100
> 50 tonnes 1 100 50 33.33
10,000 tonnes (own plant) 0.4 40 20 13.33
Note: tonnes in CO2 scale refer to volume of biomass
As shown previously the crude yield ranged from 0.8 to 1.5% in the scale up trial and
is dependent on the raw materials used so therefore, the costs based on a crude yield
of 1 to 3% were calculated. From the optimisation work shown in Chapter 4, it was
apparent that higher yields can be achieved compared to what were reported in this
chapter. The operating pressure was only 26 MPa so if this can be increased then there
would be an increase in crude yield. However, it is important to note that increased
pressure would lead to higher energy costs so it is important to find the right balance

293
between cost and extraction conditions. Other expenditure such as de-watering
processing cost, plant maintenance cost, transportation costs etc. are not included in
the calculations. Results showed that wheat straw has the lowest wax yield but it is the
cheapest source of straw in the UK which suggests pushing wheat straw wax yield to
3% would be very challenging without any plant breeding. The best case scenario is
that cheap wheat straw was used as the feedstock with a high 3% crude wax yield in a
10,000 tonnes CO2 plant, this would result in a production cost of just over £12 per kg
of wax. Currently, based on figures from Croda Europe Limited the production cost
for the finished product lanolin is about £4 per kg and the most expensive super
refined lanolin is about £11 - 12 per kg. There is a large difference in the two prices
with straw wax being at least three times more expensive than existing commercial
waxes. To make the prices more comparable and for the new straw wax to be able to
compete with the existing commercial waxes, the yield must be increased to about 8%
which would give an approximately £4 per kg of wax. From this economic
assessment, it can be concluded currently; the cost of extraction of wheat straw wax is
too high and must be reduced in order to gain more industrial interest as well as
further scale up trials.
There are a number of ways that the cost of production of straw wax can be reduced.
An obvious way is by increasing the current % crude yield and this may be achieved
by plant breeding of cereal crops and controlled growing conditions. As the cost of
scCO2 extraction is inversely proportional with size of CO2 plant, the size of plant
may need to be increased if possible. If the cost cannot be reduced then it is important
to find a unique high value application for the new product thought research and
development.
5.5 Conclusion and future work
As scCO2 can co-extract the water molecules within the biomass, the first intial processing
step after the production scale extraction is the removal of co-extracted water. If a plant was
to be built specially for the extraction of waxes from biomass, the removal of water should
be incorporated into the plant design to increase the efficiency. The use of scCO2 as part of a
extraction and fractionation as one step process have been demonstrated successfully but
294
more work is needed to optimise the fractionation conditions to give a series of wax products
with different chemical compositions and physical properties for a variety of applications.
As shown repeatedly that there are still unidentified compounds in the extracts that are too
involatile to analyse by simply using GC. Wheat and oat straw waxes were also successfully
fractionated by GPC in order to seaprate the high molecular weight compounds for further
investigation. It was found that there were a significant number of compounds with high
molecular weight (iup to 1500 Da). The molecular weight of these large molecules, believed
to be esters from the IR analysis, were determined using MALDI-TOF MS. Further method
development is needed in order to accurately analyse these wax esters succesfully each time.
This demonstrated that there is an interesting high molecular weight wax fraction. These
wax compounds could lead to further new applications and raise the value of the products.
Further work is needed for the saponified wax extracts to be analysed on GC-MS for full
identification. Other molecules such as phenolics could also be presented in these extracts so
further work is needed to fully analyse the complete extracts.
The physical properties of the straw waxes from different scCO2 conditions and scale up
trials were explored and this included appearance, melting point, acid value, saponification
value, water absortion, drop point and melting points. These physical properties were shown
to be highly influenced by the chemical compositions of the wax which are determined by
the extraction conditions. These properties were assessed and compared with some
commercial waxes in order to understand how these new renewable straw waxes can fit in
the current market. The chemical compositions were correlated with some of the physical
properties such as melting points to help understand how to tailor the wax properties by
extraction conditions. The straw waxes are strongly coloured hard waxes with high melting
points and no water absorption ability so therefore it is not ideal for cosmetics applications
in its crude form but due to high hydrophobicity, it could be ideal for coatings and polishes
applications. Further downstream processing steps e.g.: decolourisation are requried to tune
the wax products for specific applications. More work is needed on investigation of poetntial
applications of these valuable waxes by carrying out some downstream proceses and
formulations tests.
The use of supercritical CO2 as the extraction method is an expensive technology due to its
high operating pressure so an economic assessment was carried out for the extraction of
straw waxes based on the scale up trials. The costs of the scCO2 extraction decreases as the
size of the extractor increases so the absolute minimum costs was calculated for the use of a

295
10,000 tonnes extractor. A range of extraction yields and biomass costs were used in order to
achieve the minimal cost and it was calculated to be about £12 per kg of straw wax. This
calculated value was based on a high yield (3%), the assumption of low biomass costs and
no further downstream processing and this was still signifcantly higher than exisiting costs
for commercial waxes such as lanolin which can be obtained for £4 per kg. In summary,
there is a huge potential in the extraction of straw to gain valuable waxes for the growing
wax market. Extraction of cereal straw waxes using scCO2 in industrial scale were proved to
be a success but further work is needed on optimisation of conditions and the products
resulted showed promising physical properties which can lead to a wide range of industrial
applications. The extraction of straw presents an interesting alternaive wax and demonstrates
to fit well within the straw bio-refinery concept by adding value to these low cost, high
volume agricultural by-products. However, despite the success of the extraction trials and
potential applications, the costs of production of cereal straw waxes are significantly higher
than the existing commercial waxes and therefore it will be difficult to compete in the
current market. In order to commercialise these cereal straw waxes, the only solutions are to
minimise the costs further by increasing the extraction yields. As technology develops, the
cost of high pressure extractors will decrease and identify unique physical properties and
molecules that currently do not exist in the present wax market.

296

Chapter 6 Experimental Procedures


299
6. EXPERIMENTAL PROCEDURES
6.1 Materials and reagents
Wheat husk and straw (Claire 07, 08 and Viscount 09) (Triticum aestivum) were supplied by
Park Farm in Castle Howard. Park Farm is a part of the leading farming company, Velcourt
Limited. Wheat straw (Hereward 08, Oakley 08 and Charger 08), barley straw (variety:
Carat 08 and Optic 08) (Hordeum vulgare) and low erucic acid oilseed rape straw (Brassica
napus) were supplied by A & A Services, in Cliffe, Selby. Oat Services Limited supplied a
mixed variety of oat straw and oat husk. Sunflower husk, straw and capitulum (Helianthus
annuus) were provided by Auvergne Trituration. The high erucic acid oilseed rape straw
(Brassica napus) and miscanthus straw (Miscanthus giganteus) were supplied by Charles
Jackson & Co Limited. Wheat, barley and oat straw (mixed varieties 09) were supplied and
pelletised by Sundown Products Ltd.
Organic solvents dichloromethane, heptane, ethanol, diethyl ether, toluene, ethyl acetate,
acetone, 2-MeTHF, THF, chloroform and acetonitrile were all analytical grade > 99% and
were purchased from Fisher Scientific UK Limited. Pesticides grade hexane and
dichloromethane were obtained from Fisher Scientific UK Limited and used for the gel
permeation chromatography. The IMS was provided by Croda International Plc. Carbon
dioxide (> 99.99%), liquid nitrogen, helium, nitrogen and hydrogen were purchased from the
BOC Group. Octacosanol (≥ 99%), stearic acid (~ 95%), oleyl palmitate (~ 99%),
hentriacontane (≥ 99%), 4-nitroaniline ((≥ 99%) and ASTM® D5442 C12-C60 qualitative
retention time mix (containing docosane, dodecane, dotriacontane, eicosane, hexacontane,
hexacosane, hexadecane, hexatriacontane, octacosane, octadecane, pentacontane,
tetracontane, tetracosane, tetradecane, tetratetracontane and triacontane) were purchased
from Sigma-Aldrich UK Limited. Stigmasterol (~ 95%), concentrated nitric acid (67 - 70%),
1 M HCl and 1 M NaOH were obtained from Fisher Scientific UK Ltd. Trans- methyl-β-
styrene (~ 97%) was purchased from Acros Organics. Polystyrene calibration standards of
molecular weight 500 gmol-1
, 1000 gmol-1
, 2000 gmol-1
and 3000 gmol-1
were obtained from
Fluka Limited. Polystyrene calibration standard of molecular weight 2500 gmol-1
was
purchased from Alfa Aesar. Wool grease, Corona 8®, Medilan
®, Medilan Superso JP
®,
Medilan Ultra So®, Coronet
®, Fluilan
® and petroleum jelly
were provided by Croda
Enterprises Limited. The 2 mm borosilicate glass beads, phenolphthalein indicator and
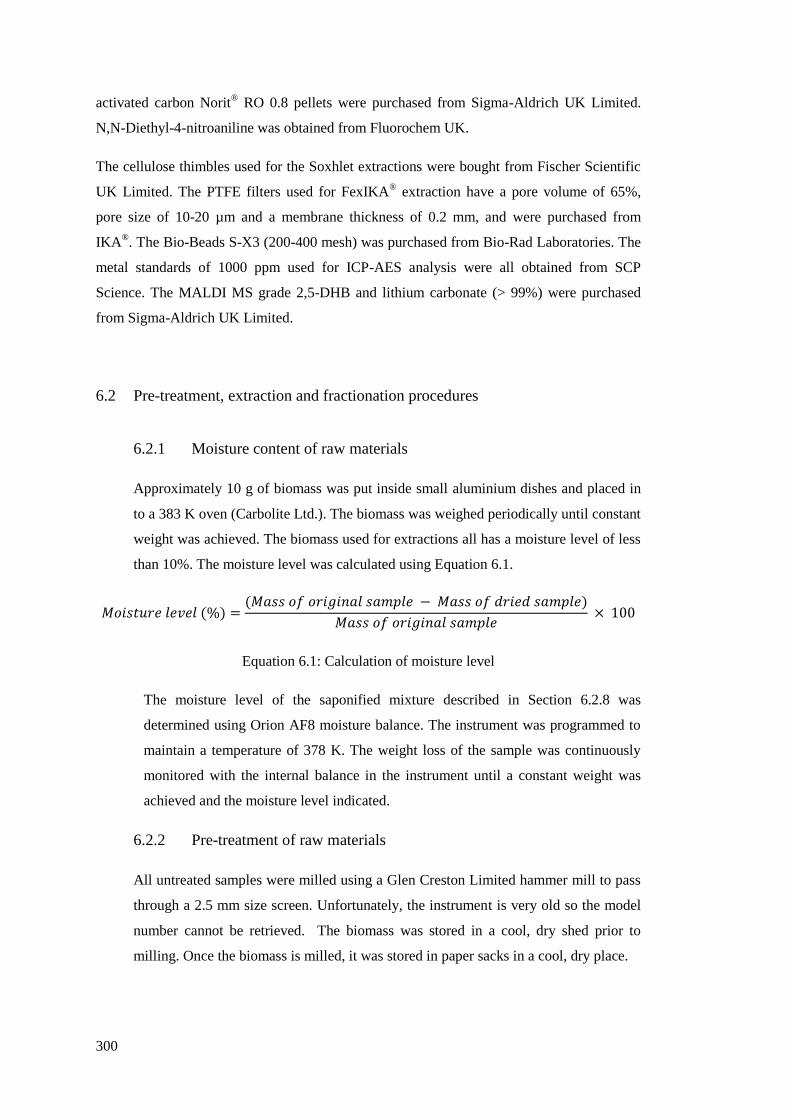
300
activated carbon Norit® RO 0.8 pellets were purchased from Sigma-Aldrich UK Limited.
N,N-Diethyl-4-nitroaniline was obtained from Fluorochem UK.
The cellulose thimbles used for the Soxhlet extractions were bought from Fischer Scientific
UK Limited. The PTFE filters used for FexIKA® extraction have a pore volume of 65%,
pore size of 10-20 µm and a membrane thickness of 0.2 mm, and were purchased from
IKA®. The Bio-Beads S-X3 (200-400 mesh) was purchased from Bio-Rad Laboratories. The
metal standards of 1000 ppm used for ICP-AES analysis were all obtained from SCP
Science. The MALDI MS grade 2,5-DHB and lithium carbonate (> 99%) were purchased
from Sigma-Aldrich UK Limited.
6.2 Pre-treatment, extraction and fractionation procedures
6.2.1 Moisture content of raw materials
Approximately 10 g of biomass was put inside small aluminium dishes and placed in
to a 383 K oven (Carbolite Ltd.). The biomass was weighed periodically until constant
weight was achieved. The biomass used for extractions all has a moisture level of less
than 10%. The moisture level was calculated using Equation 6.1.
Equation 6.1: Calculation of moisture level
The moisture level of the saponified mixture described in Section 6.2.8 was
determined using Orion AF8 moisture balance. The instrument was programmed to
maintain a temperature of 378 K. The weight loss of the sample was continuously
monitored with the internal balance in the instrument until a constant weight was
achieved and the moisture level indicated.
6.2.2 Pre-treatment of raw materials
All untreated samples were milled using a Glen Creston Limited hammer mill to pass
through a 2.5 mm size screen. Unfortunately, the instrument is very old so the model
number cannot be retrieved. The biomass was stored in a cool, dry shed prior to
milling. Once the biomass is milled, it was stored in paper sacks in a cool, dry place.

301
The three cereal straws supplied by Sundown Products Limited were milled using an
industrial hammer mill with a screen size of 8 mm to fine particle size. It was then
conditioned by evenly adding approximately 2 - 5% water. This is to lubricate the
straw for pelletisation. The milled straw is then pelletised using a pellet press fitted
with a 6 mm ring die. All the milling and pelletisation were carried out using the
instruments Swiss Combi 44K and La Meccania 935. The straw pellets were cooled
and air-dried prior to packing. The miscanthus straw was densified as briquettes for
coal co-firing by Charles Jackson Limited but the details of the procedure were unable
to obtain.
Figure 6.1: Alternative pre-treatment processes: milled, chopped, pellets and briquettes
(originally in colour)
6.2.3 Soxhlet extraction
Prior to extraction, the raw materials were pre-treated as described in Section 6.2.2.
About 13 g of the processed biomass was extracted with 300 mL of selected solvent in
a standard Soxhlet extraction apparatus for five hours as shown in Figure 2.1. The
exact temperature for the Soxhlet extraction was monitored using a Radleys Discovery
Technologies 2006T thermocouple periodically and an average of at least three
readings were taken. The recovered extracts were immediately filtered using fluted
filter paper to remove any straw residues and concentrated to dryness in vacuo. In
order to eliminate moisture and traces of residual solvent, extracts were air-dried at
room temperature. The extracts were weighed periodically until constant weight was
achieved.
6.2.4 FexIKA® extraction
The FexIKA®
Vario Control Series Extractor was the chosen extraction method for the
screening stage as shown in Figure 2.2. FexIKA®
Vario Control Series Extractor is
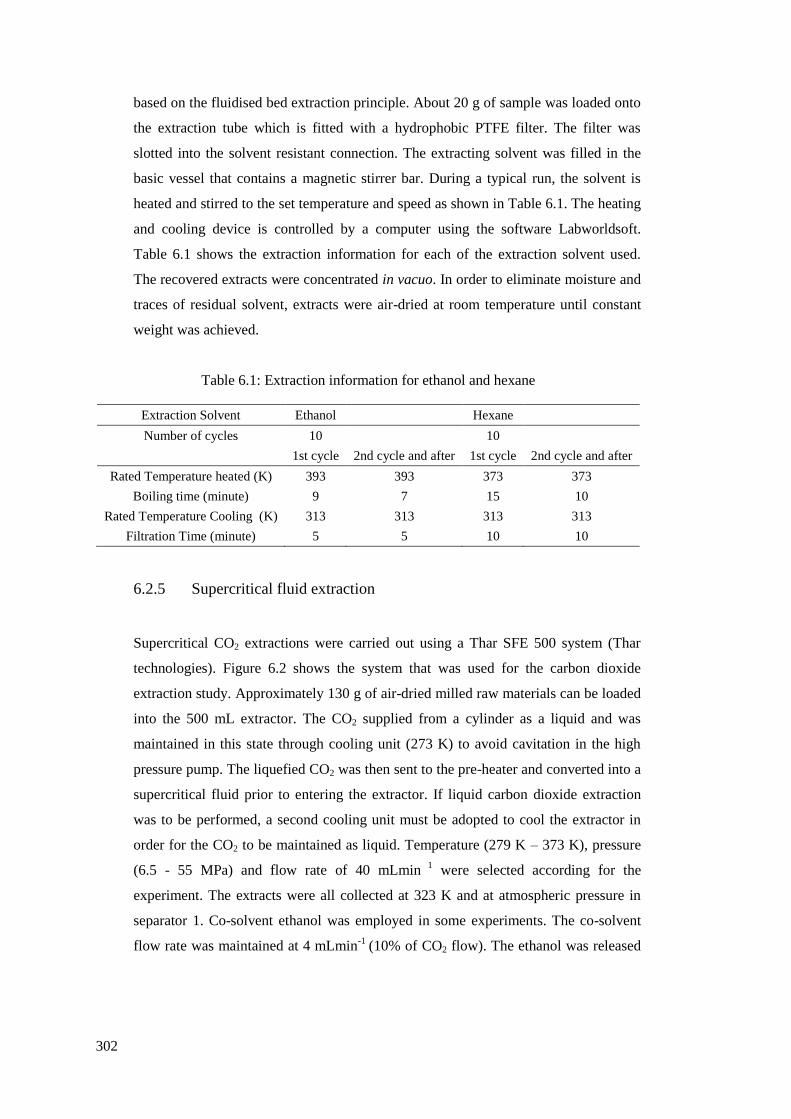
302
based on the fluidised bed extraction principle. About 20 g of sample was loaded onto
the extraction tube which is fitted with a hydrophobic PTFE filter. The filter was
slotted into the solvent resistant connection. The extracting solvent was filled in the
basic vessel that contains a magnetic stirrer bar. During a typical run, the solvent is
heated and stirred to the set temperature and speed as shown in Table 6.1. The heating
and cooling device is controlled by a computer using the software Labworldsoft.
Table 6.1 shows the extraction information for each of the extraction solvent used.
The recovered extracts were concentrated in vacuo. In order to eliminate moisture and
traces of residual solvent, extracts were air-dried at room temperature until constant
weight was achieved.
Table 6.1: Extraction information for ethanol and hexane
Extraction Solvent Ethanol
Hexane
Number of cycles 10
10
1st cycle 2nd cycle and after 1st cycle 2nd cycle and after
Rated Temperature heated (K) 393 393 373 373
Boiling time (minute) 9 7 15 10
Rated Temperature Cooling (K) 313 313 313 313
Filtration Time (minute) 5 5 10 10
6.2.5 Supercritical fluid extraction
Supercritical CO2 extractions were carried out using a Thar SFE 500 system (Thar
technologies). Figure 6.2 shows the system that was used for the carbon dioxide
extraction study. Approximately 130 g of air-dried milled raw materials can be loaded
into the 500 mL extractor. The CO2 supplied from a cylinder as a liquid and was
maintained in this state through cooling unit (273 K) to avoid cavitation in the high
pressure pump. The liquefied CO2 was then sent to the pre-heater and converted into a
supercritical fluid prior to entering the extractor. If liquid carbon dioxide extraction
was to be performed, a second cooling unit must be adopted to cool the extractor in
order for the CO2 to be maintained as liquid. Temperature (279 K – 373 K), pressure
(6.5 - 55 MPa) and flow rate of 40 mLmin 1
were selected according for the
experiment. The extracts were all collected at 323 K and at atmospheric pressure in
separator 1. Co-solvent ethanol was employed in some experiments. The co-solvent
flow rate was maintained at 4 mLmin-1
(10% of CO2 flow). The ethanol was released
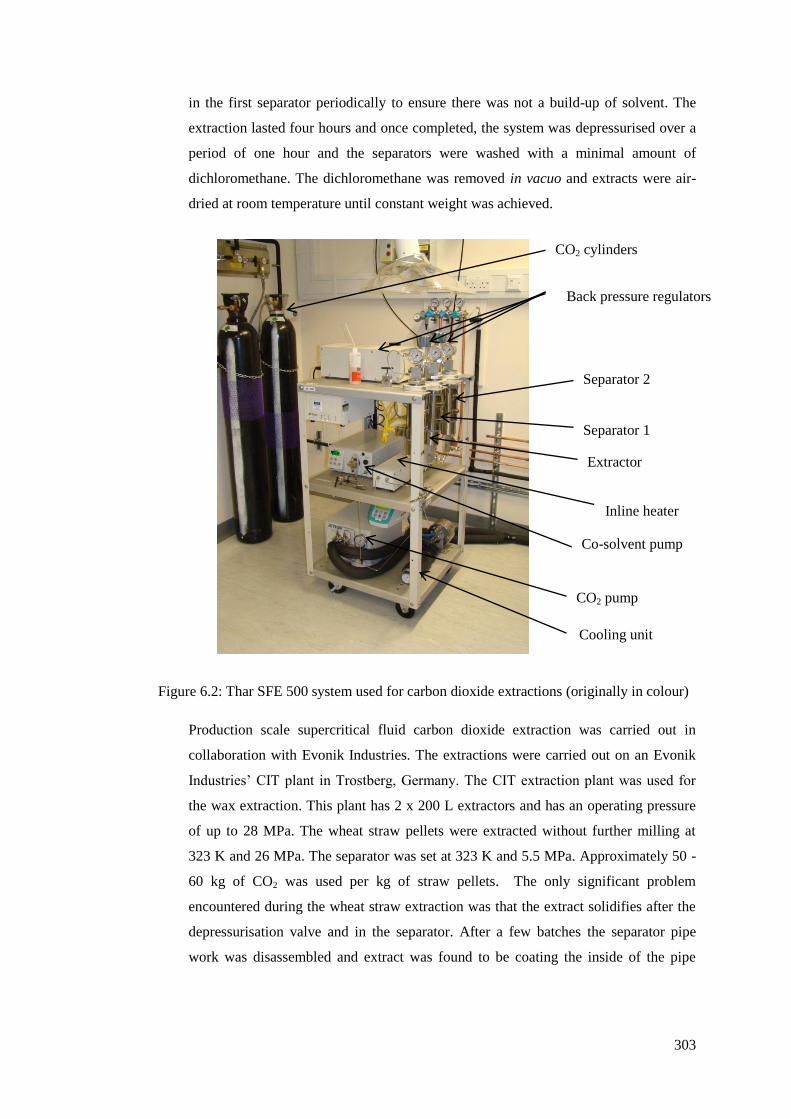
303
in the first separator periodically to ensure there was not a build-up of solvent. The
extraction lasted four hours and once completed, the system was depressurised over a
period of one hour and the separators were washed with a minimal amount of
dichloromethane. The dichloromethane was removed in vacuo and extracts were air-
dried at room temperature until constant weight was achieved.
Figure 6.2: Thar SFE 500 system used for carbon dioxide extractions (originally in colour)
Production scale supercritical fluid carbon dioxide extraction was carried out in
collaboration with Evonik Industries. The extractions were carried out on an Evonik
Industries’ CIT plant in Trostberg, Germany. The CIT extraction plant was used for
the wax extraction. This plant has 2 x 200 L extractors and has an operating pressure
of up to 28 MPa. The wheat straw pellets were extracted without further milling at
323 K and 26 MPa. The separator was set at 323 K and 5.5 MPa. Approximately 50 -
60 kg of CO2 was used per kg of straw pellets. The only significant problem
encountered during the wheat straw extraction was that the extract solidifies after the
depressurisation valve and in the separator. After a few batches the separator pipe
work was disassembled and extract was found to be coating the inside of the pipe
Separator 2
Separator 1
Extractor
Co-solvent pump
CO2 pump
CO2 cylinders
Back pressure regulators
Inline heater
Cooling unit

304
work which severely restricted the flow. To overcome this problem, a ratio of 0.7- 1.5
parts of rapeseed oil was added as carrier oil. This was injected into the high pressure
line between the extractor and separator. As the addition of carrier oil is considered
undesirable, the temperature of the extractor and separator was raised to 343 K for
other batches so the wax would be melted when separated.
Pure wax extracts were melted using a large stainless steel pot on a hot plate. The wax
extracts were stirred using a stainless steel ladle periodically to increase heat transfer
and avoid burning. The temperature of melting wax was measured and recorded to be
about 348 K. The water from the melted wax was separated off leaving a water-free
wax extract. The wax extracts were stored in freezer to avoid oxidation and
degradation.
6.2.6 Purification and fractionation of wax extracts
Approximately 0.1 g of solvent extracts was dissolved in 20 mL of DCM and the
same volume of de-ionised water was added to the solution. The bi-phasic solutions
were inverted a few times and pressure was released periodically. The aqueous wash
was repeated two times (2 x 20mL) and the total aqueous solutions were combined
and washed with 2 x 20 mL of DCM. The DCM and aqueous washes were combined
and the DCM fractions dried in vacuo.
Supercritical CO2 fractionations were carried out using a Thar SFE 500 system (Thar
technologies) as shown in Figure 6.4. The waxes from the production scale extraction
were loaded onto 2 mm borosilicate glass beads for the fractionation. The waxes were
first melted on a 348 K hot plate and were then diluted with an equal volume of
dichloromethane. The wax coated glass beads in solvent were evaporated to dryness in
vacuo. The sample was spinning continuously whilst evaporating the dichloromethane
in vacuo to ensure the wax was loaded on the glass beads evenly.
The 15 - 17% wax coated glass beads were loaded onto the extractor. The extractor
was set at 323 K and 35 MPa; separator 1 was at 308 K and 7.5 MPa and the separator
2 was 323 K and at atmospheric pressure. The CO2 flow rate remained constant at 4
mLmin-1
during the full whole four hours of fractionation time. The system was

305
depressurised and both of the separators were set to 348 K in order to melt and
retrieve the wax fractions.
6.2.7 Saponification
Full saponification of wheat straw wax was carried out using a Croda in-house method
QAP02/19. A solution of 340 g of IMS and 60 g of deionised water was added to
about 460 g of molten wheat straw wax in a 3-necked flask. A condenser,
thermocouple and overhead stirrer were attached to the flask. The solution was
warmed to 333 K and stirred gently whilst the 47% w/v of sodium hydroxide was
being added gradually. The amount of sodium hydroxide added to the mixture was
calculated using Equation 6.2.
Equation 6.2: Calculation for quantity of sodium hydroxide
After the addition, the mixture was continuously refluxed (about 353 K) and stirred
gently for approximately eight hours until the reaction was completed. In order to test
the reaction for completion, a base value was determined using method described in
Section 6.4.9. The base value must be in the range of 0.15 - 25% when completed. If
the free base is lower than 0.15%, a further addition of free base is required. The extra
sodium hydroxide needed was calculated using Equation 6.3.
Equation 6.3: Calculation of extra sodium hydroxide for low base value
The saponified mixture was extracted in batches of approximately 40 g. The moisture
level was determined using the method described in Section 6.2.1. A mixture of 50
mL IMS and 100 mL deionised water was added to the saponified mixture and
warmed to 328 K. The aqueous saponified mixture was extracted using 300 mL warm
hexane (about 323 K) in a separating funnel. The solution was swirled gently by hand

306
and the contents were allowed to come to thermal equilibrium. The funnel was
stoppered and inverted gently and pressure was released frequently.
6.3 Chemical compositions analysis procedures
6.3.1 GC analysis
Approximately 25 mg of the extract was dissolved in 1 mL of solvent and was
analysed using a capillary column ZB-5HT, 30 m x 0.25 mm I. D. X 0.25 µm film
thickness, Phenomenex. A 2 mgmL-1
tetradecane in dichloromethane was made and
used as an internal standard. This solution was used as the 1 mL solvent to make up
the wax samples for quantification analysis. Helium was used as the carrier gas with a
flow rate of 2.2 mLmin-1
in constant flow mode. The oven was temperature-
programmed from 323 K (1 minute hold) to 553 Kat 283 Kmin-1
and from 553 K to
613 K (24 minutes) at 278 Kmin-1
. The injector and the FID were both set at 573 K.
All injections were done manually in splitless mode and 1 µL of sample was injected.
Capillary columns DB-5HT, 6 m x 0.53 mm I.D. x 0.1 μm film thickness (SGE) and
ZB-5 HT, 15 m x 0.25 mm I.D. x 0.25 μm film thickness (Phenomenex) were also
employed in the study. Helium was used as the carrier gas, and the flow rate was 2.2
mLmin-1
in constant flow mode. However, there was a problem in controlling and
maintaining the gas flow with the 6 m column as the required head pressure was lower
than could be controlled accurately. The oven was temperature-programmed from 323
K (one minute hold) to 673 K at 283 Kmin-1
and the samples were injected at 10:1
split mode manually. A HP 6890 gas chromatography was used for all GC analysis.
Quantification of the wax compounds were carried out using a series of authentic
standards. The standards were used as a representative of each wax group (e.g.: stearic
acid was used for all fatty acids quantification). The standards used were stigmasterol
for sterols, hentriacontane for alkanes, octacosanol for fatty alcohols, stearic acids for
fatty acids and stearyl palmitate for wax esters. As there is no authentic standard
available for ß-diketones, the Effective Carbon Number (ECN) method was used to
quantify this group of compounds.208
Tetradecane at a concentration of about 2
cm3mg
-1 was used as an internal standard for the samples and standards.

307
6.3.2 GC-MS analysis
Approximately 30 mg of the extracts were dissolved in 1 mL of solvent
(dichloromethane or ethanol) and the samples analysed using a capillary column DB-
5HT, 30 m x 0.25 mm I.D. x 0.25 μm film thickness; Phenomenex. The oven was
temperature-programmed from 333 K (1 minute hold) to 633 K at 281 Kmin-1
(10
minutes hold). Exactly 0.5 µl of the sample was injected using 10:1 split mode. The
temperature of the injector was 573 K. A Perkin Elmer Clarus 500 Gas chromatograph
with an auto sampler was coupled to a Perkin Elmer Clarus 560S mass spectrometer
for this analysis.
The mass spectrometer was operated in electron impact (EI) mode at 70 eV, a source
temperature of 573 K with the quadruple at 573 K and scanning a mass range of 30 -
1200 amu per second.
6.3.3 Derivatisation for GC analysis
Some wax samples were derivatised in order to increase volatility, improve peak
shape and help in identification. Trimethylsilylation was carried out using 200 µL 1%
bis-(trimethyl)-trifluoro-acetamide and trimethylchlorosilane and 1mL of toluene were
added to about 20 mg of wax sample. The reaction was completed by heating the
sample in a 348 K oven for 30 minutes. The sample was allowed to cool prior to GC
and GC-MS analysis.
6.3.4 FAME analysis
Fatty acid methyl esters (FAME) analysis was carried out by dissolving about 90 mg
of crude extracts in 3 mL of hexane (containing approximately 2 mgmL-1
internal
standard tetradecane) and followed by the addition of 150 µL of 1 N methanolic
sodium hydroxide. The solution was stirred vigorously for 20 minutes and left at room
temperature until the organic and aqueous layers were separated. The organic layer
was analysed using the GC method as above and FAME was quantified using GCMS
and fatty acid as standard.
308
6.3.5 IR analysis
IR spectra were obtained by analysing on a Bruker Vertex 70 fitted with a Specac
Golden Gate ATR. This was controlled by Opus software. The spectrum was scanned
from 4000 - 600 cm-1
. The number of background scans and sample scans were set at
32 and 16 respectively. The resolution was selected to be 2 cm-1
.
6.3.6 GPC analysis
A HP 1090 liquid chromatography with an auto- sampler coupled to a DAD detector
were used for the analysis. A Phenogel 5 µ 100 Å column (300 x 4.6 mm) with a
guard column (Phenogel 5 µ linear/mixed 30 mm x 4.6 mm) was placed in an oven of
313 K and a detector set at 220 - 480 nm. The mobile phase used was THF. The flow
rate was maintained at 0.35 mLmin-1
throughout the isoscratic method. This was
carried out with the help of Peter Hurst (PhD student). The injection volume was 25
µL. The total run time was 20 minutes. The fractions were collected using a
Pharmacia Biotech FRAC-100 sample carousel and programmed to collect the
fractions every 30 seconds. The fractions were reanalysed to clarify the peaks
collected. The fractions containing the same peaks were combined and analysed using
MALDI TOF MS.
The GPC analysis was scaled up using a modified Croda in-house method G17300
which was used as a clean-up method for pesticides analysis. This was carried out
under the guidance of Graham Atkinson of Croda International Plc. A Gilson HPLC
was used to carry out the wax fractionation. The system used consists of Gilson 306
pump, Gilson 402 syringe pump, Gilson 231 XL sample injector, Gilson 206 fraction
collector, Gilson 811C dynamic mixer, Gilson 806 monometric module and Gilson
151 UV-VIS detector. Approximately 5 g of wax was dissolved in 1:1 hexane:
dichloromethane and made to volume in a 50 mL volumetric flask. The wax was
loaded on via a 5 mL sample loop onto a Bio-Beads SX3 resin (300-400 mesh) which
was swollen in 1:1 hexane: dichloromethane then packed in-house into a 600 mm x 25
mm i.d. column.335
The eluting solvent was 1:1 hexane: dichloromethane and was
mixed and pumped at 5 mLmin-1
. The wavelength for the UV-VIS detector was set at

309
254 nm with the eluting wax fractions being collected every minute from 10.5 to 20.5
minutes. The mass balance of the wax fractions were calculated.
6.3.7 MALDI-TOF MS analysis and synthesis of LiDHB matrix
A Bruker Solarix FTICR (Fourier Transform Ion Cyclotron Resonance) 9.4T magnet
with a smart beam 2 Nd:YAG laser (wavelength 355 nm) was used for MALDI TOF
MS analysis under the guidance of Adam Dowle. Laser power used was 20% which
equated to 20 micro joules per shot and the laser focus was set to medium. Each data
file was an accumulation of 4000 laser shots. The matrix used was 2,5-DHB and
lithium DHB. The instrument was calibrated from 900 to 3150 Da using a standard
peptide mixture. The sample acquisition was ranged from 500 to 3000 Da yielding a
target resolution at m/z 800 of 80,000.
The lithium DHB was synthesised using a method reported by Cvačka et al.308
The
matrix was synthesised by dissolving 0.5 g 2,5-DHB in 10 mL deionised water at
313 K. The mixture was gently stirred until complete dissolution then the
stoichiometric amount of lithium carbonate (0.12 g) was added. The pH was checked
and maintained pH 6 to prevent oxidation. Inert gas nitrogen was blown over the
mixture to reduce the solvent level to about 1 mL. The reduced mixture was
crystallised by putting it in a refrigerator of 279 K. White needle-like crystals were
formed, filtered and washed with 1 mL of CHCl3. The sample was dried under
vacuum to remove the residue water. The matrix was prepared at approximately 10
mgmL-1
with 50% acetonitrile, 40% deionised water and 10% of 1% TFA. The wax
samples were prepared at about 30 mgmL-1
in DCM. About 0.5 µL of sample was
spotted on the MALDI plate then 0.5 µL of matrix was added on top of the sample
spot and mixed on plate. The plate was left at ambient temperature so that it was
completely dried prior to analysis.
The lanolin samples were analysed and the fractions were collected. The samples were
initially screened using IR described in Section 6.3.4. The samples which showed
ester groups were then analysed using MALDI-TOF MS.

310
6.4 Physical properties of wax extracts
6.4.1 Decomposition by STA analysis
Simultaneous Thermal Analysis (STA) was carried out using Thermal Sciences STA
625 and the decomposition temperature was determined from the Thermogravimetric
Analysis (TGA) trace. Between 5 – 20 mg of sample was placed into the bottom of an
aluminium pan prior to analysis. The quantity used was dependent on the nature of the
sample. The sample in the aluminium pan was placed in the hanger along with an
empty aluminium pan as the reference. The furnace was then heated from room
temperature (approximately 298 K) to 898 K at 283 Kmin-1
under a constant nitrogen
flow of 50 mLmin-1
.
6.4.2 Thermal transition temperatures by DSC analysis
A TA instruments Q2000 modulated DSC was used to determine the melting point of
the wax extracts. About 10 mg of sample was measured into an aluminium hermetic
pan and an aluminium hermetic lid was crimped on. A TA instruments refrigerated
cooling system 90 was used to cool the sample. The pan containing the sample and an
empty reference aluminium pan were both placed into the test cell automatically. A
typical sample would be equilibrated at 308 K and heated from 308 K up to 393 K at
283 Kmin-1
and held for five minutes, then cooled down to 193 K at 278 Kmin-1
and
again held for five minutes. After holding the cell at a negative temperature, it was
heated from 193 K to 393 K at 278 Kmin-1
and held for five minutes.
6.4.3 Acid value
The acid value was calculated using the Croda in-house method G01102. Depending
on the predicted acid value of the sample, a range of 2 to 10 g of wax samples was
used for the determination. The solvent was prepared by heating equal volumes of
IMS and petroleum spirit (373 K – 393 K) to the boiling point and adding 0.5 mL of
phenolphthalein solution (1 % w/v in IMS). About 25 mL of the pre-made solvent was
used to dissolve the wax sample. This solution was then neutralised with 0.1 M
potassium hydroxide whilst keeping it warm to about 343 K. The contents were

311
titrated using a suitable molarity potassium hydroxide (0.1 M or 0.5 M) until there
was a colour change from colourless to pink. If there was precipitation during the
titration, this was then warmed on the hot plate. The acid value can then be calculated
using Equation 6.4, where T is the volume (mL) of potassium hydroxide required by
the sample, M is the molarity of the sodium hydroxide and W is the weight of the
sample.
Equation 6.4: Calculation of acid value
6.4.4 Saponification value
The saponification value for the wax samples were calculated using the Croda in-
house method G01407. About 2 g of the wax sample was weighed into a conical flask
and exactly 25 mL of 0.5 M ethanolic potassium hydroxide solution is added. The
sample was refluxed for four hours on a sand bath. When the reflux had completed,
approximately 1 mL of phenolphthalein (1% w/v in IMS) was added and swirled
around for titration against 0.5 M HCl. The titration was carried out when the solution
was warm and the titre value was noted down when the end point colour change from
pink to colourless was achieved. For every batch of sample analysed, a blank is made
for result validation. The saponification value can be calculated using Equation 6.5
where B is the volume (ml) of HCl used for the blank, T is the volume (mL) of HCl
used for the wax sample, M is the molarity of the HCl used for the titrations and W is
the weight (g) of the sample.
Equation 6.5: Calculation of saponification number

312
6.4.5 Drop point
Drop point was measured using a Croda in-house method G02805. The drop point is
the temperature at which the first drop of sample falls from the cup under the specified
temperature conditions. This was carried out using a Mettler FP90 thermosystem and
Mettler FP83 HT measurement cell. The wax sample was melted completely and was
poured into the metal cup in excess. The wax was left to fully set and a spatula was
used to scrape off the excess that was overfilling the cup. The wax containing cup was
left overnight at room temperature. The cup was loaded onto the instrument the next
day. The starting and end temperature were set at 308 K and 368 K respectively with a
ramp rate of 273.65 Kmin-1
. The drop point was noted and monitored by the
instrument automatically.
6.4.6 Slip point
The slip point was determined using a Croda in-house method G02900. The wax
sample was melted using a hot plate. Two capillary tubes were inserted into the
molten wax so that the columns of the sample are at least 1 cm long. The wax sample
was then solidified quickly by taking them out of the wax solution and leaving them at
room temperature overnight. The two capillary tubes containing the same wax sample
were attached to a thermometer. The thermometer and the capillary tubes were
clamped in a beaker of water. The water was at room temperature initially and was
heated up gradually at about 274 Kmin-1
and decreased to 273.65 Kmin-1
when close
to melting point. The water was stirred by a magnetic stirrer to ensure the water was
heated up efficiently. The temperature was noted down when the sample begun to slip
up the capillary tube.
6.4.7 Gardner colour
The Gardener colour is the number of the standard reference colour which compares
to the test sample when viewed through the Dr Lange 400 spectrometer using a Croda
in-house method G01701. The wax sample was melted and poured into a disposable
11 mm round cuvette to a depth of 2 cm. The outside glass of the cuvette was wiped
clean andit was important to ensure there were no air bubbles. The wax containing
313
cuvette was then inserted into the cuvette compartment and the instrument would take
a colour measurement ranging from 0 to 18 accurate to one decimal place. The
reading was taken as soon as the wax was molten so the reading temperature varied
according to the sample.
6.4.8 Water absorption
The water absorption test was carried out by adapting the Croda in-house method
G16101. About 0.5 g of wax sample was melted with 9.5 g of petroleum jelly and
weighed directly into a mortar. The total weight of the mortar, wax mixture and
polythene rod were noted. Deionised water was added dropwise whilst stirring
vigorously. More water was added when the wax had fully absorbed all the water. The
end point was determined when there was a visible water droplet remaining on top of
the wax mixture and cannot be incorporated into the wax mixture. Wool wax alcohol
(superhartolan®) would take more than 230% of its own mass in water. The
calculation of the percentage of water absorption can be calculated using Equation 6.5
where W is the weight (g) of wax sample, W2 is the initial weight (g) of wax sample,
mortar and polythene rod and W1 is the final weight (g) of wax sample, mortar and
polythene rod.
Equation 6.6: Calculation for water absorption
6.4.9 Base value
The base value was determined using a Croda in-house method G09701. About 20 g
of saponified wax sample was weighed out. The exact mass of the sample was
calculated by determining the moisture level using procedure described in Section
6.2.8. Approximately 75 mL of ethanol was heated to boil and 0.5 mL of
bromophenol blue indicator solution was added. The solvent was then neutralised with
0.1 M HCl whilst keeping the solution at 343 K and the colour change from green to
yellow was observed. The neutralised solvent mixture was added to the sample
solution and boiled. The solution was titrated with 0.1 M HCl until there was a

314
definite colour change from green to yellow. The base value was calculated using
Equation 6.6, where T is the volume (mL) of HCl required for complete titration, M is
the molarity (gmoleL-1
) of HCl solution and W is the weight (g) of dried sample.
Equation 6.7: Calculation for base value
Chapter 7 Conclusion and future work

317
7. CONCLUSION AND FUTURE WORK
The objective of this research was to add value to a low cost, high volume renewable
resource through an integrated extraction step to produce potentially high value wax
products. Through literature review, the epicuticular waxes on the surface of plants were
identified as a source of new potential waxes. Straw is an agricultural by-product of
significant volume that is currently being under-utilised and was shown to consist of wax
compounds of high interest in many wax applications. Within the concept of a straw bio-
refinery, this would be a great opportunity to maximise the use of the biomass by extraction
of waxes prior to existing straw uses such as combustion for energy.
Wheat straw is the most abundant cereal crop grown in the UK and through literature
review, the chemical compositions of wheat straw wax appeared to have high potential to
replace some of the existing commercial waxes. In the first stage of this study, wheat straw
wax was extracted by a variety of traditional organic solvents using Soxhlet extraction in
order to determine the effect of solvent properties on extraction. This study demonstrated
that the extraction yields are highly dependent on the solvent used which suggested different
solvent-solute interactions were established during the extraction. A qualitative analysis was
carried out on the wheat straw wax from different solvent extractions using GC-MS and
showed identical chemical composition profiles. A range of long aliphatic molecules
including free fatty acids (C14 – C18), fatty alcohol (C28), n-alkanes (C27 – C33), β-diketones
(C31 and C33), aldehydes (C28,), wax esters (C40 – C58) and cyclic sterols were identified. The
similar composition suggested that the solvent had very little selectivity on the different
groups of wax molecules and the differences between the extracts were the relative
abundance of the different compounds. A quantitative analysis was carried out using GC-
FID to gain a deeper understanding in the solvent properties with the different wax
compounds. Linear Solvation Energy Relationship (LSER) was used to model solvent
properties against the extraction of wheat straw wax for the first time. Correlations of crude
and various wax group yields with different solvent parameters were carried out. Both crude
and wax ester yields showed positive correlation with Kamlet- Taft parameter β (hydrogen
bond accepting ability) and molar volume. The model can predict the crude wax and wax
ester yields using solvent parameters successfully and this is vital in achieving high wax
yields. The waxes were purified using liquid-liquid extraction (aqueous and DCM) and
showed that the lipophilic fraction yields were similar. LSER modelling was carried out and

318
found no trend with the DCM soluble fractions but found a strong correlation of aqueous
soluble fractions with solvent parameters β and molar volume. It can be concluded that the
lipophilic fraction of the extracts can be extracted using solvents with a wide range of
polarities. This model showed the selectivity of the solvents and the model can be used to
identify the most selective solvents.
As an alternative to extraction using organic solvents a greener extraction technology using
supercritical CO2 was employed for the extraction of wheat straw wax to give a truly
sustainable and environmentally friendly process and effect of temperature and pressure on
the extraction were extensively analysed. Both qualitative and quantitative analyses were
carried out for the extracts retrieved from different extraction conditions. The chemical
composition was identical to the solvent extracts and the change in temperature and pressure
of scCO2 only affected the relative abundance of the wax compounds. The effect of
temperature and pressure on the crude and wax groups yield was analysed using first order
polynomial modelling. Strong correlations were shown with crude wax, wax esters and β-
diketones which suggested there is a linear relationship between temperature and pressure.
Aldehydes showed the least correlation which indicated that there is no relationship between
temperature and pressure. Further work is required to investigate this non- linear relationship
and determine the parameters that dictate the aldehyde yields within the wheat straw wax.
The data was also modelled using a density-based Chrastil equation. Both crude and wax
esters yield obey the Chrastil equation with a strong correlation which indicated that the
extraction yields are strongly influenced by density. However, the β-diketones, which
showed a strong linear correlation with temperature and pressure do not correlate linearly
with CO2 density, despite temperature and pressure dictating the CO2 density. This can be
explained by the change in temperature and pressure also altering other CO2 properties such
as polarity, viscosity and diffusivity. More work is needed to understand the relationship
between CO2 properties and the different wax groups so predicted extraction conditions can
be calculated to produce tailored wax products for specific applications. Extraction
temperature and pressure were optimised using the 22 extraction model on both of these
parameters. Liquid CO2 and supercritical CO2 with a co-solvent (ethanol) were also
explored. Liquid CO2 showed highly selective extraction but failed to extract any wax esters
whereas supercritical CO2 with ethanol showed a high extraction yield but proved very
unselective. Whilst using liquid and supercritical CO2 extraction for wheat straw will leave
both the straw residues and wax products completely solvent-free, the introduction of

319
ethanol as a co-solvent did not add any extra benefit but would add extra solvent elimination
and wax purification steps.
Using neat supercritical CO2 was shown to be a selective and environmentally friendly
method to extract straw waxes and was selected to be the technology used for scale up trials.
A total of seven different straws (wheat, barley, oat, oilseed rape, sunflower, miscanthus and
bagasse) were screened for yield and composition prior to selection of the biomass for scale
up trials. Hexane and ethanol Soxhlet extractions were carried out on the seven different
straws to give an insight into the polar and non-polar molecules present on the straw surface.
Qualitative and quantitative analyses were completed and new compounds were identified.
Considering the biomass availability, percentage crude yield and chemical composition
profile, wheat, barley and oat straw was shown to be the most promising biomass for the
extraction of renewable waxes.
In collaboration with Sundown Products Limited, a total of three tonnes of wheat, barley and
oat straw (1 tonne each) were obtained and laboratory scale heptane extraction was carried
out to assess the quality of the straws. In the biomass screen, it was apparent that there are
many factors such as natural variation that can alter the wax quality and yield so it was
important to check for wax quality and quantity by a simple heptane Soxhlet extraction.
Following successful laboratory scale heptane Soxhlet extraction and preliminary scCO2
extraction work, the process was scaled up to industrial scale using a 200 L extractor in
collaboration with Evonik Industries. Optimised conditions (323 K and 35 MPa) were
requested but due to the limitations of the extraction system, the operating pressure was 28
MPa which reduced the CO2 density. Conditions of 323 – 343 K and 28 MPa were used for
all the scale up trials which successfully yielded approximately 60 kg of wax extract. Overall
the scale up was successful; there was a small problem with crystallisation of waxes in the
pipe work causing blockages. Carrier oil oilseed rape oil was used to flush and clear the
pipes to relief the problem and the separator temperature was raised to 343 K. To improve
the extraction efficiency, the CO2 density must be increased for future extraction scale up
trials. Extraction times were not investigated in this study so it would be interesting to gather
data on percentage of wax extracted in specific extraction times. The wax products retrieved
from the extractions contained at least 0.5% co-extracted water so an extra de-watering step
had to be carried out. If any extraction plants were to be built solely for the extraction of
biomass such as straw, it would be ideal to incorporate a method to de-water the products as

320
part of the plant design. The waxes were fractionated using laboratory scale scCO2 extractor
to demonstrate the feasibility of combining the extraction and fractionation as a one step
process. More work is required to optimise the fractionation conditions but if a series of
separators were incorporated to give a wide range of separating temperature and pressure
into the extractor then the waxes could potentially be fractionated into different high value
fractions for a number of different markets including cosmetics, nutraceutical, home care,
personal care and agrochemical. From the quantitative analysis, it was apparent that there are
still components of the extracts that have not been identified. One reason for this is that the
molecular weight of the compounds was too large for GC analysis even using a high
temperature GC method. The waxes were separated according to molecular weight by
analytical scale GPC. Following the success of analytical scale GPC work, the fractionation
was scaled up to pilot scale to achieve enough material for MALDI-TOF MS analysis to
gain a deeper understanding of the molecular weight range. Ester molecules of up to 1500
Da were successfully separated and analysed. More work is needed on method development
as there were problems with uneven crystallisation of the waxes on the MALDI plate. As
only the molecular ion of the compounds were seen, MALDI-TOF MS provided no
structural data so further separation needs to be carried out and the wax esters saponified to
give greater structural details.
Physical properties (appearance, melting point, acid value, saponification value, drop point
and water absorption) were assayed and compared with existing commercial waxes. It was
found that the crude cereal waxes were most similar to beeswax. The straw waxes are hard,
deeply coloured, and highly hydrophobic and have a strong odour which is not ideal for
cosmetic applications in their crude form. Due to the high hydrophobic behaviour, it is
thought that they would fit into existing wax applications such as polishes and coatings.
Currently, the straw waxes are waiting to be tested for a variety of applications in
collaboration with Croda. Wheat straw wax was saponified to fatty alcohols and fatty acids
fractions with the aim of modifying its physical properties. As the chemical composition
alters, the physical properties such as colour, melting point and water absorption abilities all
changed. Further work is needed to link the chemical composition of the wax with its
physical properties so that the relevant modifications can be done to obtain tailored wax
products.
321
The work in this thesis has demonstrated the successful use of a sustainable extraction
method to obtain high value chemicals from a lost cost, high volume and under-utilised
biomass. However, this will not break through to commercialisation without a full economic
assessment of the value of the products. The economics of the process to produce the high
value straw waxes were considered by incorporating the physical pre-treatment, biomass,
extraction and CO2 costs and showed the extraction process is the most costly. The
extraction yields were incorporated into economics calculations which give the value of the
straw wax at about £12 per kg. When comparing with the existing commercial finished wax
products, the value is extremely high considering beeswax is about £6 per kg and lanolin is
about £4 per kg. With the current quoted cost of straw wax, it is impossible for the new
product to compete with existing waxes in the market, even though there is a big consumer
drive for 100% natural products, unless there are specific unique applications. In conclusion,
the extraction yields must be increased to be competitive and this can be achieved either
through the use of high pressure extractors or new cereal varieties developed to give higher
wax yields. Overall, the extraction of renewable straw waxes have shown to have great
potential to replace existing waxes but due to the current high production costs, it would be
difficult for the new wax products to move to commercialisation and compete with cheaper
waxes.

322

Chapter 8 References


325
8. REFERENCES
1 R.K. Henderson, C. Jimenez-Gonzalez, D.J.C. Constable, S.R. Alston, G.G.A. Inglis,
G. Fisher, J. Sherwood, S.P. Binks and A.D. Curzons, Green Chem., 2011, 13, 854-
862 2
B. Hopwood, M. Mellor and G. O'Brien, Sustain. Dev., 2005, 13, 38-52 3
IUCN, UNEP and WWF, World Conservation Strategy: Living Resource
Conservation for Sustainable Development, Gland, Switzerland, 1980 4
G.H. Brundtland, Our Common Future, WCED, Oxford, 1987 5
K. Aleklett, M. Höök, K. Jakobsson, M. Lardelli, S. Snowden and B. Söderbergh,
Energ. Policy, 2010, 38, 1398-1414 6
M. Poliakoff, J.M. Fitzpatrick, T.R. Farren and P.T. Anastas, Science, 2002, 297, 807-
810 7
J.E.G. van Dam, B. de Klerk-Engels, P.C. Struik and R. Rabbinge, Ind Crop Prod,
2005, 21, 129-144 8
J.H. Clark and F.E.I. Deswarte, in Introduction to Chemicals from biomass, ed. J.H.
Clark and F.E.I. Deswarte, Wiley, Chichester, 2008, ch. 1, 1-18 9
IEA, World Energy Outlook 2010 executive summary, IEA, Paris, 2007, 3-14 10
IEA, World Energy Outlook 2010 executive summary, IEA, Paris, 2010, 3-18 11
B. Kamm and M. Kamm, Appl. Microbiol. Biotechnol., 2004, 64, 137–145 12
C. Francesco, Energ. Convers. Manage., 2010, 51, 1412-1421 13
T. Werpy, G.Pedersen, A. Den, J. Bozell, J. Holladay, J. White and A. Manheim, Top
value added chemicals from biomass (Volume I: Results of Screening for Potential
Candidates from Sugars and Synthesis Gas), US Department of Energy, Oak Ridge,
2004 14
J.R. Hess, C.T. Wright and K.L. Kenney, Biofuel. Bioprod. Bioref., 2007, 1, 181-190 15
F.E.I. Deswarte, J.H. Clark, A.J. Wilson, J.J.E. Hardy, R. Marriott, S.P. Chahal, C.
Jackson, G. Heslop, M. Birkett, T.J. Bruce and G. Whiteley, Biofuels, Bioprod.
Bioref., 2007, 1, 245-254 16
F. Deswarte, Ph.D. thesis, University of York, 2006 17
J. H. Clark, F. E. I. Deswarte and T. J. Farmer, Biofuel. Bioprod. Bioref., 2009, 3, 72-
90 18
F.E.I. Deswarte, J.H. Clark, J.J.E. Hardy and P.M. Rose, Green Chem., 2006, 8, 39–
42 19
V.L. Budarin, P.S. Shuttleworth, J.R. Dodson, A.J. Hunt, B. Lanigan, R. Marriott, K.J.
Milkowski, A.J. Wilson, S.W. Breeden, J. Fan, E.H.K. Sin and J.H. Clark, Energy
Environ. Sci., 2011, 4, 471-479 20
J.H. Clark, J. Chem. Technol. Biot., 2007, 82, 603-609 21
P.T. Anastas, J.C. Warner and J. Warner, Green Chemistry: Theory and Practice,
Oxford University Press, Oxford, 2000, 22
P.T. Anastas and J.C. Warner, Green Chemistry: Theory and Practice, Oxford
University Press, Oxford, 1st edn., 1998, 29-34 23
P. Anastas and N. Eghbali, Chem. Soc. Rev., 2010, 39, 301-312 24
J.H. Clark, V. Budarin, F.E.I. Deswarte, J.J.E. Hardy, F.M. Kerton, A.J. Hunt, R.
Luque, D.J. Macquarrie, K. Milkowski, A. Rodriguez, O. Samuel, S.J. Tavener, R.J.
White and A.J. Wilson, Green Chem., 2006, 8, 853-860 25
M. Stacey, Agr. Progress, 1976, 51, 69-75 26
J. Copeland and D. Turley, National and regional supply/demand balance for
aguiltural straw in Great Britain, The National Non-Food Crops Centre Report,
Central Science Laboratory, Sand Hutton, York, 2008

326
27 T.Q. Yuan and R.C. Sun, in Cereal Straw as a Resource for Sustainable Biomaterials
and Biofuels, ed. R.-C. Sun, Elsevier, Oxford, 1st edn., 2010, ch. 1, 1-5 28
I.M.Morrison, in Straw Decay and its Effect on Disposal and Utilization, ed. E.
Grossbard, Wiley, Chichester, 1979, 237-245 29
Agriculture in the United Kingdom, Defra, Dardni, The Scottish Government: Rural
and Environment Research and Analysis Directorate and Welsh Assembly
Government: The Department for Rural Affairs and Heritage, 2010 30
R.C.Sun and T.Tomkinson, in Encyclopedia of Separation Science, ed. I.D. Wilson,
T.R. Adlard, C.F. Poole, and M. Cook, Academic Press, London, 2000, Ap. 1, 4568-
4574 31
Y.W.Han and A.W. Anderson, Econ. Bot., 1974, 28, 338-344 32
S. Kim and B.E. Dale, Biomass Bioenerg., 2004, 26, 361-375 33
H.-S. Yang, D.-J. Kim and H.-J. Kim, Bioresource Technol., 2003, 86, 117-121 34
Z. Xu, Q. Wang, Z. Jiang, X. Yang and Y. Ji, Biomass Bioenerg., 2007, 31, 162-167 35
R.A. Gross and B. Kalra, Science, 2002, 297, 803-807 36
M. Ahmedna, W.E. Marshall and R.M. Rao, Bioresources Technol., 2000, 71, 113-
123 37
M.M. Mohamed, J. Colloid Interf. Sci., 2004, 272, 28-34 38
J.A. Bird, A.J. Eagle, W.R. Horwath, M.W. Hair, E.E. Zilbert and C. Van-Kessel,
Calif. Agr. , 2002, 56, 69-75 39
D.S. Powlson, D.S. Jenkinson, G. Pruden and A.E. Johnston, J. Sci. Food Agr., 1985,
36, 26-30 40
L. Hunter and K.A. Houpt, J. Anim. Sci., 1989, 67, 1986-1991 41
D.A. Crutchfield, G.A. Wicks and O.C. Burnside, Weed Sci., 1986, 34, 110-114 42
M. Bouhicha, F. Aouissi and S. Kenai, Cement Cconcrete Comp., 2005, 27, 617-621 43
Y. Chang and H.J. Hudson, T. Brit. Mycol. Soc., 1967, 50, 649-666 44
M. Husseien, A.A. Amer, A. El-Maghraby and N. A.Taha, Int. J. Environ. Sci. Te.,
2009, 6, 123-130 45
N.C. Everall and D.R. Lees, Water Res., 1997, 31, 614-620 46
J.T. Martin, Annu. Rev. Phytopathol., 1964, 2, 81-100 47
D. Post-Beittenmiller, Annu. Rev. Plant Biol., 1996, 47, 405-430 48
S.K. Wiśniewska, J. Nalaskowski, E. Witka-Jeżewska, J. Hupka and J.D. Miller,
Colloid. Surface. B, 2003, 29, 131-142 49
F. Xu, in Cereal Straw as a Resource for Sustainable Biomaterials and Biofuels, ed.
R.-C. Sun, Elsevier, Oxford, 1st edn., 2010, ch. 2, 9-43 50
E.C. Reynhardt and M. Riederer, J. Phys. D: Appl. Phys, 1991, 24, 478-486 51
I. Basson and E.C. Reynhardt, J. Phys. D. Appl. Phys., 1988, 21, 1429-1433 52
B.S. Manheim and T.W. Mulroy, Phytochemistry, 1978, 17, 1799-1800 53
G. Eglinton, R.J. Hamilton, R.A. Raphael and A.G. Gonzalez, Nature, 1962, 193,
739-742 54
G.A. Herbin and P.A. Robins, Phytochemistry, 1968, 7, 239-255 55
G. Audisio, A. Rossini, G. Bianchi and P. Avato, J. High Res. Chromatog., 1987, 10,
594-597 56
M. Andrew and R.J.Hamilton, J. Nat. Prod., 1982, 45, 694-697 57
R.E. Wilkinson and D.G. Cummins, Crop Sci., 21, 397-400 58
G. Bianchi, P. Avato, P. Bertorelli and G. Mariani, Phytochemistry, 1978, 17, 999-
1001 59
N.G. Birgitte, Phytochemistry, 1975, 14, 921-929 60
G. Bianchi, F. Scole, B. Borghi and M. Corbellini, Phytochemistry, 1982, 21, 639-642 61
S. Irmak, N.T. Dunford and J. Milligan, Food Chem., 2006, 95, 312-318

327
62 Y. Choi, J. Kim, M. Noh, E. Park and K.-P. Yoo, Korean J. Chem. Eng., 1996, 13,
216-219 63
A.J. Matas, M. Sanz, amp, x, J. a and A. Heredia, International Journal of Biological
Macromolecules, 2003, 33, 31-35 64
P.E. Kolattukudy, J.S. Buckner and T.Y.J. Liu, Arch. Biochem. Biophys., 1973, 156,
613-620 65
K. Mladenova, B. Stoianova-Ivanova and C.M. Camaggi, Phytochemistry, 1977, 16,
269-272 66
R. Croteau and I.S. Fagerson, Phytochemistry, 1971, 10, 3239-3245 67
A.P. Tulloch, in Chemistry and Biochemistry of Natural Waxes, ed. P.E. Kolattukudy,
Elsevier, Amsterdam, 1976, ch. 7, 235-287 68
B.R. Baum, A.P. Tulloch and L.G. Bailey, Can. J. Bot., 1989, 67, 3219-3226 69
Y.Z. Jiang and T. Wang, J. Am. Oil Chem. Soc., 2005, 82, 439-444 70
S. Hubert, Plant Physiol. Bioch., 2004, 42, 465-476 71
R.A. Demel and B.D. Kruyff, Biochim. Biophys. Acta, 1976, 457, 109–132 72
L. Dyas and L.J. Goad, Phytochemistry, 1993, 34, 17-29 73
D. Takaoka, A. Matsuo and S. Hayashi, Phytochemistry, 1987, 26, 429 74
G. Holmer, R.L. Ory and C.E. Hoy, Lipids, 1973, 8, 227-283 75
T. Akihisa, K. Yasukawa, H. Oinuma, Y. Kasahara, S. Yamanouchi, M. Takido, K.
Kumaki and T. Tamura, Phytochemistry, 1996, 43, 1255-1260 76
T. Honda, H.J. Finlay and G.W. Gribble, J. Nat. Prod., 1997, 60, 1174-1177 77
N. Banno, T. Akihisa, H. Tokuda, K. Yasukawa, H. Higashihara, M. Ukiya, K.
Watanabe, Y. Kimura, J.-I. Hasegawa and H. Nishino, Biosci. Biotech. Bioch., 2004,
68, 85-90 78
T. Ohmoto, M. Ikuse and S. Natori, Phytochemistry, 1970, 9, 2137-2148 79
A.A. Millar and L. Kunst, Plant J., 1997, 12, 121-131 80
G. Bianchi, in Waxes: Chemistry, Molecular Biology and Functions, ed. R.J.
Hamilton, The Oily Press, Dundee, 1995, 6, ch. 2, 91-129 81
J. Browse and J. Phlrogge, J. Plant Cell, 1995, 7, 957-970 82
L. Kunst and A.L. Samuels, Prog. Lipid Res., 2003, 42, 51-80 83
S.J. Wakil, Biochemistry, 1989, 28, 4523-4530 84
R.S.V.D. Hoeven and J.C. Steffens, Plant Physiol. Bioch., 2000, 122, 275-282 85
L. Samuels, L. Kunst and R. Jetter, Annu. Rev. Plant Biol., 2008, 59, 683-707 86
A.Hannoufa, J. McNevin and B. Lemieux, Phytochemistry, 1993, 33, 851-855 87
R.C. Sun, D. Salisbury and J. Tomkinson, Bioresour. Technol., 2003, 88, 95-101 88
Y. Athukorala, G. Mazza and B.D. Oomah, Eur. J. Lipid Sci.Tech., 2009, 111, 705-
714 89
R.C. Sun and X.F.Sun, Sep. Sci. Technol., 2001, 36, 3027-3048 90
Y. Athukorala and G. Mazza, Ind. Crop. Prod., 2010, 31, 550-556 91
G. Bianchi and M. Corbellini, Phytochemistry, 1977, 16, 943-945 92
L.L. Jackson, Phytochemistry, 1971, 10, 487-490 93
J.D. Mikkelsen and P. von Wettstein-Knowles, Arch. Biochem. Biophys., 1978, 188,
172-181 94
P. Wettstein-Knowles, Planta, 1972, 106, 113-130 95
V. Piironen, D.G. Lindsay, T.A. Miettinen, J. Toivo and A.-M. Lampi, Journal of the
Science of Food and Agriculture, 2000, 80, 939-966 96
P. Benveniste, Ann. Rev. Plant Physiol., 1986, 37, 97
A.P. Tulloch and R.O. Weenink, Can. J. Chemistry, 1969, 47, 3119-3126 98
A.P. Tulloch and L.L. Hoffman, Phytochemistry, 1971, 10, 871-876 99
A.P. Tulloch and L.L. Hoffman, Phytochemistry, 1973, 12, 2217-2223 100
A. Tulloch and L. Hoffman, Lipids, 1974, 9, 219-219

328
101 G. Bianchi, P. Avato, P. Bertorelli and G. Mariani, Phytochemistry, 1978, 17, 999-
1001 102
G. Bianchi, E. Lupotto and S. Russo, Cellular and Molecular Life Sciences, 1979, 35,
1417-1417 103
G. Bianchi, E. Lupotto, B. Borghi and M. Corbellini, Planta, 1980, 148, 328-331 104
P. Avato, G. Bianchi and G. Mariani, Phytochemistry, 1984, 23, 2843-2846 105
G. Bianchi and M.L. Figini, J. Agr. Food Chem., 1986, 34, 429-433 106
US. Pat. 4260639, 1981 107
R. Vollbrecht, Chem. Ind.-London, 1982, 6, 397-399 108
B. Xiao, X.F. Sun and R.C. Sun, J. Wood Chem. Technol., 2001, 21, 397-411 109
X.F. Sun and R.C. Sun, Wood Fiber Sci., 2001, 33, 386-394 110
K. Hwang, S. Cuppett, C. Weller and M. Hanna, Journal of the American Oil
Chemists' Society, 2002, 79, 521-527 111
R.C. Sun and J. Tompkinson, J. Wood Sci., 2003, 49, 0047-0052 112
W.H. Morrison Iii, R. Holser and D.E. Akin, Ind. Crop. Prod., 2006, 24, 119-122 113
R.J. Hamilton, in Waxes: Chemistry, Molecular Biology and Functions, ed. R.J.
Hamilton, The Oily Press, Dundee, 1995, 6, ch. 7, 258-310 114
A. Tulloch, Lipids, 1970, 5, 247-258 115
E.W. Clark, in The Lanolin Book, ed. P. Beierdorf, BDF, Hamburg, 1st edn., 1999, ch.
1, 15-50 116
J. Jacob, in The Lanolin Book, ed. P. Beierdorf, BDF, Hamburg, 1st edn., 1999, ch. 2,
55-84 117
W. Cannon and G. Atkinson, Croda International Plc., personal communication, 2010-
2011 118
E. Taube, Econ. Bot., 1952, 6, 379-401 119
W. Hodge and H. Sineath, Econ. Bot., 1956, 10, 134-154 120
US. Pat. 2113433, 1938 121
US. Pat. 5154919, 1992 122
US. Pat. 2840509, 1958 123
US. Pat. 2967781, 1961 124
Global wax industry 2010: Market analysis and opportunities, Y635A, The Kline
Group, 2010 125
US. Pat. 4873078, 1989 126
Y. Marcus, The Properties of Solvents, Wiley, Chichester, 1st edn., 1998, 1-32 127
D.J. Adams, P.J. Dyson and S.J. Tavener, Chemistry In Alternative Reaction Media,
Wiley, Chichester, 1st edn., 2004, 1-30 128
C. Reichardt, Solvents and solvent Effects in Organic Chemistry, Wiley-VCH,
Weinheim, 3rd edn., 2003, 5-46 129
J.M. DeSimone, Science, 2002, 297, 799-803 130
L.G.S. Brooker, G.H. Keyes and D.W. Heseltine, J. Am. Chem. Soc., 1951, 73, 5350-
5356 131
E.M. Kosower, J. Am. Chem. Soc., 1958, 80, 3253-3260 132
C. Reichardt, Chem. Soc. Rev., 1992, 21, 147-153 133
R.W. Taft and M.J. Kamlet, J. Am. Chem. Soc., 98, 2886-2894 134
M.J. Kamlet and R.W. Taft, J. Am. Chem. Soc., 1976, 98, 377-383 135
M.J. Kamlet, J.L. Abboud and R.W. Taft, J. Am. Chem. Soc., 1977, 99, 6027-6038 136
M.J. Kamlet, J.L.M. Abboud, M.H. Abraham and R.W. Taft, J. Org. Chem., 1983, 48,
2877-2887 137
Y. Marcus, Chem. Soc. Rev., 1993, 22, 409-416 138
P.G. Jessop, D.A. Jessop, D. Fu and L. Phan, Green Chem., 2012, 14, 1245-1259

329
139 A.D. Curzons, D.C. Constable and V.L. Cunningham, Clean Products and Processes,
1999, 1, 82-90 140
C. Jiménez-González, A.D. Curzons, D.J.C. Constable and V.L. Cunningham, Clean
Technol. Envir., 2004, 7, 42-50 141
L. Lynd, R. Elamder and C. Wyman, Appl. Biochem. Biotech., 1996, 57-58, 741-761 142
N. Mosier, C. Wyman, B. Dale, R. Elander, Y.Y. Lee, M. Holtzapple and M. Ladisch,
Bioresource Technol., 2005, 96, 673-686 143
D. Schell and C. Harwood, Appl. Biochem. Biotech., 1994, 45-46, 159-168 144
W.E. Kaar, C.V. Gutierrez and C.M. Kinoshita, Biomass Bioenerg., 1998, 14, 277-
287 145
G. Bonn, R. Concin and O. Bobleter, Wood Sci. Technol., 1983, 17, 195-202 146
A. Zamani, L. Edebo, B. Sjöström and M.J. Taherzadeh, Biomacromolecules, 2007, 8,
3786-3790 147
S. Eero, Biomass Bioenerg., 1991, 1, 61-64 148
T.H. Kim, J.S. Kim, C. Sunwoo and Y.Y. Lee, Bioresource Technol., 2003, 90, 39-47 149
A.V. Pethkar and K.M. Paknikar, J. Biotechnol., 1998, 63, 121-136 150
W.E. Kaar and M.T. Holtzapple, Biomass Bioenerg., 2000, 18, 189-199 151
A.S. Schmidt and A.B. Thomsen, Bioresource Technol., 1998, 64, 139-151 152
R.C. Sun and X.F. Sun, Ind. Crop. Prod., 2001, 14, 51-64 153
M.J. Fishwick and A.J. Wright, Phytochemistry, 1977, 16, 1507-1510 154
G. Panfili, A. Fratianni and M. Irano, J. Agr. Food Chem., 2004, 52, 6373-6377 155
L. Gomez, E. Rubio and M. Augé, J. Sci. Food Agr., 2002, 82, 360-369 156
V. Fabos, G. Koczo, H. Mehdi, L. Boda and I.T. Horvath, Energy Environ. Sci., 2009,
2, 767-769 157
K. Alfonsi, J. Colberg, P.J. Dunn, T. Fevig, S. Jennings, T.A. Johnson, H.P. Kleine, C.
Knight, M.A. Nagy, D.A. Perry and M. Stefaniak, Green Chem., 2008, 10, 31-36 158
L. Crowhurst, P.R. Mawdsley, J.M. Perez-Arlandis, P.A. Salter and T. Welton, Phys.
Chem. Chem. Phys., 2003, 5, 159
R.P. Swatloski, S.K. Spear, J.D. Holbrey and R.D. Rogers, J. Am. Chem. Soc., 2002,
124, 4974-4975 160
H.B. Klinke, B.K. Ahring, A.S. Schmidt and A.B. Thomsen, Bioresource Technol.,
2002, 82, 15-26 161
E. Kovats, Helv. Chim. Acta., 1958, 41, 1915-1932 162
H.V.D. Dool and R.D. Kratz, J. Chromatogr., 1963, 11, 463-471 163
U.F.D. Silva, E.L. Borba, J. Semir and A.J. Marsaioli, Phytochemistry, 1999, 50, 31-
34 164
V.S. Mahalwal and M. Ali, Flavour Fragr. J., 2003, 18, 73-76 165
M.G.B. Zoghbi, E.H.A. Andrade and J.G.S. Maia, Flavour Fragr. J., 1999, 14, 411-
414 166
J.A. Pino, R. Marbot, A. Rosado and C. Vázquez, Flavour Fragr. J., 2003, 18, 271-
274 167
K. Hill, Pure Appl. Chem., 2000, 72, 1255-1264 168
N.A. Ruston, J. Am. Oil Chem. Soc., 1952, 29, 495-498 169
G.A. Herbin and P.A. Robins, Phytochemistry, 1969, 8, 1985-1998 170
S.P. Srivastava, J. Handoo, K.M. Agrawal and G.C. Joshi, J. Phys. Chem. Solids,
1993, 54, 639-670 171
F.C. Abdalla, G.R. Jones, E.D. Morgan and C.d. Cruz-Landim, Genet. Mol. Res.,
2003, 2, 191-199 172
R.W. Howard and G.J. Blomquist, Annu. Rev. Entomol., 2005, 50, 371-393 173
F.R. Dani, Ann. Zool. Fennici, 2006, 43, 500-514 174
H. Kasinger, J. Denzinger and B. Bauer, Commun. SIWN 2008, 4, 133-139
330
175 Y. Zheng and E. White, Retention Data. NIST Mass Spectrometry Data Centre, 2008
176 J.C. Taylor, L. Rapport and G.B. Lockwood, Nutrition, 2003, 19, 192-195
177 C.P.F. Marinangeli, P.J.H. Jones, A.N. Kassis and M.N.A. Eskin, Crit. Rev. Food Sci.,
2010, 50, 259-267 178
J.L. Hargrove, P. Greenspan and D.K. Hartle, Exp. Biol. Med., 2004, 3, 215–226 179
A. Pollard, A.C. Chibnall and S.H. Piper, Biochem. J. , 27, 1889 180
S. Irmak and N.T. Dunford, J. Agric. Food Chem., 2005, 53, 5583-5586 181
D.S. Mottram, Food Chem., 1998, 62, 415-424 182
E.R. Gunawan, M. Basri, M.B.A. Rahman, A.B. Salleh and R.N.Z.A. Rahman,
Enzyme Microb. Tech., 2005, 37, 739-744 183
P. von Wettstein-Knowles and A. Netting, Lipids, 1976, 11, 478-484 184
H. Schaller, Progr. Lipid Res., 2003, 42, 163-175 185
J. Galley and B.D. Kruf., FEBS Lett., 1982, 143, 133-143 186
N.L. Ruibal-Mendieta, R. Rozenberg, D.L. Delacroix, G. Petitjean, A. Dekeyser, C.
Baccelli, C. Marques, N.M. Delzenne, M. Meurens, J.-L. Habib-Jiwan and J. Quetin-
Leclercq, J. Agr. Food Chem., 2004, 52, 4802-4807 187
L.W. Thomson, A.W. Henry and S. Zalik, Phytochemistry, 1986, 25, 2505-2508 188
R.E. Ostlund, Annu. Rev. Nutr., 2002, 22, 533-549 189
A.M. Lees, H.Y.I. Mok, R.S. Lees, M.A. McCluskey and S.M. Grundy,
Atherosclerosis, 1977, 28, 325-338 190
D.K. Singh, L. Li and T.D. Porter, J. Pharmacol. Exp. Ther., 2006, 318, 1020-1026 191
T. Heinemann, G.A. Kullak-Ublick, B. Pietruck and K. von Bergmann, Eur. J. Clin.
Pharmacol., 1991, 40, S59-S63 192
F.Y. Ntanios and P.J. Jones, Biochim. Biophys. Acta, 1998, 1390, 237-244 193
EU Pat. 1108364, 2001 194
EU Pat. 1121928, 2001 195
Y.W. Wang, P.J.H. Jones, I. Pischel and C. Fairow, Lipids, 2003, 38, 165-170 196
J. Snyder, J. King, S. Taylor and A. Neese, J. Am. Oil Chem. Soc., 1999, 76, 717-721 197
R.H. Shapiro and C. Djerassi, J. Am. Chem. Soc., 1964, 86, 2825-2832 198
Retention data from estimated non-polar retention index NIST Mass Spectrometry
library, 2008 199
L.S. Keiser, I.G. Yazlovetsky and V.N. Retunsky, J. Anal. Chem., 1986, 41, 1166-
1172 200
A.C. Alberts, T. R. Sharp, D. I. Werner and P.J. Weldon, J. Chem. Ecol., 1992, 18,
703-712 201
D.H.S. Horn, Z.H. Kranz and J.A. Lamberton, Aust. J. Chem., 1964, 17, 464 - 476 202
Y. Lin, R.D. Brauer, K.E. Laintz and C.M. Wai, Anal. Chem., 1993, 65, 2549-2551 203
B. Bhushan, Y.C. Jung, A. Niemietz and K. Koch, Langmuir, 2009, 25, 1659-1666 204
M. Masur, H.-F. Grützmacher, H. Münster and H. Budzikiewicz, Org. Mass
Spectrom., 1987, 22, 493-500 205
A.P. Tulloch and L.R. Hogge, J. Chromatogr., 1978, 157, 291-296 206
A.P. Tulloch, Phytochemistry, 1973, 12, 2225-2232 207
G. Bianchi, Genetica Agraria, 1985, 39, 471-486 208
J.T. Scanlon and D.E. Willis, J. Chromatogr. Sci., 1985, 23, 333-340 209
Y.F. Chen, N.T. Dunford, J. Edwards, B. Carver and C. Goad, J. Sci. Food Agr.,
2009, 89, 310-314 210
W.D. Guenzi and T.M. McCalla, Agron. J., 58, 303-304 211
K.-H. Kim, R. Tsao, R. Yang and S.W. Cui, Food Chem., 2006, 95, 466-473 212
L. Yu, S. Haley, J. Perret, M. Harris, J. Wilson and M. Qian, J. Agr. Food Chem.,
2002, 50, 1619-1624

331
213 M.F. Andreasen, P.A. Kroon, G. Williamson and G.-C. M.-T., Free Radical Bio.
Med., 2001, 31, 304-314 214
L. Yu, J. Perret, M. Harris, J. Wilson and S. Haley, J. Agr. Food Chem. , 2003, 51,
1566-1570 215
H.J.C. Dasneves and E.M.M. Gaspar, Hrc-J. High Res. Chrom., 1990, 13, 550-554 216
M. Nazzaro-Porro, S. Passi, M. Picardo, A. Breathnach, R. Clayton and G. Zina, Brit.
J. Dermatol., 1983, 109, 45-48 217
A. Heidbreder, R. Höfer, R. Grützmacher, A. Westfechtel and C.W. Blewett, FETT-
Lipid., 1999, 101, 418-424 218
EP Pat. 0508591, 1992 219
G. Castaño, R. Mas, L. Fernández, J. Illnait, R. Gámez and E. Alvarez, Int. J. Clin.
Pharmacol. Res., 2001, 21, 43-57 220
R.D. Hagenmaier, Proc. Fla. State Hort. Soc., 1998, 111, 251-255 221
Directive 2003/15/EC of The European Parliament and of the Council of 27 February
2003, 2003 222
Commission Directive 2010/59/EU of 26 August 2010, 2010 223
Regulation (EC) No 1223/2009 of The European Parliament and of the Council of 30
November 2009, 2009 224
Regulation (EC) No 1334/2008 of the European Parliament and of the Council of 16
December 2008, 2008 225
Directive 2009/32/EC of The European Parliament and of the Council of 23 April
2009, 2009 226
1993 227
J.P. Friedrich, G.R. List and A.R.S. Usda, J. Agric. Food Chem., 1982, 30, 192-193 228
H.H. Schumburg and P.S. Spencer, Brain, 1976, 99, 183-192 229
P.S. Spencer and H.H. Schumburg, Proc. R. Soc. Med., 1977, 70, 37-38 230
F.M. Orr, J.P. Heller, J.T. Taber and R.J. Card, Chemtech, 1983, 13, 482-487 231
Y. Ikushima, N. Saito, M. Arai and K. Arai, Bull. Chem. Soc. Jpn, 1991, 64, 2224-
2229 232
B. Metz, O. Davidson, H.d. Coninck, M. Loos and L.M. (Eds.), Carbon dioxide
capture and storage, IPCC special report 2005, IPCC, Cambridge, 2005 233
S. Kim and B.E. Dale, Biomass Bioenerg., 2005, 29, 426-439 234
J. Mathews, Energ. Policy, 2007, 35, 4247-4259 235
A.J. Hunt, E.H.K. Sin, R. Marriott and J.H. Clark, ChemSusChem., 2010, 3, 306-322 236
R. Marriott, University of York, personal communication, 2010-2011 237
Council Directive 93/35/EEC of 14 June 1993 1993 238
F.M.Kerton, Alternative Solvents for Green Chemistry, RSC Publishing, Cambridge,
1st edn., 2009, 60-70 239
Y. Arai, T.Sako and Y.Takebayashi, Supercritical Fluids: Molecular Interactions,
Physical Properties and New Applications, Springer, New York, 1st edn., 2002, 1-4 240
A.A.Clifford, Fundamentals of Supercritical Fluids, Oxford University Press, Oxford,
1998, 1-5 241
P.G.Jessop and W.Leitner, Chemical Synthesis using Supercritical Fluids, Wiley-
VCH, Weinheim, 1st edn., 1999, 1-5 242
Natex Prozesstechnologie, http://www.natex.at, November 2009 243
C.Domingez, E.Jover, J.M.Bayona and P.Erra, Anal. Chim. Acta., 2003, 477, 233-242 244
J.P. Friedrich, G.R. List and A.J. Heakin, J. Am. Oil Chem.Soc., 1982, 59, 288-292 245
E. Stahl, E. Schuetz and H.K. Mangold, J. Agr. Food Chem., 1980, 28, 1153-1157 246
L.H.C.Carlson, R.A.F. Machado, C.B.Spricigo, L.K.Pereira and A.Bolzan, J.
Supercrit. Fluid., 2001, 21, 33-39
332
247 A. Garcia, A. deLucas, J. Rincon, A. Alvarez, I. Gracia and M.A. Garcia, J. Am. Oil
Chem. Soc., 1996, 73, 1127-1131 248
G.Gonzalez, Anal. Chim. Acta., 1998, 360, 227-241 249
N.Patouillard and R.Kahleyss, Evonik Industries, personal communication, 2010 250
A. Brachet, P. Christen, J.-Y. Gauvrit, R. Longeray, P. Lantéri and J.-L. Veuthey, J.
Biochem. Bioph. Meth., 2000, 43, 353-366 251
L. Ferreira de França, G. Reber, M.A.A. Meireles, N.T. Machado and G. Brunner, J
Supercrit. Fluid., 1999, 14, 247-256 252
S.Mitra and N.K.Wilson, J. Chromatogr. sci., 1991, 29, 305-309 253
I.J. Barnabas, J.R. Dean, W.R. Tomlinson and S.P. Owen, Anal. Chem., 1995, 67,
2064-2069 254
F.W. Jones, B.O. Bateup, D.R. Dixon and S.R. Gray, J. Supercrit. Fluid., 1997, 10,
105-111 255
R. Alzaga, E. Pascual, P. Erra and J.M. Bayona, Anal. Chim. Acta, 1999, 381, 39-48 256
M.Cynarowicz-Provost, J.W.King, W.N.Marmer and P.Magidman, J. Am. Oil Chem.
Soc., 1994, 71, 223-226 257
F. Favati, J. King and M. Mazzanti, J. Am. Oil Chem. Soc., 1991, 68, 422-427 258
M. Fattori, N. Bulley and A. Meisen, J. Am. Oil Chem. Soc., 1988, 65, 968-974 259
I. Papamichail, V. Louli and K. Magoulas, J. Supercrit. Fluid., 2000, 18, 213-226 260
G.Guihard, University of York, Unpublished work, 2011 261
J. Chrastil, J. Phys. Chem., 1982, 86, 3016-3021 262
J.M. Delvalle and J.M. Aguilera, Ind. Eng. Chem. Res., 1988, 27, 1551-1553 263
J. Méndez-Santiago and A.S. Teja, Fluid Phase Equilib., 1999, 158-160, 501-510 264
K.D. Bartle, A.A. Clifford, S.A. Jafar and G.F. Shilstone, J. Phys. Chem. Ref. Data,
1991, 20, 713-756 265
Y. Adachi and B.C.Y. Lu, Fluid Phase Equilibria, 1983, 14, 147-156 266
J.A. Hyatt, J. Org. Chem., 1984, 49, 5097-5101 267
F.P. Lucien and N.R. Foster, J. Supercrit. Fluid., 2000, 17, 111-134 268
Y. Koga, Y. Iwai, Y. Hata, M. Yamamoto and Y. Arai, Fluid Phase Equilibr., 1996,
125, 115-128 269
P. Maheshwari, Z.L. Nikolov, T.M. White and R. Hartel, J. Am. Oil Chem. Soc.,
1992, 69, 1069-1076 270
T. Funazukuri, S. Hachisu and N. Wakao, Ind. Eng. Chem. Res., 1991, 30, 1323-1329 271
D.K. Dandge, J.P. Heller and K.V. Wilson, Ind. Eng. Chem. Prod. RD, 1985, 24, 162-
166 272
T. Chartier, E. Delhomme, J.F. Baumard, P. Marteau, P.Subra and R. Tufeu, Ind. Eng.
Chem. Res., 1999, 38, 1904-1910 273
Z. Huang, S. Kawi and Y.C. Chiew, J. Supercrit. Fluid., 2004, 30, 25-39 274
S. Patel, D.R. Nelson and A.G. Gibbs, J. Insect Sci., 2001, 1, 1-18 275
W.H. Gibson, Chem. Eng. Res. Des., 1931, 9a, 30-35 276
US Pat. 2009522, 1935 277
G. Nuissier, P. Bourgeois, M. Grignon-Dubois, P. Pardon and M.H. Lescure,
Phytochemistry, 2002, 61, 721-726 278
Y. Sun and J. Cheng, Bioresource Technol., 2002, 83, 1-11 279
I. Lewandowski, J.C. Clifton-Brown, J.M.O. Scurlock and W. Huisman, Biomass
Bioenerg., 2000, 19, 209-227 280
G. Antolin, F.V. Tinaut, Y. Briceno, V. Castano, C. Perez and A.I. Ramirez,
Bioresource Technol., 2002, 83, 111-114 281
R. Purdy, J. Am. Oil Chem. Soc., 1986, 63, 1062-1066 282
T. Itoh, T. Tamura and T. Matsumoto, J. Am. Oil Chem. Soc., 1973, 50, 122-125 283
P. Wettstein-Knowles and A. Netting, Carlsberg Res. Commun., 1976, 41, 225-235
333
284 G. Verardo, E. Pagani, P. Geatti and P. Martinuzzi, Anal. Bioanal. Chem., 2003, 376,
659-667 285
P.J. Holloway, C.E. Jeffree and E.A. Baker, Phytochemistry, 1976, 15, 1768-1770 286
R.A. Franich, L.G. Wells and P.T. Holland, Phytochemistry, 1978, 17, 1617-1623 287
P.E. Kolattukudy and T.-Y.J. Liu, Biochem. Bioph. Res. Co., 1970, 41, 1369-1374 288
P. Khristova, N. Yossifov, S. Gabir, I. Glavche and Z. Osman, Cellul. Chem.
Technol., 1998, 32, 327-337 289
EP Pat. 0508591, 1961 290
T.C.S. Kanya, L.J. Rao and M.C.S. Sastry, Food Chem., 2007, 101, 1552-1557 291
D.E. Purcell, G.J. Leonard, M.G. O'Shea and S. Kokot, Chemometr. Intell. Lab., 2005,
76, 135-147 292
M.I. Whitecross and D.J. Armstrong, Aust. J. Bot., 1972, 20, 87-95 293
T. Shepard, G.W. Robertson, D.W. Griffiths, A.N.E. Birch and G. Duncan,
Phytochemistry, 1995, 40, 407-417 294
M. Kock, J. Am. Oil Chem. Soc., 1983, 60, 198-202 295
Z. Shen, M.V. Palmer, S.S.T. Ting and R.J. Fairclough, J. Agr. Food Chem., 1996, 44,
3033-3039 296
K.A. Evelein, R.G. Moore and R.A. Heidemann, Ind. Eng. Chem., 1976, 15, 423-428 297
V. Hentschel, K. Kranl, J. Hollmann, M.G. Lindhauer, V. Böhm and R. Bitsch, J. Agr.
Food Chem., 2002, 50, 6663-6668 298
M.T. Escribano-Bailón, C. Santos-Buelga and J.C. Rivas-Gonzalo, J. Chromatogr. A,
2004, 1054, 129-141 299
N. Nicolaid and H.C. Fu, Lipids, 1970, 5, 299-307 300
F.J. Ramirez, P. Luque, A. Heredia and M.J. Bukovac, Biopolymers, 1992, 32, 1425-
1429 301
S. Merk, A. Blume and M. Riederer, Planta, 1998, 204, 44-53 302
H. Schulz and M. Baranska, Vib. Spectrosc., 2007, 43, 13-25 303
Y. Ozaki, R. Cho, K. Ikegawa, S. Muraishi and K. Kawauchi, Appl. Spectrosc., 1992,
1503-1507 304
J. Dubois, F.R. vandeVoort, J. Sedman, A.A. Ismail and H.R. Ramaswamy, J. Am.Oil
Chem. Soc., 1996, 73, 787-794 305
R.G. Sinclair, A.F. McKay, G.S. Myers and R.N. Jones, J. Am. Chem. Soc., 1952, 74,
2578-2585 306
M.D. Guillen and N. Cabo, J. Am. Oil Chem. Soc., 1997, 74, 1281-1286 307
J.R. Dodson, Ph.D. thesis, University of York, 2011 308
V. Vrkoslav, R. Míková and J. Cvačka, J. Mass Spectrom., 2009, 44, 101-110 309
G. Kühn, S. Weidner, U. Just and G. Hohner, J. Chromatogr. A, 1996, 732, 111-117 310
J. Cvačka and A. Svatoš, Rapid Commun. Mass Sp., 2003, 17, 2203-2207 311
J. Cvačka, P. Jiroš, J. Šobotník, R. Hanus and A. Svatoš, J. Chem. Ecol., 2006, 32,
409-434 312
R. Congiu, D. Falconieri, B. Marongiu, A. Piras and S. Porcedda, Flavour Fragr. J.,
2002, 17, 239-244 313
N. Aligiannis, E. Kalpoutzakis, I.B. Chinou, S. Mitaku, E. Gikas and A.
Tsarbopoulos, J. Agric. Food Chem., 2001, 49, 811-815 314
K.E. Espelie, B.B. Dean and P.E. Kolattukudy, Plant Physiol., 1979, 64, 1089-1093 315
K.E. Espelie and P.E. Kolattukudy, Plant Sci. Lett., 1979, 15, 225-230 316
US Pat. 5460808, 1995 317
US Pat. 5948393, 1999 318
K. Nakasone, K. Shiokawa, Y. Urabe and N. Nemoto, J. Phys. Chem. B, 2000, 104,
7483-7489 319
D.H. Bonsor and D. Bloor, J. Mater. Sci., 1977, 12, 1559-1564
334
320 A.G. Gibbs, Comp. Biochem. Phys. B, 1995 112, 667-672
321 M.E.Stewart and D.T.Downing, Adv. Lipid Res., 1991, 24, 263-302
322 US Pat. 2736667, 1956
323 US Pat. 2498201, 1947
324 G. Atkinson, Croda International Plc., personal communication, 2011
325 US Pat. 2795595, 1957
326 L. Tobares, C. Guzmán and D. Maestri, Eur. J. Lipid Sci.Tech., 2003, 105, 749-753
327 US Pat. 1777766, 1930
328 US Pat. 4154750, 1979
329 US Pat. 3489690, 1970
330 I. Cuthbertson, Oakbank Products, personal communication, 2010
331 U. Schuchardt, R. Sercheli and R.M. Vargas, J. Braz. Chem. Soc., 1998, 9, 199-210
332 B.M. Folmer, Adv. Colloid Interface Sci., 2003, 103, 99-119
333 B.J. Hall and J.S. Brodbelt, J. Am. Soc. Mass Spectrom., 1999, 10, 402-413
334 G. Brunner, J. Food Eng., 2005, 67, 21-33
335 F.W. Jones, J. Agric. Food Chem., 1996, 44, 3197-3201