Embed Size (px)
Citation preview
Supercritical Fluid Extraction and Fractionation of Bioactive Natural Products from Cork
A dissertation presented to the Faculdade de Engenharia da Universidade do Porto
For the degree of PhD in Chemical and Biochemical Engineering
by
Yaidelin Josefina Alves Manrique
Supervised by
Prof. José Miguel Loureiro
Prof. Mª Manuela Vilarinho Ferreira de Oliveira
Laboratory of Separation and Reaction Engineering Associate Laboratory LSRE-LCM
Department of Chemical Engineering Faculty of Engineering, University of Porto
December 2016


FEUP-LSRE/LCM – Universidade do Porto
© Yaidelin Josefina Alves Manrique, 2016
All rights reserved


______________________________
This thesis was financially supported by Fundação para a Ciência e Tecnologia (Portugal) through the PhD grant SFRH/BD/71891/2010. The work was also co-financed by: Project POCI-01-0145-FEDER-006984 – Associate Laboratory LSRE-LCM funded by FEDER through COMPETE2020 - Programa Operacional Competitividade e Internacionalizaça o (POCI) – and by national funds through FCT - Fundaça o para a Ciencia e a Tecnologia


Acknowledgements
Each challenge is a new opportunity to grow up and improve yourself, both professionally and personally, so the responsibility to achieve our goals is plenty ours; however, it is important to highlight that to make this happen, it is essential to have a favourable environment, as well the right people around us to be successful. Therefore, at the end of this journey, there are many people that in one way or another had a contribution, and to whom I would like to express my gratitude.
First, I want to thank to my supervisors Prof. José Miguel Loureiro and Prof. Manuela V. Ferreira de Oliveira, for giving me a vote of confidence to develop this project, for their continuous support and availability and for all ideas and discussions to improve my work; also for the motivation and encouragement when things were not going in the best way.
To the Associate Laboratory LSRE-LCM, represented by Prof. Emeritus A. Rodrigues (ex-coordinator) and Prof. M. Dias (coordinator), for their support whenever I needed. And finally, I have a positive answer to their single question, "Yes, I have finished this chapter!”; from now on, new challenges can be taken.
To Fundação para a Ciência e Tecnologia (Portugal), for the financial support (research Fellowship: SFRH/BD/71891/2010).
To António Almeida, Cortiças, S.A., for supplying all cork samples and for their explanations of cork industrial processing; this work was all about cork...
To all my colleagues of LSRE; I know that mentioning only a few of you is very unfair; for that reason, I would like to express my gratitude to all of you without forgetting anyone. Since the beginning of this special journey, many of you still remain at my side, others had to go far away to embrace new professional challenges, some were here for a specific period and others are still here; working with each of you was exciting; we always gave our best to be better (professionally and personally). I really want to thank all of you for all our discussions and great ideas, the support and the continuous motivation, and specially all the great moments spent together (in and out of work), with all of you this journey was enriching; regardless of the new ways for our future, I know that I won friends for my life.
To my friends, in particular those who I won in this journey, you became my family. Undoubtedly, friends are the family you choose, thank you for being always present and making possible what seems impossible. With all of you to infinity and beyond!
To those who made all this possible since the first day of my life, my family that always supports all my decisions and gives me the freedom to follow my path to achieve my goals, even when it takes me far away from the comfort zone. You always believed, even when I could not. I am grateful for all, especially because whenever things got more difficult, you always encouraged me to not give up

viii
and to go even further, and you taught me that the difficulties are not what make us stronger but instead our attitude and faith to keep on. Today, I am here only because of you. Thank you for everything!
To each one of you, thank you very much! With all of you everything is possible!

To my family


“The greatest gift you can give someone is your time. Because when you give your time,
you are giving a portion of your life that you will never get back”
Anonymous


Supercritical fluid extraction and fractionation of bioactive natural products from cork
Abstract
Cork is the bark of the cork oak (Quercus Suber L.), a hundred percent natural plant tissue, that is composed, in average, by 14% extractives; these extractives are mainly constituted by triterpenic compounds (e.g., cerin, betulin – B, friedelin, betulinic acid – BA) that have promising applications as bioactive compounds or precursors to drug ingredients. Therefore, these compounds can have a very high-value.
Portugal is the world leader in the production, processing and marketing of cork. In 2014, the total sales of Portuguese cork industry represented 1 288 million euros; that represents ca. 182 thousand tons of cork by year (2014). The most important sector to the cork industry is the production of cork stoppers; in the process of natural cork stoppers production, ca. 60% of initial raw material is rejected; this rejected material is milled to be used in other applications, e.g. technical cork stoppers, agglomerated, etc.
This work aims to “Add a New Value to Cork”, i.e., it intends to use the cork as a “possible” source of high-added value chemicals, by introducing in the cork mill process a valorisation step, but without compromising the traditional uses of this granulated material.
To evaluate the potential of this material as a source of bioactive compounds, several samples (A1 to A9) of granulated industrial cork and cork powder were extracted by soxhlet and supercritical fluid extraction (SFE) with and without co-solvent. In the soxhlet extractions were used solvents with different polarities; for all samples, the yield increases with the polarity of the solvent, regardless of the average particle size (or cork density). E.g., for sample A1
(0.75 mm), the yield was 94.7, 84.3, 70.4 and 48.5 1
DryCorkextractkgg
for ethanol,
acetone, dichloromethane and hexane, respectively. These results represented a benchmark to the supercritical fluid extraction (SFE) with and without co-solvent.
The results obtained are compatible with the hypothesis that the particles bigger than cork powder are not totally extracted, i.e., only an outer layer was extracted; also, it seems that this layer is nearly constant, for particles bigger than 1 mm, for each solvent.
To perform the SFE, an experimental setup at bench scale was designed (up to 80°C and 300 bar), assembled and tested; this setup can be operated with and without co-solvent. The best performance of SFE without co-solvent was
19.7 1
DryCorkextractkgg
obtained at 210 bar and 41°C; when 10% of ethanol was
added, the yield increases almost 86% (to 36.6 1
DryCorkextractkgg
).
To describe the experimental results for both soxhlet and SFE, two phenomenological models are developed, a diffusional and a shrinking core models. For the two models, negligible film resistance and that only an outer
xiv Abstract
Supercritical fluid extraction and fractionation of bioactive natural products from cork
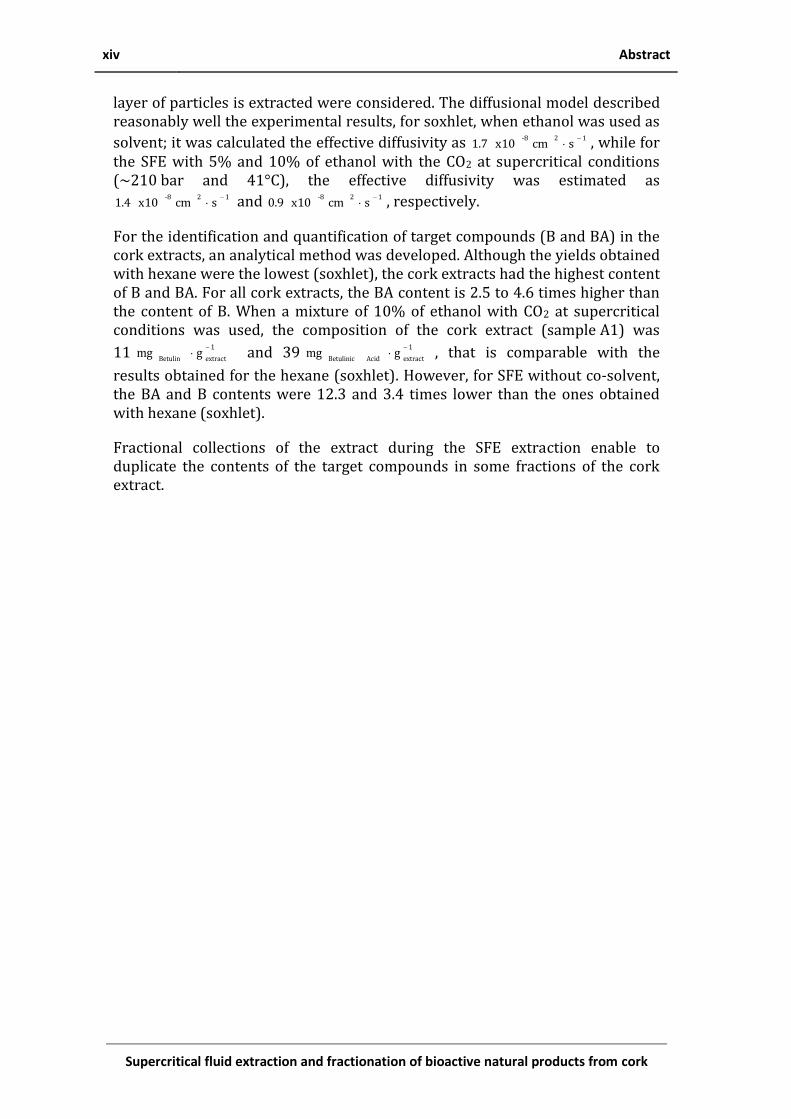
layer of particles is extracted were considered. The diffusional model described reasonably well the experimental results, for soxhlet, when ethanol was used as
solvent; it was calculated the effective diffusivity as 12-8scmx10 1.7
, while for
the SFE with 5% and 10% of ethanol with the CO2 at supercritical conditions (~210 bar and 41°C), the effective diffusivity was estimated as
12-8scmx10 1.4
and 12-8
scmx10 0.9
, respectively.
For the identification and quantification of target compounds (B and BA) in the cork extracts, an analytical method was developed. Although the yields obtained with hexane were the lowest (soxhlet), the cork extracts had the highest content of B and BA. For all cork extracts, the BA content is 2.5 to 4.6 times higher than the content of B. When a mixture of 10% of ethanol with CO2 at supercritical conditions was used, the composition of the cork extract (sample A1) was
11 1
extractBetulingmg
and 39
1
extract AcidBetulinicgmg
, that is comparable with the
results obtained for the hexane (soxhlet). However, for SFE without co-solvent, the BA and B contents were 12.3 and 3.4 times lower than the ones obtained with hexane (soxhlet).
Fractional collections of the extract during the SFE extraction enable to duplicate the contents of the target compounds in some fractions of the cork extract.

Supercritical fluid extraction and fractionation of bioactive natural products from cork
Resumo
A cortiça é a casca do sobreiro (Quercus Suber L.), sendo cem por cento tecido vegetal natural, constituída em média por 14% de extrativos; estes extrativos são principalmente compostos triterpénicos (por exemplo, cerina, betulina - B, friedelina, ácido betulínico - BA) que têm aplicações promissoras como compostos bioativos ou precursores de ingredientes de fármacos. Por isso, estes compostos podem ter um valor muito elevado.
Portugal é o líder mundial na produção, transformação e comercialização da cortiça. Em 2014, o total das vendas da indústria portuguesa de cortiça representaram 1 288 milhões de euros; em termos de massa, isto representa ca. 182 mil toneladas de cortiça por ano. O sector mais importante para a indústria da cortiça é a produção de rolhas de cortiça; no processo de produção de rolhas de cortiça naturais, ca. 60% da matéria-prima inicial é rejeitada; contudo este material não é considerado como desperdício, uma vez que é moído para ser utilizado noutras aplicações, e.g. rolhas técnicas de cortiça, aglomerados, etc.
Este trabalho pretende "acrescentar um novo valor à cortiça", ou seja, pretende utilizar a cortiça como uma "possível" fonte de produtos químicos com elevado valor acrescentado, através da introdução no processo de produção de rolhas de cortiça naturais de um novo passo de valorização, mas sem comprometer o uso habitual do granulado de cortiça.
Para avaliar o potencial deste material como fonte de compostos bioativos, foram extraídas várias amostras (A1 a A9) do granulado industrial de cortiça e pó de cortiça por extração com soxhlet e também usando dióxido de carbono em condições supercríticas (SFE) com e sem co-solvente. Na extração soxhlet foram utilizados solventes com diferentes polaridades; verificou-se que para todas as amostras, o rendimento aumenta com a polaridade do solvente, independentemente do tamanho médio das partículas (ou da densidade da cortiça). Por exemplo, para a amostra A1 (0,75 mm), obteve-se um rendimento
de 94,7, 84,3, 70,4 e 48,5 1
aCortiçaSecextratokgg
para o etanol, a acetona, o
diclorometano e o hexano, respetivamente. Estes resultados constituem uma referência para a extração supercrítica (SFE) com e sem co-solvente.
Os resultados obtidos são compatíveis com a hipótese de que só o pó de cortiça é totalmente extraído, sendo que apenas uma camada externa é extraída para todas as outras partículas de maior tamanho; também, de acordo com os resultados obtidos, esta camada é praticamente constante, para partículas maiores que 1 mm, e para cada solvente.
Para efetuar as extrações supercríticas (SFE), foi projetada, construída e testada uma instalação experimental à escala de bancada (até 80°C e 300 bar). Esta instalação pode ser operada com e sem co-solvente. O maior rendimento obtido usando CO2 supercrítico e sem adicionar co-solvente foi de

xvi Resumo
Supercritical fluid extraction and fractionation of bioactive natural products from cork
19,7 1
Seca Cortiçaextratokgg
a 210 bar e 41°C; quando se adicionou 10% de etanol, o
rendimento aumentou ca. 86% (até 36,6 1
Seca Cortiçaextratokgg
).
Para descrever os resultados experimentais obtidos nas extrações soxhlet e SFE, foram desenvolvidos dois modelos fenomenológicos, um modelo difusional e um modelo de núcleo a contrair (“shrinking core”). Para os dois modelos, considerou-se desprezável a resistência do filme à volta das partículas e que apenas uma camada externa das partículas era extraída. O modelo difusional descreveu razoavelmente bem os resultados experimentais, no caso da extração soxhlet, usando como solvente o etanol; a difusividade efetiva foi estimada como
sendo 12-8scm10 x 1,7
, enquanto que para a SFE com 5% e 10% de etanol na
mistura com CO2 em condições sobrecríticas (~210 bar e 41°C), a difusividade
efetiva estimada foi de -810 x 1,4 e 12-8
scm10 x 0,9
, respetivamente.
Para a identificação e quantificação dos compostos alvo (B e BA) nos extratos de cortiça, foi desenvolvido um método analítico. Embora os rendimentos obtidos com hexano, em termos de massa de extrato por massa de cortiça, tenham sido os mais baixos (soxhlet), os extratos de cortiça têm o maior teor de B e
BA 1
extratoBA or Bgmg
. Para todos os extratos de cortiça, o teor de BA é 2,5 a 4,6
vezes superior ao conteúdo de B. Quando 10% de etanol foi acrescentado ao CO2 em condições sobrecríticas, a composição do extrato de cortiça (amostra A1) foi
de 111
extratoBgmg
e 39 1
extratoBAgmg
, o que é comparável com os resultados
obtidos para o hexano (soxhlet). No entanto, para SFE sem co-solvente, os conteúdos em BA e B foram 12,3 e 3,4 vezes inferiores aos conseguidos com hexano (soxhlet).
A recolha fracionada do extrato durante a extração supercrítica com co-solvente, permitiu duplicar o conteúdo dos compostos alvos em algumas frações do extrato de cortiça.

Supercritical fluid extraction and fractionation of bioactive natural products from cork
Résumé
Le liège est l’écorce du chêne-liège (Quercus Suber L.), étant cent pour cent du tissu végétal naturel, il se compose en moyenne de 14% extractibles ; ces extractibles sont principalement composés triterpéniques (par exemple, cérine, bétuline – B, friedeline, acide bétulinique – BA) qui ont des applications prometteuses telles que des agents bioactifs ou des précurseurs d’ingrédients pharmaceutiques. Par conséquent, ces composés peuvent avoir une valeur très élevée.
Le Portugal est le leader mondial dans la production, la transformation et la commercialisation du liège. En 2014, le total des ventes de l’industrie portugaise du liège ont représenté € 1.288 millions ; ce qui représente, en termes de masse, environ 182.000 tonnes de liège par an. Le secteur le plus important pour l’industrie du liège est la production de bouchons de liège ; dans le processus de production de bouchons en liège naturel, ca. 60% de la charge initiale est rejetée ; toutefois, ce matériau n’est pas considéré comme un déchet, une fois qu’il est broyé pour être utilisé dans d’autres applications, par exemple bouchons techniques de liège, agglomérés, etc.
Ce travail vise à "ajouter une nouvelle valeur au liège", c’est-à-dire, il veut utiliser le liège comme une source "possible" de produits chimiques à haute valeur ajoutée grâce à l'introduction, au processus de production de bouchons en liège naturel, d'une nouvelle étape de valorisation, mais sans compromettre l'utilisation habituelle de granulés de liège.
Pour évaluer le potentiel de ce matériau en tant que source de composés bioactifs, plusieurs échantillons ont été extraits (A1 à A9) du granulé industriel de liège et de la poussière de liège en utilisant le procédé soxhlet et aussi le dioxyde de carbone en conditions supercritiques (SFE) avec et sans co-solvant. Concernant l'extraction soxhlet, plusieurs solvants avec des polarités différentes ont été utilisés ; il a été constaté que, pour tous les échantillons, le rendement augmente avec la polarité du solvant, quelle que soit la taille moyenne des particules (ou la densité du liège). Par exemple, l'échantillon A1 (de 0,75 mm) a
donné un rendement de 94,7, 84,3, 70,4 et 48,5 1
LiègeSecextraitkgg
quand on utilise
l'éthanol, l'acétone, le dichlorométhane et l'hexane, respectivement. Ces résultats fournissent une référence pour l'extraction supercritique (SFE) avec et sans co-solvant.
Les résultats sont cohérents avec l'hypothèse selon laquelle seul le liège en poudre est complètement extrait, et une seule couche externe est extraite pour toutes les autres particules plus grandes ; en outre, d'après les résultats, cette couche est sensiblement constante pour les particules supérieures à 1 mm, et pour chaque solvant.
Une installation expérimentale à l'échelle de laboratoire (jusqu'à 80°C et 300 bar) a été conçue, construite et testée pour effectuer l'extraction supercritique (SFE). Cette installation peut fonctionner avec ou sans co-solvant.

xviii Résumé
Supercritical fluid extraction and fractionation of bioactive natural products from cork
Le rendement le plus élevé obtenu en utilisant le CO2 supercritique et sans
ajouter de co-solvant était de 19,7 1
LiègeSecextraitkgg
à 210 bar et 41°C; lors de
l'ajout de 10% d'éthanol, le rendement a augmenté ca. 86% (jusqu'à
36,6 1
LiègeSecextraitkgg
).
Pour décrire les résultats expérimentaux obtenus dans les extractions soxhlet et SFE on a développé deux modèles phénoménologiques, un modèle de diffusion et un modèle de rétrécissement de nucléo («shrinking core»). Pour les deux modèles, il a été considéré comme négligeable la résistance du film autour des particules et que seulement une couche extérieure des particules était extraite. Le modèle de diffusion décrit assez bien les résultats expérimentaux dans le cas d'une extraction soxhlet, en utilisant de l'éthanol comme solvant ; la diffusivité
effective a été estimée à 12-8scm10 x 1,7
, tandis que pour la SFE avec 5% et
10% d'éthanol en mélange avec le CO2 en conditions surcritiques (~ 210 bar et
41°C), la diffusivité effective estimée était -810 x 1,4 e 12 -8
scm10 x 0,9
,
respectivement.
Pour l’identification et la quantification des composés désirés (B et BA) dans les extraits de liège, une méthode d’analyse a été développée. Bien que les rendements obtenus avec l’hexane, en termes de masse extraite par masse de liège, ont été les plus faibles (soxhlet), les extraits de liège ont la plus haute
teneur en B et BA 1
extraitBA ou Bgmg
. Pour tous les extraits de liège, le contenu de
BA est de 2,5 à 4,6 fois supérieure à la teneur en B. Lorsque 10% d’éthanol est ajouté au CO2 en conditions supercritiques, la composition de l’extrait de liège
(échantillon A1) était de 11 1
extraitBgmg
et 39 1
extraitBAgmg
, ce qui est comparable
aux résultats obtenus avec l’hexane (soxhlet). Cependant, pour la SFE sans co-solvant, les contenus en BA et B étaient 12,3 et 3,4 fois inférieurs à ceux obtenus avec de l’hexane (soxhlet).
La collecte fractionnée de l'extrait pendant l'extraction supercritique avec le co-solvant, a permis de doubler le contenu des composés désirés dans quelques fractions de l’extrait de liège.

Supercritical fluid extraction and fractionation of bioactive natural products from cork
Table of Contents
List of Tables .............................................................................................................................. xxiii
List of Figures .............................................................................................................................. xxv
Introduction ............................................................................................................................ 1 1
1.1 Motivation ....................................................................................................................... 3
1.2 Main Goals and tasks ................................................................................................... 6
1.3 Organization ................................................................................................................... 7
References ..................................................................................................................................10
Cork ..........................................................................................................................................13 2
2.1 Cork, its history and Portugal ................................................................................15
2.2 Cork, its main properties & applications ...........................................................21
2.2.1 Chemical composition of cork .......................................................................22
2.2.2 Applications of cork extractives ...................................................................24
2.3 Manufacturing of cork – The granulated industrial cork ............................28
References ..................................................................................................................................31
Soxhlet Extraction ..............................................................................................................35 3
3.1 Characterization of samples ...................................................................................35
3.1.1 Cork density, bulk density and particle size ............................................37
3.2 Soxhlet extraction .......................................................................................................39
3.2.1 Yields .......................................................................................................................45
3.3 Layer thickness of cork accessible to extraction ............................................47
3.4 Quantification of betulin and betulinic acid .....................................................50
Notation .......................................................................................................................................56
List of Acronyms ......................................................................................................................56
xx Table of contents
Supercritical fluid extraction and fractionation of bioactive natural products from cork
References.................................................................................................................................. 57
Supercritical Fluid Extraction & Experimental Setup .......................................... 59 4
4.1 Supercritical Fluid Extraction (SFE) ................................................................... 60
4.2 Design and construction of a bench-scale supercritical fluid extraction
(SFE) setup ................................................................................................................................ 66
4.2.1 Feed section ......................................................................................................... 67
4.2.2 Extraction section .............................................................................................. 68
4.2.3 Separation section ............................................................................................. 72
4.2.4 Purge ....................................................................................................................... 73
4.2.5 Program – SFE ..................................................................................................... 78
4.3 Startup, operation and shutdown of the SFE bench scale setup .............. 81
4.3.1 Start-up of SFE setup ........................................................................................ 81
4.3.2 Operation of the SFE setup ............................................................................ 82
4.3.3 Shutdown of the SFE ........................................................................................ 83
4.4 Experimental Results ................................................................................................ 84
4.5 Conventional extraction vs. SFE ............................................................................ 85
4.6 SFE setup improvement to add co-solvent ....................................................... 87
4.7 Experimental results, scCO2 and Ethanol .......................................................... 89
Notation ...................................................................................................................................... 92
List of Acronyms ...................................................................................................................... 92
References.................................................................................................................................. 93
Modelling Extraction Process ........................................................................................ 95 5
5.1 Desorption Model ....................................................................................................... 97
5.1.1 Diffusional model ............................................................................................... 99
5.1.2 Shrinking core model .................................................................................... 105
5.2 Validation of models............................................................................................... 111

Table of contents xxi
Supercritical fluid extraction and fractionation of bioactive natural products from cork
Notation .................................................................................................................................... 120
Greek letters ........................................................................................................................... 121
List of Acronyms ................................................................................................................... 121
References ............................................................................................................................... 122
Fractionation of the cork extracts ............................................................................. 123 6
6.1 Soxhlet extraction .................................................................................................... 125
6.2 Supercritical Fluid Extraction (SFE) ................................................................. 126
Conclusions .................................................................................................................................. 129
Future Work ............................................................................................................................... 133
Appendix 1 - Analytical Methods .......................................................................................... 1
Gas Chromatography / Flame Ionization Detector (GC-FID) ................................... 1
Gas Chromatography / Mass Spectrometry (GC-MS) ............................................. 2
References .................................................................................................................................... 4
Appendix 2 - Response Surface Methodology (RSM) ................................................... 1
Design of experiments using response surface methodology .................................. 1
References .................................................................................................................................... 4


Supercritical fluid extraction and fractionation of bioactive natural products from cork
List of Tables
Table 2.1 – Properties and structures for the main triterpenes of cork
extractives .......................................................................................................................................26
Table 3.1 – Particle size, bulk density, apparent density and moisture content of
industrial granulated cork samples. .....................................................................................37
Table 3.2 – Yields obtained in the cork extract from several cork samples ..........42
Table 3.3 – Parameters for the Soxhlet extraction ..........................................................43
Table 3.4 – Yields for sequential extractions of several cork samples. ...................48
Table 4.1 – Critical constants of the main solvents considered in supercritical
extraction. Data from Perry (2008) ......................................................................................61
Table 4.2 – Constants for the equations of melting (Eq. 4.1) sublimation (Eq. 4.2)
and vapour pressures (Eq. 4.3). ..............................................................................................63
Table 4.3. – Density of CO2 -3mkg for the critical point and above it...................64
Table 4.4 – Commercial-scale supercritical CO2 extraction plants and processes.
.............................................................................................................................................................64
Table 4.5 – List of material in the supercritical fluid extraction setup ...................75
Table 5.1 – Dimensionless numbers .................................................................................. 101


Supercritical fluid extraction and fractionation of bioactive natural products from cork
List of Figures
Figure 1.1 – Annual Portuguese sales of cork industry ................................................... 4
Figure 1.2 – a) Distribution of sales of Portuguese cork industry in 2013, b) Cork
sales structure by Product Type in percentage in 2013 ................................................. 4
Figure 1.3 – Scheme of the main sections of this thesis. ................................................. 9
Figure 2.1 – Harvesting cork (http://www.casarosdenportugal.com/portugal-
cork/) ................................................................................................................................................13
Figure 2.2 – Geographical distribution of cork oak. ........................................................15
Figure 2.3 – First draw of cork cellular structure made by Robert Hooke after his
microscope observation (“Robert Hooke,” 2015) ...........................................................17
Figure 2.4 – The first industrial machine to produce cork stopper, the “Garlopa”
(Corticeira_Amorim, 2005) ......................................................................................................18
Figure 2.5 – Percentage of Portuguese corks exports by type of products (1851 –
2000). Data from: Carvalho, A. (2002) .................................................................................19
Figure 2.6 – a) Value of world’s cork exports. b) Percentage of cork exports
according to HS Code Chapter 45: Cork and articles of cork .......................................20
Figure 2.7 – Schematic representation of the axial section of a cork oak stem,
showing the different layers ....................................................................................................21
Figure 2.8 – Diagram of the cellular structure of cork (Gil et al., 2000) .................22
Figure 2.9 – Average chemical composition of cork. ......................................................23
Figure 2.10 – New process step to add a new value to cork ........................................30
Figure 3.1 – Punched cork planks. .........................................................................................36
Figure 3.2 – SEM for samples A1 to A6 that correspond to inner section of plank.
.............................................................................................................................................................36
xxvi List of Figures
Supercritical fluid extraction and fractionation of bioactive natural products from cork
Figure 3.3 – Granulated industrial cork from two sections of cork planks: inner
(A1 to A6) and outer (A7 and A9). ........................................................................................ 38
Figure 3.4 – Total void space ( t ) for each sample vs. average particle size. ....... 39
Figure 3.5 – Internal porosity ( p ) vs. average particle size. ..................................... 39
Figure 3.6 – Schematic representation of a soxhlet extractor. ................................... 40
Figure 3.7 – Conventional method for soxhlet extraction. ........................................... 44
Figure 3.8 – Yields of conventional soxhlet extraction of industrial granulated
cork as a function of particle size, for the three solvents tested: (black) acetone,
(gray) dichloromethane, (light gray) hexane. (A8) cork powder, (A1 to A6) inner
bark and (A7 and A9) outer bark samples. The diamonds represent the average
particle size and the circles the cork density. ................................................................... 45
Figure 3.9 – Dimensionless thickness of the extractable outer cork layer vs.
average particle size. .................................................................................................................. 50
Figure 3.10 – Procedure for derivatization of cork extracts before GC Analysis.51
Figure 3.11 – Betulin (a) and betulinic acid (b) content in each extract sample vs.
particle size, for the three solvents tested. (A8) cork powder, (A1 to A6) inner
bark and (A7 and A9) outer bark samples. Solvents: (black) acetone, (gray)
dichloromethane, (light gray) hexane. The diamonds represent the average
particle size and the circles the cork density. ................................................................... 52
Figure 3.12 – Betulin (a) and betulinic acid (b) contents in each sample vs.
particle size, for the three solvents tested. (A8) cork powder, (A1 to A6) inner
bark and (A7 and A9) outer bark samples. Solvents: (black) acetone, (gray)
dichloromethane, (light gray) hexane. The diamonds represent the average
particle size and the circles the cork density. ................................................................... 54
Figure 4.1 – Physical properties of different phases; adapted
fromFrancis et al. (1999). ......................................................................................................... 60

List of Figures xxvii
Supercritical fluid extraction and fractionation of bioactive natural products from cork
Figure 4.2 – CO2 Phase Diagram..............................................................................................62
Figure 4.3 – PVT diagram of CO2. ...........................................................................................63
Figure 4.4 – Schematic representation of SFE setup ......................................................66
Figure 4.5 – Schematic representation of the feed section. .........................................68
Figure 4.6 – Schematic 3D drawing of feed section of the experimental SFE
setup. .................................................................................................................................................68
Figure 4.7 – Schematic representation of the extraction section of the SFE setup
.............................................................................................................................................................69
Figure 4.8 - 3D drawing of a) the extractor, b) its cover and c) the raw material
basket. ...............................................................................................................................................70
Figure 4.9 – Schematic 3D drawing of the extraction section of the experimental
SFE setup. ........................................................................................................................................71
Figure 4.10 – Schematic representation of the separation section of the SFE
setup. .................................................................................................................................................72
Figure 4.11 – 3D drawing of a) the separator and b) its cover. ..................................72
Figure 4.12 – Schematic 3D drawing of the separation section of the
experimental SFE setup. ............................................................................................................73
Figure 4.13 – Schematic 3D drawing and photo of the SFE setup after
assembling. .....................................................................................................................................74
Figure 4.14 – Principal windows of the SFE Program. ..................................................79
Figure 4.15 – Process windows of the SFE Program ......................................................80
Figure 4.16 – Yields obtained with sample A1 (granulated industrial cork –
particle size 0.75 mm) for the SFE at 41°C in a range of pressures from 170 up to
243 bar. ............................................................................................................................................84

xxviii List of Figures
Supercritical fluid extraction and fractionation of bioactive natural products from cork
Figure 4.17 – Yields obtained with sample A1 (granulated industrial cork –
particle size 0.75 mm) for the SFE at 41, 59 and 78°C and ca. 210 bar. ................. 85
Figure 4.18 – Yields of the conventional solvent extraction vs. SFE (41, 59 and
78°C at ~210 bar). For granulated industrial cork with particle size 0.75 mm
(sample A1) .................................................................................................................................... 86
Figure 4.19 – Betulin and betulinic acid (BA) contents in the different extracts,
soxhlet extraction (acetone, dichloromethane and hexane) and SFE. .................... 87
Figure 4.20 – Flowsheet of SFE setup with co-solvent. ................................................. 87
Figure 4.21 – Schematic 3D drawing of the SFE setup using co-solvent. ............... 88
Figure 4.22 – Yields of the conventional solvent extraction vs. SFE at 41°C and
~185 bar and ~210 bar with different concentrations of ethanol (10%, 5% and
0%). For granulated industrial cork with particle size 0.75 mm (sample A1). ... 90
Figure 4.23 – Contents of betulin and betulinic acid (BA): a) in the extracts and
b) in the cork. For granulated industrial cork with particle size 0.75 mm (sample
A1). For the conventional solvent extraction and SFE at 41°C and ~210 bar with
different concentrations of ethanol (0, 5 and 10%). ...................................................... 91
Figure 5.1 – Considerations to describe a model for extraction processes
(e.g., supercritical fluid extraction). ...................................................................................... 96
Figure 5.2 – Histories of amount of solute in the fluid phase at the outlet of the
packed-bed for different Péclet number values (0.01 to 1000) and Bim = 1.
(a) Nf = Nd = 0.1; (b) Nf = Nd = 1; (c) Nf = Nd = 10 ............................................................. 102
Figure 5.3 – Histories of amount of solute in the fluid phase at the outlet of the
packed-bed. Nf = 0.01 to 10; Nd = 10 and Péclet number is 100. ............................ 103
Figure 5.4 – Histories of amount of solute in the fluid phase at the outlet of the
packed-bed. Nd = 0.01 to 10; Nf = 10 and Péclet number is 100 ............................. 104
Figure 5.5 – Volume used according to internal radius pcc
Rr .................... 105
List of Figures xxix
Supercritical fluid extraction and fractionation of bioactive natural products from cork
Figure 5.6 – Histories of the amount of solute in the fluid phase at outlet of the
packed-bed for several Péclet number values (0.01, 1 and 1000) and Bim = 1.
(a) Nf = Nd = 0.1; (b) Nf = Nd = 1; (c) Nf = Nd = 10 ............................................................. 108
Figure 5.7 – Histories of amount of solute in fluid phase at the outlet of the
packed-bed. Nf = 0.01 to 10; Nd = 10 and Péclet number is 100. ............................ 109
Figure 5.8 – Histories of amount of solute in fluid phase at the outlet of the
packed-bed. Nd = 0.01 to 10; Nf = 10 and Péclet number is 100. ............................ 110
Figure 5.9 – Histories of amount of solute in fluid phase at the outlet of the
packed-bed. Nd = 0.01; 0.1 and 10; Nf = 10 and Péclet number is 100. Diffusional
model is represented by solid lines and shrinking core model by dashes lines
.......................................................................................................................................................... 110
Figure 5.10 – Histories of amount of solute in fluid phase at the outlet of the
packed-bed. Nf = 0.01; 0.1 and 10; Nd = 10 and Péclet number is 100. Diffusional
model is represented by solid lines and shrinking core model by dashed lines
.......................................................................................................................................................... 111
Figure 5.11 – Yields of conventional soxhlet extraction of industrial granulated
cork as a function of particle size, for the different solvents tested: (hexagon-
open) ethanol, (hexagon-half up) acetone, (diamond-half right)
dichloromethane, (diamond-half down) hexane. ......................................................... 112
Figure 5.12 – Dimensionless core radius vs. particle size, for the different
solvents tested: (hexagon-open) ethanol, (hexagon-half up) acetone, (diamond-
half right) dichloromethane, (diamond-half down) hexane. .................................... 113
Figure 5.13 – Histories of amount of solute in fluid phase at the outlet of the
packed-bed. For three particle size of granulated industrial cork: (triangle)
5 mm, (diamond) 0.75 mm and (circle) <0.20 mm – cork powder. Solvent:
Ethanol. Solid lines represent the diffusional model and dash lines represent the
shrinking core model while the red lines show the results for variable Nd. ...... 114

xxx List of Figures
Supercritical fluid extraction and fractionation of bioactive natural products from cork
Figure 5.14 – Histories of Nd value used in diffusional and shrinking core model
for each particle size: (triangle) 5 mm, (diamond) 0.75 mm and (circle)
<0.20 mm – cork powder; the dashed line represents the value of Nd over the
time when was assumed the possible formation of agglomerates (A8*). .......... 114
Figure 5.15 – Nd* (the outer layer extracted) vs. Nd (whole particle). ................. 115
Figure 5.16 – Histories of amount of solute in fluid phase at the outlet of the
packed-bed; for sample A1 (0.75 mm). a) CO2 and 5% ethanol and b) CO2 and
10% ethanol. Pressure ~210 bar and 40°C. Continuous lines represent the
diffusional model and dashed dot lines represent the shrinking core model. .. 117
Figure 5.17 – Histories of amount of solute in fluid phase at the outlet of the
packed-bed; for sample A1 (0.75 mm) and CO2 and 10% ethanol at ~210 bar
and 40°C. Continuous lines represent the diffusional model and dashed dot lines
represent the shrinking core model considering a variable Nd .............................. 118
Figure 5.18 – Histories of amount of solute in fluid phase at the outlet of the
packed-bed. For sample A5 (5 mm) using 10% ethanol and pressure ~210 bar
and 40°C. Continuous line represents the diffusional model and dashed dot line
represents the shrinking core model. ............................................................................... 119
Figure 6.1 – Yields obtained for Soxhlet (ethanol, acetone, dichloromethane and
hexane) and scCO2 without co-solvent (at ~210bar and 41°C) for granulated
industrial cork; samples A8 (powder), A1 (0.75 mm) and A5 (5 mm) ................ 123
Figure 6.2 – Betulinic acid and betulin content a) in the cork extract and b) in
the cork; for Soxhlet (ethanol, acetone, dichloromethane and hexane) and scCO2
without co-solvent (at ~210bar and 41°C) for granulated industrial cork,
samples A8 (powder), A1 (0.75 mm) and A5 (5 mm). ............................................... 124
Figure 6.3 – Betulinic acid and betulin contents in the cork extracts for Soxhlet
extraction at different times. Solvent: Ethanol. Samples: A8 (cork powder),
A1 (0.75 mm) and A5 (5 mm). ............................................................................................. 126

List of Figures xxxi
Supercritical fluid extraction and fractionation of bioactive natural products from cork
Figure 6.4 – Betulinic acid and betulin contents in the cork extracts for SFE with
10% ethanol at different times, (0-1h; 1-2h and 2-3h). Operating conditions:
~210 bar and 41°C. .................................................................................................................. 127
Figure 6.5 – Betulinic acid and betulin contents in the cork extracts for SFE at
different times. Co-solvent: Ethanol. Operating conditions: ~210 bar and 41°C.
For granulated industrial cork (0.75 mm – sample A1). ............................................ 128


Supercritical fluid extraction and fractionation of bioactive natural products from cork
Introduction 1Natural products are chemical compounds produced by a biological source
(Bart, 2011) and they commonly have biological activity that may have
therapeutic benefits in treating some diseases, wherein these products
generally represent, in traditional medicines, the active
components (Brahmachari, 2010). Then, it is possible that the extraction of
those natural products has aroused a huge interest, probably since the
discovery of fire (Chemat et al., 2012).
Nowadays, several studies are being done to evaluate the potential to obtain
bioactive compounds from natural products; wherein bark, branches, roots,
rhizomes, seeds, fruits, leaves and also flowers can be sources of those
products (Azmir et al., 2013; Bart, 2011; Gan et al., 2011; Martins et al., 2011;
Wijngaard et al., 2012). And the extraction techniques have been focused on
finding a clean, sustainable and efficient process (Azmir et al., 2013; Ghafoor et
al., 2010; Martinez et al., 2011; Mendiola et al., 2013; Pereira, C. G. et al., 2009;
Shi et al., 2007; Wijngaard et al., 2012). In this way, de Melo, M., et al. (2014)
published a work that summarizes a wide-range of extracts from vegetable
matrices using supercritical fluid in a period larger than a decade, being the
work of Castola et al. (2005) the unique reported as using carbon dioxide at
supercritical condition to powdered cork extraction.
“Cork is 100% natural, 100% recyclable and…
‘essentially' Portuguese.”

2 Introduction
Supercritical fluid extraction and fractionation of bioactive natural products from cork
Cork is the bark of the cork oak (Quercus Suber L.); it is a hundred percent
natural plant tissue that consists of a honeycomb of microscopic cells. This
natural product conceals a fraction of non-structural compounds, the
extractives, which can be easily extracted.
According to the literature, the cork extractives are mainly constituted by
polyphenols, long chain alkanols, triterpenes and, in minor quantities, long
chain fatty acids (Castola et al., 2002, 2005, Conde et al., 1998, 1999a, 1999b;
Cordeiro et al., 1998; Pereira, H., 1988, 2013; Sousa et al., 2006). The main
triterpenes identified were friedelin, cerin, betulin and betulinic acid that have
promising applications as bioactive compounds or as precursors to drug
ingredients (Alakurtti et al., 2006; Cichewicz et al., 2004; Sousa et al., 2006).
They also have some cosmetics applications (Betulin, 2009b; “Skin Actives
Scientific,” 2015); e.g. Birken AG1, produces a series of lotions and creams to
skin care that use betulin as active ingredient in their formulations; likewise the
pantent US5529769A (Cho et al., 1996) shows the betulinic acid as main content
in some cosmetic applications.
It is to remark that friedelin has been studied and described as antioxidant, anti-
inflammatory or even as an anti-cancer agent (Antonisamy et al., 2011; Silva et
al., 2005); betulin possesses a wide range of biological capabilities including
anti-viral, anti-inflammatory, and anti-cancer properties (Wu et al., 2014); and
betulinic acid has a moderate anti-inflammatory activity (Costa et al., 2014) and
it has also been tested in the treatment of melanoma and other serious diseases
(Betulin, 2009a).
The world’s area of cork oak forests is ca. 2,139,942 hectares, and the
Portuguese forest has the first place, with ca. 34% of this area; however, with
refers to the national forest inventory, the cork oak represents only a 23% of
the Portuguese forest area by species, the second place, after the
Eucalyptus (APCOR, 2013, 2014).
1 Birken AG was founded in 2000 in Niefern-Öschelbronn, Germany; this is a biopharmaceutical and dermo-cosmetic company.
Motivation 3
Introduction
The development of efficient and sustainable processes for the extraction of
those high added-value products from cork have an enormous positive impact.
Since the cork may be used in its common applications after being subjected to
the extraction process, which means a new value added to cork, as a result of
introducing new markets and products. Removal of cork extractives may not
modify the internal structure of cork (Pereira, H., 2007).
1.1 Motivation
Cork has an enormous relevance to Portugal, both culturally and economically.
The cork oak is considered a national heritage, being established as the
Portugal's national tree since December 22, 2011 (Resolução da Assembleia da
República nº 15/2012). Its forest has been legally protected for centuries, the
only way to cut them down being their recognition as unproductive by the
forestry department; the Portuguese law also protects its harvest to ensure the
quality of this resource (“Cork Institute of America,” 2008). Portugal is the
world leader in the production, processing and marketing of cork, making the
cork industry sector very relevant to the Portuguese economy.
More than 50% of the worldwide sales of cork products are assumed by the
Portuguese cork industry; Figure 1.1 shows the total sales value for the
Portuguese cork industry in the period from 2000 to 2014; in average, this
industry represents to Portuguese economy 1 142 million euros in sales by year.

4 Motivation
Supercritical fluid extraction and fractionation of bioactive natural products from cork
Figure 1.1 – Annual Portuguese sales of cork industry2
In 2014, the total sales of Portuguese cork industry was 1 288 million euros,
where ca. 37% corresponds to the national market (Figure 1.2a). Likewise, the
total sales associated to cork stoppers (both natural and agglomerated) are 71%
(Figure 1.2b). The most important sector to the cork industry is still, without
doubt, the production of cork stoppers, being the wine industry the main focus.
a)
b) Figure 1.2 – a) Distribution of sales of Portuguese cork industry in 2013, b) Cork sales
structure by Product Type in percentage in 20133
In the process of natural cork stoppers production ca. 60% of initial raw
material is rejected, but it is not waste, since it can be used in other applications,
e.g. cork powder can be used as a source of energy (Gil, 1997). Then, in the way
2 Corresponding to code 16290 (Cork Industry), according to CAE-Rev.3 (Portuguese Classification of Economic Activities – Revision 3). 3 Value corresponding to code 16290 (Cork Industry), according to code CAE-Rev.3 (Portuguese Classification of Economic Activities – Revision 3).

Motivation 5
Introduction
to produce a natural cork stopper the selected planks are punched, these planks
after punching, as well as the material without the specifications to be a natural
cork stopper, are granulated and automatically separated into different sizes
and densities according to their subsequent application, from technical to
agglomerated stoppers, agglomerates for floor and wall coverings, flooring
panels, decorative home and office items, works of art and design, shoe soles,
applications for the automobile industry, among many others (APCOR, 2009).
Even the cork powder can be burned to generate energy (Gil, 1997); in the cork
industry it is possible to take advantage of all the material, i.e., “nothing is
waste”.
A few studies define cork as a “possible” source of high-added value
chemicals (Cordeiro et al., 1998; Pereira, H., 2007; Silvestre et al., 2008), as a
consequence of its chemical composition; however, until now, to the author best
knowledge, there is no evaluation of the particular use proposed in this work.
Nowadays, supercritical fluid extraction (SFE) has been widely used to
successfully extract some compounds from natural matter (de Melo et al., 2014;
Reverchon et al., 2006). SFE is a flexible process since a continuous modulation
of the solvent-power/selectivity is possible; also, SFE avoids the expensive post-
processing of the extracts for the solvent elimination, once it avoids the use of
polluting organic solvents. Moreover, the use of the carbon dioxide presents
several advantages as supercritical fluid; it is cheap, readily available, safe, and
allows operating at relatively low pressures and near-room temperatures.
In the cork industry, SFE has been applied to extract the 2,4,6-Trichloroanisole
(TCA) and other contaminants from granulated cork, being the TCA (so-called
cork taste) one of the most sensitive points in the worldwide cork and wine
industries (Silva et al., 2005); through the DIAMANT® process the granulated
industrial cork is pretreated with supercritical CO2 to remove all contaminants,
and ensuring lower level of TCA in cork, with the aim to produce a clean cork
stopper (Iversen et al., 2012; NATEX, 2011; Sanjuan, 2010; “Tecnología
Diamant,” 2011). In the same way, there is a patent with a “method to direct
treatment of natural cork stoppers, using supercritical fluid” (Da Ponte et al.,

6 Main Goals and tasks
Supercritical fluid extraction and fractionation of bioactive natural products from cork
2010; Lumia et al., 2001, 2007) the properties and shape of the cork stoppers,
after the treatment, are unchanged.
It is to highlight that, until now, all processes are focused in solving the problem
of contaminants to preserve the market of cork stoppers; they do not introduce
a new value for the cork industry, i.e., cork was not explored as a potential
source of high added-value chemicals, keeping its traditional uses.
If one considers that over 15,000 million cork stoppers are produced each year,
even if only a small percentage leads to cork taste, serious economic
implications arise, especially in wines and champagnes of high commercial
value (Silva et al., 2005). In fact, as consequence of cork taste problems, some
alternative products to cork stoppers are emerging over the years; however, the
“unique” cork’s properties still associate the best wines with natural cork
stoppers.
The main purpose of this work is the development of a sustainable, clean and
efficient process for the extraction of triterpenic compounds from cork that
would add value to granulated industrial cork and cork powder. The key idea is
to extract from cork very high added-value compounds, maintaining the
traditional applications for the cork, after extraction; e.g., it is known that cork
powder is burned to produce energy; this material may be an abundant source
of valuable triterpenic compounds, that can be extracted prior to combustion.
1.2 Main Goals and tasks
The main objective of this work is to “Add a New Value to Cork”. Since, it does
not intend to replace traditional cork applications but to introduce in the cork
mill process a valorisation step as a means of getting additional value to cork
and enlarging its markets.
Several samples of granulated industrial cork with different particle sizes (0.5 to
6 mm) and also of cork powder were studied.

Organization 7
Introduction
A conventional extraction (soxhlet) was performed to be a reference for the
supercritical fluid extraction (SFE). In the soxhlet extraction, several solvents
with different polarities were used.
An experimental setup for supercritical fluid extraction at bench scale (ca.
200 mL extraction vessel) using carbon dioxide up to 80 °C and 300 bar, was
designed, assembled and tested. In a second stage, this experimental setup was
adapted to use mixtures of CO2 and co-solvent, for the same range of
temperature and pressure.
It was necessary to analyse cork extracts both from conventional (soxhlet) and
supercritical fluid extraction (SFE). An analytical method had to be
implemented with the purpose to identify and quantify the compounds
extracted, for example, by GC-FID and GC-MS.
The SFE was performed at bench scale in order to optimize the extraction yield
and the extract composition by changing parameters as pressure, temperature,
extraction time. Preliminary tests of SFE provided information on the effect of
all those parameters individually. Due to the particular and increasing interest
in friedelin, betulin (B), betulinic acid (BA) and their derivatives, special
attention was paid to obtain a rich fraction of these compounds.
1.3 Organization
In this first chapter, it was described the relevance and motivation of this work
that pretend to add a new value to cork, enlarging its markets; the main goals
were listed.
The 2nd chapter was focused on cork, its properties, uses and main applications
through time; in last years the production of natural cork stoppers represents
more than a half of billed of cork industry, the granulated industrial cork used in
this work generated as a by-product of that process.
A conventional solvent extraction (soxhlet) was studied, in the third chapter, as
a reference to the supercritical extraction; all cork samples were extracted with

8 Organization
Supercritical fluid extraction and fractionation of bioactive natural products from cork
solvents with different polarity, hexane, dichloromethane and acetone; also,
ethanol was used for smaller and larger particle sizes. To follow, the
supercritical fluid extraction (SFE) setup was design and assembly, to
performed extraction using CO2 at supercritical conditions with and without co-
solvent (ethanol). The yields obtained with soxhlet and SFE were compared
(Chapter 4).
The fifth chapter summarized a phenomenological model of the supercritical
fluid extraction of bioactive compounds from cork in order to optimize the
process. To follow (Chapter 6), the histories for the composition of the cork
extracts were analysed for both extractions, soxhlet and SFE. And last chapter
reported the principal conclusions to this research and also several tasks were
proposed as future work. Figure 1.3 depicts the global organization of the thesis.

Organization 9
Introduction
Fig
ure
1.3
– S
chem
e o
f th
e m
ain
sec
tio
ns
of
this
th
esis
.

Supercritical fluid extraction and fractionation of bioactive natural products from cork
References
Alakurtti, S., Mäkelä, T., Koskimies, S., and Yli-Kauhaluoma, J. (2006). “Pharmacological properties of the ubiquitous natural product betulin.” European Journal of Pharmaceutical Sciences, 29(1), 1–13. doi:10.1016/j.ejps.2006.04.006
Antonisamy, P., Duraipandiyan, V., and Ignacimuthu, S. (2011). “Anti-inflammatory, analgesic and antipyretic effects of friedelin isolated from Azima tetracantha Lam. in mouse and rat models.” The Journal of Pharmacy and Pharmacology, 63(8), 1070–1077. doi:10.1111/j.2042-7158.2011.01300.x
APCOR. (2009). “Yearbook 2009.” Associação Portuguesa da Cortiça.
APCOR. (2013). “Yearbook 2013.” Associação Portuguesa da Cortiça.
APCOR. (2014). “Yearbook 2014.” Associação Portuguesa da Cortiça.
Azmir, J., Zaidul, I. S. M., Rahman, M. M., Sharif, K. M., Mohamed, a., Sahena, F., … Omar, a. K. M. (2013). “Techniques for extraction of bioactive compounds from plant materials: A review.” Journal of Food Engineering, 117(4), 426–436. doi:10.1016/j.jfoodeng.2013.01.014
Bart, H.-J. (2011). “Extraction of Natural Products from Plants–An Introduction.” In H.-J. Bart & S. Pilz (Eds.), Industrial Scale Natural Products Extraction (First Edit, pp. 1–26). WILEY-VCH Verlag GmbH. doi:10.1002/9783527635122
Betulin. (2009a). “Betulin.” Retrieved March 1, 2015, from http://www.betulin.ca/
Betulin. (2009b). “Betulin and Birch Bark Extract.” Retrieved March 1, 2015, from http://betulin.ca/betulin-for-cosmetics.html
Brahmachari, G. (2010). “Handbook of Pharmaceutical Natural Products.” (Wiley-VCH, Ed.). Weinheim.
Castola, V., Bighelli, A., Rezzi, S., Melloni, G., Gladiali, S., Desjobert, J.-M., and Casanova, J. (2002). “Composition and chemical variability of the triterpene fraction of dichloromethane extracts of cork (Quercus suber L.).” Industrial Crops and Products, 15(1), 15–22. doi:10.1016/S0926-6690(01)00091-7
Castola, V., Marongiu, B., Bighelli, A., Floris, C., Laı, A., and Casanova, J. (2005). “Extractives of cork (Quercus suber L.): chemical composition of dichloromethane and supercritical CO2 extracts.” Industrial Crops and Products, 21(1), 65–69. doi:10.1016/j.indcrop.2003.12.007
Chemat, F., Vian, M. A., and Cravotto, G. (2012). “Green extraction of natural products: concept and principles.” International Journal of Molecular Sciences, 13(7), 8615–27. doi:10.3390/ijms13078615
Cho, S. H., Gottlieb, H., and Santhanam, U. (1996). “Cosmetic Compositions Containing Betulinic Acid.” United States Patent: US005529769A.
Cichewicz, R. H., and Kouzi, S. A. (2004). “Chemistry, biological activity, and chemotherapeutic potential of betulinic acid for the prevention and treatment of cancer and HIV infection.” Medicinal Research Reviews, 24(1), 90–114. doi:10.1002/med.10053
Conde, E., Cadahía, E., Garcia-Vallejo, M. C., and Gonźalez-Adrados, J. R. (1998). “Chemical Characterization of Reproduction Cork from Spanish Quercus Suber.” Journal of Wood Chemistry and Technology, 18(4), 447–469. doi:10.1080/02773819809349592
Conde, E., Garcia-Vallejo, M. C., and Cadahía, E. (1999a). “Waxes composition of Quercus

References 11
Introduction
suber reproduction cork from different Spanish provenances.” Wood Science and Technology, 33(4), 271–283. doi:10.1007/s002260050115
Conde, E., Garcia-Vallejo, M. C., and Cadahía, E. (1999b). “Waxes composition of reproduction cork from Quercus suber and its variability throughout the industrial processing.” Wood Science and Technology, 33(3), 229–244. doi:10.1007/s002260050112
Cordeiro, N., Belgacem, M. N., Silvestre, A. J. D., Neto, C. P., and Gandini, A. (1998). “Cork suberin as a new source of chemicals. 1. Isolation and chemical characterization of its composition.” International Journal of Biological Macromolecules, 22(2), 71–80. doi:10.1016/S0141-8130(97)00090-1
“Cork Institute of America.” (2008). Retrieved December 1, 2014, from http://www.corkinstitute.com/
Costa, J. F. O., Barbosa-Filho, J. M., de Azevedo Maia, G. L., Guimarães, E. T., Meira, C. S., Ribeiro-dos-Santos, R., … Soares, M. B. P. (2014). “Potent anti-inflammatory activity of betulinic acid treatment in a model of lethal endotoxemia.” International Immunopharmacology, 23(2), 469–474. doi:10.1016/j.intimp.2014.09.021
Da Ponte, M. L., Lopes, J. A., Vesna, N.-V., Manic, M., Mesquita, A. C., Da Silva, R. P., and Allegro, I. M. (2010). “Method for direct treatment of cork stoppers, using supercritical fluids.” WO 2010093273 A1.
de Melo, M. M. R., Silvestre, A. J. D., and Silva, C. M. (2014). “Supercritical fluid extraction of vegetable matrices: Applications, trends and future perspectives of a convincing green technology.” The Journal of Supercritical Fluids. doi:10.1016/j.supflu.2014.04.007
Gan, C.-Y., and Latiff, A. A. (2011). “Optimisation of the solvent extraction of bioactive compounds from Parkia speciosa pod using response surface methodology.” Food Chemistry, 124(3), 1277–1283. doi:10.1016/j.foodchem.2010.07.074
Ghafoor, K., Park, J., and Choi, Y.-H. (2010). “Optimization of supercritical fluid extraction of bioactive compounds from grape (Vitis labrusca B.) peel by using response surface methodology.” Innovative Food Science & Emerging Technologies, 11(3), 485–490. doi:10.1016/j.ifset.2010.01.013
Gil, L. (1997). “Cork powder waste: An overview.” Biomass & Bioenergy, 13(1–2), 59–61.
Iversen, S., Felsvang, K., Larsen, T., Luthje, V., and Henriksen, O. (2012). “A method and process for controlling the temperature, pressure and density profiles in dense fluid processes and associated apparatus.” WO 2005/049170.
Lumia, G., Perre, C., and Aracil, J.-M. (2001). “Methods for treating and extracting cork organic compounds, with a dense fluid under pressure.” France: AU 200075317.
Lumia, G., Perre, C., and Aracil, J.-M. (2007). “Method for treating and extracting cork organic compunds, with a dense fluid under pressure.” France: US 007192490B1.
Martinez, J. L., and Tapriyal, D. (2011). “Supercritical Fluid Extraction of Bioactive Compounds from Cereals.” In Fruit and Cereal Bioactives. doi:10.1201/b10786-24
Martins, S., Mussatto, S. I., Martínez-Avila, G., Montañez-Saenz, J., Aguilar, C. N., and Teixeira, J. a. (2011). “Bioactive phenolic compounds: production and extraction by solid-state fermentation. A review.” Biotechnology Advances, 29(3), 365–73. doi:10.1016/j.biotechadv.2011.01.008
Mendiola, J. A., Ibáñez, E., and Herrero, M. (2013). “Compressed fluids for the extraction of bioactive compounds.” Trends in Analytical Chemistry, 43, 67–83. doi:10.1016/j.trac.2012.12.008

12 References
Supercritical fluid extraction and fractionation of bioactive natural products from cork
NATEX. (2011). “New Application.”
Pereira, C. G., and Meireles, M. A. a. (2009). “Supercritical Fluid Extraction of Bioactive Compounds: Fundamentals, Applications and Economic Perspectives.” Food and Bioprocess Technology, 3(3), 340–372. doi:10.1007/s11947-009-0263-2
Pereira, H. (1988). “Chemical composition and variability of cork from Quercus suber L.” Wood Science and Technology, 22(3), 211–218. doi:10.1007/bf00386015
Pereira, H. (2007). “Cork: biology production and uses” (1st ed.). Lisbon: Elsevier.
Pereira, H. (2013). “Variability of the Chemical Composition of Cork.” BioResources, 8(2), 2246–2256.
Reverchon, E., and de Marco, I. (2006). “Supercritical fluid extraction and fractionation of natural matter.” The Journal of Supercritical Fluids, 38(2), 146–166. doi:DOI 10.1016/j.supflu.2006.03.020
Sanjuan, B. (2010). “Method for extractiong organic compounds from granulated cork.” Spain: EP 2404647 A1.
Shi, J., Kassama, L. S., and Kakuda, Y. (2007). “Supercritical Fluid Technology for Extraction of Bioactive Components.” In Functional Food Ingredients and Nutraceuticals. Taylor & Francis Group.
Silva, S. P., Sabino, M. A., Fernandes, E. M., Correlo, V. M., Boesel, L. F., and Reis, R. L. (2005). “Cork: properties, capabilities and applications.” International Materials Reviews, 50(4), 345–365. doi:10.1179/174328005X41168
Silvestre, A. J. D., Neto, C. P., and Gandini, A. (2008). “Cork and Suberins: Major Sources, Properties and Applications.” In Monomers, Polymers and Composites from Renewable Resources (p. 549). Elsevier.
“Skin Actives Scientific.” (2015). Retrieved March 1, 2015, from http://www.skinactives.com/betullinic-acid.html
Sousa, A. F., Pinto, P. C. R. O., Silvestre, A. J. D., and Neto, C. P. (2006). “Triterpenic and other lipophilic components from industrial cork byproducts.” Journal of Agricultural and Food Chemistry, 54(18), 6888–6893. doi:10.1021/Jf060987+
“Tecnología Diamant.” (2011). Europacork, 37.
Wijngaard, H., Hossain, M. B., Rai, D. K., and Brunton, N. (2012). “Techniques to extract bioactive compounds from food by-products of plant origin.” Food Research International, 46(2), 505–513. doi:10.1016/j.foodres.2011.09.027
Wu, Q., Li, H., Qiu, J., and Feng, H. (2014). “Betulin protects mice from bacterial pneumonia and acute lung injury.” Microbial Pathogenesis, 75, 21–28. doi:10.1016/j.micpath.2014.08.005

Supercritical fluid extraction and fractionation of bioactive natural products from cork
Cork 2Cork corresponds to the thick bark of Quercus Suber L. (commonly known as
cork oak) that can be harvested (Figure 2.1), almost completely, without killing
or endangering the tree, which is a rare characteristic, since most plant species
die when a ring of bark is harvested (APCOR, 2009; Silva et al., 2005). Besides,
after harvested, the cork oak can produce even more cork than one that never
was harvested. This species is native of the western Mediterranean region, and
lives about 150 – 200 years and it usually grows to a height of 15 to 20 meters.
Figure 2.1 – Harvesting cork (http://www.casarosdenportugal.com/portugal-cork/)
The cork may be easily stripped off from the tree in late spring and early
summer when the phellogen is in full activity (cell generation), allowing an easy
separation of the cork layers (Silva et al., 2005). In Portugal, this process is
made between May and July.
“Cork is an unique natural material
from past to present, ensuring the future”
14 Cork
Supercritical fluid extraction and fractionation of bioactive natural products from cork
The first harvest occurs when the tree has about 20 – 30 years of age and its
diameter reaches 25 cm; this extracted material is known as “virgin cork”, it has
an irregular structure, thickness and density, and it also is hard-rough (Silva et
al., 2005). “Virgin cork” is only used for insulation, cork board, gaskets, shoe
soles, etc. The following stripping off usually occurs 9 – 12 years later,
depending on the culture region; in Portugal, harvesting takes place each
9 years.
The second harvest, “reproduction cork”, has a more regular structure, being less
hard; however, it is still not suitable for cork stoppers. The next harvest, i.e., the
second cycle of 9 – 12 years, results in a material with a better quality, called
“amadia”; this cork is mainly used to cork stoppers production, essentially to
the wine sector. Until then, the farmers invested over 40 years; the wise country
folks say “plant a cork oak forest for your grandchildren”.
Even today, cork stripping continues to be a delicate process, because it is
achieved with traditional tools and methods using an axe; being one of the
better paid in seasonal agriculture works, since it requires qualified staff, i.e.,
with experience. The regular harvesting improves the health and vigour of the
tree. When cork is removed from the tree a new layer begins to grow again, and
this resource is constantly replaced. In average, each cork oak tree provides an
average of 16 harvests over its lifespan.
The yield of stripping cork depends upon the size and age of the tree; it has
enormous variation and can reach from twenty to seventy-five kg per tree;
regarding the thickness of planks, they may have from about 1.27 up to
6.85 cm (Stecher, 1914, p. 17).
Cork is 100% natural, renewable and biodegradable (WWF, 2006). The human
being took advantage of this noble material, even before knowing about its
structure or its chemical composition, and its value continues to grow over the
years; the section “2.1 Cork, its history and Portugal” describe a brief history of
cork and how Portugal became the world leader in its production, processing
and marketing. Likewise, in section “2.2 Cork, its main properties & applications”,
some of its applications that result from its distinctive cellular structure as well

Cork, its history and Portugal 15
Cork
as its chemical composition (Pereira, 2007; Pereira et al., 1987) will be
described. In the last section, of this chapter, it is summarized the
manufacturing process for the production of natural cork stoppers, i.e., it shows
the origin of the granulated used in this work.
2.1 Cork, its history and Portugal
The cork oak was established in the Mediterranean region around ten thousand
years ago, and it is distributed today as shown in Figure 2.2; however, the first
tree identified as a cork oak dates back from millions of
years (Cork_Information_Bureau, 2010). This species is typical of the
Mediterranean region, its first known application was as fishing tackle, and it
was found in China, Egypt, Babylon and Persia nearly
3000 B.C. (Cork_Information_Bureau, 2010).
Figure 2.2 – Geographical distribution of cork oak.
In some Egyptian sarcophagus from the 5th century B.C., amphorae with cork
lids for foodstuffs storage were found (Cork_Information_Bureau, 2010). While,
several objects made of cork from the 4th century B.C. were found in Italy, such
as floats, sandals (footwear), stoppers for casks and roofing materials (APCOR,
2015a). Theophrastus, an ancient Greek philosopher (4th-3th century B.C.),
refers in his botanical treatise “Historia Plantarum”, that cork oak has the ability
to renew its bark after removing it, and the new bark had a better quality than
the previous one (Carvalho M., 2002; Cooke, 1931; Cork_Information_Bureau,
2010).

16 Cork, its history and Portugal
Supercritical fluid extraction and fractionation of bioactive natural products from cork
The cork uses were continuously increasing; Virgil (70 - 19 B.C.) referred that
cork slabs were used for houses roofs, and Roman soldiers also used cork in
their helmets against the sun heat, taking advantage of its properties as a
thermal insulator (Cooke, 1931; Cork_Information_Bureau, 2010).
For centuries, this novel material was applied as one of the most versatile and
broadly accepted raw materials found in nature. In the 1st century, Gaius Plinius
Secundus, a Roman naturalist, known as Pliny the Elder, made an extensive
reference to cork oaks in his “Naturalis Historia” (1669); he described that this
particular tree, in Greece, had a high value, considering it as a symbol of honour,
being the priests the only ones that were allowed to cut them down
(Cork_Forest_Conservation_Alliance, 2015). Moreover, in the 2nd century A.D.,
Dioscorides, a Greek physician, pharmacologist and botanist, remarks some of
its medicinal applications, specifically against baldness (Carvalho M., 2002;
Pereira, 2007).
With regards to environmental protection legislation, Portugal was the pioneer.
In 1292, Dinis, king of Portugal, banned the cutting down of cork oaks in
“Alcáçovas”; being the first explicit reference to cork extraction
activity (Carvalho M., 2002).
In medieval Europe, the main use of cork was as soles for footwear that provide
isolation against the cold castles floor, particularly in winter. The use of cork as
nowadays is known, i.e., as stopper for bottles holding liquids, took place only
after the late 1500s (Taber, 2007).
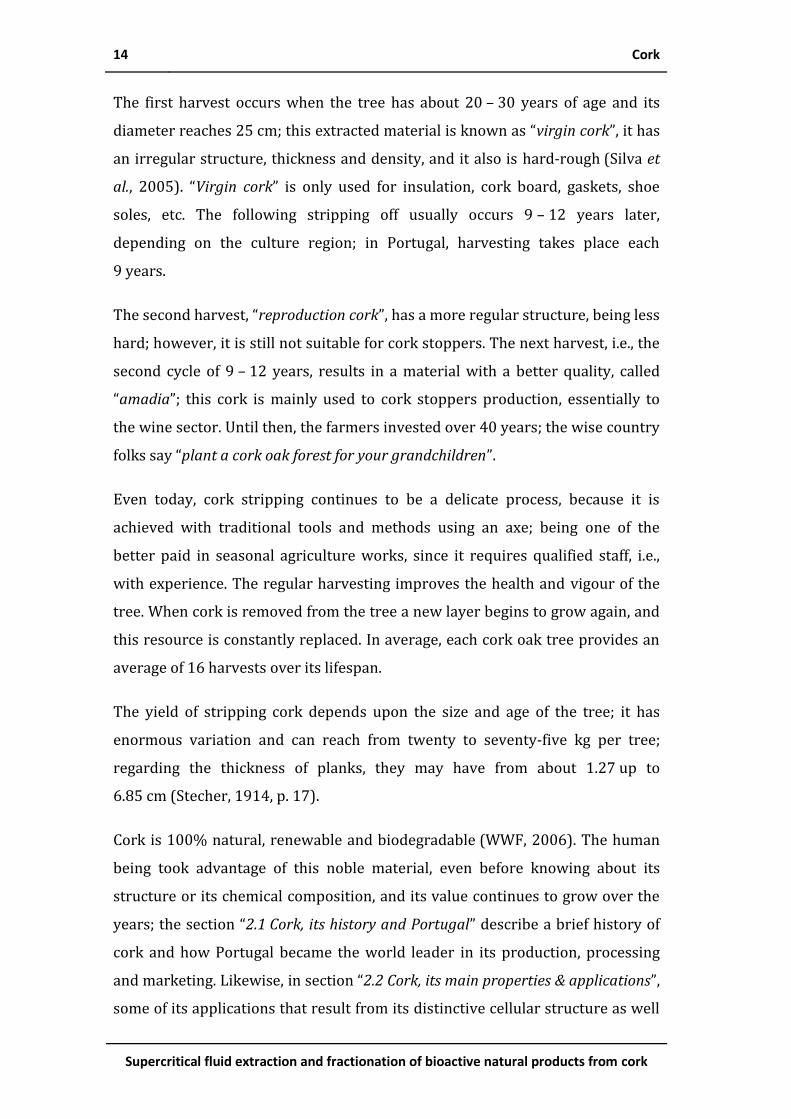
On the other hand, in the early 1660s, Robert Hooke, an English physicist, was
the first to observe cork through a microscope that he developed with fifty-
times magnification, more than others at that time (Taber, 2007, p. 6); Hooke
through its lens plainly perceived the structure of this material, all perforated
and porous, comparable with a honey-comb, and also made rigorous drawings
of its cellular structure; a reproduction of Hooke’s drawings about cork cell
structure is shown in Figure 2.3; he also calculated that in a cubic inch of cork
must be approximately twelve hundred million cells (Taber, 2007, p. 6).
Cork, its history and Portugal 17
Cork
Figure 2.3 – First draw of cork cellular structure made by Robert Hooke after his
microscope observation (“Robert Hooke,” 2015)
Nowadays, no one knows for sure when it was the first time that cork were used
as known at present time as cork stoppers. However, some stories refer that in
the last quarter of the 17th century A.D., the French Benedictine monk Dom
Pierre Pérignon was the first to seal its Champagne bottles with cork.
Apparently, two Spanish monks on their way to Sweden visited the Abbey of
Hautvillers, and they were using cork stoppers in their water gourds; then, Dom
Pérignon inquired his visitors about those stoppers, and they described that
they came from the bark of a tree that grew in Catalonia and provided a great
way to seal a container. Afterwards, Dom Pérignon started to use cork to seal its
famous champagne (1680). Despite this history be widely accepted, the true is
that he was not the first to use cylindrical cork; sparkling wine was already
marketed during the 60s and 70s of the 17th century, before Pérignon monks
started to use it (Taber, 2007). Nonetheless, in this period the use of cork
stopper bloomed, being known that the choice was also assumed by Ruinart
Reims (1729) and by Moët et Chandon (1743), which is similar to today’s
practice (Carvalho M., 2002; Cork_Information_Bureau, 2010).
Initially, the manufacturing process to produce natural cork stoppers was
completely manual; experienced workers cut the stoppers by hand, producing
about three stoppers per minute (Peres, 1988 Reminiscências de há 50 anos.
Suplemento do Boletim da Junta Nacional da Cortiça Nº 600, pp. 71-75). The 19th

18 Cork, its history and Portugal
Supercritical fluid extraction and fractionation of bioactive natural products from cork
century was characterized by the development of the cork industry, highlighting
that the production process was systematized. In 1820, the “garlopa”, that was
the first machine to manufacture stoppers, appeared (Figure 2.4), which
allowed the systematic production of cylindrical corks, increasing their
production, and it was possible to achieve values three times larger than that of
an experienced worker (Pestana et al., 2009); over time, auxiliary equipment
arose, such as machines for stopper counting and calibration (APCOR, 2015b).
Figure 2.4 – The first industrial machine to produce cork stopper, the “Garlopa”
(Corticeira_Amorim, 2005)
The systematization of the production process brought an increase of the
market, and the waste generated by the natural cork stoppers production
started to be used in new applications; then agglomerated cork was developed.
In 1891, John Smith verified that when granulated cork is overheated, it is
possible to obtain agglomerated cork (expanded pure agglomerate); moreover,
in 1909, Charles McManus found that if those cork wastes (granulated cork)
were combined with a binder they could also produce a functional product as
composed agglomerated (Pestana et al., 2009). With this development the
applications for cork were expanded and agglomerate uses blossomed
(Cork_Institute_of_America, 2008a). And the cork stoppers with a body of
agglomerate and natural cork discs turned up
(Cork_Forest_Conservation_Alliance, 2015).
In the last quarter of the 19th century, Portugal was the leader with regards to
cork production, and in the beginning of the 20th century it held around 50% of
the world production. Nevertheless, in terms of the industrial production and
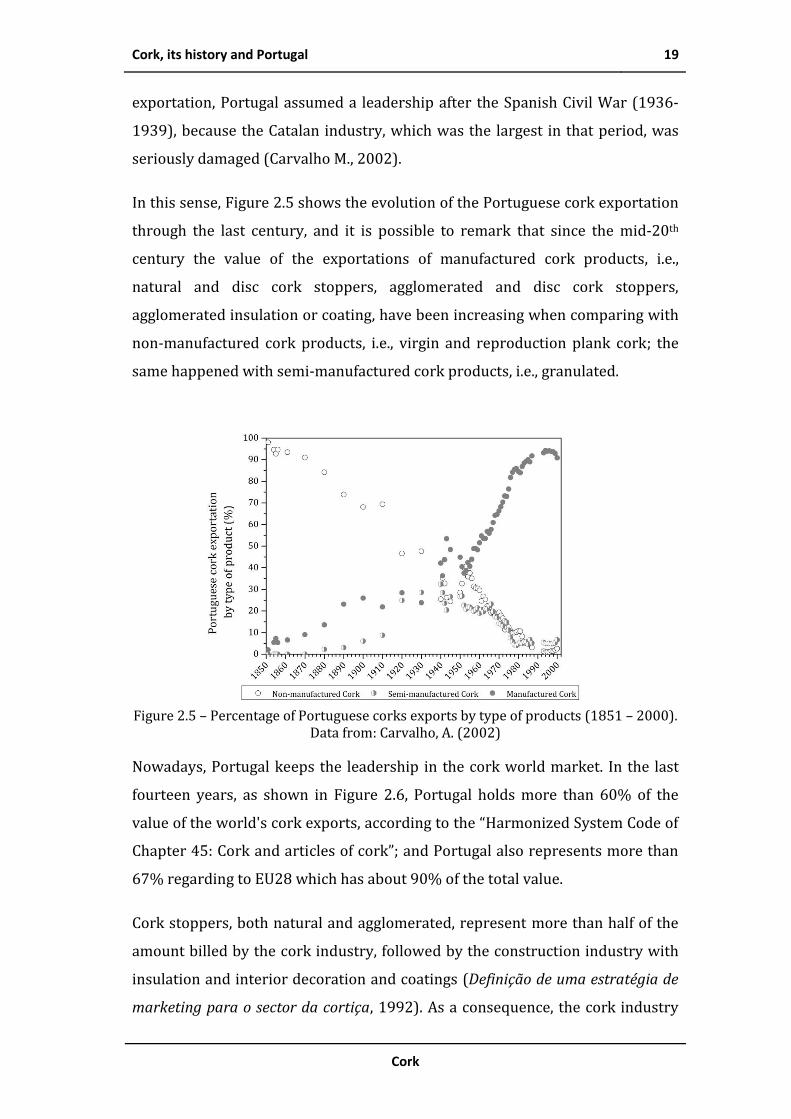
Cork, its history and Portugal 19
Cork
exportation, Portugal assumed a leadership after the Spanish Civil War (1936-
1939), because the Catalan industry, which was the largest in that period, was
seriously damaged (Carvalho M., 2002).
In this sense, Figure 2.5 shows the evolution of the Portuguese cork exportation
through the last century, and it is possible to remark that since the mid-20th
century the value of the exportations of manufactured cork products, i.e.,
natural and disc cork stoppers, agglomerated and disc cork stoppers,
agglomerated insulation or coating, have been increasing when comparing with
non-manufactured cork products, i.e., virgin and reproduction plank cork; the
same happened with semi-manufactured cork products, i.e., granulated.
Figure 2.5 – Percentage of Portuguese corks exports by type of products (1851 – 2000).
Data from: Carvalho, A. (2002)
Nowadays, Portugal keeps the leadership in the cork world market. In the last
fourteen years, as shown in Figure 2.6, Portugal holds more than 60% of the
value of the world's cork exports, according to the “Harmonized System Code of
Chapter 45: Cork and articles of cork”; and Portugal also represents more than
67% regarding to EU28 which has about 90% of the total value.
Cork stoppers, both natural and agglomerated, represent more than half of the
amount billed by the cork industry, followed by the construction industry with
insulation and interior decoration and coatings (Definição de uma estratégia de
marketing para o sector da cortiça, 1992). As a consequence, the cork industry

20 Cork, its history and Portugal
Supercritical fluid extraction and fractionation of bioactive natural products from cork
developed an exceptional synergy with the wine sector, since its main focus is to
produce stoppers essentially for the wine sector, but not only, since some of the
most expensive beers in the world (e.g. “Jacobsen Vintage by Carlsberg”) also use
cork stoppers.
a) b) Figure 2.6 – a) Value of world’s cork exports. b) Percentage of cork exports according to
HS Code Chapter 45: Cork and articles of cork
As mentioned in the previous chapter, in the last decades some problems arose;
cork was identified as responsible of the so-called “cork taste” in wine and
moreover alternatives to cork, e.g. the screwcap and plastic stoppers, appeared.
Notwithstanding, the cork industry made a big effort to hold its market
positions; the research being focused in way to reduce (nearly eradicate) the
TCA problem and several studies and patents have been published. In spite of
those challenges, the cork industry has assured its market place in world; the
cork products remain to be synonymous of high quality. It is to remark that a
study on the life cycle of cork stoppers shows that the natural cork stoppers are
the best sealing option for wine producers, distributors and retailers who want
to minimize their carbon footprint and adopt best practices in relation to
environmental performance (Moreira da Silva, 2009).
Even with the cork industry focused to produce stoppers, cork continues to
have endless applications, both in its natural condition and also when it is
compounded with other materials. It is a material with a unique quality; in
2013, expanded cork agglomerate was recognized as one of the most innovative
products for sustainable construction, integrating the “Top-10 Green Building
Products” by BuildingGreen, publisher of the GreenSpec directory and
Environmental Building News (EBN) (Amorim, 2012; BuildingGreens, 2013).
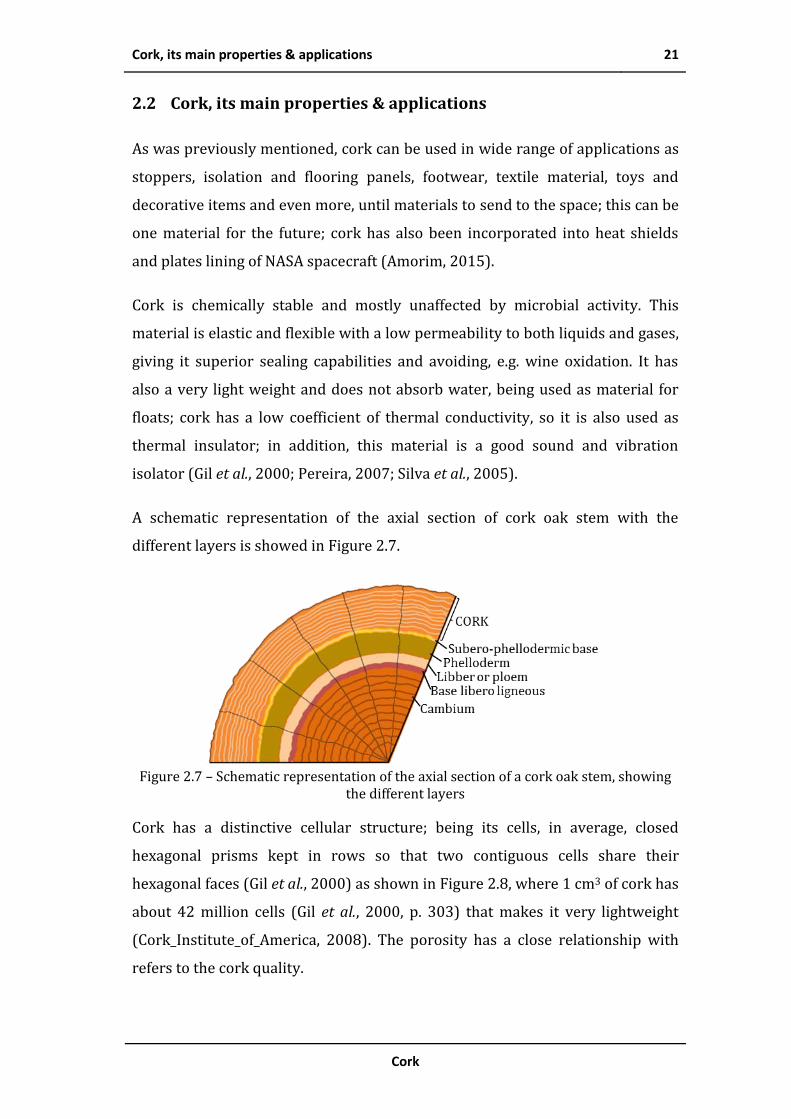
Cork, its main properties & applications 21
Cork
2.2 Cork, its main properties & applications
As was previously mentioned, cork can be used in wide range of applications as
stoppers, isolation and flooring panels, footwear, textile material, toys and
decorative items and even more, until materials to send to the space; this can be
one material for the future; cork has also been incorporated into heat shields
and plates lining of NASA spacecraft (Amorim, 2015).
Cork is chemically stable and mostly unaffected by microbial activity. This
material is elastic and flexible with a low permeability to both liquids and gases,
giving it superior sealing capabilities and avoiding, e.g. wine oxidation. It has
also a very light weight and does not absorb water, being used as material for
floats; cork has a low coefficient of thermal conductivity, so it is also used as
thermal insulator; in addition, this material is a good sound and vibration
isolator (Gil et al., 2000; Pereira, 2007; Silva et al., 2005).
A schematic representation of the axial section of cork oak stem with the
different layers is showed in Figure 2.7.
Figure 2.7 – Schematic representation of the axial section of a cork oak stem, showing
the different layers
Cork has a distinctive cellular structure; being its cells, in average, closed
hexagonal prisms kept in rows so that two contiguous cells share their
hexagonal faces (Gil et al., 2000) as shown in Figure 2.8, where 1 cm3 of cork has
about 42 million cells (Gil et al., 2000, p. 303) that makes it very lightweight
(Cork_Institute_of_America, 2008). The porosity has a close relationship with
refers to the cork quality.
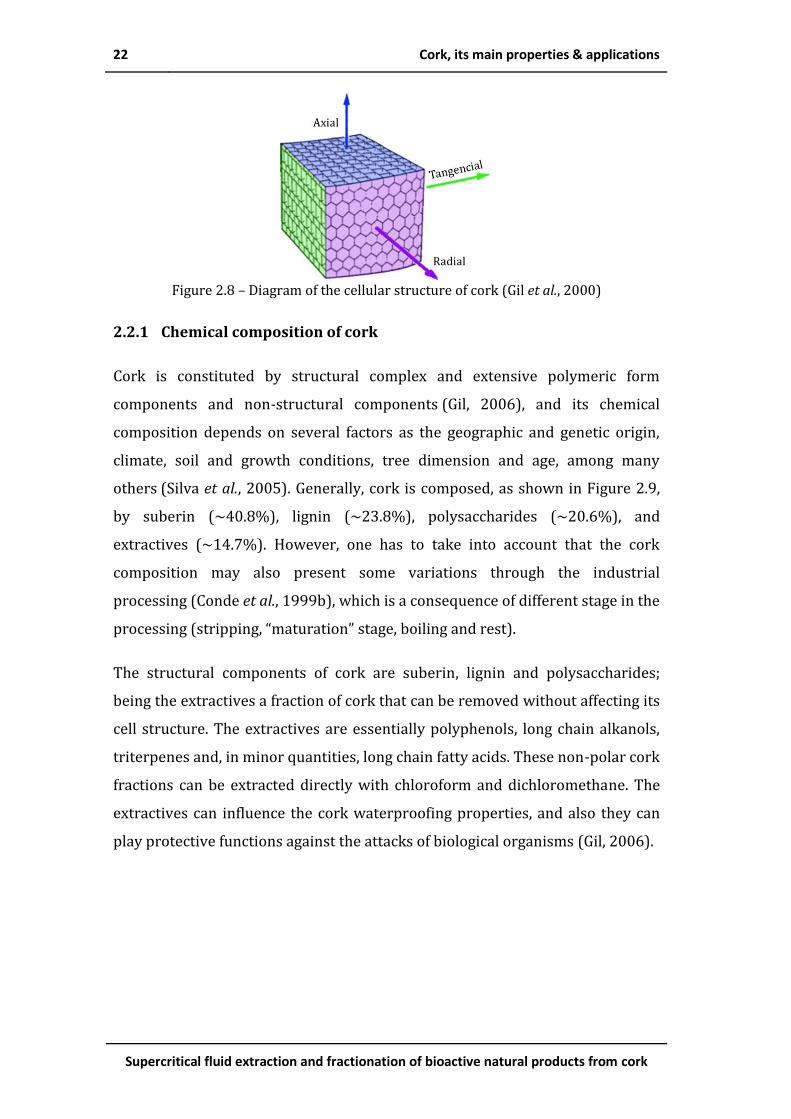
22 Cork, its main properties & applications
Supercritical fluid extraction and fractionation of bioactive natural products from cork
Figure 2.8 – Diagram of the cellular structure of cork (Gil et al., 2000)
2.2.1 Chemical composition of cork
Cork is constituted by structural complex and extensive polymeric form
components and non-structural components (Gil, 2006), and its chemical
composition depends on several factors as the geographic and genetic origin,
climate, soil and growth conditions, tree dimension and age, among many
others (Silva et al., 2005). Generally, cork is composed, as shown in Figure 2.9,
by suberin (~40.8%), lignin (~23.8%), polysaccharides (~20.6%), and
extractives (~14.7%). However, one has to take into account that the cork
composition may also present some variations through the industrial
processing (Conde et al., 1999b), which is a consequence of different stage in the
processing (stripping, “maturation” stage, boiling and rest).
The structural components of cork are suberin, lignin and polysaccharides;
being the extractives a fraction of cork that can be removed without affecting its
cell structure. The extractives are essentially polyphenols, long chain alkanols,
triterpenes and, in minor quantities, long chain fatty acids. These non-polar cork
fractions can be extracted directly with chloroform and dichloromethane. The
extractives can influence the cork waterproofing properties, and also they can
play protective functions against the attacks of biological organisms (Gil, 2006).
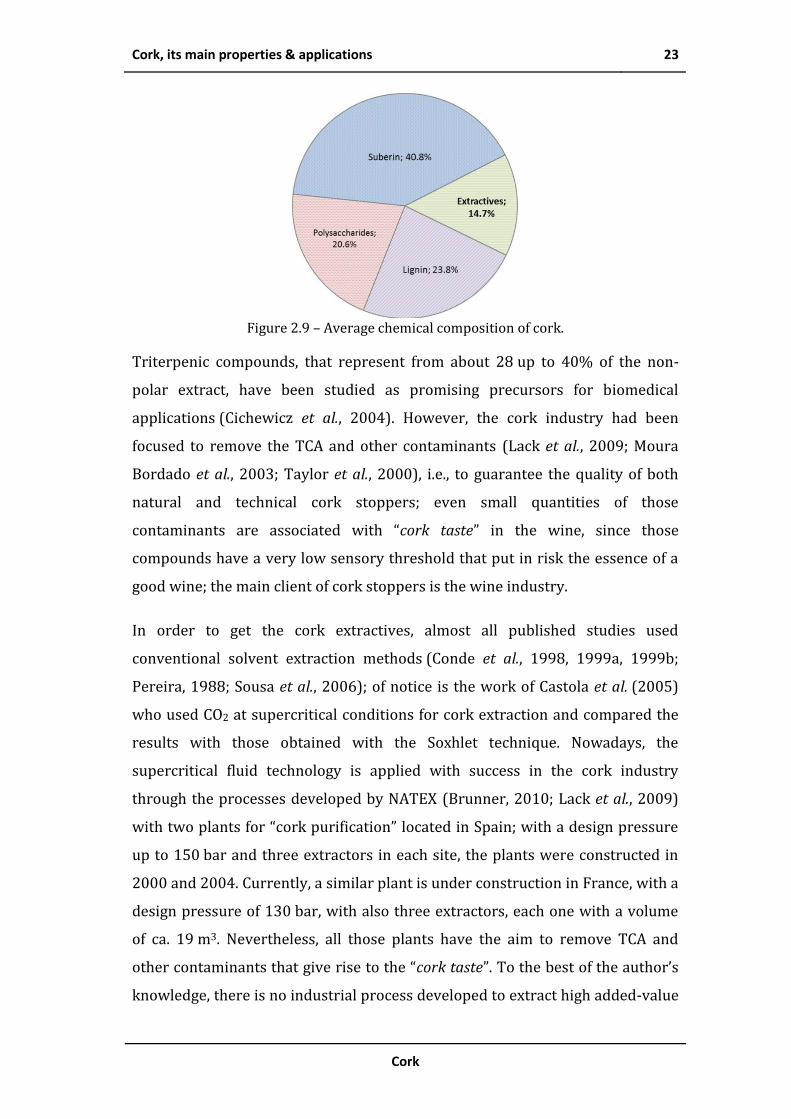
Cork, its main properties & applications 23
Cork
Figure 2.9 – Average chemical composition of cork.
Triterpenic compounds, that represent from about 28 up to 40% of the non-
polar extract, have been studied as promising precursors for biomedical
applications (Cichewicz et al., 2004). However, the cork industry had been
focused to remove the TCA and other contaminants (Lack et al., 2009; Moura
Bordado et al., 2003; Taylor et al., 2000), i.e., to guarantee the quality of both
natural and technical cork stoppers; even small quantities of those
contaminants are associated with “cork taste” in the wine, since those
compounds have a very low sensory threshold that put in risk the essence of a
good wine; the main client of cork stoppers is the wine industry.
In order to get the cork extractives, almost all published studies used
conventional solvent extraction methods (Conde et al., 1998, 1999a, 1999b;
Pereira, 1988; Sousa et al., 2006); of notice is the work of Castola et al. (2005)
who used CO2 at supercritical conditions for cork extraction and compared the
results with those obtained with the Soxhlet technique. Nowadays, the
supercritical fluid technology is applied with success in the cork industry
through the processes developed by NATEX (Brunner, 2010; Lack et al., 2009)
with two plants for “cork purification” located in Spain; with a design pressure
up to 150 bar and three extractors in each site, the plants were constructed in
2000 and 2004. Currently, a similar plant is under construction in France, with a
design pressure of 130 bar, with also three extractors, each one with a volume
of ca. 19 m3. Nevertheless, all those plants have the aim to remove TCA and
other contaminants that give rise to the “cork taste”. To the best of the author’s
knowledge, there is no industrial process developed to extract high added-value
24 Cork, its main properties & applications
Supercritical fluid extraction and fractionation of bioactive natural products from cork
compounds from cork in an efficient and environmentally-friendly way as is
proposed in the present work, i.e., adding a new value to cork without affecting
its traditional uses. However, there are some studies on the purification of the
friedelin obtained by alkaline hydrolysis, the conventional solvent extraction
(LeFevre et al., 2001; Pires et al., 2008).
2.2.2 Applications of cork extractives
As previously described, the main triterpenic compound of the cork extractives
are: friedelin, betulin, betulinic acid, cerine and -sitosterol. It is to highlight
that, in the last years, those compounds were studied and it was found some
promising applications as isolated compounds.
Friedelin is a natural product that was isolated from cork for the first time in
1807 by Chevreul, according to his publication in the Annales de Chimie. Vol. 62,
page 323 (LeFevre et al., 2001). This compound is known as an analgesic and
anti-inflammatory drug (Acton, 2013, p. 355). Ghosh et al. (2010) reported the
antifungal activities of friedelin, that shows more activity when compared with
cerine; they concluded also that friedelin should be a potential candidate drug in
the treatment of some infectious diseases as consequence of its good antifungal
activity in-vitro. Besides, it is one of the main tritepenic compounds in cork
extractives; it can also be found in several others natural materials as Azima
tetracantha, Notonia Grandiflora, Vismia Laurentii, Calophyllum Brasiliense
(Duraipandiyan et al., 2010). Antonisamy et al. (2011) investigated the
properties of the friedelin isolated from Azima tetracantha Lam. Leaves, which
have in-vivo anti-inflammatory, analgesic and antipyretic effects; Sunil et al.
(2013) also concluded that the friedelin isolated from the Azima tetracantha
Lam. leaves could be used to prevent the evolution of several oxidative stress-
related diseases, since it possesses antioxidant and liver protective effects in in-
vitro and in-vivo studies. Therefore, its biological activity makes it an
extraordinary compound for further research in medicine (Antonisamy et al.,
2011).

Cork, its main properties & applications 25
Cork
With respect to betulinic acid, this has gained special attention, since it shows a
variety of biological and medicinal properties. Moghaddam et al. (2012) made a
review of the properties of betulinic acid focused on its pharmacological
properties as anticancer, anti-HIV, anti-bacterial, antimalarial and some other
biological activities when isolated from several plants; some researches
envisage betulinic acid as a promise in the treatment of human cancers (Fulda,
2008). Birch tree (Betula) is an important source of betulinic acid, but mainly
betulin which could be also used to synthetize betulinic acid. Also, it is detected
in a wide range of species of plants (Moghaddam et al., 2012; Mullauer et al.,
2010; Yogeeswari et al., 2005). In the case of the betulin, it has also been found
to have anti-bacterial, anti-inflammatory and wound-healing properties (Imlan,
2012). In its turn, -sitosterol is used for heart disease and high cholesterol,
since it reduces the total and bad cholesterol levels; FDA allows manufacturers
to claim that foods containing -sitosterol are for reducing the risk of coronary
heart disease (WebMD, 2015). Table 2.1 summarizes the properties for the main
triterpenes of cork extractives.

26 Cork, its main properties & applications
Supercritical fluid extraction and fractionation of bioactive natural products from cork
Tab
le 2
.1 –
Pro
per
ties
an
d s
tru
ctu
res
for
the
mai
n t
rite
rpen
es o
f co
rk e
xtra
ctiv
es
Stru
ctu
re
Ace
ntr
ic
Fact
or
0.6
67
59
0.8
98
85
1.0
95
9
0.9
19
68
Zc
(-)
0.1
93
0.1
94
0.1
74
0.1
95
Vc
(kg. m
-3)
29
4.0
31
7.4
30
6.0
30
9.7
Pc
(bar
)
10
.19
11
.17
9.2
8
10
.48
Tc
(K)
92
3
96
8
92
6
93
2
Tb
(K)
73
1.3
77
9.3
76
8.9
75
5.2
MW
(g. m
ol-1
)
42
6.7
2
44
2.6
7
44
2.7
2
44
2.7
2
CA
S N
º
55
9-7
4-0
47
2-1
5-1
47
3-9
8-3
46
8-6
7-7
Nam
e
Form
ula
Frie
del
in
C3
0H
50O
Bet
ulin
ic A
cid
C3
0H
48O
3
Bet
ulin
C3
0H
50O
2
Cer
in
C3
0H
50O
2
ID
1
2
3
4

Cork, its main properties & applications 27
Cork
Tab
le 2
.1 –
Pro
per
ties
an
d s
tru
ctu
res
for
the
mai
n t
rite
rpen
es o
f co
rk e
xtra
ctiv
es (
con
t.)
Stru
ctu
re
Ace
ntr
ic
Fact
or
1.0
18
8
Zc
(-)
0.2
08
Vc
(kg. m
-3)
29
5.5
Pc
(bar
)
11
.43
Tc
(K)
92
8
Tb
(K)
75
4
MW
(g. m
ol-1
)
41
4.7
CA
S N
º
83
-46
-5
Nam
e
Form
ula
-s
ito
ster
ol
C2
9H
50O
ID
5

28 Manufacturing of cork – The granulated industrial cork
Supercritical fluid extraction and fractionation of bioactive natural products from cork
2.3 Manufacturing of cork – The granulated industrial cork
In Portugal, cork harvesting occurs each nine year. After the harvesting process,
the cork planks are left out in the open air for a stabilization period of six
months at least and are then sorted by quality and size. As a rule, the planks
used for cork stoppers are displaced on stainless steel pallets, i.e., the planks
that are in contact with the ground are never used for cork stoppers production.
The remaining cork is processed to be used in the production of agglomerated
cork and cork & rubber compounds with a variety of applications
(Cork_Institute_of_America, 2008b).
Next, the planks to produce stoppers are boiled ca. 30 min in purified water,
free of any microbiological contamination. Afterwards, they are submitted to a
quality selection process and kept in controlled ambient conditions; during this
step, the risk of mould growth is higher. After a stabilization time, the planks are
ready to continue the production process.
Selected planks are punched, giving rise to the natural cork stoppers; this
stoppers are selected manually or, recently, by image analysis; all stoppers
unsuitable or discarded during production and the rest of the planks that were
submitted to punching are taken to a grinding stage in order to be used
subsequently in a variety of applications. In this stage, the material is granulated
and separated by particle size and density according to its following
applications, to technical cork stoppers and also can be used as agglomerates
among many other applications. In order to add a new value and enlarge the
markets to the cork industry, the raw material to be used in this work was
constituted by the granulated and powder generated in this stage. Since the
focus is to add value to cork without compromising its traditional uses as
represented in Figure 2.10, it is to highlight that the total or even just a portion
of the granulated can be extracted and returned to the actual process to be used
in its traditional applications thus resulting in a new value to cork. In other
words, the proposal is that the raw material does a by-pass to the traditional
process, in order to add an efficient and environmentally-friendly extraction

Manufacturing of cork – The granulated industrial cork 29
Cork
process to get the compounds concealed in cork. It is to highlight that the cork
powder can also be extracted; actually ca. 20 – 30% of the cork entering the mill
ends as cork powder, currently burned to produce energy (Cordeiro et al.,
1998).

30 Manufacturing of cork – The granulated industrial cork
Supercritical fluid extraction and fractionation of bioactive natural products from cork
Fig
ure
2.1
0 –
New
pro
cess
ste
p t
o a
dd
a n
ew v
alu
e to
co
rk

Supercritical fluid extraction and fractionation of bioactive natural products from cork
References
Acton, A. Q. (2013). “Terpenes—Advances in Research and Application.” (S. Editions, Ed.) (2013 Ed). Atlanta, Georgia.
Amorim. (2012). “Corticeira Amorim’s expanded insulation cork board in U.S. BuildingGreen’s TOP 10 products.” Retrieved February 1, 2015, from http://www.amorim.com/en/whats-new/news/Corticeira-Amorims-expanded-insulation-cork-board-in-US-BuildingGreens-TOP-10-products/700/
Amorim. (2015). “Nature without limits.” Retrieved January 1, 2015, from http://www.amorimcork.com/en/natural-cork/cork-and-other-applications/
Antonisamy, P., Duraipandiyan, V., and Ignacimuthu, S. (2011). “Anti-inflammatory, analgesic and antipyretic effects of friedelin isolated from Azima tetracantha Lam. in mouse and rat models.” The Journal of Pharmacy and Pharmacology, 63(8), 1070–1077. doi:10.1111/j.2042-7158.2011.01300.x
APCOR. (2009). “Yearbook 2009.” Associação Portuguesa da Cortiça.
APCOR. (2015a). “História da cortiça.” Retrieved February 1, 2015, from http://apcor.pt/artigo/historia-cortica.htm
APCOR. (2015b). “History of Cork.” Retrieved February 1, 2015, from http://www.apcor.pt/artigo/1.htm
Brunner, G. (2010). “Applications of Supercritical Fluids.” Annual Review of Chemical and Biomolecular Engineering, Vol 1, 1, 321–342. doi:10.1146/annurev-chembioeng-073009-101311
BuildingGreens. (2013). “Buildinggreens Top 10 Products 2013.” Retrieved February 1, 2015, from https://www2.buildinggreen.com/buildinggreens-top-10-products-2013
Carvalho M., A. (2002). “A economia do sector da cortiça em Portugal.” Faculdade de Economia E Gestão. Porto: Universidade Católica Portuguesa.
Castola, V., Marongiu, B., Bighelli, A., Floris, C., Laı, A., and Casanova, J. (2005). “Extractives of cork (Quercus suber L.): chemical composition of dichloromethane and supercritical CO2 extracts.” Industrial Crops and Products, 21(1), 65–69. doi:10.1016/j.indcrop.2003.12.007
Cichewicz, R. H., and Kouzi, S. A. (2004). “Chemistry, biological activity, and chemotherapeutic potential of betulinic acid for the prevention and treatment of cancer and HIV infection.” Medicinal Research Reviews, 24(1), 90–114. doi:10.1002/med.10053
Conde, E., Cadahía, E., Garcia-Vallejo, M. C., and Gonźalez-Adrados, J. R. (1998). “Chemical Characterization of Reproduction Cork from Spanish Quercus Suber.” Journal of Wood Chemistry and Technology, 18(4), 447–469. doi:10.1080/02773819809349592
Conde, E., Garcia-Vallejo, M. C., and Cadahía, E. (1999a). “Waxes composition of Quercus suber reproduction cork from different Spanish provenances.” Wood Science and Technology, 33(4), 271–283. doi:10.1007/s002260050115
Conde, E., Garcia-Vallejo, M. C., and Cadahía, E. (1999b). “Waxes composition of reproduction cork from Quercus suber and its variability throughout the industrial processing.” Wood Science and Technology, 33(3), 229–244. doi:10.1007/s002260050112
Cooke, G. (1931). “Cork and its uses.” Journal of Chemical Education, 8(8), 1463–1492.

32 References
Supercritical fluid extraction and fractionation of bioactive natural products from cork
Cordeiro, N., Belgacem, M. N., Silvestre, A. J. D., Neto, C. P., and Gandini, A. (1998). “Cork suberin as a new source of chemicals. 1. Isolation and chemical characterization of its composition.” International Journal of Biological Macromolecules, 22(2), 71–80. doi:10.1016/S0141-8130(97)00090-1
Cork_Forest_Conservation_Alliance. (2015). “History of Cork.” Retrieved January 1, 2015, from http://www.corkforest.org/history-of-cork/
Cork_Information_Bureau. (2010). “CORK - HISTORY.” Portugal.
Cork_Institute_of_America. (2008). “Cork History.” Retrieved January 1, 2015, from http://www.corkinstitute.com/history.html
Cork_Institute_of_America. (2008). “Harvest.” Retrieved January 1, 2015, from http://www.corkinstitute.com/harvest.html
Cork_Institute_of_America. (2008). “Properties.” Retrieved February 1, 2015, from http://www.corkinstitute.com/properties.html
Corticeira_Amorim. (2005). “The art of cork.” Mozelos: Corticeira Amorim.
“Definição de uma estratégia de marketing para o sector da cortiça.” (1992).
Duraipandiyan, V., Gnanasekar, M., and Ignacimuthu, S. (2010). “Antifungal activity of triterpenoid isolated from Azima tetracantha leaves.” Folia Histochemica et Cytobiologica, 48(2), 311–313. doi:10.2478/v10042-010-0005-3
Fulda, S. (2008). “Betulinic acid for cancer treatment and prevention.” International Journal of Molecular Sciences, 9(6), 1096–1107. doi:10.3390/ijms9061096
Ghosh, P., Mandal, A., Chakraborty, M., and Saha, A. (2010). “Triterpenoids from Quercus suber and their antimicrobial and phytotoxic activities.” J. Chem Pharm. Res, 2(4), 714–721.
Gil, L. (2006). “A cortiça como material de construção. Manual Técnico.” Portugal.
Gil, L., and Moiteiro, C. (2000). “Cork.” In Ullmann’s Encyclopedia of Industrial Chemistry. Wiley-VCH Verlag GmbH & Co. KGaA. doi:10.1002/14356007.f07_f01
Imlan. (2012). “Betulin.” Retrieved February 1, 2015, from http://www.imlan.de/en/what-is-betulin.html
Lack, E., Seidlitz, H., Bakali, M., and Zobel, R. (2009). “Cork treatment - A new industrial application of supercritical fluids.” Proc. Int. Symp. Supercrit. Fluids,. Retrieved from http://www.isasf.net/fileadmin/files/Docs/Arcachon/oraux/c04-CO42 Lack Manuskript.pdf
LeFevre, J. W., McNeill, K. I., and Moore, J. L. (2001). “Isolating Friedelin from Cork and Reducing It to Friedelinol and Epifriedelinol. A Project Involving NMR Spectrometry and Molecular Modeling.” Journal of Chemical Education, 78(4), 535. doi:10.1021/ed078p535
Moghaddam, M. G., Ahmad, F. B. H., and Samzadeh-kermani, A. (2012). “Biological Activity of Betulinic Acid: A Review.” Pharmacology & Pharmacy, 3, 119–123. doi:10.4236/pp.2012.32018
Moreira da Silva, R. P. (2009). “Avaliação do Ciclo de Vida Da Rolha de Cortiça Natural.” Universidade do Porto.
Moura Bordado, J. C., Santos Marques, J. P., Pissarra Goncalves, M. A., Allegro, I. M., Mesquita, A. C., and Lopes Filipe, R. (2003). “New Process for treating cork stoppers or planks for the reduction of strange aromas, namely 2,4,6-Trichoroanisole.” Portugal: WO 03/041927 A1.

References 33
Cork
Mullauer, F. B., Kessler, J. H., and Medema, J. P. (2010). “Betulinic acid, a natural compound with potent anticancer effects.” Anti-Cancer Drugs, 21(3), 215–227. doi:10.1097/CAD.0b013e3283357c62
Pereira, H. (1988). “Chemical composition and variability of cork from Quercus suber L.” Wood Science and Technology, 22(3), 211–218. doi:10.1007/bf00386015
Pereira, H. (2007). “Cork: biology production and uses” (1st ed.). Lisbon: Elsevier.
Pereira, H., Rosa, M. E., and Fortes, M. A. (1987). “The cellular structure of cork Quercus Suber L.” IAWA Bulletin, 8(3), 213–218.
Pestana, M., and Tinoco, I. (2009). “A Indústria e o Comércio da Cortiça em Portugal Durante o Século XX.” Silva Lusitana, 17(1), 1–26.
Pires, R. A., Martins, S., Chagas, J. A., and Reis, R. L. (2008). “Extraction and purification of friedelin.” Portugal: WO 2009/072916 A1.
“Robert Hooke.” (2015). Retrieved January 1, 2015, from https://en.wikipedia.org/wiki/File:RobertHookeMicrographia1665.jpg
Silva, S. P., Sabino, M. A., Fernandes, E. M., Correlo, V. M., Boesel, L. F., and Reis, R. L. (2005). “Cork: properties, capabilities and applications.” International Materials Reviews, 50(4), 345–365. doi:10.1179/174328005X41168
Sousa, A. F., Pinto, P. C. R. O., Silvestre, A. J. D., and Neto, C. P. (2006). “Triterpenic and other lipophilic components from industrial cork byproducts.” Journal of Agricultural and Food Chemistry, 54(18), 6888–6893. doi:10.1021/Jf060987+
Stecher, G. (1914). “Cork: Its origin and industrial uses.” New York.
Sunil, C., Duraipandiyan, V., Ignacimuthu, S., and Al-Dhabi, N. A. (2013). “Antioxidant, free radical scavenging and liver protective effects of friedelin isolated from Azima tetracantha Lam. leaves.” Food Chemistry, 139(1–4), 860–865. doi:10.1016/j.foodchem.2012.12.041
Taber, G. M. (2007). “To cork or not to cork.” London: Scribner.
Taylor, M. K., Young, T. M., Butzke, C. E., and Ebeler, S. E. (2000). “Supercritical Fluid Extraction of 2,4,6-Trichloroanisole from Cork Stoppers.” Journal of Agricultural and Food Chemistry, 48, 2208–2211. doi:10.1021/jf991045q
WebMD. (2015). “beta-sitosterol.” Retrieved February 1, 2015, from http://www.webmd.com/vitamins-supplements/ingredientmono-939-beta-sitosterol.aspx?activeingredientid=939&activeingredientname=beta-sitosterol
WWF. (2006). “Cork screwed? Environmental and economic impacts of the cork stoppers market.”
Yogeeswari, P., and Sriram, D. (2005). “Betulinic acid and its derivatives: a review on their biological properties.” Current Medicinal Chemistry, 12(6), 657–66. doi:10.2174/0929867053202214


Supercritical fluid extraction and fractionation of bioactive natural products from cork
Soxhlet Extraction 3A conventional soxhlet extraction, the current benchmark technology, was
performed in order to be a reference to yields and to the composition of cork
extracts obtained by supercritical fluid extraction (SFE); also, an analytical
method was developed for the identification and quantification of the cork
extracts compounds.
Initially, the samples were characterized, determining their cork density, bulk
density, particle size and moisture content. The granulated industrial cork and
cork powder were soxhlet extracted, and cork extracts were derivatized prior to
gas chromatography (GC) analysis.
3.1 Characterization of samples
Samples were constituted by granulated industrial cork of different particle
sizes and densities, provided by António Almeida, Cortiças, S.A. (AAC) from their
industrial facilities (in 2011). They were obtained by milling punched cork
planks (Figure 3.1) that were used to produce single-piece natural cork
stoppers, and also by cork material that did not meet the quality requirements
for single-piece stoppers production. It is worth to note that the cork planks
were previously submitted to a boiling-water treatment, which corresponds to
one of the conventional industrial stages before the production of natural cork
stoppers.
“plant a cork oak forest for your grandchildren”
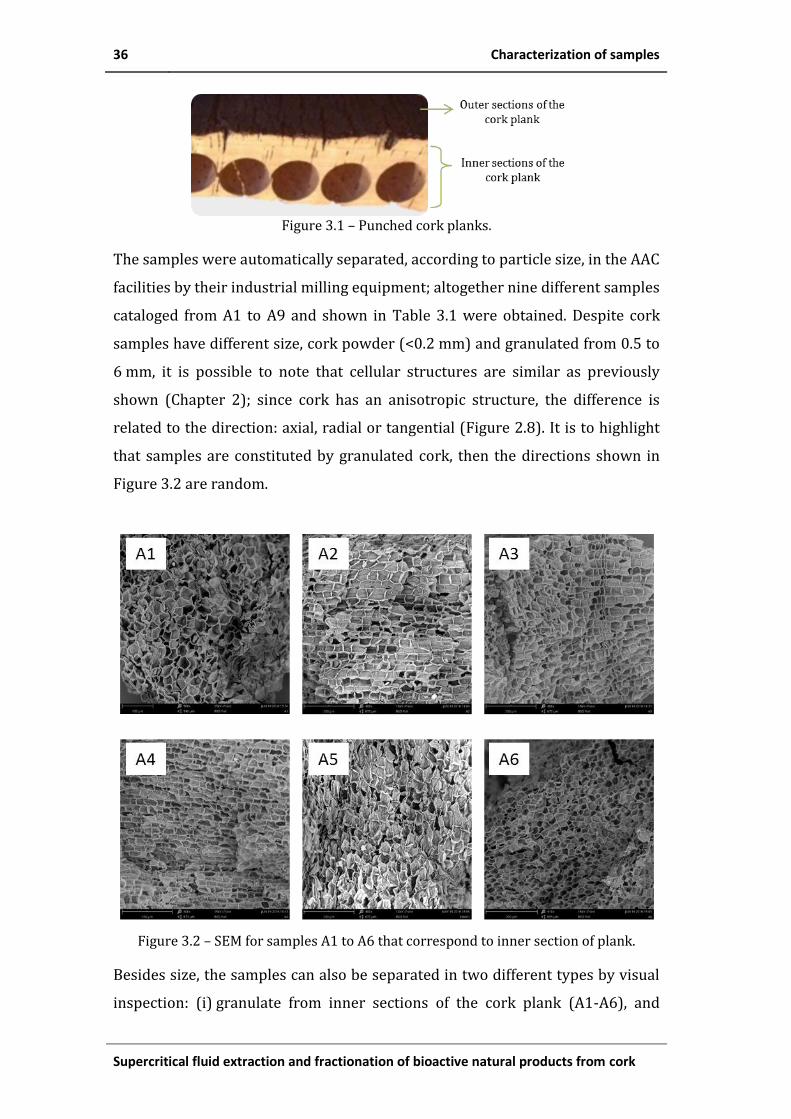
36 Characterization of samples
Supercritical fluid extraction and fractionation of bioactive natural products from cork
Figure 3.1 – Punched cork planks.
The samples were automatically separated, according to particle size, in the AAC
facilities by their industrial milling equipment; altogether nine different samples
cataloged from A1 to A9 and shown in Table 3.1 were obtained. Despite cork
samples have different size, cork powder (<0.2 mm) and granulated from 0.5 to
6 mm, it is possible to note that cellular structures are similar as previously
shown (Chapter 2); since cork has an anisotropic structure, the difference is
related to the direction: axial, radial or tangential (Figure 2.8). It is to highlight
that samples are constituted by granulated cork, then the directions shown in
Figure 3.2 are random.
Figure 3.2 – SEM for samples A1 to A6 that correspond to inner section of plank.
Besides size, the samples can also be separated in two different types by visual
inspection: (i) granulate from inner sections of the cork plank (A1-A6), and

Characterization of samples 37
Soxhlet Extraction
(ii) from outer sections of the plank (A7 and A9), that are characterized by a
darker color, as presented in Figure 3.3. It is to note that sample A8 corresponds
to cork powder.
Table 3.1 – Particle size, bulk density, apparent density and moisture content of industrial granulated cork samples.
Sample
Size
Group
mm
Average
Particle size
mm
Moisture
%
Cork
density
-3mkg
Bulk
density
-3mkg
Apparent
density
-3mkg
A1 0.5 – 1 0.75 5.4 + 0.1 710 + 58 89 + 6 209
A2 0.5 – 2 1.25 6.3 + 0.1 334 + 42 66 + 5 159
A3 0.5 – 1 0.75 5.0 + 0.1 546 + 102 54 + 3 141
A4 1 – 4 2.5 6.7 + 0.1 326 + 21 73 + 5 173
A5 4 – 6 5 4.8 + 0.1 266 + 14 67 + 4 166
A6 2 – 4 3 9.2 + 0.1 267 + 27 64 + 3 170
A8* < 0.2 < 0.2 5.2 + 0.1 1160 + 121 70 + 11 233
A7** 0.5 – 2 1.25 13.7 + 0.1 600 + 31 160 + 12 381
A9** 0.5 – 2 1.25 17.9 + 0.3 998 + 17 310 + 16 762
* Cork powder ** Granulated industrial cork from the outer section of plank
3.1.1 Cork density, bulk density and particle size
The density depends on several factors as particle size and shape, specific
density of individual particles and material composition (Lam et al., 2008;
Miranda et al., 2012). The samples were automatically separated by size and
density in the milling equipment. Table 3.1 shows, for each size group, the bulk
density determined using a cylindrical container dividing the mass of the
sample in the container by the volume of the container; to evaluate the cork
(solid) density and the apparent density, helium pycnometry and mercury
pycnometry were used, respectively.
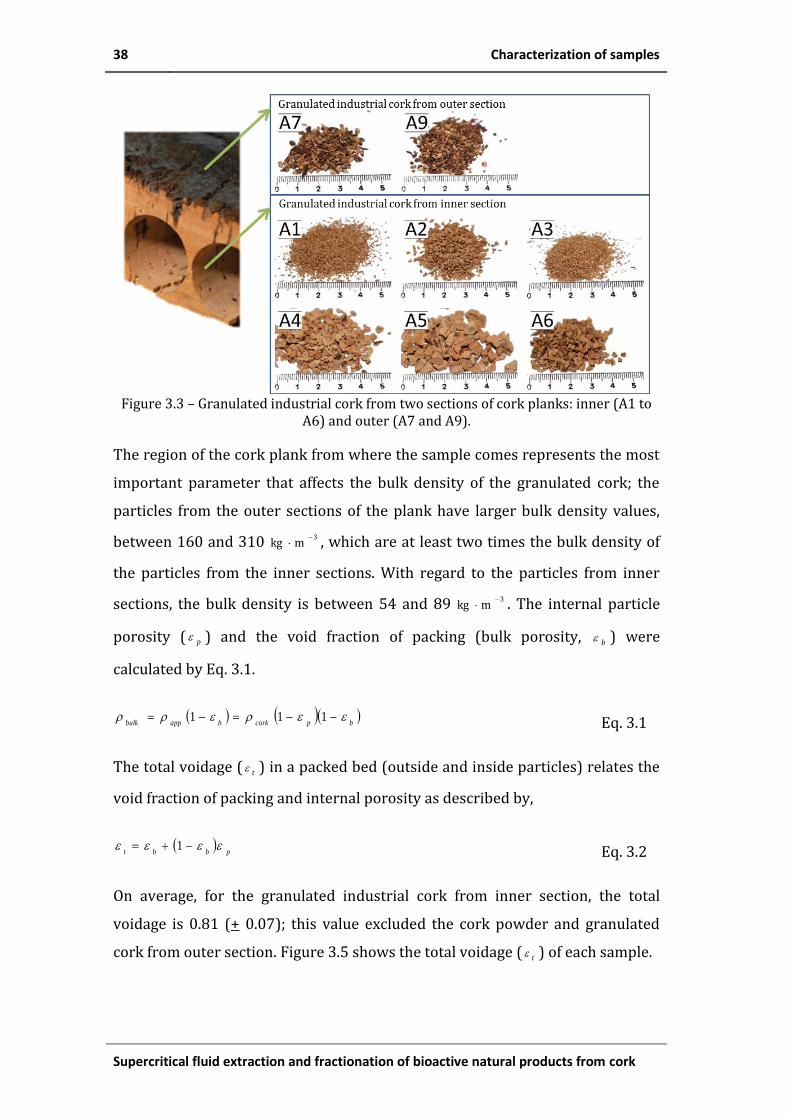
38 Characterization of samples
Supercritical fluid extraction and fractionation of bioactive natural products from cork
Figure 3.3 – Granulated industrial cork from two sections of cork planks: inner (A1 to
A6) and outer (A7 and A9).
The region of the cork plank from where the sample comes represents the most
important parameter that affects the bulk density of the granulated cork; the
particles from the outer sections of the plank have larger bulk density values,
between 160 and 310 3mkg
, which are at least two times the bulk density of
the particles from the inner sections. With regard to the particles from inner
sections, the bulk density is between 54 and 89 3mkg
. The internal particle
porosity ( p ) and the void fraction of packing (bulk porosity, b ) were
calculated by Eq. 3.1.
bpcorkbappbulk
111 Eq. 3.1
The total voidage ( t ) in a packed bed (outside and inside particles) relates the
void fraction of packing and internal porosity as described by,
pbbt
1 Eq. 3.2
On average, for the granulated industrial cork from inner section, the total
voidage is 0.81 (+ 0.07); this value excluded the cork powder and granulated
cork from outer section. Figure 3.5 shows the total voidage ( t ) of each sample.

Soxhlet extraction 39
Soxhlet Extraction
Figure 3.4 – Total void space ( t ) for each sample vs. average particle size.
Figure 3.5 represents the internal porosity ( p ) vs. average particle size, for
granulated industrial cork and cork powder; on average, for particles with size
bigger than 1 mm, the internal porosity is 0.39 (+ 0.10).
Figure 3.5 – Internal porosity ( p ) vs. average particle size.
3.2 Soxhlet extraction
Soxhlet extraction is a leaching technique for extraction from solid samples; it is
a batch system continuously operated due to the solvent distillation and
recirculation. In this extraction method, the sample is repeatedly in contact with
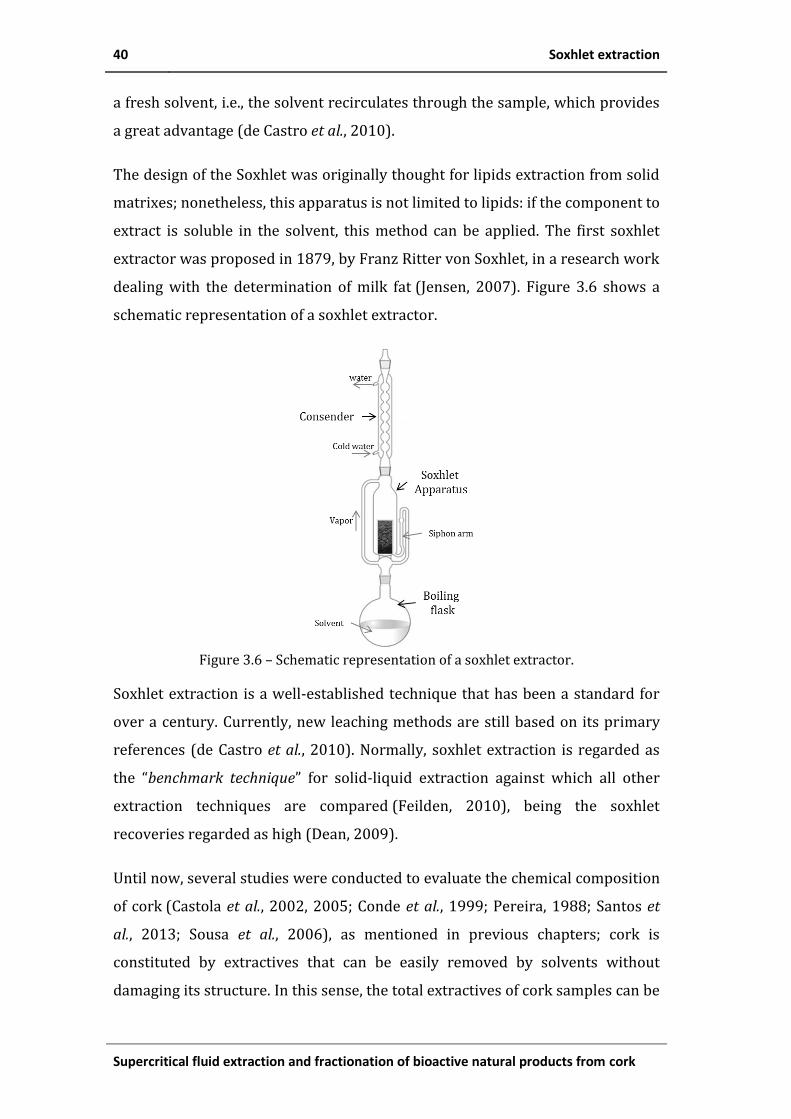
40 Soxhlet extraction
Supercritical fluid extraction and fractionation of bioactive natural products from cork
a fresh solvent, i.e., the solvent recirculates through the sample, which provides
a great advantage (de Castro et al., 2010).
The design of the Soxhlet was originally thought for lipids extraction from solid
matrixes; nonetheless, this apparatus is not limited to lipids: if the component to
extract is soluble in the solvent, this method can be applied. The first soxhlet
extractor was proposed in 1879, by Franz Ritter von Soxhlet, in a research work
dealing with the determination of milk fat (Jensen, 2007). Figure 3.6 shows a
schematic representation of a soxhlet extractor.
Figure 3.6 – Schematic representation of a soxhlet extractor.
Soxhlet extraction is a well-established technique that has been a standard for
over a century. Currently, new leaching methods are still based on its primary
references (de Castro et al., 2010). Normally, soxhlet extraction is regarded as
the “benchmark technique” for solid-liquid extraction against which all other
extraction techniques are compared (Feilden, 2010), being the soxhlet
recoveries regarded as high (Dean, 2009).
Until now, several studies were conducted to evaluate the chemical composition
of cork (Castola et al., 2002, 2005; Conde et al., 1999; Pereira, 1988; Santos et
al., 2013; Sousa et al., 2006), as mentioned in previous chapters; cork is
constituted by extractives that can be easily removed by solvents without
damaging its structure. In this sense, the total extractives of cork samples can be
Soxhlet extraction 41
Soxhlet Extraction
obtained by sequential soxhlet extraction, using solvents of increasing
polarity (Pereira, 1988; Sousa et al., 2006).
Table 3.2 summarizes the yields obtained for the extraction of several cork
samples; virgin cork, reproduction cork, and cork samples from different stages
in the industrial process are included; the samples were milled to particle size
lower than 1 mm and sequentially soxhlet extracted using as first solvent
dichloromethane or chloroform.
The samples before industrial processing, i.e., virgin cork and reproduction
cork, after harvesting, presented higher yields when extracted with
dichloromethane, giving values of 79 1
DryCorkextractkgg
and 60
1
DryCorkextractkgg
,
respectively; otherwise, the industrial cork powder had the lowest yields.
It is to highlight that, according to Conde et al. (1999), the content of extractives
in cork decreases throughout the industrial processing; the cork after the
stripping had yields two times higher when compared with the samples after
the boiling process.
As already mentioned, the samples used in this work were constituted by
granulated industrial cork obtained from punched cork planks after the boiling-
water treatment. These samples include from cork powder (<0.2 mm) until
particles with 6 mm, and some samples (A7 and A9) also contain particles from
the most external layer of the cork plank.

42 Soxhlet extraction
Supercritical fluid extraction and fractionation of bioactive natural products from cork
Tab
le 3
.2 –
Yie
lds
ob
tain
ed i
n t
he
cork
ext
ract
fro
m s
ever
al c
ork
sam
ple
s
Re
fere
nce
(Per
eira
, 19
88
)
(Per
eira
, 19
88
)
(Cas
tola
et
al.,
20
02
)
(San
tos
et a
l., 2
01
3)
(Cas
tola
et
al.,
20
05
)
(Co
nd
e et
al.,
19
99
)
(Co
nd
e et
al.,
19
99
)
(Co
nd
e et
al.,
19
99
)
(Co
nd
e et
al.,
19
99
)
(San
tos
et a
l., 2
01
3)
(So
usa
et
al.,
20
06
)
(So
usa
et
al.,
20
06
)
(So
usa
et
al.,
20
06
)
(So
usa
et
al.,
20
06
)
Yie
ld
(gex
trac
t. kg-1
Dry
Co
rk)
79
54
60
59
.3
60
10
1.3
80
.8
49
.1
53
.2
22
.6
26
42
50
27
Solv
en
t
DC
M
DC
M
DC
M
DC
M
DC
M
Ch
loro
form
Ch
loro
form
Ch
loro
form
Ch
loro
form
DC
M
DC
M
DC
M
DC
M
DC
M
Par
ticl
e s
ize
40
- 6
0 m
esh
40
- 6
0 m
esh
Co
rk p
ow
der
40
- 6
0 m
esh
40
- 6
0 m
esh
0.5
- 1
mm
0.5
- 1
mm
0.5
- 1
mm
0.5
- 1
mm
40
- 6
0 m
esh
40
- 6
0 m
esh
40
- 6
0 m
esh
40
- 6
0 m
esh
40
- 6
0 m
esh
Mat
eri
al
Vir
gin
Co
rk
Rep
rod
uct
ion
Co
rk
Co
rk p
ow
der
fro
m t
he
ou
ter
bar
k Q
. su
ber
exc
lud
ing
th
e m
ost
ext
ern
al la
yer
Nat
ura
l co
rk p
lan
ks –
“am
adia” grad
e
Co
rk p
ow
der
fro
m t
he
ou
ter
bar
k o
f Q
. su
ber
exc
lud
ing
the
mo
st e
xter
nal
lay
er
Co
rk p
ow
der
fro
m t
he
ou
ter
bar
k o
f Q
. su
ber
exc
lud
ing
the
mo
st e
xter
nal
lay
er -
In
du
stri
al P
roce
ssin
g -
Stri
pp
ing
Co
rk p
ow
der
fro
m t
he
ou
ter
bar
k o
f Q
. su
ber
exc
lud
ing
the
mo
st e
xter
nal
lay
er -
In
du
stri
al P
roce
ssin
g -
Fir
st r
est
Co
rk p
ow
der
fro
m t
he
ou
ter
bar
k o
f Q
. su
ber
exc
lud
ing
the
mo
st e
xter
nal
lay
er -
In
du
stri
al P
roce
ssin
g -
Bo
ilin
g o
pen
air
res
t
Co
rk p
ow
der
fro
m t
he
ou
ter
bar
k o
f Q
. su
ber
exc
lud
ing
the
mo
st e
xter
nal
lay
er -
In
du
stri
al P
roce
ssin
g -
Bo
ilin
g +
sto
re r
est
Ind
ust
rial
co
rk p
ow
der
Ind
ust
rial
co
rk p
ow
der
Co
rk p
ow
der
fro
m t
he
ou
ter
bar
k o
f Q
. su
ber
e b
oil
ed c
ork
pla
nk
s o
bta
ined
aft
er a
co
rk c
oo
kin
g s
tage
Co
rk p
ow
der
fro
m t
he
ou
ter
bar
k o
f Q
. su
ber
e, p
arti
cles
fro
m i
nn
er s
ecti
on
s o
f p
lan
ks
bo
iled
co
rk p
lan
ks
ob
tain
ed a
fter
a c
ork
co
ok
ing
sta
ge
Co
rk p
ow
der
fro
m t
he
ou
ter
bar
k o
f Q
. su
ber
e, p
arti
cles
fro
m o
ute
r s
ecti
on
s o
f p
lan
ks
bo
iled
co
rk p
lan
ks
ob
tain
ed a
fter
a c
ork

Soxhlet extraction 43
Soxhlet Extraction
The yields in Table 3.2 were assumed as an estimate/reference, since the
composition of cork depends on several factors, such as climate and soil
conditions, geographical and genetic origin, tree dimension, age and growth
conditions (Silva et al., 2005).
In this work, all samples were conventionally soxhlet extracted, and the
procedure is shown in Figure 3.7. Table 3.3 presents the parameters for the
soxhlet extraction. First, ca. 6–10 g of sample was weighed in a thimble; the
ratio of solvent/solid matrix is 12–20 1
CorksolventgmL
; in soxhlet extraction, the
concentration of the extractable components in the solvent increases with time
(after the first cycle); for each cycle, a new portion of the extractable fraction is
extracted and this process is repeated as many times as necessary until it
reaches the maximum extractable for the solvent. The total time of extraction
was fixed as 8 h (approximately 50 cycles). All extractions were performed in
triplicate, and three solvents with different polarities, hexane (HEX),
dichloromethane (DCM) and acetone (ACE), were used; as the experimental
procedure considers the screening of the effects of all variables, as particle size
and sample density, i.e. cork samples A1 to A9 (see Table 3.1), a total of 81
extractions were done.
Table 3.3 – Parameters for the Soxhlet extraction
Samples:* A1 up to A9
Solvents: Hexane (hex), dichloromethane (dcm) or acetone (ace)
Mass of sample: 6 – 10 g
Ratio of solvent/solid matrix: 12 – 20 1
CorksolventgmL
Extraction time 8 h (ca. 50 cycles) *To each solvent new samples were extracted and all extractions were performed in triplicate.
After soxhlet extraction, cork extracts were separated from each solvent by a
rotary evaporator; as a consequence of the reduced pressure, the solvent
evaporates at lower temperatures and guarantees that the extract is not over-
heated. At the end, it is possible to quantify the total yield for each solvent and
sample.

44 Soxhlet extraction
Supercritical fluid extraction and fractionation of bioactive natural products from cork
Conventional Soxhlet Extraction
Time = 1Solvent = 1
For each cork sample (A1 up to A9), weigh ca. 6-10 g of cork (inside a thimble); introduce it in a Soxhlet
extractor and put the Solvent in a flask.
Time = Time + 1
Solvent = Solvent + 1Time = 1
End Conventional Soxhlet Extractions
Verify if cold water is flowing in the condenser. Turn on the heater mantle which is in contact with the flask.
The extraction time starts after the first cycle; extraction should be continued by 8h.
Verify that the time of each cycle is constant.
When extraction is finished, cork extracts are separated from the solvent by a rotary evaporator.
Quantify the total yield for each sample.
Time < 3Yes
Solvent < 3
No
Yes
No
Figure 3.7 – Conventional method for soxhlet extraction.
In the next section (3.2.1 Yields), the effect of different parameters is evaluated
with respect to the performance of the extraction.

Soxhlet extraction 45
Soxhlet Extraction
3.2.1 Yields
The extraction yields (on a dry basis) obtained for each solvent are depicted in
Figure 3.8 as a function of the average particle size. The influence of solvent
polarity, particle size and density were analyzed in view of determining their
effect on the yields.
For all samples (A1 to A9), the yield increases with the polarity of the solvent,
regardless of the average particle size (or cork density). This increase was
probably related with the increase of solvent power for a wider range of low
molecular weight compounds present in the cork material.
The maximum yield (84 1
DryCorkextractkgg
) was obtained for sample A1 using
acetone as solvent; the value was ca. 17 and 42% higher than the ones obtained
with dichloromethane and hexane, respectively, for the same sample.
Figure 3.8 – Yields of conventional soxhlet extraction of industrial granulated cork as a
function of particle size, for the three solvents tested: (black) acetone, (gray) dichloromethane, (light gray) hexane. (A8) cork powder, (A1 to A6) inner bark and (A7 and A9) outer bark samples. The diamonds represent the average particle size and the
circles the cork density.
With respect to dichloromethane, the yields of samples from the inner section of
cork planks (A1 to A6) were 37 to 70 1
DryCorkextractkgg
; while the ones of samples
from the outer section (A7 and A9) were 14 to 32 1
DryCorkextractkgg
. Sousa et
al. (2006) reported, for similar samples with a granulometric fraction of 40–

46 Soxhlet extraction
Supercritical fluid extraction and fractionation of bioactive natural products from cork
60 mesh (ca. 0.4 – 0.2 mm), a yield of 50 1
DryCorkextractkgg
for particles from the
inner section of planks after the boiling process; whereas for samples from the
outer section, the yield obtained was 27 1
DryCorkextractkgg
. The results achieved by
Sousa et al. (2006) were within the interval obtained in this work. Also, both
works showed that the yields for the inner section were higher than those for
the outer section.
It is to highlight that the maximum yields obtained in this work, for each
individual solvent, were lower than the yields reached by Sousa et al. (2006); for
sequential extraction (dichloromethane, methanol and water) these were 112
and 57 1
DryCorkextractkgg
for samples from the inner and the outer sections of the
planks after the boiling process, respectively.
Regarding to industrial cork powder, Sousa et al. (2006) and Conde et al.
(1999), achieved yields of 26 and 22.6 1
DryCorkextractkgg
, respectively, using
dichloromethane; however, those values were 60 and 65% lower than those
obtained in this work for the same solvent and sample A8.
The influence of particle size in soxhlet extraction yields was also studied.
Figure 3.8 shows that the yields decrease for all solvents, regardless of the cork
density, when the particle size increases (within the inner bark samples: from
A1 to A6). As previously referred, the highest yields were obtained for sample
A1, the smallest particles (after cork powder). On the other hand, the lowest
yields were obtained with sample A5 (excluding the samples from the outer
section), i.e., the largest particles: 16 1
DryCorkextractkgg
(HEX), 37
1
DryCorkextractkgg
(DCM) and 48 1
DryCorkextractkgg
(ACE).
The cork samples from the outer section of cork planks had the lowest yields for
all solvents used; despite having the same particle size, yields 50% higher for
sample A7 than for sample A9 were obtained, in average.
The effect of particle size is more pronounced as the polarity of the solvent
decreases, i.e., as it is more selective for nonpolar compounds. These differences

Layer thickness of cork accessible to extraction 47
Soxhlet Extraction
are probably related with the higher specific surface area of the smaller
particles, promoting a better contact with the solvent and, consequently, leading
to an easier diffusion and mass transfer of each soluble compound from the cork
matrix into the solvent medium.
With respect to the effect of cork density, for particles from inner sections of the
planks having the same particle size (A1 and A3), but with rather different
densities (see Figure 3.8): for the three solvents used, a higher amount of
soluble compounds was extracted from sample A1 (higher cork density) than
from sample A3.
Particles corresponding to the outer sections of the planks (A7 and A9) have the
opposite behavior: particles with higher cork density led to lower extraction
yields. This behavior may be related with a lower content of low molecular
weight compounds relatively to macromolecular components. Therefore, the
effect of cork density in the outer region did not led to an increase on the
extractives yield.
Wshen one compares granulated industrial cork of the same size group, but
from different sections (inner – A2; and outer – A7 and A9), the yields obtained
with inner particles are higher.
Until now, we described the yields of the soxhlet extraction; nevertheless, the
previous results show that it is possible that only a layer of granulated can be
extracted; in the following section, it is calculated the layer thickness of cork
accessible to extraction, that could explain quantitatively the results obtained
with different particle sizes.
3.3 Layer thickness of cork accessible to extraction
To know the total cork extractives, some studies (Pereira, 1988, 2013; Sousa et
al., 2006) were focused to determine the chemical composition of cork, where
the samples were extracted sequentially with several solvents of increasing
polarity and the sum of this sequential extraction will represent the total cork
extractives. Table 3.4 shows the yield obtained for several cork samples (virgin

48 Layer thickness of cork accessible to extraction
Supercritical fluid extraction and fractionation of bioactive natural products from cork
and reproduction cork, cork powder, natural boiled cork, etc.), where the total
extractives were between 56 and 169 1
DryCorkextractkgg
. In those studies, the cork
samples were granulated to particle size lower than 1 mm.
Table 3.4 – Yields for sequential extractions of several cork samples.
Material* Total
Extractives (%)
Solvent Ref.
DCM EtOH1 or MeOH2
H2O
Virgin Cork 16.9 7.9 5.81 3.1 (Pereira, 1988)
Industrial cork powder 5.9 2.6 1.92 1.4 (Sousa et al., 2006)
Reproduction Cork 16.2 5.8 5.91 4.5 (Pereira, 2013)
Reproduction Cork 14.2 5.4 4.81 4 (Pereira, 1988)
Natural boiled cork planks obtained after a cork cooking stage
8 4.7 2.22 1.1 (Sousa et al., 2006)
Inner from boiled cork planks obtained after a cork cooking stage
11.2 5 3.62 2.6 (Sousa et al., 2006)
Outer from boiled cork planks obtained after a cork cooking stage
5.6 2.7 1.82 1.1 (Sousa et al., 2006)
* Particle size: 40-60 mesh.
The total of cork extractives depends on several factors, as previously
described: growth conditions, genetic origin, age and tree dimension, etc.
However, Table 3.4 will represent a bench mark to cork samples used in this
work; as explained before, the samples were obtained after milling the punched
cork planks, after a cork cooking stage, and they are constituted by granulated
industrial cork with particle sizes until 6 mm. According to Table 3.4, it is
assumed that the total extractives for the samples used in this work, from inner
section of cork planks, was 112 1
DryCorkextractkgg
.
In the soxhlet extraction, for hexane, dichloromethane or acetone, the maximum
yield obtained, in this work, was 84 1
DryCorkextractkgg
(acetone); most probably,
the cork samples used, after the extraction, still contain some extractives; and
when the solvent polarity decreases, the fraction of extractives that remains in
the sample is higher. It is to note that, since extraction was conducted until
completion, the maximum yield achieved for each solvent represents the
capacity for each one. Nevertheless, the decrease of yields when the particle size

Layer thickness of cork accessible to extraction 49
Soxhlet Extraction
for particles of same section increases can be explained if it is assumed that only
an outer layer of cork is extracted.
Cork is an excellent liquid sealant used from ancient times until nowadays. It is
then reasonable to assume that any liquid in contact with cork will penetrate
just its outer layer, being prevented to attain the inner core due to the unique
cork sealant properties. Assuming that each solvent extracts its maximum from
the wetted region, it is possible to estimate the outer layer as a function of the
extracting solvent.
To estimate this cork accessible shell to be extracted from each sample, i.e., the
layer available to be extracted, it was assumed that the extractives are equally
distributed inside the particle of each sample and all particles are spherical.
Figure 3.9 shows dimensionless cork layer, for all solvents; in these calculations,
it was assumed that cork powder was completely extracted, i.e., for cork powder
0c
r , leading to the capacity of each solvent; as expected, when the particle size
increases, the dimensionless thickness of the (outer) layer extracted decreases;
however, it can be noted that for particles bigger than 1 mm this value
decreases only slightly; then, it can be considered that this layer is nearly
constant for each solvent; being for hexane around half the value extracted with
the other two solvents, regardless of particle size. The dimensionless thickness,
on average, is ca. 0.22, 0.20 and 0.11 for acetone, dichloromethane and hexane,
respectively.
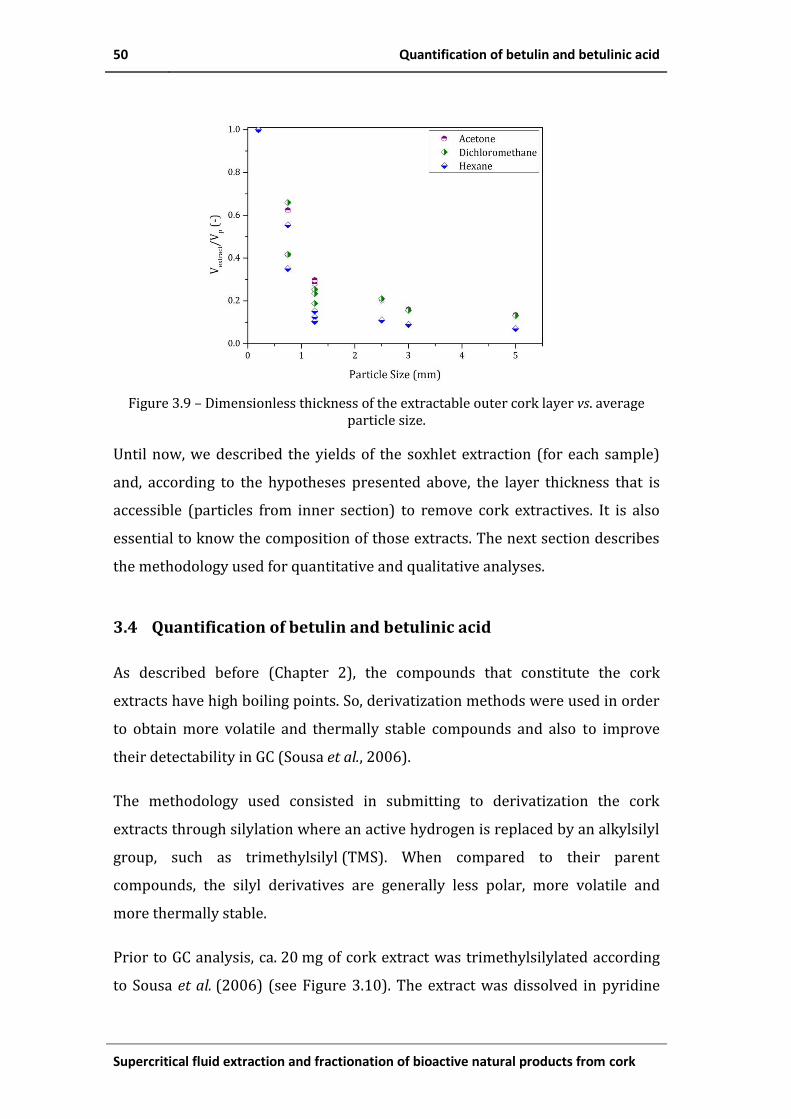
50 Quantification of betulin and betulinic acid
Supercritical fluid extraction and fractionation of bioactive natural products from cork
Figure 3.9 – Dimensionless thickness of the extractable outer cork layer vs. average
particle size.
Until now, we described the yields of the soxhlet extraction (for each sample)
and, according to the hypotheses presented above, the layer thickness that is
accessible (particles from inner section) to remove cork extractives. It is also
essential to know the composition of those extracts. The next section describes
the methodology used for quantitative and qualitative analyses.
3.4 Quantification of betulin and betulinic acid
As described before (Chapter 2), the compounds that constitute the cork
extracts have high boiling points. So, derivatization methods were used in order
to obtain more volatile and thermally stable compounds and also to improve
their detectability in GC (Sousa et al., 2006).
The methodology used consisted in submitting to derivatization the cork
extracts through silylation where an active hydrogen is replaced by an alkylsilyl
group, such as trimethylsilyl (TMS). When compared to their parent
compounds, the silyl derivatives are generally less polar, more volatile and
more thermally stable.
Prior to GC analysis, ca. 20 mg of cork extract was trimethylsilylated according
to Sousa et al. (2006) (see Figure 3.10). The extract was dissolved in pyridine
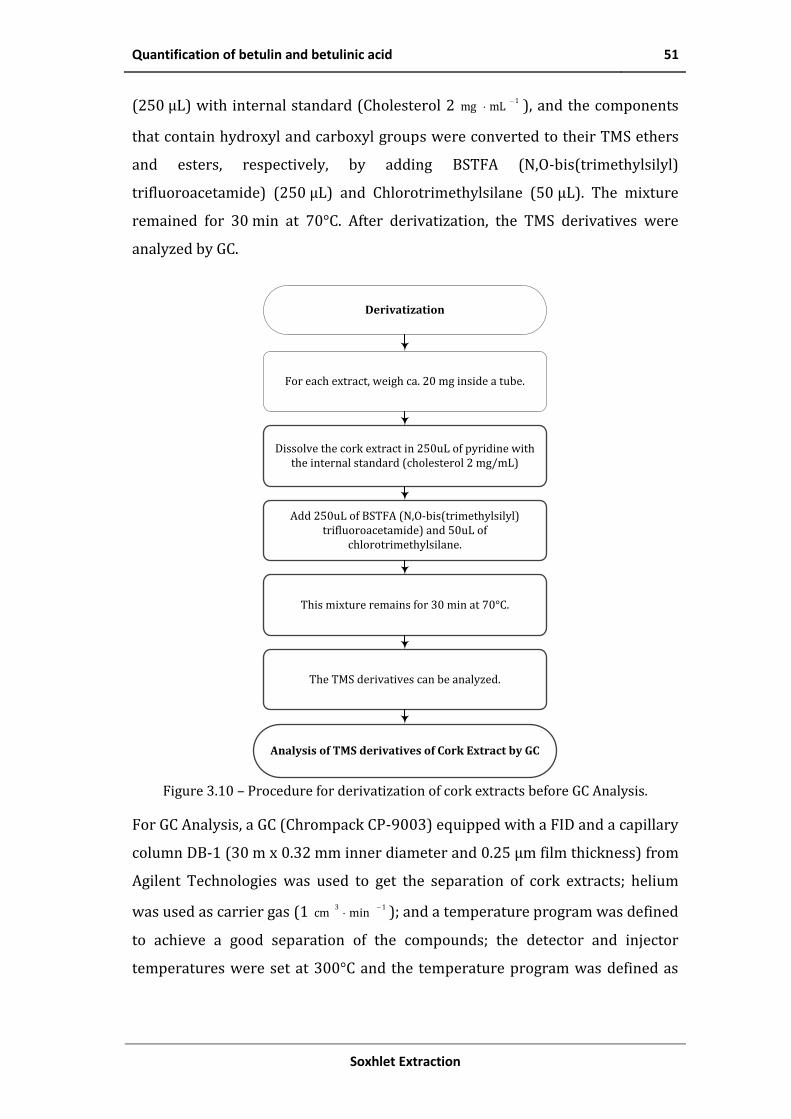
Quantification of betulin and betulinic acid 51
Soxhlet Extraction
(250 µL) with internal standard (Cholesterol 2 1mLmg
), and the components
that contain hydroxyl and carboxyl groups were converted to their TMS ethers
and esters, respectively, by adding BSTFA (N,O-bis(trimethylsilyl)
trifluoroacetamide) (250 µL) and Chlorotrimethylsilane (50 µL). The mixture
remained for 30 min at 70°C. After derivatization, the TMS derivatives were
analyzed by GC.
Derivatization
For each extract, weigh ca. 20 mg inside a tube.
Analysis of TMS derivatives of Cork Extract by GC
Dissolve the cork extract in 250uL of pyridine with the internal standard (cholesterol 2 mg/mL)
Add 250uL of BSTFA (N,O-bis(trimethylsilyl) trifluoroacetamide) and 50uL of
chlorotrimethylsilane.
This mixture remains for 30 min at 70°C.
The TMS derivatives can be analyzed.
Figure 3.10 – Procedure for derivatization of cork extracts before GC Analysis.
For GC Analysis, a GC (Chrompack CP-9003) equipped with a FID and a capillary
column DB-1 (30 m x 0.32 mm inner diameter and 0.25 µm film thickness) from
Agilent Technologies was used to get the separation of cork extracts; helium
was used as carrier gas (1 13mincm
); and a temperature program was defined
to achieve a good separation of the compounds; the detector and injector
temperatures were set at 300°C and the temperature program was defined as

52 Quantification of betulin and betulinic acid
Supercritical fluid extraction and fractionation of bioactive natural products from cork
follows: 80°C during the first 5 min, an increase from 80°C to 280°C with a
heating rate of 4 1minC
; and 20 min at 280°C.
a)
b) Figure 3.11 – Betulin (a) and betulinic acid (b) content in each extract sample vs.
particle size, for the three solvents tested. (A8) cork powder, (A1 to A6) inner bark and (A7 and A9) outer bark samples. Solvents: (black) acetone, (gray) dichloromethane, (light gray) hexane. The diamonds represent the average particle size and the circles
the cork density.
Figure 3.11 shows the betulin and betulinic acid contents in the extracts for
each sample and the three solvents (hexane, dichloromethane and acetone)
tested. As can be observed, the betulin content is 2.5 to 4.6 times lower than the
content of betulinic acid for all extracts.
Quantification of betulin and betulinic acid 53
Soxhlet Extraction
Solvent polarity, size group, and plank region affect the amounts of these two
target compounds in the extracts, but in a different manner when compared to
their influence on the yields (Figure 3.8), demonstrating that all these
parameters affect the extraction selectivity.
Although the yields obtained with hexane were the lowest, the extracts for this
non-polar solvent have the highest content of betulin (23 1
extractgmg
– sample
A9) and betulinic acid (74 1
extractgmg
– sample A9) when compared with the
other two solvents (Figure 3.11), making hexane more selective to the target
compounds, which is in accordance with its low polarity nature.
To the author’s best knowledge, there is no literature data with respect to
hexane extractions. However, Sousa et al. (2006) presented results for
dichoromethane extracts: 70 1
extract AcidBetulinicgmg
and 13 1
extractBetulingmg
(betulinic acid in extract was 5.3 times higher than betulin), for samples from
the outer section of cork planks after the boiling process; while Castola
et al. (2005) obtained, for a similar sample, 73 1
extract AcidBetulinicgmg
and
27 1
extractBetulingmg
(betulinic acid in extract was 2.7 times higher than betulin);
in this work the best results obtained for dichoromethane were with sample A7:
48 1
extract AcidBetulinicgmg
and 14 1
extractBetulingmg
, and for hexane were
71 1
extract AcidBetulinicgmg
and 21 1
extractBetulingmg
for the same sample; in average,
the content of betulinic acid in cork extracts were 3.3 times higher when
compared with betulin, which are in line with the literature presented.
With respect to the plank region, the behavior is also very interesting: although,
again, the yields obtained for outer bark sections are the lowest, their extracts
are the richest in betulinic acid and betulin. This behavior was also observed for
other barks (eg., Eucalyptus urograndis, Eucalyptus grandis, Eucalyptus maidenii,
Eucalyptus globulus and Eucalyptus nitens), where high amounts of triterpenoids
in the outer fraction are reported (Domingues et al., 2012; Domingues, Patinha,
et al., 2011; Domingues, Sousa, et al., 2011; Freire et al., 2002).

54 Quantification of betulin and betulinic acid
Supercritical fluid extraction and fractionation of bioactive natural products from cork
a)
b) Figure 3.12 – Betulin (a) and betulinic acid (b) contents in each sample vs. particle size, for the three solvents tested. (A8) cork powder, (A1 to A6) inner bark and (A7 and A9)
outer bark samples. Solvents: (black) acetone, (gray) dichloromethane, (light gray) hexane. The diamonds represent the average particle size and the circles the cork
density.
Figure 3.12 shows a global analysis, i.e., the betulinic acid and betulin contents
but on a dry cork basis. As can be observed, for the three solvents tested, there
is a similar trend: (i) the contents of betulin and betulinic acid in cork decrease
as the particle size increases, with sample A1 being the richest in both
compounds (2991 1
DryCork AcidBetulinickgmg
and 571
1
DryCorkBetulinkgmg
, for acetone);
(ii) for the same particle size and inner section (A1 and A3), samples with
higher cork density are richer in betulinic acid and betulin (iii); for the same
Quantification of betulin and betulinic acid 55
Soxhlet Extraction
particle size and outer section (A7 and A9), samples with lower cork density are
richer in betulinic acid and betulin.
It is also important to remark that, although the yields obtained with sample A7
(outer bark section) are lower than with all the other inner section samples and
cork powder, with respect to betulinic acid and, specially, betulin content (on a
dry cork basis), its behavior is different: the values obtained are not only
comparable to, but sometimes higher, than the ones obtained with inner section
cork samples.
Supercritical fluid extraction and fractionation of bioactive natural products from cork
Notation
Yield content of extractives in cork 1
DryCorkextract kgg
pR particle radius m
cr radius of core m
List of Acronyms
ACE Acetone
AAC António Almeida, Cortiças, S.A
CO2 Carbon Dioxide
DCM Dichloromethane
EtOH Ethanol
FID Flame Ionization Detector
GC Gas Chromatography
HEX Hexane
MeOH Methanol
SEM Scanning Electron Microscope
SFE Supercritical Fluid Extraction
Supercritical fluid extraction and fractionation of bioactive natural products from cork
References
Castola, V., Bighelli, A., Rezzi, S., Melloni, G., Gladiali, S., Desjobert, J.-M., and Casanova, J. (2002). “Composition and chemical variability of the triterpene fraction of dichloromethane extracts of cork (Quercus suber L.).” Industrial Crops and Products, 15(1), 15–22. doi:10.1016/S0926-6690(01)00091-7
Castola, V., Marongiu, B., Bighelli, A., Floris, C., Laı, A., and Casanova, J. (2005). “Extractives of cork (Quercus suber L.): chemical composition of dichloromethane and supercritical CO2 extracts.” Industrial Crops and Products, 21(1), 65–69. doi:10.1016/j.indcrop.2003.12.007
Conde, E., Garcia-Vallejo, M. C., and Cadahía, E. (1999). “Waxes composition of reproduction cork from Quercus suber and its variability throughout the industrial processing.” Wood Science and Technology, 33(3), 229–244. doi:10.1007/s002260050112
de Castro, M. D. L., and Priego-Capote, F. (2010). “Soxhlet extraction: Past and present panacea.” Journal of Chromatography A, 1217(16), 2383–2389. doi:10.1016/j.chroma.2009.11.027
Dean, J. R. (2009). “Extraction Techniques in Analytical Sciences.” Wiley.
Domingues, R. M. A., Oliveira, E. L. G., Freire, C. S. R., Couto, R. M., Simões, P. C., Neto, C. P., … Silva, C. M. (2012). “Supercritical Fluid Extraction of Eucalyptus globulus Bark-A Promising Approach for Triterpenoid Production.” International Journal of Molecular Sciences, 13(6), 7648–62. doi:10.3390/ijms13067648
Domingues, R. M. A., Patinha, D. J. S., Sousa, G. D. A., Villaverde, J. J., Silva, C. M., Freire, C. S. R., … Pascoal Neto, C. (2011). “Eucalyptus biomass residues from agro-forest and pulping industries as sources of high-value triterpenic compounds.” Cellulose Chemistry and Technology, 45(7–8), 475–481.
Domingues, R. M. A., Sousa, G. D. A., Silva, C. M., Freire, C. S. R., Silvestre, A. J. D., and Neto, C. P. (2011). “High value triterpenic compounds from the outer barks of several Eucalyptus species cultivated in Brazil and in Portugal.” Industrial Crops and Products, 33(1), 158–164. doi:10.1016/j.indcrop.2010.10.006
Feilden, A. (2010). “Update on Undertaking Extractable and Leachable Testing.” Smithers Rapra Technology. Retrieved from http://www.knovel.com/web/portal/browse/display?_EXT_KNOVEL_DISPLAY_bookid=4202
Freire, C. S. R., Silvestre, A. J. D., Neto, C. P., and Cavaleiro, J. A. S. (2002). “Lipophilic extractives of the inner and outer barks of Eucalyptus globulus.” Holzforschung, 56(4), 372–379.
Jensen, W. B. (2007). “The origin of the soxhlet extractor.” Journal of Chemical Education, 84(12), 1913–1914.
Lam, P. S., Sokhansanj, S., Bi, X., Lim, C. J., Naimi, L. J., Hoque, M., … Narayan, S. (2008). “Bulk density of wet and dry wheat straw and switchgrass particles.” Applied Engineering in Agriculture, 24(3), 351–358.
Miranda, I., Gominho, J., Mirra, I., and Pereira, H. (2012). “Chemical characterization of barks from Picea abies and Pinus sylvestris after fractioning into different particle sizes.” Industrial Crops and Products, 36(1), 395–400. doi:10.1016/j.indcrop.2011.10.035
Pereira, H. (1988). “Chemical composition and variability of cork from Quercus suber L.”
58 References
Supercritical fluid extraction and fractionation of bioactive natural products from cork
Wood Science and Technology, 22(3), 211–218. doi:10.1007/bf00386015
Pereira, H. (2013). “Variability of the Chemical Composition of Cork.” BioResources, 8(2), 2246–2256.
Santos, S. A. O., Villaverde, J. J., Sousa, A. F., Coelho, J. F., Neto, C. P., and Silvestre, A. J. D. (2013). “Phenolic composition and antioxidant activity of industrial cork by-products.” Industrial Crops and Products, 47, 262–269. doi:10.1016/j.indcrop.2013.03.015
Silva, S. P., Sabino, M. A., Fernandes, E. M., Correlo, V. M., Boesel, L. F., and Reis, R. L. (2005). “Cork: properties, capabilities and applications.” International Materials Reviews, 50(4), 345–365. doi:10.1179/174328005X41168
Sousa, A. F., Pinto, P. C. R. O., Silvestre, A. J. D., and Neto, C. P. (2006). “Triterpenic and other lipophilic components from industrial cork byproducts.” Journal of Agricultural and Food Chemistry, 54(18), 6888–6893. doi:10.1021/Jf060987+

Supercritical fluid extraction and fractionation of bioactive natural products from cork
Supercritical Fluid Extraction 4& Experimental Setup
In the extraction process, the solute should have a higher affinity for the solvent
in order to improve its separation. If the extraction is performed when the
solvent is above its critical pressure and temperature, the process can be
designated as supercritical fluid extraction (SFE).
The SFE aroused enormous interest a consequence of its advantages, since the
physical properties in this region promote the separation, its density is similar
to the liquid and its lack of surface tension allows to come in contact with the
solid to improve the extraction process; also its viscosity is in the same order of
magnitude of that of gases.
Nowadays, there are two major areas of application for the supercritical
extraction process, the counter current extraction of a liquid stream, and the
extraction of solutes from the interior of solid matrices. From the solid matrices,
the extraction is determined by the proportion of soluble components and their
distribution in the matrix, as particle size and solid nature (Coulson et al., 2002).
Usually, this process can be considered in three stages: first the solute is
dissolved by the solvent, then it diffuses through the pores to the outside of the
particle, and finally the solute in solution is transferred to the fluid (Coulson et
al., 2002).
“”
“Cork is a gift of Nature and a key factor for Sustainable Development”
(Corticeira Amorim)
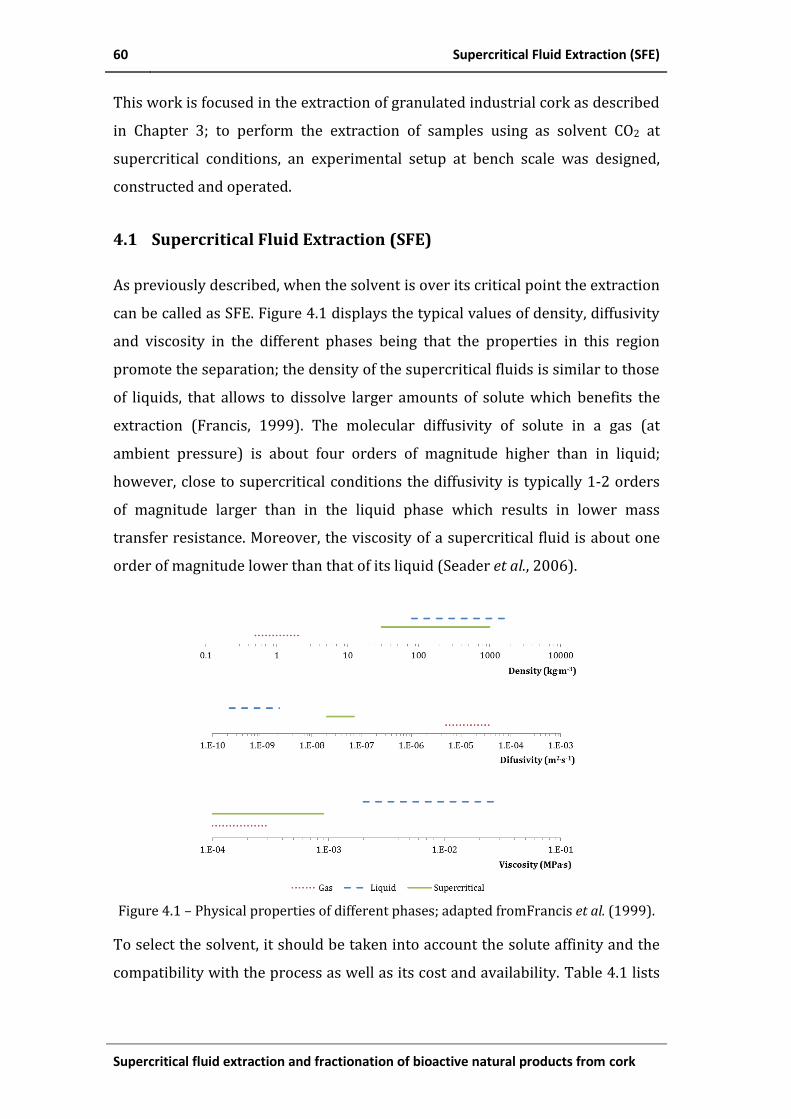
60 Supercritical Fluid Extraction (SFE)
Supercritical fluid extraction and fractionation of bioactive natural products from cork
This work is focused in the extraction of granulated industrial cork as described
in Chapter 3; to perform the extraction of samples using as solvent CO2 at
supercritical conditions, an experimental setup at bench scale was designed,
constructed and operated.
4.1 Supercritical Fluid Extraction (SFE)
As previously described, when the solvent is over its critical point the extraction
can be called as SFE. Figure 4.1 displays the typical values of density, diffusivity
and viscosity in the different phases being that the properties in this region
promote the separation; the density of the supercritical fluids is similar to those
of liquids, that allows to dissolve larger amounts of solute which benefits the
extraction (Francis, 1999). The molecular diffusivity of solute in a gas (at
ambient pressure) is about four orders of magnitude higher than in liquid;
however, close to supercritical conditions the diffusivity is typically 1-2 orders
of magnitude larger than in the liquid phase which results in lower mass
transfer resistance. Moreover, the viscosity of a supercritical fluid is about one
order of magnitude lower than that of its liquid (Seader et al., 2006).
Figure 4.1 – Physical properties of different phases; adapted fromFrancis et al. (1999).
To select the solvent, it should be taken into account the solute affinity and the
compatibility with the process as well as its cost and availability. Table 4.1 lists

Supercritical Fluid Extraction (SFE) 61
Supercritical Fluid Extraction & Experimental Setup
some compounds which have received special attention as solvents in
supercritical conditions.
Table 4.1 – Critical constants of the main solvents considered in supercritical extraction. Data from Perry (2008)
Solvent
Molecular
weight,
1molg
Critical temperature,
cT K
Critical pressure,
cp MPa
Critical
density,c
3mkg
cZ
Acetone (C3H6O) 58.079 508.2 4.701 278 0.233
Ammonia (NH3) 17.031 405.6 11.28 235 0.242
Carbon dioxide (CO2) 44.010 304.2 7.383 468 0.274
Ethane (C2H6) 30.069 305.3 4.872 207 0.279
Ethanol (C2H5OH) 46.068 514.0 6.137 274 0.241
Ethylene (C2H4) 28.053 282.3 5.041 214 0.281
N-hexane (C6H14) 86.175 507.6 3.025 232 0.266
Methane (CH4) 16.042 190.5 4.599 163 0.286
Methanol (CH3OH) 32.042 512.5 8.084 274 0.222
Propane (C3H8) 44.096 369.8 4.248 220 0.276
Propylene (C3H6) 42.080 364.8 4.600 227 0.280
Water (H2O) 18.015 647.1 22.06 322 0.229
Besides solvent phase, in the extraction process there are some other factors
that may influence the separation, as the particle size, since smaller particles
provide a large interfacial area between the solid and the fluid phase which
increases transfer rate; however, by decreasing the particle size, the pressure
drop within the bed increases. Operating parameters have also relevance, e.g.,
increasing the extraction temperature commonly raises the solubility and the
diffusion coefficient, and as consequence the extraction rate.
In Table 4.1 CO2 should be highlighted, since the supercritical CO2 is recognized
by the FDA (U.S. Food and Drug Administration) as a GRAS (Generally
Recognized As Safe), i.e., a safe solvent, because it leaves no trace on the
products (extracts) neither on the raw material. It is not flammable, non-
corrosive, inert and non-toxic. Likewise, it enables the treatment of the raw
material in near-ambient temperatures, since its critical temperature is around

62 Supercritical Fluid Extraction (SFE)
Supercritical fluid extraction and fractionation of bioactive natural products from cork
31°C, which becomes relevant in the treatment of substances that are thermally
labile, as numerous natural products (Azevedo et al., 2009). Figure 4.2 depicts
the CO2 phase diagram, according to the equations to estimate the melting
pressure (mel
p ), Eq. 4.1, the sublimation pressure(sub
p ), Eq. 4.2, and the vapour
pressure ( vapp ), Eq. 4.3, that were established by Span and Wagner (1994).
Figure 4.2 – CO2 Phase Diagram.
KTKT
Ta
T
Ta
p
p
ttt
222217;111
2
mel,2mel,1
mel
Eq. 4.1
9.2
sub,3
9.1
sub,2s,1
sub111ln
ttt
ub
t
tT
Ta
T
Ta
T
Ta
T
T
p
p Eq. 4.2
4
1
v,
vap
vap,
1ln
i
t
c
api
c
c
i
T
Ta
T
T
p
p Eq. 4.3
Where T is the temperature in kelvin and MPa51795.0t
p ,
K592.216t
T , MPa383.7c
p and K2.304c
T , the values of the other
constants jia
, and vap,it are displayed in Table 4.2.
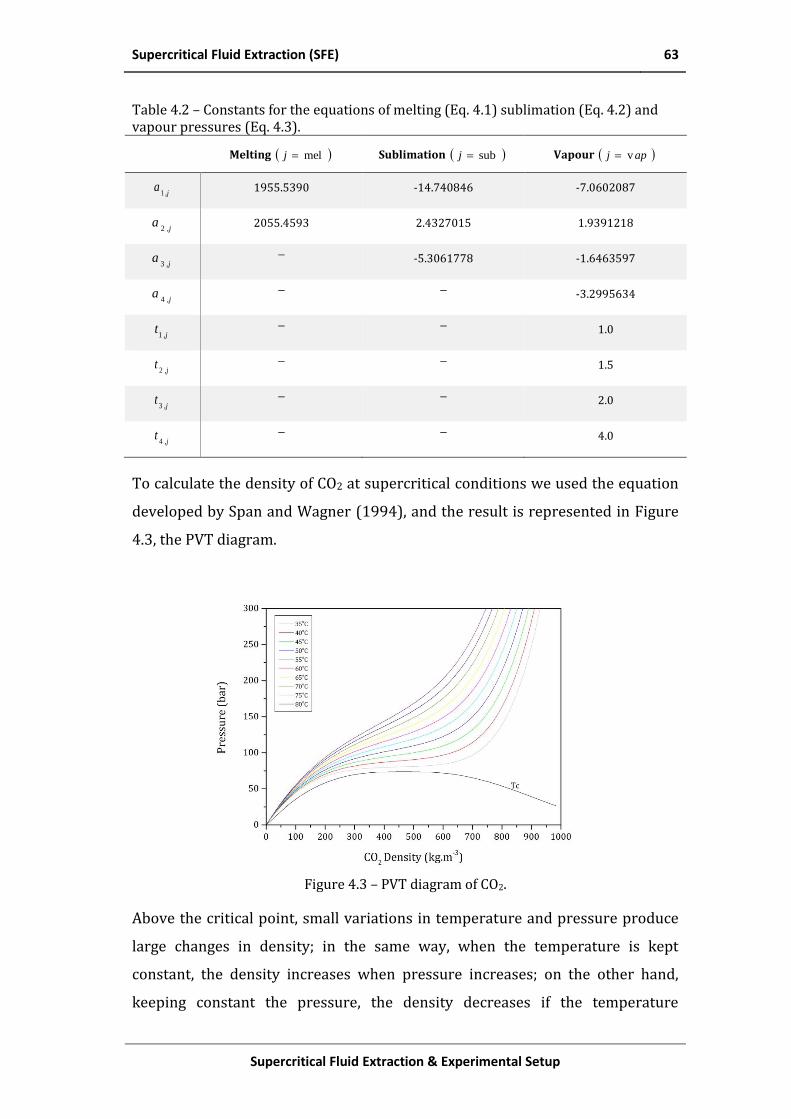
Supercritical Fluid Extraction (SFE) 63
Supercritical Fluid Extraction & Experimental Setup
Table 4.2 – Constants for the equations of melting (Eq. 4.1) sublimation (Eq. 4.2) and vapour pressures (Eq. 4.3).
Melting melj Sublimation subj Vapour apj v
,ja
1 1955.5390 -14.740846 -7.0602087
,ja
2 2055.4593 2.4327015 1.9391218
,ja
3 -5.3061778 -1.6463597
,ja
4 -3.2995634
,jt
1 1.0
,jt
2 1.5
,jt
3 2.0
,jt
4 4.0
To calculate the density of CO2 at supercritical conditions we used the equation
developed by Span and Wagner (1994), and the result is represented in Figure
4.3, the PVT diagram.
Figure 4.3 – PVT diagram of CO2.
Above the critical point, small variations in temperature and pressure produce
large changes in density; in the same way, when the temperature is kept
constant, the density increases when pressure increases; on the other hand,
keeping constant the pressure, the density decreases if the temperature

64 Supercritical Fluid Extraction (SFE)
Supercritical fluid extraction and fractionation of bioactive natural products from cork
increases, e.g., at 100 bar and 40°C, the CO2 density is 629 3mkg
, and
decreases about 54% until 290 3mkg
at 60°C. Table 4.3 shows the values of
the density of CO2 in a range from 31 up to 80°C and from its critical pressure up
to 300 bar.
Table 4.3. – Density of CO2 -3mkg for the critical point and above it.
Pressure (bar) / Temperature (°C) 31 40 60 80
73.8 468* 222 168 144
100 761 629 290 222
150 841 780 604 427
200 886 744 724 594
250 918 879 787 686
300 944 910 830 746
* Critical density
Besides density, in the supercritical region, the solubility and selectivity are also
sensitive to changes in pressure and temperature; this makes possible
dissolving non-volatile compounds at moderate temperatures (31°C) (Noyes,
1994), since CO2 has a low critical temperature. The CO2 presents good solvent
properties for non-polar molecules (Modey et al., 1996); however, to dissolve
polar compounds, adding a co-solvent can increase the solubility.
In industry, the use of supercritical CO2 has been arousing great interest, for
example, in the extraction of caffeine and some high value-added products, such
as flavorings, fragrances and food supplements (Lozowski, 2010). Table 4.4
shows some commercial-scale supercritical CO2 extraction plants or processes,
indicating the location and manufacturer.
Table 4.4 – Commercial-scale supercritical CO2 extraction plants and processes.
Process Location Manufacturer
Coffee decaffeination* Houston, Tex., U.S. Maximus Coffee Group LP (General Foods)
Bremen, Germany Kaffe HAG AG
Bremen, Germany Hermsen
Poszillo, Italy SKW-Trostberg AG
Tea decaffeination* Munchmuenster, Germany SKW-Trostberg AG
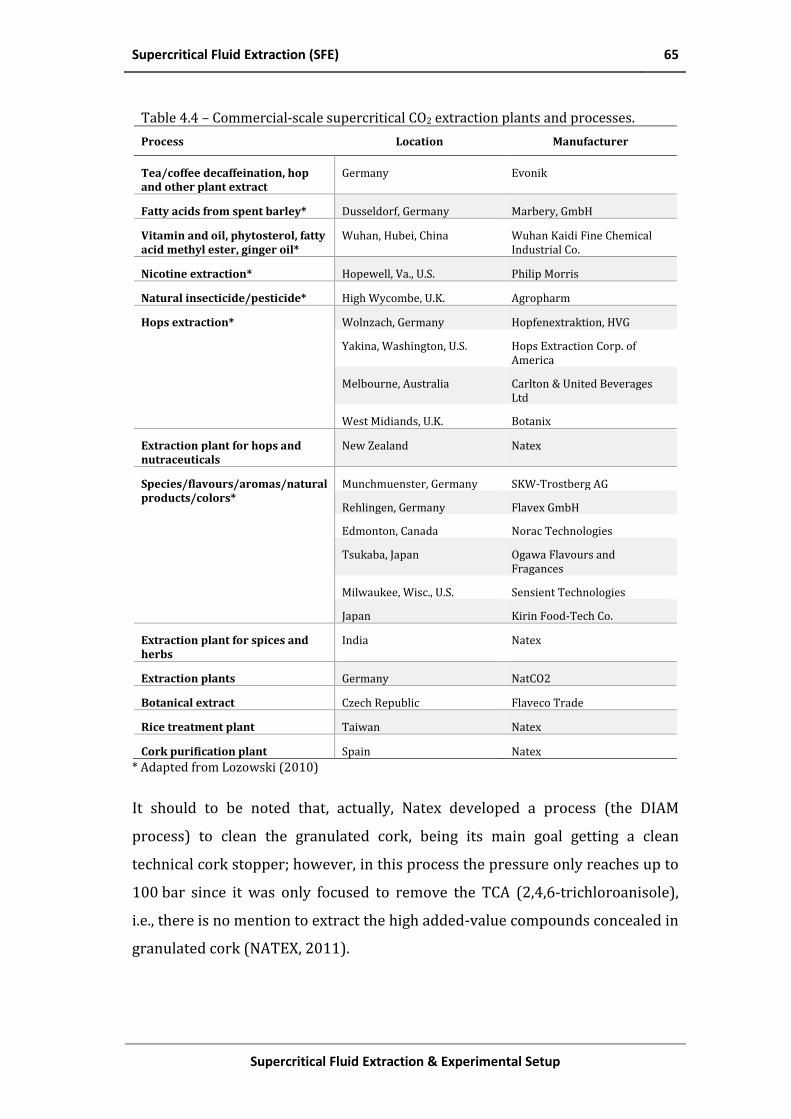
Supercritical Fluid Extraction (SFE) 65
Supercritical Fluid Extraction & Experimental Setup
Table 4.4 – Commercial-scale supercritical CO2 extraction plants and processes.
Process Location Manufacturer
Tea/coffee decaffeination, hop and other plant extract
Germany Evonik
Fatty acids from spent barley* Dusseldorf, Germany Marbery, GmbH
Vitamin and oil, phytosterol, fatty acid methyl ester, ginger oil*
Wuhan, Hubei, China Wuhan Kaidi Fine Chemical Industrial Co.
Nicotine extraction* Hopewell, Va., U.S. Philip Morris
Natural insecticide/pesticide* High Wycombe, U.K. Agropharm
Hops extraction* Wolnzach, Germany Hopfenextraktion, HVG
Yakina, Washington, U.S. Hops Extraction Corp. of America
Melbourne, Australia Carlton & United Beverages Ltd
West Midiands, U.K. Botanix
Extraction plant for hops and nutraceuticals
New Zealand Natex
Species/flavours/aromas/natural products/colors*
Munchmuenster, Germany SKW-Trostberg AG
Rehlingen, Germany Flavex GmbH
Edmonton, Canada Norac Technologies
Tsukaba, Japan Ogawa Flavours and Fragances
Milwaukee, Wisc., U.S. Sensient Technologies
Japan Kirin Food-Tech Co.
Extraction plant for spices and herbs
India Natex
Extraction plants Germany NatCO2
Botanical extract Czech Republic Flaveco Trade
Rice treatment plant Taiwan Natex
Cork purification plant Spain Natex
* Adapted from Lozowski (2010)
It should to be noted that, actually, Natex developed a process (the DIAM
process) to clean the granulated cork, being its main goal getting a clean
technical cork stopper; however, in this process the pressure only reaches up to
100 bar since it was only focused to remove the TCA (2,4,6-trichloroanisole),
i.e., there is no mention to extract the high added-value compounds concealed in
granulated cork (NATEX, 2011).

66 Design and construction of a bench-scale supercritical fluid extraction (SFE) setup
Supercritical fluid extraction and fractionation of bioactive natural products from cork
4.2 Design and construction of a bench-scale supercritical fluid
extraction (SFE) setup
The experimental setup for the supercritical fluid extraction used in this work
was designed and built by the author. Figure 4.4 shows the proposed layout; it
was divided in three zones according to its operating conditions, each one
corresponding to a specific stage of the process: feed, extraction and separation.
Figure 4.4 – Schematic representation of SFE setup
The CO2 is supplied through a cylinder at the liquid/gas equilibrium pressure
(e.g., pressure 50 bar at 15°C); this cylinder is equipped with a dip tube through
which the CO2 leaves the bottle in the liquid phase and the pump head is also
cooled to ensure liquid phase at the pump inlet. After the pump, extraction zone,
the pressure can achieve 300 bar according to the operating conditions. An oven
keeps the temperature constant in this zone. The CO2 under supercritical
conditions dissolves the extractable compounds concealed in the cork. The
pressure is reduced in the next stage (separation section) through a pressure-
reducing valve, and the cork extracts are separated from the CO2, now in the gas
phase; the cork extracts remain in the separator while the CO2 is released to the
environment. It should be highlighted that, in a large scale process, the CO2
should be recirculated.
The SFE setup was designed to work in both static mode being the inlet and
outlet of the extractor closed by a specific period of time; and in continuous
mode with a constant flow rate of CO2; in both cases, the temperature and
CO2
Cooling Bath Pump
F
MFM
Oven
T PTP
up to 60 bar
up to 300 barup to 70 bar
T
Ru
ptu
re D
isc
Check Valve
BPR
atm
Feed Extraction Separation
atm
purge
E-5
Design and construction of a bench-scale supercritical fluid extraction (SFE) setup 67
Supercritical Fluid Extraction & Experimental Setup
pressure are kept constant. The parts of the extraction and separation zones
were designed and built specifically to this project in order to operate at
pressures up to 300 and 100 bar, respectively as will be referred in the
following sections.
After defining the requirements of the entire setup, it was evaluated the
possibility to use some equipment already available in the laboratory, as a high
pressure isocratic pump adapted to CO2, and cooling bath with recirculation, etc.
The experimental setup will be described in detail in the next sections,
indicating the components of each section and a 3D drawing was done in order
to simplify its construction/assembling, since it helps the visualization of the
real position of each part.
4.2.1 Feed section
The function of this section is the supply and conditioning of the CO2 (solvent).
The CO2 supply (>99% purity) is made by a cylinder under pressure with a dip
tube to take liquid CO2, as shown in Figure 4.5; afterwards, the solvent goes
through a switching (3-way) valve, to the pump or the bypass (purge).
The maximum pressure, in this section, corresponds to the equilibrium CO2
pressure inside the cylinder (see Phase diagram of CO2 – Figure 4.2). The pump
head is cooled to ensure liquid phase at its inlet. The isocratic pump (JASCO PU-
2080) was already available in the laboratory; it works at constant flow or
constant pressure; in the constant flow mode, the maximum pressure is about
50 MPa at a flow rate lower than 5 1minmL
; if the flow rate is higher than
5 1minmL
, the maximum pressure is ca. 35 MPa. This pump has two check
valves, one at the inlet and the other at the outlet to guarantee that the flow has
only one direction; after the pump, the CO2 continues to the extraction section
as described below.

68 Design and construction of a bench-scale supercritical fluid extraction (SFE) setup
Supercritical fluid extraction and fractionation of bioactive natural products from cork
Figure 4.5 – Schematic representation of the feed section.
The schematic 3D drawing of this section is presented in Figure 4.6, where a
recirculating bath is used to cool the pump head.
Legend:
A – CO2 Cylinder
B – Recirculating bath
C - Switching (3-way) valve
D – Needle valve (purge)
E – Isocratic CO2 Pump with cooled head
Figure 4.6 – Schematic 3D drawing of feed section of the experimental SFE setup.
4.2.2 Extraction section
The extraction section corresponds to the heart of the setup. Here, the pressure
can reach 300 bar, while the temperature can be between 40 and 80°C; small
changes in the operating conditions can result in very large changes in the
CO2
Cylinder
Cooling Bath3-way Valve
Nee
dle
Val
ve
Purge
Go to Extractor
Valve
Pump
up to 60 bar
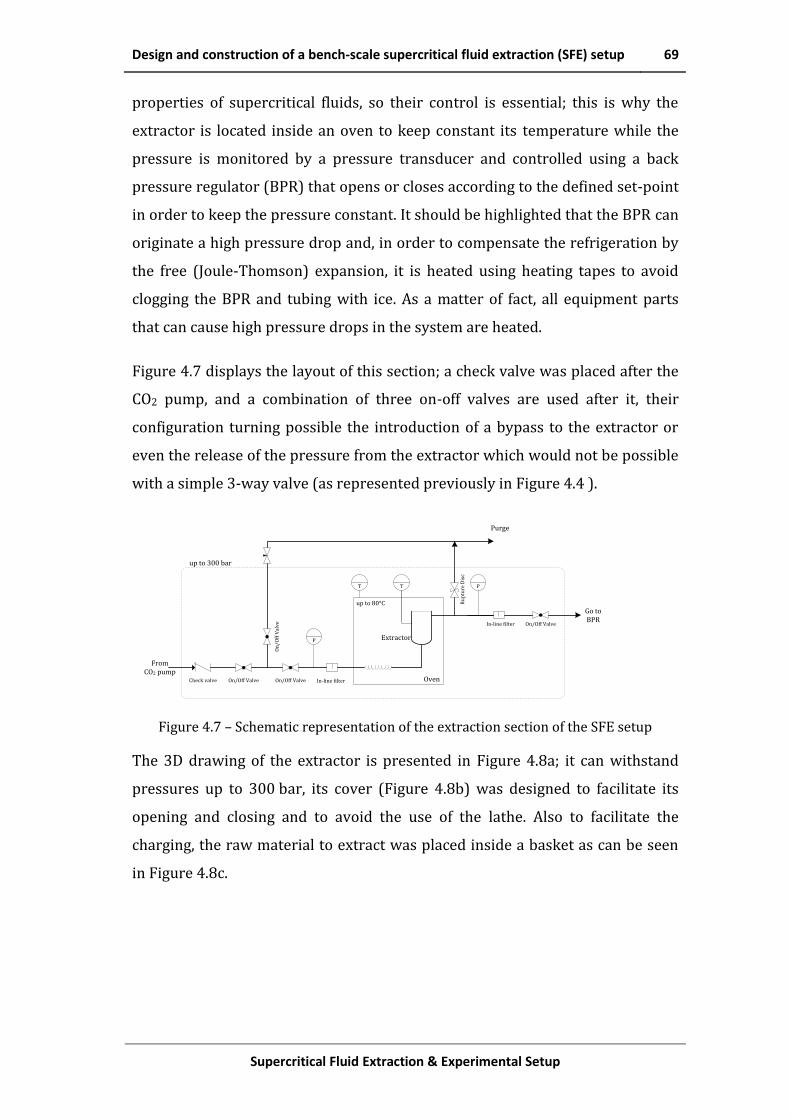
Design and construction of a bench-scale supercritical fluid extraction (SFE) setup 69
Supercritical Fluid Extraction & Experimental Setup
properties of supercritical fluids, so their control is essential; this is why the
extractor is located inside an oven to keep constant its temperature while the
pressure is monitored by a pressure transducer and controlled using a back
pressure regulator (BPR) that opens or closes according to the defined set-point
in order to keep the pressure constant. It should be highlighted that the BPR can
originate a high pressure drop and, in order to compensate the refrigeration by
the free (Joule-Thomson) expansion, it is heated using heating tapes to avoid
clogging the BPR and tubing with ice. As a matter of fact, all equipment parts
that can cause high pressure drops in the system are heated.
Figure 4.7 displays the layout of this section; a check valve was placed after the
CO2 pump, and a combination of three on-off valves are used after it, their
configuration turning possible the introduction of a bypass to the extractor or
even the release of the pressure from the extractor which would not be possible
with a simple 3-way valve (as represented previously in Figure 4.4 ).
Purge
Oven
T PT
up to 300 bar
Ru
ptu
re D
isc
Check valve
On/Off Valve
On/Off Valve On/Off Valve
On
/Off
Val
ve
In-line filter
P
In-line filter
up to 80°C
Go to BPR
From CO2 pump
Extractor
Figure 4.7 – Schematic representation of the extraction section of the SFE setup
The 3D drawing of the extractor is presented in Figure 4.8a; it can withstand
pressures up to 300 bar, its cover (Figure 4.8b) was designed to facilitate its
opening and closing and to avoid the use of the lathe. Also to facilitate the
charging, the raw material to extract was placed inside a basket as can be seen
in Figure 4.8c.
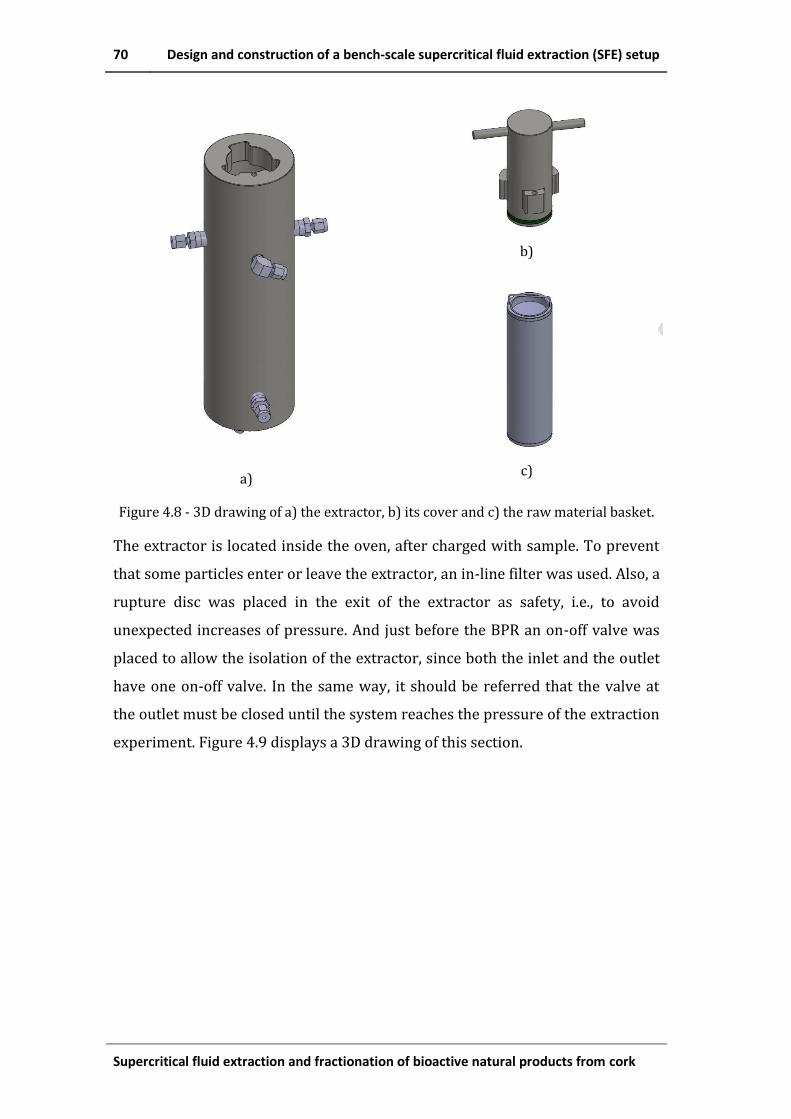
70 Design and construction of a bench-scale supercritical fluid extraction (SFE) setup
Supercritical fluid extraction and fractionation of bioactive natural products from cork
a)
b)
c)
Figure 4.8 - 3D drawing of a) the extractor, b) its cover and c) the raw material basket.
The extractor is located inside the oven, after charged with sample. To prevent
that some particles enter or leave the extractor, an in-line filter was used. Also, a
rupture disc was placed in the exit of the extractor as safety, i.e., to avoid
unexpected increases of pressure. And just before the BPR an on-off valve was
placed to allow the isolation of the extractor, since both the inlet and the outlet
have one on-off valve. In the same way, it should be referred that the valve at
the outlet must be closed until the system reaches the pressure of the extraction
experiment. Figure 4.9 displays a 3D drawing of this section.

Design and construction of a bench-scale supercritical fluid extraction (SFE) setup 71
Supercritical Fluid Extraction & Experimental Setup
Legend:
A – Check valve
B – on-off valve
C – Section that includes:
B – on-off valve,
G – pressure gauge,
H – in-line filter,
D – Section that includes:
B – on-off valve
H – in-line filter,
I – pressure transducer,
J –rupture disc,
E – Extractor
F – BPR
zoom of section C
zoom of section D
Figure 4.9 – Schematic 3D drawing of the extraction section of the experimental SFE setup.
In the following section, the extracts from cork are separated from the solvent
(CO2).
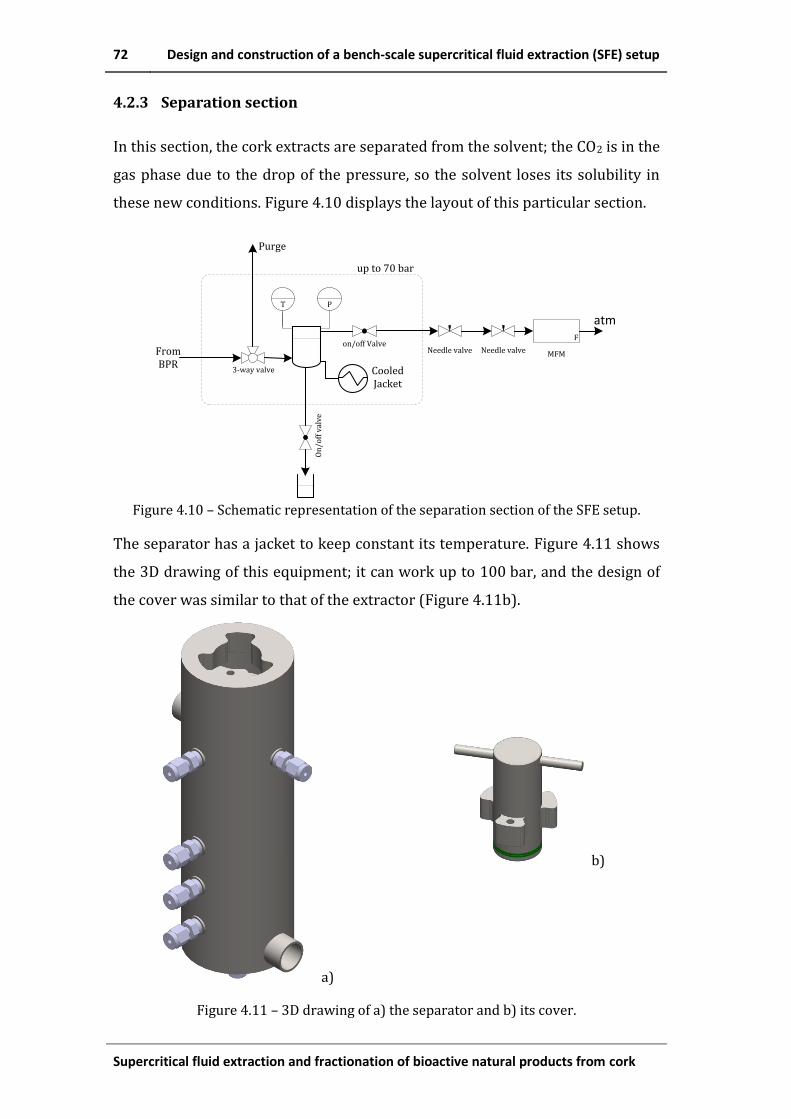
72 Design and construction of a bench-scale supercritical fluid extraction (SFE) setup
Supercritical fluid extraction and fractionation of bioactive natural products from cork
4.2.3 Separation section
In this section, the cork extracts are separated from the solvent; the CO2 is in the
gas phase due to the drop of the pressure, so the solvent loses its solubility in
these new conditions. Figure 4.10 displays the layout of this particular section.
Figure 4.10 – Schematic representation of the separation section of the SFE setup.
The separator has a jacket to keep constant its temperature. Figure 4.11 shows
the 3D drawing of this equipment; it can work up to 100 bar, and the design of
the cover was similar to that of the extractor (Figure 4.11b).
a)
b)
Figure 4.11 – 3D drawing of a) the separator and b) its cover.
T
up to 70 bar
P
3-way valve
On
/off
val
ve
CooledJacket
on/off ValveF
MFMNeedle valve Needle valve
atm
Purge
From BPR
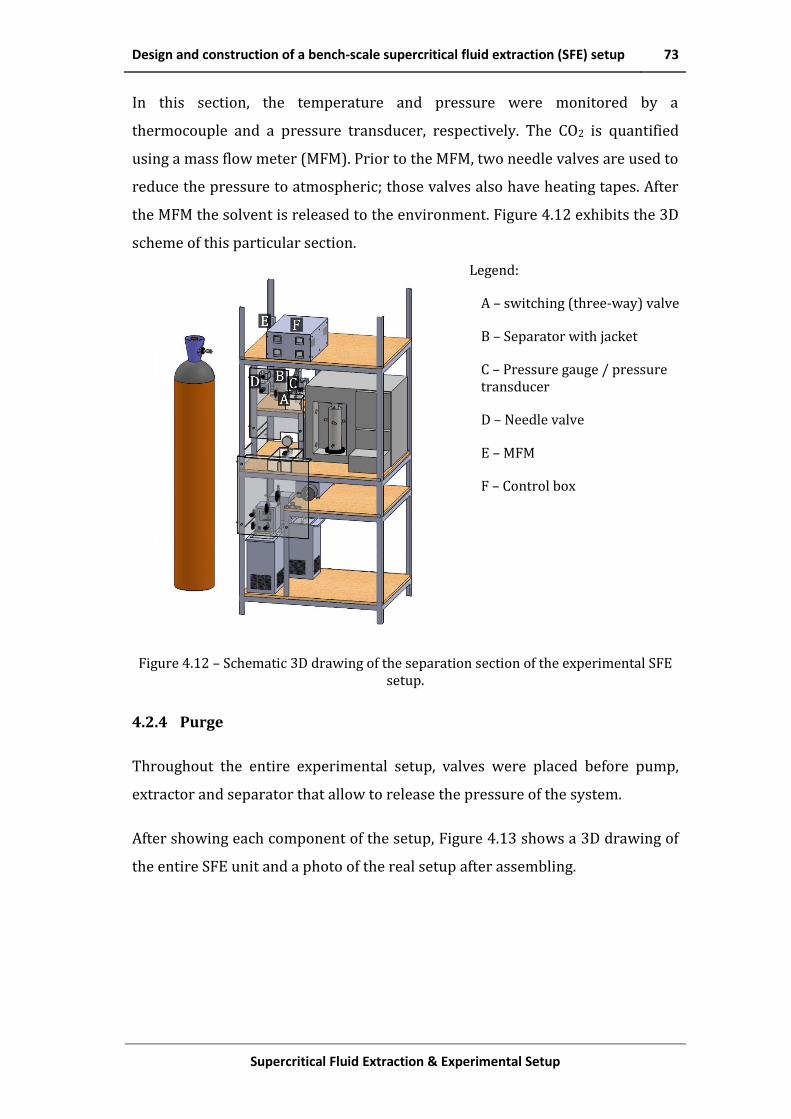
Design and construction of a bench-scale supercritical fluid extraction (SFE) setup 73
Supercritical Fluid Extraction & Experimental Setup
In this section, the temperature and pressure were monitored by a
thermocouple and a pressure transducer, respectively. The CO2 is quantified
using a mass flow meter (MFM). Prior to the MFM, two needle valves are used to
reduce the pressure to atmospheric; those valves also have heating tapes. After
the MFM the solvent is released to the environment. Figure 4.12 exhibits the 3D
scheme of this particular section.
Legend:
A – switching (three-way) valve
B – Separator with jacket
C – Pressure gauge / pressure transducer
D – Needle valve
E – MFM
F – Control box
Figure 4.12 – Schematic 3D drawing of the separation section of the experimental SFE setup.
4.2.4 Purge
Throughout the entire experimental setup, valves were placed before pump,
extractor and separator that allow to release the pressure of the system.
After showing each component of the setup, Figure 4.13 shows a 3D drawing of
the entire SFE unit and a photo of the real setup after assembling.

74 Design and construction of a bench-scale supercritical fluid extraction (SFE) setup
Supercritical fluid extraction and fractionation of bioactive natural products from cork
Figure 4.13 – Schematic 3D drawing and photo of the SFE setup after assembling.
Table 4.5 depicts a material list for all equipment used in this setup, indicating
the respective main feature as well as brief descriptions of the equipment in all
sections.

Design and construction of a bench-scale supercritical fluid extraction (SFE) setup 75
Supercritical Fluid Extraction & Experimental Setup
Tab
le 4
.5 –
Lis
t o
f m
ater
ial i
n t
he
sup
ercr
itic
al f
luid
ext
ract
ion
set
up
De
scri
pti
on
CO
2 c
yli
nd
er w
ith
a d
ip t
ub
e to
tak
e li
qu
id C
O2. C
yli
nd
er f
rom
Ar
Liq
uid
e P
ort
uga
l (>
99
.99
%).
Th
is b
ath
was
av
aila
ble
in
th
e la
bo
rato
ry. M
c: L
aud
a; m
od
el: e
co-
lin
e R
E 1
04
. Op
erat
ing
tem
per
atu
re r
ange
: -1
0 t
o 1
20
°C.
Mc:
Sw
agel
ok
, Ty
pe:
1/8
"; m
ater
ial:
sta
inle
ss s
teel
; wo
rkin
g p
ress
ure
: up
to
85
00
psi
g.
Iso
crat
ic p
um
p t
o h
igh
pre
ssu
re; t
his
pu
mp
was
alr
ead
y a
vai
lab
le
in t
he
lab
ora
tory
; it
was
ad
apte
d t
o C
O2 w
ith
a c
oo
led
hea
d. M
c:
Jasc
o; m
od
el: P
U-2
08
0.
Mc:
Sw
agel
ok
; ty
pe:
lift
ch
eck
val
ves
; mat
eria
l: s
tain
less
ste
el;
tem
per
atu
re: 9
3°C
- w
ork
ing
pre
ssu
re: 3
55
bar
.
It w
as u
sed
an
old
GC
ov
en a
vail
able
in
th
e la
b. T
he
inte
rnal
d
imen
sio
n o
f th
e o
ven
: 21
5 x
35
5 x
12
5 m
m.
Mc:
Sw
agel
ok
; ty
pe:
tee
-ty
pe
filt
ers;
mat
eria
l: s
tain
less
ste
el;
tem
per
atu
re: u
p t
o 9
3°C
- w
ork
ing
pre
ssu
re: u
p t
o 3
55
bar
.
Mc:
Sw
agel
ok
; ty
pe:
mu
ltip
urp
ose
bal
l val
ves
(on
-off
); m
ater
ial:
St
ain
less
Ste
el, t
emp
erat
ure
: up
to
93
°C -
wo
rkin
g p
ress
ure
: up
to
3
55
bar
.
Th
e d
isc
bre
aks
wh
en t
he
pre
ssu
re r
each
es c
a. 4
00
bar
.
Mc:
Sw
agel
ok
, mo
del
: gen
eral
-pu
rpo
se s
tain
less
ste
el g
auge
wit
h
adju
stab
le p
oin
ter.
Pre
ssu
re r
ange
: 0 –
40
0 b
ar.
Re
qu
ire
me
nts
CO
2 s
up
ply
(>
99
.99
%)
to t
he
extr
acti
on
.
To
co
ol t
he
CO
2 b
efo
re e
nte
rin
g th
e p
um
p, i
ts t
emp
erat
ure
was
ab
ou
t -
1°C
.
In t
his
sec
tio
n, t
he
max
imu
m p
ress
ure
was
def
ined
by
th
e eq
uil
ibri
um
p
ress
ure
of
CO
2 in
sid
e th
e cy
lin
der
(i.e
., u
p t
o 6
0 b
ar).
To
in
crea
se t
he
pre
ssu
re t
o e
xtra
ctio
n r
equ
irem
ents
. Th
e p
ress
ure
sh
ou
ld b
e h
igh
er t
han
th
e cr
itic
al p
ress
ure
up
to
30
0 b
ar.
En
sure
s th
ere
is n
o f
low
ret
urn
to
pu
mp
hea
d.
To
kee
p c
on
stan
t th
e ex
trac
tio
n t
emp
erat
ure
in t
he
enti
re p
roce
ss.
Pre
ven
t th
at s
om
e p
arti
cles
fro
m c
ork
sam
ple
s go
es t
o t
he
foll
ow
eq
uip
men
t as
th
e B
PR
.
Co
ntr
ol t
he
CO
2 s
up
ply
to
th
e ex
trac
tor
and
als
o t
he
ou
tpu
t o
f th
e ex
trac
tor.
To
av
oid
ove
r p
ress
uri
zati
on
pea
ks
in t
he
syst
em (
extr
acto
r); i
f th
e p
ress
ure
ris
es o
ver
30
0 b
ar t
he
dis
c b
reak
s to
rel
ease
th
e p
ress
ure
.
Mo
nit
or
the
pre
ssu
re b
efo
re t
he
extr
acto
r in
th
e ra
nge
of
wo
rkin
g p
ress
ure
.
Eq
uip
me
nt
CO
2 C
yli
nd
er
Bat
h
Tu
be
CO
2 p
um
p
Ch
eck
val
ve
Ov
en
Fil
ters
Val
ves
Ru
ptu
re d
isc
Pre
ssu
re G
auge
s
Se
ctio
n
Fee
d
Ext
ract
ion

76 Design and construction of a bench-scale supercritical fluid extraction (SFE) setup
Supercritical fluid extraction and fractionation of bioactive natural products from cork
Tab
le 4
.5 –
Lis
t o
f m
ater
ial i
n t
he
sup
ercr
itic
al f
luid
ext
ract
ion
set
up
(co
nti
nu
ed)
De
scri
pti
on
Mc:
Om
ega;
ran
ge: 0
– 7
50
0 p
sig.
Th
erm
oco
up
le T
yp
e K
.
Mat
eria
l: s
tain
less
ste
el, w
ork
ing
tem
per
atu
re -
pre
ssu
re: u
p t
o
80
°C –
30
0 b
ar. B
ask
et d
imen
sio
ns:
dia
met
er 3
0 m
m a
nd
hei
ght
13
0 m
m (
inte
rnal
dim
ensi
on
s).
Mc:
Sw
agel
ok
; ty
pe:
1/8
"; m
ater
ial:
sta
inle
ss s
teel
; wo
rkin
g p
ress
ure
: up
to
85
00
psi
g
Mc:
Res
earc
h C
on
tro
l Val
ves
; mo
del
: RC
20
0. I
ncl
ud
ing
the
elec
tric
ac
tuat
ors
.
Th
is b
ath
was
av
aila
ble
in
th
e la
b. M
c: L
aud
a; m
od
el: e
co-l
ine
RE
1
04
. Op
erat
ing
tem
per
atu
re r
ange
: -1
0 t
o 1
20
°C
Mat
eria
l: s
tain
less
ste
el, w
ork
ing
tem
per
atu
re -
pre
ssu
re: u
p t
o
80
°C –
10
0 b
ar.
Th
erm
oco
up
le T
yp
e K
.
Mc:
Sw
agel
ok
; ty
pe:
on
e 3
-way
val
ve
/ o
n-o
ff; m
ater
ial:
sta
inle
ss
stee
l; p
ress
ure
-tem
per
atu
re r
atin
g: u
p t
o 1
72
bar
at
93
°C.
Re
qu
ire
me
nts
Th
e p
ress
ure
is
mo
nit
ore
d a
nd
rec
ord
ed d
uri
ng
the
enti
re e
xtra
ctio
n
pro
cess
.
Mo
nit
ors
th
e te
mp
erat
ure
insi
de
the
extr
acto
r. T
emp
erat
ure
: ro
om
te
mp
erat
ure
up
to
80
°C.
Th
is p
iece
mu
st w
ork
un
til 3
00
bar
an
d 8
0°C
. It
sho
uld
be
po
ssib
le t
o
mea
sure
in
tern
ally
its
tem
per
atu
re a
nd
pre
ssu
re. T
he
mat
eria
l to
ex
trac
t (e
.g. c
ork
sam
ple
s) s
ho
uld
be
easi
ly c
har
ged
.
In t
his
sec
tio
n, t
he
max
imu
m w
ork
ing
pre
ssu
re c
an r
each
30
0 b
ar,
wh
ile
the
max
imu
m t
emp
erat
ure
can
be
80
°C.
Th
is v
alv
e h
as a
n a
uto
mat
ic c
on
tro
l to
op
en o
r cl
ose
in
way
to
kee
p
con
stan
t th
e p
ress
ure
in
sid
e th
e ex
trac
tor.
Als
o, t
his
val
ve
has
a C
v t
hat
al
low
s a
larg
e p
ress
ure
dro
p.
To
kee
p c
on
stan
t th
e te
mp
erat
ure
in
sid
e th
e se
par
ato
r.
Th
is p
iece
sh
ou
ld w
ork
at
pre
ssu
res
up
to
10
0 b
ar; i
t sh
ou
ld b
e p
oss
ible
to
mea
sure
th
e te
mp
erat
ure
an
d p
ress
ure
in
sid
e it
; als
o, t
he
sep
arat
or
is e
qu
ipp
ed w
ith
a ja
cket
to
kee
p c
on
stan
t th
e te
mp
erat
ure
.
Mo
nit
ors
th
e te
mp
erat
ure
insi
de
the
extr
acto
r.
Th
rou
gh
th
ese
val
ves
, it
is p
oss
ible
to
su
pp
ly t
he
sep
arat
or
or
to
pu
rge
syst
em. T
he
val
ves
sh
ou
ld w
ork
up
to
10
0 b
ar.
Eq
uip
me
nt
Pre
ssu
re t
ran
sdu
cer
Th
erm
oco
up
le
Ext
ract
or
Tu
be
Bac
k P
ress
ure
R
egu
lato
r (B
PR
)
Bat
h
Sep
arat
or
Th
erm
oco
up
le
Val
ves
Se
ctio
n
Ext
ract
ion
Sep
arat
ion
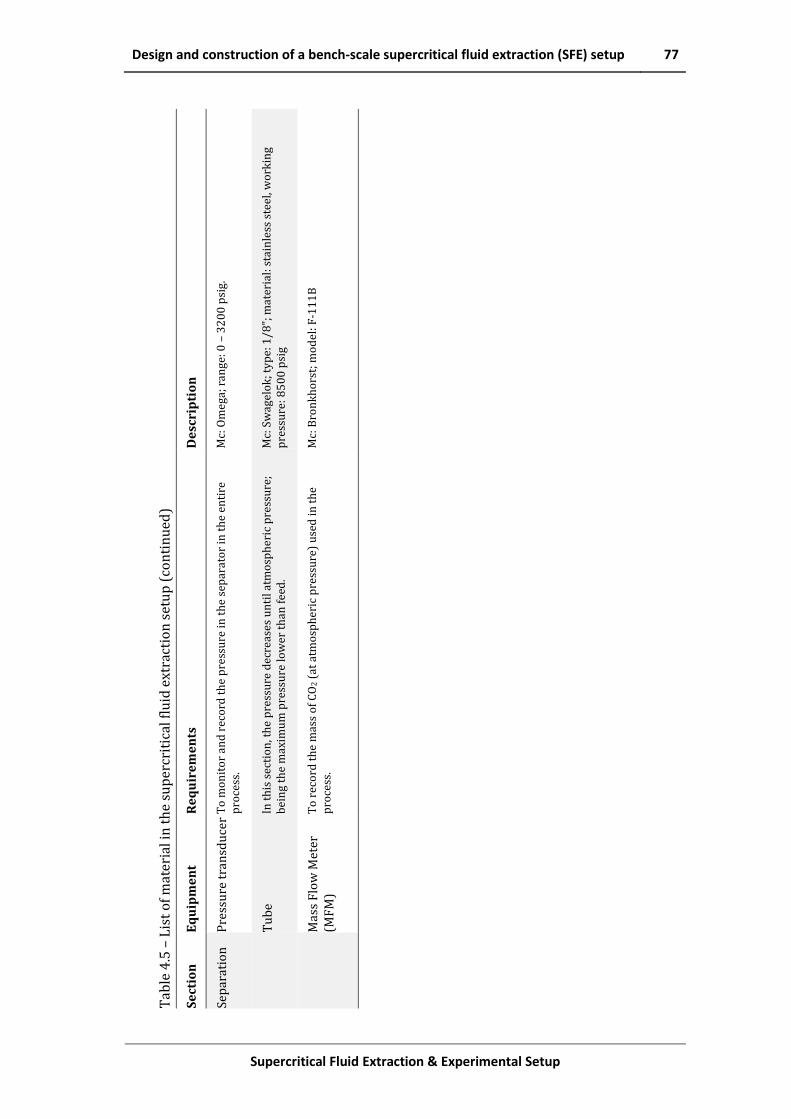
Design and construction of a bench-scale supercritical fluid extraction (SFE) setup 77
Supercritical Fluid Extraction & Experimental Setup
Tab
le 4
.5 –
Lis
t o
f m
ater
ial i
n t
he
sup
ercr
itic
al f
luid
ext
ract
ion
set
up
(co
nti
nu
ed)
De
scri
pti
on
Mc:
Om
ega;
ran
ge: 0
– 3
20
0 p
sig.
Mc:
Sw
agel
ok
; ty
pe:
1/8
"; m
ater
ial:
sta
inle
ss s
teel
, wo
rkin
g p
ress
ure
: 85
00
psi
g
Mc:
Bro
nk
ho
rst;
mo
del
: F-1
11
B
Re
qu
ire
me
nts
To
mo
nit
or
and
rec
ord
th
e p
ress
ure
in
th
e se
par
ato
r in
th
e en
tire
p
roce
ss.
In t
his
sec
tio
n, t
he
pre
ssu
re d
ecre
ases
un
til a
tmo
sph
eric
pre
ssu
re;
bei
ng
the
max
imu
m p
ress
ure
low
er t
han
fee
d.
To
rec
ord
th
e m
ass
of
CO
2 (
at a
tmo
sph
eric
pre
ssu
re)
use
d i
n t
he
pro
cess
.
Eq
uip
me
nt
Pre
ssu
re t
ran
sdu
cer
Tu
be
Mas
s F
low
Met
er
(MF
M)
Se
ctio
n
Sep
arat
ion
78 Design and construction of a bench-scale supercritical fluid extraction (SFE) setup
Supercritical fluid extraction and fractionation of bioactive natural products from cork
4.2.5 Program – SFE
As previously referred, to keep constant the pressure, the BPR is open/closed;
also the temperature and pressure through the entire process should be
monitored and recorded using a program developed in Labview, being the
drivers of the data acquisition module (ADAM 4000 Series) developed for this
particular application by Paralab, and all the program/interface was adapted by
the author.
Figure 4.14 shows the computer display, in real time, of the pressure and
temperature in the extractor and separator, the CO2 flow rate at each instant of
time as well as its cumulative value. The pressure in the BPR is controlled
according to the defined pressure set-point. In this same window, there is also a
region denominated “Heating Zone” where the set-point temperature in the BPR
and the two needle valves (after the separator) are defined. It is to remark that
this window presents the instantaneous operating conditions, while the process
window (Figure 4.15) shows the temperature and pressure histories, i.e., the
temperature and pressure of the extraction and separator since the starting
time; and also the total mass of CO2 that was used. Moreover, it is possible to
register the cork sample type, its mass and some other observations concerning
each extraction experiment. The program allows to record all pressures and
temperatures at the time intervals defined by the user.
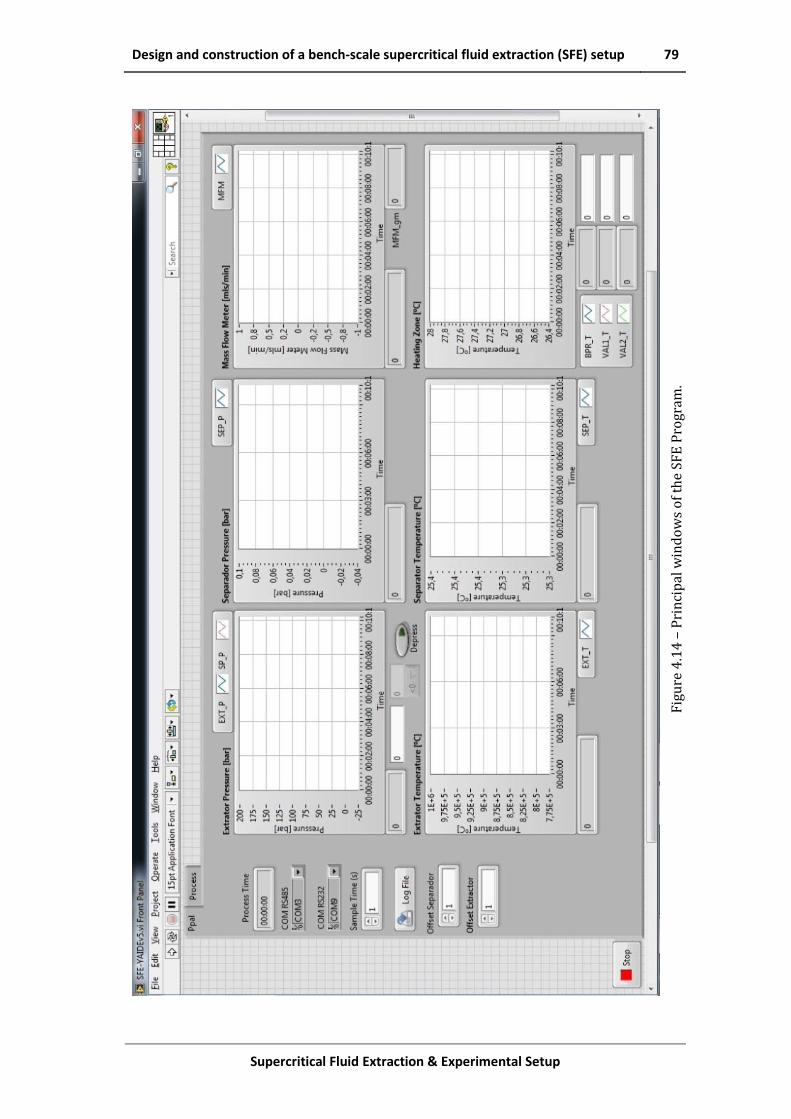
Design and construction of a bench-scale supercritical fluid extraction (SFE) setup 79
Supercritical Fluid Extraction & Experimental Setup
Fig
ure
4.1
4 –
Pri
nci
pal
win
do
ws
of
the
SFE
Pro
gram
.

80 Design and construction of a bench-scale supercritical fluid extraction (SFE) setup
Supercritical fluid extraction and fractionation of bioactive natural products from cork
Fig
ure
4.1
5 –
Pro
cess
win
do
ws
of
the
SFE
Pro
gram

Startup, operation and shutdown of the SFE bench scale setup 81
Supercritical Fluid Extraction & Experimental Setup
4.3 Startup, operation and shutdown of the SFE bench scale setup
After the design and assembling of the setup, the next phase was to test it, which
was essential in order to check for leaks and some other problems that can
arise. At the end of the tests, it was possible to perform the first experiment; in
this section a typical startup, running and shutdown is described for a simple
experiment on the bench scale setup in batch or dynamic operations.
4.3.1 Start-up of SFE setup
First, for both batch and dynamic operations, the raw material (granulated or
cork powder) should be weighed and placed inside the sample basket, and this
inside the extractor and the extractor closed; all connections must be checked
and the valves until the exit of the extractor as well as all purge valves must be
in closed position. Next, turn on the control box, and run the program “SFE” that
was developed by the author in Labview (as previously described); it is to refer
that before running, both the communication ports of the RS485 (acquisition
module ADAM 4000 Series) and the RS232 (MFM) interfaces should be
indicated; when the program is running, it is possible to monitor all the
variables of the process; to start the recording, the user must press the button
“Log File” in the tab named “Ppal” of the program user interface as shown in
Figure 4.14; after pressing that button, it must be indicated in the new window
the name and localization of the new file (to record all data in the run); it is to
refer that the interval of time to record each variable was previously defined in
“Sample Time (s)”, the default value being one second. In tab “Process” of the
program, can be registered the type of sample and mass of cork used as well as
other observations; remember that to save this information it is necessary to
press the button “OK” in this new window. It is noteworthy that through this
program, it is possible to define a set point value to the pressure, in the BPR,
that is directly related with the pressure in the extractor, as well as the
temperature in the valves with heating tapes.
Then, turn on the cooling baths defining a set-point to each one; after the
cooling bath that cools the pump head reaches the value of its set-point, the CO2

82 Startup, operation and shutdown of the SFE bench scale setup
Supercritical fluid extraction and fractionation of bioactive natural products from cork
cylinder is opened, and all the valves from the cylinder exit until the inlet of the
extractor must be opened (keep closed the purge valves); switch on the CO2
pump (note that the valve at the exit of the extractor should be closed until
reaching the pressure for the extraction). Then, switch off the pump and close
all valves and: (i) verify that there are not leaks in the system, i.e. no pressure
drop is observed in the extractor and (ii) wait for the system to stabilize at the
temperature and pressure required to the extractions. Until now, the procedure
is similar to both modes of operation, batch and continuous/dynamic.
4.3.2 Operation of the SFE setup
To operate in batch mode, the system remains closed, since the extraction time
is one of the main parameters of the extraction; then, the solvent inside is not
refreshed being the total mass of CO2 defined by the volume occupied at the
previously fixed pressure and temperature. For this operating mode, and in
order to evaluate the transfer of solute to the solvent, the extraction time can be
changed and also the temperature and/or pressure of the process.
For the dynamic operation, after the stabilization period, the pressure set-point
on the BPR must be fixed, and the pump switched-on, fixing the CO2 flow rate for
the experiment; the valves will be opened, including the exit-valve of the
extractor, and the valves of the separation section. It is to note that it is possible
to monitor and record all operating conditions (pressure and temperature) in
the extraction and separation sections at each time through the program “SFE”,
according to the previous definition by the user.
The pressure set-point of the BPR and the temperature set-point for each valve
in the denominated “heating zone” (as defined in the previous section) can be
fixed in the program “SFE”; however, it must be remembered that although it is
possible to monitor the temperature in the recirculating baths, the change of
their set-points should be directly done in the respective bath; the same is true
for the temperature in the oven, where the extractor is located; the CO2 flow
rate can only be changed directly in the pump. The program helps to visualize
all the operating conditions in a simple window, but you have to remember that
Startup, operation and shutdown of the SFE bench scale setup 83
Supercritical Fluid Extraction & Experimental Setup
in this particular case, it is not possible to perform an experiment by remote
control, since we have no control of the CO2 pump, neither of the open/close for
all valves. Summarizing for this particular case, the program “SFE” monitors and
records all variables of the experiment, but to operate this setup at bench-scale
it is fundamental to stay in the laboratory, and remember that when working at
high pressure it is necessary to focus the attention on the experiment. For
example, if you perform an experiment at 40°C and 120 bar (CO2 density of
717.8 3mkg
), with an extractor of ca. 200 3
cm , and a flow rate of 6 1ming
of CO2, if suddenly the exit of the extractor is closed, maintaining the same rate
of flow, in 5 min the pressure inside the extractor can reach ca. 234 bar (at the
same temperature); then it is crucial to know what happens at any time, since in
short time we can have large variations in the operating variables.
4.3.3 Shutdown of the SFE
To finish, switch–off the CO2 pump and close the CO2 cylinder as well as the
valve at the exit pump, and remember to change the pressure set-point of the
BPR. Also, you can switch-off the cooling bath used for the pump head. When the
system reaches the atmospheric pressure, stop the acquisition in the program
“SFE”. And also turn off the oven and the thermostatic bath used to cool the
jacket of the separator.
To collect the cork extractives, it is necessary to pass a solvent to remove all
extracts in the separator and even any that remains in the BPR, since this
extract is solid at atmospheric conditions; at the exit of the extractor it will be
made a connection to the co-solvent pump to remove all the extract in the
system. It is to note that the separator has an on/off valve at the bottom and the
solvent passes from the exit of the extractor to the separator, the extract being
collected in solution at the bottom of the separator. After this step, the solvent
used to collect the cork extractives must be removed; it can be used a rotary
evaporator as described previously in Chapter 3.
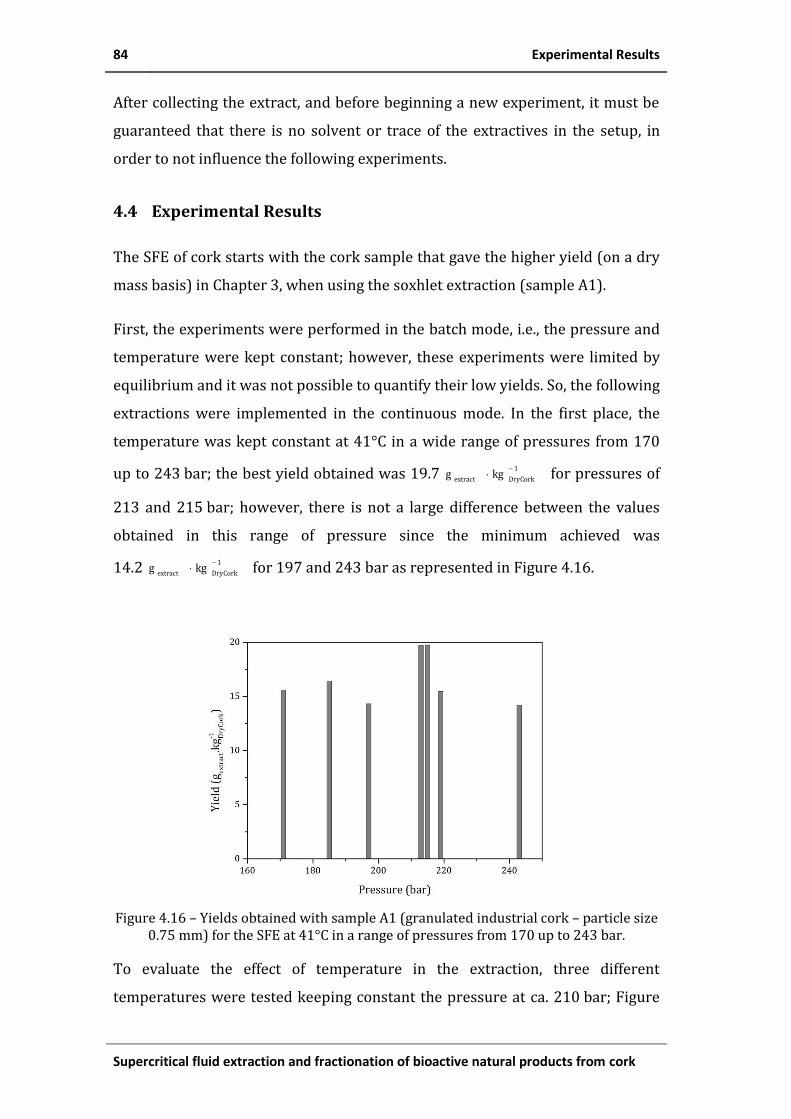
84 Experimental Results
Supercritical fluid extraction and fractionation of bioactive natural products from cork
After collecting the extract, and before beginning a new experiment, it must be
guaranteed that there is no solvent or trace of the extractives in the setup, in
order to not influence the following experiments.
4.4 Experimental Results
The SFE of cork starts with the cork sample that gave the higher yield (on a dry
mass basis) in Chapter 3, when using the soxhlet extraction (sample A1).
First, the experiments were performed in the batch mode, i.e., the pressure and
temperature were kept constant; however, these experiments were limited by
equilibrium and it was not possible to quantify their low yields. So, the following
extractions were implemented in the continuous mode. In the first place, the
temperature was kept constant at 41°C in a wide range of pressures from 170
up to 243 bar; the best yield obtained was 19.7 1
DryCorkextractkgg
for pressures of
213 and 215 bar; however, there is not a large difference between the values
obtained in this range of pressure since the minimum achieved was
14.2 1
DryCorkextractkgg
for 197 and 243 bar as represented in Figure 4.16.
Figure 4.16 – Yields obtained with sample A1 (granulated industrial cork – particle size
0.75 mm) for the SFE at 41°C in a range of pressures from 170 up to 243 bar.
To evaluate the effect of temperature in the extraction, three different
temperatures were tested keeping constant the pressure at ca. 210 bar; Figure

Conventional extraction vs. SFE 85
Supercritical Fluid Extraction & Experimental Setup
4.17 shows that the best result was obtained at 41°C (19.7 1
DryCorkextractkgg
),
while the minimum was 12.2 1
DryCorkextractkgg
at 59°C.
Figure 4.17 – Yields obtained with sample A1 (granulated industrial cork – particle size
0.75 mm) for the SFE at 41, 59 and 78°C and ca. 210 bar.
4.5 Conventional extraction vs. SFE
Comparing the results obtained for the conventional soxhlet extraction (sample
A1), with acetone the yield was 84.3 1
DryCorkextractkgg
(Chapter 3), that is ca. 4.3
times higher than the maximum of the SFE using CO2 without co-solvent; and for
the lowest polar solvent, hexane, the yield was 48.5 1
DryCorkextractkgg
which is
only 2.5 times higher when compared with the result for the CO2 at supercritical
conditions as shown in Figure 4.18

86 Conventional extraction vs. SFE
Supercritical fluid extraction and fractionation of bioactive natural products from cork
Figure 4.18 – Yields of the conventional solvent extraction vs. SFE (41, 59 and 78°C at
~210 bar). For granulated industrial cork with particle size 0.75 mm (sample A1)
Although the yields obtained for the SFE were lower than for the conventional
extraction, SFE has a large advantage, since the granulated and cork powder
extracted are not contaminated with organic solvent. A quantitative analysis of
the compositions of the extracts showed an increase of the target compound
when the polarity of the solvent used decreases, i.e. although the yield is lower
for hexane, its extract has a higher content of betulin and betulinic acid, being
up to 1.5 times higher. It is also to refer that the betulinic acid content of the
soxhlet extracts is, in average, 4.8 times higher than that of betulin; the results
of the SFE reveals a similar content of betulin and betulinic acid in the extract.
Figure 4.19 depicts that the contents of betulin and betulinic acid in the extract
are ca. 2.1 and 8.7 times lower than those achieved with the conventional
extraction, respectively.

SFE setup improvement to add co-solvent 87
Supercritical Fluid Extraction & Experimental Setup
Figure 4.19 – Betulin and betulinic acid (BA) contents in the different extracts, soxhlet
extraction (acetone, dichloromethane and hexane) and SFE.
4.6 SFE setup improvement to add co-solvent
The experimental setup previously described was prepared to use only one
solvent, the CO2; however, in order to increase the yields and also the range of
components extracted, it was required to add a new solvent to increase the
polarity of the mixture and to increase the separation of the cork extractives
compounds. Then, the experimental setup was adapted to add a co-solvent to
the CO2. Figure 4.20 shows the new layout of the setup: there is a new pump,
that increases the pressure of the new solvent to mix with the CO2.
Figure 4.20 – Flowsheet of SFE setup with co-solvent.
It should be noted that this new layout involves some adaptations of the original
setup, as the above referred new pump to the co-solvent, an on-off valve for the
CO2
Cooling Bath Pump
F
MFM
Oven
T PTP
up to 60 bar
up to 300 bar up to 70 bar
T
Ru
ptu
re D
isc
BPRatm
Feedstock Extraction Separation
atm
purge
Co-solvent Pump
co-solvent reservoir
Check valve
Ch
eck
val
ve

88 SFE setup improvement to add co-solvent
Supercritical fluid extraction and fractionation of bioactive natural products from cork
new stream, and a check valve for the co-solvent. Figure 4.21 shows the new 3D
drawing.
Legend:
A – co-solvent pump
B – Check valve
Figure 4.21 – Schematic 3D drawing of the SFE setup using co-solvent.
In which concerns to the list of material, this adaptation modified both the feed
and extraction zones: in the feed zone a new pump is included, the co-solvent-
pump, to increase the pressure of the co-solvent until matching with the CO2
pressure; this pump was an isocratic pump, brand: Jasco, model PU-4180;
concerning the extraction zone, a new check valve was added, brand: Swagelok,
type Poppet 6000 psig (413 barg) check valve; material: stainless steel; this
valve ensures there is no flow returning to the pump head.
In this new configuration, it is to take into account that the new solvent (co-
solvent) must remain in the separator, i.e., it is not released to the environment
as the CO2; therefore, it is important to know the total volume of co-solvent to
be used and redefine the new operating conditions for the separation section.
Also, with this new configuration it is possible to perform samples collection
during the extraction time, since the extract remains in the co-solvent.
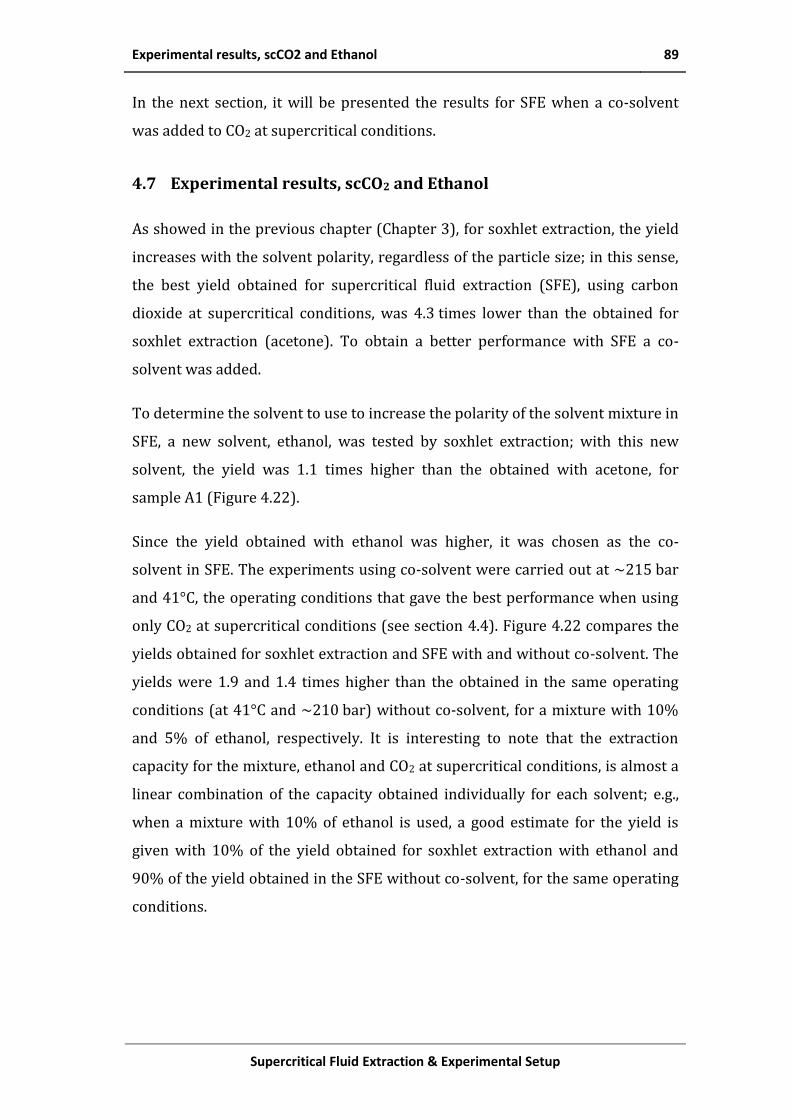
Experimental results, scCO2 and Ethanol 89
Supercritical Fluid Extraction & Experimental Setup
In the next section, it will be presented the results for SFE when a co-solvent
was added to CO2 at supercritical conditions.
4.7 Experimental results, scCO2 and Ethanol
As showed in the previous chapter (Chapter 3), for soxhlet extraction, the yield
increases with the solvent polarity, regardless of the particle size; in this sense,
the best yield obtained for supercritical fluid extraction (SFE), using carbon
dioxide at supercritical conditions, was 4.3 times lower than the obtained for
soxhlet extraction (acetone). To obtain a better performance with SFE a co-
solvent was added.
To determine the solvent to use to increase the polarity of the solvent mixture in
SFE, a new solvent, ethanol, was tested by soxhlet extraction; with this new
solvent, the yield was 1.1 times higher than the obtained with acetone, for
sample A1 (Figure 4.22).
Since the yield obtained with ethanol was higher, it was chosen as the co-
solvent in SFE. The experiments using co-solvent were carried out at ~215 bar
and 41°C, the operating conditions that gave the best performance when using
only CO2 at supercritical conditions (see section 4.4). Figure 4.22 compares the
yields obtained for soxhlet extraction and SFE with and without co-solvent. The
yields were 1.9 and 1.4 times higher than the obtained in the same operating
conditions (at 41°C and ~210 bar) without co-solvent, for a mixture with 10%
and 5% of ethanol, respectively. It is interesting to note that the extraction
capacity for the mixture, ethanol and CO2 at supercritical conditions, is almost a
linear combination of the capacity obtained individually for each solvent; e.g.,
when a mixture with 10% of ethanol is used, a good estimate for the yield is
given with 10% of the yield obtained for soxhlet extraction with ethanol and
90% of the yield obtained in the SFE without co-solvent, for the same operating
conditions.

90 Experimental results, scCO2 and Ethanol
Supercritical fluid extraction and fractionation of bioactive natural products from cork
Figure 4.22 – Yields of the conventional solvent extraction vs. SFE at 41°C and ~185 bar
and ~210 bar with different concentrations of ethanol (10%, 5% and 0%). For granulated industrial cork with particle size 0.75 mm (sample A1).
Despite the addition of co-solvent increases the yields obtained as shown in
Figure 4.22, it is to highlight that in the supercritical fluid extraction without co-
solvent, both the cork and the extracts are obtained in a solvent-free condition.
With respect to the composition of the extract, when the polarity of the SFE
mixture increases, the capacity of the extraction for the target compound also
increases. Figure 4.23 a) presents the contents of betulin and betulinic acid in
the extract (sample A1), for the soxhlet extraction and SFE; when a 5% of
ethanol was used in the SFE, the results indicate that the target components in
the extract are comparable with the best results obtained in the soxhlet
extraction; and the contents of betulin and betulinic acid in the extract were
12.3 and 3.4 times higher than obtained without co-solvent, respectively.

Experimental results, scCO2 and Ethanol 91
Supercritical Fluid Extraction & Experimental Setup
a)
b) Figure 4.23 – Contents of betulin and betulinic acid (BA): a) in the extracts and b) in the
cork. For granulated industrial cork with particle size 0.75 mm (sample A1). For the conventional solvent extraction and SFE at 41°C and ~210 bar with different
concentrations of ethanol (0, 5 and 10%).

Supercritical fluid extraction and fractionation of bioactive natural products from cork
Notation
jia
, constants of Eq. 4.1, Eq. 4.2 and Eq. 4.3 (Value Table 4.2)
𝑀𝑊 molecular weight 1molg
cp critical pressure MPa
melp melting pressure MPa
tp triple point pressure MPa
subp sublimation pressure MPa
vapp vapour pressure MPa
c critical density 3
mkg
2CO
carbon dioxide density 3mkg
T temperature K
cT critical temperature K
vap,it constants of Eq. 4.3 (Value Table 4.2)
cZ compressibility factor
List of Acronyms
BPR Back Pressure Regulator
CO2 Carbon Dioxide
FDA U.S. Food and Drug Administration
GRAS Generally Recognized As Safe
MFM Mass flow meter
SFE Supercritical Fluid Extraction
TCA 2,4,6-trichloroanisole

Supercritical fluid extraction and fractionation of bioactive natural products from cork
References
Azevedo, E. G. de, and Alves, A. M. de F. B. (2009). “Engenharia de processos de separação.” Ensino da Ciência e da Tecnologia 27 (1.a ed). Lisboa: IST Press. Retrieved from http://eos.fe.up.pt:1801/webclient/DeliveryManager?custom_att_2=simple_viewer&metadata_request=false&pid=50939
Coulson, J. M., Richardson, J. F., Harker, J. H., and Backhurst, J. R. (2002). “Chemical engineering.” Coulson & Richardson’s Chemical Engineering (5th ed, Vol. 2). Oxford: Butterworth Heinemann.
Francis, F. J. (1999). “Wiley Encyclopedia of Food Science and Technology (2nd Edition) Volumes 1-4.” John Wiley & Sons. Retrieved from http://www.knovel.com/web/portal/browse/display?_EXT_KNOVEL_DISPLAY_bookid=681
Green, D. W., and Perry, R. H. (2008). “Perry’s Chemical Engineerrs’ HandBook” (8th ed). McGraw Hill. doi:10.1036/0071422943
Lozowski, D. (2010). “Supercritical CO2: A Green Solvent.” Chemical Engineering, 117(2), 15–18.
Modey, W. K., Mulholland, D. A., and Raynor, M. W. (1996). “Analytical Supercritical Fluid Extraction of Natural Products.” Phytochemical Analysis, 7, 1–15. doi:10.1002/(SICI)1099-1565(199601)7:1<1::AID-PCA275>3.0.CO;2-U
NATEX. (2011). “New Application.”
Noyes, R. (1994). “Unit Operations in Environmental Engineering.” William Andrew Publishing/Noyes. Retrieved from http://www.knovel.com/web/portal/browse/display?_EXT_KNOVEL_DISPLAY_bookid=1292
Seader, J. D., and Henley, E. J. (2006). “Separation process principles” (2nd ed.). New York: John Wiley.
Span, R., and Wagner, W. (1994). “A New Equation of State for Carbon Dioxide Covering the Fluid Region from the Triple-Point Temperature to 1100 K at Pressures up to 800 MPa.” J. Phys. Chem. Ref. Data, 25(6), 1509–1596. doi:10.1063/1.555991


Supercritical fluid extraction and fractionation of bioactive natural products from cork
Modelling Extraction Process 5In order to predict the experimental results, phenomenological models of the
extraction of bioactives from cork will be developed, and applied to both soxhlet
and supercritical fluid extractions. In the extraction from a solid, mass transfer
takes place when a solute is removed from the solid matrix by the fluid phase,
i.e., the solvent. The physical characteristics of the particles and their bonds
with the solute as well as the changes of the process variables have direct
influence on the extraction.
There are several models to describe the extraction process, Figure 5.1
summarizes the main considerations to define a specific model wherein each
assumption determines where and when can it be applied (Cocero et al., 2001a,
2001b; de Melo et al., 2014; Esquível et al., 1999; Martinez et al., 2003; Naik et
al., 1989; Oliveira et al., 2011; Tan et al., 1989). The equilibrium, for example, is
a function of temperature and pressure as well as of the composition of the
solute in the solid matrix and the saturation concentration in the solvent; it is
important to know the particles configurations, since their sizes, geometries and
surface area will have direct influence on mass transfer; moreover, the velocity
profile of the solvent in the packed-bed determines the mass transfer process.
Also, the diffusivity and solubility have influence in the process.
"The cork industry is truly unique for its sustainability." (WWF)

96 Modelling Extraction Process
Supercritical fluid extraction and fractionation of bioactive natural products from cork
Figure 5.1 – Considerations to describe a model for extraction processes
(e.g., supercritical fluid extraction).
As previously referred, each group of assumptions defines an extraction model,
so there are several classifications; e.g. (Cocero et al., 2001a, 2001b) defined
two basic models, (i) desorption models; assuming that the solute is removed by
a desorption process, they developed a model with two parameters to describe
the process (equilibrium and mass transfer coefficients), (ii) shortcut methods;
these methods consider that the extraction curve can be simulated by the
residence time distribution (RTD), i.e. the process is described by the flow
pattern. On the other hand, de Melo et al. (2014) consider two main classes of
models, (i) empirical and simplified models; and (ii) comprehensive
phenomenological models (shrinking core, broken plus intact cells and a
combination of both).
In this chapter, two phenomenological models are described, a diffusional
model and a shrinking core model with the aim to describe the experimental
results.
The contact system will be considered to be a fixed bed for both soxhlet and
supercritical fluid extractions. The soxhlet case deserves a special explanation.
As a matter of fact, it is in reality an extraction process constituted by several
successive batch steps. Nonetheless, it is well known that batch and plug flow

Desorption Model 97
Modelling Extraction Process
systems can be considered equivalent if the operating time of the batch system
is equal to the space time (mean residence time) of the plug flow system. In the
operation of the soxhlet, the solvent is vaporized and condenses around the
particles operating then the extraction; when the system is full of liquid, it is
emptied and the solvent (now with the extracted matter) is returned to the
boiler to be vaporized. And this process is repeated as many times as wanted,
always with “fresh” (recently vaporized) solvent, fixing the total extraction time.
In the models to be developed in the following, the time from the beginning of
each extraction step (start of the filling up with solvent) until the end of the
same step (emptying of the extraction system), which is the operating time of
each batch, is taken as the space time of the fixed bed system which is modelled.
5.1 Desorption Model
In this model, it is proposed that the solute is removed from a solid matrix in a
packed-bed through a desorption process; the main assumptions which refer to
the fluid phase are:
The flow rate, density and viscosity of the solvent are kept constant
through the process.
There is no gradient of temperature in the bed or it can be neglected.
Density and porosity of bed are constant.
Solute in the matrix is completely soluble in the fluid phase, i.e. in the
solvent.
The mass balance for the fluid phase is given by:
i
Rpspf
i
i
iiCCak
z
Cu
z
CD
t
C
*
2
2
ax
1
Eq. 5.1
Where, i
C is the concentration of solute in the fluid phase, Rp
sC
* is the surface
equilibrium concentration, t corresponds to the time of extraction, z is the
length in the axial direction, p
R is the radius of particle, ax
D is the axial
dispersion coefficient, i
u is the interstitial velocity, f
k is the mass transfer

98 Desorption Model
Supercritical fluid extraction and fractionation of bioactive natural products from cork
coefficient, p
a is the particle specific surface area (area/volume) and is the
porosity or void fraction of the packed-bed. To solve Eq. 5.1 it is necessary to
know the initial and boundary conditions. The initial condition is given by,
0t ; zCi
0 Eq. 5.2
While the boundary conditions, the conditions at the inlet and outlet of bed are
given by,
0z ;
0,feed,
0
ziii
z
i
axCCu
dz
dCD
Lz ; 0
Lz
i
dz
dC
Eq. 5.3
Where L is the length of the bed.
Introducing the following dimensionless variables and time constants:
t ;
L
zZ ;
pR
r
*
0s
i
i
C
Cx ;
*
0
*
,*
s
is
s
C
Cx ;
1
0
*
0 ssCC
iu
L ;
1
1
pf
f
ak;
h
p
d
D
R2
Eq. 5.4
With the following model parameters,
f
fN
;
d
dN
;
d
f
m
N
NBi ;
axD
LuPe
i Eq. 5.5
Eq. 5.1 becomes in dimensionless form:
isf
iiixxN
Z
x
Z
x
Pe
x
1
*
2
21
Eq. 5.6

Desorption Model 99
Modelling Extraction Process
With the initial condition,
Zxi
00; Eq. 5.7
And the following boundary conditions,
0Z ;
0,feed,
0
1
Zii
Z
ixx
dZ
dx
Pe
1Z ; 0
1
Z
i
dZ
dx
Eq. 5.8
In this chapter, two considerations were assumed with respect to the material
balance to the solid phase; first, it was considered a “diffusional model”, in
which the solute is uniformly distributed throughout the matrix and it diffuses
through the particle until its surface being then transferred to the fluid phase.
The second model studied was the “shrinking core model”, in which it is
considered that the solute is removed by layers and it is only in a portion of the
matrix (core).
Taking into account the results of chapter 3 and the respective interpretation, it
will be considered that only an outer layer of each particle will be extracted.
This layer, as shown before depends on the particle size and on the solvent.
5.1.1 Diffusional model
Considering spherical particles, the mass balance for the solid is given by the Eq.
5.9,
r
Cr
rr
D
dt
dCishis ,2
2
, Eq. 5.9
Where, is
C,
is the concentration of solute in the particle, t corresponds to the
time of extraction, r is the radial position, p
R is the radius of particle, h
D is the
effective diffusivity. The initial condition to solve Eq. 5.9 is given by,
rzCCtsis
&;00,,
Eq. 5.10

100 Desorption Model
Supercritical fluid extraction and fractionation of bioactive natural products from cork
With the following boundary conditions,
crr ; 0
0
,
r
is
r
C
pRr ;
iRp
isf
Rr
is
hCCk
r
CD
p
*
,
,
Eq. 5.11
Introducing dimensionless variables, Eq. 5.9 becomes,
isdisxN
d
dx,2
2
,
Eq. 5.12
With the initial condition,
0 ; 1,
isx Eq. 5.13
And the boundary conditions,
0
0
,
is
c
xr
is
d
fixx
N
Nx
1
1
31
Eq. 5.14
In order to evaluate the effects of the dimensionless parameters on the process
behaviour, the Péclet number was changed;d
N and f
N were also varied; these
two last parameters represent the numbers of mass transfer units by diffusion
inside the particles and in the film surrounding particles, respectively. Table 5.1
shows the minimum and maximum of those numbers used in the simulation
runs. In the following simulations, the particles are assumed to be totally
extracted, i.e., rc = c = 0.

Desorption Model 101
Modelling Extraction Process
Table 5.1 – Dimensionless numbers Minimum Maximum
Péclet (Pe) 0.01 1000
Nd 0.01 10
Nf 0.01 10
Assuming that the solute is uniformly distributed throughout the particle and
that it is totally removed, Figure 5.2 shows for several Péclet numbers (Pe),
using the diffusional model, the histories of the cumulative amount of solute in
the fluid phase (at the exit of the packed-bed). This Figure represents the effects
of different Pe when the other parameters are unchanged; in this particular
case, Bim was kept as 1, i.e. the diffusion in the particle and in the film
surrounding particles have the same influence in the extraction process.

102 Desorption Model
Supercritical fluid extraction and fractionation of bioactive natural products from cork
a)
b)
c) Figure 5.2 – Histories of amount of solute in the fluid phase at the outlet of the packed-
bed for different Péclet number values (0.01 to 1000) and Bim = 1. (a) Nf = Nd = 0.1; (b) Nf = Nd = 1; (c) Nf = Nd = 10

Desorption Model 103
Modelling Extraction Process
Figure 5.2 reports the results obtained for different (18) runs; when Péclet
increases, the transfer rate of solute from the solid to the fluid phase increases
for all runs; despite Biot is kept constant and equal to 1, the transfer of solute
takes a longer time when Nd and Nf are lower (Figure 5.2a). Also, Figure 5.2
shows that it is not noticeable a difference in the transfer of solute to fluid phase
when Pe is higher than 100; Figure 5.3 shows the influence of Nd and Nf, when
Pe was kept as 100 and the number of mass transfer units by diffusion, in the
particle, has no influence in the extraction process (Nd = 10), while the number
of mass transfer units in the film surrounding particles was changed from 0.01
until 10, i.e., the mass transfer coefficient (f
k ) decreases three orders of
magnitude; as expected, when Nf increases the transfer from the solid to the
fluid phase increases. When the dimensionless time is 5 and Nf is 10, it was
extracted the totality of the solute from the solid phase, while only 94%, 35%
and 4% were extracted when Nf is 1, 0.1 and 0.01, respectively.
Figure 5.3 – Histories of amount of solute in the fluid phase at the outlet of the packed-
bed. Nf = 0.01 to 10; Nd = 10 and Péclet number is 100.
If the effect of the film surrounding particles is negligible, it is possible to study
the effect of diffusion in the particle. Figure 5.4 shows the effect of Nd. For
Pe = 100, Nf = 10 and Nd = 10 or 1; when the dimensionless time is 5, the particle
was totally extracted while for Nd = 0.1 and 0.01 the amounts extracted are 96%
and 55%, respectively.
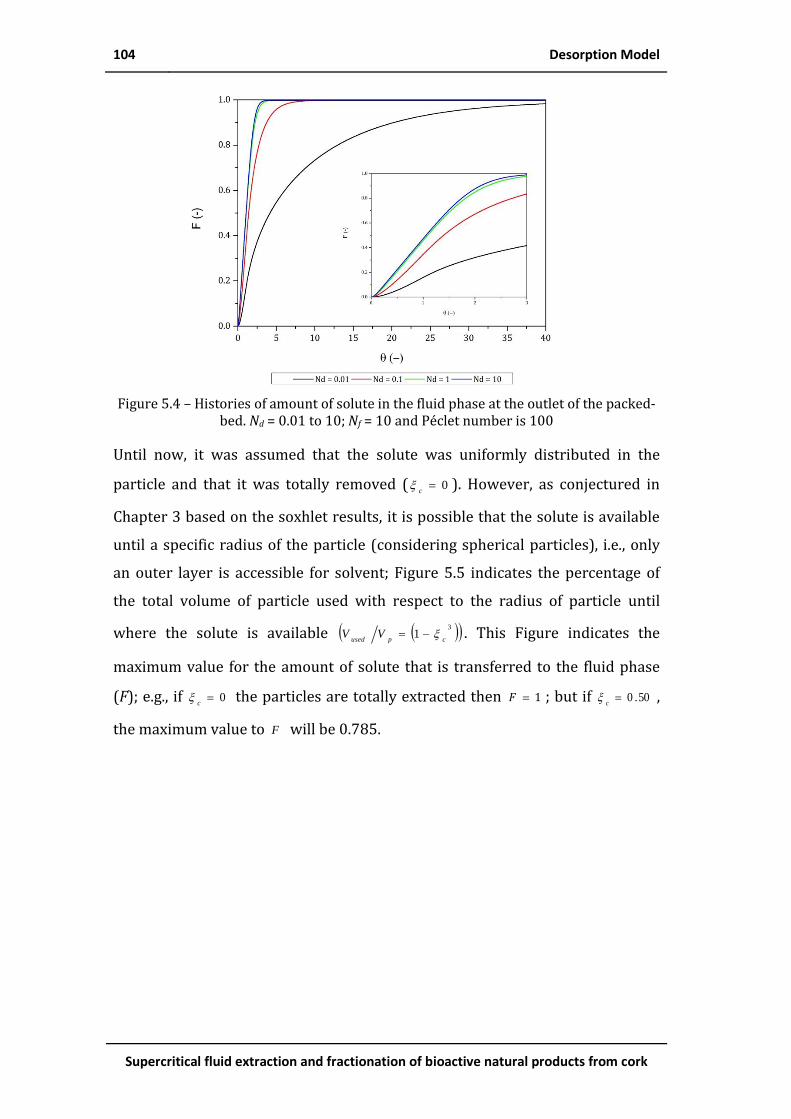
104 Desorption Model
Supercritical fluid extraction and fractionation of bioactive natural products from cork
Figure 5.4 – Histories of amount of solute in the fluid phase at the outlet of the packed-
bed. Nd = 0.01 to 10; Nf = 10 and Péclet number is 100
Until now, it was assumed that the solute was uniformly distributed in the
particle and that it was totally removed ( 0c
). However, as conjectured in
Chapter 3 based on the soxhlet results, it is possible that the solute is available
until a specific radius of the particle (considering spherical particles), i.e., only
an outer layer is accessible for solvent; Figure 5.5 indicates the percentage of
the total volume of particle used with respect to the radius of particle until
where the solute is available 3
1cpused
VV . This Figure indicates the
maximum value for the amount of solute that is transferred to the fluid phase
(F); e.g., if 0c
the particles are totally extracted then 1F ; but if 50.0c
,
the maximum value to F will be 0.785.

Desorption Model 105
Modelling Extraction Process
Figure 5.5 – Volume used according to internal radius
pccRr
In this section, the diffusional model was described, as well as the influence of
some parameters in the extraction process; in the following, the shrinking core
model will be considered.
5.1.2 Shrinking core model
In this case, spherical particles are also assumed; however, the solute is
removed by layers; since everything is happening in the “extraction front”, the
outer region is considered to be in steady state, i.e., there is no accumulation in
this region and the mass balance is given by
0,2
r
Cr
r
is
Eq. 5.15
The solute extracted from the core is transferred to the fluid phase; the core
radius changes over time as described by the following equation:
pR
s
s
hc
p
c
r
C
C
D
t
r
R
r
0,
2
Eq. 5.16

106 Desorption Model
Supercritical fluid extraction and fractionation of bioactive natural products from cork
The initial conditions for the previous equations are,
0t rzCCsis
&0,,
zRrpc
Eq. 5.17
While the boundary conditions are,
crr
pRr
zCCsis
0,,
i
Rpisf
Rr
is
hCCk
r
CD
p
*
,
, Eq. 5.18
The mass balance equations, after introducing dimensionless variables, become
02
sx
Eq. 5.19
And,
1
2
s
d
c
c
xN
Eq. 5.20
With the initial conditions
0
1,
isx
1c
Eq. 5.21
The boundary conditions are given by
1sc
x
1
1
,31
si
d
fisxx
N
Nx Eq. 5.22
Similarly to the previous analysis for the diffusional model, for the shrinking-
core model the influences of Péclet, Nd and Nf were studied. In this model, the

Desorption Model 107
Modelling Extraction Process
transfer of the solute occurs by layers and the core radius changes over time
until eventually reaching the centre of the particle. Figure 5.6 represents the
histories of the cumulative amount of solute in the fluid phase at the outlet of
the packed-bed; the effect of the Péclet number was evaluated, while Nd and Nf
were kept constant. As in the diffusional model, when Nd and Nf are lower, the
mass transfer decreases, despite the Pe number.

108 Desorption Model
Supercritical fluid extraction and fractionation of bioactive natural products from cork
a)
b)
c) Figure 5.6 – Histories of the amount of solute in the fluid phase at outlet of the packed-bed for several Péclet number values (0.01, 1 and 1000) and Bim = 1. (a) Nf = Nd = 0.1;
(b) Nf = Nd = 1; (c) Nf = Nd = 10

Desorption Model 109
Modelling Extraction Process
The effects of Nd and Nf showed in Figure 5.7 and Figure 5.8 were similar to the
obtained in the diffusional model (Figure 5.3 and Figure 5.4, respectively). It is
possible to note that for the same parameter, the transfer of the solute from the
solid to the fluid phase is higher in the shrinking core model. When the term of
diffusion inside the particle was considered negligible, i.e. Nd = 10, the particle
was fully extracted when the dimensionless time was 1.6, 2.5 and 11.6, for
Nf = 10, 1 and 0.1, respectively.
Figure 5.7 – Histories of amount of solute in fluid phase at the outlet of the packed-bed.
Nf = 0.01 to 10; Nd = 10 and Péclet number is 100.
When the film surrounding the particles is not the limiting step of the extraction
process, it is possible to study the effect of diffusion inside the particle. Figure
5.8 shows the effect of Nd, considering Pe = 100 and Nf = 10. When the
dimensionless time is 5, the particle was totally extracted for Nd = 0.1 until 1,
while for Nd = 0.01 the amount extracted was only 67%.

110 Desorption Model
Supercritical fluid extraction and fractionation of bioactive natural products from cork
Figure 5.8 – Histories of amount of solute in fluid phase at the outlet of the packed-bed.
Nd = 0.01 to 10; Nf = 10 and Péclet number is 100.
For both models, diffusional and shrinking core, Figure 5.9 compares the
particular case of negligible film resistance (Nd = 10) and with Péclet = 100; this
Figure shows that for the shrinking core model (dashed lines), the transfer is
faster than in the diffusional model (full lines); although the shrinking core
model assumed that the solute is removed by layers, it should be noted that it
was considered that in both models all the particles were fully extracted.
Figure 5.9 – Histories of amount of solute in fluid phase at the outlet of the packed-bed.
Nd = 0.01; 0.1 and 10; Nf = 10 and Péclet number is 100. Diffusional model is represented by solid lines and shrinking core model by dashes lines

Validation of models 111
Modelling Extraction Process
Figure 5.10 shows the effect of the film resistance around the particles for each
model, considering Nd = 10 and Pe = 100.
Figure 5.10 – Histories of amount of solute in fluid phase at the outlet of the packed-
bed. Nf = 0.01; 0.1 and 10; Nd = 10 and Péclet number is 100. Diffusional model is represented by solid lines and shrinking core model by dashed lines
In the following section, the models described previously will be compared with
the experimental data, for both soxhlet extraction and supercritical fluid
extraction (with or without ethanol as co-solvent).
5.2 Validation of models
In previous chapters (Chapter 3 and 4), the yields were represented as mass of
extract by mass of cork; but in chapter 3, section 3.3 (layer thickness of cork
accessible to extraction), it was found that when the particle size increases, for
the granulated industrial cork, only the external layer is accessible to the
solvent, i.e., it is not fully extracted according with the result obtained. As the
total volume of cork is not extracted it was essential to represent the yields in
terms of volume of cork used; Figure 5.11 shows the yields of the conventional
soxhlet extraction (mass extract by volume of dry cork). It was considered that
the cork powder was fully extracted and the yield obtained for powder
represents the maximum extraction capacity for each solvent. Also, it is possible
to note that when the particle size increases, only a layer was extracted;

112 Validation of models
Supercritical fluid extraction and fractionation of bioactive natural products from cork
however, for particles higher than ~1 mm, as a consequence of cork being a
liquid sealant, the layer is almost constant regardless of particle size, and it only
depends on the type of solvent.
Figure 5.11 – Yields of conventional soxhlet extraction of industrial granulated cork as
a function of particle size, for the different solvents tested: (hexagon-open) ethanol, (hexagon-half up) acetone, (diamond-half right) dichloromethane, (diamond-half
down) hexane.
The previous Figure represents the fraction of volume extracted; being the cork
powder fully extracted according to the capacity of each solvent. Figure 5.12
shows the dimensionless (extractable) core radius as a function of particle size;
cork powder was totally extracted, i.e., 0cpc
Rr , if the particle size
increases only a fraction of the particle is extracted 0c
.

Validation of models 113
Modelling Extraction Process
Figure 5.12 – Dimensionless core radius vs. particle size, for the different solvents tested: (hexagon-open) ethanol, (hexagon-half up) acetone, (diamond-half right)
dichloromethane, (diamond-half down) hexane.
To evaluate the effect of particle size on the extraction process, experiments for
three different particle sizes (powder, 0.75 mm and 5 mm) were performed and
ethanol was used as solvent. Figure 5.13 shows the histories of cumulative
amount of solute extracted; cork powder presents a higher yield at the end of
extraction; in that Figure the full lines represent the diffusional model while the
dash-dot lines represent the shrinking core model; for both models, the film
resistance around particles is considered negligible (Nf = 10) and the particle
Péclet number is taken as Pep = 2, while the internal effective diffusivity (Dh)
was 1.7 x 10⁻⁸ 1scm
. For the particles sizes 0.75 mm (sample A1) and 5 mm
(sample A5), the diffusional model described reasonably well the experimental
results; however, the histories of cumulative amount of solute in solvent for the
cork powder is not described by any of the models; one possible explanation for
this results could be the eventual formation of agglomerates, happening when
the solvent wets the powder, agglomerates that vanish along time; this
hypothesis is represented in Figure 5.13 by the red lines, solid and dash lines for
the diffusional and shrinking core models respectively. In these simulations, Nd
is considered to vary along time, i.e., a Nd value for particles of larger size was
used in the beginning and it was varied linearly with time until a Nd value
corresponding to powder, at the end of the extraction.
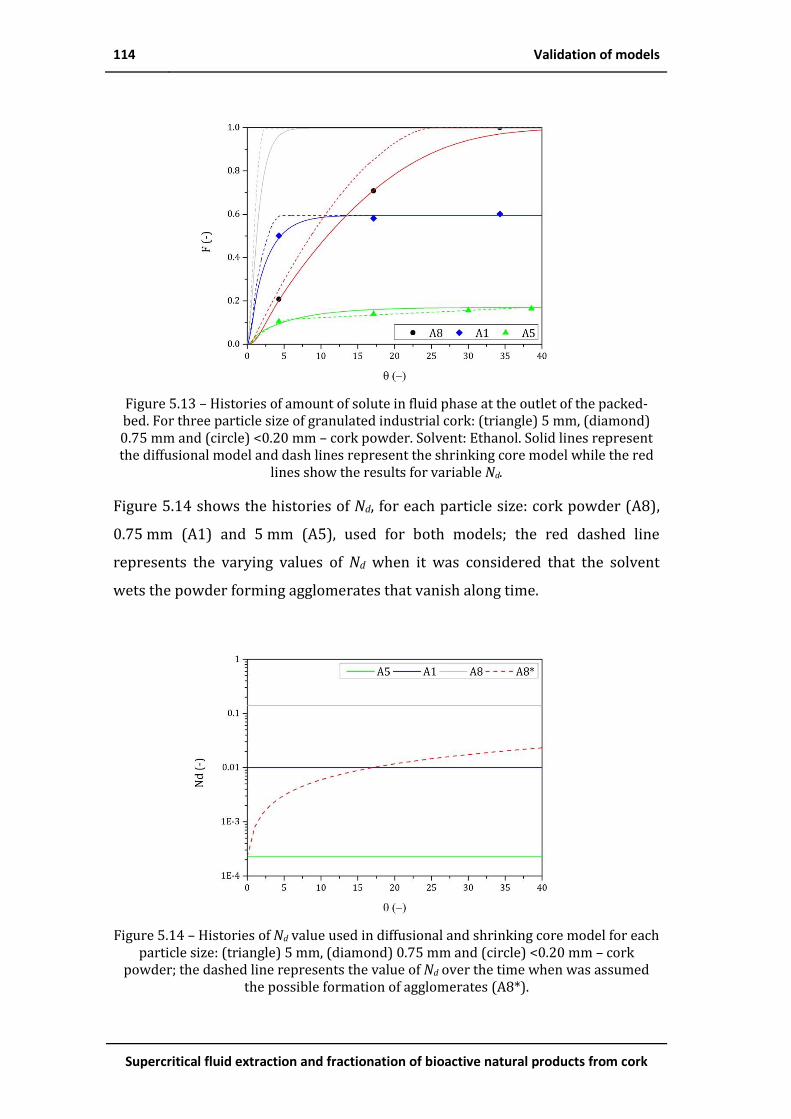
114 Validation of models
Supercritical fluid extraction and fractionation of bioactive natural products from cork
Figure 5.13 – Histories of amount of solute in fluid phase at the outlet of the packed-bed. For three particle size of granulated industrial cork: (triangle) 5 mm, (diamond) 0.75 mm and (circle) <0.20 mm – cork powder. Solvent: Ethanol. Solid lines represent the diffusional model and dash lines represent the shrinking core model while the red
lines show the results for variable Nd.
Figure 5.14 shows the histories of Nd, for each particle size: cork powder (A8),
0.75 mm (A1) and 5 mm (A5), used for both models; the red dashed line
represents the varying values of Nd when it was considered that the solvent
wets the powder forming agglomerates that vanish along time.
Figure 5.14 – Histories of Nd value used in diffusional and shrinking core model for each
particle size: (triangle) 5 mm, (diamond) 0.75 mm and (circle) <0.20 mm – cork powder; the dashed line represents the value of Nd over the time when was assumed
the possible formation of agglomerates (A8*).

Validation of models 115
Modelling Extraction Process
It is to highlight that the Nd parameter hpd
DRN2
considers the whole
particle (Eq. 5.4 and Eq. 5.5); however, as previously described, only an outer
layer is extracted for particle sizes higher than powder; a corrected value is
expressed by,
dd
NN2
*
1
1
Eq. 5.23
When the particle is fully extracteddd
NN * , i.e., 0
c (as in the case of the
cork powder). Figure 5.15 shows the numbers of mass transfer units by
diffusion considering the outer layer that it is extracted.
Figure 5.15 – Nd* (the outer layer extracted) vs. Nd (whole particle).
For the supercritical fluid extraction, samples of sizes 0.75 mm (sample A1) and
5 mm (sample A5) were extracted, using carbon dioxide at supercritical
conditions and its mixtures with ethanol (5 and 10%). As shown in the previous
chapter (Chapter 4), for sample A1 (0.75 mm), using only CO2, the higher yield
(14.1 3
DryCorkextractmmg
) was obtained at ~210 bar and 40°C; however, according
to the results obtained for the soxhlet extraction, it was assumed that only an
outer layer is accessible to be extracted for the particle sizes larger than
powder; for powder, the maximum obtained at those operating conditions could
be 23.4 3
DryCorkextractmmg
. In the same way, considering a linear relation for the

116 Validation of models
Supercritical fluid extraction and fractionation of bioactive natural products from cork
extraction capacity of solvent (no interaction nor synergetic effect between the
solvents), it is possible to estimate 27.7 and 32.3 3
DryCorkextractmmg
, for 5 and
10% of ethanol in the mixture, respectively (at 210 bar and 40°C).
For sample A1 (0.75 mm), Figure 5.16 shows the histories of cumulative amount
of solute in the fluid phase for a mixed solvent of CO2 and (a) 5% or (b) 10% of
ethanol; in this case, as the solvent is changed, the diffusion (Dh) was estimated
as 1.40 x 10⁻⁸ 12scm
and 0.93 x 10⁻⁸ 12
scm
, respectively, while Péclet = 373
and Nf = 10. The diffusional model simulates very reasonably the experimental
results for 5% of ethanol in the solvent mixture; while for 10% ethanol, it is
possible that something similar to the previous case (the cork powder in the
soxhlet extraction) had occurred, i.e., the formation of agglomerates that vanish
along time. In Figure 5.17, for both models it was assumed that Nd changed its
value over time (Rp decreases) and this hypothesis, also, leads to a reasonable
prediction of the experimental results.

Validation of models 117
Modelling Extraction Process
a)
b) Figure 5.16 – Histories of amount of solute in fluid phase at the outlet of the packed-bed; for sample A1 (0.75 mm). a) CO2 and 5% ethanol and b) CO2 and 10% ethanol. Pressure ~210 bar and 40°C. Continuous lines represent the diffusional model and
dashed dot lines represent the shrinking core model.

118 Validation of models
Supercritical fluid extraction and fractionation of bioactive natural products from cork
Figure 5.17 – Histories of amount of solute in fluid phase at the outlet of the packed-
bed; for sample A1 (0.75 mm) and CO2 and 10% ethanol at ~210 bar and 40°C. Continuous lines represent the diffusional model and dashed dot lines represent the
shrinking core model considering a variable Nd
For sample A5 (5 mm), Figure 5.18 shows the experimental results when 10%
ethanol is used in the solvent mixture; for the same conditions (~210 bar and
40°C), the full line represents the simulation result with the diffusion model and
the dash-dot line with the shrinking core model, considering Nf = 10 (negligible
film resistance) and Péclet = 56; the effective diffusivity (Dh) was
128scm1087.1
x .
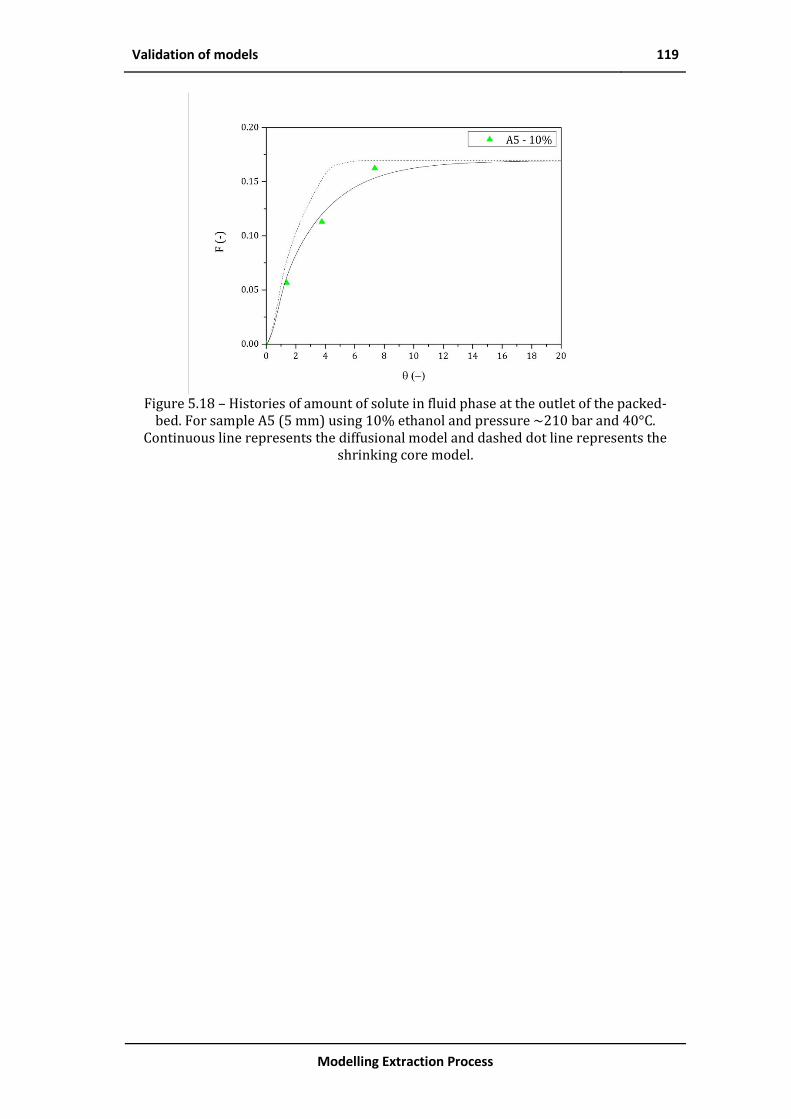
Validation of models 119
Modelling Extraction Process
Figure 5.18 – Histories of amount of solute in fluid phase at the outlet of the packed-
bed. For sample A5 (5 mm) using 10% ethanol and pressure ~210 bar and 40°C. Continuous line represents the diffusional model and dashed dot line represents the
shrinking core model.
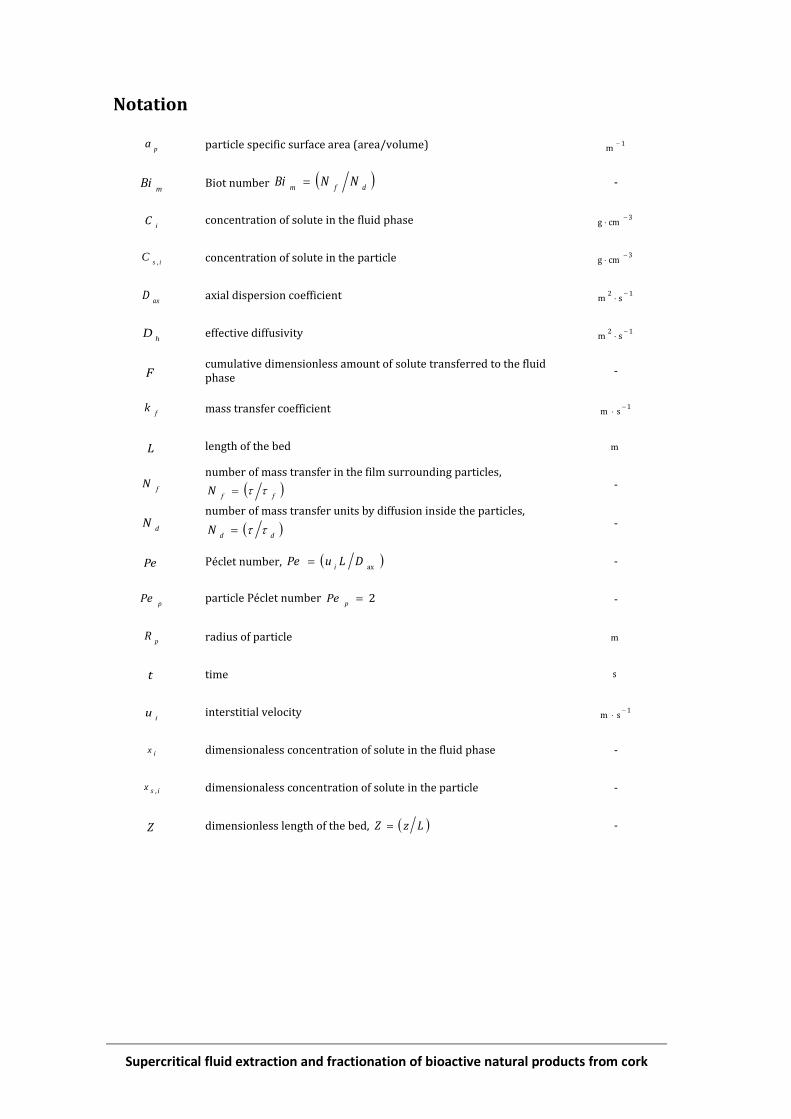
Supercritical fluid extraction and fractionation of bioactive natural products from cork
Notation
pa particle specific surface area (area/volume) 1
m
mBi Biot number
dfmNNBi -
iC concentration of solute in the fluid phase 3
cmg
isC
, concentration of solute in the particle 3
cmg
axD axial dispersion coefficient 12
sm
hD effective diffusivity 12
sm
F cumulative dimensionless amount of solute transferred to the fluid phase
-
fk mass transfer coefficient 1
sm
L length of the bed m
fN
number of mass transfer in the film surrounding particles,
ff
N -
dN
number of mass transfer units by diffusion inside the particles,
dd
N -
Pe Péclet number, ax
DLuPei
-
pPe particle Péclet number 2
pPe -
pR radius of particle m
t time s
iu interstitial velocity 1
sm
ix dimensionaless concentration of solute in the fluid phase -
isx , dimensionaless concentration of solute in the particle -
Z dimensionless length of the bed, LzZ -

Notation, Greek letters and list of acronyms 121
Modelling Extraction Process
Greek letters
porosity or void fraction of the packed-bed -3bed
3space void mm
dimensionless radius, p
Rr -
dimensionless time, t -
i
uL s
List of Acronyms
SFE Supercritical Fluid Extraction
CO2 Carbon Dioxide

Supercritical fluid extraction and fractionation of bioactive natural products from cork
References
Cocero, M. J., and Garcia, J. (2001a). “Mathematical model of supercritical extraction applied to oil seed extraction by CO2 plus saturated alcohol - I. Desorption model.” The Journal of Supercritical Fluids, 20(3), 229–243. doi:10.1016/S0896-8446(01)00068-7
Cocero, M. J., and Garcia, J. (2001b). “Mathematical model of supercritical extraction applied to oil seed extraction by CO2 plus saturated alcohol - II. Shortcut methods.” The Journal of Supercritical Fluids, 20(3), 245–255. doi:10.1016/S0896-8446(01)00069-9
de Melo, M. M. R., Silvestre, A. J. D., and Silva, C. M. (2014). “Supercritical fluid extraction of vegetable matrices: Applications, trends and future perspectives of a convincing green technology.” The Journal of Supercritical Fluids. doi:10.1016/j.supflu.2014.04.007
Esquível, M. M., Bernardo-Gil, M. G., and King, M. B. (1999). “Mathematical models for supercritical extraction of olive husk oil.” Journal of Supercritical Fluids, 16, 43–58. doi:10.1016/S0896-8446(99)00014-5
Martinez, J., Monteiro, A. R., Rosa, P. T. V, Marques, M. O. M., and Meireles, M. A. A. (2003). “Multicomponent model to describe extraction of ginger oleoresin with supercritical carbon dioxide.” Industrial & Engineering Chemistry Research, 42(5), 1057–1063. doi:10.1021/Ie020694f
Naik, S. N., Lentz, H., and Maheshwari, R. C. (1989). “Extraction of perfumes and flavours from plant materials with liquid carbon dioxide under liquid-vapor equilibrium conditions.” Fluid Phase Equilibria, 49, 115–126. doi:10.1016/0378-3812(89)80009-3
Oliveira, E. L. G., Silvestre, A. J. D., and Silva, C. M. (2011). “Review of kinetic models for supercritical fluid extraction.” Chemical Engineering Research and Design, 89, 1104–1117. doi:10.1016/j.cherd.2010.10.025
Tan, C.-S., and Liou, D.-C. (1989). “Modeling of desorption at supercritical conditions.” AIChE Journal, 35(6), 1029–1031. doi:10.1002/aic.690350616

Supercritical fluid extraction and fractionation of bioactive natural products from cork
Fractionation of the cork 6extracts
Until now, it was determined that for the extraction of the granulated industrial
cork, the yield increases when the solvent polarity increases (Figure 6.1); and,
when the particle size increases, it is possible to note that the yield decreases
since apparently only an external layer is extracted, for both soxhlet and SFE,
Chapters 3 and 4, respectively.
Figure 6.1 – Yields obtained for Soxhlet (ethanol, acetone, dichloromethane and
hexane) and scCO2 without co-solvent (at ~210bar and 41°C) for granulated industrial cork; samples A8 (powder), A1 (0.75 mm) and A5 (5 mm)

124 Fractionation of the cork extracts
Supercritical fluid extraction and fractionation of bioactive natural products from cork
With respect to the target compounds in the cork extracts and cork, their
cumulative composition at the end of each extraction is shown in Figure 6.2;
despite the extract of hexane presenting the highest contents for the target
compounds by mass of extract, by mass of dry cork it is the acetone that has the
largest contents (Figure 6.2 b).
a)
b) Figure 6.2 – Betulinic acid and betulin content a) in the cork extract and b) in the cork;
for Soxhlet (ethanol, acetone, dichloromethane and hexane) and scCO2 without co-solvent (at ~210bar and 41°C) for granulated industrial cork, samples A8 (powder),
A1 (0.75 mm) and A5 (5 mm).
In the following, the composition of the cork extracts along the extraction
process, both in the soxhlet (ethanol) and in the SFE with co-solvent extractions,

Soxhlet extraction 125
Fractionation of the cork extracts
will be reported; those data allow the estimation of the composition of the
extracts along time and then enable the eventual programming of the fractions
collection according to the target compounds. Moreover, the fractionation
contributes to improve the design of a separation/purification process with the
aim of achieving extracts with higher compositions of the target compounds
6.1 Soxhlet extraction
As it was referred in Chapter 3, the soxhlet extraction is a benchmark
technology in which the solvent is continuously recirculated; Figure 6.3 shows
the composition of the extract at different time intervals of the extraction, i.e.,
the solvent was removed after 1h, and new solvent was used in the extraction
for more 3h, and then for 4h; at the end of the experiment the cork material was
extracted by 8h, and three collections were made; it can be verified that, for the
cork powder (Sample A8), the composition of the extract in the target
compounds is practically constant over time; however, for the larger particles
(A1 and A5) this does not occur; in the case of betulinic acid, this compound is at
least 7 times higher in the first fraction collected for both samples (A1 and A5),
while the betulin is at least 2 times higher in the same fraction. The last columns
in Figure 6.3 represent the average contents of betulin or betulinic acid, i.e.,
considering that there were no intermediate collections

126 Supercritical Fluid Extraction (SFE)
Supercritical fluid extraction and fractionation of bioactive natural products from cork
Figure 6.3 – Betulinic acid and betulin contents in the cork extracts for Soxhlet
extraction at different times. Solvent: Ethanol. Samples: A8 (cork powder), A1 (0.75 mm) and A5 (5 mm).
6.2 Supercritical Fluid Extraction (SFE)
In this case, the samples were collected removing the co-solvent with the cork
extract from the extraction setup at different times; the collections were made
each hour; after evaporating the solvent, the composition of the extracts was
analysed. Figure 6.4 shows, for samples A1 (0.75 mm) and A5 (5 mm), the
composition of the target compounds in the extracts at different stages of the
extraction process, for 210 bar and 41°C, when 10% of co-solvent (ethanol) was
used. For the larger size sample (A5), the compositions of the target compounds
were almost constant; however, for the sample A1, the last collected fraction
was richer in betulinic acid and betulin, being 4.1 and 2 times higher than the
first collected, respectively. If there were no collections the content of betulin or
betulinic acid in the extract are represented in last columns of Figure 6.3 for
each sample.

Supercritical Fluid Extraction (SFE) 127
Fractionation of the cork extracts
Figure 6.4 – Betulinic acid and betulin contents in the cork extracts for SFE with 10% ethanol at different times, (0-1h; 1-2h and 2-3h). Operating conditions: ~210 bar and
41°C.
The previous Figure compares the results for two samples (Samples A1 and A5)
with different average particle size. Considering the sample with smallest
particles (Sample A1), the effect of the addition of co-solvent in the composition
of the cork extract was studied. Figure 6.5 shows the compositions of the cork
extracts, for SFE using from 0, 5 and 10% of ethanol at the same operating
conditions. In both cases where co-solvent was used, with 5% or 10% of ethanol
as co-solvent in the SFE, the cork extracts were richer in the target compounds
when compared with the SFE without co-solvent. Comparing the first and the
last collected fractions, it is possible to note that, using fractional collections, the
amount of the target compounds in the extracts can be doubled.
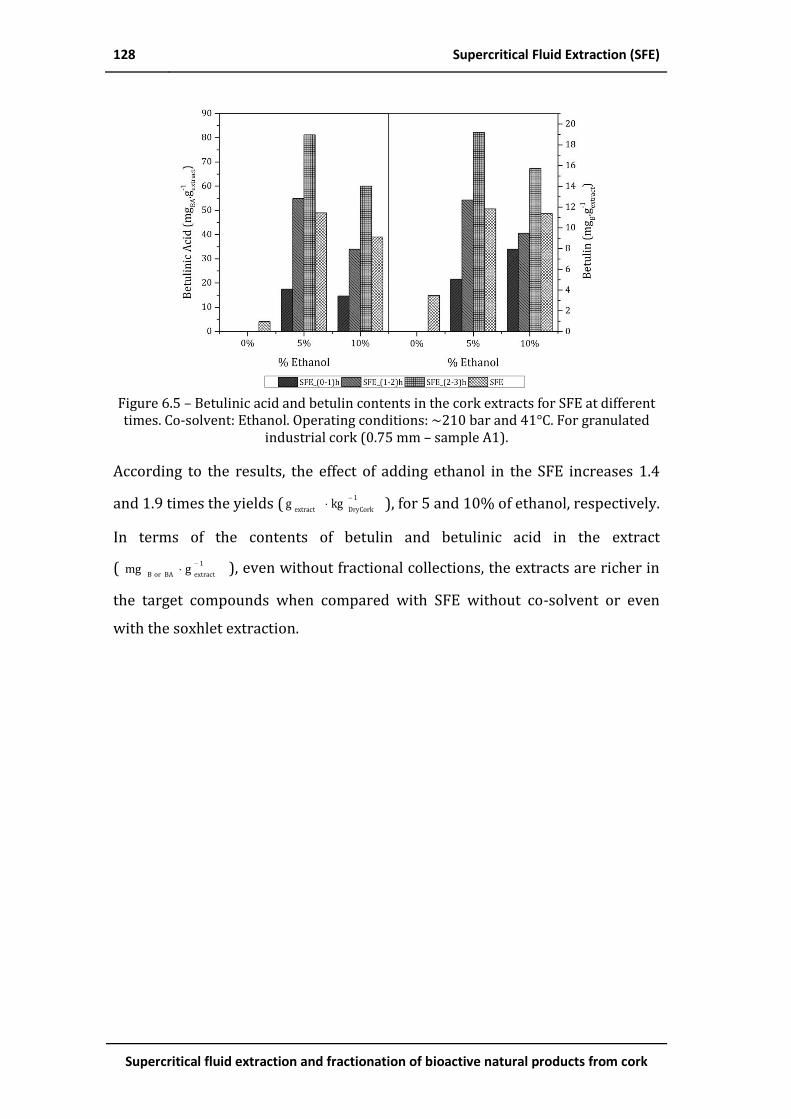
128 Supercritical Fluid Extraction (SFE)
Supercritical fluid extraction and fractionation of bioactive natural products from cork
Figure 6.5 – Betulinic acid and betulin contents in the cork extracts for SFE at different times. Co-solvent: Ethanol. Operating conditions: ~210 bar and 41°C. For granulated
industrial cork (0.75 mm – sample A1).
According to the results, the effect of adding ethanol in the SFE increases 1.4
and 1.9 times the yields (1
DryCorkextractkgg
), for 5 and 10% of ethanol, respectively.
In terms of the contents of betulin and betulinic acid in the extract
( 1
extractBA or Bgmg
), even without fractional collections, the extracts are richer in
the target compounds when compared with SFE without co-solvent or even
with the soxhlet extraction.

Supercritical fluid extraction and fractionation of bioactive natural products from cork
Conclusions
The main goal of this work was to show the feasibility to obtain new
products/markets from granulated industrial cork, which means to “Add a New
Value to Cork”, that should constitute a push forward to the cork industry; the
cork oak is considered a national heritage and more than fifty percent of the
worldwide sales of cork products are assumed by the Portuguese cork industry.
Being the production of cork stoppers the biggest sector of the cork industry,
the raw material used in this work was constituted by the granulated industrial
cork and cork powder generated in the facilities of natural cork stoppers
production. Two different extraction processes, soxhlet and SFE, were studied;
also, it was developed an analytical method to identify and quantify the target
compounds, betulin and betulinic acid (B and BA), in cork.
With respect to the soxhlet extraction, the global extraction yields were
influenced by all the parameters studied: solvent polarity, particle size, plank
region, and particle bulk density. Yields increased with the polarity of the
solvent, regardless of the average particle size (or bulk density) of the samples.
The highest yield (96.5 1
DryCorkextractkgg
) was obtained for cork powder using
ethanol as solvent. On the other hand, yields decreased, for all solvents, with
increasing particle size. Particles from outer sections of the plank presented
lower yields than samples from inner sections; for particles from inner sections,
and with the same particle size, higher yields were obtained for samples with
higher bulk density; the opposite behavior was verified for outer section
samples.
“That's one small step for man…” Neil Armstrong

130 Conclusions
Supercritical fluid extraction and fractionation of bioactive natural products from cork
The extracts for the soxhlet extraction have 2.5 to 4.6 times more betulinic acid
than betulin. It was also shown that the contents of these target compounds
extracted from cork decreased as the particle size increased, with the extracts
from sample A1 being the richest (2991 1
DryCork AcidBetulinickgmg
, and
571 1
DryCorkBetulinkgmg
, with acetone as solvent). If we consider that around 20%
of the total Portuguese exports of cork in mass could be extracted, then it would
be possible to obtain by year ca. 3 ton of extract (assuming an 8% yield).
Taking the results of the soxhlet extraction as the benchmark, a bench scale
setup for supercritical extraction was designed, assembled and tested; this
setup can be operated both in batch or continuous modes as well as with or
without co-solvent; also, it allows the recording of all operating conditions
(pressures and temperatures), as well as the volume of CO2 used in the
extraction process. It is to remark that, although the setup was designed to
extract granulated industrial cork, other materials can be used. The setup
counts with a single separator. As the setup was built in-house, it is easily
adaptable; e.g., it is possible to add another separator, to change the chamber of
extraction, etc.
With respect to the supercritical extraction, the best result was obtained at 41°C
and 210 bar with 19.7 1
DryCorkextractkgg
; when 10% of ethanol was added, the
yield increased almost 86% (to 36.4 1
DryCorkextractkgg
).
In order to try to predict the experimental results, two phenomenological
models were developed, one diffusional and one shrinking core models. In the
development of both models, the film mass transfer resistance was neglected
(Nf = 10 was used throughout); and according with the experimental results and
as cork is a liquid sealant, it was assumed that only an outer layer of the cork
can be extracted; excluding the cork powder that was fully extracted, for
particles bigger than 1 mm the dimensionless cork layer pcp RrR is nearly
constant and only depends on the type of solvent; on average, it is ca. 0.22, 0.20
and 0.11 for acetone, dichloromethane and hexane, respectively.
Conclusions 131
Conclusions
For the same conditions, the mass transfer is faster in the shrinking core model
than in the diffusional model. The diffusional model described reasonably well
the experimental results; for soxhlet, the effective diffusivity was calculated as
1.7 x 10⁻⁸ 12scm
, when the ethanol was used as solvent. While for the SFE the
effective diffusivity was calculated as 1.4 x 10⁻⁸ 12scm
for 5% of ethanol, and
0.9 x 10⁻⁸ 12scm
for 10% of ethanol.
When fractional collections of the extracts were done, it was possible to double
the contents of the target compounds in the cork fractions extracted.

Supercritical fluid extraction and fractionation of bioactive natural products from cork
Future Work
This thesis represented a first step to use the granulated industrial cork as a
source of bioactive products; however, the author suggests new approaches to
be done. First, analyse the performance for supercritical fluid extraction when
another co-solvent is used, e.g., water; since the material used in this work is
further used to produce cork stopper. Appendix 2 shows the methodology that
will be used for those experiences. Needless to say, based in the results obtained
in this work, granulated cork to be used in other technical applications can be a
potential source of bioactive compounds with a high added-value, and for them
other co-solvents can be used.
After obtaining the optimal operating conditions for extraction and
fractionation with the new co-solvents (at the bench scale), the experimental
setup should be adapted to a preparative scale, with the objective to evaluate
the effects of scale-up and to prepare its eventual industrial application in the
future.
Also, develop a model to predict the extraction and fractionation of the
extractives from cork not only in terms of the total yields (as presented in this
work), but also focused in each one of the target compounds.
Finally, it is essential to carry out an economic analysis for this process to
determine the possibility to implement in the cork industry.
“Now this is not the end, it is not even the beginning of the end. But it is, perhaps, the end
of the beginning” Winston Churchill


Supercritical fluid extraction and fractionation of bioactive natural products from cork
Appendix 1 - Analytical Methods
Beyond the yields achieved to each cork extraction, it was essential to know
their composition, i.e. the selectivity of the target compounds to each solvent. An
analytical method was implemented to identify and quantify the compounds
present in the cork extracts, by soxhlet extraction or even supercritical fluid
extraction. A gas chromatograph (GC) was used to separate the cork extracts.
The quantitative GC analysis is based in the area of the chromatographic peak,
and the qualitative analysis uses the retention time (McNair et al., 1998).
Nonetheless, the retention time cannot be the only parameter to confirm the
compound identity; the spectrum from a mass spectrometer helps to identify
the structure, elemental composition and molecular weight of the components
in a mixture (Harris, 1999). In this work, two detectors coupled to the GC were
used for the analysis of cork extracts: for the qualitative analysis, a MS detector
was used, while for quantitative analysis a FID detector was coupled to the GC;
the GC-FID was calibrated using pure reference compounds representative of
the major classes of components present in cork extracts, relative to an internal
standard (cholesterol).
Gas Chromatography / Flame Ionization Detector (GC-FID)
FID responds to a wide range compounds, since it is a non-selective detector
(McNair et al., 1998). A GC (Chrompack CP-9003), that was equipped with a
flame ionization detector and a DB-1 capillary column (30 m x 0.32 mm inner
diameter and 0.25 µm film thickness), was used. To achieve a good separation of
the compounds, a temperature program was defined, and helium was used as
carrier gas (1 mL.min-1); the detector and injector temperatures were set at
300°C and a temperature program was defined as: 80°C during the first 5 min,
an increase from 80 °C to 280°C with a heating rate of 4°C.min-1, and 20 min at
280°C. Figure A1.1 shows a chromatographic separation between betulin and
betulinic acid for the conditions described above.

A1.2 Analytical Methods
Supercritical fluid extraction and fractionation of bioactive natural products from cork
Figure A1.1 - Chromatogram for betulin (B) and betulinic acid (BA)separation using cholesterol as internal standard for the conditions described in the text.
To quantify the compounds in the samples, a calibration curve must be done; an
internal standard should be used when high precision is required, since the
internal standard and the samples are submitted to the same conditions during
the analysis. Preferably, the internal standard must belong to a similar family of
the compounds to be analyzed, and cannot be present in the sample, neither
interfere with the other chromatographic peaks. As cholesterol is not present in
cork extracts, it was used as the internal standard. The calibration curve is a
method to determine the concentration of a substance in an unknown sample,
comparing standard samples of known concentrations with the unknown
samples. Figure A1.2 shows calibration curves for betulin and betulinic acid
using cholesterol as internal standard.
a) b)
Figure A1.2 – Calibration Cuve: a) betulinic acid b) betulin.
Gas Chromatography / Mass Spectrometry (GC-MS)
The GC-MS combines the power of high-resolution separation with a very
selective and sensitive mass detection (Harris, 1999). A mass spectrometer
bombards molecules in the vapor phase (commonly, using electron-impact

Analytical Methods A1.3
Appendix 1
mode) with a high-energy electron beam and records the result as a spectrum of
positive ions separated on base of mass/charge (m/z) (Silverstein et al., 1998).
Mass spectra are routinely obtained at an electron beam energy of 70 eV. With
mass spectrometers, structural information to identify the analyte is obtained
(Silverstein et al., 1998). Figure 9 shows a mass spectrum for the cholesterol
trimethylsilyl ether; this is a representation of the masses of the positively
charged fragments versus their relative concentrations. The most intense peak
in the spectrum (base peak), is assigned a value of 100 %, and the other peak
intensities (including the molecular peak) are reported as percentages of the
base peak (Silverstein et al., 1998).
Figure A.3 - Mass spectrum for cholesterol trimethylsilyl ether.
For the identification of the components in the cork extracts, a gas
chromatograph with a mass spectrometer was used (Varian 4000 GC-MS, USA).
The compounds in the mixture were separated in a capillary VF-5MS (30 m x
0.25 mm ID x 0.25 µm film) column. The detector was set at 300°C and helium
was used as carrier gas. The temperature program used is the one defined
above (GC-FID). The MS is operated in the electron impact mode with an
electron impact energy of 70 eV over a range of m/z 50 – 700. The ion source is
maintained at 200°C.

Supercritical fluid extraction and fractionation of bioactive natural products from cork
References
Harris, D. C. (1999). “Quantitative chemical analysis” (5th ed). Book, New York:
W. H Freeman and Company.
McNair, H. M., and Miller, J. M. (1998). “Basic gas chromatography.” Techniques
in analytical chemistry series. Book, New York [etc.]: John Wiley & Sons.
Silverstein, R. M., and Webster, F. X. (1998). “Spectrometric identification of
organic compounds” (6th ed). Book, New York: John Wiley & Sons.

Supercritical fluid extraction and fractionation of bioactive natural products from cork
Appendix 2 - Response Surface Methodology (RSM)
Design of experiments using response surface methodology
In order to evaluate the influence of each variable (pressure, temperature and
amount of co-solvent) in the performance of the process, the response surface
methodology (RSM) was used to design the experiments; Table A2.1 shows the
range of values tested for each variable. It is to remark that despite the range
proposed for pressure, the experimental set-up can be operated in a wider
range (up to 300 bar).
Table A2.1 – Range of the process variable used in SFE with co-solvent.
Low -1
Medium 0
High 1
Pressure (bar) 170 205 240
Temperature (°C) 40 60 80
co-solvent (%) 0 5 10
To do a screening of the variables, the first experiments are obtained by a
fractional factorial design as indicated in Table A2.2. With the results obtained,
the response is fitted to a linear model through the first-order model
represented in Eq. A2.1.
kk
xxxy 22110
Eq. A2.1
Where
ix represents the variable “i”,
k is the number of variables,
0 is the constant term,
i represents the coefficients of the linear parameter “i”,
is the residue associated to the experiments.

A2.2 Response Surface Methodology (RSM)
Supercritical fluid extraction and fractionation of bioactive natural products from cork
Table A2.2 – Experiments from fractional factorial design with 3 variables (6 runs)
RUN Pressure (bar) Temperature (°C) Co-solvent (%)
1 170 40 10
2 240 40 0
3 170 80 0
4 240 80 10
center-a 205 60 5
center-b 205 60 5
In the case of a good fitting, the fractional factorial design is improved; so, a full
factorial design is run, as described in Table A2.3. Figure A2.1 shows that the
experiments from the fractional factorial design procedure are included in the
full factorial design.
Table 4 – Experiments from the full factorial design with 3 variables (10 runs)
RUN Pressure (bar) Temperature (°C) Co-solvent (%)
1 170 40 0
2 240 40 0
3 170 80 0
4 240 80 0
5 170 40 10
6 240 40 10
7 170 80 10
8 240 80 10
center-a 205 60 5
center-b 205 60 5
a) b)
Figure A2.1 – Experimental design a) fractional factorial; b) full factorial.
The previous first-order model does not describe any curvature in the response;
to evaluate a possible curvature, a second-order model is used (Eq. A2.2). In this
-1
0
1
-1
0
1
-1
0
1
PressureTemperature
co-s
olv
ent
-1
0
1
-1
0
1
-1
0
1
PressureTemperature
co-s
olv
ent

Response Surface Methodology (RSM) A2.3
Appendix 2
sense, a Box-Behnken design or a central composite design can be chosen; the
experiments from these designs are presented in Table A2.4 and Table A2.5,
respectively. The required number of runs from the Box-Behnken algorithm is
given by int
12po
ckkN , where intpoc is the number of replicates of the
central run; in the case of the central composite, int
22
pockkN .
Table A2.4 – Experiments from the Box-Behnken design with 3 variables (15 runs)
RUN Pressure (bar) Temperature (°C) Co-solvent (%)
1 170 40 5
2 240 40 5
3 170 80 5
4 240 80 5
5 170 60 0
6 240 60 0
7 170 60 10
8 240 60 10
9 205 40 0
10 205 80 0
11 205 40 10
12 205 80 10
center-a 205 60 5
center-b 205 60 5
center-c 205 60 5
Table A2.5 – Experiments from the central composite design with 3 variables (17 runs)
RUN Pressure (bar) Temperature (°C) Co-solvent (%)
L:A 170 60 5
H:A 240 60 5
L:B 205 40 5
H:B 205 80 5
L:C 205 60 0
H:C 205 60 10
1 170 40 0
2 240 40 0
3 170 80 0
4 240 80 0
5 170 40 10
6 240 40 10
7 170 80 10
8 240 80 10
cent-a 205 60 5
cent-b 205 60 5
cent-c 205 60 5

A2.4 Response Surface Methodology (RSM)
Supercritical fluid extraction and fractionation of bioactive natural products from cork
Figure A2.2 shows the experiments with the Box-Behnken and central
composite designs. The central composite design includes all runs of the full
factorial. The second-order model is
k
ji
jiij
k
j
jjj
k
j
jjxxxxy
21
2
1
0
Eq. A2.2
Where
jj represents the coefficients of the quadratic parameter “j”,
ij represents the coefficients of the interaction parameter,
k is the number of variables,
a) b)
Figure A2.2 – Experimental design a) Box-Behnken and b) central composite.
References
Bezerra, M. A., Santelli, R. E., Oliveira, E. P., Villar, L. S., and Escaleira, L. A.
(2008). “Response surface methodology (RSM) as a tool for optimization in
analytical chemistry.” Talanta, 76(5), 965–977.
doi:10.1016/j.talanta.2008.05.019
Myers, R. H., and Montgomery, D. C. (2002). “Response surface methodology
process and product optimization using designed experiments.” Wiley
Series in Probability and Statistics (2nd ed). New York: John Wiley & Sons.
-1
0
1
-1
0
1
-1
0
1
PressureTemperature
co-s
olv
ent
-1
0
1
-1
0
1
-1
0
1
PressureTemperature
co-s
olv
ent