Embed Size (px)
Citation preview

THE GEORGE WASHINGTON UNIVERSITY SCHOOL OF BUSINESS AND PUBLIC MANAGEMENT
INSTITUTE OF BRAZILIAN BUSINESS AND PUBLIC MANAGEMENT ISSUES – IBI
XXII MINERVA PROGRAM FALL 2007
THE EXPANSION OF DISTRIBUTED GENERATION IN BRAZIL: ANALYSIS OF THE CURRENT INCENTIVES AND THE
RISKS FOR INVESTORS
MARCO AURÉLIO LENZI CASTRO
ADVISOR: PROF. JOHN FORRER
WASHINGTON-DC, DECEMBER OF 2007
TABLE OF CONTENTS
1. INTRODUCTION 3 2. CHARACTERISTICS OF BRAZILIAN ELECTRIC SECTOR 5
2.1 DISTRIBUTED GENERATION 9
2.1.1 Introduction 9 2.1.2 Distributed Generation Types 10 2.1.3 SHPs Main Characteristics 11 2.1.4 Biomass 13
2.1.4.1 Sugar Cane Bagasse 14 2.1.5 Wind Power 16
3 LEGAL AND REGULATORY INCENTIVES TO DISTRIBUTED
GENERATION 19
3.1 BRAZILIAN NATIONAL PROGRAM FOR DISTRIBUTED GENERATION – PROINFA 19
3.2 OTHERS CURRENT INCENTIVES IN BRAZIL 24 3.3 RENEWABLE ENERGY POLICY OF CALIFORNIA 25
4 CLEAN DEVELOPMENT MECHANISM 31
4.1 INTRODUCTION 31 4.2 CURRENT SITUATION OF CDM PROJECTS 34
5 ENERGY AUCTIONS 38
5.1 REGULATED CONTRACTING ENVIRONMENT (RCE) 38 5.2 FREE CONTRACTING ENVIRONMENT (FCE) 39 5.3 ELECTRIC ENERGY CONTRACTING 40
5.3.1 General Aspects 40 5.3.2 Auctions Done After 2004 41
6 INVESTORS’ RISKS VERSUS CURRENT OPPORTUNITIES 46
6.1 SHPS RISKS 46 6.2 RISKS FOR BIOMASS POWER PLANTS 48 6.3 RISKS FOR WIND POWER PLANTS 49
7 CONCLUSION 51 8 REFERENCES 53
2
1. INTRODUCTION
The Brazilian electric energy matrix is characterized by the expressive
participation of renewable sources in its structure, especially the hydraulics that
corresponds to 71% of the installed capacity in Brazil. Besides, energy sources
such as biomass correspond to 3.7%, and the wind energy answer for only
0.2%.
The hydroelectric power plants, which are considered with installed power
above 30 MW, are responsible for 97.6% of the hydraulics sources. Therefore,
the Small Hydroelectric Power Plants - SHPs (with installed power ratings over
1 MW and equal to or less than 30 MW) and the Mini Hydroelectric Power
Plants - MHPs (under 1 MW) still have a small participation in the Brazilian
energy market.
In order to increase the distributed generation in the country, legal and
regulatory incentives were designed to stimulate those plants, allowing larger
access to bank financings, reducing the energy commercialization costs and
celebrating energy purchase and sale contracts for long period, through energy
auctions or the national program for renewable electric energy (Proinfa).
Besides, the establishment of the Clean Development Mechanism (CDM),
through the Kyoto Protocol, opened the possibility for investors in renewable
sources in Brazil to obtaining an additional income, through the sale of carbon
credits for great companies installed at developed countries, which have to
follow the established goals to reduce the greenhouse gases emissions in their
countries.
However, investors are still exposed to risks from different sources: fulfill all
Proinfa’s commitments, difficulties on getting banks financings, face long
environmental licensing process for each power plant and also obtain the
definition of the connection point in the distribution grid.
3
In conclusion, the objective of this study is analyzing the current incentives,
detailing the Brazilian Federal laws and ANEEL’s resolutions, as well as the
national program - Proinfa, and the risks associated to the investors for the
expansion of distributed generation, especially for the following renewable
energy sources: biomass, wind power and small hydroelectric power plant.
In addition, it will be presented the renewable energy policy adopted in the
California State after the energy crisis of 2001, in order to increase the
participation of those sources in the electric energy matrix.
4

2. CHARACTERISTICS OF BRAZILIAN ELECTRIC SECTOR
Brazilian electric energy matrix is mostly based on renewable energy sources,
specially the available great hydraulics resources. Figure 1 illustrates all electric
energy sources that are used in Brazil.
70,9%
10,5%
4,0%
3,7%
1,9%
1,3%
0,2%
7,5%
0% 20% 40% 60% 80%
Hydraulic
Gas
Petroleum
Biomass
Nuclear
Mineral Coal
Wind Power
Import
Figure 1: Brazilian Electric Energy Matrix [1]
Additionally, it must be registered the increasing of thermal generation, that
burns fossil fuels such as natural gas and diesel oil, and specially the one who
uses different types of biomass as energy source, like sugar cane. On the other
hand, the participation of nuclear generation is not very important.
With reference to energy produced by wind power plants, it can be observed
that there is a low participation in electric energy matrix, with only 15 plants
operating. However there were 108 new plants authorized by Brazilian
Electricity Regulatory Agency – ANEEL in October of 2007 and it is hold a
higher participation of this source on the next years.
As the hydroelectric power plants are located far from the load, it is necessary
to have long transmission grids to carry these energy blocks to the load centers.
5
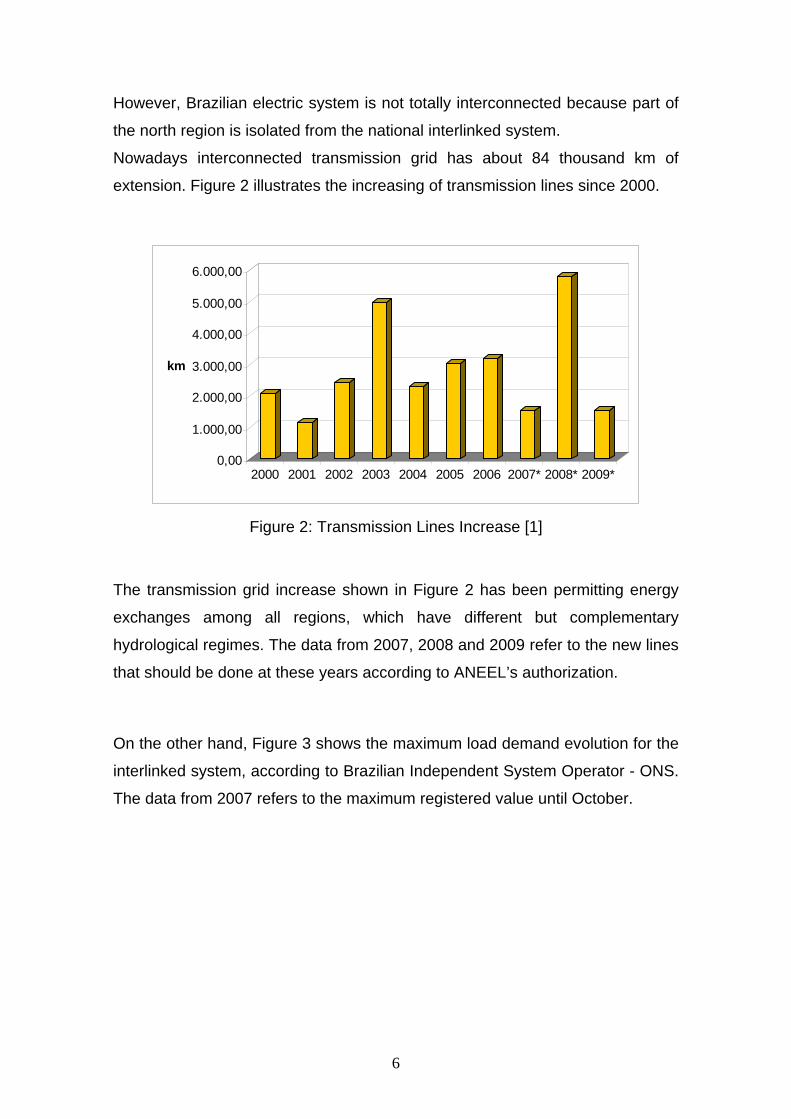
However, Brazilian electric system is not totally interconnected because part of
the north region is isolated from the national interlinked system.
Nowadays interconnected transmission grid has about 84 thousand km of
extension. Figure 2 illustrates the increasing of transmission lines since 2000.
0,00
1.000,00
2.000,00
3.000,00
4.000,00
5.000,00
6.000,00
km
2000 2001 2002 2003 2004 2005 2006 2007* 2008* 2009*
Figure 2: Transmission Lines Increase [1]
The transmission grid increase shown in Figure 2 has been permitting energy
exchanges among all regions, which have different but complementary
hydrological regimes. The data from 2007, 2008 and 2009 refer to the new lines
that should be done at these years according to ANEEL’s authorization.
On the other hand, Figure 3 shows the maximum load demand evolution for the
interlinked system, according to Brazilian Independent System Operator - ONS.
The data from 2007 refers to the maximum registered value until October.
6

0
10.000
20.000
30.000
40.000
50.000
60.000
70.000
2000 2001 2002 2003 2004 2005 2006 2007*
MW
Figure 3: Maximum Load Demand
In order to answer the load increase, Figure 4 presents the evolution of
Brazilian installed power plants, up to October of 2007.
010.00020.00030.00040.00050.00060.00070.00080.00090.000
100.000
MW
2000 2001 2002 2003 2004 2005 2006 2007*
Figure 4: Generation Installed Power Increase [1]
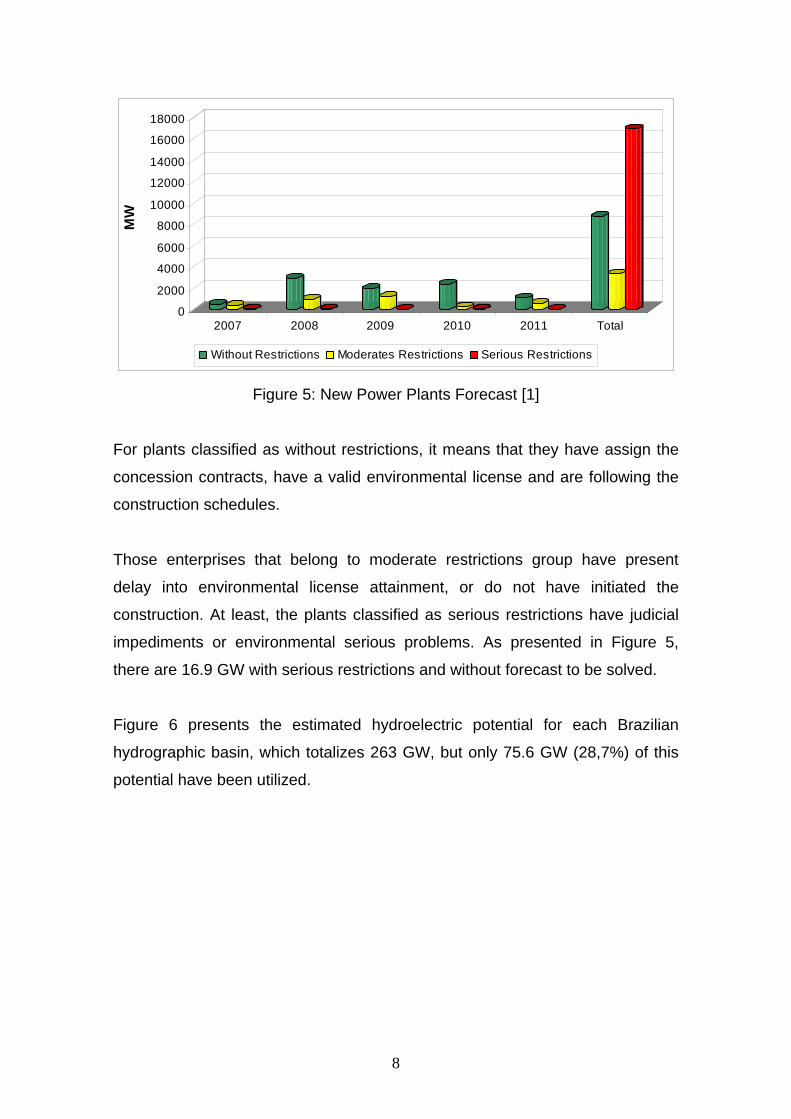
Figure 5 illustrates the forecast of new power plants operation, divided into
three categories by ANEEL: without restrictions, moderate restrictions and
serious restrictions.
7
0
2000
4000
6000
8000
10000
12000
14000
16000
18000M
W
2007 2008 2009 2010 2011 Total
Without Restrictions Moderates Restrictions Serious Restrictions
Figure 5: New Power Plants Forecast [1]
For plants classified as without restrictions, it means that they have assign the
concession contracts, have a valid environmental license and are following the
construction schedules.
Those enterprises that belong to moderate restrictions group have present
delay into environmental license attainment, or do not have initiated the
construction. At least, the plants classified as serious restrictions have judicial
impediments or environmental serious problems. As presented in Figure 5,
there are 16.9 GW with serious restrictions and without forecast to be solved.
Figure 6 presents the estimated hydroelectric potential for each Brazilian
hydrographic basin, which totalizes 263 GW, but only 75.6 GW (28,7%) of this
potential have been utilized.
8

0,00 20,00 40,00 60,00 80,00 100,00 120,00
GW
Amazonas
Tocantins
Atlântico Norte/Nordeste
São Francisco
Atlântico Leste
Paraná/Paraguai
Uruguai
Atlântico Sul/Sudeste
Figure 6: Brazilian Estimated Hydroelectric Potential [1]
However, hydroelectric power plants constructions are getting more difficult to
be done, especially on Amazon region, because of the rigorous environmental
legislation. Therefore, it is necessary to improve the generation capacity, giving
priority to projects that have minimum environmental impact and with lower
building costs.
2.1 DISTRIBUTED GENERATION 2.1.1 Introduction [3], [4]
Distributed generation is installed next to the load, and could use many types of
energy sources (renewable and non-renewable), without any power limitation. It
can be useful to supply isolated consumers or be connected to the distribution
grid, supplying others loads. The main benefits of distributed generation are:
• reduce or postpone the investments on transmission system;
• could be build in less time than hydroelectric power plants;
• low environmental impact;
• improves the tension level on the grid and permits loss reduction;
• is an alternative to supply part of the demand with lower costs;
9
• could provide ancillaries services, by generating reactive energy;
• increases the distribution system security, allowing the supply of some
loads in case of problems with the centralized generation.
On the other hand, there are some disadvantages that come with the spread of
distributed generation, such as:
• rise the complexity of the central generation because distribution system
will receive energy from big plants, which are commanded by ISO, and
energy produced by small power plants that are next to the load;
• necessity of changing the procedures that are used by distribution
companies to operate, control and protect their grids;
• difficult on controlling the tension level of the lines;
• rise the harmonic distortion, which means that energy quality could be
reduced especially where wind power plants are installed.
Therefore the inputs of generation units on distribution grid must be well
planned, always looking for the best connection point, projecting and installing
the adequate protections.
2.1.2 Distributed Generation Types [1]
There are many types and technologies for local electrical energy generation,
which means close to consumers. For instance, it can be listed the following
types:
Small Hydroelectric Power Plants – SHPs;
Biomass;
Wind Power Plants;
Solar;
Urban Waste;
Fossil Fuels.
10
Despite the great variety of techniques, this study will focus on SHPs, biomass
and wind power, showing their main characteristics and discuss the current
opportunities for investors.
2.1.3 SHPs Main Characteristics [1], [2], [6], [13]
SHPs are small hydroelectric power plants, and in Brazil, have installed power
between 1 MW and 30 MW and their reservoir must occupy less than 3 km² of
area, according to ANEEL’s Resolution no 652/2003. These plants must have
authorization from ANEEL to produce energy for their own consume or sell it to
the market.
In October of 2007, there were 289 SHPs operating in the country, which
correspond to 1786 MW of installed power. Besides, there are 67 new
enterprises under construction, or 1210 MW from this renewable energy source.
The main benefits of a SHP are:
• small reservoir, which means less environmental impacts;
• low generated energy cost;
• uses renewable source, which has no cost and do not produce
greenhouse effects emissions;
• needs short period for construction (18 to 24 months);
• uses national equipments, reducing costs and giving incentives for local
industry;
• lower connection costs to distribution grid;
• loss reduction on the distribution line.
SHPs present two huge advantages when compared with natural gas, diesel oil
or mineral coal thermoelectrics:
less environmental impact, because SHPs do not produce pollutant
gases;
11

uses a renewable fuel (water), that is abundant in Brazil, allowing costs
reduction.
The average cost to construct a SHP is about R$ 4,200/kW (or about US$
2,200/kW), without considering the costs to install the exclusive line to connect
the plant to distribution system.
Another point that must be considered is that ANEEL has simplified the river
inventory study demands for those plants, as well as for basic and executive
projects, which have less complexity when compared with a hydroelectric
enterprise. Then, there is no need to have a public process to sell the
enterprise, but only give an authorization to the investor, what can considerably
reduce the time to receive the approval from ANEEL.
Figures 7, 8 and 9 illustrate SHP Mourão 1 (8.2 MW) and SHP Primavera (18.2
MW) barrages, and also the machine house of SHP Ilhéus (2.5 MW),
respectively.
Figure 7: SHP Mourão 1
Figure 8: SHP Primavera
12
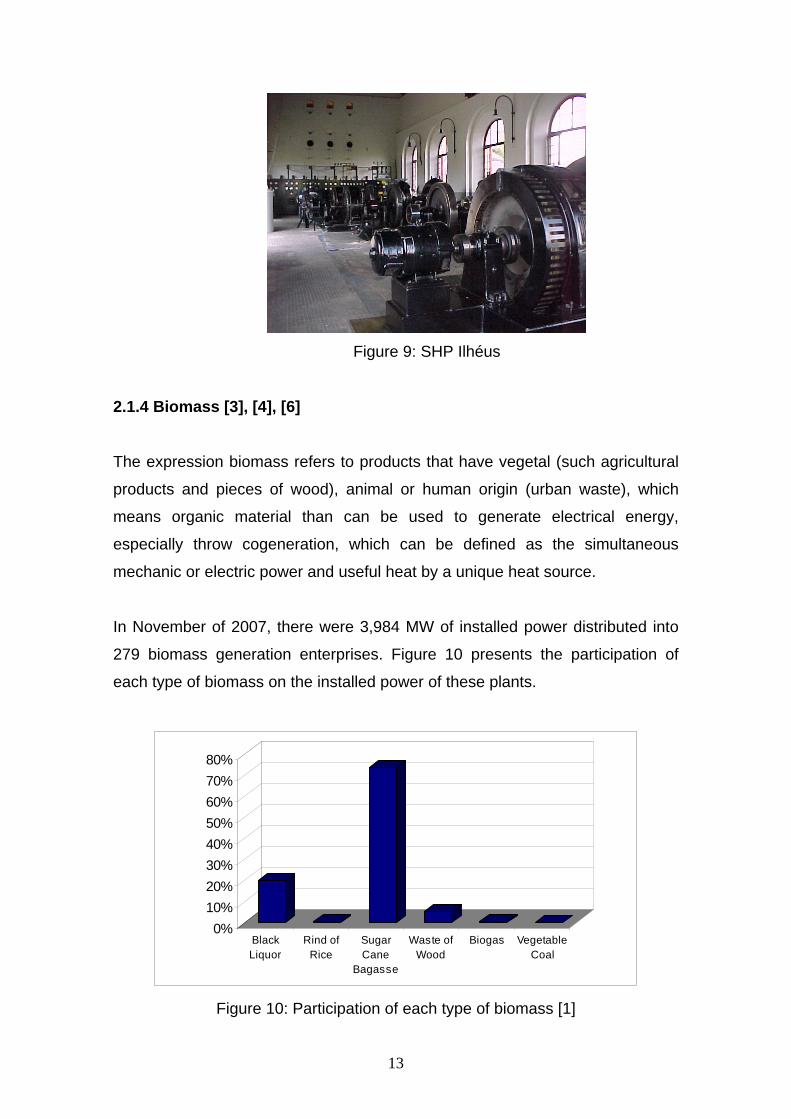
Figure 9: SHP Ilhéus
2.1.4 Biomass [3], [4], [6]
The expression biomass refers to products that have vegetal (such agricultural
products and pieces of wood), animal or human origin (urban waste), which
means organic material than can be used to generate electrical energy,
especially throw cogeneration, which can be defined as the simultaneous
mechanic or electric power and useful heat by a unique heat source.
In November of 2007, there were 3,984 MW of installed power distributed into
279 biomass generation enterprises. Figure 10 presents the participation of
each type of biomass on the installed power of these plants.
0%10%20%30%40%50%60%70%80%
BlackLiquor
Rind ofRice
SugarCane
Bagasse
Waste ofWood
Biogas VegetableCoal
Figure 10: Participation of each type of biomass [1]
13
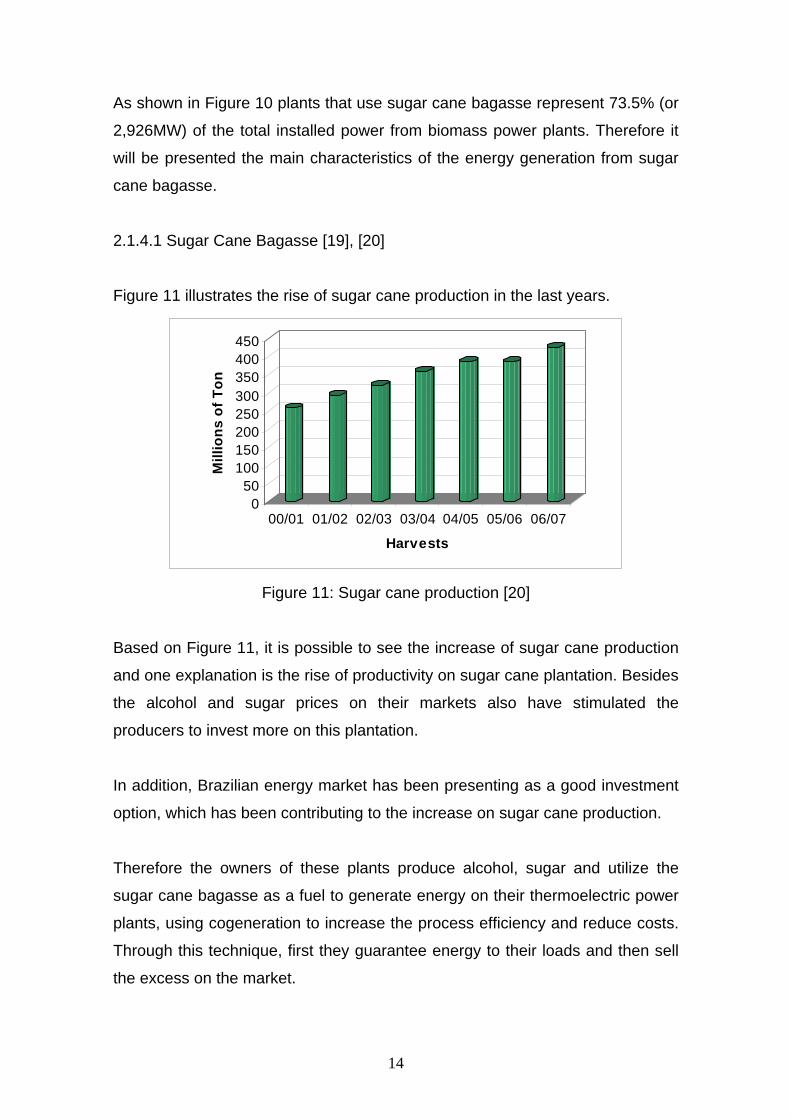
As shown in Figure 10 plants that use sugar cane bagasse represent 73.5% (or
2,926MW) of the total installed power from biomass power plants. Therefore it
will be presented the main characteristics of the energy generation from sugar
cane bagasse.
2.1.4.1 Sugar Cane Bagasse [19], [20]
Figure 11 illustrates the rise of sugar cane production in the last years.
050
100150200250300350400450
Mill
ions
of T
on
00/01 01/02 02/03 03/04 04/05 05/06 06/07
Harvests
Figure 11: Sugar cane production [20]
Based on Figure 11, it is possible to see the increase of sugar cane production
and one explanation is the rise of productivity on sugar cane plantation. Besides
the alcohol and sugar prices on their markets also have stimulated the
producers to invest more on this plantation.
In addition, Brazilian energy market has been presenting as a good investment
option, which has been contributing to the increase on sugar cane production.
Therefore the owners of these plants produce alcohol, sugar and utilize the
sugar cane bagasse as a fuel to generate energy on their thermoelectric power
plants, using cogeneration to increase the process efficiency and reduce costs.
Through this technique, first they guarantee energy to their loads and then sell
the excess on the market.
14
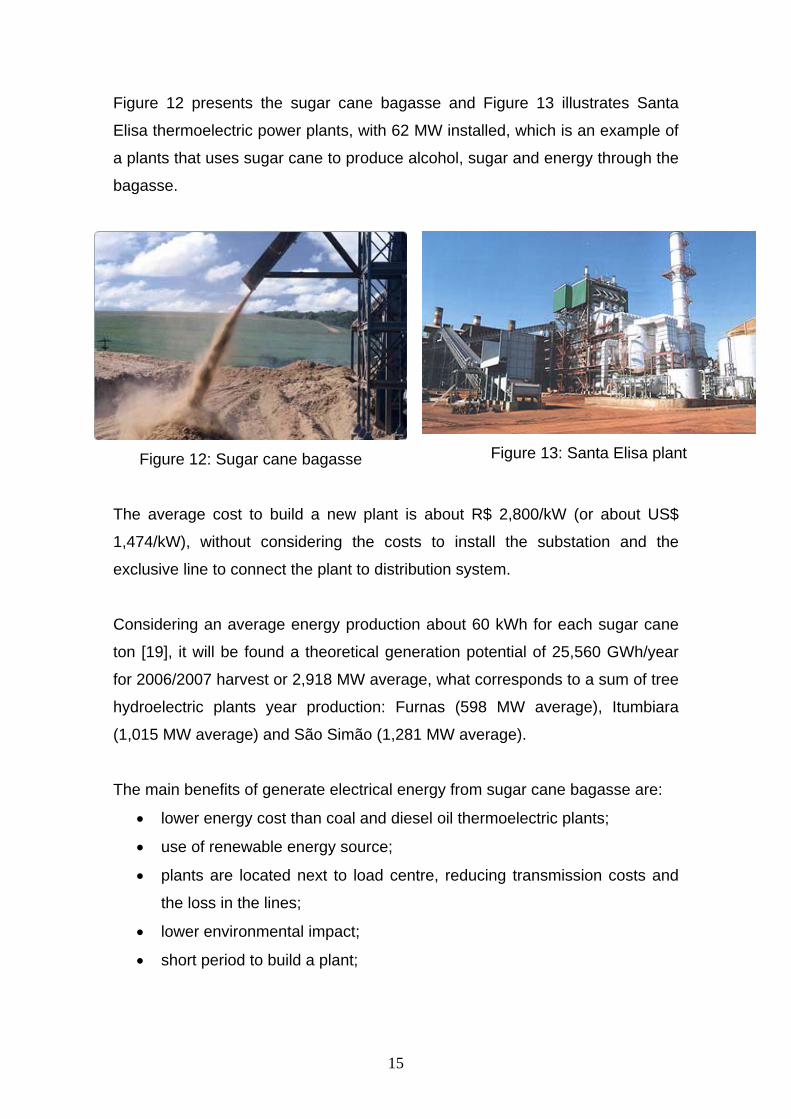
Figure 12 presents the sugar cane bagasse and Figure 13 illustrates Santa
Elisa thermoelectric power plants, with 62 MW installed, which is an example of
a plants that uses sugar cane to produce alcohol, sugar and energy through the
bagasse.
Figure 12: Sugar cane bagasse
Figure 13: Santa Elisa plant
The average cost to build a new plant is about R$ 2,800/kW (or about US$
1,474/kW), without considering the costs to install the substation and the
exclusive line to connect the plant to distribution system.
Considering an average energy production about 60 kWh for each sugar cane
ton [19], it will be found a theoretical generation potential of 25,560 GWh/year
for 2006/2007 harvest or 2,918 MW average, what corresponds to a sum of tree
hydroelectric plants year production: Furnas (598 MW average), Itumbiara
(1,015 MW average) and São Simão (1,281 MW average).
The main benefits of generate electrical energy from sugar cane bagasse are:
• lower energy cost than coal and diesel oil thermoelectric plants;
• use of renewable energy source;
• plants are located next to load centre, reducing transmission costs and
the loss in the lines;
• lower environmental impact;
• short period to build a plant;
15
• as the harvest period is from April to November, which is the same
period of lower outflows to hydroelectric reservoirs, it is a great
opportunity to use this type of plants to complement the energy
generation.
2.1.5 Wind Power [1], [2], [18]
Wind power is a complementary energy source to conventional ones (hydraulic
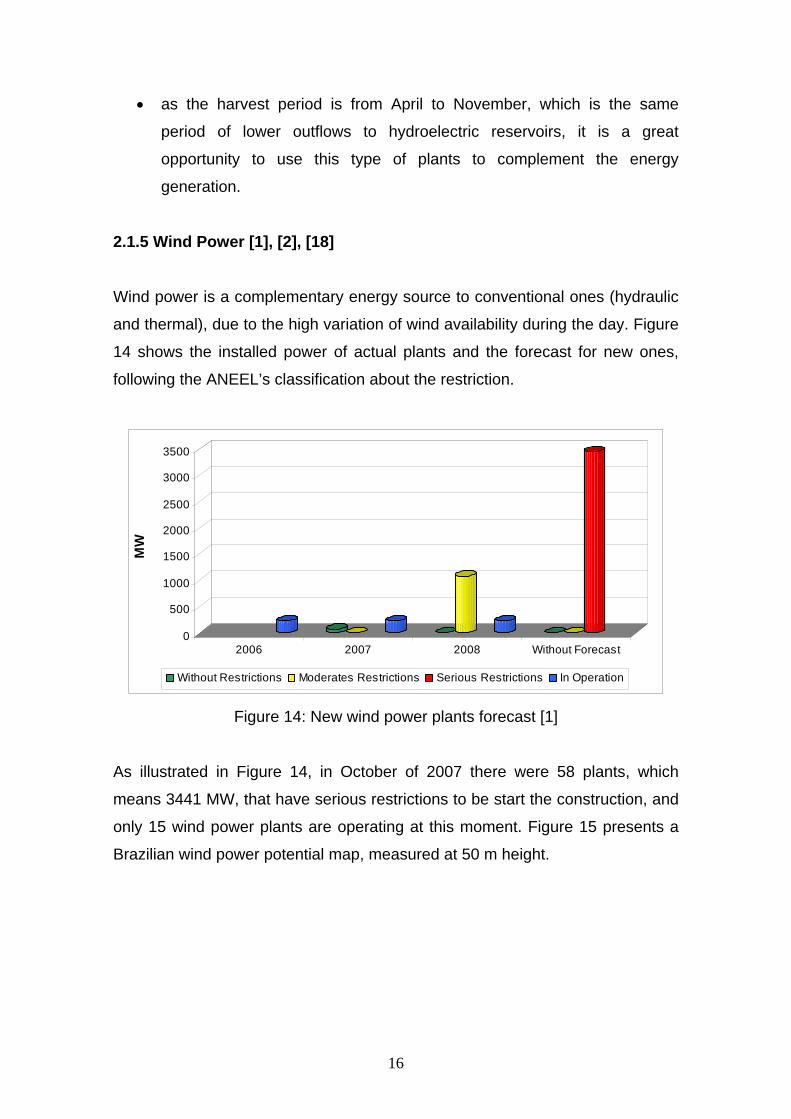
and thermal), due to the high variation of wind availability during the day. Figure
14 shows the installed power of actual plants and the forecast for new ones,
following the ANEEL’s classification about the restriction.
0
500
1000
1500
2000
2500
3000
3500
MW
2006 2007 2008 Without Forecast
Without Restrictions Moderates Restrictions Serious Restrictions In Operation
Figure 14: New wind power plants forecast [1]
As illustrated in Figure 14, in October of 2007 there were 58 plants, which
means 3441 MW, that have serious restrictions to be start the construction, and
only 15 wind power plants are operating at this moment. Figure 15 presents a
Brazilian wind power potential map, measured at 50 m height.
16

Figure 15: Brazilian wind power potential [22]
According to Figure 16 Brazilian Northeast region has the major wind power
potential with 75 GW, or 52% of all. On the other hand, the Center-West has the
lower potential of the country with 3.1 GW.
Additionally, wind incidence on Northeast region is higher during the period of
lower outflows to hydroelectric reservoirs on São Francisco River, which
responds for 98% of all region generation.
The average cost to build a new plant is about R$ 2,000/kW (US$ 1,053/kW),
without considering the costs to install the substation, build an exclusive line to
connect the plant to distribution system and the purchase of the land where all
turbines will be installed.
Besides to avoid turbulence between the turbines and to guarantee the best
performance of the engines, it is necessary to have a reasonable space
between towers, based on shovel diameter (which can reach 80 m). Then it
17
results on a big land to be bought and this cost could be very high, depending
on the installed power of the plant.
The main benefits of wind power plants are:
• use of renewable energy source, without costs and do not produce
pollutant gases;
• lower environmental impact;
• short period to build a plant (about 6 months);
• use the great Brazilian wind power potential, especially on Northeast
region.
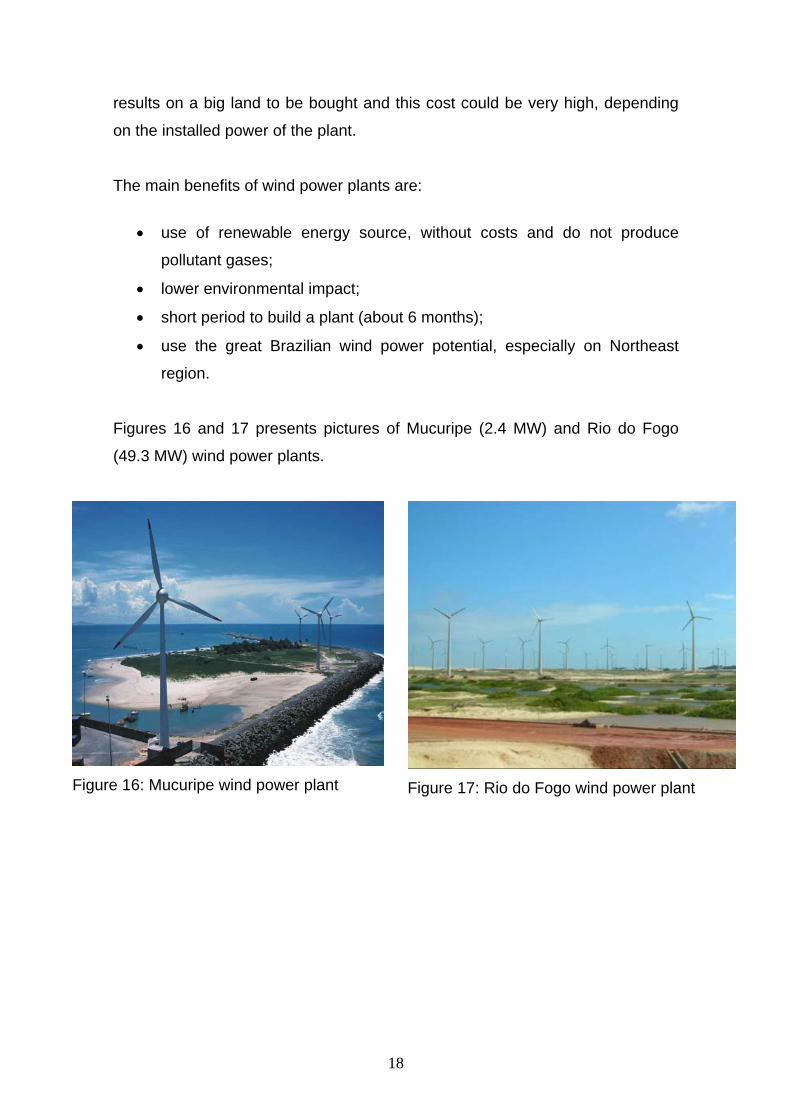
Figures 16 and 17 presents pictures of Mucuripe (2.4 MW) and Rio do Fogo
(49.3 MW) wind power plants.
Figure 16: Mucuripe wind power plant
Figure 17: Rio do Fogo wind power plant
18

3. LEGAL AND REGULATORY INCENTIVES TO DISTRIBUTED GENERATION
3.1 BRAZILIAN NATIONAL PROGRAM FOR DISTRIBUTED GENERATION – PROINFA [23], [24]
Brazilian Federal Law no 10,438/2002 created a national program designed to
stimulate the use of renewable energy resources – Proinfa, especially: Small
Hydroelectric Power Plants – SHPs, biomass and wind power. In addition this
program seeks to reduce greenhouse gas emissions, based on Kyoto Protocol.
Initially the first part of this program aimed to hire 3000 MW in June of 2004,
divided into equal parts among those energy sources, and the plants should be
operating until December of 2006. Furthermore Eletrobrás has contracted each
plant and the energy costs will be transferred to all consumers of interlinked
system throw tariff, except for low income consumers.
Then Federal Law no 10,762/2003 postponed the dead line for December of
2008, and Decree no 5,025/2004, has established more rules for Proinfa. In
addition ANEEL has published the following resolutions detailing the rules and
allowing the program to be done:
• Resolution no 56/2004, established the conditions to those plants
access the transmission and distribution systems;
• Resolution no 62/2004, established the procedures to calculate the
reference energy for distributed generation plants that could be
interested to join Proinfa;
• Resolution no 65/2004, published the reference energy for each plant
that were allowed to participate in Proinfa’s public selection;
• Resolutions no 111/2004 and no 127/2004, defined the procedures for
dividing the energy costs among consumer of all distribution companies
and their respective values.
19

Therefore Eletrobrás has done two public calls for investors who might be
interested to join the first stage of Proinfa, according the following conditions:
i) preferential choice for new enterprises, especially those which had
the oldest environmental licenses;
ii) possibility of contracting the energy that will be produced by the
expansion of actual biomass thermoelectric plant;
iii) the energy price were defined by MME based on Brazilian average
tariff, and all contracts will guarantee the purchase for 20 years;
iv) guarantee of financing by National Bank for Social and Economic
Development - BNDES, which could have reached 70% of total cost;
v) guarantee of full payment for at least 70% of generation by the plant
during the financing period;
vi) enterprises must have at least 60% of national equipments and
services;
vii) Eletrobrás will represent all generators on CCEE, taking all short-run
markets risks when plants generation become inferior to contract
values;
viii) each distributed generation type had limits to be contracted for each
Brazilian State, which was 20% for biomass and wind power and 15%
for SHP, in order to provide development in all regions;
ix) all contracts must have special clause to reduce the energy price if
the generator receive another benefits besides Proinfa, which
includes the carbon credits selling.
Table 1 illustrates the economics values established for each source in June of
2004 and the present values in September of 2007 through IGP-M index.
20

Table 1: Economic Value for Each Energy Source [14]
R$/MWh R$/MWhjun/04 sept/07
SHP 117.02 136.60Maximum price 204.35 238.54Minimum price 180.18 210.32Sugar cane 93.77 109.46Shell of rice 103.20 120.47
Waste of wood 101.35 118.31Landfil gas 169.08 197.37
Source Specification
Wind Power
Biomass
Table 2 presents the main results from Proinfa’s first stage and Figure 18
illustrates the percentage participation of each source on total contracted
power.
Table 2: Results of 1st Proinfa’s Stage [1],[14] Contracted Energy Investment
Power (MW) (GWh/year) (R$ billions)SHP 63 1191 6,541 3.60Wind Power 54 1423 3,72 5.53Biomass 27 685 2,276 1.01Total 144 3299 12,537 10.14
Sources Enterprises
36,1%
43,1%
20,8%
SHP Wind Power Biomass
Figure 18: Participation of each source in Proinfa
According to Table 2 the global contraction goal was reached but there were
not enough interested investors on biomass because the established price for
this type generation was lower than investor’s expectations. Therefore the
biomass goal was redistributed between SHP and wind power, as presented in
Table 2.
21

Figure 19 presents the actual situation of the plants that were included in
Proinfa, showing the perspectives until 2008.
25%
16%54%
5%
Operating 2007 2008 Without forecast
Figure 20: Actual situation of Proinfa’s Power Plants [1]
Based on Figure 20, there can be known that 25% of those plants are already
operating and only 5% present serious restrictions and do not have any
perspectives to be done.
Figure 21, 22 and 23 shows the situation of each energy source inside Proinfa.
61%25%
3%11%
Operating 2007 2008 Without forecast
Figure 21: Proinfa - situation of Biomass Power Plants [1]
22

15%
5%
75%
5%
Operating 2007 2008 Without forecast
Figure 22: Proinfa - situation of Wind Power Plants [1]
13%
23%
64%
Operating 2007 2008
Figure 23: Proinfa - situation of SHPs [1]
In addition Federal Law no 10,438/2002 has forecasted a second stage for
Proinfa which would seeks to reach the following goals: supply 10% of energy
market by distributed generation, 20 years after the conclusion of the first
stage, but there is no regulation about that yet.
Therefore those plants would be contracted for 20 years by Eletrobrás, just like
the first stage, but the price would be established by MME based on weighted
average costs from hydroelectric and natural gas thermoelectric power plants,
which is very different from the first stage rules. At least, it will be demand that
90% of all equipments and services must be national.
23
3.2 OTHERS CURRENT INCENTIVES IN BRAZIL [23], [24], [26], [32]
Beyond Proinfa there are others legal and regulatory incentives for alternatives
energy sources. Therefore there will be presented the main benefits for
enterprises for small plants, fewer than 30 MW, that are classified as SHP or
use wind power, biomass, solar or qualified cogeneration:
50% reduction on distribution or transmission tariff applied to generation
and for consume;
possibility of selling energy for free consumers (which have demands
above 3 MW);
possibility of selling energy for especial consumers (which have
demands above 500 kW on interlinked system and 50 kW on isolated
system);
SHPs do not have the obligation for paying financial compensation to the
cities that might be damaged by theirs small reservoirs, which are not
applied to hydroelectric power plants;
possibility to receive income as subsidy for substituting thermal
generation through diesel oil on isolated system by renewable energy
sources;
possibility for SHPs getting into MRE, which is as mechanism to reduce
the hydrological risks for the participants on interlinked system;
exemption from annual investment on Resource and Development,
which is an obligation for others generation that must apply 1% of their
annual income;
possibility to sell energy on annual public auctions for all distribution
companies, that are promoted by MME and organized by ANEEL;
possibility to sell energy on especial auctions for alternative generation;
possibility to sell energy directly to distribution companies through public
calling, but this type of commercialization are limited to 10% of their
market.
24

3.3 RENEWABLE ENERGY POLICY OF CALIFORNIA [46], [48]
After the energy crisis faced in 2001, California established in 2002 its
Renewable Portfolio Standard Program (RPS), with the goal of increasing the
percentage of renewable energy in the state's electricity matrix to 20 percent by
2017. However, the California Energy Commission (CEC) recommended
accelerating that goal to 2010, and then the goal was increased to 33 percent
by 2020, supported by State's Energy Action Plan.
Table 3 provides a summary of RPS contracts approved by California Public
Utilities Commission (CPUC) since 2002, from California’s three large utilities –
Pacific Gas & Electric (PG&E), Southern California Edison (SCE), and San
Diego Gas & Electric (SDG&E), considering that 2007 data are updated until
may.
Table 3: Contracts Approved by CPUC [48] Year PG&E SCE SDG&E2002 119 MW (4 contracts) 268 MW (5 contracts) 239 MW (15 contracts)2003 44 MW (3 contracts) 687 MW (8 contracts) 40 MW (1 contract)2004 371 MW (6 contracts) - 580 MW (6 contracts)2005 180 MW (7 contracts) 205 MW (11 contracts) 193 MW (6 contracts)2006 219 MW (6 contracts) - -2007 2 MW (1 contract) - -Total 935 MW (27 contracts) 1160 MW (24 contracts) 1052 MW (28 contracts)
Besides, it was created the Emerging Renewable Program (ERP) to help
develop a self-sustaining market for renewable energy systems across
California. Through this program, the Energy Commission provides funding to
offset the cost of purchasing and installing new renewable energy systems
using emerging renewable technologies.
The ERP provides electricity consumers with a financial incentive to install
renewable energy systems on their property. The financial incentive varies
based on system size, technology, and type of installation. The incentive is paid
once the system is installed and operating.
25
The goal of the ERP is to reduce the net cost of on-site renewable energy
systems to end-use consumers, and thereby stimulate demand and increased
sales of such systems. Increased sales are expected to encourage
manufacturers, sellers, and installers to expand operations, improve distribution,
and reduce system costs.
To qualify for an incentive, both the consumer and the renewable energy
system must satisfy a number of requirements. Consumer must receive
electricity distribution service of installation from an electrical utility and the
renewable energy system must utilize an emerging renewable technology, such
as fuel cells (the conversion of sewer gas, landfill gas, or other renewable
sources of hydrogen or hydrogen rich gases into electricity by a direct chemical
process) or small wind turbines (50 kW or less).
The system must also be interconnected to the utility distribution grid, must use
new components that are certified or tested to be reliable, and must come with
a five-year warranty. In addition, the renewable energy system must generate
electricity to supply consumer's load.
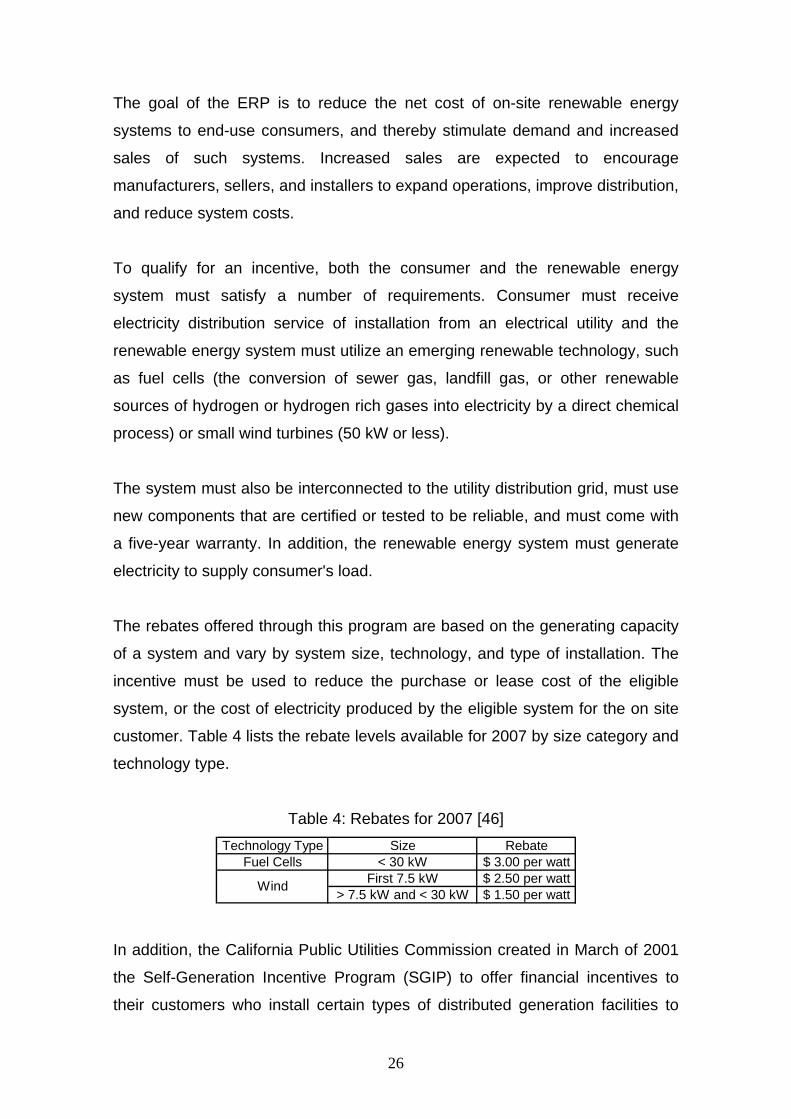
The rebates offered through this program are based on the generating capacity
of a system and vary by system size, technology, and type of installation. The
incentive must be used to reduce the purchase or lease cost of the eligible
system, or the cost of electricity produced by the eligible system for the on site
customer. Table 4 lists the rebate levels available for 2007 by size category and
technology type.
Table 4: Rebates for 2007 [46] Technology Type Size Rebate
Fuel Cells < 30 kW $ 3.00 per wattFirst 7.5 kW $ 2.50 per watt
> 7.5 kW and < 30 kW $ 1.50 per wattWind
In addition, the California Public Utilities Commission created in March of 2001
the Self-Generation Incentive Program (SGIP) to offer financial incentives to
their customers who install certain types of distributed generation facilities to
26

meet all or a portion of their energy needs. SGIP provides rebates for systems
sized up to 5 MW. Generation technologies involved in the SGIP include
photovoltaic (solar) systems, microturbines, fuel cells, and wind turbines.
Table 5 presents the Self-generation program results until September of 2007
per technology.
Table 5: Results per distributed generation technology [50] Number of Power
Plants (MW)Photovoltaic 1150 212.9Fuel Cell 32 21.2Gas Turbine 10 23.1IC Engine 249 161.6Microturbine 140 26.9Wind Turbine 5 3.4Total 1586 449.1
Figure 24 presents the percentile participation of each alternative generation
technology described on Table 5 in the total power that has been installed.
47%
5%5%
6% 1%
36%
Photovoltaic Fuel Cell Gas Turbine IC Engine Microturbine Wind Turbine
Figure 24: Percentile Participation of each Distributed Generation Technology
Table 6 presents the list of the main fuel utilized in those power plants, showing
the number of plants and the total power for each fuel.
27
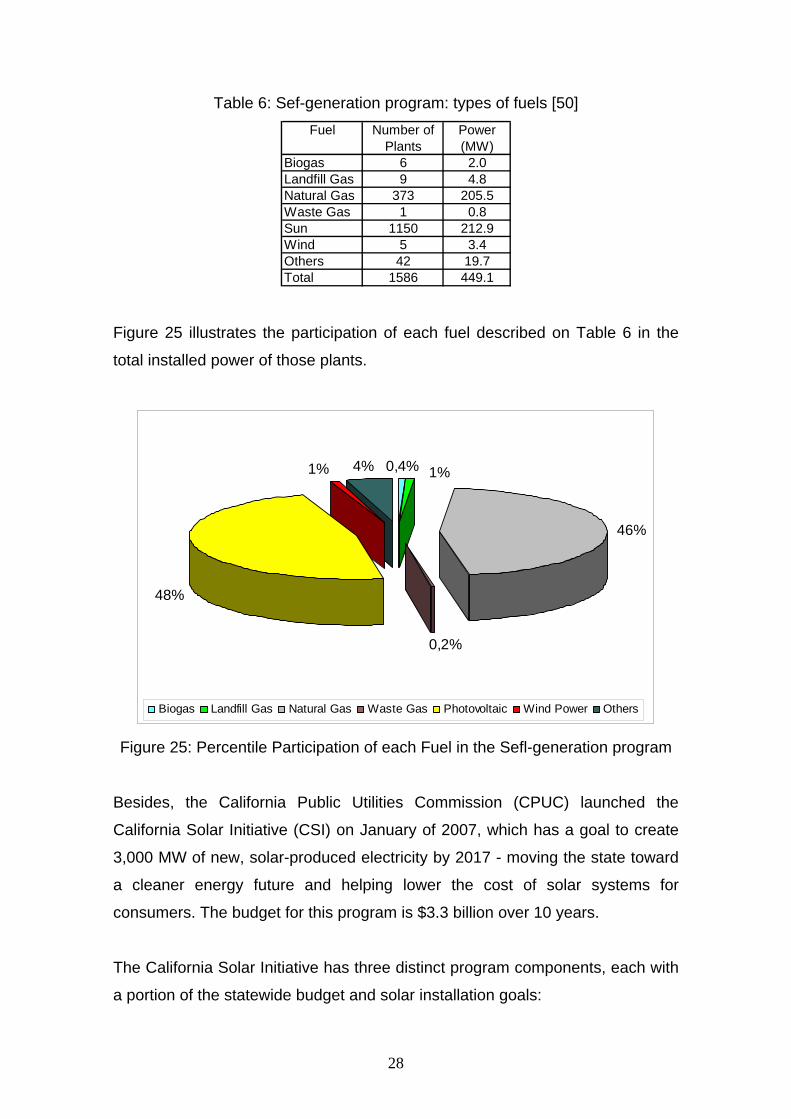
Table 6: Sef-generation program: types of fuels [50] Fuel Number of Power
Plants (MW)Biogas 6 2.0Landfill Gas 9 4.8Natural Gas 373 205.5Waste Gas 1 0.8Sun 1150 212.9Wind 5 3.4Others 42 19.7Total 1586 449.1
Figure 25 illustrates the participation of each fuel described on Table 6 in the
total installed power of those plants.
46%
48%
1% 4%
0,2%
0,4% 1%
Biogas Landfill Gas Natural Gas Waste Gas Photovoltaic Wind Power Others
Figure 25: Percentile Participation of each Fuel in the Sefl-generation program
Besides, the California Public Utilities Commission (CPUC) launched the
California Solar Initiative (CSI) on January of 2007, which has a goal to create
3,000 MW of new, solar-produced electricity by 2017 - moving the state toward
a cleaner energy future and helping lower the cost of solar systems for
consumers. The budget for this program is $3.3 billion over 10 years.
The California Solar Initiative has three distinct program components, each with
a portion of the statewide budget and solar installation goals:
28

• CPUC directs solar incentives to customers of the distribution companies for
existing homes and existing and new commercial, industrial, and agricultural
properties. This program component is allocated $2,167 million over 10 years,
and the goal is to reach 1,940 MW by 2016. This goal includes 1,750 MW from
the mainstream incentive program and 190 MW from the low-income resident
incentive program.
• California Energy Commission advances solar in new home construction,
through its New Solar Homes Partnership. This program component is
authorized $400 million over 10 years, with a goal of 360 MW.
• Each electricity distribution company has to offer an equivalent incentive
program, an aggregate commitment of $784 million over 10 years, toward a
goal of 660 MW.
Therefore Table 7 presents the Gross System Power for 2006, showing the
participation of each electrical energy source and including the amount that was
imported by others states.
Table 7: Gross System Power for 2006 [46]
Fuel TypeCalifornia
(GWh)Import (GWh)
Total (GWh)
Coal 17.573 28.662 46.235Large Hydro 43.088 12.951 56.039Natural Gas 106.968 15.258 122.226Nuclear 31.959 6.191 38.150Renewables 30.514 1.701 32.215
Biomass 5.735 550 6.285Geothermal 13.448 260 13.708Small Hydro 5.788 448 6.236
Solar 616 0 616Wind 4.927 443 5.370
TOTAL 230.102 64.763 294.865
However Table 7 does not include the electricity produced by many small-scale
photovoltaic installations throughout the state which might add another 203.3
GWh, based on Energy Commission's Renewable Energy Program records.
Figure 27 presents the participation of each source in the Electric Energy Matrix
of California, including all the imports.
29
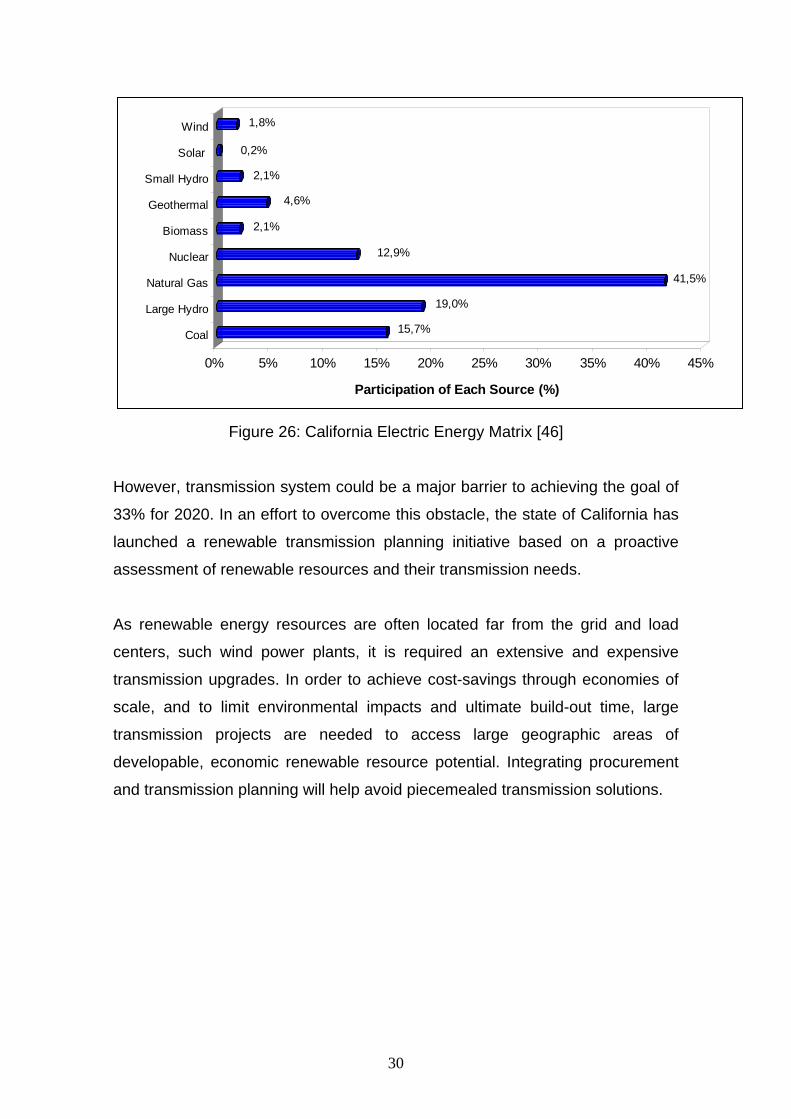
15,7%
19,0%
41,5%
12,9%
2,1%
4,6%
2,1%
0,2%
1,8%
0% 5% 10% 15% 20% 25% 30% 35% 40% 45%
Participation of Each Source (%)
Coal
Large Hydro
Natural Gas
Nuclear
Biomass
Geothermal
Small Hydro
Solar
Wind
Figure 26: California Electric Energy Matrix [46]
However, transmission system could be a major barrier to achieving the goal of
33% for 2020. In an effort to overcome this obstacle, the state of California has
launched a renewable transmission planning initiative based on a proactive
assessment of renewable resources and their transmission needs.
As renewable energy resources are often located far from the grid and load
centers, such wind power plants, it is required an extensive and expensive
transmission upgrades. In order to achieve cost-savings through economies of
scale, and to limit environmental impacts and ultimate build-out time, large
transmission projects are needed to access large geographic areas of
developable, economic renewable resource potential. Integrating procurement
and transmission planning will help avoid piecemealed transmission solutions.
30
4. CLEAN DEVELOPMENT MECHANISM 4.1 INTRODUCTION [15], [36]
Kyoto Protocol, adopted in December of 1997, has established targets for
voluntary reduction of greenhouse gases emissions – GHG (CO2, CH4 e N2O)
for countries listed in Annex I of United Nations Framework Convention on
Climate Change – UNFCCC, which means an average decrease of 5% on 1990
GHG levels to be done among 2008 and 2012.
The Clean Development Mechanism – CDM has been created by article 12 of
Kyoto Protocol to assist the develop countries listed on Annex I in meeting their
GHG emission reduction commitments or removal of CO2, and at the same
time, allowing developing countries (non-Annex) to implement sustainable
projects.
Therefore governs and firms from developed countries can use CDM to invest
in projects that will be done in developing countries seeking to reduce GHG
emissions and get a Certified Emission Reductions (CERs), which are
measured in metric tons of carbon dioxide equivalent (CO2 equivalent).
The CERs represent credits that can be use by countries from Annex I that
have ratified Kyoto Protocol, to achieve part of their GHG emission reduction
targets with lower costs than projects in their own countries.
Then CDM seeks to allow investments in more efficient technologies, in
replacement of fossil energy sources by renewable ones, in rational use of
electric energy, forestation and reforestation, among others possible actions.
Besides CDM Kyoto Protocol has established two additional mechanisms to
stimulate the countries to invest in GHG emission reduction, which are: Joint
Implementation and Emissions Trading. However those mechanisms are
restricted to countries listed in Annex I.
31
Joint Implementation (article 6 of Kyoto Protocol) consists in transference or
acquisition of Emissions Reduction Units (ERUs) from projects that have
reduced human activities emissions in many economy sectors. Therefore it
allows one Annex I country to invest in projects that will be done in another
country listed in Annex I.
On the other hand, Emissions Trading (article 17 of Kyoto Protocol) refers to
carbon credits commercialization among Annex I countries, but not directly
related to any project.
Therefore CDM is the unique mechanism that allows voluntary participation of
developing countries, and Brazil has a huge potential to implement many types
of GHG emission reduction or CO2 removal projects, what can attract the
available resources from developed countries that have difficulties to meet
Kyoto Protocol’s targets.
The CDM project activities, as well as GHG emission reduction or CO2 removal,
have to be submitted to gauge and verification process through the following
institutions:
CDM Executive Board – supervises CDM and has the following
responsibilities: (i) accreditation of Designated Operational Entities; (ii)
registry of CDM project activities; (iii) emission of CERs; (iv) development
and maintenance of CDM registry; (v) establishment and improvement of
methodologies related to baselines, monitoring and leakage.
Designated National Authority (DNA) - certifies that the participation is
voluntary and that project activities contribute to the sustainable
development of the country. DNA in Brazil is represented by
Interministerial Committee for Global Climate Change that is chaired by
Minister of Science and Technology and the vice-Chair is the Minister of
the Environment.
32

Designated Operational Entities (DOE) - domestic or international entities
accredited by the Executive Board and have the following
responsibilities:
a) validate CDM project activities according with the Marrakech
decisions;
b) verify and certify emission reductions and removals of CO2;
c) maintain a public list of CDM project activities;
d) submit an annual report to Executive Board;
e) make information about CDM projects publicly available, unless
deemed proprietary or confidential by project participants.
In order to receive CERs from activities projects there must be done the
following steps of the Project Cycle:
• Preparation of the Project Design Document (PDD);
• Validation/Approval;
• Registration;
• Monitoring;
• Verification/Certification
• Issuance and approval of the CERs
Brazilian Interministerial Committee analyzes the validation report (prepared by
DOE) and the contribution of the project activity for sustainable development of
the country, based on the following criteria:
Income distribution;
Local environmental sustainability;
Work conditions and employment generation;
Qualification and technology development;
Regional integration and connection with others sectors;
33
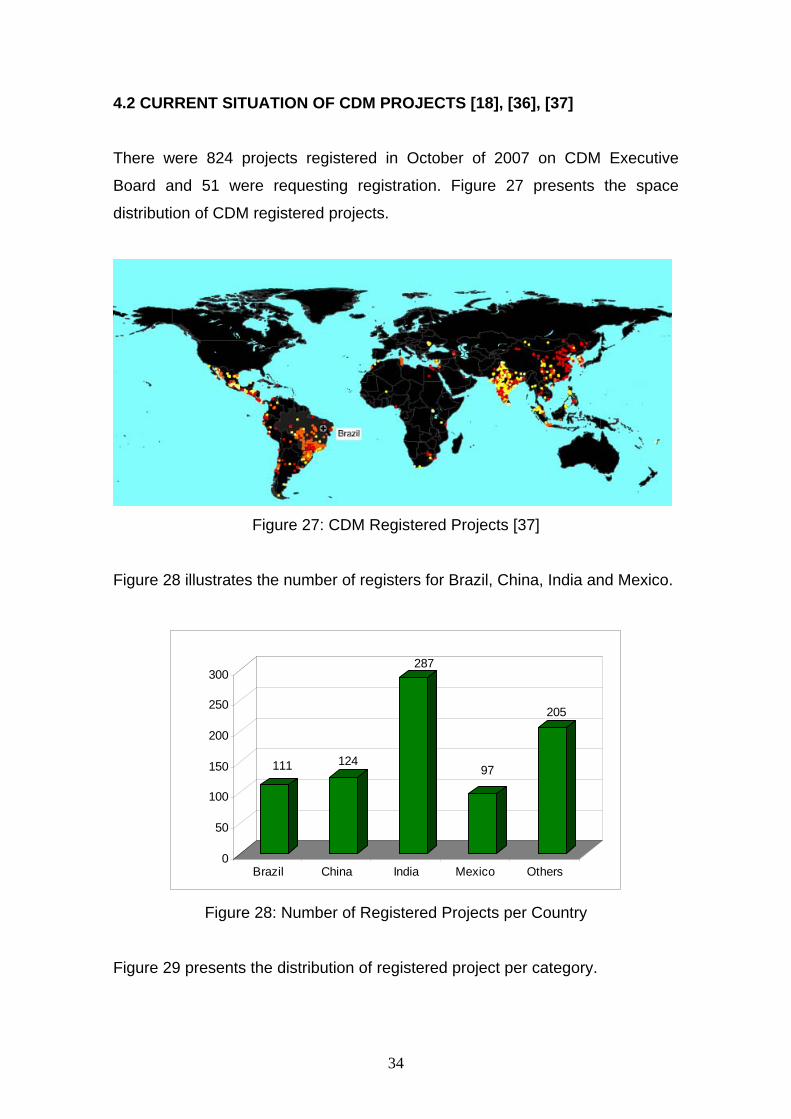
4.2 CURRENT SITUATION OF CDM PROJECTS [18], [36], [37]
There were 824 projects registered in October of 2007 on CDM Executive
Board and 51 were requesting registration. Figure 27 presents the space
distribution of CDM registered projects.
Figure 27: CDM Registered Projects [37]
Figure 28 illustrates the number of registers for Brazil, China, India and Mexico.
111 124
287
97
205
0
50
100
150
200
250
300
Brazil China India Mexico Others
Figure 28: Number of Registered Projects per Country
Figure 29 presents the distribution of registered project per category.
34

1
81
15 14
568
85
16
66
5 1
223
0
100
200
300
400
500
600Afforestation and reforestation
Agriculture
Chemical industries
Energy demand
Energy industries
Fugitive emissions from fuels
Halocarbons and sulphurhexafluorideManufacturing industries
Mining/mineral production
Transport
Waste handling and disposal
Figure 29: Types of Registered Projects
According to Figure 29 projects in Energy Industries area, which are focus on
renewable and non-renewable energy sources (but less pollutant), represent
53% of all registered projects.
In October there were 245 projects passing through validation/approval process
on Brazilian DNA. Figure 30 presents the distribution of these projects per
category.
62,0%
15,5%
11,0%
4,5%
4,1%
2,9%
0,0% 10,0% 20,0% 30,0% 40,0% 50,0% 60,0% 70,0%
Projects
Electric Generation
Pig Production
Sanitary Landfill
Manufacturing Industry
Energy Eff iciency
Others
Figure 30: Brazilian Projects
35

Based on Figure 30, there can be verified that 62% of those projects belong to
Energy Industries category and the annual emission reductions forecasts for
those projects represent about 43.9% of all, as illustrated in Figure 31.
43,9%
5,8%25,8%
5,5%
0,2%
18,8%
Electric Generation Pig Production Sanitary LandfillManufacturing Industry Energy Efficiency Others
Figure 31: Percentage of Gases Emission Reduction
On the other hand, it is quite expensive to submit a project for DNA validation
and get thought the others steps, including receive a certification from DOE and
finally obtain the CER, what can make a project impracticable. The estimated
cost for a CDM project varies between US$ 250,000 and US$ 300,000.
Nevertheless the price of each CER avoided for the project, or tCO2 equivalent,
can reach attractive values for the enterpriser, depending on carbon market
situation. For example, the average prices for contracts that were done in May
of 2007 and will be running in 2008 were about €20.00/tCO2 equivalent on
European Climate Exchange.
Based on this price there can be used as an example the SHP Passo do Meio,
with 30 W and an estimated annual generation of 156,204 MWh, which project
were approved on CDM Executive Board, can avoid about 43,472 tCO2
equivalent/year and could receive €869,440 for annual income, as a result of
selling carbon credits.
36

Additionally, an real example of well done CDM project is the Bandeirantes
sanitary landfill in São Paulo, which generate energy with the methane gas
produced by the landfill, has sold 808,450 CERs for a Dutch Bank through an
auction lead by Bolsa de Mercadorias e Futuros (BMF) from São Paulo and will
receive R$ 34 millions, or €16.20/tCO2.
Considering a contract with an average period of 10 years for CDM projects,
and depending on the amount of CER of each enterprise and their prices, the
higher costs for getting the project certification could be recovered very fast,
resulting on additional and interesting incomes for those plants.
Finally, Brazilian projects included in Energy Industries area totalize 2,634 MW
of installed power and are distributed among several energy sources, as
presented in Figure 32. Especial emphasis must be done to biomass projects
and their huge potential to obtain an additional income from carbon credits sells.
1384
528
310 310
102
0
200
400
600
800
1000
1200
1400
1600
Pow
er (M
W)
Biomass SHP Hydroelectric Wind pow er Biogas
Figure 32: Installed Power by Source
37
5. ENERGY AUCTIONS [25], [28]
The New Institutional Model of Brazilian Electric Sector were introduced by
Federal Law no 10,848/2004, and regulated by Decree no 5,163/2004, which
changed significantly the rules of energy commercialization through the creation
of two distinct frameworks:
• Regulated Contracting Environment (RCE)
• Free Contracting Environment (FCE)
5.1 REGULATED CONTRACTING ENVIRONMENT (RCE) [38]
This environment concentrates all public energy purchases and selling from
distribution companies (buyers) and generators (sellers). Distribution companies
are only allowed to buy energy from regulated environment and must supply
100% of their markets. On the other hand, generators must guarantee 100% of
electricity, with their own production or buying contracts.
Therefore all distribution utilities have to sign a power purchase agreement
(PPA) with all sellers (generators), through Brazilian Electric Power
Commercialization Chamber (CCEE) supervising.
At this environment generators will assume all hydrological risks on energy
delivery contracts and distribution companies will answer for all risks on energy
availability contracts, which will be, in consequence, transferred for their
consumers through regulated tariff.
As distribution companies can only purchase energy through public auctions,
except for bilateral contracts that were celebrated before Federal Law no
10,848/2004, and the compulsory annual acquisition of Binational Itaipu’s
energy for South, Southeast and Center-West regions, ANEEL promotes three
types of auctions that are executed by CCEE:
38
Energy from Existing Power Plants;
Energy from New Power Plants;
Energy Adjustment (only for existing power plants).
New power plants do not have a public authorization before the auction or an
existing plant can receive this classification in a very particular case,
considering only the new generation unit, which represents the installed
capacity increase of this unit.
The total energy amount to be auctioned and the list of hydroelectric and
thermoelectric power plants that would able to participate the auction are
defined by MME, based on market forecasts made by distribution utilities and
on planning studies made by Brazilian Researching Energy Company (EPE).
5.2 FREE CONTRACTING ENVIRONMENT (FCE) [38]
This environment concentrates energy purchase and selling through bilateral
contracts, among generators, energy retailers, free consumers, with freedom to
negotiate their prices and contracts period, but without distribution utilities
participation.
In Brazil free consumer must have at least 3 MW of demand, and since 1995,
the new one can be attended by any tension level and choose other energy
supplier, different from local distribution company.
In addition consumers with installed power between 500 kW and 3000 kW can
also be included in FCE, although they have to buy energy directly from
renewable sources, like SHPs, biomass, wind power and solar or buy it from a
retailer, which has to guarantee that this energy belongs to renewable sources.
Generators can sell their assured energies in FCE through the following
options:
39
exclusives selling auctions for free consumers or purchasing auctions
organized by consumers;
auctions or public calls for others sellers (to cover their contracts).
5.3 ELECTRIC ENERGY CONTRACTING [38]
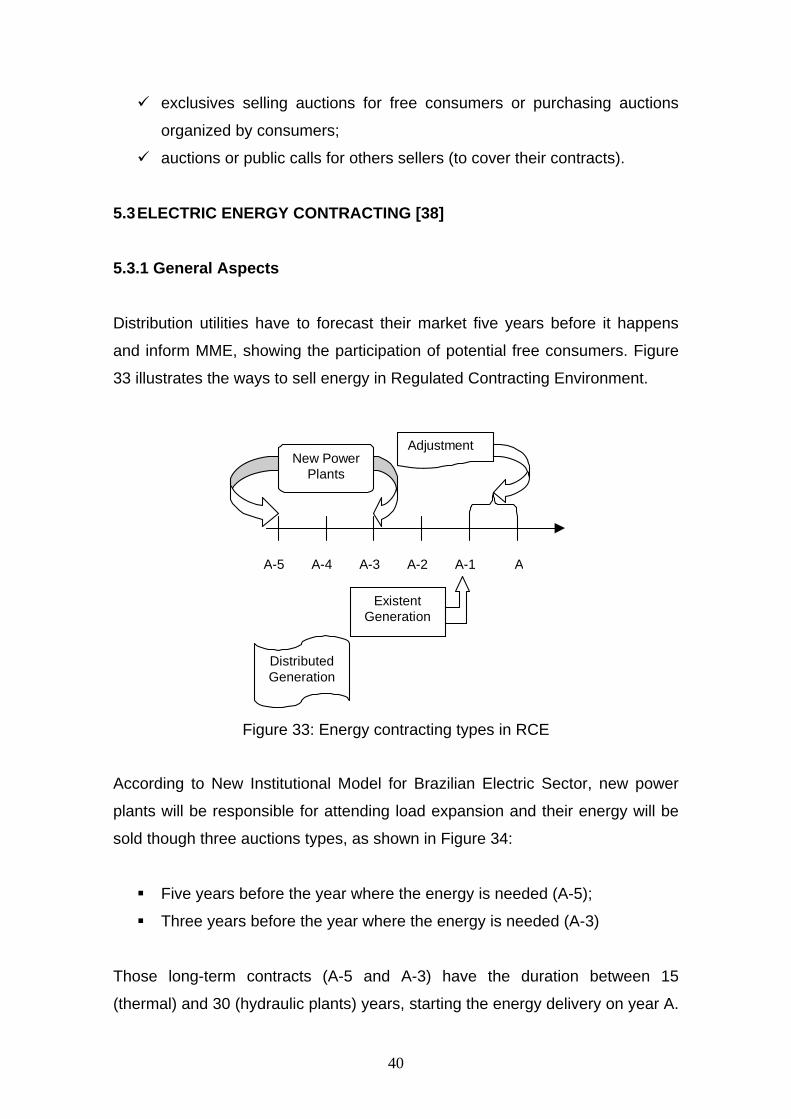
5.3.1 General Aspects Distribution utilities have to forecast their market five years before it happens
and inform MME, showing the participation of potential free consumers. Figure
33 illustrates the ways to sell energy in Regulated Contracting Environment.
A-5 A-4 A-3 A-2 A-1 A
Existent Generation
DistributedGeneration
New Power Plants
Adjustment
Figure 33: Energy contracting types in RCE
According to New Institutional Model for Brazilian Electric Sector, new power
plants will be responsible for attending load expansion and their energy will be
sold though three auctions types, as shown in Figure 34:
Five years before the year where the energy is needed (A-5);
Three years before the year where the energy is needed (A-3)
Those long-term contracts (A-5 and A-3) have the duration between 15
(thermal) and 30 (hydraulic plants) years, starting the energy delivery on year A.
40
41
For the first case, distribution companies will be allowed to pass all energy
acquisition costs to consumers. But for energy contracted in A-3 auctions,
distribution companies will only receive for all purchase costs if the limit of 2%
their energy market would be respected.
The existing energy contracting, which involves plants that were generating in
the year 2000, will also be done by public auctions with duration between 3 and
15 years, delivering the energy on January of the following year.
At least the energy adjustment auctions will be done to complement a small part
of distribution market foreseen for year A and that were not covered by the
others auctions, limited to 1% of total load.
This auction will be done in year A with a participation of public generators,
independent generators and retails as sellers, considering that all contracts
would have up to 2 years of duration and the delivery must start in 4 months.
5.3.2 Auctions Done After 2004 [1], [39], [40]
After Law no 10,848/2004 and until October of 2007, there were 5 existent
energy auctions, 6 adjustments auctions, 5 new power plants auctions and 1
exclusive auction for renewable energy sources.
Therefore the first ones existent energy auctions negotiated huge energy
amounts, because it was necessary to re-contract energy for all current market.
On the other hand, the quantity of energy that were sold in new power plants
auctions was lower, once the objective was to attend market rise forecasts for
following years. In addition, as adjustment auction aims to attend less than 1%
of distribution market the negotiated amount were very modest.
Tables 8 and 9 present the main results of the main auctions.

Table 8: Summary of 5 Existent Energy Auctions
Number of ContractSellers Period Number Average Price Number Average Price Number Average Price Number Average Price Number Average Price
(years) of Lots R$/MWh of Lots R$/MWh of Lots R$/MWh of Lots R$/MWh of Lots R$/MWh18 8 9054 57.51 6782 67.33 1.172 75.4616 8 1325 83.13 0 -13 3 102 62.9515 8 1166 94.916 8 204 104.74
Offered Products2005 2006 2007 2008 2009
Table 9: Summary of 5 New Power Plant Auctions
Date of Power Plant New Existent Plant or Contractthe Auction Type Plants with ANEEL's Period Number Average Price Number Average Price Number Average Price Number Average Price Number Average Price
Authorization (years) of Lots R$/MWh of Lots R$/MWh of Lots R$/MWh of Lots R$/MWh of Lots R$/MWhHydroelectric 7 15 30 71 106.95 46 113.89 891 114.83
Thermoelectric 6 23 15 561 132.26 855 129.26 862 121.81Hydroelectric 0 15 30 1.028 126.77
Thermoelectric 11 5 15 654 132.39Hydroelectric 2 4 30 569 136.2
Thermoelectric 7 2 15 535 137.44Hydroelectric 0 0 30 - -
Thermoelectric 11 1 15 1304 134.67Hydroelectric 5 30 715 129.14
Thermoelectric 4 1 15 1597 128.3710/16/2007
12/16/2005
2008 2011
6/29/2006
10/10/2006
2009 2010Offered Products
7/26/2007
2012
42

An energy lot that were negotiated, as shown in tables 8 and 9, corresponds to
1MW average, or 8760 MWh per year, and the prices are referred to time of
each auction without any monetary correction.
With respect to existent energy auctions, as the sellers were the old
hydroelectric plants owners which were aimed to re-contract their energy
amount the final prices were relatively low, because those enterprises have
their construction cost already amortized. In addition, these auctions resulted on
energy delivery contracts and generators have taken all hydrological risks.
For new power plants auctions there were signed energy quantity contracts for
generators, which uses hydraulic source and energy availability contracts for
thermal generators.
According to the rules thermoelectric plants receives a fix income every month,
as insurance, and if they would be called by ONS to produce energy, because
the water price has reached their energy cost, they will even receive extra
money for paying their operational costs. So all consumers will take this risk
from distribution companies and pay for these expensive generations in order to
support the load supply through national interlinked electric system.
As presented in Table 9, on the 1st new power plant auction it was sold energy
from 7 biomass plants, with 31 lots to 2008 and 66 lots to 2009. On the 2nd
auction it was sold only 1 lot from 1 SHP and 60 lots from 5 biomass plants.
Besides, the 3rd auction negotiated 61 lots from 4 biomass plants.
The 4th auction has sold only thermal products for delivery in 2010 (1304 lots)
and without any biomass plant, but just oil fuel that will receive for their
availability to increase the system security.
43
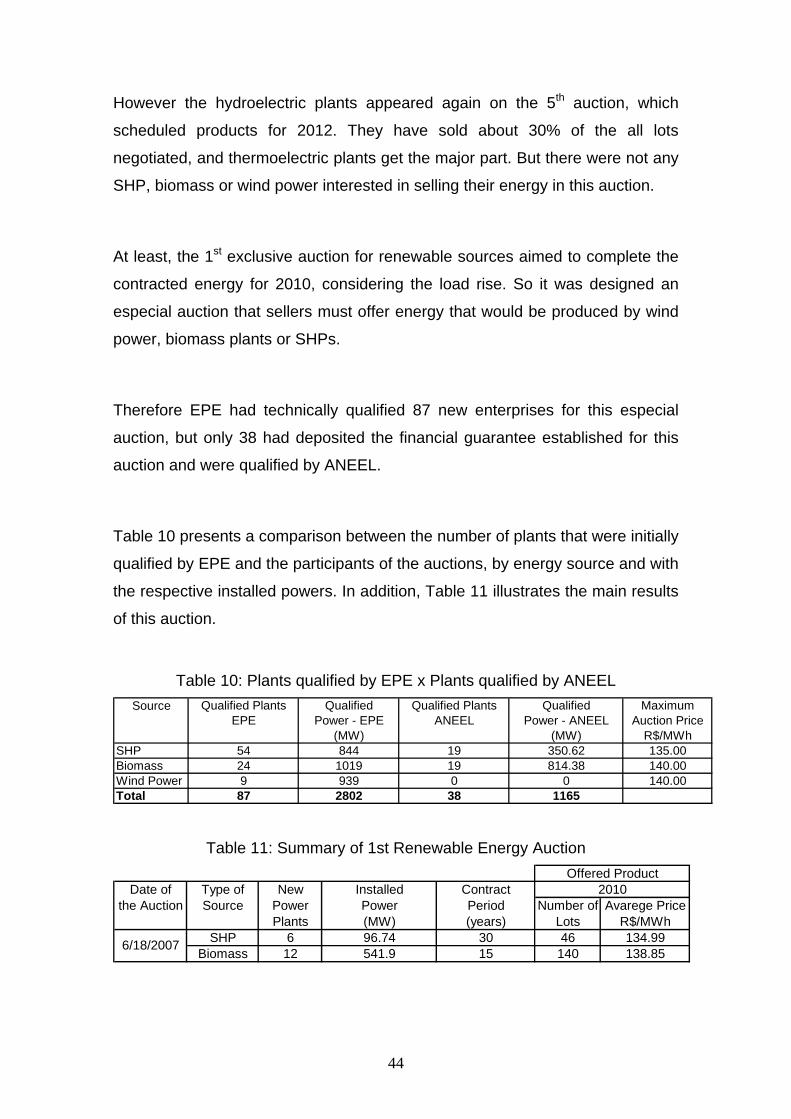
However the hydroelectric plants appeared again on the 5th auction, which
scheduled products for 2012. They have sold about 30% of the all lots
negotiated, and thermoelectric plants get the major part. But there were not any
SHP, biomass or wind power interested in selling their energy in this auction.
At least, the 1st exclusive auction for renewable sources aimed to complete the
contracted energy for 2010, considering the load rise. So it was designed an
especial auction that sellers must offer energy that would be produced by wind
power, biomass plants or SHPs.
Therefore EPE had technically qualified 87 new enterprises for this especial
auction, but only 38 had deposited the financial guarantee established for this
auction and were qualified by ANEEL.
Table 10 presents a comparison between the number of plants that were initially
qualified by EPE and the participants of the auctions, by energy source and with
the respective installed powers. In addition, Table 11 illustrates the main results
of this auction.
Table 10: Plants qualified by EPE x Plants qualified by ANEEL
Source Qualified Plants Qualified Qualified Plants Qualified MaximumEPE Power - EPE ANEEL Power - ANEEL Auction Price
(MW) (MW) R$/MWhSHP 54 844 19 350.62 135.00Biomass 24 1019 19 814.38 140.00Wind Power 9 939 0 0 140.00Total 87 2802 38 1165
Table 11: Summary of 1st Renewable Energy Auction
Date of Type of New Installed Contractthe Auction Source Power Power Period Number of Avarege Price
Plants (MW) (years) Lots R$/MWhSHP 6 96.74 30 46 134.99
Biomass 12 541.9 15 140 138.856/18/2007
2010Offered Product
44

As presented in Table 11 there were negotiated only 186 energy lots for 2010,
which corresponds to 18 new small plants with 639 MW. Among them there are
115 lots for sugar cane biomass and 25 lots for animal waste biomass. Besides,
the final price of each product was very close to its initial value, which means
that there was not much competition among the few investors.
Finally the result of this auction had frustrated the market expectations,
especially when compared with the number of enterprises qualified by EPE, and
the distribution company demand (989 MW) [45]. Besides none of the wind
power plants had deposited the auction guarantee, which represented a lost of
939 MW from dispute, and the SHPs and biomass participation were inferior to
their potential.
45
6. INVESTORS’ RISKS VERSUS CURRENT OPPORTUNITIES
As presented in Chapter 1, Brazil has a huge potential to produce electric
energy through renewable sources, especially hydroelectric, wind power and
biomass, but they are not completely explored.
The following items will evaluate the main risks and current opportunities that
renewable energy investors face, with particular attention to SHP, wind power
and sugar cane biomass.
6.1 SHPS RISKS
In November of 2007 there were 174 enterprises that have already received
ANEEL’s authorization but have not started building the plants, which would
represent 2,607 MW of installed power.
As presented in Chapter 1 it is necessary about 18 to 24 months to build a SHP,
which is much less than the time for a hydroelectric power plant (5 years).
Besides, the environmental impacts are lower too, which gives more velocity on
the environmental process to obtain the enterprise license, reducing the costs
and minimizing the risks of construction delays.
With respect of plant financing, BNDES has an especial credit line for
renewable energy projects and has guaranteed financing for all Proinfa’s plants.
Similarly the Bank of Brazil offers financing for generation enterprises, reducing
the investors’ risk.
On the other hand some enterprises face problems to connect their power plant
to distribution grid. The ANEEL’s Authorization Act defines the connection point
of the plant at a specific distribution line, and according to current rules the
entrepreneur has to pay for its exclusive use line construction until the
connection point, including the protection and measure equipments.
46
However if would be necessary to reinforce the current line, the distribution
company must pay for that and these costs will be incorporated to their asset,
which means that their consumers will pay through tariff.
In case of having conflicts between the plant owner and the distribution
company about the definition of connection point and its costs, ANEEL could be
asked to mediate the situation.
Another point that usually gives many doubts to investors is the tariff of
transport that plants have to pay, especially the current incentives, which were
presented in Chapter 2 the main legal and regulatory incentives, including the
reduction at least 50% on those values for SHP, wind power and biomass
generators and for free consumers who have purchased from these alternatives
energy sources.
In addition, the average energy cost for a SHP is about 114 R$/MWh [44],
which is inferior to the final prices of new power plants auctions and the 1st
exclusive auction for renewable sources, as presented in Chapter 4. When
compared to the prices that were contracted in Proinfa, the average energy cost
is still lower.
Besides Proinfa and energy auctions guarantee long-term contracts of 20 and
30 years for SHP, respectively, what give conditions to obtain lower tax in
financing and guarantee cash flow during the contract period, reducing the
investors’ risk.
On the other hand, the Free Contracting Environment (FCE) has become an
attractive market for generators, especially because of free consumers
increased in the last years and answer for 18% of interlinked system consume.
Then despite energy price variation in short run market and the fact that those
contracts duration are shorten than Regulated Contracting Environment (RCR),
there are good opportunities in FCE.
47
Finally, as shown in Chapter 3, Clean Development Mechanism can provide an
extra income for renewable energy projects for approximately 10 years, through
the carbon credits sale that were obtained from the enterprises.
However there are many SHPs that have been authorized by ANEEL to change
their society control lately and there is a great number of plants that have
received ANEEL’s authorization many years ago, but have not even started the
construction.
Therefore, based on the information presented in this study, there might be
inferred that there are sufficiently legal and regulatory incentives to turn SHP
investment viable in Brazil. Besides, ANEEL is analyzing carefully the possibility
to annul the authorizations of all enterprises that have not started plant
construction yet and even have no perspective to begin it.
6.2 RISKS FOR BIOMASS POWER PLANTS
The average energy cost for a thermoelectric power plant that uses sugar cane
bagasse is about R$ 110/MWh for new plants and R$ 138/MWh for old plants
that need retrofit [44]. Then the enterpriser will only sell his product if the offer
were higher than his production costs.
Based on the results of Proinfa (Chapter 3) and the 1st auction for renewable
energy sources (Chapter 5), it might be inferred that the maximum selling prices
established by MME for biomass were not very attractive to enterprisers,
because they could not cover their production costs.
On the other hand, a simple analyze of the sugar cane harvest rise in the last
years (Chapter 1) and the great interest in installing turbines in their alcohol and
sugar plants to produce electric energy indicate that energy market became
very attractive to these investors, offering good business perspectives.
48
Besides investors have the opportunity to insert their biomass power plants in
CDM projects and receive an extra income from carbon credits sale that were
obtained from the enterprises.
It should be pointed out that those plants have lower environment risks,
because the occupied area is reduced and most of them adopt special
procedures to treat their wastes and minimize the environment impacts.
In addition, similarly to SHP, BNDES has a specific financing credit line for
biomass power plants, which reduce the financing risks for investors. Also there
are others incentives for those plants, such as the discount of at least 50% on
energy transport tariffs for generators and for free consumers who have
purchased their energy, as presented in Chapter 2.
Therefore, based on all information presented in this study, there might be
inferred that biomass power plants risks can be managed and mitigated
especially for sugar cane bagasse. Then the maximum established price for this
source in the auctions might be limiting the expansion of these plants, or the
investors might be planning to sell in FCE and get better prices.
6.3 RISKS FOR WIND POWER PLANTS
As presented in Chapter 1 Brazilian wind power potential is extremely huge
(about 143.5 GW), especially in Northeast region with 75 GW. However the
production cost of this type of plant is still high (about R$ 200/MWh) and
represents the greater barrier to its expansion through the country.
In order to incentive this type of generation Proinfa has established an attractive
price, between R$ 180.18/MWh and R$ 204.35/MWh (in 2004) as presented in
Table 1, and the result was very positive because the initial contracting target
has been exceeded.
But among all rules established, one can be considered crucial because those
enterprises must have at least 60% of national equipments and services, and
49
there are only two national turbine industries in Brazil. So the current
equipments are higher than prices included in the projects and the investors do
not have enough options. Besides, the contracts have stipulated penalties for
construction delays.
Therefore there are real risks for these investors in Proinfa, because they could
have reduced their income and those wind power plants might be considered as
economically non viable.
In addition the new power plants auctions and the exclusive renewable were not
considered interesting by wind power investors, because the established prices
were inferior to Proinfa and even to their average generation costs.
On the other hand, investors have the opportunity to insert their plants in CDM
projects and receive an extra income from carbon credits sale that were
obtained from the enterprises.
Finally to make possible the expansion of wind power plants in the country there
could be created other incentives or better conditions to commercialize their
energy such as an exclusive auction for these enterprises with reasonable
prices or even the implementation of Proinfa’s second stage, but reducing the
demands for national equipments and services.
50

7. CONCLUSION
This study aimed to analyze the current incentives for distributed generation in
Brazil, presenting the main risks and opportunities for investors, with focuses on
biomass, wind power and small hydroelectric power plants (SHPs).
Chapter 2 has presented an overview of Brazilian Electric System, which is
based on renewable energy sources, emphasizing the benefits of distributed
generation and describing the main characteristics of each source, pointing out
their growth potential and their average building costs.
Chapter 3 has presented the legal and regulatory incentives that were created
to stimulate the expansion of distributed generation in Brazil, detailing Proinfa
and its results already obtained. Besides, it was illustrated the renewable
energy policy of the California State, which was developed after the energy
crisis of 2001, showing their effort to increase the participation of renewable
energy and achieve the goal of 33% state's electricity matrix by 2020.
Chapter 4 has shown the Clean Development Mechanism – CDM, established
by Kyoto Protocol, and presented the current opportunities for energy
generation projects in developing countries (such as Brazil) based on
renewable sources to sell of carbon credits for great companies installed at
developed countries, which have goals for greenhouse gases emissions
reduction in their countries.
Chapter 5 has presented the energy auctions that have been done in Brazil
since 2004, after another change in the Brazilian electric model, showing the
main results, emphasizing the participation of SHPs, biomass and wind power
in those auctions and highlighting the first energy auction for alternative
sources, done in June of 2007.
Chapter 6 has discussed the risks associated to distributed generation
investors, based on all information presented in this study.
51
Therefore, there might be inferred that there are sufficiently legal and regulatory
incentives to turn SHP investment viable in Brazil, and that biomass power
plants risks can be managed and mitigated especially for sugar cane bagasse.
However, there are real risks for investors in wind power, because Proinfa’s
contracts have established a minimum percentage 60% of national equipments
and services in those plants, and as there are only two industries in Brazil for
wind turbines, the cost is higher then it was planned before and those plants
could never be done.
Besides, as the average generation cost for those plants are higher than the
maximum prices for the energy auctions, investors do not feel stimulated to
allocate their resources in those projects.
Thus the great Brazilian wind power potential would probably continue almost
unexplored, and to attend the load increase it would be necessary to invest in
others energy sources that would provoke more environment impacts.
52

8. REFERENCES [1] ANEEL – Agência Nacional de Energia Elétrica, technical information available under http:// www.aneel.gov.br. [2] ANEEL. Atlas de Energia Elétrica do Brasil - 2a Edição. Brasília, 2005. [3] TOLMASQUIM, MAURÍCIO TIOMNO. Alternativas Energéticas Sustentáveis no Brasil. Rio de Janeiro, Relume Dumará, 2004. [4] GUEDES, LARISSA DE MATOS. Localização e Dimensionamento de Unidades de Geração Distribuída em Redes de Distribuição Radiais. Brasília, 2006. Dissertação de Mestrado – Universidade de Brasília. [5] SIMIONI, CARLOS ALBERTO. O Uso da Energia Renovável Sustentável na Matriz Energética Brasileira: obstáculos para o planejamento e ampliação de políticas sustentáveis. Curitiba, 2006. Tese de Doutorado – Universidade Federal do Paraná. [6] ROSA, VITOR HUGO DA SILVA. Energia Elétrica Renovável em Pequenas Comunidades no Brasil: em busca de um modelo sustentável. Brasília, 2006. Tese de Doutorado – Universidade de Brasília. [7] FLORES, EDISON MARQUES. Modelo Probabilístico de Viabilidade de Geração Distribuída em Ambiente Competitivo. São Paulo, 2003. Tese de Doutorado – Universidade de São Paulo. [8] BARJA, GABRIEL DE JESUS. A Cogeração e sua Inserção ao Sistema Elétrico. Brasília, 2006. Dissertação de Mestrado – Universidade de Brasília. [9] MME – Ministério de Minas e Energia. Plano Decenal de Expansão de Energia Elétrica 2006-2015. Brasília, 2006. [10] EPE – Empresa de Pesquisa Energética. Plano Nacional de Energia 2030. Rio de Janeiro, 2006. [11] LORA, ELECTO EDUARDO SILVA & HADDAD, JAMIL. Geração Distribuída. Rio de Janeiro, Interciência, 2006. [12] ONS – Operador Nacional do Sistema Elétrico, technical information available under http:// www.ons.org.br. [13] CERPCH – Centro Nacional em Referência de Pequenas Centrais Hidrelétricas, technical information available under http://www.cerpch.unifei.edu.br/. [14] ELETROBRÁS – Centrais Elétricas do Brasil, technical information available under http://www.eletrobras.com.br.
53
[15] MCT – Ministério da Ciência e Tecnologia, technical information available under http://www.mct.gov.br. [16] MME – Ministério de Minas e Energia, technical information available under http://www.mme.gov.br. [17] Fórum Brasileiro de Mudanças Climáticas, technical information available under http://www.forumclima.org.br. [18] WADE – World Alliance for Decentralized Energy, technical information available under http://www.localpower.org. [19] CENBIO – Centro Nacional de Referência em Biomassa, technical information available under http://www.cenbio.org.br. [20] ÚNICA – União da Indústria de Cana de Açúcar, technical information available under http://www.portalunica.com.br. [21] BOYCE, MEHERWAN P. Handbook for cogeneration and combined cycle power plants. New York, ASME PRESS, 2002. [22] CRESESB – Centro de Referência para Energia Solar e Eólica. Atlas do Potencial Eólico Brasileiro. Brasília, 2001. Available under http://www.cresesb.cepel.br. [23] BRASIL, CONGRESSO NACIONAL. Law no 10,438/02. Diário Oficial, April 26 of 2002. [24] BRASIL, CONGRESSO NACIONAL. Law no 10,762/03. Diário Oficial, November 11 of 2003. [25] BRASIL, CONGRESSO NACIONAL. Law no 10,848/04. Diário Oficial, March 16 of 2004. [26] BRASIL, PRESIDÊNCIA DA REPÚBLICA. Decree no 4,541/02. Diário Oficial, December 23 of 2002. [27] BRASIL, PRESIDÊNCIA DA REPÚBLICA. Decree no 5,025/04. Diário Oficial, March 30 of 2004. [28] BRASIL, PRESIDÊNCIA DA REPÚBLICA. Decree no 5,163/04. Diário Oficial, July 30 of 2004. [29] ANEEL. Resolução Normativa no 56, Diário Oficial, April 6 of 2004. [30] ANEEL. Resolução Normativa no 62, Diário Oficial, May 5 of 2004. [31] ANEEL. Resolução Normativa no 65, Diário Oficial, May 25 of 2004. [32] ANEEL. Resolução Normativa no 77, Diário Oficial, August 18 of 2004.
54

[33] ANEEL. Resolução Normativa no 111, Diário Oficial, November 16 of 2004. [34] ANEEL. Resolução Normativa no 127, Diário Oficial, December 6 of 2004. [35] SUGAI, HÉLIO MITSUO & SANTOS JUNIOR, MILTON FRANCISCO. As Pequenas Centrais Hidrelétricas e os Créditos de Carbono. Revista PCH Notícias & SHP News, no 29, 2006. [36] MCT – O Mecanismo de Desenvolvimento Limpo: Guia de Orientação. Dezembro, 2002. Technical information available under http://www.mct.gov.br/index.php/content/view/3881.html. [37] United Nations Framework Convention on Climate Change. Technical information available under http://unfccc.int/2860.php. [38] CASTRO, MARCO AURÉLIO LENZI. Análise dos Riscos de uma Distribuidora Associados à Compra e Venda de Energia no Novo Modelo do Setor Elétrico. Brasília, 2004. Dissertação de Mestrado – Universidade de Brasília. [39] CCEE – Câmara de Comercialização de Energia Elétrica, technical information available under http:// www.ccee.org.br. [40] EPE – Empresa de Pesquisa Energética, technical information available under http:// www.epe.gov.br. [41] OLIVEIRA, JANAINA GARCIA DE. Cogeração com Bagaço de Cana-de-Açúcar no Estado de São Paulo no Contexto do Mercado Internacional de Créditos de Carbono. XI Congresso Brasileiro de Energia, Rio de Janeiro, 2006. [42] FERREIRA, HENRIQUE TAVARES & FAGÁ, MURILO TADEU WERNECK. Energia Eólica: Políticas Públicas. XI Congresso Brasileiro de Energia, Rio de Janeiro, 2006. [43] SOARES, JEFERSON BORGHETI. O Proinfa e a Inserção de Fontes Renováveis na Matriz Energética Brasileira. XI Congresso Brasileiro de Energia, Rio de Janeiro, 2006. [44] BARROSO, LUIZ AUGUSTO. Energia Elétrica: Perspectivas de Suprimento e Preço. Apresentação realizada na Associação Nacional dos Consumidores de Energia, July of 2007. [45] Instituto Acende Brasil. Monitoramento Permanente dos Cenários de Oferta e do Risco de Racionamento – 2ª Edição, July of 2007. [46] California Energy Commission, technical information available under: http://www.energy.ca.gov
55

56
[47] California Independent System Operator, technical information available under http://www.caiso.com [48] California Public Utilities Commission, technical information available under http://www.cpuc.ca.gov/puc [49] PG&E - Pacific Gas & Electric, technical information available under http://www.pge.com [50] SCE - Southern California Edison, technical information available under http://www.sce.com [51] SDG&E - San Diego Gas & Electric, technical information available under http://sdge.com/index.shtml