Embed Size (px)
Citation preview

1
Fleet Safety Management Practices in Hazmat Transportation:
Challenges in Thailand
Mahaboon J.1, Grzebieta R.H.
1, Friswell R.
1, and Mooren L.
1
1Transport and Road Safety (TARS) Research, University of New South Wales
Abstract
Transportation by land is essential for the distribution of hazardous material (hazmat)
in Thailand and many countries. However, it also represents a significant road safety risk
because of the consequences associated with crashes involving hazmat loads and heavy
vehicles. The aim of this study was to examine current fleet safety management practices
implemented by hazmat carrier companies in Thailand. Hazmat fleet managers completed an
interview about their safety management practices. A preliminary analysis of an empirical
study points to gaps in the practices of carriers, and identifies challenges carriers have
complying with traffic safety regulations.
A total of 32 carriers participated in the study. Examination of safety practices and
policies revealed that most of the carriers perceived driver reinforcement as a successful
practice in managing safe driver behaviour. Driver monitoring using GPS was also chosen as
a good practice to reduce the risk of crashes. However, most carriers failed to implement
important policies, for example, control of hours of service. The study provides an insight into
the deficiencies of safety management in hazmat fleets that are relevant for many countries
concerned with hazmat transport. The findings of this exploratory study should guide
researchers interested in policies and practices to prevent hazmat crashes in Thailand as well
as other countries.
Keywords: Safety management practices, best practices, hazmat transport, fleet safety
1. Introduction
Although considered as a low probability event, crashes associated with hazmat
transport pose a significant road safety risk to human life, property, and the environment
(Brown and Dunn 2007). The US Federal Motor Carrier Safety Administration (FMCSA)
(2001) has estimated that economic losses from a hazmat crash are higher than for a non-
hazmat crash, especially a crash that results in a fire or explosion. The FMCSA has also
reported that for the US the average number of hazmat crashes is 0.32 per million vehicle-
miles. Because of these consequences, hazmat crashes raise serious concerns for all
stakeholders involved in and affected by such traffic (Samuel et al. 2009). The transportation
of hazmat usually occurs in the context of a complex and dynamic institutional environment
(Carnes 1986). Hazmat vehicles are moving risk sources (Bubbico et al. 2004). Routine work
tasks are also essentially carried out without supervisory oversight (Malone 2004) and
completed under time pressure. The combination of all these factors requires hazmat carriers
to play an active role in preventing road crashes and to have a special focus on driver safety.
1.1 Hazmat transport situation in Thailand
Hazmat transport is vital to the Thai economy, underpinning a diverse range of
industries and activities. The use of hazmat in the industrial, agricultural, and public health
sectors has increased rapidly in recent years (Decha 2005, Chartsirisup 2006, Thailand
Environment Institute 2011). As a consequence, hazmat trucks have been appearing on Thai
roads in increasing numbers and are the most dominant mode of hazmat transport
(TransConsult Company Limited 2007, Land Transport Association of Thailand 2009). The

2
Thai Department of Land Transport (2011) has estimated that the total number of registered
vehicles in the country is 28 million, of which the number of general trucks is about 1 million.
10,000 of these trucks are registered to transport hazmat commodities. The same source has
also reported that the current number of hazmat truck drivers is 91,244 (Department of Land
Transport 2011). It is worth noting that there seems to be a disparity between the figures of
hazmat vehicles and drivers. This raises concerns regarding the enforcement of hazmat truck
registration and the validity of the registration system itself. Interestingly, the annual
projected demand for drivers has continued to increase considerably since 2008 (Office of the
National Economic and Social Development Board 2008, Chanthorn 2011). The number of
trucks used for general and hazmat transport has been increasing steadily in recent years and
there are between 50,000 and 70,000 new trucks registered annually, a growth rate of over
10% per year (Chanthorn 2011). Moreover, in 2002, nearly 20 million tons of imported
hazmat was transported from the central port of Bangkok to the industrial regions via several
main national highways. Nowadays, a greater amount of hazmat that is imported, exported,
and produced domestically is transported via Thailand’s national road network (TransConsult
Company Limited 2007).
Given this situation, it can be assumed that the risk of hazmat vehicle crashes is high
and is increasing. Unfortunately, accurate nation-wide statistics on hazmat truck crashes are
not available (Chartsirisup 2006, TransConsult Company Limited 2007). There is no single
federal database maintained by government agencies that records hazmat crashes and related
incidents. The lack of hazmat database management and crash surveillance is one of a number
of critical failings in hazmat road safety management. Moreover, past governmental efforts in
solving and preventing crashes caused by hazmat transport have proved to be inefficient
according to analyses by Waranusantikul (2009) and the Thailand Environment Institute
(2011). These authors agree that some carriers and drivers involved in the transportation of
hazmat may lack responsibility, awareness, and care in the use, distribution, and
transportation of hazmat. Recent studies also report that Thai drivers’ aberrant behaviour,
such as violating road rules or driver errors has been a leading cause of past hazmat crashes
(Chartsirisup 2006, Waranusantikul 2009). To date, there has been only sporadic adoption of
safety interventions in not only hazmat fleets but also general fleets in Thailand
(Waranusantikul 2009, Hazardous Substance Logistics Association 2011).
1.2 Fleet safety management practices: benefits and challenges
The current situation of hazmat transport in Thailand highlights the serious need for
safety management programs within hazmat fleets. It is widely recognised that the
management of safety plays an important part in achieving and maintaining safety standards.
Safety management practices (SMPs) are a vital ingredient of comprehensive safety
management systems. SMPs can influence and shape employees’ attitudes towards the
importance of safety and can contribute to their safe behaviour. SMPs have been found to
have positive effects on increasing driver safety perception (Newnam et al. 2008), driver
safety behaviour (Newnam et al. 2002, DeJoy et al. 2004) and reducing crash rates (Moses
and Savage 1994) in general fleets. Specifically, particular SMPs have been reported to be
associated with positive safety outcomes. For example, Mejza et al. (2003) reported the
effects of driver hiring practices, driver training, and reinforcement activities and Park et al.
(2005) reported positive effects from the control of hours of service.
In highly hazardous workplaces and industries, such as in the distribution of hazmat
commodities, the importance of safety management is even more apparent (Reniers et al
(2005)). While transport of this kind is highly regulated and monitored in developed
countries, in Thailand, SMPs implemented by hazmat carriers are sporadically adopted. The
central legislation (i.e. the Announcement of Dangerous Goods Transport Committee:

3
Dangerous Goods Transportation by Land B.E. 2545 (Hazardous Substance Committee
2002)) designates safety performances to be the responsibility of carriers. The carriers must
manage their drivers to ensure compliance with legal requirements, i.e. driver selection,
restricted routes, working time, speed monitoring, and safety communication. However, the
standards of such mandatory practices are less stringent compared to legislation in highly
regulated countries. The Thai Government’s position is that the carriers are responsible for
putting SMPs into effect to meet such standards. Currently, there have been few interventions
from Thai road safety government agencies to support the carriers regarding the translation of
these requirements into SMPs in a hazmat fleet setting. This raises some difficulties for the
carriers when implementing SMPs. Firstly, the lack of support provided may make carriers
confused as how to establish SMPs and as to which SMPs should be implemented to meet the
requirements. Secondly, implementation of safety interventions often involves substantial
expenditure and resources (Krasus 2005) and the positive impact of an intervention may not
be immediate (Robson et al. 2007). These aspects may discourage carriers from adopting
effective SMPs.
The present study focused on hazmat carriers and aimed to identify particular safety
management practices that have been adopted by hazmat fleets in Thailand. More specifically,
the objectives of the present study were (1) to investigate the current patterns of hazmat fleet
SMPs adopted by hazmat carriers in Thailand and (2) to examine which SMPs were perceived
by hazmat carriers to be associated with good driver safety outcomes. Knowledge of safety
management-related activities performed by hazmat carriers is essential to inform future
analyses e.g. investigating the relationship between SMPs and driver safety outcomes, and the
benchmarking of SMPs with carriers in highly regulated countries.
2. Method
2.1 Study design
The present study was exploratory and survey-based. A cross-sectional survey of a
sample of Thai hazmat carriers was used. Verification of the content validity of the survey
questionnaire was also conducted by Thai experts to ensure coherence of questionnaire items
with respect to the Thai hazmat transport context.
2.2 Participants
The sample unit in this study was a safety management representative with at least 2
years experience in their current position, i.e. a hazmat fleet manager responsible for safety.
This particular person was chosen because they had responsibility for allocating resources to
SMP implementation in a company and also had access to information about specific
practices being carried out in the organisation, including a practice’s effectiveness and
associated difficulties. To recruit the participants, hazmat carriers registered with the Thai
Department of Land Transport were included. Company selection was limited to those that
were located in the four provinces that had the highest amount of hazmat transport activity.
Companies that did not have full contact details were excluded. One hundred (100) carriers
were then randomly selected from the eligible list. An initial letter was sent to the hazmat
carriers, via post, to invite a fleet manager to take part in the study. This was limited to one
representative from each company. A consent form was delivered in person or via mail to
those fleet managers that indicated an interest. The representatives were then contacted to
schedule a time for the questionnaire administration. In total, 32 representatives from 32
hazmat carriers participated in this study.

4
2.3 Measures and procedures
The questionnaire was divided into 2 sections. The first section was self-administered
by the participants. The participants supplied information about the company, e.g. experience,
number of vehicles, type of hazmat, and length of trip. Such information was completed using
either multiple choice or open-ended responses. Participants ticked the choices which best
described their characteristics or supplied a short answer to the open-ended questions.
Section 2 collected information about fleet safety management practices via interview. The participants completed a short, semi-structured interview face-to-face. Open-ended
questions were asked and answers from the respondents were recorded on a paper-based form
by the investigator. Information about current safety management practices adopted by the
fleet was collected. This included information about the SMPs that were perceived by the
fleet managers to best control driver behaviour and reduce crash risk. These questions were
asked without additional prompts and the number of SMPs reported by the participants was
not limited. Factors contributing to the success of SMPs were also noted. The last set of
questions asked about specific SMPs that were important for the hazmat fleet. The
respondents answered whether such SMPs had been adopted by the fleet or not. If so, a
detailed explanation of implementation was also requested.
2.4 Data analyses
Descriptive statistics were used to describe the patterns of carrier characteristics
completed in Section 1. This analysis was performed using the PASW program version 18.0
for Windows. The interview data regarding the implementation of SMPs in Section 2 was
coded and analysed to examine current patterns.
3. Results
3.1 Characteristics of the sample hazmat carriers
A summary of the descriptive characteristics of the sample carriers is presented in
Table 1. The most reported characteristics are highlighted in bold type. Half of the sample
carriers had between 11 and 20 years experience in the hazmat transport industry. Only two of
them (6.25%) had less than 5 years experience. 71.88% of carriers were certified for the
international quality management system standard (ISO 9000 (International Organisation for
Standardization 2011)). Three carriers (9.38%) had achieved the local safety management
system standard (TIS 18000 (Thai Industrial Standards Institute 2011)) and two carriers
(6.25%) had achieved the international safety management system standard (OHSAS 18000
(The Occupational Health and Safety Group 2011)). The most frequent hazmat transported
was flammable liquids at 56.25%, followed by corrosive substances at 46.88%. Just over half
of the carriers used a 10-wheel truck to transport their hazmat. The numbers of hazmat trucks
in fleets were most commonly between 11 and 50 at 40.63 %. The average distance per trip
was 101 – 400 kilometres that were reported by 53.13% of carriers. Lastly, about half of the
carriers had annual fleet vehicle kilometres travelled of less than ten million. Five carriers
(15.63%) did not record this information.
3.2 Patterns of safety management practices
3.2.1 Best SMPs selected by the participants to control aberrant driving behaviours
The sample fleet managers’ perception of the SMPs, implemented in their fleets,
which most effectively controlled aberrant driving behaviour was investigated. The
participants indicated that “driver reinforcement” using incentives/disincentives was the best
SMP at 53.13%. “Driver training” and “supervision and monitoring using GPS” followed at
43.75% each. Figure 1 shows the best SMPs as reported by the participants.

5
Table1 Descriptive characteristics of the sample hazmat carriers
Characteristics n = 32 % Characteristics n = 32 %
- Experience in hazmat transport
industry (years)
< 5
6 – 10
11 – 20
> 20
2
11
16
3
6.25
34.38
50.00
9.38
- Fleet vehicles km travelled (x 106
kilometres)
< 10
11 – 30
> 31
Did not record
17
7
3
5
53.13
21.88
9.38
15.63
- Management system certified a
ISO 9000
ISO 14000
TIS 18000
OHSAS 180000
23
5
3
2
71.88
15.63
9.38
6.25
- Types of hazmat trucks a
4 wheel
6 wheel
10 wheel
More than 10 wheel
Trailer or semi-trailer
3
9
18
8
15
9.38
28.13
56.25
25.00
46.88
- No. of hazmat trucks in fleet
1 – 10
11 – 50
51 – 100
101 – 500
> 501
6
13
3
8
2
18.75
40.63
9.38
25.00
6.25
- Distance per trip (kilometres)
< 100
101 – 400
401 – 700
> 700
8
17
4
3
25.00
53.13
12.50
9.38
- Types of hazmat transported a
Explosives
Gases
Flammable liquids
Flammable solids
Toxic and infectious substances
Radioactive material
Corrosive substances
Oxidizing & organic peroxides
Miscellaneous dangerous
0
10
18
2
2
1
15
1
4
0.00
31.25
56.25
6.25
6.25
3.13
46.88
3.13
12.50
a Participants could choose more than one option, so percentages do not sum to 100%.
3.2.2 Best SMPs selected by participants to reduce risk of vehicle crashes
The participants were asked about the best SMPs they thought reduced the risk of
hazmat truck crashes in their fleets. 56.25% of the fleet managers perceived that "speed
control using GPS" was the most effective SMP to reduce the rate of crashes. The practices
“control of hours of service” and “driver training” were reported at 28.13% each. Figure 2
presents all SMPs reported.
3.2.3 Factors contributing to effectiveness of SMPs
When asked about factors contributing to the effectiveness of SMPs, the participants
reported the two most important factors were “management commitment” and “drivers’
intrinsic safety values”, both at 34.38%. They were closely followed by “communication
within organisation” (Figure 3).
3.2.4 New SMPs to be implemented
This question asked about SMPs that had not been adopted in their own fleet as yet but
that should be introduced to enhance fleet safety. The result is shown in Figure 4. The
majority of the participants indicated that no more SMPs should be implemented in their
fleets. However, a few respondents proposed some other SMPs which they felt were
important such as “emergency response drills with local government and community”, “driver
monitoring on the roadside” and “driver training by private agencies”.

6
3.2.5 Driver hiring practice
The participants were asked whether their fleets adopted a SMP regarding driver
hiring. The answer was recorded as a binary response, i.e. ‘yes’ or ‘no’. All of the carriers that
adopted this SMP provided a detailed description of their practices. Figure 5 presents what
processes are used for driver selection among the sample carriers. All sample carriers reported
complying with the driver selection criteria as required by the legislation, i.e. a minimum age
of 25 years old, particular hazmat driving license, and drug criminal related history checked
with the Police Department. However, other criteria, beyond the legal requirements, were
only sporadically applied. Only 18.75% of the sample carriers used a classroom test for
screening and 25.00% implemented an on-road driving test. Physical check-ups and past
experience were less commonly employed during the recruiting process.
3.2.6 Route analysis and designation
About 72% (23 carriers) of the sample carriers had an SMP focussing on route
analysis and designation. The majority of the carriers that adopted this practice (62.50%)
conducted a route survey and designated the routes for drivers. 28.13% of the sample
considered points/areas for truck stops during the trip and also avoided restricted areas e.g.
tunnel, hazardous intersections, water reservoirs, and highly populated areas (Figure 6).
18.75% of the carriers provided a document called a ‘route card’ for the driver to confirm the
designated route each trip. Very few of them incorporated hazmat route risk assessment as
part of their route analysis and designation practice.
Fig. 4 Number (%) of carriers identifying new SMPs
that should be implemented in fleets
Fig. 3 Number (%) of carriers identifying which
factors contributed to the effectiveness of SMPs
Fig. 1 Number (%) carriers identifying which SMPs are
effective ways to control aberrant driving
behaviour
Fig. 2 Number (%) of carriers identifying which SMPs
are effective in reducing risk of vehicle crashes
behaviour
Fig. 5 Number (%) of carriers identifying characteristics
of driver hiring practice
Fig. 6 Number (%) of carriers identifying characteristics
of route analysis and designation
7
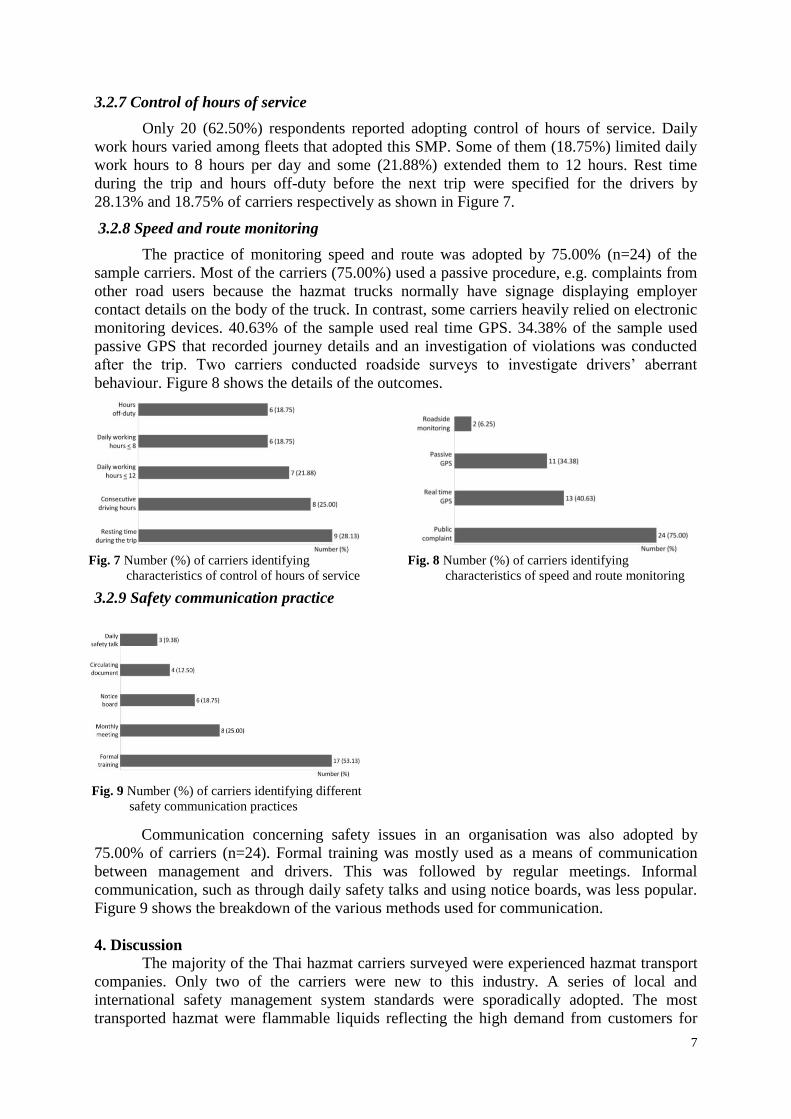
3.2.7 Control of hours of service
Only 20 (62.50%) respondents reported adopting control of hours of service. Daily
work hours varied among fleets that adopted this SMP. Some of them (18.75%) limited daily
work hours to 8 hours per day and some (21.88%) extended them to 12 hours. Rest time
during the trip and hours off-duty before the next trip were specified for the drivers by
28.13% and 18.75% of carriers respectively as shown in Figure 7.
3.2.8 Speed and route monitoring
The practice of monitoring speed and route was adopted by 75.00% (n=24) of the
sample carriers. Most of the carriers (75.00%) used a passive procedure, e.g. complaints from
other road users because the hazmat trucks normally have signage displaying employer
contact details on the body of the truck. In contrast, some carriers heavily relied on electronic
monitoring devices. 40.63% of the sample used real time GPS. 34.38% of the sample used
passive GPS that recorded journey details and an investigation of violations was conducted
after the trip. Two carriers conducted roadside surveys to investigate drivers’ aberrant
behaviour. Figure 8 shows the details of the outcomes.
3.2.9 Safety communication practice
Communication concerning safety issues in an organisation was also adopted by
75.00% of carriers (n=24). Formal training was mostly used as a means of communication
between management and drivers. This was followed by regular meetings. Informal
communication, such as through daily safety talks and using notice boards, was less popular.
Figure 9 shows the breakdown of the various methods used for communication.
4. Discussion
The majority of the Thai hazmat carriers surveyed were experienced hazmat transport
companies. Only two of the carriers were new to this industry. A series of local and
international safety management system standards were sporadically adopted. The most
transported hazmat were flammable liquids reflecting the high demand from customers for
Fig. 7 Number (%) of carriers identifying
characteristics of control of hours of service
Fig. 8 Number (%) of carriers identifying
characteristics of speed and route monitoring
Fig. 9 Number (%) of carriers identifying different
safety communication practices

8
these products. Fleet sizes also varied. However, the majority of the carriers were considered
to be smaller fleets with a fleet size between 1 and 50 vehicles. The distance of transport was
typically a medium haul trip (less than 400 km), followed by a short haul trip (less than 100
km).
From their past experience, the sample fleet managers perceived that the best SMP to
control aberrant driving behaviour (i.e., violations, errors, and lapses and vehicle crashes) was
“driver reinforcement” by means of financial incentive/disincentive and rewards/punishments.
This is in line with findings from prior research that reported relationships between these
SMPs and driver safety outcomes. Zaidel et al. (2002) reported significant relationships
between decreases in the number of crashes for general drivers and three punishment
measures namely, warning letters, penalty point systems, and license revocation. Moses and
Savage (1992) also reported the effect of incentives on occupational drivers. The authors
found a significant relationship between safety incentive programs and the total number of
crashes and injuries for carriers in the trucking industry in the United States. Harrison (2001)
also suggests that rewards are effective to control fleet driver speeding behaviour. The
benefits of driver positive and negative reinforcement, however, are controversial, especially
when sustainable behavioural change is desired. Safety behaviours may continue to occur
only if they are positively reinforced (Harrison 2001) and punished behaviour may return
when the punishment is withdrawn (Staddon 1995). Moreover, driver incentive schemes can
lead to underreported crashes (Murray 2006). Most importantly, the high reporting of this
SMP among the sample reflects the carriers’ preference for an intervention that encourages an
immediate safety response. Some sample carriers voiced the importance of other SMPs, e.g.
“driver training”. This intervention would target a driver’s knowledge and understanding of
safety. In addition, because a driver educated in safety may not always be motivated by the
incentives provided by the employer (Probst and Brubaker 2001), driver training may also be
useful for enhancing drivers’ safety attitudes (Newnam et al. 2008).
A majority of sample carriers utilised driver monitoring using in vehicle technology,
i.e. a GPS (global positioning system) tracking device and thought it was effective to reduce
crash risk. Although this technology is not mandatory and still expensive with respect to its
commercial application in the Thai logistics market, over half of the sample had voluntarily
adopted monitoring using GPS and reported it as the best SMP to reduce crash involvement.
The main reason given was that the GPS is a tool to objectively monitor driving behaviour
that, in turn, is a potential determinant of crashes. According to an analysis of the effects of
in-vehicle data recorders incorporating a GPS receiver by Toledo et al. (2008), fleet drivers
showed statistically significant reductions in crash rates. One of the sample of Thai fleet
managers also suggested that “in the past my drivers never admitted speeding violations even
after several complaints had been lodged by other road users...but they cannot refuse once a
GPS tracker has been installed in their trucks”. Several fleet managers also agreed that a GPS
device offers a number of safety benefits including monitoring route deviations and on-road
driving behaviour, providing real-time feedback and date data for crash investigations.
Another reason that may encourage the carriers to adopt this SMP is that a GPS also offers
commercial benefits, e.g. monitoring of corruption of commodities, and misuse of the
vehicles. Some sample carriers voiced concerns about the limitations of the GPS system, e.g.
network coverage and high operating cost and they expected government involvement to
improve these issues. Also, one of the fleet managers argued that “the downside is that it
makes my drivers feel like they are bad people. Feedback provided in real-time also annoys
and distracts the drivers”.
The factors that the sample fleet managers perceived to be an important contributor to
the success of SMP implementation were equally “drivers’ intrinsic safety values” and

9
“management commitment”. This does not correspond to the best SMPs reported by fleet
managers previously (i.e. “driver reinforcement” and “GPS monitoring”) as those practices do
not deal with drivers’ intrinsic safety values. It can be concluded that, although the fleet
managers realised that driver and management attitudes are crucial, in reality, the practices
that encourage an immediate effect are selected first.
A few carriers requested the involvement of local government units and community
(e.g. fire brigade and hospital) for periodic emergency response drills. Two of the carriers had
a plan to provide recreational areas at the sites for the drivers’ families. A fleet manager said
that “a driver usually brings his family along...sometimes the driver, together with his wife
and kids, sit down under the truck and have lunch”. However, the majority of the fleet
managers asserted that no more safety interventions should be implemented in their fleets.
This is consistent with sporadic adoption of SMPs and somewhat reflects a low level of
enthusiasm for improving fleet safety.
All sample carriers adopted driver hiring practices but only those components that are
stated in the legislation. Although this practice is mandatory, criteria for hiring decisions are
less stringent than the standards required in highly regulated countries. Only minimum age,
type of driving license, and no background of drug criminal-related history are indicated.
Other criteria, e.g. driver health and fitness, are stated merely in general. In the US, a driver
pre-employment program is well established and overseen by the FMCSA. The driver
qualification criteria are specified in the CFR Part 391 (Federal Motor Carrier Safety
Administration 2012) with support guidance provided. The criteria cover general background
of the driver, tests, physical examination, and files and records. A small number of sample
carriers include such criteria for driver selection. Only 4 carriers conducted a physical
examination and only eight conducted road tests. Hazmat routing control is legally required in
Thailand. Nevertheless, almost 30% of the sample carriers had not adopted route analysis and
designation practices. Some fleet managers revealed that their priority was cost saving and the
cheapest transport route was therefore selected. Some carriers just ignored this practice and
only gave the destination to the drivers. No designated route was provided.
Control of hours of service was the least common SMP adopted among the sample
carriers. This finding corresponds to Jiamboonsri’s analysis (2010) that violations of hours of
service regulations by heavy vehicle drivers in Thailand are believed to be common. The
central hazmat legislation does not specify the drivers’ working time. However, the Thai
Labour Protection (No. 2) Act B.E. 2551 specifies the maximum working time per day for a
commercial driver and an employee in any industry (Ministry of Labour 2008). Specifically,
an employer must not allow an employee to work longer than 8 hours per day. If an employee
agrees, the limit of working time may extend to 9 hours per day but must not go over 48 hours
per week. However, details of off-duty hours before the next trip are not specified in any Thai
legislation. Several authors have reported a relationship between driver violations of hours of
service rules and traffic crashes (Jones and Stein 1987, Corsi and Fanara 1988). More
recently, Park et al., (2005) reported that crash risk increased significantly in the 5th
driving
hour and this increase was sustained through to the 10th
driving hour.
Because fleet drivers’ routine work is essentially carried out without supervisory
oversight, driver speeding and deviation from designated routes are of major concern once
drivers depart from the fleet site. The monitoring of driver compliance to speed limits and
route designation is important given that people who are aware of being observed tend to
modify their behaviour (Wouters and Bos 2000). Most of the sample of Thai hazmat carriers
used public feedback, via a telephone number displayed on the vehicles, to monitor their
drivers. The same amount of carriers used real time GPS monitoring and passive GPS
monitoring. This practice could potentially be used to encourage individuals to behave more

10
safely when driving. Lastly, the adoption of an SMP related to safety communication
indicated that formal training was preferred. Informal communication, e.g. daily talk, was less
popular and mainly discussed production-related matters.
5. Limitations
This study presents the findings of a survey of safety perceptions of a sample of
hazmat fleet managers. There are limitations that should be acknowledged when considering
these findings. The study may suffer from self-report subjectivity with respect to the
perceptions associated with the measurement of SMPs. Hence, the perceived best SMPs
indicated in the study should be viewed as preliminary until they can be confirmed by the
respective fleet’s safety performance. Further statistical analysis to investigate the correlations
between SMP implementation and carriers’ safety performance is important to validate the
efficacy of the SMPs. This information could then be useful for hazmat carriers who are
establishing or reviewing their safety management program. Recruitment of the participants in
this study was voluntary and the response rate was only 32%. This raises an issue in that the
participants may comprise only carriers with good safety performance who are more
interested in safety because those carriers who have poor safety performance may tend to
have a general aversion to outside scrutiny. The sample size is also small which limits the
statistical analysis that can be conducted and makes the results vulnerable to the effect of
unusual respondents. Future research with a broader sample of hazmat carriers is important to
confirm the findings of the current exploratory study and provide information to help prevent
hazmat truck crashes in this industry.
6. Conclusion
This study reported findings from a survey conducted to identify current patterns of
safety management practices in the Thai hazmat transport industry. Taken together, the study
findings suggest that the challenges facing hazmat carriers include increasing the adoption of
long term proactive safety interventions and improving the comprehensiveness of SMPs
already adopted. In particular, the study suggested that:
SMPs that encouraged an immediate safety response were preferred by carriers, e.g. driver
reinforcement.
SMPs, related to the active role of the carriers such as control of hours of service and route
analysis and designation, were still only sporadically adopted even though they are legally
required. These SMPs should be targeted to ensure carriers fulfil their legal obligations in
fleet safety management.
Low enthusiasm for new safety interventions among the fleet managers was noted which
was consistent with the pattern of sporadic SMP adoption. This finding raises an issue
regarding safety managers’ perspective on their role in managing safety. Overall, the
results suggest that the carriers would prefer to place the safety responsibilities on drivers
and not seek to implement SMPs that may affect their resources or workloads.
The components of each SMP in several fleets were also inadequate in regards to the Thai
and international standards, e.g. driver hiring practices and control of hours of service.
Ultimately the responsibility remains with the Thai government to monitor fleet safety
compliance, and to review the adequacy of current legislation. The fleet managers’ call for
assistance from the government with SMPs, such as emergency response drills and free
software support for GPS, could be considered as an opportunity to improve the safety of
hazmat transport.

11
In summary, the study provides an insight into current trends of safety management
practices and how fleet safety in the Thai hazmat industry can be enhanced. Further studies to
investigate the relationship between particular SMPs and driver safety outcomes could help
target the SMPs precisely. The findings from the present study may also be relevant for other
countries concerned about improving safety management interventions in hazmat transport.
References
Brown, D.F., Dunn, W.E., 2007. Application of a quantitative risk assessment method to
emergency response planning. Computers & Operations Research 34 (5), 1243-1265.
Bubbico, R., Di Cave, S., Mazzarotta, B., 2004. Risk analysis for road and rail transport of
hazardous materials: A simplified approach. Journal of Loss Prevention in the Process
Industries 17 (6), 477-482.
Carnes, S.A., 1986. Institutional issues affecting the transport of hazardous materials in the
united states: Anticipating strategic management needs. Journal of Hazardous
Materials 13 (3), 257-277.
Chanthorn, K., 2011. Demand of truck drivers in thailand.
Chartsirisup, R., 2006. The study of causes and factors affecting the hazardous material
vehicle accident. King Mongkut's Institute of Technology Nort Bangkok.
Corsi, T., Fanara, P., 1988. Effects of new entrants on motor carrier safety. Transportation
deregulation and safety conference. Transportation research board, USA.
Cox, S., Jones, B., Rycraft, H., 2004. Behavioural approaches to safety management within
uk reactor plants. Safety Science 42 (9), 825-839.
Decha, W., 2005. The comparison of safety management score between hazardous material
transportation sizes and accident occurences. Mahidol Univeristy.
Dejoy, D.M., Schaffer, B.S., Wilson, M.G., Vandenberg, R.J., Butts, M.M., 2004. Creating
safer workplaces: Assessing the determinants and role of safety climate. Journal of
Safety Research 35 (1), 81-90.
Department of Land Transport, 2011. Statistics of registerated vehicles. Transport Statistics
Sub-Division, Planing Division, Thailand.
Federal Motor Carrier Safety Administration, 2001. Comparative risks of hazardous materials
and non-hazardou materials truck shipment accidents/incidents. Washington, DC., The
U.S.
Federal Motor Carrier Safety Administration, 2012. Qualifications of drivers and longer
combination vehicle (lcv) driver instructors. In: The U.S. Department of Transportion
ed. Part 391. The United States.
Harrison, W., 2001. What works in speed enforcement. The NRMA insurance national speed
and road safety conference. Adelaide, Australia.
Hazardous Substance Committee, 2002. Announcement of hazardous substance committee on
hazrdous substance transport by land. 113 Section 95D. Hazardous Substance
Committee, Thailand.
Hazardous Substance Logistics Association, 2011. Hazardous substances logistics
association: History of founding. Thailand.
International Organisation for Standardization, 2011. Iso 9000 essentials
Jiamboonsri, K., 2010. Overtime working problems among drivers in land transport industry.
Thailand Logistic Club, Thailand.
Jones, I.S., Stein, H.S., 1987. Effect of driver hours of service on tractor-trailer crash
involvement. Insurance Institute for Highway Safety, Washington.
Krasus, B., 2005. Health & safety management systems for enhanced performance. ASSE
Professional Development Conference and Exposition. American Society of Safety
Engineers, New Orleans, Louisiana.

12
Land Transport Association of Thailand, 2009. Hazardous material transport industry:
Hazmat trucks.
Malone, C., 2004. Tackling road safety in a global upstream business: An integrated and long-
term approach, paper spe 86751. Conference on HSE in Oil and Gas Exploration and
Production. Calgary.
Mejza, M.C., Barnard, R.E., Corsi, T.M., Keane, T., 2003. Driver management practices of
motor carriers with high compliance and safety. Transport Journal 42 (4).
Ministry of Labour, 2008. The labour protection act (no.2) b.E. 2551. In: Ministry of Labour
ed. Royal Thai Government Gazette, Thailand.
Moses, L.N., Savage, I., 1992. The effectiveness of motor carrier safety audits. Accident
Analysis & Prevention 24 (5), 479-496.
Moses, L.N., Savage, I., 1994. The effect of firm characteristics on truck accidents. Accident
Analysis & Prevention 26 (2), 173-179.
Murray, W., 2006. Guidance on fleet driver incentive programs for crash avoidance.
Newnam, S., Griffin, M.A., Mason, C., 2008. Safety in work vehicles: A multilevel study
linking safety values and individual predictors to work-related driving crashes. Journal
of Applied Psychology 93 (3), 632-644.
Newnam, S., Watson, B., Murray, W., 2002. A comparison of the factors influencing the
safety of work-related drivers in work and personal vehicles. Road Safety Research,
Policing and Education Conferene. Adelaide, Australia.
Office of the National Economic and Social Development Board, 2008. Strategy plan:
Development of man power in logistics year 2008 - 2011. Department of Government
Investment Analysis, Thailand.
Park, S.-W., Mukherjee, A., Gross, F., Jovanis, P., 2005. Safety implications of multiday
driving schedules for truck drivers: A comparison of field experiments and crash data
analysis. Transportation Research Record: Journal of the Transportation Research
Board 1922 (-1), 167-174.
Probst, T.M., Brubaker, T.L., 2001. The effects of job insecurity on employee safety
outcomes: Cross-sectional and longitudinal explorations. Journal of Occupational
Health Psychology 6 (2), 139-159.
Reniers, G.L.L., Dullaert, W., Ale, B.J.M., Soudan, K., 2005. The use of current risk analysis
tools evaluated towards preventing external domino accidents. Journal of Loss
Prevention in the Process Industries 18 (3), 119-126.
Robson, L.S., Clarke, J.A., Cullen, K., Bielecky, A., Severin, C., Bigelow, P.L., Irvin, E.,
Culyer, A., Mahood, Q., 2007. The effectiveness of occupational health and safety
management system interventions: A systematic review. Safety Science 45 (3), 329-
353.
Samuel, C., Keren, N., Shelley, M.C., Freeman, S.A., 2009. Frequency analysis of hazardous
material transportation incidents as a function of distance from origin to incident
location. Journal of Loss Prevention in the Process Industries 22 (6), 783-790.
Staddon, J., 1995. On responsibility and punishment. The Atlantic Monthly, 88-94.
Thai Industrial Standards Institute, 2011. Occupational health and safey management system
standards: Tis 18000.
Thailand Environment Institute, 2011. Access to environmental information: Case studies.
Thailand.
The Occupational Health and Safety Group, 2011. What is ohsas 18001?
Toledo, T., Musicant, O., Lotan, T., 2008. In-vehicle data recorders for monitoring and
feedback on drivers’ behavior. Transportation Research Part C: Emerging
Technologies 16 (3), 320-331.

13
Transconsult Company Limited, 2007. Development of monitoring systems and hazardous
material transport prodecure. Report Prepared for the Office of Transport and Traffic
Policy and Planning. Thailand.
Vredenburgh, A., 2002. Organizational safety: Which management practices are most
effective in reducing employee injury rates? Journal of Safety Research 33 (2), 259-
276.
Waranusantikul, T., 2009. Hazardous material trucks: Moving risk scources in the capital city.
Thailand Environment Institute, Thailand.
Wouters, P.I.J., Bos, J.M.J., 2000. Traffic accident reduction by monitoring driver behaviour
with in-car data recorders. Accident Analysis & Prevention 32 (5), 643-650.
Zaidel, D.M., 2002. The impact of enforcement on accidents. Technical Research Centre of
Finland, Finland.


![Ventilinsel MPA-S - festo.com · PDF fileBeschreibung Pneumatik Ventilinselmit MPA-S Pneumatik Typ: MPA-FB MPA-CPI MPA-MPM-und MPA-ASI- 534240 1309f [8028623] Ventilinsel MPA-S](https://img.dokumen.tips/doc/110x75/5a79d19f7f8b9ab83f8b7435/ventilinsel-mpa-s-festocom-pneumatik-ventilinselmit-mpa-s-pneumatik-typ-mpa-fb.jpg)


![GSW mbH - Startseite · 2018. 9. 4. · DIN V 4279-7 teilwelse ersetzt und erneut den aktuellen Erkenntnissen angepasst [4]. Speziell für die Druckprüfung an PE-Rohrleitungen wurde](https://img.dokumen.tips/doc/110x75/60ccb5dda7ca34035d0dbd13/gsw-mbh-startseite-2018-9-4-din-v-4279-7-teilwelse-ersetzt-und-erneut-den.jpg)

![Valve terminal MPA-S - Festo USA · Pneumatic components description Valveterminalwith MPA-Spneumatics Type: MPA-FB MPA-CPI MPA-MPM-…and MPA-ASI-… 534241 1309f [8028624] Valve](https://img.dokumen.tips/doc/110x75/5c5bd85409d3f236368c6efe/valve-terminal-mpa-s-festo-usa-pneumatic-components-description-valveterminalwith.jpg)