Embed Size (px)
Citation preview

Old Dominion UniversityODU Digital Commons
CCPO Publications Center for Coastal Physical Oceanography
5-1995
The Evolution of Density-Driven Circulation OverSloping Bottom TopographyG. H. WhelessOld Dominion University
J. M. KlinckOld Dominion University, [email protected]
Follow this and additional works at: https://digitalcommons.odu.edu/ccpo_pubs
Part of the Oceanography Commons, and the Physics Commons
This Article is brought to you for free and open access by the Center for Coastal Physical Oceanography at ODU Digital Commons. It has beenaccepted for inclusion in CCPO Publications by an authorized administrator of ODU Digital Commons. For more information, please [email protected].
Repository CitationWheless, G. H. and Klinck, J. M., "The Evolution of Density-Driven Circulation Over Sloping Bottom Topography" (1995). CCPOPublications. 61.https://digitalcommons.odu.edu/ccpo_pubs/61
Original Publication CitationWheless, G.H., & Klinck, J.M. (1995). The evolution of density-driven circulation over sloping bottom topography. Journal of PhysicalOceanography, 25(5), 888-901. doi: 10.1175/1520-0485(1995)0252.0.co;2

888 JOURNAL OF PHYSICAL OCEANOGRAPHY VOLUME25
The Evolution of Density-Driven Circulation over Sloping Bottom Topography
G. H. WHELESS AND J. M. KLINCK
Center for Coastal Physical Oceanography, Old Dominion University, Norfolk. Virginia
(Manuscript received 12 February 1993, in final form 9 August 1994)
ABSTRACT
The short timescale temporal ev~lution of buoyancy-driven coastal flow over sloping bottom topography is examined using a two-dimensional, vertically averaged numerical model. Winter shelf circulation driven by a coastal "point source" buoyancy flux is modeled by initiating a coastal outflow with density anomaly t into well-mixed shelf water. The nonlinear interaction between the time-varying velocity and density field is represented by an advection-diffusion equation. Three cases are discu~: that of a buoyant ( t < 0) outflow, a neutral ( E
= 0) outflow, and a dense (t > 0) outflow. Results are similar to observations from well-mixed shelf areas and show that density-topography interactions are capable of substantially influencing coastal circulation. A negative (buoyant) coastal buoyancy flux is shown to generate alongshore motion with relatively small cross-shelf transport. Conversely, positive (dense) coastal buoyancy flux is shown to generate flow that travels across isobaths to initiate an offshore cyclonic gyre, which is then advected in the direction of propagation of a right-bounded wave. A vortiG.ity analysis shows that local circulation is controlled by the interaction of vortex stretching, JEBAR, and the time change of vorticity; the residual of which is roughly balanced by bottom dissipation.
1. Introduction
Continental shelf circulation patterns transport organic material from the shallow, productive coastal oceans to the deeper offshore areas, although estimates of the amount of material transported are uncertain. The mechanisms by which this transport is effected include advection, small-scale lateral mixing, and entrainment. Forcing mechanisms such as wind stress, tidal mixing, surface heat flux, and coastal buoyancy inputs all contribute to the shelf circulation on various scales, ranging from the episodic to the seasonal in time and from the small-scale local estuarine to the largescale sheltwide in space. Buoyancy fluxes of estuarine or riverine origin and the interactions between the resulting horizontal density gradients and shelf topography are capable of driving significant inner shelf currents, which transport material along and across the shelf. In this paper, we use the results of a numerical model to examine the short timescale evolution of circulation arising from both a positive and negative "point source" buoyancy flux on a well-mixed sloping shelf and the associated density-topography interactions. We also investigate the vorticity dynamics of these developing flows and offer comments on the applicability of the results to more complex scenarios.
Outflowing buoyant water from a wide estuary or river usually exhibits an initial anticyclonic turn after
Corresponding author address: Dr. Glen H. Wheless, Center for Coastal Physical Oceanography, Old Dominion University, Norfolk, VA 23529.
© 1995 American Meteorological Society
exiting the coast and becomes a right-bounded coastal plume with an associated coastal current (Chao and Boicourt 1986; Garvine 1987; Chao l 988a). The nearfteld region just seaward of the buoyant outflow area is characterized by intense mixing as the fresh, buoyant outflow merges with the more saline shelf water. In the winter months, wind stress, tidal mixing, surface cooling, and overturn all serve to completely mix the shelf waters from surface to bottom, often down to 250-m depth (Beardsley et al. 1976; Hendershott and Malanotte-Rizzoli 1976). In many cases, a continental outflow will carry its own stratification as it enters this weU-mixed shelf water, creating a region of coastally trapped, vertically stratified water adjacent to that which is well niixed. However, this does not preclude the situation where the coastal circulation is driven by a surface-to-bottom buoyancy flux characterized by greater horizontal structure than vertical, perhaps due to the magnitude of the buoyancy flux or the strength of tidal mixing (e.g., see Blanton 1981; Blanton and Atkinson 1983; Garvine 1991). Depending upon the initial stratification of the runoff or outflow and physical characteristics of the estuary as well as the intensity of local mixing, this intruding fluid becomes a plume, which either rides atop the shelf water as a thin layer or remains connected with the bottom. Examples of the former are the Chesapeake Bay (Boicourt 1973) and Connecticut River (Garvine 1974, 1977) plumes; the Atchafalaya River (Wang 1984) and the Delaware Bay estuary system are examples of the latter (Mi.inchow and Garvine 1993). Less common are examples of positive coastal buoyancy fluxes in the form of dense

MAY 1995 WHELESS AND KLINCK 889
river outflows, although there are cases where strong evaporation causes outflowing coastal water to be more saline than shelf waters. The winter cascade of the Bass Strait outflow is colder and more saline than the receiving shelf waters, often remaining in contact with the bottom to depths of 400 m (Tomczak 1985). Newly formed dense surface water on high-latitude shelves may also be characterized as a positive buoyancy flux, which remains in contact with the bottom as it sinks and moves along the shelf.
The results of previous analytical and numerical studies of shelf circulation due to coastal buoyancy flux reveal a complex dynamical interaction of forcing and response. The analytical problem is compounded by the basic nonlinearity of the dynamics, while numerical modeling work is made more problematic by the tendency for the ensuing coastal density front to outcrop at the surface and by the choice of mixing parameterization schemes. Garvine ( 1984, 1987) utilized techniques often used to solve compressible gas flow problems and developed a steady, nonlinear and inviscid analytical plume model, which he applied to the Connecticut River outflow and the weakly stratified Delaware Bay. It was shown that for the rotating case, the resulting plume and coastal frontal structure were subject to wavelike meanders with wavelength of approximately two Ross by radii. O'Donnell ( 1990) used a similar model in his examination of plumes originating from small rivers. The significant length scales were shown to be the width of the outflow channel and the baroclinic Rossby radius, the ratio of which comprised a Kelvin number. Chao and Boicourt ( 1986) utilized a three-dimensional, primitive equation model with flat bottom topography to study the onset of estuarine plumes, showing the dependence of the circulation upon bottom friction and vertical mixing processes. Chao ( l 988a,b; 1990) subsequently examined the three-dimensional structure and dynamics of riverforced estuarine plumes, including the effects of sloping bottom topography, idealized wind effects, and tidal modulation. Although a simple mixing parameterization was used, he was able to devise a plume classification scheme based upon a densimetric Froude number and a dissipation parameter. More recently, Oey and Mellor ( 1993) used the Princeton general circulation model to examine the unsteady, nonlinear motions of a non-wind-forced estuarine plume over flat topography, showing substantial subtidal variability. These studies all envisioned a thin surface plume of buoyant fluid physically disconnected from the bottom, thereby minimizing bottom friction effects.
Alternatively, this study examines the case of strong surface-to-bottom forcing and allows outflowing fluid representing a coastal buoyancy flux to remain in contact with the bottom in a slablike layer rather than riding on the surface. There are basic physical differences between the behavior of the thin, surface plume and the coastal outflow that remains connected with
the bottom over a substantial offshore region. One difference is the minimization of bottom friction effects for the surface plume, friction becoming important to the vorticity dynamics after approximately three days (Kao 1981). Conversely, the surface-to-bottom plume is subject to strong bottom frictional effects from the onset of motion. Vortex tube stretching effects are also different for the two scenarios. As Miinchow and Garvine ( 1993) point out, the thin plume gains anticylonic vorticity due to layer-thinning at the edge of the plume, whereas cyclonic vorticity is induced in the surface-tobottom plume as the bottom depth increases. Another important effect, especially in the surface-to-bottom scenario, is the interaction between the mass field and the bottom topography. This so-called JEBAR (joint effect of baroclinicity and relief) effect is a locally important flow generation mechanism resulting from the baroclinicity of the fluid and may play a large role in the vorticity balance (Rattray 1982; Huthnance 1984; Mertz and Wright 1992). Perhaps the clearest explanation of the JEBAR effect was presented by Mertz and Wright (1992), who provide two equivalent descriptions of the mechanism. They first formulate a depth-averaged vorticity equation with which they portray the JEBAR effect as a correction to the topographic stretching term. They then alternatively develop a depth-integrated vorticity tendency equation whereby the JEBAR term is associated with differences between bottom pressure torque, or the torque due to pressure on the fluid from the bottom, and the torque due to the depth-averaged pressure gradient arising due to density differences. The mechanism is capable of forcing the transport of fluid across contours off/ h (Huthnance 1984) or isobaths ifthe bottom slopes in the offshore direction only for a meridional coast. JEBAR acts against the topographic vortex-stretching term and allows an ageostrophic component to the flow, which is ultimately balanced by frictional dissipation.
Coupling this surface-to-bottom scenario with the assumption of very small vertical density stratification enables the controlling equations to be vertically averaged, an approach which simplifies the examination of individual processes responsible for coastal circulation. Several models of the large-scale circulation over a well-mixed shelfusing this methodology have recently emerged. Circulation driven by outflowing river water onto a sloping shelf was described analytically by simple heat conduction solutions by Shaw and Csanady (1983), whose results showed that the interaction of the density field with the bottom slope generated significant geostrophic bottom velocities with a direction dependent upon the sign and strength of the buoyancy flux. Solutions of parabolic heat conduction equations were used to describe the flow generated by these interactions. The resulting self-advection of an imposed density anomaly was characterized by the Burgers equation, a nonlinear diffusive wave equation describ-

890 JOURNAL OF PHYSICAL OCEANOGRAPHY VOLUME 25
ing shock front formation (Whitham 197 4). The dynamical effects of a "double ramp" density profile on coastal flow were studied by Vennell and MalanotteRizzoli ( 1987), who found that it was essential to have an alongshore density gradient symmetrical about a density maximum in order to drive an alongshore coastal flow. In an extension of this earlier work, V ennel and Malanotte-Rizzoli (1990) examined the wellmixed shelf circulation arising from deep-ocean forcing as well as from a coastal density source, finding that dense water near the coast had the potential to expand across isobaths much more quickly than did light river outflow. The interactions between horizontal density gradient and bottom slope were shown to play a large part in the dynamics of the resulting circulation.
We were intrigued by these earlier results and applied some of the same principles to model numerically the local winter shelf circulation due to a coastal buoyancy flux, such as a fresh runoff event or the initial formation of dense water. We examine the circulation arising during the quasi-steady-state period after the onset of a significant coastal runoff episode or weather event, the timescale of which is of 0(7-10) days. In most problems of this kind with a small Rossby number (Ro = U If L), momentum advection is reasonably discarded from the analysis, and cross-isobath flow is ignored based upon scale analysis. Indeed, the steadystate circulation due to coastal buoyancy flux is dominated by alongshore flow. However, we chose to utilize the primitive equations, retaining all cross-isobath flow components on the assumption that they may be as important as the along-isobath components during the period after initial geostrophic adjustment of the outflow but before the long-term equilibrium solution is achieved. We also investigate the vorticity dynamics controlling the transport of this outflowing water, comparing individual terms of the vertically averaged vorticity equation to demonstrate that the JEBAR effect is capable of substantially affecting coastal circulation patterns. The dependence upon certain key parameters such as bottom and horizontal friction and horizontal density diffusion is also discussed. The formulation of the dynamical model used to study this circulation is described in the next section. Section 3 describes the experiments and results of this study, a discussion of which may be found in section 4. The last section presents some conclusions.
2. Description of the model
We assume a vertically homogenous coastal buoyancy anomaly outflowing onto a sloping, well-mixed shelf and use the vertically averaged primitive equations to formulate a single layer model of the local circulation. Although such a model neglects vertical density stratification effects and forces the isopycnals to remain vertical, the simplification allows one to utilize the thermal wind relations and the lateral density gradient
to obtain a bottom velocity (Shaw and Csanady 1983; Vennel and Malanotte-Rizzoli 1990) which, in turn, provides an indication of the vertical characteristics of the velocity profile. Implications of this bottom velocity and associated vertical shear are advanced below. An advection-diffusion formulation of the controlling density equation provides nonlinear interaction between velocity and mass fields so that the model is not merely diagnostic. The results provide insight into the dominant spatial and temporal processes active in the generation of transient inner-shelf flow during winter. Further assumptions are that flow is on an f plane and that topography varies only in the offshore (x) direction. Wind and tidal forcing are assumed zero, as is surface heat flux. A free surface is allowed.
a. Governing equations
The depth-averaged gradient pressure force may be written as
1 gh - Vp = g(l + €)V17 + -2 VE, (1) Po
and the horizontal components of momentum and continuity are then
au [ a11 h a€] at = + f v - g ( 1 + €) ax + 2 ax
(2)
av = - Ju - g[( 1 + €) a11 + ~ a€]- rv + A\72v at ay 2 ay
(3)
a11 a a - = - - (hu) - - (hv), at ax ay
(4)
where u and v are the depth-averaged cross- and alongshelf velocity components, E(X, y, t) = (p - p0 )/ Po is the density anomaly referenced to a base density Po, h is the mean fluid depth, fis the Coriolis parameter, g is the acceleration due to gravity, 11 is the height of the free surface, and A is a horizontal turbulent viscosity. The effects of drag and bottom boundary layer processes are conveniently yet crudely represented in the momentum equations by linear loss terms ru and rv (Csanady 1976; Beardsley and Winant 1979), rbeing a simple linear friction parameter corresponding to Rf h where R is the more standard bottom friction parameter with units of velocity.
The nonlinear interaction between the density and the velocity field is retained by writing the mass conservation equation as
ap a a ( a2p a
2p) at= - a)up) - ay (vp) + Kh ax2 + ay2 , (5)
where Kh is the horizontal turbulent density diffusivity. Vertical velocity shear may be calculated from hor
izontal density gradients through use of the thermal

MAY 1995 WHELESS AND KLINCK 891
wind relations for well-mixed fluid referenced to the bottom. Bottom velocities, ub and vb, are then
Ub = - ! (hb OE+ OTJ) f i)y i)y
(6)
(7)
Taking hb to be the depth of the sloping bottom, these equations describe the bottom flow generated by horizontal density variations on a well-mixed shelf. The magnitude of this bottom flow is proportional to the strength of the density anomaly and the slope of the shelf(Shaw and Csanady 1983). Holding bottom slope constant, as in this model, bottom velocity magnitudes are then determined by the magnitude of horizontal density gradients.
The vertically averaged momentum equations are converted to a vertically averaged potential vorticity equation by cross-differentiating and subtracting ( 2) and ( 3). The equation of conservation of vorticity ( ~) for the vertically averaged flow is
:; + 1(:~ + :;) + (f)J(h, e) + r~
- A(!... 'V2v - !.._ 'V2u) = 0 (8) ax i)y '
where J is the Jacobian, defined as J(F,G) = FxGy - FyGx. The terms in the equation will be referred to as vorticity time change, stretching, JEBAR, bottom loss and horizontal loss, respectively.
b. Mode/formulation
To minimize truncation error associated with rapidly changing bathymetry and to preclude inaccurate energy cascade to smaller scales, our finite-difference model is based on the potential enstrophy conserving scheme developed by Arakawa and Lamb ( 1981). A spatially staggered C grid is utilized, known to be well suited for geostrophic adjustment problems ( Mesinger and Arakawa 1976). The model is initiated using a forward time-centered space scheme, then advanced in time with a leapfrog scheme. The bottom friction terms are lagged and spatial derivatives are second-order accurate.
We consider a coastal domain of 50 km by 150 km with a straight coast on the western side of the domain that has an inflow region 5 km wide located 35 km from the upper boundary. For the cases considered, water depth increases linearly from 10 m to 30 m in the offshore ( + x) direction only, so h(x) = h0 + sx, where s is bottom slope. There is a narrow shelf one grid point wide located at the coast. The bottom topography is smoothed by three passes through a I :2: I spatial average in the offshore ( + x) direction to round off comers. The largest stable time step is constrained
by the fast surface gravity wave allowed by the free surface condition. The 0.833-km grid spacing between like variables demands that the time step be kept below 10 seconds. Simulations are run for 10 and 20 days, by which time a quasi-steady state is achieved.
Open boundary conditions suggested by Camerlengo and O'Brien ( 1980) and later evaluated as a modified Orlanski radiation condition by Chapman ( 1985) are used at both cross-shelf model boundaries. The staggered grid requires that the open boundary conditions be applied to both the cross-shelf ( u) velocity and the free surface height ( 7J) at each time step. Boundary values for the alongshelf ( v) velocity are fixed at zero at each open cross-shelf boundary. Cross-shelf ( u) velocities are set to zero at the offshore boundary and a frictional sponge layer is used there to reduce reflected wave energy. The no-slip condition is imposed at the coastal boundary.
The model is initialized by allowing fluid of anomalous constant density, representing a coastal buoyancy flux, to enter the homogenous, quiescent ocean from the coastal outflow region. The final outflow velocity, V0 , is assumed small and is set at 10 cm s- 1
• Outflow velocity and density anomaly magnitude are ramped up over an inertial period to the final values to preclude momentum spikes, then held constant for the duration of the simulation. Experiments were conducted with alongshore (y) variation imposed on the outflow velocity, simulating a horizontal vorticity structure. There were no qualitative differences noted between these results and the ones discussed below.
For the results shown, fis taken to be 10-4 s- 1 and reference density, p0 , is 1030.0 kg m-3
• For both the buoyant and dense cases discussed, the density anomaly E between the outflowing water and the receiving shelf water is 2.0 u1 units. If this were a stratified system, this density anomaly would yield a theoretical internal gravity wave speed of0(.5) m s-1 with a corresponding internal deformation radius R; of 0( 5.0) km. The resulting Kelvin number of the system, the ratio of outflow width to deformation radius, would then be approximately unity indicating the importance of rotation. However, the lack of vertical density stratification in this study precludes calculation of R; . Instead, we follow Chao ( l 988a) and use the velocity just downstream of the outflow area and the outflow width to construct a ratio indicative of the importance of rotation effects. In all cases this ratio is close to unity, classifying our modeled system as large.
As there is no ambient alongshore flow in this model other than that arising from buoyancy effects, horizontal diffusion of density is not due to current shear and is therefore chosen small to highlight advective effects over diffusive ones, in effect specifying a high Peclet number. In the simulations discussed, Kh is kept below 30 m2 s - I , the minimum required to eliminate numerical diffusive instabilities in this model as well as to preclude the rapid formation of density fronts.

892 JOURNAL OF PHYSICAL OCEANOGRAPHY VOLUME 25
As discussed by Shaw and Csanady (1983), the debouchment of fluid of anomalous density onto a quiescent shelf is an inherently frontogenetic process. The magnitude of horizontal (Laplacian) friction, A, was also kept at the minimum required to damp out reflected gravity wave energy, normally below 30 m2 s-1•
Both A and Kh are assumed uniform in the vertical. A value of 10-5 s -i was used for the linear bottom friction parameter, r.
3. Results
Three general cases are considered for flow of water onto a continental shelf: the density anomaly f of the added water is less than, equal to, or greater than the ambient (uniform) density of the coastal water. The
focus of the analysis is on the quasi-steady-state period before the equilibrium state has been reached. Simulations of 30 days or longer were completed to confirm the equilibrium state for both buoyant and dense cases. Directionality is described in terms of propagation of a right bounded wave, downcoast being toward negative y.
a. Negative (buoyant) density anomaly: f = -2.0
At the beginning of the simulation, the advancing buoyant fluid moves away from the outflow area in the cross-shelf direction at a velocity slightly greater than the imposed outflow speed. It then turns anticyclonically until it impinges on the coast and becomes a right-bounded coastal jet with an average downcoast
Velocity and Density Field
3.75 (days) 150.
113.
I \
I ' . I ' . ' ' . . . 75.
38.
0. 0. 13. 25. 38.
150.
113.
I ' I I . \ '
75.
38.
0. 50. 0.
10.00 (_days l
13. 25.
•
38.
B.160E+BB
HAXINUH ~ECTOR
50.
FIG. I. Evolution of the velocity and density fields for the case of a negative buoyancy input (buoyant water); time is (a) 3.75 days and (b) 10.00 days. Maximum water depth is 30 m. Density anomaly< is -2.0 u,, Ah is 30.0 m2 s- 1
,
and Kh is 30.0 m2 s-1• Density contour interval is 0.4 kg m-3•

MAY 1995 WHELESS AND KLINCK 893
1511J.
113.
75.
Bottom Geostrophic Velocity
10.00 (days) I I I
- ' ' ' - ' ' ' . - ' \ \ I
- ' \ ' I .
' \
I I
-· I . -I .
I I , . . I I I I . ' I 1 I - I I I . - ' I I
- / I . - , ,
- -
38. >-- -
11J. I I
11J. 13. 25.
I
38.
0. 150E+00
HAXIHUH VECTOR
511J.
FIG. 2. Bottom geostrophic velocities for the case displayed in Fig. 2 at 10.00 days. Velocity maximum corresponds with maximum horizontal density gradients. Flow is generally upcoast, in opposition to the vertically averaged velocity field.
speed slightly more than the inflow velocity (Figs. la,b). This behavior is much like that of the buoyant plumes modeled by Chao ( 1988) and Garvine ( 1984 ), or observed by Boicourt ( 197 3). The advection speed is reduced near the nose of the plume due to frictional effects and horizontal mixing. A small part of the outflow moves toward the upper boundary (positive y), apparently due to pressure gradient effects, before turning offshore and then eventually downcoast. In experiments with ambient alongshelf flow, this upcoast spreading is eliminated. Similar spreading and alongshelf flow effects are seen in a modeling study of small river plumes by O'Donnell ( 1990). Cross-shelf penetration of the buoyant outflow is limited to a narrow
coastal layer and there is little growth in the cross-shelf extent of the coastal jet.
The bottom geostrophic velocity field has a strong alongshore component in the upcoast direction with evidence of cyclonic recirculation (Fig. 2). This upcoast bottom flow is similar to that of the barotropic model of Masse ( 1990), which clearly shows that shelf water withdrawn into an estuary originates downcoast from the estuary. With constant density anomaly magnitude and bottom slope, the strongest bottom geostrophic velocities are associated with the strongest horizontal density gradients. Vertical velocity shear inferred from these bottom velocities indicates a general decrease in velocity with depth, in some locations reversing direction. This result is consistent with that of Blanton ( 1981 ) in his study of the dynamics of a "line source" buoyant discharge in the South Atlantic Bight.
b. No density anomaly: E = 0.0
This experiment provides an interesting intermediate case in that there is no interaction between the velocity and mass fietds. After debouching onto the sloping shelf, the flow is controlled by rotational effects and exhibits the expected anticyclonic turn (Figs. 3a,b). The magnitude of the down coast flow is not as strong as that of the buoyant case and the coastal jet seen in the buoyant case is absent due to the lack of density anomaly and the associated pressure gradient. There is little change in the velocity field with time other than linear spindown due to frictional effects. Bottom geostrophic velocities (not shown) are extremely small, being entirely due to surface height changes arising from the divergence of the velocity field.
c. Positive (dense) density anomaly: E = 2.0
Driven by dense coastal discharge in this experiment, the surface flow again exhibits an initial anticyclonic turn followed by a cyclonic offshore turn, transporting dense water offshore. Unlike the buoyant density case, the positive density input quickly spreads across isobaths in a tonguelike distribution with reduced shoreparallel motion, as shown in Figs. 4a,b. Evidence of a very sharp density front may be seen above the outflow but there is little upcoast spreading as was seen in the buoyant case.
As the dense water is subjected to the interaction between vortex stretching and JEBAR in deeper water, a cyclonic gyre quickly forms similar to that observed in the Adriatic Sea by Malanotte-Rizzoli and Bergamasco ( 1983), but on a much shorter timescale. There are no corresponding structures evident in the buoyant case. Animations of long timescale simulations show the periodic, cyclic formation of these gyres, which travel slowly along the density front in the direction of coastal wave propagation. Similar eddy generation has been reported by Davey and Killworth ( 1989) in their
894 JOURNAL OF PHYSICAL OCEANOGRAPHY VOLUME 25
Velocity Field
3.75 (days) 10.00 (days) 150. ·'. ·' . J . 150. ,I• ,I • • J
113. ~' - .- 113. --:i:..' •
~'~~ !)'-~ ~ ·-I I \ '
' I \ \ \
I I I ' I I I I I I I I ' I I I I ' I I I ' ' I I.\ I I I I I I I I I I I I I ' ' I I
' I . ' ' . I I ' '
75. -. . .- 75. .... ' ·-
38. -. . - 38. ... . .-
0. ., . ., 1
0. •I• 1 1
0. 13. 25. 38. 50. 0. 13. 25. 38. 50.
0 .120E+ee
MAXIMUM VECTOR
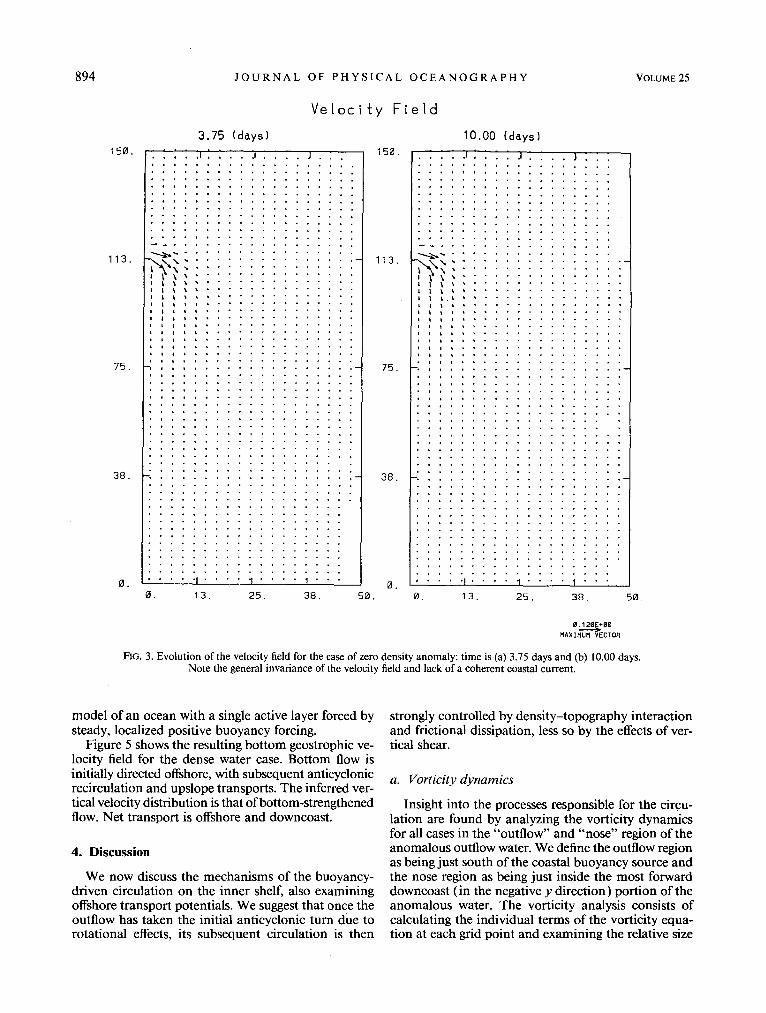
FIG. 3. Evolution of the velocity field for the case of zero density anomaly: time is (a) 3.75 days and (b) 10.00 days. Note the general invariance of the velocity field and lack of a coherent coastal current.
model of an ocean with a single active layer forced by steady, localized positive buoyancy forcing.
Figure 5 shows the resulting bottom geostrophic velocity field for the dense water case. Bottom flow is initially directed offshore, with subsequent anticyclonic recirculation and upslope transports. The inferred vertical velocity distribution is that ofbottom-strengthened flow. Net transport is offshore and downcoast.
4. Discussion
We now discuss the mechanisms of the buoyancydriven circulation on the inner shelf, also examining offshore transport potentials. We suggest that once the outflow has taken the initial anticyclonic turn due to rotational effects, its subsequent circulation is then
strongly controlled by density-topography interaction and frictional dissipation, less so by the effects of vertical shear.
a. Vorticity dynamics
Insight into the processes responsible for the circulation are found by analyzing the vorticity dynamics for all cases in the "outflow" and "nose" region of the anomalous outflow water. We define the outflow region as being just south of the coastal buoyancy source and the nose region as being just inside the most forward downcoast (in the negative y direction) portion of the anomalous water. The vorticity analysis consists of calculating the individual terms of the vorticity equation at each grid point and examining the relative size

MAY 1995 WHELESS AND KLINCK 895
Velocity and Density Field 3.75 !days)
150. 150.
113'. 113.
10.12 (days)
I ' ,, ~
\ ' ' ' ' I I I I I I t I I
I I I
75. 75.
38. 38.
QI. <21. <21. 13. 25. 38. 50. 0. 13. 25. 38. 50.
0 .1&e~+ee MAXIMUM ECTOR
FIG. 4. Evolution of the velocity and density fields for the case ofa positive buoyancy input (dense water): time is (a) 3.75 days and (b) 10.00 days. Density anomaly tis 2.0 u,. Density contour interval is 0.4 kg m-3•
of each term. This residual value is examined for evidence of model error and is usually an order of magnitude smaller than the largest term.
The results of this study are consistent with earlier modeling studies of buoyancy-driven shelf flow (Shaw and Csanady 1983; Csanady 1984; Venne! and Malanotte-Rizzoli 1990) and show that, in the absence of wind stress or other surface forcing, the vorticity-generating mechanism arising from the interaction of bottom slope and horizontal density gradient (the JEBAR effect) contributes significantly to local circulation on the inner shelf. Constructing our vorticity equation ( 8) from depth-averaged equations of motion for flow over a sloping bottom ( 2 and 3) yields a Jacobian of density anomaly and depth, the JEBAR term. The term directly results from the introduction of a density anomaly, or potential energy, into the equations of motion and is
not found in a vorticity equation for homogeneous fluid. Because it is the bottom geostrophic velocity over sloping bottom topography that induces topographic vortex tube stretching, one may alternatively describe the JEBAR term as a correction to the stretching term when a vertically averaged vorticity equation is formulated (Mertz and Wrigh( 1992). This mechanism is capable of forcing the transport of fluid across contours off/ h or, in this model, isobaths.
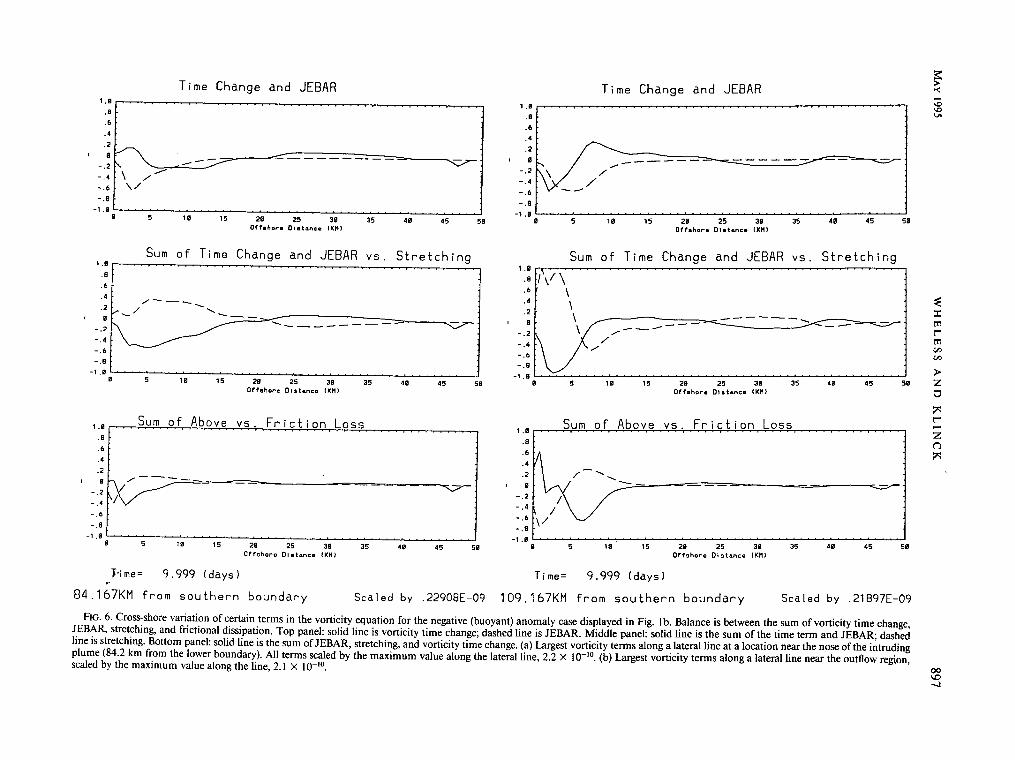
Near the dynamic outflow region of the buoyant outflow case, the circulation is largely controlled by vortex stretching (Fig. 6a). The sum of the JEBAR term and the time term roughly balances stretching with bottom dissipation completing the balance. The structure of the vorticity terms in the nose region is quantitatively different but the same qualitative effects are seen. The vorticity balance is primarily between

896 JOURNAL OF PHYSICAL OCEANOGRAPHY VOLUME 25
15rll.
113.
Bottom Geostrophic Velocity
10.12 (days)
·'. I I
~'' .... -,\ ~~ ~ ~ : : : - - . ' ~!~~~~===:~~~::: - ........ \ \ ' ..... ~ ... \, \ \ ' I ' I
_, ...... - I \ " ' • ' ' ' I ' ' ' - ................. - - , , / , I I I I I I .,.,,...._ ____ _,,._,,,,,///I
...,,...._ _____ ..,.;"*'/II'
75. -. -
38. t-
rll. I I
rll. 13. 25.
-
I
38.
0. 491 E+00
MAXIMUM VECTOR
5rll.
fJG. 5. Bottom geostrophic velocities for the dense water case at 10.00 days. Note the region of bottom-strengthened currents.
the sum of stretching, time change of vorticity, JEBAR, and bottom losses (Fig. 6b). Maximum variability in the vorticity terms occurs closest to the coast in the region with the greatest alongshore horizontal density gradients.
The results of the neutral case, E = 0, show a balance between the sum of time change and stretching, and frictional losses (Fig. 7), as would be expected in a homogeneous fluid. The JEBAR contribution is absent due to the lack of buoyancy flux.
In the dense outflow case, there is more offshore spatial variability in the vorticity terms due to the crossshelf motion of the plume. Figures 8a,b show the sum of vorticity time change and stretching terms plotted against the JEBAR term, the largest in the vorticity balance, and their sum against bottom dissipation. In the outflow region there are substantial density gra-
dients in both the cross-shelf and alongshelf directions with ordinately stronger vorticity effects but with essentially the same result as seen farther away from the outflow (Fig. 8b). In general, bottom dissipation balances relative vorticity generated by the residual of JEBAR and the sum of stretching and vorticity time change.
JEBAR generates vorticity by the interaction of orthogonal gradients of density and depth. In this study where bottom slope is dependent upon offshore direction only, there must be a misalignment between density gradient and bottom slope for JEBAR to be effective at generating vorticity. In both the buoyant and dense cases, strong crosshelf horizontal density gradients near the outflow region (Figs. 1 and 4) reduce the JEBAR effect due to JEBAR's singular dependence upon alongshelf density gradients; rotational effects and vortex stretching are most important here. The sum of vorticity time change, JEBAR, and stretching is balanced by bottom losses in general, although the vorticity processes are ·so.mew hat complicated near the outflow region. JEBAR becomes more important in the vorticity balance once the flow has advected the mass field, so that the strongest density gradients are oriented more alongshore and thus more orthogonal to the bathymetry.
Examining the vertically averaged vorticity equation (8), retaining all cross-isobath terms, and considering a shelf sloping in the x direction only, the steady vorticity balance may be stated as
!(au+ av)+~ (ah aE) + r~b = O. ax ay 2 axay (9)
This equation is similar to a heat conduction equation as shown by Shaw and Csanady ( 1983) with alongcoast advective properties. The results herein are similar, the retention of cross-isobath terms serving to affect the circulation locally. Alongshore density gradients are si.milar to the wind stress in the generation of shelf circulation, the sign of the density anomaly, E, imparting cyclonic or anticyclonic circulation tendency to the flow via JEBAR.
b. Potential for offshore transport
The results have shown that dense outflow is able to spread across isobaths farther than buoyant outflow before ultimately flowing predominantly alongshore. There is little offshore spreading associated with a buoyant outflow because once the coastal jet has formed, the residual of vortex stretching and JEBAR must be balanced by the creation of negative vorticity, which favors coastal trapping of the plume. The buoyancy flux due to this outflowing buoyant fluid allows for some spreading but once the density contours become primarily alongshore oriented, spreading ceases except for that caused by horizontal diffusion. In both cases, the outflowing fluid remains in contact with the
Time Change and JEBAR 1 .0
.8
.6
.4
.2 -.:[>--= ---~ -----.4 \ /- -------.6 '\/ - - - =-----.. ,-
-1.0~~~~~~~~~~~~~~~~~~~-~~~~~~~-~~~~~~~__, 8 5 10 15 28 25 38 35 48 45 5B
Offahor• 01 stance ll(HJ
Sum of Time Change and JEBAR vs. Stretching 1.0.-.-~~~~~~~~~~~~~~~~~~~~~~~~
.8
.6
.4
.2
-.2
- .4
-.6
-.8
/----....
/ ...... ____ ----------
-1.0 ~~~~~~~~~~~-~~~~-~~~~~~~-~~~~~~~~~~........, 0 5 10 15 20 25 30 35 48 45 58
OP'hhore Distance CKHI
1 . 0 Sum of Above vs. Friction Loss .8 .6
.4
.2
- .2
,--/ --
-.4 ,;
- .6
- .8
-1.08;---~~~.~-~~.~n;-~~-~-;-~~~--~~~~~~~~~~~~~~~~-~~~~..J 1u 15 4B 28 25 38 35 45 58
Offshoro Di 9 hnca (t(H J
T·i me= 9.999 (days)
1 .0
B
.6
.4
.2
e -.2 f\ \ - .4
-.6
-.8
-1 .0 8 5
Time Change and JEBAR
/ /
.,--
10 15 20 25 38 Offahor• D1atanca CICHI
35 48 45
Sum of Time Chanqe and JEBAR vs. Stretching
58
1.8 ..... ~~~~~-~~~~~~~~~~~~~~~-~~~~-~~~~~~~.......,
.8 f/\/ \
.6
.4
.2
- .2
-.4
- .6 -.8
\ \ \ \
5
,,.------,,...------~----/ --/
10 15 28 25 30 35 Offshore 01stanco CKHJ
1.0
Sum of Above vs. Friction Loss .8
.6
.4
. 2
e -.2
- .4
- .6
-.8
....... .......
-1 .0 .
--
48 45 58
0 5 i 0 i 5 20 25 38 35 48 45 50 Offshore Distance IKHI
Time= 9.999 (days)
84.167KM from southern boundary Sea I ed by . 22908E-09 109. 16 7KM from southern boundary Scaled by .21897E-09
FIG. 6. Cross-shore variation of certain terms in the vorticity equation for the negative (buoyant) anomaly case displayed in Fig. 1 b. Balance is between the sum of vorticity time change, JEBAR, stretching, and frictional dissipation. Top panel: solid line is vorticity time change; dashed line is JEBAR. Middle panel: solid line is the sum of the time term and JEBAR; dashed line is stretching. Bottom panel: solid line is the sum of JEBAR, stretching, and vorticity time change. (a) Largest vorticity terms along a lateral line at a location near the nose of the intruding plume (84.2 km from the lower boundary). All terms scaled by the maximum value along the lateral line, 2.2 X 10⁻¹⁰• (b) Largest vorticity terms along a lateral line near the outflow region, scaled by the maximum value along the line, 2.1 X 10⁻¹⁰•
E:: > ..: 'D 'D v.
~ ::c: tTl t""' tTl tn tn
> z t)
~ t""' ...... z (j
~
00
'° -i

898 JOURNAL OF PHYSICAL OCEANOGRAPHY
Time Change and JEBAR 1.0r-~~~~~~~~~~~~~~~~~~~~~~~~~~....,
.a .6
.4
.2
e ~"=-'=-==..:=-==---~--=o..==-=~~~~~~~~~~~~~~ -.2
- .4
- .6
-.B
-l.e0~~~5~~-1~0~~~,5~~-2~0~~~25~~-3~0~~~3~5~~4~0~~-4-5~~~50
Offahora Distance CKMl
Sum of Time Change and JEBAR vs. Stretching 1.0r-~~~~~~~~~~~~~~~~~~~~~~~~~~.....-,
.a
.6
.. 4 I \
·:A.\ -.2 '--~,--,~~~---~--~~~~~~~=-==-=~~~~~~~~~-
-.4 '- _ _.........-
- .6
- .a -1.0~~~~~~~~~~~~~~~~~~~~~~~~~--~-.J
0
1.Br-~~--.--~.,...c,.o~~--'"...,_;-,..c~-'.-';'-'-~c,"-,-~..;=..;"-r-~~~~~~~~
.a
.6
.4
.2
Time=
Offshore Dtshnca IKHJ
9.999 (days)
109.167KM from southern boundary Scaled by .15883E-09
FIG. 7. Cross-shore variation of certain terms in the vorticity equation for the zero anomaly case displayed in Fig. 3. Balance is between the sum of vorticity time change and stretching, and frictional dissipation. Top panel: solid line is vorticity time change; dashed line is JEBAR (equal to zero in this case). Middle panel: solid line is the sum of the time term and JEBAR; dashed line is stretching. Bottom panel: solid line is the sum of stretching and vorticity time change. Largest vorticity terms along a lateral liile at a location near the outflow region (I 09. I km from the lower boundary). All terms scaled by the maximum value along the lateral line, 1.6 x 10⁻¹⁰•
VOLUME 25
bottom and experiences horizontally varied bottom drag as the depth increases offshore. Flow located in the shallower regions is affected more by the bottom friction than flow in deeper water.
wind balance. Examining Figs. 2 and 5, one may see that positive buoyancy flux is associated with bottom velocities that are strengthened with respect to the vertically averaged fields, whereas negative buoyancy flux is associated with bottom-diminished velocities. Bottom velocities not solely directed along isobaths generate vorticity (Shaw and Csanady 1983). In the buoyant case, the sign of the density gradient causes the flow to be bottom-diminished (Fig. 2) with respect to the depth-averaged flow, alongshore flow reversal being evident at the isobath corresponding to maximum offshore spreading and strongest density gradient. An area of convergent flow near the surface delineates this
Although one is unable to deduce the actual vertical velocity distribution from a vertically averaged field without relying upon certain questionable assumptions, one may calculate an idealized vertical shear and thus obtain bottom velocities from the thermal wind relations as shown by ( 6) and ( 7). Near the frontal zone in both the buoyant and dense cases, the cross-shelf density gradient is increased, requiring a subsequent increase in the vertical shear to maintain the thermal

Time Change and Stretching 1 .0
.8
.6
.4
.2
0 v" -.2
- .4 ....----........ ----......... _ ......... ___ _
-.6
- .8
-1.0 0 10 15 20 25 30 35 40 45 50
Offshore 0111tanee CKHJ
Sum of Time Change and Stretching vs. JEBAR 1.0,.-~~~~~~~~~~~~~~~~~~~~~~~..--.-,
.8 ,6
.4
.2
- .2
- .4
- .6
- .8
/-----------/ -----
--------
-1.0 ~~~~~~~~~~~~~~~~~~~~~~~~~~~~~~~~~~~~ 0 5 10 , 5 20 25 30 35 40 45 50
Offshore Distance IKHl
1 .0 Sum of Above vs. Fricfion Loss .8
.6
.4
.2
- .2
-.4
- .6
- .8
\. -....... ------1.0 ~~~~~~~~~~~~~~~~~~~~~~~~~~~~~~~~~~~~
0 5 10 15 20 25 30 35 40 45 50 Offshore Distance IKHl
Time= 10.124 (days)
Time Change and Stretching 1.0 r""~~~~~~~~~~~~~~~~~~~~~~~~~~~~~~~~-.-,
,8
.6
.4
·:r ,,, I !fa/ , __ ~
0 5 10 15 20 2s 30 35 40 45 50 Ofhho,..o 01ahnco tKHl
Sum of Time Change and Stretching vs. JEBAR 1 .0
.8
.6
.4 t ;\
.2 / \
- .2 u /"-'- ----------------- .4
- .6
- .8
-1 .e 0 5 10 15 20 25 30 35 40 45
Ofhhore DI stance 1Kt1)
1.0
Sum of Above vs. Friction Loss .8
.6
.4
.2
0
- .2
- .4
- .6
- .8
/ .,.,.....---------------...::
50
-1.0'-'-~~~~~~~~~~~~~~~~~~~~~~~~~~~---'
0 5 10 15 20 25 30 35 40 45 50 Offshore Q19tanco <KMI
Time= 10.124 (days)
95.000KM from southern boundary Scaled by .35752E-09 105.000KM from southern boundary Scaled by .37558E-09
FIG. 8. Cross-shore variation of certain terms in the vorticity equation for the positive (dense water) anomaly case displayed in Fig. 4b. Balance is between the sum of vorticity time change, stretching, JEBAR, and frictional dissipation. Top panel: solid line is time change; dashed line is stretching. Middle panel: solid line is the sum of the time term and stretching; dashed line is JEBAR. Bottom panel: solid line is the sum of JEBAR, stretching, and vorticity time change. (a) Largest vorticity terms along a lateral line at a location near the nose of the intruding plume (95.0 km from the lower boundary). All terms scaled by the maximum value along the lateral line, 3.6 X 11-10
. (b) Largest vorticity terms along a lateral line near the outflow region, scaled by the maximum value along the line, 3.7 X 10⁻¹⁰•
~ -< \0 \0 v.
~ :i:: m t"" m <Z> <Z>
)>
z ti
~ t"" -z (')
~
00 \0 \0

900 JOURNAL OF PHYSICAL OCEANOGRAPHY VOLUME 25
trapping isobath and also contributes to the cessation of spreading by forcing flow onshore and disallowing substantial cross-shelf flow other than that by diffusive effects. Conversely, the dense outflow case is able to spread across isobaths due to the positive vorticity created by the net JEBAR-stretching residual. Once the offshore density contours become oriented alongshore, this residual is minimized and spreading once again stops. The geostrophic bottom velocity is that of a bottom-strengthened coastal flow in the region of strongest density gradient (Fig. 5), opposite to that of the buoyant inflow case.
c. Parameter influence
For both the buoyant and dense outflow cases, an increase or decrease in the magnitude of the density anomaly results in accordingly stronger or weaker circulation. This is attributed to the corresponding increase or decrease in the density gradients and the effect of this on the JEBAR term. A simple increase in bottom slope also increases the JEBAR term magnitude, yet inhibits offshore transport due to the changes in the stretching term and the subsequent vorticity effects. Offshore spreading is also reduced due to the greater bottom velocities occurring nearer the coast with an increase in bottom slope.
Frictional dissipation due to linear bottom drag controls the maximum advective speed of the anomalous water mass and, to some extent, the offshore spreading. Increasing the linear drag parameter r serves to decrease the spindown time of the flow as well as the offshore extent of the coastal current. The horizontal friction parameter, A, was kept small in all cases and did not affect the solutions other than to smooth out gravity wave effects. Decreasing A below a critical value resulted in increased wave energy and subsequent model failure. Increasing KH above the maximum value with a fixed small outflow velocity yielded flow fields that were increasingly diffusive and not realistic. Decreasing KH below the minimum value allowed the ap~ pearance of numerical instabilities due to the formation of density fronts not resolvable by the grid spacing of the model.
5. Conclusions
We have studied the quasi-steady motion of densitydriven, well-mixed flow over sloping bottom topography using a vertically averaged primitive equation model. Our results highlight the notable differences be-, tween the behavior of a dense coastal outflow and the more familiar buoyant outflow. Although the lack of vertical stratification and three-dimensional effects serves to oversimplify the resulting flow fields, our results compare favorably with those of other modeling studies as well as with observations. In all experiments, the outflow makes an initial anticyclonic turn but there
all similarity ends. The buoyant outflow quickly becomes a right-bounded coastal jet, consistent with the model results ofGarvine (1987), Chao (1988a), and Weaver and Hsieh ( 1987), although there is no-bulge in the outflowing fluid seaward of the outflow region as seen in these earlier model results or in the observations of Boicourt ( 1973) or of Hickey et al. ( 1991). The radial spreading behavior resembles that observed in outflowing buoyant fluid from the Quinault River in Taholah, Washington (Garvine 1984 ), and in the' model results of O'Donnell ( 1990). The dense water plume and cyclonic gyre found in the dense coastal outflow case has been observed in the Adriatic Sea after a cold air outbreak (Hendershott and Malanotte-Rizzoli 197 6). Additionally, the behavior and the crossisobath spreading associated with the dense case has implications for the motion ensuing after formation of dense water on high-latitude shelves.
We have shown that in the period after the initiation of a surface-to-bottom coastal buoyancy flux, the interaction of horizontal density gradients and bottom slope with vortex stretching substantially affects the circulation over the inner shelf. Vertical velocity shear also may play a large role in the circulation dynamics by creating a spatially variable drag force on the fluid as it flows over a sloping bottom. Flow due to a dense coastal input is bottom-strengthened and capable of substantial cross-isobath flow, most likely due to the increased potential energy of this scenario as well as the vorticity produced by the JEBAR effect. This bottom-strengthened flow experiences enhanced bottom frictional forces also augmenting cross-isobath transport. Conversely, bottom-diminished circulation associated with a buoyant coastal density source is confined to a narrow coastal boundary layer. The buoyant fluid has very little cross-shelf flow, its motion being oriented primarily along isobaths. Frontal instabilities possibly due to topographic vorticity waves are present in the dense outflow case but not seen in the buoyant case.
Finally, the results of this study show the relevance of ensuring that future coastal zone observational studies include closely spaced bottom or near-bottom measurements along isobaths for a distance of some tens of kilometers alongshore with the express purpose of analyzing the effects of the density-bathymetery interaction. Coupled with standard hydrography, this analysis of the effects of JEBAR would provide new insights into cross-isobath transport mechanisms as well as magnitudes. Locating such an experiment near the mouth of a large river or estuary would also shed light on estuary-shelf interactions.
Acknowledgments. The first author gratefully acknowledges support from the University Corporation for Atmospheric Research under their Postdoctoral Program in Ocean Modeling. UCAR is supported by the National Science Foundation. Additional resources

MAY 1995 WHELESS AND KLINCK 901
were provided by the Center for Coastal Physical Oceanography, Old Dominion University. The suggestions provided by anonymous reviewers were most helpful and are appreciated.
REFERENCES
Arakawa, A., and V. R. Lamb, 1981: A potential enstrophy conserving scheme for the shallow water equations. Mon. Wea. Rev., 109, 18-36.
Beardsley, R. C., and W. C. Winant, 1979: On the mean circulation in the Mid-Atlantic Bight. J. Phys. Oceanogr., 9, 612-619.
--, W. C. Boicourt, and D. V. Hansen, 1976: Physical oceanography of the Middle Atlantic Bight. Middle Atlantic Continental Shelf and the New York Bight, M. G. Gross, Ed., American Society of Limnology and Oceanography, Special Symposia, Vol. 2, 20-24.
Blanton, J. 0., 1981: Ocean currents along a nearshore frontal zone on the continental shelf of the southeastern United States. J. Phys. Oceanogr., 11, 1627-1637.
--, and L. P. Atkinson, 1983: Transport and fate of river discharge on the continental shelf of the southeastern United States. J. Geophys. Res .. 88, 4730-4738.
Boicourt, W. C., 1973: The circulation on the continental shelf from Chesapeake Bay to Cape Hatteras. Ph.D. dissertation, The Johns Hopkins University, 183 pp.
Camerlengo, A. L., and J. J. O'Brien, 1980: Open boundary conditions in rotating fluids. J. Comput. Phys., 35, 12-35.
Chao, S.-Y., 1988a: River-forced estuarine plumes. J. Phys. Oceanogr., 18, 72-88.
--, I 988b: Wind-driven motion of estuarine plumes. J. Phys. Oceanogr., 18, 1144-1166.
--, 1990: Tidal modulation of estuarine plumes. J. Phys. Oceanogr., 20, 1115-1122.
--, and W. C. Boicourt, 1986: Onset of estuarine plumes. J. Phys. Oceanogr., 16, 2137-2149.
Chapman, D. C., 1985: Numerical treatment of cross-shelf open boundaries in a barotropic coastal ocean model. J. Phys. Oceanogr., 15, 1060-1075.
Csanady, G. T., 1976: Mean circulation in shallow seas. J. Geophys. Res., 81, 5389-5399.
--, 1984: The influence of wind stress and river runoff on a shelfsea front. J. Phys. Oceanogr., 14, 1383-1392.
Davey, M. K., and P. D. Killworth, 1989: Flows produced by discrete sources of buoyancy. J. Phys. Oceanogr., 19, 1279-1290.
Garvine, R. W., 1974: Physical features of the Connecticut River outflow during high discharge. J. Geophys. Res., 79, 831-846.
--, 1977: Observations of the motion field of the Connecticut River plume. J. Geophys. Res., 82, 441-454.
--, 1984: Radial spreading of buoyant, surface plumes in coastal waters. J. Geophys. Res., 89, 1989-1996.
--, 1987: Estuary plumes and fronts in shelf waters: A layer model. J. Phys. Oceanogr., 17, 1877-1896.
--, 1991: Subtidal frequency estuary-shelf interaction: Observations near Delaware Bay. J. Geophys. Res., 96, 7049-7064.
Hendershott, M. C., and P. Malonotte-Rizzoli, 1976: Winter circulation of the Adriatic Sea. Deep-Sea Res., 23, 353-370.
Hickey, B. M., R. E. Thompson, H. Yih, and P.H. LeBlond, 1991: Velocity and temperature fluctuations in a buoyancy-driven current off Vancouver Island. J. Geophys. Res .. 96, 10 507-10 538.
Huthnance, J. M., 1984: Slope currents and "JEBAR." J. Phys. Oceanogr., 14, 795-810.
Kao, T. W., 1981: The dynamics of ocean fronts. Part II: Shelf water structure due to freshwater discharge. J. Phys. Oceanogr., 11, 1215-1223.
Malanotte-Rizzoli, P., and A. Bergamasco, 1983: The dynamics of the coastal region of the northern Adriatic Sea. J. Phys. Oceanogr., 13, 1105-1130.
Masse, A. K., 1990: Withdrawal of shelf water into an estuary: A barotropic model. J. Geophys. Res., 95, 16 085-16 096.
Mertz, G., and D. G. Wright, 1992: Interpretations of the JEBAR term. J. Phys. Oceanogr., 22, 301-305.
Mesinger, F., and A. Arakawa, 1976: Numerical methods used in atmospheric models. Vol. I. Global atmospheric research programme. GARP Pub. Ser. No. 17, 65 pp.
Miinchow, A., and R. W. Garvine 1993: Dynamical properties of a buoyancy driven coastal current. J. Geophys. Res., 98, 20 063-20 077.
O'Donnell, J., 1990: The formation and fate of a river plume: A numerical model. J. Phys. Oceanogr., 20, 551-569.
Oey, L.-Y., and G. L. Mellor, 1993: Subtidal variability of estuarine outflow, plume, and coastal current: A model study. J. Phys. Oceanogr., 23, 164-171.
Rattray, M., Jr. 1982: A simple exact treatment of the baroclinicitybathymetry interaction in a frictional, iterative, diagnostic ocean model. J. Phys. Oceanogr., 12, 997-1003.
Shaw, P. T., and G. T. Csanady, 1983: Self-advection of density perturbations on a sloping continental shelf. J. Phys. Oceangr., 13, 769-782.
Tomczak, M., Jr., 1985: The Bass Strait water cascade during winter 1981. Cantin. Shelf Res., 4l, 255-278.
Venne!, R. M., and P. Malanotte-Rizzoli, 1987: Coastal flows driven by alongshore density gradients. J. Phys. Oceangr., 17, 821-
.827. --, and--, 1990: The influence of a steady baroclinic deep
ocean on the shelf: The vertically well-mixed case. J. Phys. Oceangr., 20, 489-505.
Wang, F. C., 1984: The dynamics of a river-bay-delta system. J. Geophys. Res., 89, 8054-8060.
Weaver, A. J., and W.W. Hsieh, 1987: The influence of buoyancy flux from estuaries on continental shelf circulation. J. Phys. Oceanogr., 17, 2127-2140.
Whitham, G. B., 1974: Linear and Nonlinear Waves. Wiley, 636 pp.


![[Jurnal] Ketidakstabilan Refleksi Gelombang Nonliniear Pada Sloping](https://img.dokumen.tips/doc/110x75/55cf8f47550346703b9ab688/jurnal-ketidakstabilan-refleksi-gelombang-nonliniear-pada-sloping.jpg)