Embed Size (px)
Citation preview

©2017 Dynatrace
The Enterprise Guide to OpenStack MonitoringGoing beyond the Elastic Stack (ELK) with full stack monitoring

The Enterprise Guide to OpenStack Monitoring
Table of contents
2
©2017 Dynatracedynatrace.com @Dynatrace fb.com/dynatrace
Executive Summary .................................................................................................................................................................3
What industry analysts say ....................................................................................................................................................4
What is OpenStack? .................................................................................................................................................................5
The OpenStack monitoring space: Monasca, Zabbix, Elastic Stack (ELK Stack) ..................................................7
Monitoring with Dynatrace ..................................................................................................................................................10
Conclusion ...............................................................................................................................................................................18
Additional resources .............................................................................................................................................................19
Katalin Varga
Product Marketing Manager, Dynatrace
Katalin Varga focuses on educating the market about
AI-powered application performance monitoring
on OpenStack. With a background in product marketing
for IT and cloud technologies, she is passionate about
helping companies and organizations harness the
transformative power of OpenStack.
Twitter: @KatalinVarga
About the Author

The Enterprise Guide to OpenStack Monitoring 3
©2017 Dynatracedynatrace.com @Dynatrace fb.com/dynatrace
Today’s digital businesses are under more pressure than ever to do things faster, smarter, and more effectively. This is doubly true for companies who run customer facing applications. Technology is the difference between winning and losing on the battlefield of customer experience.
Cloud computing has been the biggest facilitator of new enterprise IT developments in
recent years. Consuming computing resources on a third party’s hardware reduces the
overhead of operations while keeping the employee number and owned assets low.
However, the public cloud’s security and privacy concerns raised the need for the private
cloud. A private cloud allows organizations the fast provisioning of applications on a
secure IT infrastructure, without the concern of private data being stored by a third-party
provider.
Enter OpenStack, the open cloud infrastructure platform. What started as a joint project
of NASA and Rackspace seven years ago, is today a key player in the cloud infrastructure
platform field. And what does the future hold? While Gartner called it a “science project” in
2015, in 2017 451 Research Group estimates that:
“OpenStack’s ecosystem will grow nearly five-fold in revenue, from US$1.27 billion market size in 2015 to US$5.75 billion by 2020.”
Indeed, AT&T, Walmart or Bloomberg are just a few of the big brands that already
repackaged their IT infrastructure into OpenStack.
Its explosive growth in popularity within the enterprise has enabled large, interoperable
application architectures and, with this, a need for app-centric monitoring of the
OpenStack cloud.
In this book, we will explore the state of OpenStack, as well as a few of its key components.
Then, we will see what are the main options when it comes to monitoring OpenStack.
Finally, we will walk through Dynatrace’s full stack monitoring process. By the end of this
book, you should not only know the main benefits OpenStack offers, but also have gained
confidence in monitoring your own OpenStack based applications with Dynatrace.
Executive summary

The Enterprise Guide to OpenStack Monitoring 4
©2017 Dynatracedynatrace.com @Dynatrace fb.com/dynatrace
What industry analysts say
“OpenStack plays a key role in increasing efficiency by creating a widely interoperable, function-rich platform to orchestrate datacenter resources and eliminate traditional IT siloes.”1
“At Wal-Mart, for example, OpenStack is the foundation for a global eCommerce platform that has reduced costs while also improving scalability and agility as the company introduces new products.”2
“OpenStack has become a credible cloud option and the market is growing quickly.”3
1. OpenStack in the Enterprise: A Potential Foundation for Your Cloud Strategy: http://www.sourcemcf.com/PublicDocs/5_51819_IDCSpotlightOpenStackintheEnterpriseAPotentialFoundationforYourCloudStrategy.pdf
2. OpenStack Is Now Ready For Business: http://www.openstack.org/assets/pdf-downloads/Brief-OpenStack-Is-Now-Ready.pdf
3. The OpenStack Pulse 2015: http://451research.com/report-long?icid=3523

Table of Contents
5
©2017 Dynatrace
Chapter 1
What is OpenStack?

The Enterprise Guide to OpenStack Monitoring 6
©2017 Dynatracedynatrace.com @Dynatrace fb.com/dynatrace
OpenStack is an open source cloud operating system used to develop private- and public-cloud environments. It consists of multiple interdependent microservices, and provides a production-ready IaaS layer for your applications and virtual machines. It’s a 2010 joint project of Rackspace and NASA, and it’s being supported by many high-profile companies including AT&T, IBM, and Red Hat.
Still getting dinged on its complexity, OpenStack currently has around 60 components,
also referred to as “services”, six of which are core components, controlling the most
important aspects of the cloud. There are components for the compute, networking and
storage management of the cloud, for identity and access management, and also for
orchestrating applications that run on it. With these, the OpenStack project aims to provide
an open alternative to giant cloud providers like AWS, Google Cloud, Microsoft Azure or
DigitalOcean.
A few of the most common OpenStack componentsThe OpenStack components are open source projects continuously developed by the
OpenStack Community. Let’s have a brief look at the most important ones:
Nova (Compute API)— Nova is the brain of the OpenStack cloud, meaning that it provides
on-demand access to compute resources by provisioning and managing large networks of
virtual machines.
Neutron (Networking service)— Neutron focuses on delivering networking-as-a-service
in its cloud.
Keystone (Identity service)— Keystone is the identity service used for authentication
and high-level authorization.
Horizon (Dashboard service)— Its Dashboard, providing a web-based user interface to
other services.
Cinder (Block Storage service)— The component that manages and provides access to
block storage.
Swift (Object storage service)— Swift provides eventually consistent and redundant
storage, and retrieval of fixed digital content.
Heat (Orchestration service)— The orchestration engine, providing a way to automate
the creation of cloud components.
What is OpenStack?

The Enterprise Guide to OpenStack Monitoring 7
©2017 Dynatracedynatrace.com @Dynatrace fb.com/dynatrace
The reasons behind the explosive growth in OpenStack’s popularity are quite straightforward. Because it offers open source software for companies looking to deploy their own private cloud infrastructure, it’s strong where most public cloud platforms are weak.
Vendor neutral API: Proprietary cloud service providers such as AWS, Google Compute
Engine and Microsoft Azure have their own application programming interfaces (API), which
means businesses can’t easily switch to another cloud provider, i.e. they are automatically
locked into these platforms. In contrast, OpenStack’s open API removes the concern of a
proprietary, single vendor lock-in for companies and creates maximum flexibility in the
cloud.
More flexible SLAs: All cloud providers offer Service Level Agreements, but these used to
be the same for all customers. In some cases, however, the SLA in your contract might be
completely irrelevant to your business. But thanks to the many OpenStack service providers
it is easy to find the most suitable one.
Data privacy: Perhaps the biggest advantage of using OpenStack is the data privacy it
offers. For some companies, certain data may be prohibited by law to be stored in public
cloud infrastructure. While a hybrid cloud makes it possible to keep sensitive data on
premise, the potential for vendor lock-in and data inaccessibility still remains. Not with
OpenStack. Here, all your data is on-premise, secured in your data center.
These are the reasons why companies like China Mobile, CERN or Bloomberg decided to
become OpenStack users.
Why the hype around OpenStack?

The Enterprise Guide to OpenStack Monitoring 8
©2017 Dynatracedynatrace.com @Dynatrace fb.com/dynatrace
URP!
At least this is what someone at OpenStack Summit Boston 2017 claimed in the crowd. This might not be too far-fetched, as the figures of the 2017 OpenStack Foundation User Survey show.
Nothing demonstrates OpenStack’s growth more than the rapid development of new
clouds, with 44% more deployments reported on this year’s survey than in 2016. And,
its clouds around the world have also become larger: 37% of clouds have 1,000 or more
cores. So what could speak more for its maturity if not the two-thirds of deployments in
production environments?
Is OpenStack really going to eat the world? And if most applications will run on OpenStack
in the future, who will make sure that app performance meets user expectations?
“OpenStack will eat the world”

Table of Contents
9
©2017 Dynatrace
Chapter 2
The OpenStack monitoring space: Monasca, Zabbix, Elastic Stack (ELK Stack)

The Enterprise Guide to OpenStack Monitoring 10
©2017 Dynatracedynatrace.com @Dynatrace fb.com/dynatrace
MonascaMonasca is the OpenStack Community’s in-house project for monitoring OpenStack.
Defined as “monitoring-as-a-service”, Monasca is a multi-tenant, highly scalable, fault-
tolerant open source monitoring tool. It works with an agent and it’s also easily extendable
with plugins. After installing it on the node, users have to define what should be measured,
what statistics should be collected, what should trigger an alarm, and how they want to
be notified. Once set, Monasca shows metrics like disk usage, CPU usage, network errors,
ZooKeeper average latency, and VM CPU usage.
ZabbixZabbix is an enterprise open source monitoring software for networks and applications.
It’s best suited to monitor the health of servers, network devices, and storage devices, but
it doesn’t collect highly granular or deep metrics. Once installed and configured, Zabbix
provides availability and performance metrics of hypervisors, service endpoints, and
OpenStack nodes.
Elastic Stack (ELK Stack)Perhaps the most widely used open source monitoring tool which also works well
with OpenStack is the Elastic Stack (aka ELK). It consists of three separate projects —
Elasticsearch, Logstash, and Kibana — and is driven by the open source vendor Elastic.
The Elastic philosophy is easy: it couples good search capabilities with good visualization,
which results in outstanding analytics. Their open source analytics tool — which now rivals
big players like Microsoft, Oracle or Splunk — supports OpenStack too.
Monitoring OpenStack with the ELK Stack starts by installing and configuring the its log
collector tool, Logstash. Logstash is the server-side data processing pipeline that ingests
data from a multitude of sources simultaneously, transforms it, and then sends it to
Elasticsearch for indexing. Beats is a lightweight alternative to Logstash.
Through the API, you get good insights into OpenStack Nova, the component responsible
for provisioning and managing the virtual machines. From Nova, you get the hypervisor
metrics, which give an overview of the available capacities for both computation and
storage. Nova server metrics provide information on the virtual machines’ performance.
Tenant metrics can be useful in identifying the need for change with quotas in line with
resource allocation trends.
Finally, you want to visualize all the collected OpenStack performance metrics. Kibana is
a browser-based interface that allows you to build graphical visualizations of the log data
based on Elasticsearch queries. It allows you to slice and dice your data and create bar, line
or pie charts and maps on top of large volumes of data.
The OpenStack monitoring space: Monasca, Zabbix, Elastic Stack (ELK Stack)

The Enterprise Guide to OpenStack Monitoring 11
©2017 Dynatracedynatrace.com @Dynatrace fb.com/dynatrace
OpenStack monitoring challenges
Monitoring OpenStack is not an easy task. Getting a clear overview of the complex
application ecosystem built on OpenStack is even more difficult. Even though they provide
good visibility into different OpenStack components and use cases, open source tools like
the ELK Stack clearly have several disadvantages:
> They are unable to see the causation of events
> They fail at understanding data in context
> They rely heavily on manual configuration
Because they are missing the big picture, companies often implement different
monitoring tools for different silos (e.g. infrastructure monitoring, log monitoring, user
experience monitoring). However, they quickly realize that with dozens
of tools they are unable to identify the root cause of a performance issue. Under these
circumstances, how could they reduce MTTR and downtime? And with a number of
separate tools, how could they ever see performance trends or predict capacity needs?
By using different monitoring tools for different use cases, companies miss out exactly on
the monitoring skills today’s complex business applications require:
> Full stack power, or to see the big picture
> AI-power, to understand data in context
> Automation power, to do this without any manual intervention

Table of Contents
12
©2017 Dynatrace
Chapter 3
Monitoring with Dynatrace

The Enterprise Guide to OpenStack Monitoring 13
©2017 Dynatracedynatrace.com @Dynatrace fb.com/dynatrace
Monitoring with Dynatrace
That’s why it’s so important to look at your OpenStack environment holistically, as opposed to
the single monitoring use cases that traditional monitoring tools provide. You need to cover:
> OpenStack service performance
> Service availability
> Supporting technologies: HAproxy, Rabbit MQ, MySQL
> Resource utilization metrics
> Log analysis
> APM
> Problem alerting with root cause analysis
In the next section we’ll take a look at how
Dynatrace gives you a perfect overview
of OpenStack and everything running
on it in six easy steps.
Since we started our journey with OpenStack, we have had a lot of interesting conversations
with OpenStack cloud users. As a general conclusion, we learned that the most important
metrics and capabilities they are looking for include:
> OpenStack service performance
> Service availability
> Resource utilization metrics
> Log monitoring
However, what we also learned is that OpenStack is a different kind of beast: due to its elusive
nature, problems with one OpenStack service can manifest themselves as performance issues
within other services.
Take this example: an OpenStack admin notices an issue when launching a new VM or
attaching a Cinder volume. His first thought might be to look into the log files of Nova and
Cinder services. After combing through hundreds of megabytes of log data, he might learn
however that the root cause of the issue resides within different OpenStack services, or
supporting technologies like load balancers (HAproxy), message brokers (RabbitMQ), and
databases (MySQL).
The Enterprise Guide to OpenStack Monitoring 14
©2017 Dynatracedynatrace.com @Dynatrace fb.com/dynatrace
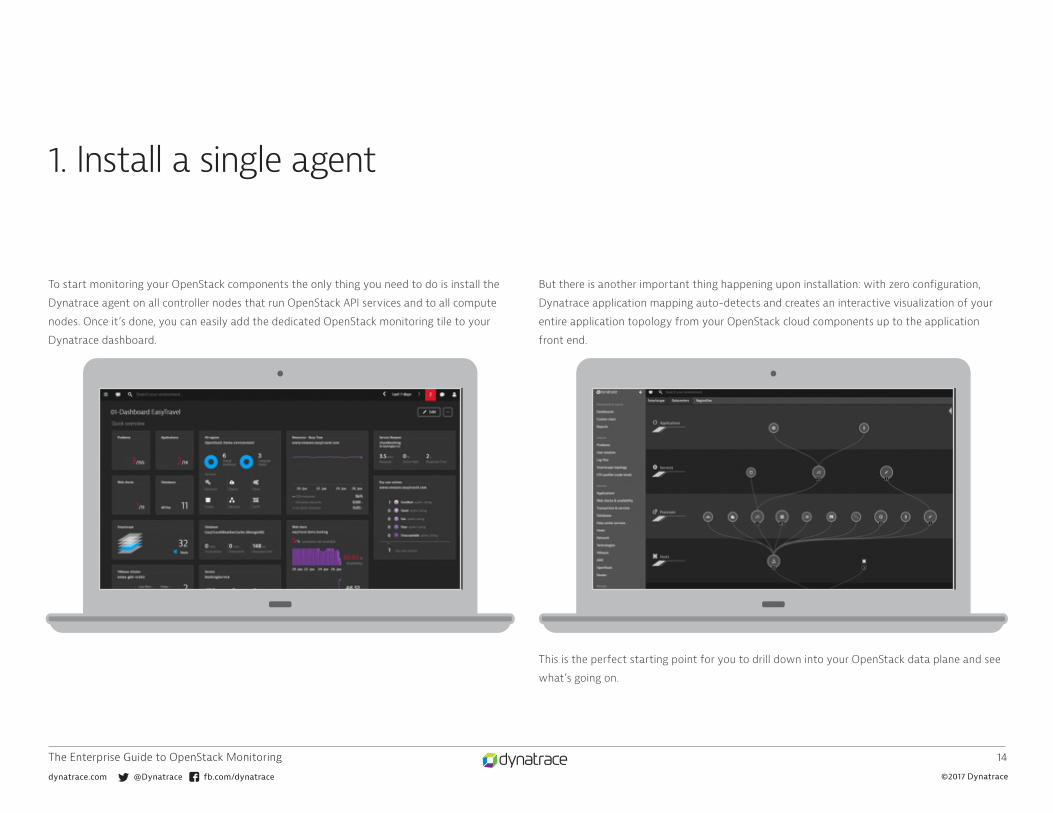
But there is another important thing happening upon installation: with zero configuration,
Dynatrace application mapping auto-detects and creates an interactive visualization of your
entire application topology from your OpenStack cloud components up to the application
front end.
This is the perfect starting point for you to drill down into your OpenStack data plane and see
what’s going on.
To start monitoring your OpenStack components the only thing you need to do is install the
Dynatrace agent on all controller nodes that run OpenStack API services and to all compute
nodes. Once it’s done, you can easily add the dedicated OpenStack monitoring tile to your
Dynatrace dashboard.
1. Install a single agent

The Enterprise Guide to OpenStack Monitoring 15
©2017 Dynatracedynatrace.com @Dynatrace fb.com/dynatrace
In the Compute view you get a general overview of your controller and compute nodes, your
Cinder volumes, Neutron subnets and your Swift objects. But keep scrolling because more
valuable insights are coming.
The Environment dynamics section tracks how the number of running virtual machines evolves
over time. An increasing trend may indicate the need for capacity adjustments. Crucial details
regarding the number of VMs that have been spawned and their average launch times is also
included. If you notice launch times going up, you may want to investigate the reasons why.
The Events section lets you know on which compute node each VM is launched and stopped.
The Compute section shows you how well your compute nodes are performing, which virtual
machines are currently running on those nodes, and how the VMs contribute to overall
resource usage.
You can slice and dice your OpenStack monitoring data with filters—compute nodes and
virtual machines can be filtered based on region, security group name, compute node name,
availability zone, and more. Such filtering is particularly useful for tracking down elusive
performance issues within large environments.
2. Analyze your OpenStack compute nodes

The Enterprise Guide to OpenStack Monitoring 16
©2017 Dynatracedynatrace.com @Dynatrace fb.com/dynatrace
If you switch to the Controller section, you get a complete overview of your OpenStack
services (Keystone, Glance, Cinder, Neutron and others) and their basic performance metrics
like CPU, Memory usage, Connectivity.
3. Gain insights into your OpenStack controller node
From here you can select the service you are interested in and drill down into it on a process
page to find out more about its performance. Here, Dynatrace provides:
> OpenStack service availability
> Service performance
> Connectivity
> Process-specific metrics
> …and direct access to the log files of all OpenStack services

The Enterprise Guide to OpenStack Monitoring 17
©2017 Dynatracedynatrace.com @Dynatrace fb.com/dynatrace
The technologies deployed alongside OpenStack — load balancers, message queues and
databases — are often potential problem areas about which OpenStack admins need to be
aware. Take this RabbitMQ connectivity problem for example.
4. Keep an eye on supporting technologies
Thanks to the additional RabbitMQ counters provided by Dynatrace we can easily find the
root cause.
On the Further details section of the RabbitMQ process page we can see that this process
was launched with a default file descriptor limit. Once this limit was exceeded, RabbitMQ
stopped accepting new connections. This resulted in a connectivity problem.

The Enterprise Guide to OpenStack Monitoring 18
©2017 Dynatracedynatrace.com @Dynatrace fb.com/dynatrace
In the previous steps we’ve seen how Dynatrace deals with infrastructure level
components, like compute nodes and OpenStack services. But if that’s all a monitoring tool
gives you, be sure you see only a part of the big picture.
To get the most out of your OpenStack monitoring, you need a way to correlate what’s
happening in OpenStack with what’s happening in the rest of your application environment.
Besides providing insights into your OpenStack control plane, Dynatrace also gives deep
visibility into the applications you run in your private cloud. After installing the Dynatrace
agent to the VM’s, you get an unparalleled insight into real user and business metrics.
Take the example: this problem notification lets us know that in one of our web
applications running on OpenStack the user action duration has seriously degraded.
A-ha, so that’s why there were no conversions in the last two hours.
But why?
5. See the overall health of your applications running on OpenStack

The Enterprise Guide to OpenStack Monitoring 19
©2017 Dynatracedynatrace.com @Dynatrace fb.com/dynatrace
If your daily activity involves monitoring, I’m quite sure one of your favorite questions is
“but why”. This is where Dynatrace’s automated root cause analysis comes in handy.
While manually hunting down performance problems in highly distributed OpenStack
environments is a time-consuming (if not impossible) process, Dynatrace makes it possible
to automatically pinpoint application and infrastructure issues in seconds using artificial
intelligence.
By examining billions of dependencies, Dynatrace problem detection goes beyond
correlation and gives you causation. Thus, in the following example it identified that the
actual root cause of the problem was a CPU saturation on the OpenStack-Business-Backend
host. Nice, from here we can start remediating the issue.
6. Understand the causes of failing services

The Enterprise Guide to OpenStack Monitoring 20
©2017 Dynatracedynatrace.com @Dynatrace fb.com/dynatrace
It’s not yet seven and OpenStack is really going to eat the world. Becoming more mature,
OpenStack environments also need app-centric monitoring that is mature enough to handle
their complexity.
Open source monitoring tools like the Elastic Stack (ELK Stack) are all strong in their specific
areas. Before choosing anything however, consider what you need to monitor. It could be
only a few things or it could be everything. And then choose the tool that will make your
monitoring life easier.
We hope this book has given you some useful insights into the state of OpenStack, the
current monitoring tool options, and how Dynatrace’s specialties — Full stack power, AI-
power, and Automation power — really make a difference.
Even though these might sound like marketing buzzwords for some, at the moment there is
no other monitoring tool capable to see the big picture, understand data in context, and do
this without any manual intervention.
“To help customers get the most out of Red Hat’s OpenStack offerings and our open hybrid cloud solutions, we work closely with technology companies like Dynatrace that provide powerful and complementary solutions. We look forward to continued collaboration with Dynatrace as an important member of Red Hat’s OpenStack ecosystem.”
— Radhesh Balakrishnan General Manager, OpenStack, Red Hat
Conclusion

The Enterprise Guide to OpenStack Monitoring 21
©2017 Dynatracedynatrace.com @Dynatrace fb.com/dynatrace
Dynatrace Digital Performance Platform — it’s digital business…transformed.
Successfully improve your user experiences, launch new initiatives with confidence, reduce operational complexity and go to market faster than your competition. With the world’s most complete, powerful and flexible digital performance platform for today’s digital enterprises, Dynatrace has you covered.
If you would like to see Dynatrace at work, take our 15-day free trial or reach out to [email protected]
Additional resources
Web pages
OpenStack monitoring
Dynatrace vs. Cisco AppDynamics vs. NewRelic vs. Datadog vs. Open source
OpenStack monitoring features
Videos
Dynatrace for OpenStack 1-minute explainer
Recommended reading
OpenStack network mystery: How 2 bytes cost me two days of trouble
Six mistakes in your OpenStack monitoring process…and how to fix them

Dynatrace has redefined how you monitor today’s digital ecosystems. AI-powered, full stack and completely automated, it’s the only solution that provides answers, not just data, based on deep insight into every user, every transaction, across every application. The world’s leading brands, including, 72 of the Fortune 100, trust Dynatrace to optimize customer experiences, innovate faster and modernize IT operations with absolute confidence.
Learn more at dynatrace.com
10.06.17 2468_EBK_jw


![[OpenStack Day in Korea] Keynote#2 - Bringing OpenStack to the Enterprise Datacenter](https://img.dokumen.tips/doc/110x75/554a09d5b4c905507a8b5823/openstack-day-in-korea-keynote2-bringing-openstack-to-the-enterprise-datacenter.jpg)