Embed Size (px)
Citation preview

Monitoring Across OpenStack CloudsHow to Automate Incident Management in OpenStack-Enabled Environments.
Richard Whitehead, Evangelist in Chief - Moogsoft
@Moogsoft@rwhitehead

What we will cover today
• Challenges to troubleshoot OpenStack hybrid clouds• Summary of different approaches• A quick user story• How to streamline problem resolution• Introduction to data-driven situation management
©2015 Moogsoft Inc. All rights reserved. Confidential. The "HappyMoo" logo is a registered trademark of Moogsoft Incorporated. All other names and trademarks used are the property of their respective owners. 2
Live Q&A at the end! Submit your questions via chat

Who’s Moogsoft?
3
2008 2011 2012 2013 2014
Research begins onmachine-learning
algorithms
Moogsoftincorporated
Incident.MOOGversion 1.0deployed at
multiple customers
$9MSeries A
$14.3MSeries B
©2015 Moogsoft Inc. All rights reserved. Confidential. The "HappyMoo" logo is a registered trademark of Moogsoft Incorporated. All other names and trademarks used are the property of their respective owners.

The Results
• > 2,000,000 entities (virtual & physical) under management
• Find issues 12-24 hours before legacy systems
• See 1000s of outages that legacy systems missedCustomers Partners

Why Are We All Here?
User Survey
November 2014

OpenStack Promise:
Agility, open, savings
Enabling NFV, PaaS, SaaS, etc… NFV
“OpenStack enterprise users say
it's ready for primetime” but…
Why Are We All Here. . .On This Webinar?
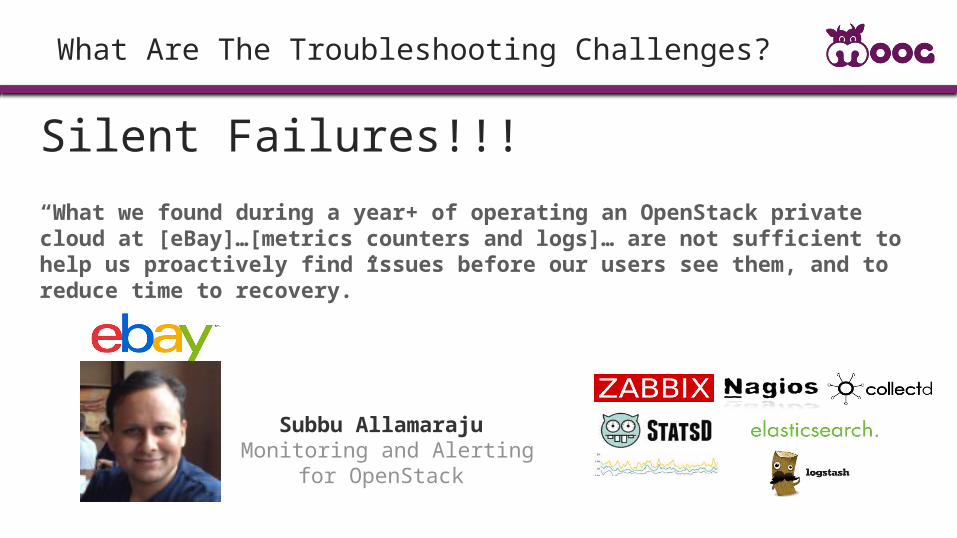
What Are The Troubleshooting Challenges?
Silent Failures!!!
“What we found during a year+ of operating an OpenStack private cloud at [eBay]…[metrics counters and logs]… are not sufficient to help us proactively find issues before our users see them, and to reduce time to recovery.”
Subbu Allamaraju Monitoring and Alerting for
OpenStack
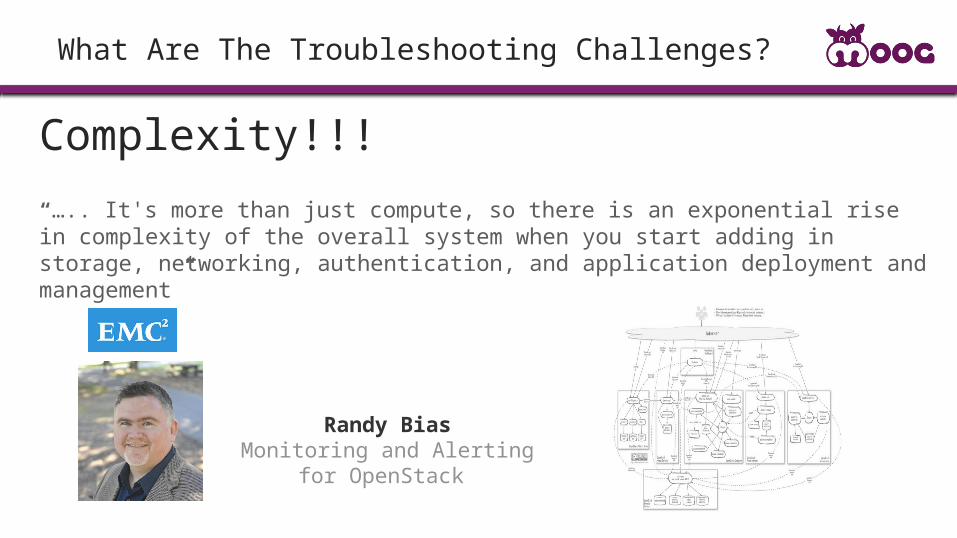
What Are The Troubleshooting Challenges?
Complexity!!!
“….. It's more than just compute, so there is an exponential rise in complexity of the overall system when you start adding in storage, networking, authentication, and application deployment and management”
Randy BiasMonitoring and Alerting for
OpenStack

OpenStack Implementation
• Multiple (13) fundamental interoperable components (projects)
• Multiple domains to monitor– Service daemons
– nova-compute, glance-registry, etc.
• Ensure they are running
• Ensure they are functioning
– Tempest, Rally
– Instance reachability
– iptables / nat
– attached volumes
– left-open iSCSI sessions
– RabbitMQ queue depth and health
– OVS tunnels
– Tenant Functionality
– “Canary” Instances
OpenStack, is an open technology reference architecture
https://wiki.openstack.org/wiki/Operations/Monitoring

OpenStack Implementation
• Multiple Vendors• Multiple Management Domains
– Nagios
– Sensu
• Multiple Alert Mediums & sources– Email
– SMS
– Jabber / XMPP
– IRC
– NRPE
– collectd
– StatsD
– RabbitMQ
• Holistic & Tenant Based Monitoring Requirements
OpenStack, is a vendor independent reference architecture

OpenStack Implementation
Private cloud (on-prem, colo), or public cloud, or a combination!
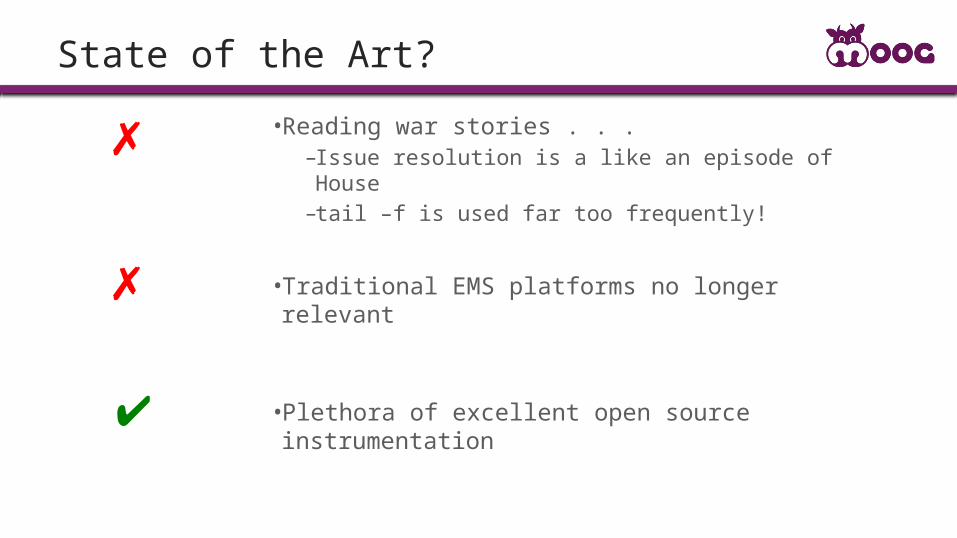
State of the Art?
•Reading war stories . . .–Issue resolution is a like an episode of House–tail –f is used far too frequently!
•Traditional EMS platforms no longer relevant
•Plethora of excellent open source instrumentation
✔
✗
✗

Management Requirements: Table Stakes
• Single Pane of Glass
–Just because you need lots of tools, doesn’t mean you have to use all of them at once
–You must consume all events and status messages, from all sources
–From all vendors
–Must ingest change data (Puppet etc.)
–User feedback (trouble tickets)
• Volume
–100s of thousands of cores, thousands of hypervisors

Management Requirements: FTW!
• Team Oriented
– Social collaboration, instant, dynamically created, problem driven virtual “war-room”
– Chat enabled, must also link to trouble-ticketing systems
• Guided Diagnostics
– Clustered “narrative” of issues, in real-time…
– Integrated ChatOps
– Automated Run-Books
• Data Driven!
– Clustering AND configuration from the data (and external sources)
– “Zero-Maintenance”
– Service Oriented, Software Defined Solutions

15
What Do We Do?
©2015 Moogsoft Inc. All rights reserved. Confidential. The "Happy Moo" logo is a registered trademark of Moogsoft Incorporated. All other names and trademarks used are the property of their respective owners.
Incident early warning and collaborative remediation system for IT Ops and DevOps
A holistic, comprehensive, collaborative view of your entire infrastructure, real and virtual“A Next-Generation Manager of Managers, for The New Era of IT”
Real-timedata ingestionacross entire
production stack
Detects andcontextualizesapplication and
service problems as they unfold

OpenStack Cell Not Opening Reliably
Troubleshooting Challenges: Where To Start?
Compute failure?
Dashboard (Horizon) failing?
Notify cloud admin and tenants first?
RabbitMQ message delivery failed?
Silent failure during provisioning?
MySQL database failed?
Oversubscribed switch ports?
Hardware layer?
Tenant Applications

Silos of Aggregation Domains of
SupportMajor Incident
War RoomTicket
Escalation
Run the diagnostic
Check out performance
Check out the log files
Run the diagnostic
Check out performance
Check out the log files
Actionable fault?
Limited Warning Resource Intensive Diagnosis High MTTR
Hours of Finger Pointing
MySQL read / write failed
CEPH replication
Network retransmission
JBOD failed
Nova cell failed
Previous Process

Problems With This Legacy Approach
Lengthy, ineffective, “spam” workloads:
• Operators overwhelmed
• High volume of tickets
• All non P1 issues ignored
• Many P2 issues cause an incident
• Multiple related issues, but no context
Sea of Red
Ocean of Metrics
Lake of Logs

Situationally Enabling The Existing Processes
Situation Rooms
Informed activities
Document activities
Auto-Anomaly Detection
Reduced Escalations
Share knowledge
Early Warning Earlier Diagnosis Faster Resolution
Situation Awareness
Time Saving Opportunity
ResourceSavingOpportunity
MySQL read / write failed
CEPH replication
Network retransmission
JBOD failed
Nova cell failed

Earlier and Faster Detection of Issues
Millions of raw events clustered into100s of real “situations”

Faster Problem RemediationSee how issues unfolded over
time
See related issues unfolding
Instant search for similar past situations
Automatic synchronization
with any ticketing systems
Automatic invites to only the relevant
experts

Data Driven Management
Nova
Keystone
Glance
Horizon
Cinder
Neutron
Use “tagging” to create self-describing data.e.g. Core label, tenant name etc.

Data Driven Management
Nova
Keystone
Glance
Horizon
Cinder
Neutron
Use “tagging” to create self-describing data.e.g. Core label, tenant name etc.
MassData
Processing
“Clean”

Data Driven Management
Nova
Keystone
Glance
Horizon
Cinder
Neutron
Use “tagging” to create self-describing data.e.g. Core label, tenant name etc.
MassData
Processing
Further enriching from externalized data sources automates configuration
Enrichment
ps aux | grep nova-computestatus nova-computegrep AMQP /var/log/nova/nova-compute
“Contextualize”

Data Driven Management
Nova
Keystone
Glance
Horizon
Cinder
Neutron
Use “tagging” to create self-describing data.e.g. Core label, tenant name etc.
MassData
Processing
“Tenant A”EventEventEventEvent
“AvailabilityGroup B”
EventEventEventEvent
Further enriching from externalized data sources automates configuration
Enrichment
ps aux | grep nova-computestatus nova-computegrep AMQP /var/log/nova/nova-compute
AutomatedAlertClustering
“Contextualize”

Data Driven Management
Nova
Keystone
Glance
Horizon
Cinder
Neutron
Use “tagging” to create self-describing data.e.g. Core label, tenant name etc.
MassData
Processing
“Tenant A”EventEventEventEvent
“AvailabilityGroup B”
EventEventEventEvent
Further enriching from externalized data sources automates configuration
Auto-remediate, or collaboratively diagnose in a dynamically created virtual war-room
Enrichment
ps aux | grep nova-computestatus nova-computegrep AMQP /var/log/nova/nova-compute
AutomatedAlertClustering
“Collaborate”

Data Driven Management
Nova
Keystone
Glance
Horizon
Cinder
Neutron
Use “tagging” to create self-describing data.e.g. Core label, tenant name etc.
MassData
Processing
“Tenant A”EventEventEventEvent
“AvailabilityGroup B”
EventEventEventEvent
Further enriching from externalized data sources automates configuration
Auto-remediate, or collaboratively diagnose in a dynamically created virtual war-room
Enrichment
ps aux | grep nova-computestatus nova-computegrep AMQP /var/log/nova/nova-compute
AutomatedAlertClustering
28
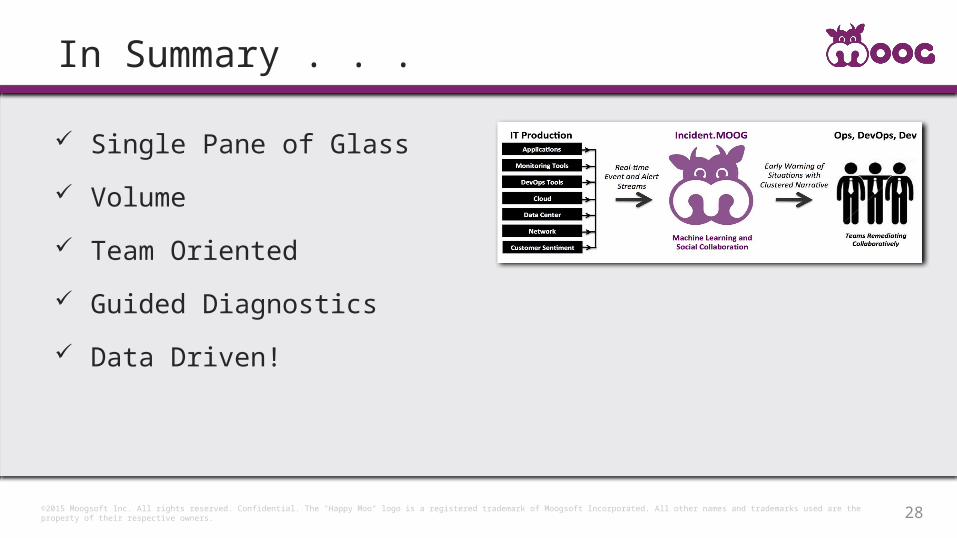
In Summary . . .
©2015 Moogsoft Inc. All rights reserved. Confidential. The "Happy Moo" logo is a registered trademark of Moogsoft Incorporated. All other names and trademarks used are the property of their respective owners.
Single Pane of Glass
Volume
Team Oriented
Guided Diagnostics
Data Driven!

@moogsoft
www.moogsoft.com
29©2014 Moogsoft Inc. All rights reserved. Confidential. The "HappyMoo" logo is a registered trademark of Moogsoft Incorporated. All other names and trademarks used are the property of their respective owners.
www.linkedin.com/company/moogsoft
also:
Tell us what you think! Submit your questions via chat