Embed Size (px)
Citation preview

by KIRSTY BOSLEY
Research Report Number 53


Central Fire Brigades Advisory Council Scottish Central Fire Brigades Advisory Council
Joint Committee on Fire Research
The Effects of Wind Speed on Escape Behaviour
through Emergency Exits Summary Report
By KIRSTY BOSLEY
The text of this publication may not be reproduced, nor may talks or lectures based on material contained
within the document be given, without the written consent of the Head of the Home Office Fire Research
and Development Group.
Research Report Number 53 1992
© Crown Copyright ISBN 0-86252-745-7


The Effects of Wind Speed on Escape Behaviour through
Emergency Exits Summary Report
The smoke control systems used in many public buildings remove smoke and hot fumes through an exhaust, replacing it with fresh air from outside. The incoming air can attain relatively high velocities in the apertures where it enters the building. This paper examines the effects on members of the public of various wind speeds through an emergency exit and suggests a possible revised inlet air speed limit.
INTRODUCTION
In the event of a fire in an atrium building, such as a shopping precinct, the major danger to the public is from the smoke produced. To reduce this danger, smoke control measures are a required part of the fire safety system. These measures involve removing smoke from the region affected and allowing fresh air to replace it.
Two main smoke removal methods are prevalent:
natural ventilation, where vents are opened and the smoke flows out.
mechanical ventilation, where smoke is pumped out using fans.
In the latter case, fresh air is effectively sucked in through available openings. Where this happens the air is likely to enter by means of the emergency exits . If this is so then the incoming air speed is currently recommended not to exceed 3 metres per second (Reference 1).
The design of the smoke control systems in a building is thus affected by this air speed limit. If the limit is exceeded, it may be necessary to reduce the air intake speed by increasing the intake area with either automatic air vents, or extra doors.
The Home Office Fire Experimental Unit of the Fire Research and Development Group was asked to look at the influence of the intake air speed on people's ability to escape through an emergency exit of a shopping precinct, to investigate the validity of the current air speed limit of 3 metres per second, and if necessary, to advise on an acceptable alternative limit.
This figure of 3 metres per second is based on previous research work by the Building Research Establishment (Reference 2). This research suggested that wind speeds over 5 metres per second could cause discomfort to pedestrians . However, that research related to the level of discomfort occasioned by high wind speeds in and around shopping centres making it too cold to sit on benches or stand around, or causing dust and litter to be blown about. It was considered that a maximum intake air speed figure based on this criterion was open to challenge.
Whilst a number of agencies would have been capable of constructing a wind tunnel suitable for this study, the psychological effects (i.e. people's feelings of safety when escaping through an air flow) were considered to be as important in this project as the physical effects.
The project was therefore contracted out to Cranfield Institute of Technology where the Applied Psychology Department has considerable experience of studies into escape behaviour, and is part of the Department of Aeronautics, which has expertise in the use of wind tunnels.
THE TEST RIG
The approach adopted was to simulate the conditions likely to prevail when a smoke control system comes into action. To this end a wind tunnel test rig was constructed and volunteers recruited to escape through it under varying headwind conditions, having entered it under a crosswind. The physical and psychological effects on the whole range of volunteers could then be assessed at a number of different air speeds.
Direction of Travel
~ Doorway
Fan
Ante Room
(==J Air
Direction
Exit Ramp
Indicates the preferred path marked in tape
Shaded areas represent the corridor sections for analysis
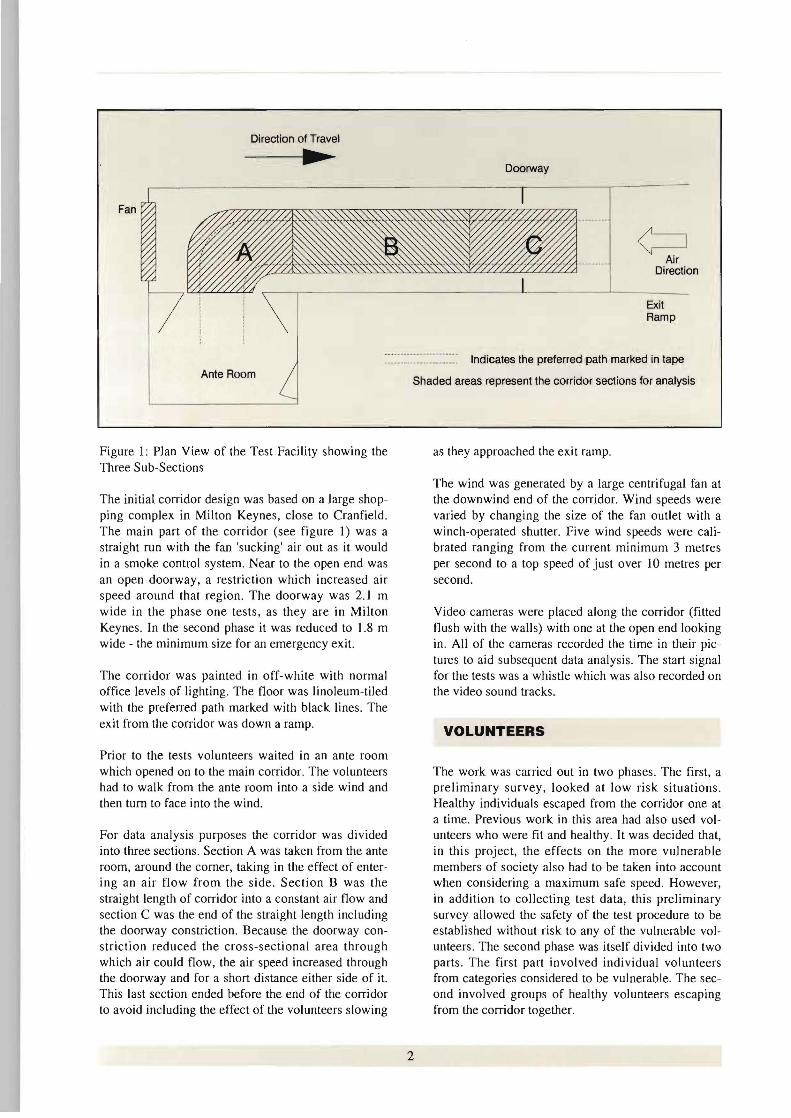
Figure 1: Plan View of the Test Facility showing the Three Sub-Sections
The initial corridor design was based on a large shopping complex in Milton Keynes. close to Cranfield . The main part of the corridor (see figure 1) was a straight run with the fan 'sucking' air out as it would in a smoke control system. Near to the open end was an open doorway. a restriction which increased air speed around that region . The doorway was 2.1 m wide in the phase one tests. as they are in Milton Keynes. In the second phase it was reduced to 1.8 m wide - the minimum size for an emergency exit.
The corridor was painted in off-white with normal office levels of lighting. The floor was linoleum-tiled with the preferred path marked with black lines. The exit from the corridor was down a ramp.
Prior to the tests volunteers waited in an ante room which opened on to the main corridor. The volunteers had to walk from the ante room into a side wind and then turn to face into the wind.
For data analysis purposes the corridor was divided into three sections. Section A was taken from the ante room. around the corner. taking in the effect of entering an air flow from the side. Section B was the straight length of corridor into a constant air flow and section C was the end of the straight length including the doorway constriction. Because the doorway constriction reduced the cross-sectional area through which air could flow. the air speed increased through the doorway and for a short distance either side of it. This last section ended before the end of the corridor to avoid including the effect of the volunteers slowing
as they approached the exit ramp.
The wind was generated by a large centrifugal fan at the downwind end of the corridor. Wind speeds were varied by changing the size of the fan outlet with a winch-operated shutter. Five wind speeds were calibrated ranging from the current minimum 3 metres per second to a top speed of just over 10 metres per second.
Video cameras were placed along the corridor (fitted flush with the walls) with one at the open end looking in. All of the cameras recorded the time in their pictures to aid subsequent data analysis . The start signal for the tests was a whistle which was also recorded on the video sound tracks.
VOLUNTEERS
The work was carried out in two phases. The first. a preliminary survey. looked at low risk situations. Healthy individuals escaped from the corridor one at a time. Previous work in this area had also used volunteers who were fit and healthy. It was decided that. in this project, the effects on the more vulnerable members of society also had to be taken into account when considering a maximum safe speed. However, in addition to collecting test data, this preliminary survey allowed the safety of the test procedure to be established without risk to any of the vulnerable volunteers. The second phase was itself divided into two parts. The first part involved individual volunteers from categories considered to be vulnerable. The second involved groups of healthy volunteers escaping from the corridor together.
2

Direction of travel
Fan
/Doorway
Row 1 1 2 3 H~ Row 2 / 4 5
Row 3 6 7 8
Figure 2: The Start Positions for the Group Tests
In phase one, 12 volunteers were recruited from each of the following categories:
I. Females between 20 and 39
2. Males between 20 and 39
3. Females between 40 and 54
4. Males between 40 and 54.
(n phase two, where more vulnerable members of the public were selected, the target was to test a cross section of people who might have difficulty evacuating a shopping precinct, but who nevertheless represented regular shopping centre users. Several categories were covered:
I. Adults with young children in pushchairs For this category the same pushchair was used in all of the tests.
2. Adults over the age of 60
3. Children between the ages of 12 and 14 It would have been preferable to include younger children in this category, but the ethical and insurance implications involved prevented their inclusion. The children were all recruited from the same class of a local secondary school.
4. Experienced wheelchair pushers and occupants Due to the lack of any facilities for the disabled at the test site in Cranfield, this category became entirely restricted to wheelchair pushers. The same wheelchair and occupant was used every time for consistency.
5. Adults with some form of restricted mobility Adults with restricted mobility who were willing to participate in these tests were particularly hard to come across. Because of this, fewer participants were tested in this category than was originally intended.
In addition to these categories, phase two of the work also investigated group evacuations. These represented the likely scenario in the event of a fire, where people leaving en masse would restrict the emergency exit. This would alter the evacuation situation not only by impeding the progress of other volunteers, but also by increasing the wind speed around the doorway constriction by reducing the area through which air could flow.
Groups of eight people were evacuated, firstly in a close-knit unit and then in a more dispersed group. The two types of groupings simulate different situations :
1. Where the danger is obvious and everyone is trying to leave at once (the close-knit unit).
2. Where the danger is not obvious and people are leaving in their own time with no urgency (the dispersed group).
TEST PROCEDURE
During phase one of the tests, ten proper and two practice evacuations were completed by each volunteer, that is one evacuation walking and one running at each of the five wind speeds. During phase two, the individuals and groups each completed one practice
3

and five proper evacuations, each evacuation made as quickly as the volunteer felt comfortable. The practice evacuations were made at an intermediate wind speed, i.e. not one of the calibrated speeds. The test evacuations were made in a randomised order to avoid any preconceptions or learning.
Before the tests volunteers were briefed about the aims of the project and about what was expected of them. They were offered ear defenders if they wanted them (the fan was very noisy). Each was then given a questionnaire, to be filled in after each test, designed to determine their perception of the effect of the wind, before being taken to the wind corridor.
In phase one, the volunteer was asked to step up to the starting line in the ante room and asked either to walk as fast as possible or to run. The test started when the whistle was blown. The same routine was used in phase two, except that volunteers were asked to escape as quickly as they felt comfortable.
During the group evacuations, volunteers were assigned a start position in the ante room (see figure 2) . All the volunteers started from their assigned positions and were asked to leave the corridor as quickly as they felt comfortable. For the close-knit groups all volunteers started at a single whistle blast. For the
Figure 3 : A volunteer in the wind tunnel.
dispersed groups each of the three rows of volunteers started separately, requiring three blasts of the whistle at 2 second intervals.
When each volunteer reached the end of the tunnel he or she returned to the ante room and completed their questionnaire. At the end of all of the tests, the volunteers were taken to a quiet room for debriefing.
DATA ANALYSIS
a. Video Recordings
The physical effect of various wind speeds, that is the amount by which people were slowed down, was established by timing video recordings of each test. Video cameras were set up to record the start and end of each section of the corridor. The time for each volunteer to complete each section was noted and also the total time taken to negotiate the whole corridor.
b. The Questionnaire
In all tests the psychological effects of the air speed were gauged by means of a questionnaire. The questionnaire aimed to ascertain volunteers' perception of safety and wind effect. All aspects were evaluated on a scale of 1 to 10. For each separate section of the corridor volunteers were asked :
"To what extent did the air flow affect your progress along the corridor ?"
Then for the corridor as a whole they were asked:
"To what extent did the air flow affect your: clothes hair face and eyes ?"
"How safe did you feeJ whilst escaping from the corridor?" .
"Did any other factors impede your progress along the corridor?" .
Space was allowed for the volunteer to explain what had impeded them and how.
During phase two of the project an extra question regarding the effects of other people on the individual's progress was asked.
4

RESULTS
a. Phase one - Healthy Individuals
Running and walking evacuations were considered to represent different situations and were treated separately.
The mean and the standard deviation of the escape times for walking and running were calculated for each wind speed, firstly taking into account the whole corridor and then considering each section separately. These values were then analysed to establish whether significant differences in escape times were encoun tered and which wind speeds (if any) were primarily responsible.
'Significance' is used here in the statistical sense, where, at the 5% significance level an occurrence would happen by chance 5 times in every 100, and at the I % level it would happen only once every 100 times. Thus if an increase in mean evacuation times from 5.7 seconds to 6.1 seconds is significant at the 1 % level (highly significant) it is likely to happen by chance fewer than one in every 100 tests, therefore the increase is judged to be caused by the wind.
The volunteers' perceived safety values, derived from the questionnaires, were analysed in a similar way to the evacuation timings.
Higher wind speeds did produce slower escape times than lower wind speeds, and the highest wind speed (la mls) had a significantly worse effect than other wind speeds when healthy adults were tested at walking pace.
With volunteers running , the second highest wind speed (7 .5 mls) also had a significant effect on escape times, though the effect of the highest speed was even greater.
It was clear in the responses to the perceived effect of the wind that volunteers were able to distinguish differences between the wind speeds, despite the randomised order of wind speeds when testing.
The volunteers felt that the three highest wind speeds (at and above 6.5 mls) were significantly more unsafe than the lowest two. This finding was evident throughout phase one, both walking and running.
Further factors such as age, height and weight had no effect on individual evacuation rates, although there was, surprisingly, a difference due to clothing: people wearing loose clothing were less affected by the high
er wind speeds than those wearing tight clothes. The effect however was only slightly significant and based on an arbitrary classification of clothing into 'loose' or 'not loose' clothes. It was felt that the effect was not of great importance and could be attributed to a number of factors with no relevance to this project (e.g . tight clothes are restrictive, classification was subjective etc .).
b. Phase two - Vulnerable Individuals
A similar general approach was taken in analysing the escape times and perceptions of safety of potentially vulnerable individuals. There was no distinction made between the running and walking evacuations (all were made 'as quickly as comfortable') but the means and standard deviations were calculated for each category of individuals .
As before, these values were then analysed to establish whether significant differences in escape times were encountered and which wind speeds (if any) were responsible.
The escape times for section A of the corridor were not significantly affected. That is, walking into a crosswind and turning to face it, is not a problem. However problems were encountered on the straight section and, in most cases, on the doorway restriction section . Also, when the corridor was taken as a whole, significant differences in escape times were noted.
In order to establish which wind speeds were primarily responsible for the differences indicated above, each wind speed was compared with every other. In most of the cases only the top speed of 10 mls was found to affect progress significantly . There were cases however (e.g. adults with pushchairs in section C, children from 12 - 14 in the whole corridor) where the 7.5 mls wind also significantly altered progress. In three cases only (children 12-14, mobility restricted people when the whole corridor is taken into account, and wheelchair pushers in section C) the mid-range wind speed significantly impeded progress.
The perceived safety ratings were subjected to the same kind of analysis and it was found that only in two cases were the safety ratings significantly changed . These categories were the 12 - 14 year olds and the adults with children. The wind speeds that made the significant difference were found to be the three highest (at and above 6.5 mls) .
An indication of the susceptibility of a category of volunteers was derived by comparing their escape times at the highest wind speed and their times at the
5

lowest. These values showed, unsurprisingly, that healthy adults were least affected by the highest wind speed, their escape times increasing by 7%, and people with restricted mobility and those over 60 were most affected with an increase of 17%.
The questionnaire also asked whether any factors other than the air flow had affected their progress. In answer to this two wheelchair pushers had noted that their progress had been slowed by 'lift' under the wheelchair.
c. Phase two - Groups
For the group evacuations the close-knit group and the dispersed group were treated separately . The time taken for the whole group to escape at each wind speed was analysed to find the mean and standard deviation, and to establish significant differences . Additionally the times were analysed by the start position of the individual within the group. The perceived safety ratings were treated similarly.
For the group evacuations virtually every wind speed made a significant difference to escape times. The only section of the corridor which was not significantly affected was section A, the entry section (although even that was affected by the highest wind speed during the high-density tests) .
When the escape times were analysed by start position, volunteers starting at the outside positions (1,4,6 in figure 2) and at the back (6,7,8) were found to be significantly slower with the highest wind speed (l0 m/s) than those at the front. This was true of both close-knit and dispersed groups although in the closeknit groups the volunteer in the inside second row position (5) was also affected by the highest wind speed. Additionally the volunteer in the outside second row position of the close-knit groups was significantly affected by the second highest wind speed (7.5 m/s) .
The perceived safety ratings show the same trends as earlier tests with significantly lower safety ratings at wind speeds at and above 6.5 m/s.
Group members were also asked how much they felt that other volunteers had impeded their progress. For the close-knit tests no significant differences were found at the various wind speeds; however, the volunteers in the dispersed tests felt that they were significantly impeded at the middle and highest wind speeds (6.5 m/s and 10 m/s).
Analysed by start position, in a close-knit group the front row were less affected by other volunteers than the middle row, with the back row most affected. However in the dispersed group the front two rows gave very similar ratings and only the back row felt
Table 1 SUMMARY OF SIGNIFICANT WIND SPEEDS
Category Minimum Wind Speed (m/s) which significantly affects
physical progress perceived safety
Healthy Individual - walking 10.3 I
6.5
Healthy Individual - running 7.5 6.5
Adults with pushchair 7.5 6.5
Over 60s 10.3 The volunteers did not identify any significant differences
12-14 year old 6.5 6.5
Restricted mobility 6.5 The volunteers did not identify any significant differences
Wheelchair pusher 6.5 As above
Group 7.5 6.5
6

that they were impeded by others.
In answer to the final question about whether any factors other than wind speed had affected their progress, several volunteers noted that they had hit either the door frame on leaving the ante room or the doorway constriction at the end of the corridor. This was more often noted by people in low-density conditions than when in high-density conditions.
Further analyses were carried out to establish whether any other factors affected volunteers' performance. This was done by comparing the 'actual' and 'expected' performance of an individual based on their start position. From this it was found that males, taller people, younger people, those with flat shoes and those not carrying a bag were likely to perform better in a group. These results are not surprising but give confidence in the other less predictable results which have been reported.
Table 1 (page 6), summarises the lowest air speeds which significantly affect either the physical progress of the volunteer, or their perception of safety.
The original calibrated wind speeds had been measured at various points in an empty corridor. The wind speed was also measured with eight people standing in the doorway restriction. The percentage increases in wind speed through the crowded doorway ranged from 75% with a calibrated wind of 4 mls, to 50% with the highest calibrated wind speed of IO mls.
DISCUSSION
The tests undertaken at Cranfield examined a number of different parameters, yet involved a relatively small sample of people. This, although it was not ideal, was inevitable to keep the project within a reasonable budget. Another compromise made was for each volunteer to make several evacuations - the ideal would have been for each to make one evacuation only . The learning effect was kept to minimum by randomising the order of wind speeds, and the results were treated with caution during interpretation by typically using a 1 % criterion for statistical significance.
Escape times were significantly affected by wind speeds of 6.5 mls and above. There were instances of significant effects at lower wind speeds, with some categories of volunteers in certain sections of corridor, but the broad picture was that wind speeds under 6.5 mls did not affect escape times.
Most categories of volunteers felt safe at wind speeds
up to 6.5 mls. At and above this speed, volunteers perceptions of safety were significantly decreased. although their safety ratings still remained relatively high (at the highest wind speed the mean safety rating value was around 8.5 on a scale where 1 represented 'not at aJl safe' and IO represented 'completely safe'). Bearing in mind that the tests were held in controlled conditions with plenty of light. space and assistance near by, the high safety ratings are understandable. therefore it is important to concentrate on the changes in the volunteers' safety ratings rather than their absolute value.
On this basis a wind speed of over 6.5 tnls could present physical and perceived problems to people. however a limit of 5 mls would be more appropriate than the current 3 m/so This value does not discount or ignore the occasional occurrence of significant effects at wind speeds lower than the suggested revised limit. These tests have indicated that significant problems will happen rarely enough. and with sufficiently minor consequences, to confirm that wind speeds up to 5 mls pose no serious threat to a person's ability to escape.
CONCLUSIONS
The maximum intake air speed value is referred to in BS 5588 : Part 10 (1991) - Fire precautions in the design, construction and use of buildings - code of practice for shopping complexes (Reference 3). This standard has adopted the BRE current advised limit of air speeds no greater than 3 mls and is referred to in the Building Regulations Approved Document B (Reference 4).
The results of this project have been discussed with Mr Howard Morgan from the Building Research Establishment (BRE) and with G2 Division of the Home Office and it has been agreed that a maximum air speed of 5 mls is acceptable for all users of a shopping mall and should be proposed as an amendment to the relevant British Standards (Reference 3). This value takes into account not only the physical effects of wind speed on escape behaviour but also the psychological perceived effects.
In situations where severe design problems are encountered e.g. in upgrading old buildings, it might be possible to accept higher limits of up to 10 mls based on these figures .
The findings of this project are directly applicable to the exit corridors from a shopping mall but are equally valid in any situation where an approach corridor
7

leads to a double door e.g. hospitals, schools, prisons tems cause air to flow out through the final exit door etc. of a pressurised escape route. Although the project
does not cover evacuations in a tail wind, everyday Air flows through doorways not only occur when a experience suggests that progress is easier and more mechanical smoke control system is used but also stable in that situation. The maximum values for air occur with systems based on depressurisation (see BS flows derived from this project are thus equally valid 5588 : Parts 4 and 5, reference 3). Pressurisation sys- under these circumstances.
REFERENCES
1. Building Research Establishment Report BR 186 1990 Design principles for smoke ventilation in enclosed shopping centres
H.P.Morgan and 1.P.Gardner ISBN 0-85125-462-4
2. Building Research Establishment CP 1174 1974 Acceptable wind speeds in town
A.D.Penwarden
3. British Standards Institute BS 5588 : Fire precautions in the design, construction and use of buildings
Part 4 (1991) - Code or practice ror smoke control in protected escape routes using pressurization. Part 5 (1991) - Code of practice for firefighting stairs and lifts.
Part 10 (1991) - Code or practice for shopping complexes.
4. Department of the Environment and the Welsh Office The Building RegUlations 1991
Part Bl - Means of Escape HMSO
ISBN 0-11 -752313-5
© Crown Copyright
8


Designed by Home Office Design and IUwtration Branch Cl Crown Copyright ISBN 0-86252-745-7