Embed Size (px)
Citation preview
Academic Research International Vol. 6(1) January 2015
____________________________________________________________________________________________________________________________________________________________________________________________________________________________________________________________________________________________________________
Copyright © 2015 SAVAP International ISSN: 2223-9944, e ISSN: 2223-9553
www.savap.org.pk 91 www.journals.savap.org.pk
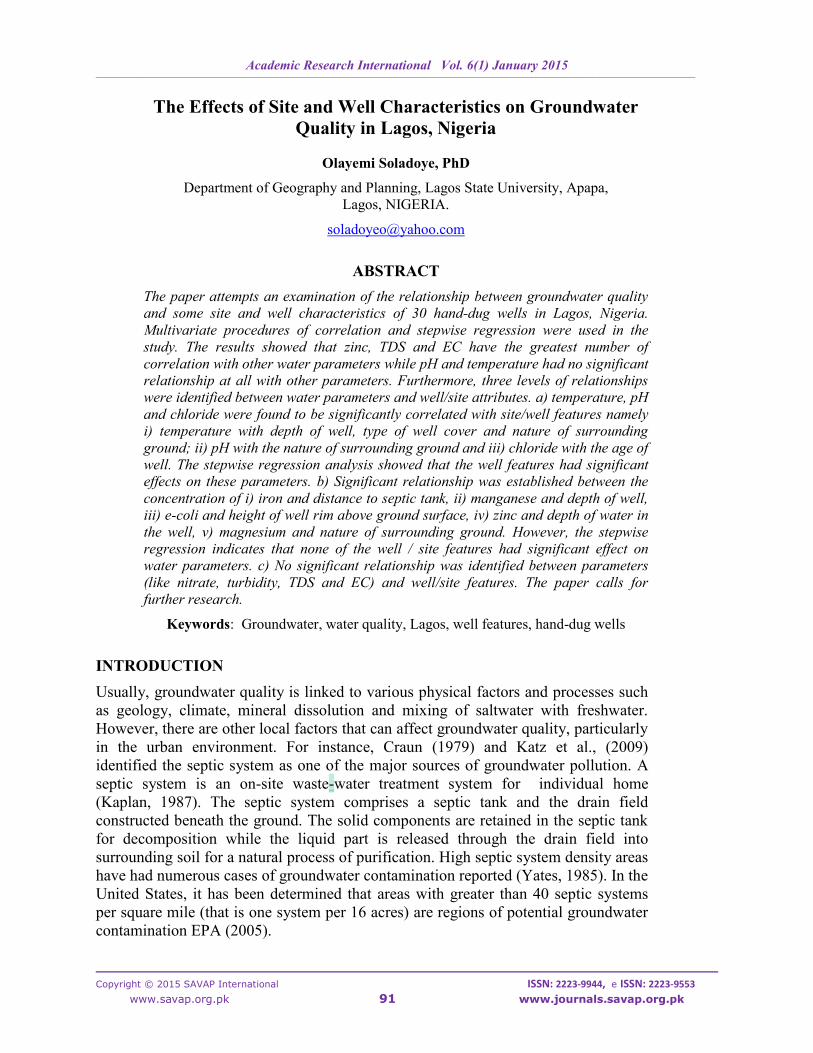
The Effects of Site and Well Characteristics on Groundwater
Quality in Lagos, Nigeria
Olayemi Soladoye, PhD
Department of Geography and Planning, Lagos State University, Apapa,
Lagos, NIGERIA.
ABSTRACT
The paper attempts an examination of the relationship between groundwater quality
and some site and well characteristics of 30 hand-dug wells in Lagos, Nigeria.
Multivariate procedures of correlation and stepwise regression were used in the
study. The results showed that zinc, TDS and EC have the greatest number of
correlation with other water parameters while pH and temperature had no significant
relationship at all with other parameters. Furthermore, three levels of relationships
were identified between water parameters and well/site attributes. a) temperature, pH
and chloride were found to be significantly correlated with site/well features namely
i) temperature with depth of well, type of well cover and nature of surrounding
ground; ii) pH with the nature of surrounding ground and iii) chloride with the age of
well. The stepwise regression analysis showed that the well features had significant
effects on these parameters. b) Significant relationship was established between the
concentration of i) iron and distance to septic tank, ii) manganese and depth of well,
iii) e-coli and height of well rim above ground surface, iv) zinc and depth of water in
the well, v) magnesium and nature of surrounding ground. However, the stepwise
regression indicates that none of the well / site features had significant effect on
water parameters. c) No significant relationship was identified between parameters
(like nitrate, turbidity, TDS and EC) and well/site features. The paper calls for
further research.
Keywords: Groundwater, water quality, Lagos, well features, hand-dug wells
INTRODUCTION
Usually, groundwater quality is linked to various physical factors and processes such
as geology, climate, mineral dissolution and mixing of saltwater with freshwater.
However, there are other local factors that can affect groundwater quality, particularly
in the urban environment. For instance, Craun (1979) and Katz et al., (2009)
identified the septic system as one of the major sources of groundwater pollution. A
septic system is an on-site waste-water treatment system for individual home
(Kaplan, 1987). The septic system comprises a septic tank and the drain field
constructed beneath the ground. The solid components are retained in the septic tank
for decomposition while the liquid part is released through the drain field into
surrounding soil for a natural process of purification. High septic system density areas
have had numerous cases of groundwater contamination reported (Yates, 1985). In the
United States, it has been determined that areas with greater than 40 septic systems
per square mile (that is one system per 16 acres) are regions of potential groundwater
contamination EPA (2005).
Academic Research International Vol. 6(1) January 2015
____________________________________________________________________________________________________________________________________________________________________________________________________________________________________________________________________________________________________________
Copyright © 2015 SAVAP International ISSN: 2223-9944, e ISSN: 2223-9553
www.savap.org.pk 92 www.journals.savap.org.pk
According to Egboka et al., (1989), pathogenic microorganisms are present in groundwater
especially in the vicinity of facilities that are discharging contaminated surface waters. It
follows, therefore that the nearer these sources of pollution are to groundwater sources, the
greater the chance of successful seepage of these microorganisms. Shallow wells and some
deep boreholes are prone to contamination by these pathogens.
The effectiveness of the soil as a treatment system will vary considerably with a number of
changing environmental factors. Such factors include soil and air temperatures, the level of
the groundwater table, and the amount of oxygen that is in the soil. As the concentration of
effluent in the soil increases, the ability of the soil to treat it may reduce. Even with a soil
absorption system operating well, ground- water contamination is inevitable because the soil
is not equally effective at removing all constituents of the percolate (Viraraghavan and
Warnock, 1976).
In environments where adequate sanitation is not being provided, both surface and ground
water are vulnerable to contamination. The groundwater gets contaminated by seepage from
polluted surface waters particularly through the digging of wells. More often than not, wells
are sunk less than 5m away from obvious sources of pollution like pit latrines. Worse still, the
water wells are usually not lined at all and may not be covered.
For instance, metropolitan Lagos is characterized by an array of blighted communities much
so that almost 70 percent (70%) of Lagos’ population consequently live in the slums
(Adelekan, 2009). It is normal to have families of five or more persons all live together in one
small room, (average size of 4.30 m2). Many homes are in poor conditions and the scanty
facilities in them are shared. Okafor (1985) noted that in major parts of Nigeria, feces are
disposed of on ordinary dry ground, bucket latrines, the pit-latrine, and septic tank latrine.
Sewage systems are non-existing. This observation is typical of the Lagos environment.
More than 67% of households within the Lagos environment depend on groundwater for
domestic water needs (Lagos Household Survey, 2011) including drinking purposes. This
figure is huge bearing in mind that in the 2006 census, Lagos recorded a population figure of
more than 9 million people (NPC, 2006). The estimated population of Lagos is more than 15
million currently. Governmental agencies responsible for water provision are unable to meet
up with the demand, and most homeowners have resorted to the construction of private wells
within the living premises. It implies that the groundwater resource is exploited mainly
through boreholes, and hand-dug wells with the use of hand–dug wells being more prevalent
probably due to the low cost of construction.
Consequently, there is a high density of hand-dug wells within the living environment.
Usually, there is no requirement for licensing of wells or obtaining of permits before
constructing wells as is the practice in many parts of the world. There are no standards to
comply to in the construction of wells neither is there any governmental agency responsible
for the supervision of well construction. Digging of wells is carried out by untrained locals
with the use of simple tools such as shovels. Such poorly constructed wells are the primary
sources of domestic water supply both in the cities and the rural areas.
With this heavy dependence on groundwater and unregulated practices of groundwater
extraction, contamination of groundwater has become a potential health risk. Contamination
becomes a major source of concern for those households that get their drinking water from

Academic Research International Vol. 6(1) January 2015
____________________________________________________________________________________________________________________________________________________________________________________________________________________________________________________________________________________________________________
Copyright © 2015 SAVAP International ISSN: 2223-9944, e ISSN: 2223-9553
www.savap.org.pk 93 www.journals.savap.org.pk
untreated wells. Several studies have revealed that Lagos groundwater is not potable (e.g.
Osibanjo and Majolagbe, 2012; Akoteyon and Soladoye, 2011).
OBJECTIVES OF THE STUDY
This study is focused on how site and well features affect groundwater contamination. The
specific objectives were to:
1) describe the relationship between groundwater parameters.
2) examine the relationship between the concentration of some physicochemical
elements in groundwater and well features such as depth of well, depth of water
in a well, age of well and nature of well casing; and
3) study the effects of site factors on groundwater quality. Results from the study
could be used to explain the variation in quality of water in wells located near
each other.
METHODS
Study Area
By virtue of the physical characteristics of the Lagos environment and the totality of human
activities therein, the megacity is at risk of groundwater contamination. Lagos State is located
in the south-western coast of Nigeria approximately between latitudes 6022
1N and 6
052
1N
and longitudes 2042
1E and 3
042
1E. It shares boundary towards the west with the Republic of
Benin and on the south is the 180km long Atlantic coastline. Lagos lies within the wet
equatorial climate and has a mean annual rainfall above 1800mm. The rainy and the dry
season alternates on an annual basis from April to October and October to March
respectively.
According to Coode Blizzard et. al. (1996), Lagos State lies within the Dahomey sedimentary
basin and has no basement outcrop. The geology of Lagos State is mainly sedimentary of
tertiary and quaternary sediments. Tertiary sediments consist of unconsolidated sandstones, grits
with mudstone band and sand with layers of clay. Quaternary sediments, on the other hand, are
recent deltaic sands, mangrove swamps and alluvium near the coast. The relief pattern in Lagos
reflects the location of the area along the coast. Water is a prominent topographical feature in
the area as water and wetlands cover over 40% of the total land area. Another 12% of the
land area is subject to seasonal flooding (Iwugo, et.al.,2003).The environment is
characterized by wetlands, sandy barrier islands, beaches, low-lying tidal flats and estuaries.
However, the surface water in Lagos is polluted. Sources of pollution of the Lagos estuary
include the industries, domestic sewage and solid wastes from homes. The water bodies
within the study area is a sink for waste for the entire city.
Braimoh et. al., (2007) reported that nowhere in West Africa is the rate of urbanization as
unprecedented as the city of Lagos. Lagos has a total area of 3,577 km2 about 22 percent of
which is water. The small land area means that its large population has to be crowded in a
small space, resulting in high population density. The population density of the study area
was 20,000 persons per km2 in 1988 (Bilsborrow, 1998). This figure has increased
significantly to as high as 4,000 people per hectare in several parts of the city (Lagos State
Ministry of Economic Planning & Budget, 2004). With about 17,500 hectares of built up area

Academic Research International Vol. 6(1) January 2015
____________________________________________________________________________________________________________________________________________________________________________________________________________________________________________________________________________________________________________
Copyright © 2015 SAVAP International ISSN: 2223-9944, e ISSN: 2223-9553
www.savap.org.pk 94 www.journals.savap.org.pk
(Oduwaiye, 2007), the metropolitan area of Lagos takes up to 37 percent (37%) of the land
area. The metropolis alone houses about 90 percent (90%) of its population (Aina, 1994).
Data collection methods
A total of thirteen water parameters were considered in the study. This includes five physical
parameters namely acidity (pH), temperature (0C), total dissolved solids (TDS), electrical
conductivity (EC), turbidity. Four chemical parameters namely chloride (Cl), nitrate (NO3),
magnesium (Mg), manganese (Mn); one biological parameter (e-coli) and trace elements of
iron (Fe), lead (Pb), zinc (Zn) were also studied.
Total Dissolved Solids (TDS) in water supplies originate from several sources such as
sewage, industrial wastewater and other natural sources. pH is a good indicator of water
quality as it is a measure of the alkalinity or acidity of water. Conductivity was selected
because it can be used as an indicator of human activity. A higher EC indicates more
dissolved material, which may contain more contaminants. Turbidity is an important
indicator of suspended sediment and erosion levels. Such sediments could be sewage sludges,
organic and biological sludges that are as a result of human presence in a place. Chloride (Cl)
exists in all natural waters. A high result of chloride may indicate pollution of water by
sewage effluent. Thus, it is a good indicator of pollution from both residential and industrial
sources.
Nitrate comes mainly from organic and inorganic sources such as waste discharges and
artificial fertilizer. The presence of nitrate in groundwater is cause for suspicion of past
sewage pollution or excess levels of fertilizers or manure on land. Apart from geological
formations, the origin of iron (Fe) can also be traced to effluent discharges. Lead (Pb)
originates from leaching from ores, effluent discharges, and it is highly toxic. Zinc (Zn) also
originates from natural geological occurrence and wastes. Magnesium (Mg) is naturally
present waters and is a major contributor to water hardness. Water from areas where the
mineral is abundant may contain magnesium at high concentration, but industrial effluents
may also contain similarly high levels of magnesium. E-coli is an indicator of a possible
presence of pathogenic micro-organisms.
The factors used in explaining the variation in water quality were derived from both the site
of the well and the well features. Factors such as nearness to septic tanks, nearness to
contaminated drainage channels, type of housing unit where well is, and the nature of
surrounding ground were the site factors in this study. Some other factors are linked to the
well features namely depth of well, age of the well, nature of the well wall and well cover.
A field survey carried out to collect water samples from and to take inventory of thirty hand-
dug wells within the study area. The process of water samples collection and the laboratory
analysis of chemical and trace metal parameters were in accordance with the standard
methods. (APHA, 2005).
The well inventory included the estimation of the depth of the well. A calibrated weighted
line was lowered into the bottom of the well. The point at the ground level end of the line was
marked, and the line pulled out of the water. The length from the weight to the marked point
was the depth of the well (m). The well water depth was also determined following the same
procedure. When the weighted line was let down into the well bottom, the point at which the

Academic Research International Vol. 6(1) January 2015
____________________________________________________________________________________________________________________________________________________________________________________________________________________________________________________________________________________________________________
Copyright © 2015 SAVAP International ISSN: 2223-9944, e ISSN: 2223-9553
www.savap.org.pk 95 www.journals.savap.org.pk
rope touched the surface of water within the well was marked. The distance between the
weighted line and the water surface point marked the depth of the water within the well.
The distance between each well and the nearest septic tank was measured. Also measured
were the distance between each well and the nearest drainage channel; and the height of the
rim of the well from the ground surface. The owners either gave the age of each well or as in
some cases, written on concrete posts around the well. The nature of the well wall and cover
were identified as this could influence the quality of water within the well. Activities in
surrounding areas of wells such as washing, cooking and general hygiene were observed.
Furthermore, the land use around each well was assessed as this was to help in the
determination of the land use category.
Data generated from the well inventory were then subjected to both correlation and stepwise
regression methods. In the regression analysis, each of the water parameters under study was
used as the dependent variable while attributes of the well inventory taken on the field are the
predictors. Such predictors were the depth of well, the depth of water in the well, the age of
well and the height of well above the ground surface. Other predictors used include the
distance from the nearest septic tank and the distance from drainage channels.
FINDINGS AND DISCUSSIONS
Relationship between selected water parameters
The results from the laboratory analysis of samples were subjected to correlation analysis.
The correlation results are in Table 1. The partial correlation was also carried out to confirm
the same relationship. The correlation analysis also revealed that zinc, TDS and conductivity
have the greatest number of correlation with other parameters.
Table 1. Correlation matrix showing relationship between water parameters
The pairwise correlation results revealed that there is significant correlation between TDS
and conductivity (EC) at R = 0.9974, nitrate (NO3) and conductivity at R = 0.8558, nitrate
OC Turbidity pH EC TDS NO3 Cl Mg Fe Mn Zn e-coli
OC 1.0000 -0.0528
-
0.1479
-
0.1095
-
0.1000 -0.0526
-
0.0978 0.1657
-
0.1122 0.0991
-
0.1302
-
0.0368
Turbidity 1.0000 0.0994 0.2901 0.2859 0.1974 0.1191 0.0270 -
0.1385 0.0460 0.2835 0.8239
pH 1.0000 0.1059 0.0937 0.1040 0.2674 0.0614 -
0.0234 0.1337 0.0194
-
0.0420
EC 1.0000 0.9974 0.8558 0.5573 0.4923 0.5741 0.6503 0.9217 0.4147
TDS 1.0000 0.8774 0.5610 0.5218 0.5829 0.6498 0.9318 0.3920
NO3 1.0000 0.3839 0.7358 0.5656 0.6073 0.8741 0.2400
Cl 1.0000 -
0.0614 0.1232 0.5421 0.4618
-
0.0560
Mg 1.0000 0.5253 0.4348 0.4810 0.0551
Fe 1.0000 0.3417 0.6730 -
0.0857
Mn 1.0000 0.5089 -
0.0004
Zn 1.0000 0.3825
e-coli 1.0000
Academic Research International Vol. 6(1) January 2015
____________________________________________________________________________________________________________________________________________________________________________________________________________________________________________________________________________________________________________
Copyright © 2015 SAVAP International ISSN: 2223-9944, e ISSN: 2223-9553
www.savap.org.pk 96 www.journals.savap.org.pk
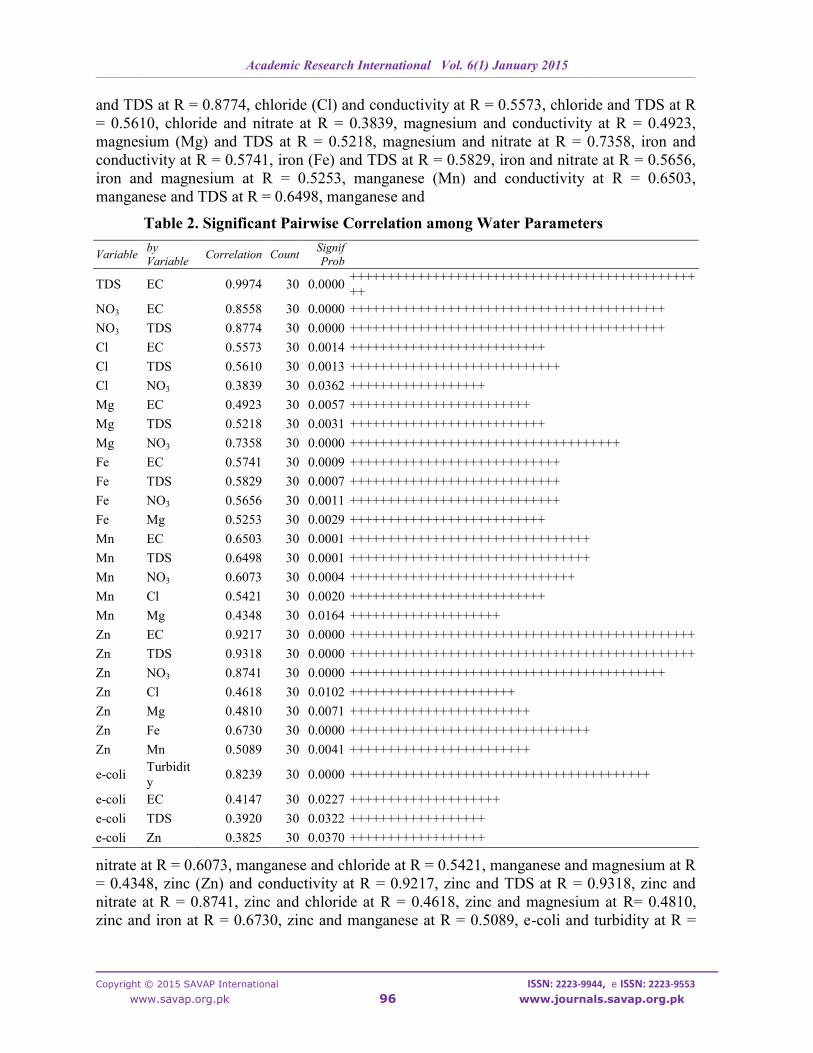
and TDS at R = 0.8774, chloride (Cl) and conductivity at R = 0.5573, chloride and TDS at R
= 0.5610, chloride and nitrate at R = 0.3839, magnesium and conductivity at R = 0.4923,
magnesium (Mg) and TDS at R = 0.5218, magnesium and nitrate at R = 0.7358, iron and
conductivity at R = 0.5741, iron (Fe) and TDS at R = 0.5829, iron and nitrate at R = 0.5656,
iron and magnesium at R = 0.5253, manganese (Mn) and conductivity at R = 0.6503,
manganese and TDS at R = 0.6498, manganese and
Table 2. Significant Pairwise Correlation among Water Parameters
Variable by
Variable Correlation Count
Signif
Prob
TDS EC 0.9974 30 0.0000 ++++++++++++++++++++++++++++++++++++++++++++++
++
NO3 EC 0.8558 30 0.0000 ++++++++++++++++++++++++++++++++++++++++++
NO3 TDS 0.8774 30 0.0000 ++++++++++++++++++++++++++++++++++++++++++
Cl EC 0.5573 30 0.0014 ++++++++++++++++++++++++++
Cl TDS 0.5610 30 0.0013 ++++++++++++++++++++++++++++
Cl NO3 0.3839 30 0.0362 ++++++++++++++++++
Mg EC 0.4923 30 0.0057 ++++++++++++++++++++++++
Mg TDS 0.5218 30 0.0031 ++++++++++++++++++++++++++
Mg NO3 0.7358 30 0.0000 ++++++++++++++++++++++++++++++++++++
Fe EC 0.5741 30 0.0009 ++++++++++++++++++++++++++++
Fe TDS 0.5829 30 0.0007 ++++++++++++++++++++++++++++
Fe NO3 0.5656 30 0.0011 ++++++++++++++++++++++++++++
Fe Mg 0.5253 30 0.0029 ++++++++++++++++++++++++++
Mn EC 0.6503 30 0.0001 ++++++++++++++++++++++++++++++++
Mn TDS 0.6498 30 0.0001 ++++++++++++++++++++++++++++++++
Mn NO3 0.6073 30 0.0004 ++++++++++++++++++++++++++++++
Mn Cl 0.5421 30 0.0020 ++++++++++++++++++++++++++
Mn Mg 0.4348 30 0.0164 ++++++++++++++++++++
Zn EC 0.9217 30 0.0000 ++++++++++++++++++++++++++++++++++++++++++++++
Zn TDS 0.9318 30 0.0000 ++++++++++++++++++++++++++++++++++++++++++++++
Zn NO3 0.8741 30 0.0000 ++++++++++++++++++++++++++++++++++++++++++
Zn Cl 0.4618 30 0.0102 ++++++++++++++++++++++
Zn Mg 0.4810 30 0.0071 ++++++++++++++++++++++++
Zn Fe 0.6730 30 0.0000 ++++++++++++++++++++++++++++++++
Zn Mn 0.5089 30 0.0041 ++++++++++++++++++++++++
e-coli Turbidit
y 0.8239 30 0.0000 ++++++++++++++++++++++++++++++++++++++++
e-coli EC 0.4147 30 0.0227 ++++++++++++++++++++
e-coli TDS 0.3920 30 0.0322 ++++++++++++++++++
e-coli Zn 0.3825 30 0.0370 ++++++++++++++++++
nitrate at R = 0.6073, manganese and chloride at R = 0.5421, manganese and magnesium at R
= 0.4348, zinc (Zn) and conductivity at R = 0.9217, zinc and TDS at R = 0.9318, zinc and
nitrate at R = 0.8741, zinc and chloride at R = 0.4618, zinc and magnesium at R= 0.4810,
zinc and iron at R = 0.6730, zinc and manganese at R = 0.5089, e-coli and turbidity at R =

Academic Research International Vol. 6(1) January 2015
____________________________________________________________________________________________________________________________________________________________________________________________________________________________________________________________________________________________________________
Copyright © 2015 SAVAP International ISSN: 2223-9944, e ISSN: 2223-9553
www.savap.org.pk 97 www.journals.savap.org.pk
0.8239, e-coli and conductivity at R = 0.4147, e-coli and TDS at R = 0.3920, e-coli and zinc
at R = 0.3825.
The correlation analysis also revealed that zinc, TDS and EC have the greatest number of
correlations with other parameters. Zinc had eight significant correlations with other
parameters namely EC, TDS, NO3, Cl, Mg, Fe, Mn and e-coli. In a similar vein, TDS had
eight significant correlations with EC, NO3, Cl, Mg, Fe, Mn, Zn and e-coli. Also, EC had
eight significant correlations with TDS, NO3, Cl, Mn, Fe, Mg, Zn and e-coli. However, pH
and temperature were not significantly correlated with other parameters.
Table 3. Correlation between selected water parameters and site/well attributes
Attributes 0C
Turbi
dity pH EC TDS NO3 Cl Mg Fe Mn Zn e-coli
Depth -
.419* -.265 -.057 -.218 -.236 -.237 -.212 -.288 .112 -.362 -.124 -.157
DWW -.275 -.179 .098 -.253 -.276 -.267 .055 -.264 -.229 -.190 -
.326* -.192
Age -.051 .293 .141 .157 .179 .248 .450* -.060 -.021 .166 .300 .070
Septic -.004 -.078 -.075 -.295 -.280 -.210 -.113 -.265 -.352* -.132 -.213 -.029
Height -.084 -.300 .258 .056 .062 .045 .161 .099 .111 .153 .007 -
.312*
Drain -.007 -.189 -.267 -.213 -.190 -.122 -.130 -.022 -.117 -.185 -.147 -.173
Surround -
.393* -.049
-
.396* -.077 -.078 -.097 -.051
-
.313* -.118
-
.333* .008 .087
Well wall -.058 .097 .008 -.005 .000 -.037 .252 -.092 -.243 -.012 -.073 -.034
Well cover -
.322* -.071 -.236 -.095 -.112 -.132 -.048 -.283 -.165 -.114 -.073 .023
House .262 .165 -.103 -.095 -.098 -.061 .087 .096 -.272 .130 -.195 .063
*Correlation is significant at the 0.05 level (1-tailed).
Depth = the depth of the well; DWW = the depth of water in the well; Age = the age of the
well; Septic = the distance between well and the nearest septic tank; Height =the height of
well rim above ground surface; Drain = the distance between well and the nearest drain
channel; Surround = the nature of well surrounding; Well wall = the nature of the well wall;
Well cover = the nature of well cover; House = the type of house where well is located.
Relating water parameters with well attributes
(i) Temperature
The relationship between water temperature and well characteristics was analyzed using the
Pearson Correlation method. The result suggests that there is a significant inverse correlation
between water temperature and variables of the depth of the well, the nature of the
surrounding ground and the well cover. This was at R = -0.419, -0.393, -0.322, respectively at
p < 0.05 significant level. The adequacy of the variation accounted for in the model is
ascertained in the ANOVA result in Table 3.
Table 3. ANOVA using Temperature and Depth of Well
Academic Research International Vol. 6(1) January 2015
____________________________________________________________________________________________________________________________________________________________________________________________________________________________________________________________________________________________________________
Copyright © 2015 SAVAP International ISSN: 2223-9944, e ISSN: 2223-9553
www.savap.org.pk 98 www.journals.savap.org.pk
Model Sum of Squares Df Mean Square F Sig.
Regression 9.109 1 9.109 5.971 0.021
Residual 42.718 28 1.526
Total 51.827 29
a. Dependent Variable: TEMPERATURE, b. Predictors: (Constant), DEPTH
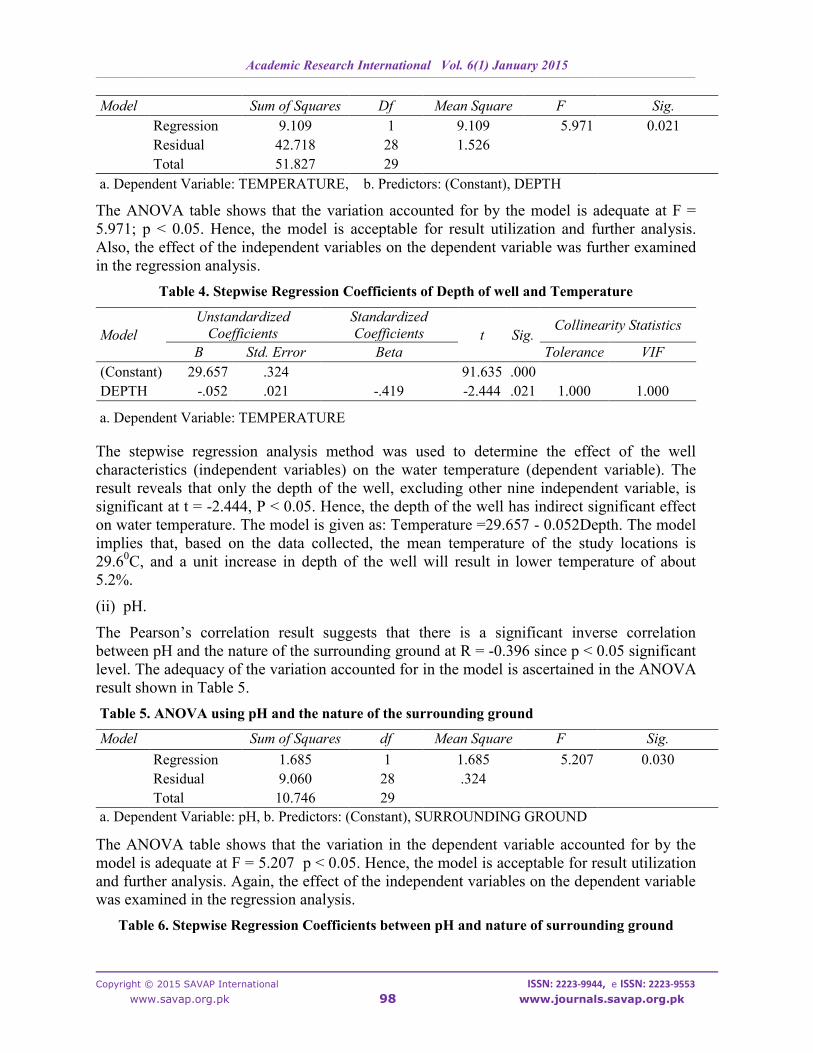
The ANOVA table shows that the variation accounted for by the model is adequate at F =
5.971; p < 0.05. Hence, the model is acceptable for result utilization and further analysis.
Also, the effect of the independent variables on the dependent variable was further examined
in the regression analysis.
Table 4. Stepwise Regression Coefficients of Depth of well and Temperature
Model
Unstandardized
Coefficients
Standardized
Coefficients t Sig. Collinearity Statistics
B Std. Error Beta Tolerance VIF
(Constant) 29.657 .324 91.635 .000
DEPTH -.052 .021 -.419 -2.444 .021 1.000 1.000
a. Dependent Variable: TEMPERATURE
The stepwise regression analysis method was used to determine the effect of the well
characteristics (independent variables) on the water temperature (dependent variable). The
result reveals that only the depth of the well, excluding other nine independent variable, is
significant at t = -2.444, P < 0.05. Hence, the depth of the well has indirect significant effect
on water temperature. The model is given as: Temperature =29.657 - 0.052Depth. The model
implies that, based on the data collected, the mean temperature of the study locations is
29.60C, and a unit increase in depth of the well will result in lower temperature of about
5.2%.
(ii) pH.
The Pearson’s correlation result suggests that there is a significant inverse correlation
between pH and the nature of the surrounding ground at R = -0.396 since p < 0.05 significant
level. The adequacy of the variation accounted for in the model is ascertained in the ANOVA
result shown in Table 5.
Table 5. ANOVA using pH and the nature of the surrounding ground
Model Sum of Squares df Mean Square F Sig.
Regression 1.685 1 1.685 5.207 0.030
Residual 9.060 28 .324
Total 10.746 29
a. Dependent Variable: pH, b. Predictors: (Constant), SURROUNDING GROUND
The ANOVA table shows that the variation in the dependent variable accounted for by the
model is adequate at F = 5.207 p < 0.05. Hence, the model is acceptable for result utilization
and further analysis. Again, the effect of the independent variables on the dependent variable
was examined in the regression analysis.
Table 6. Stepwise Regression Coefficients between pH and nature of surrounding ground
Academic Research International Vol. 6(1) January 2015
____________________________________________________________________________________________________________________________________________________________________________________________________________________________________________________________________________________________________________
Copyright © 2015 SAVAP International ISSN: 2223-9944, e ISSN: 2223-9553
www.savap.org.pk 99 www.journals.savap.org.pk
Model
Unstandardized
Coefficients
Standardized
Coefficients t Sig.
Collinearity
Statistics
B Std. Error Beta Tolerance VIF
(Constant) 7.196 .328 21.911 .000
SURROUNDING
GROUND -.474 .208 -.396 -2.282 .030 1.000 1.000
a. Dependent Variable: pH
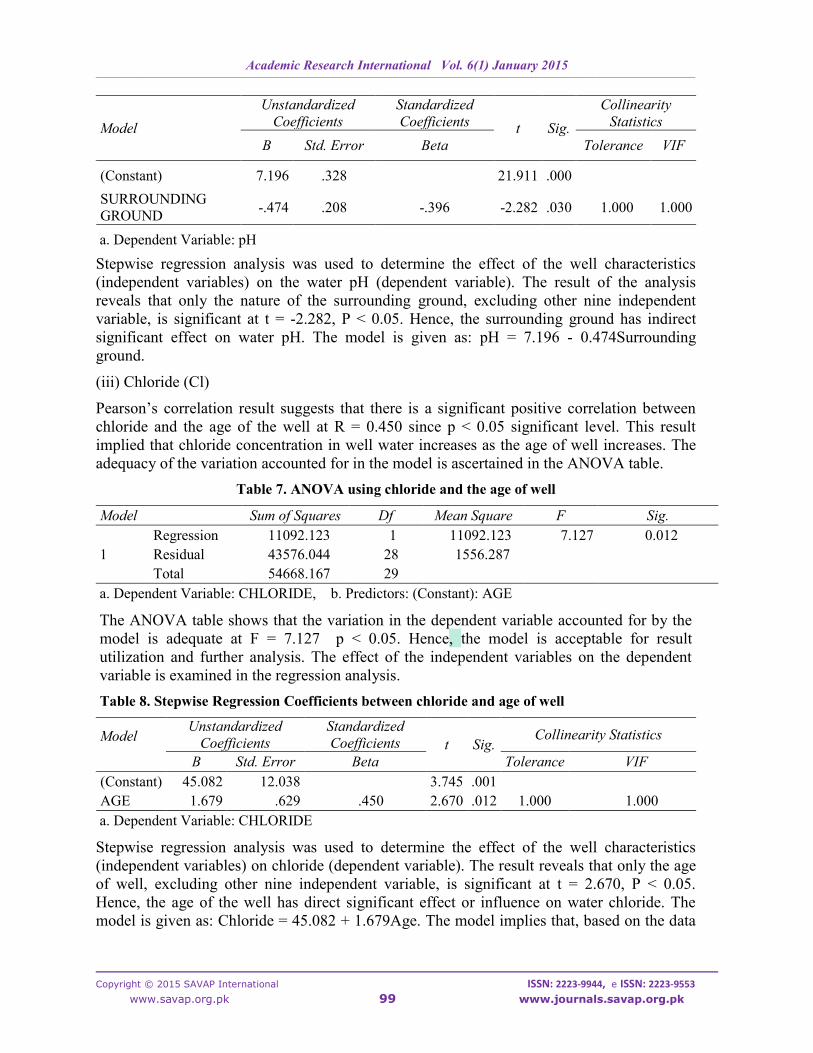
Stepwise regression analysis was used to determine the effect of the well characteristics
(independent variables) on the water pH (dependent variable). The result of the analysis
reveals that only the nature of the surrounding ground, excluding other nine independent
variable, is significant at t = -2.282, P < 0.05. Hence, the surrounding ground has indirect
significant effect on water pH. The model is given as: pH = 7.196 - 0.474Surrounding
ground.
(iii) Chloride (Cl)
Pearson’s correlation result suggests that there is a significant positive correlation between
chloride and the age of the well at R = 0.450 since p < 0.05 significant level. This result
implied that chloride concentration in well water increases as the age of well increases. The
adequacy of the variation accounted for in the model is ascertained in the ANOVA table.
Table 7. ANOVA using chloride and the age of well
Model Sum of Squares Df Mean Square F Sig.
1
Regression 11092.123 1 11092.123 7.127 0.012
Residual 43576.044 28 1556.287
Total 54668.167 29
a. Dependent Variable: CHLORIDE, b. Predictors: (Constant): AGE
The ANOVA table shows that the variation in the dependent variable accounted for by the
model is adequate at F = 7.127 p < 0.05. Hence, the model is acceptable for result
utilization and further analysis. The effect of the independent variables on the dependent
variable is examined in the regression analysis.
Table 8. Stepwise Regression Coefficients between chloride and age of well
Model
Unstandardized
Coefficients
Standardized
Coefficients t Sig. Collinearity Statistics
B Std. Error Beta Tolerance VIF
(Constant) 45.082 12.038 3.745 .001
AGE 1.679 .629 .450 2.670 .012 1.000 1.000
a. Dependent Variable: CHLORIDE
Stepwise regression analysis was used to determine the effect of the well characteristics
(independent variables) on chloride (dependent variable). The result reveals that only the age
of well, excluding other nine independent variable, is significant at t = 2.670, P < 0.05.
Hence, the age of the well has direct significant effect or influence on water chloride. The
model is given as: Chloride = 45.082 + 1.679Age. The model implies that, based on the data
Academic Research International Vol. 6(1) January 2015
____________________________________________________________________________________________________________________________________________________________________________________________________________________________________________________________________________________________________________
Copyright © 2015 SAVAP International ISSN: 2223-9944, e ISSN: 2223-9553
www.savap.org.pk 100 www.journals.savap.org.pk
collected, the mean chloride of the study locations is obtained as 45.082, and a unit increase
in the age of well will increase water chloride by 167.9%.
(iv) Magnesium (Mn)
The Pearson’s correlation result suggests that there is an indirect significant correlation
between magnesium and the nature of the surrounding ground at R = -0.313 since p < 0.05
significant level. However, the stepwise regression analysis indicates that the nature of the
surrounding ground and other well characteristic have no significant effect or influence on
magnesium concentration in well water.
(v) Iron (Fe)
Pearson’s correlation result suggests that there is a significant correlation between the
concentration of iron and the distance from the nearest septic tank at R = -0.352 since p <
0.05 significant level. The implication of this is that with an increase in distance of wells
away from septic tanks, the concentration of iron in well water reduces. However, further
results from the stepwise regression analysis indicate that distance away from the septic tank
and other well characteristics do not significantly influence iron content of water.
(vi) Manganese (Mg)
The Pearson’s correlation result suggests that there is a significant correlation between
manganese and site and well attributes. These are depth of well and nature of the surrounding
ground at R = -0.362, -0.333, since p < 0.05 significant level. This implies that magnesium
concentration reduces at increased depth of well. Also, the nature of the surrounding ground
influences the concentration of manganese. However, the stepwise regression analysis
indicates that none of these well characteristics have significant effect or influence on
manganese concentration in well water.
(vii) Zinc (Zn)
The Pearson correlation result indicates that there is a significant correlation between zinc
and well water depth at R = -0.326 since p < 0.05 significant level. The implication is that the
concentration of zinc in well water reduces with water depth. However, the stepwise
regression analysis indicates that the well characteristic has no significant effect on the
concentration of zinc.
(viii) e-coli
The Pearson’s correlation result suggests that there is a significant correlation between e-coli
and the height of well rim from the ground at R = -0.312 since p < 0.05 significant level. This
implies that the content of e-coli in well water reduces the higher the well rim is above the
ground surface. However, the stepwise regression analysis shows that the well characteristic
has no significant effect or influence on e-coli.
The Pearson’s correlation result suggests that there is no significant correlation between some
of the tested parameters and the site/well attributes. Such parameters include turbidity,
conductivity (EC), TDS and nitrate (NO3). The stepwise regression analysis also indicates
that no variable has a significant effect on the above-mentioned parameters.

Academic Research International Vol. 6(1) January 2015
____________________________________________________________________________________________________________________________________________________________________________________________________________________________________________________________________________________________________________
Copyright © 2015 SAVAP International ISSN: 2223-9944, e ISSN: 2223-9553
www.savap.org.pk 101 www.journals.savap.org.pk
CONCLUSION
The relationship between water parameters was discussed. Some parameters had a positive
relationship with one another while some others were negative. For instance, iron
concentration in well water had a negative significant correlation with physical parameters
such as temperature, turbidity and pH while magnesium and manganese positively and
significantly correlated with the same physical parameters. The relationship between well
water parameters and selected well/site attributes was also examined. From the findings of
the study, it is evident that both site and well features have a tendency to influence the quality
of water in wells. Notable here is the relationship between temperature of well water and the
depth of the well, the nature of the surrounding ground and the well cover. The stepwise
regression between pH and the selected well characteristics showed that the nature of the
surrounding ground is inversely correlated with pH. The findings of this study suggest the
need for further studies on the impact of a site and the characteristics of a well on
groundwater quality.
REFERENCES
[1]. Adelekan, I. O. (2009).Vulnerability of Poor Urban Coastal Communities to Climate
Change in Lagos, Nigeria. Urban Research Symposium on Cities and Climate
Change: Responding to an Urgent Agenda, Marseille, France, June 2009 in Fifth
Urban Research Symposium on Cities and Climate Change Website: Responding to
an Urgent Agenda, ed Ranjan Bose, Urban Research Symposium, World Bank,
France, pp. 1-33
[2]. Aina T. (1994). Health, Habitat and Underdevelopment in Nigeria: With Special
Reference to Low Income Settlement in Metropolitan Lagos, The International
Institute For Environment and Development (IIED), London.
[3]. Akoteyon, I.S., & Soladoye, O. (2011). Groundwater Quality Assessment in Eti-Osa,
Lagos-Nigeria using Multivariate Analysis .J. Appl. Sci. Environ. Manage. 15 (1),
121-125
[4]. APHA (2005). Standard Methods for the Examination of Water and Wastewater, 21st
edition, American Public Health Association, Washington, DC, New York, USA
[5]. Bilsborrow R. (1998). Migration, Urbanization and Development: New Directions
and Issues. United Nations Population Fund (UNFPA), USA
[6]. Braimoh, A., & Onishi, T. (2007). Spatial Determinants of Urban Land Use Change
in Lagos, Nigeria, Land Use Policy, 24: 502-515.
[7]. Coode Blizard Ltd., Akute Geo-Resource Ltd. and Rofe Kennard and Lapworth,
(1996), Hydrogeological Investigation of Lagos State Final Report, Vols. I & II.
[8]. Craun, G. F. (1979). Waterborne disease – A status report emphasizing outbreaks in
Ground-water systems. Ground Water 17(2):183-191.
[9]. Egboka, B. C. E., et al. (1989). Principles and Problems of Environmental Pollution of
Groundwater Resources With Case Examples From Developing Countries,
Environmental Health Perspectives, 83, 36–68.

Academic Research International Vol. 6(1) January 2015
____________________________________________________________________________________________________________________________________________________________________________________________________________________________________________________________________________________________________________
Copyright © 2015 SAVAP International ISSN: 2223-9944, e ISSN: 2223-9553
www.savap.org.pk 102 www.journals.savap.org.pk
[10]. EPA, Office of Water (2005). Handbook for Managing Onsite and Clustered
(Decentralized) Wastewater Treatment Systems: An Introduction to Management
tools and information for implementing EP‟s Management Guidelines, EPA
Publication 832-B-05-001, 66 p.
(http://www.epa.gov/owm/septic/pubs/onsite_handbook.pdf).
[11]. Iwugo, K. 0. (1986). Groundwater quality, treatment and pollution in Nigeria the
Lagos metropolis case study. In: Proceedings of Groundwater Resources Conference,
Lagos, Nigeria, pp. 259-285.
[12]. Kaplan, O. B.(1987). Septic Systems Handbook. Chelsea, Michigan: Lewis Publishers.
290 p.
[13]. Katz, B. G., et al. (2009). Estimating Nitrogen Loading to Ground Water and
Assessing Vulnerability to Nitrate Contamination in a Large Karstic Springs Basin,
Florida. Journal of the American Water Resources Association 45, 607-627.
[14]. Lagos Household Survey (2011). Final Report, Lagos Bureau of Statistics, Lagos
State Ministry of Economic Planning and Budget, Alausa.
[15]. Lagos State Ministry of Economic Planning and Budget (2004). State of Lagos
Megacity and other Nigerian Cities, a Report by the Lagos State Ministry of Economic
Planning and Budget in collaboration with the Lagos State Ministry of Physical
Planning and Urban Development, the UN-Habitat Office in Nigeria, the State
NEPAD Committee and the Lagos Economic Summit Group, Lagos Metropolitan
Development and Governance Project 2006
[16]. National Population Commission (2006). Population and Housing Census of the
Federal Republic of Nigeria Priority Tables Volume 1
Available online at
http://www.population.gov.ng/images/Priority%20Tables%20Volume%20I-
update.pdf
[17]. Oduwaye, L. (2007). Effects of Institutional Land uses on Road Traffic in
Metropolitan Lagos, Journal of Land Use and Development Studies, 3 (1), 96 – 108.
[18]. Okafor, N. (1985). Aquatic and Waste Microbiology. Fourth Dimension Publishers,
Enugu, Nigeria.
[19]. Osibanjo, O., & Majolagbe, A.O. (2012). Physico-chemical Quality Assessment of
Groundwater Based on Land Use in Lagos city, southwest- Nigeria. Chemistry
Journal. Vol. 02 (02), 79 – 86
[20]. Oyegoke, E. S. (1986). The hydrogeology of the Lagos metropolis. In: Proceedings of
Groundwater Resources Conference, Lagos, Nigeria, 69-80.
[21]. Papaas, N.D. (1972). Ontario's Cottage Pollution Control Program. A paper
presented at the Annual Conf. of Ontario Sect, AWWA.
[22]. Smith, S.O., & Baver, J.H. (1969). Report on Nitrate Pollution of Groundwater,
Nassau County, Long Island. Bu. of Water Resources, Nassau County Dept. of Health,
Moneola, N.Y..
Academic Research International Vol. 6(1) January 2015
____________________________________________________________________________________________________________________________________________________________________________________________________________________________________________________________________________________________________________
Copyright © 2015 SAVAP International ISSN: 2223-9944, e ISSN: 2223-9553
www.savap.org.pk 103 www.journals.savap.org.pk
[23]. Viraraghavan, T. and Warnock, R. G. (1976). Groundwater Quality Adjacent to a
Septic Tank System. Water Storage Developments, 68 (11), 611-614
[24]. Yates, M. V. (1985). Septic tank density and ground-water contamination. Ground
Water 23(5) 586-591