Embed Size (px)
Citation preview

LAPPEENRANTA UNIVERSITY OF TECHNOLOGY
School of Business and management
Master’s Degree Programme in International Marketing Management
MASTER’S THESIS
The effects of packaging characteristics on consumer perception about liquid
soaps in Ghana
1st Supervisor: Professor Sanna-Katrina Asikainen
2nd Supervisor: Associate Professor Anssi Tarkiainen
Benjamin Atta Annan 2018

ABSTRACT
Author:
Title:
Faculty:
Master’s programme:
Year:
University:
Pages, figures and tables:
Examiners:
Keywords:
Benjamin Atta Annan
The effects of packaging characteristics on consumer perception
about liquid soap in Ghana
School of business and management
International marketing management
2018
Lappeenranta university of technology
99 pages, 14 figures, 19 tables
Professor Sanna-katrina Asikainen
Associate Professor Anssi Tarkiainen
Packaging, packaging characteristics, consumer perception
The main objective of the research was to establish the characteristics of packaging that
influences consumers’ perception concerning liquid soap. The characteristics of packaging
that were researched upon were categorised into two, namely visual and informational
elements. The visual elements include size, colour, graphics, shape, and material, whereas
the informational elements include origin of product, manufacture and expiry date,
ingredient, regulatory body, and environmental concern.
A quantitative research technique was used where six different hypotheses were designed
with the aid of existing literature. Each of the hypotheses included independent and
dependent variables. A multi-item questionnaire was designed and distributed to 500
respondents through email. 413 respondents answered the questionnaire. The statistical
analytical tool SPSS was used to analyse the data.
The results of the empirical data analysis indicate that all six (6) hypotheses were accepted.
The six (6) acceptable hypotheses included independent variables such as, size, colour,
graphics, information, shape, and material. To answer the research question, the regression
analysis revealed six (6) independent variables as the elements of packaging characteristics
that influences consumers’ perception. These elements included information, size, colour,
graphics, material, and shape in high-low order of influence. Again, the research revealed
that size was identified as the most attractive visual element of packaging characteristics that
influences consumers’ perception about liquid soap. Furthermore, the research revealed that
manufacture/expiry date was the most important informational element of packaging
characteristics that influences consumers’ perception about liquid soap. Clearly, these results
relate to results of previous research in the same field. Most available literature in this field
reveal that colour, shape, size, graphics and information attract consumers’ attention
depending on the context and the culture in which the research was carried out.

AKNOWLEDGEMENT
First and foremost, I thank the most high God for seeing me through this work. Second, I
also thank and appreciate my supervisor, Professor Sanna-Katrina Asikainen for her
unfailing supervision regardless of her busy schedules. Again, I thank my wife Mrs. Frelima
Annan for her support and encouragement during my studies. Last but not the least, I thank
my siblings and mother for their prayers and support during my studies.

TABLE OF CONTENTS
1 INTRODUCTION ....................................................................................................................... 10
1.1 BACKGROUND ........................................................................................................................................ 10
1.2 LITERATURE REVIEW ................................................................................................................................ 12
1.3 RESEARCH OBJECTIVES, QUESTIONS AND DELIMITATION .................................................................................. 16
1.3.1 Objectives ................................................................................................................................. 17
1.3.2 Main research question............................................................................................................ 17
1.3.3 Delimitation ............................................................................................................................. 17
1.4 KEY CONCEPTS DEFINITIONS ...................................................................................................................... 17
1.4.1 Packaging ................................................................................................................................. 18
1.4.2 Packaging characteristics elements ......................................................................................... 18
1.4.3 Consumer perception ............................................................................................................... 18
1.5 THEORETICAL FRAMEWORK....................................................................................................................... 19
1.6 HYPOTHESIS DESIGN AND RESEARCH CONSTRUCT MEASURES ........................................................................... 20
1.6.1 Size ........................................................................................................................................... 20
1.6.2 Colour ....................................................................................................................................... 21
1.6.3 Graphics ................................................................................................................................... 21
1.6.4 Information .............................................................................................................................. 22
1.6.5 Shape........................................................................................................................................ 23
1.6.6 Material ................................................................................................................................... 23
1.7 METHODOLOGY ...................................................................................................................................... 24

1.8 STRUCTURE OF THE THESIS ........................................................................................................................ 26
2 PACKAGING ............................................................................................................................. 27
2.1 TYPES OF PACKAGING .............................................................................................................................. 27
2.1.1 Primary packaging ................................................................................................................... 28
2.1.2 Secondary packaging ............................................................................................................... 29
2.1.3 Tertiary packaging ................................................................................................................... 31
2.2 ELEMENTS OF PACKAGING CHARACTERISTICS ................................................................................................ 31
2.2.1 Visual elements ........................................................................................................................ 32
2.2.2 Informational elements ............................................................................................................ 35
2.3 FUNCTIONS OF PACKAGING ....................................................................................................................... 35
2.3.1 Product differentiation ............................................................................................................. 36
2.3.2 Protection against transportation damage ............................................................................. 36
2.3.3 Attraction and promotion ........................................................................................................ 37
2.4 CHARACTERISTICS OF A GOOD PACKAGING DESIGN ......................................................................................... 38
2.4.1 Use of good imagery ................................................................................................................ 38
2.4.2 Insights action and emotion ..................................................................................................... 39
2.4.3 Clear branding and logo ........................................................................................................... 39
2.4.4 Easy to open and convenience of use ....................................................................................... 39
2.4.5 Environmentally friendly .......................................................................................................... 39
2.5 MODELS OF GOOD PACKAGING DESIGN ....................................................................................................... 40
2.5.1 Kano model .............................................................................................................................. 40

2.5.2 Haberma’s theory of communicative competence .................................................................. 46
3 CONSUMER PERCEPTION ........................................................................................................ 48
3.1 THEORETICAL IMPETUS ............................................................................................................................ 48
3.1.1 The theory of perceptual filters ................................................................................................ 49
3.1.2 Gestalt theory of visual perception .......................................................................................... 50
3.2 CONCEPTUALIZATION OF CONSUMER PERCEPTION ......................................................................................... 51
3.3 STAGES OF DEVELOPING A PERCEPTION ....................................................................................................... 52
3.3.1 Exposure ................................................................................................................................... 53
3.3.2 Attention .................................................................................................................................. 54
3.3.3 Interpretation ........................................................................................................................... 57
3.3.4 Retention .................................................................................................................................. 60
4 RESEARCH METHODOLOGY ..................................................................................................... 62
4.1 RESEARCH PHILOSOPHIES AND APPROACHES ................................................................................................. 63
4.2 RESEARCH DESIGN .................................................................................................................................. 64
4.3 SAMPLING AND DATA COLLECTION ............................................................................................................. 65
4.4 DATA ANALYSIS ...................................................................................................................................... 65
5 EMPIRICAL ANALYSIS AND RESULTS ........................................................................................ 66
5.1 DEMOGRAPHIC STATISTICS........................................................................................................................ 66
5.1.1 Gender distribution .................................................................................................................. 66
5.1.2 Age distribution ........................................................................................................................ 66
5.1.3 Educational level distribution ................................................................................................... 67

5.2 FACTOR ANALYSIS ................................................................................................................................... 68
5.2.1 Kaiser-Meyer-Olkin (KMO) measure and Bartlett’s test ........................................................... 68
5.2.2 The total variance explained .................................................................................................... 69
5.2.3 The rotated factor matrix ......................................................................................................... 71
5.2.4 The internal consistency and reliability test ............................................................................. 74
5.3 ORDINAL REGRESSION ANALYSIS ................................................................................................................ 75
5.3.1 The assumption tests ............................................................................................................... 75
5.3.2 Ordinal regression output ........................................................................................................ 77
6 DISCUSSION AND CONCLUSION .............................................................................................. 83
6.1 RESULTS AND THEORETICAL CONTRIBUTION ................................................................................................. 83
6.2 THE RELIABILITY AND VALIDITY ................................................................................................................... 87
6.3 MANAGERIAL IMPLICATIONS ..................................................................................................................... 88
6.4 LIMITATION AND FUTURE RESEARCH ........................................................................................................... 89
REFERENCES
APPENDIX
1.1 QUESTIONNAIRE
LIST OF TABLES
Table 5.1 Gender distribution .............................................................................................. 66
Table 5.2 Age distribution ................................................................................................... 67

Table 5.3 Educational level distribution .............................................................................. 67
Table 5.4 Kaiser-Meyer-Olkin measure/Bart's test.............................................................. 68
Table 5.5 Total variance explained ...................................................................................... 69
Table 5.6 Factor correlation matrix ..................................................................................... 72
Table 5.7Rotated factor matrix ............................................................................................ 73
Table 5.8 Reliability statistics for independent variables .................................................... 74
Table 5.9 Reliability statistics for dependent variable, consumer perception ..................... 74
Table 5.10 Descriptive statistics of independent variables .................................................. 75
Table 5.11 Model fitting information .................................................................................. 75
Table 5.12 Goodness-of-fit .................................................................................................. 76
Table 5.13 Pseudo R-Square ................................................................................................ 76
Table 5.14 Test of parallel lines ........................................................................................... 77
Table 5.15 Model summary ................................................................................................. 77
Table 5.16 ANOVA ............................................................................................................. 78
Table 5.17 Standardized and unstandardized coefficient .................................................... 79
Table 5.18 Packaging information ....................................................................................... 80
Table 5.19 Hypotheses result summary ............................................................................... 82
LIST OF FIGURES
Figure 1.1 Theoretical framework ....................................................................................... 19

Figure 2.1 Typical example of a primary packaging of liquid soap .................................... 29
Figure 2.2 A typical example of a secondary packaging of liquid soap .............................. 30
Figure 2.3 A typical example of a tertiary packaging of liquid soap ................................... 31
Figure 2.4 Basic requirement ............................................................................................... 41
Figure 2.5 Performance requirements .................................................................................. 42
Figure 2.6 Excitement requirement ..................................................................................... 43
Figure 2.7 Zone of indifference ........................................................................................... 44
Figure 2.8 Reverse requirements ......................................................................................... 45
Figure 2.9 Logical framework on Kano model, 1984 .......................................................... 45
Figure 3.1 The semiotics of Charles Sanders Pierce perceptual positioning ....................... 59
Figure 3.2 Typology of perceptual process ......................................................................... 61
Figure 4.1 The research onion ............................................................................................. 63
Figure 5.1 The scree plot ..................................................................................................... 71

10
1 Introduction
This chapter is made up of the introduction to the research. It comprises of the research
background; literature review; research objectives, questions and delimitation; definitions of
key concepts; theoretical framework; research methodology and; thesis structure.
1.1 Background
In the past, packaging was solely regarded to performing technical functions such as
protection and logistics. People mainly packaged goods for containing, protection and
transportation purposes. Mass-media advertising was considered as the major tool for
marketing communication purposes. However, the dynamics of marketing knowledge
growth coupled with rapid consumer behaviour changes in recent time have affected the
main and major role of mass-media advertising among the marketing communication
platform. Researchers have unearthed the fact that despite the huge effort in mass-media
advertising to influence consumer purchase, a large number of purchases are to a large extent
influenced by the environment of the store (Solomon, 1996). Estimated 39% of purchases in
stores are not planned and are mostly orchestrated by the advertising stimuli in the store
(Weinberg & Gottwald, 1982). It has been established that about 66% of all supermarket
decisions to buy are taken in the store. In the wake of this, it can be argued that apart from
mass-media advertising role, there is an increase in desire for the role of the marketing
stimuli in the store to persuade and influence consumer buying decision making. This
revelation motivated researchers to investigate any potential in-store marketing tool that
could stimulates consumers’ purchasing decision when faced with many products in their
choice making. In the light of this, many researches has been done in this area that has
identified packaging and its characteristics elements as a key element of marketing
communication that is greatly influencing consumers’ choice of products.
Aside the technical function, packaging nowadays is recognised by marketers as also
performing communication and attraction functions. This assertion is supported by the fact
that businesses focus their resources on packaging more than on marketing advertising
efforts and packaging is now recognised as the most unique marketing campaign (Dickson,
1994). In addition, there has been an increased in-store purchasing decision-making for non-

11
durable goods coupled with product differentiation effect caused by packaging (Underwood,
Klein & Burke, 2001). In this regard, much academic research has been done that has
revealed the effect elements of packaging characteristics have had on consumers’ buying
decision making concerning different categories of products. In their work on impact of
elements of packaging on buying decision of consumers economics and management
(Kuvykaite, Dovaliene & Navickiene, 2009), the authors revealed that comparing the
effectiveness of visual and informational elements, informational elements are more vital
than visual elements, with reference to buying a milk product. On the other hand, Silayoi &
Speece (2007) wrote about the role of packaging of food items on consumers in Thailand
which revealed that technology of packaging that showed convenience and ease of use
messages strongly affected consumers’ probability to buy. Furthermore, Clement (2007)
wrote in his work about the visual attention effect on buying behaviour of consumers in the
store. He revealed the pros of a model of the human behaviour to explain the buying in the
store and established through an experiment using the eye-track to deduce how visual effect
from the designs of the packaging affected purchasing behaviour. The above research results
clearly show that different categories of packaging characteristics are considered important
to affecting consumers’ buying decision making when research is done in different context.
Soap product can be regarded as one important non-durable product in our everyday life.
The introduction of liquid soap has added to variety of soap forms such as solid and powder
in the market today. In many business environments, the proliferation of liquid soaps is
eminent due to its popularity among consumers nowadays. In the European market, it is
believed that personal care product such as soap has gotten to its stage of maturity of the life
cycle of the product, with the impression that brands can be great mostly through sales
capture from the brands that are competitive. It is believed among major soap companies
and multinationals that the soap market is at its growth stage of product life cycle in
developing countries (Ferrer et al, 2012). In Ghana, the situation cannot be different. Industry
players are now focusing much on liquid soap manufacturing which has created the
proliferation of liquid soap in the market and competition has become fierce among liquid
soap manufacturers. In the wake of this present market challenge, many players especially
the local ones are looking for any effective marketing strategy that could help gain a
competitive advantage to survive the competition. A distinguished marketing effort, which

12
is now popular among industry players, that is helping their business survive the competition
is packaging. In the light of this, it is imperative to ascertain the key packaging characteristics
elements that greatly influence consumers’ decision-making in the event of choosing
between varieties of packaged liquid soaps. Findings of this research could help local soap
industry players consider the appropriate and attractive packaging style for the liquid soap,
which can ultimately boost sales. Theoretically, this could add to the abundance of
knowledge in packaging and the effect it has on consumer buying decision but in different
context, which is soap as a product and in developing country settings
1.2 Literature review
The discovery of the growing importance of packaging and its characteristics in recent times
has attracted a lot of research in this field in diverse perspective. Today, there is a lot of
literature on this subject and researchers continue to research and establish more findings
that will be relevant to the academia and the business sector as well. In this research paper,
previous literature that focuses on packaging and its characteristics as a tool for influencing
consumer buying decision-making and attraction to products are reviewed.
Packaging is known to attract consumers to a brand. In reviewing this finding, Kuvykaite
(2009) in his descriptive research method approach reveals that packaging elements
influence the attraction of consumers to a brand, boost its image and affect consumers’
perceptions of a product. Orth (2009) in his research developed meaningful guidelines for
designing a package for the construction of brand identity. Again, Rundh (2005) in his work
confirmed this finding by establishing that packaging captures the attentiveness of
consumers to some brand, raises its image and positively increase the perception of
consumers about the product. Moreover, Louw (2006) researched on the packaging power
and reveals that the correct packaging could enable a brand establishes a position which is
special in the market environment and in consumers’ minds.
In other findings, packaging is regarded as influencing consumers’ buying behaviour and
attracting their attention. The elements of Packaging, and their effects on the buying
behaviour of consumers became and interested issue. Adelina & Morgan (2007), reveals that
packaging could be regarded as one of the most important elements of marketing

13
communications in recent times; packaging has a significant effect on buying behaviour of
consumers, indicating that the effect of elements of packaging can influence the buying
decision of consumers. Packaging is considered as a differentiation tool, which is it aids
consumers to make a choice among a wide range of similar products, and also incites
consumers buying behaviour (Wells, Farley & Armstrong, 2007). Moreover, Renaud (2007)
considers the influence of eco-labelling on consumer behaviour. He assessed the labelling
relative importance in packaging to other attributes of products such as price, brand and
others for purchasing decisions of consumers. The result that was important was the desire
to purchase products that were packaged with energy efficient material. Again, Hysen &
Mensur (2008) carried out a research on analysis of buying behaviour of consumers with
regards to dairy products in Kosovo. The finding is that packaging has greater impact on the
dairy product purchase by consumers in Kosovo.
Additionally, other researchers focused on distinct elements of packaging as influencing
consumer buying behaviour. The importance of these elements of packaging is dependent
on the context in which the research was carried out. The packaging effect and its elements
on the decision of consumers when making purchase could be established through the
analysis of the significance of its individual elements for consumers’ selection making. Upon
thorough research for literature in this perspective, it was found out that food products were
popularly used as the product of reference. Kuvykaite (2009) theoretically analysed
packaging elements and the effect on consumers’ purchasing decision to practically show
the elements that have significant influence on consumers’ selection of a product. She
deduces from the research that there exist six key elements which must be given priority by
designers of package to establish efficient packaging. These include material, flavour,
colour, form, graphics and size. Additionally, Kotler (2003) in his research establishes
similar result to that of Kuvykaite (2009). He distinguishes six elements that must be given
attention when making packaging decisions. These include colour, size, form, material, text
and brand. Dodson & Yadav (2012) posits that the visual characteristics elements of a
package is significant in product recognition since they establish huge attention and are
captured at a faster pace. McWilliam, (1997) asserts that consumers rely mostly on visual
imagery for low involvement fast moving consumer goods (FMCG). In this regard,
Grossman & Wisenbit (1999) argues that since the attributes evaluation is of low importance

14
in decision-making on low involvement product, highly visible elements such as colour and
graphics become important on choice making among low involvement products. On the
other side, highly involved consumers evaluate informational elements of package carefully,
and therefore depend on this information to establish their attitudes and intention to buy
(Vakratsas & Ambler, 1999). This signifies that when dealing with packaging of FMCGs,
designers must give priority to the visual imagery characteristics of the package whereas
informational elements must be given much priority when dealing with high involvement
products. Visual imagery on the packaging is an important attribute, says (Underwood et al,
2001). They second the argument by establishing that pictures on packages could serve as a
unique element to establish differentiation, and this will stimulate consumers’ consciousness
access. Because in their opinion pictures are stimuli that are bold and clear to view compared
to words. Silayoi & Speece (2004) in their research argue that in many countries, the
influence of different elements of packaging on product brand selection is significant. A
typical example is a focus group research organised in Thailand. The research established
that both visual and informational elements are strongly taken into consideration regarding
brand selection decision.
Kuvykaite, Dovaliene & Navickiene (2009) in their research work concerning the packaging
elements’ impact on purchase decision of consumers, economics and management, they
reveal that the most essential visual elements for influencing consumers’ purchase decision
with reference to milk product and washing powder is material. They also identify that in
this context, graphics forms, and colour could be regarded as not important to packaging of
these products named above. Again, when they analysed the importance of verbal elements,
they state that product information and country of origin for both milk and washing powder
are the most important elements of a package. They finally conclude that in comparison, the
impacts of verbal elements are valuable than visual elements when buying washing powder
and milk.
Environment-friendly character of packaging has also become an issue that consumers are
relying on to make product choice decisions. In his work, Gersen (2000) wrote on ethical
consumer: Danish consumers’ preference for environmentally-friendly packaging. The
research was carried out in Denmark. The findings of this research indicate that higher
number of consumers in Denmark have grown personal affection for the choice of

15
environmentally-friendly packaging and their personal belief is an important identifier of
their willingness for prefering environmentally-friendly packaging in the shopping outlets.
Calves & Ricardo (2008) did a research on characteristics of a product and the perception
quality. In his opinion when consumers make a choice among products that are competing,
they are often challenged with the uncertainty of performance and quality of the product,
therefore they often rely on cues such as the extrinsic attributes. He concludes by revealing
that shapes and colours combination in labels is regarded as the extrinsic attributes used to
perceive quality of a product by consumers. Prathiraja & Ariyawardana (2003) did a research
on the effect of nutritional labelling of packaging on buying behaviour of consumers. In this
research the authors revealed that nutritional labelling is used by consumers to choose a
purchasing decision on food item mostly because of health concerns. They conclude that
many consumers are willing to make extra payment even for the information on nutrition
written on the package. Again, Imram (1999) in his research with reference to food product
posits that the colour effect is the area well researched on. He argues that the perceptions of
consumers of an acceptable colour relates to the perceptions of other elements of quality
such as nutrition and flavour, and with levels of satisfaction. Positive impact can occur by
the manipulation of one or more elements of packaging, including colour of the packaging,
clear packs that aid the food colour viewing, nomenclature, brand name appearance and
incident light. He further states that in the sale of food, the food items chosen for display to
be sold by the food vendors are chosen base on their appearance and colour attributes.
Many studies also reveal that packaging attracts attention from consumers. Goldberg et al.
(1999) asserts that when visual elements which include colour are omitted, the verbal
element attention can be increased. Underwood et al. (2001) in his research states that
pictures embedded on packages are known to stimulate attention, especially when consumers
are not used to the brands. Moreover, packages are regarded to stimulate attraction when
their looks are typically within a class of product (Garber et al., 2000; Schoormans & Robben
1997). By drawing from the above findings, it can be argued that packages that have deviated
stimulate attention. However, other research also confirms that packaging shape and colour
deviated stimulate attention.
In effect, the above literature demonstrates the abundance of literature in this area and shows
clearly that packaging and its elements influence consumers buying decision-making and

16
attracts their attention to products. Many of the research reveal the importance each
individual packaging element has on influencing consumers’ buying decisions and their
attraction to a product. It can be noted that the importance of these individual elements of
packaging depends on the context in which the research is carried out. It is arguable to state
that there is no knowledge about the packaging and its characteristics elements’ effect on
consumers decision to purchase when consumers are in the state to making a choice between
varieties of liquid soap products in the market. Additionally, the abundance of literature in
this area is mostly applicable to the developed countries context and little is known about
this area among developing countries especially Africa. Therefore, the result of this research
will fill this contextual gap and add to the abundant literature already available in this area.
1.3 Research objectives, questions and delimitation
In Ghana, poor packaging has been an existing problem among the local manufacturing
industry. This situation has affected the industry negatively. Several authors argue that
judgement of quality is to a large extent controlled by product characteristics exhibited by
packaging, and this plays a key role in brand preference establishment. If the package is seen
to be of high quality, consumers typically perceive the product to be of high quality. If the
package is seen to be of low quality, consumers typically perceive the product to be of low
quality, consumers therefore regard the product itself as having this “low quality” grade
(Underwood et al., 2001; Silayoi & Speece, 2004). It is in this view that many multinational
manufacturing firms’ products with attractive packaging have always attracted many
consumers in the Ghanaian market. Additionally, liquid soap is much familiar in the
Ghanaian market in recent time. A situation that has created huge competition among liquid
soap industry players. It can be argued that to be sustainable, these industry players are
proactive in discovering certain marketing strategies that will offer them a competitive edge.
As revealed by Dickson (1994), packaging is seen as the most distinguished marketing effort
in recent times. For the above reasons, the objectives and the questions of the research are
stated below

17
1.3.1 Objectives
• To identify the elements of packaging characteristics that influence the perception
of consumers about liquid soaps
• To identify visual and informational elements of packaging characteristics that are
attractive and important to consumer perception about liquid soap
1.3.2 Main research question
• How does packaging influence consumers’ perception about liquid soaps?
Sub-questions
• What are the elements of packaging characteristics that influence consumers’
perception about liquid soaps?
• What visual elements of packaging characteristics do consumers perceive as the
most attractive to selecting liquid soap?
• What informational elements of packaging characteristics do consumers perceive as
the most important to selecting liquid soap?
1.3.3 Delimitation
The study is to ascertain the effects packaging characteristics have on the perceptions of
consumers when selecting liquid soaps in a certain country. This clearly shows that the
research is focused on liquid soaps, and therefore the findings may not be applicable to solid
or bar soap. Furthermore, the study population is limited to a certain group of people in a
chosen jurisdiction in the country where the research is conducted. With regards to this, the
results of the research cannot be generalised for all different groups of people in the country
of study.
1.4 Key concepts definitions
Under this part, relevant concepts that are central to the research paper are defined.

18
1.4.1 Packaging
In the past, packaging was traditionally defined as the process which includes preservation
and drying, and materials which include plastic, paper cardboard, glass and metal used to
contain and store, protect, handle and transport a product (Business dictionary 2006). At
present, the discovery of other functions packaging serves has added to the definition of
packaging. Hence the definition of packaging is the processes, material used for wrapping
and its designs that are employed to contain and store, protect, handle, transport, identify,
display, describe, promote, and otherwise attract attention of products on display (Dileep
2006). Other renowned writers also have varied definitions for packaging. Kotler &
Armstrong (2005) defined packaging as every aspect that concern the designing and
manufacturing of the container for a product or also the product wrapper. Saghir (2002)
also defined packing as linked manner of managing goods for safe, efficient, secure and
efficient handling, transportation, distribution, storage, retailing, usage and recovery, reuse
or disposal in addition to increasing the value of the consumer, sales and therefore profit.
1.4.2 Packaging characteristics elements
Packaging characteristics elements can be defined as all the attributes, both visual and
informational which are identified with a package. For example, some of the visual attributes
are colour, size, shape, graphic design, images and pictures (Vyas, 2015), and some of the
informational attributes are information about place of origin of the product, its usage
instruction and all other vital information that help consumers to know more about the
product.
1.4.3 Consumer perception
This is defined as the process of selection, organization, and interpretation processes that is
formed into an acceptable whole by the consumer (Hanna & Wozniak, 2012). Consumer
perception is again defined as selecting, organizing and interpreting stimuli into a whole and
understanding view of the world (Shiffman & Kanuk, 2007).

19
1.5 Theoretical framework
The diagram below shows a causal relationship between the key elements in the research
paper. The category of packaging characteristics is labelled the independent element and the
consumer perception is labelled the dependent element.
In other words, the concept of the research paper proposes a direct relationship between key
elements which includes the consumer perception which is dependent on the category of the
packaging characteristics. The perception the consumer develops about the product relate to
the interpretation the consumer gives about the packaging characteristics. This therefore
plays an important role in the buying decision-making of the consumer. If consumers
develop positive perception, they are likely to execute purchase, whereas if consumers
develop a negative perception, they are likely not to execute purchase.
Independent elements
Dependent element
categories of packaging
characteristics
consumer perception
Visual characteristics
Informational
characteristics
informational
characteristics
Figure 1.1 Theoretical framework

20
1.6 Hypothesis design and research construct measures
This section designs the six hypothesis and discusses the construct measures associated with
the hypothesis
1.6.1 Size
H1: The more consumers perceive the size of a liquid soap package as being convenience to
carry, the higher their perceived preference for the product.
Independent variable: consumers perceived convenience to carry size of a liquid soap
package.
Dependent variable: consumers perceived preference for liquid soap package in certain size.
The measure for consumers perceived convenience to carry is adapted from Yan et al. (2015)
packaging perceived quality and size: the existing role of a perception of unit price. In their
paper, respondents were made to give judgements of head and shoulder shampoo. They were
shown pictures of small bottles (400ml) and large bottle (1000ml) of the shampoo. They
were then asked to offer their ratings on how much they liked the sizes. A five-point likert
scale was used starting from number 1 (not at all) to number 5 (very much). This research
will modify this measure by using the 5-point likert scale to let respondents to offer their
ratings on the convenience to carry of the sizes.
The measure for consumers perceived preference is adapted from Carpenter and Nakamoto
(1989) product judgement scale, where respondents allocates 100 points among three
different brands to indicates their product preference judgement.
Since the dependent variable will be measured on ordinal scale, the analysis will be carried
out with the ordinal regression from the SPSS stastical tool.

21
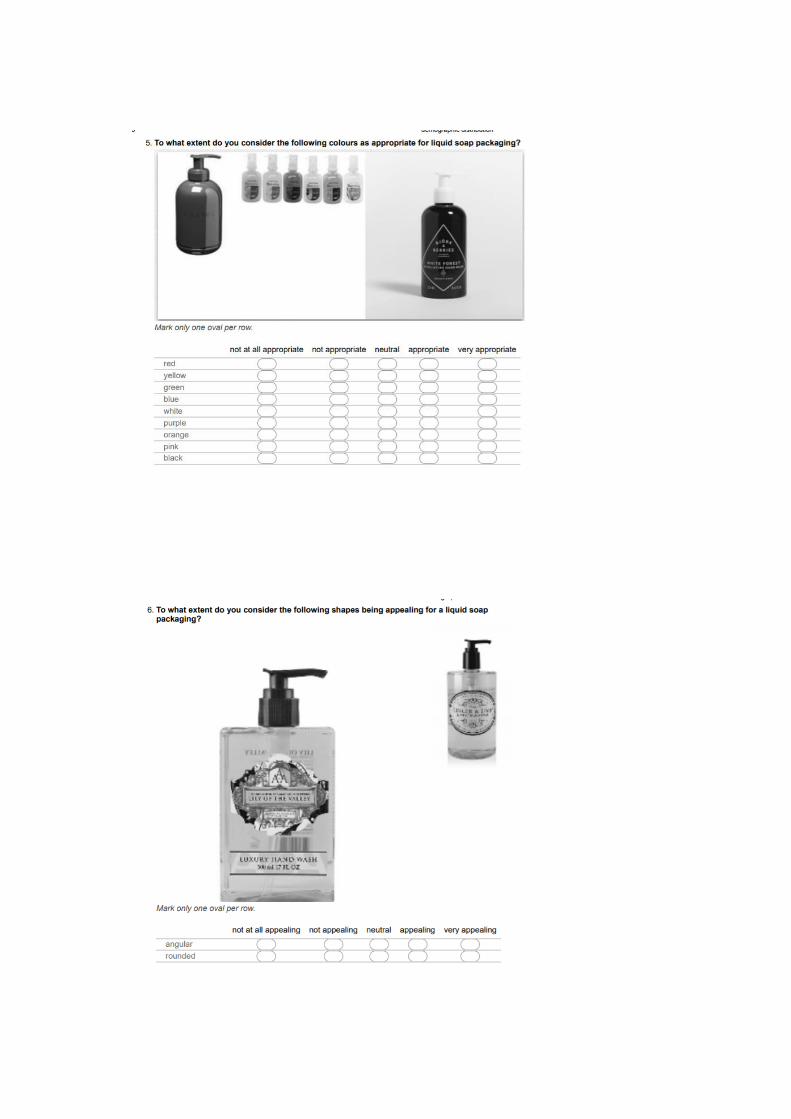
1.6.2 Colour
H2: The more consumers perceive the colour of a liquid soap package as appropriate for the
product category, the higher their perceived preference for the product.
Independent variable: consumers perceived appropriateness of colour for the liquid soap.
Dependent variable: Consumers perceived preference for liquid soap package in certain
colours.
Measure for colour appropriateness is adapted from Schloss, B., Strauss, E. D., and Palmer,
S. E. (2012) colour preference of object. In their experiment 1, preference for imagined
object colours, participants were shown many colour squares and were asked to rate how
appropriate they regard the colours of various objects using a 5-point likert scale starting
from number 1 (not at all appropriate) to number 5 (very appropriate).
Measure for consumers perceived preference is adapted from Carpenter and Nakamoto
(1989) product judgement scale, where respondents allocated 100 points among the three
different brands to show their preference judgement.
Since regression is the tool used for exhibiting the strength of the independent variable’s
effect on the dependent variable, and also used to forecast the impact of changes, in other
words, regression shows how much the dependent variables changes with a change in the
independent variables (Stastistics solution online). The unit of analysis for these variables
will be regression analytical tool.
Since the dependent variable will be measured on an ordinal scale, the analysis will be
carried out with an ordinal regression from SPSS stastical instrument
1.6.3 Graphics
H3: the more consumers perceive the graphics of a liquid soap package as appealing, the
more their perceived preference for the liquid soap product.
Independent variable: consumers perceived appealing graphic of a liquid soap package

22
Dependent variables: consumers perceived preference for liquid soap package in certain
graphics.
The measure for appealing graphics is adapted from Westerman et al. (2012) the consumer
packaging design: the effects of ultering the shapes, orientating, and aligning of graphical
structure on consumer assessments. In their paper, respondents were asked to offer their
ratingsof graphical designs on two products, vodka and water, although these products have
same physical form. A 5-point likert scale starting from number 1 (not at all appealing) and
number 5 (very appealing) was used for the ratings.
The measure for consumers perceived preference is adapted from Carpenter and Nakamoto
(1989) product judgement scale, where respondents allocates 100 points among three
different brands to indicates their product preference judgement.
Since the dependent variable will be measured on ordinal scale, the analysis will be carried
out with the ordinal regression from the SPSS stastical tool.
1.6.4 Information
H4: the more consumers perceive the product information of a liquid soap package as being
important, the more the perceived preference for the liquid soap product.
Independent variable: consumers perceived importance of product information on a liquid
soap package.
Dependent variable: consumers perceived preference for liquid soap package with certain
product information.
The measure for product information importance is adapted from Kraus (2015) factors that
impact the buying decisions and consumer food function. In his paper, respondents were
instructed to evaluate the elements of product information such as the healthful properties
information of a product, value of the nutrition, and guarantee of quality. The evaluation was
performed with a 5-point likert scale with initial and ending being number 1 (not at all
important) and number 5 (very important) respectively.

23
The measure for consumers perceived preference is adapted from Carpenter and Nakamoto
(1989) product judgement scale, where respondents allocates 100 points among three
different brands to indicates their product preference judgement.
Since the dependent variable will be measured on ordinal scale, the analysis will be carried
out with the ordinal regression from the SPSS stastical tool.
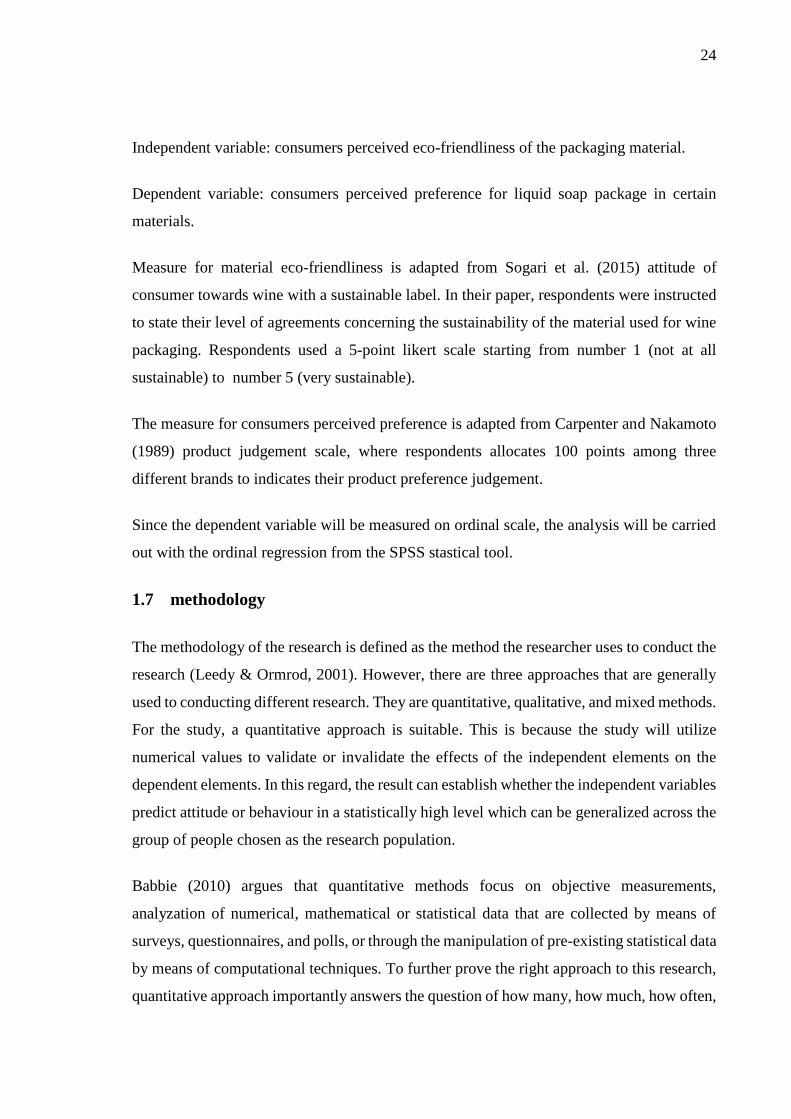
1.6.5 Shape
H5: the more consumers perceive the shape of a liquid soap package as being appealing for
the product category, the higher their perceived preference for the product.
Independent variable: consumers perceived appealing shape of the liquid soap package.
Dependent variable: consumers perceived preference for liquid soap in certain shapes.
The measure for appealing shape is adapted from Vladic et. al (2015) The shape influence
on the perception of consumers about packaging attributes. In their paper, respondents were
shown images of six (6) boxes with different shapes and were asked to offer their ratings.
The ratings was done using the likert scale ranging from 3 to 3 (-3 representing a negative
grade, 0 representing neutral, and 3 representing positive. This paper will modify this
measure by using a 5-point likert scale, starting from number 1 (not at all appealing) to
number 5 (very appealing).
The measure for consumers’ perceived preference is adapted from Carpenter and Nakamoto
(1989) product judgement scale, where respondents allocated 100 points among the three
different brand to indicate their product preference judgement.
Since the dependent variable will be measured on an ordinal scale, the analysis will be
carried out with the ordinal regression from the SPSS stastical tool
1.6.6 Material
H6: the more consumers perceive the material of a liquid soap package as being eco-friendly,
the more their perceived preference for the liquid soap product.
24
Independent variable: consumers perceived eco-friendliness of the packaging material.
Dependent variable: consumers perceived preference for liquid soap package in certain
materials.
Measure for material eco-friendliness is adapted from Sogari et al. (2015) attitude of
consumer towards wine with a sustainable label. In their paper, respondents were instructed
to state their level of agreements concerning the sustainability of the material used for wine
packaging. Respondents used a 5-point likert scale starting from number 1 (not at all
sustainable) to number 5 (very sustainable).
The measure for consumers perceived preference is adapted from Carpenter and Nakamoto
(1989) product judgement scale, where respondents allocates 100 points among three
different brands to indicates their product preference judgement.
Since the dependent variable will be measured on ordinal scale, the analysis will be carried
out with the ordinal regression from the SPSS stastical tool.
1.7 methodology
The methodology of the research is defined as the method the researcher uses to conduct the
research (Leedy & Ormrod, 2001). However, there are three approaches that are generally
used to conducting different research. They are quantitative, qualitative, and mixed methods.
For the study, a quantitative approach is suitable. This is because the study will utilize
numerical values to validate or invalidate the effects of the independent elements on the
dependent elements. In this regard, the result can establish whether the independent variables
predict attitude or behaviour in a statistically high level which can be generalized across the
group of people chosen as the research population.
Babbie (2010) argues that quantitative methods focus on objective measurements,
analyzation of numerical, mathematical or statistical data that are collected by means of
surveys, questionnaires, and polls, or through the manipulation of pre-existing statistical data
by means of computational techniques. To further prove the right approach to this research,
quantitative approach importantly answers the question of how many, how much, how often,

25
and to what extent, which matches the same way the research questions were designed.
Again, Babbie (2010) argues that with quantitative research, one of the goals is to ascertain
the relationship between the independent variable and the dependent variable in a population.
About the data collection, there exist two types of data available for carrying out research.
These are primary and secondary data. Primary data are data collected from the original
sources. They are from first hand sources namely direct interviews, observation,
questionnaires and surveys. Secondary data are data that are readily available and can easily
be obtained from secondary sources such as published piece of article, books, online,
magazines and more (MBA-lectures, 2011). For the research, primary and secondary data
will be used. Secondary data will be collected from multiple sources namely, published
articles, relevant course materials, magazines, books, and online materials. Surveys involve
questionnaires that are mostly designed and directed to the target group. This is done mostly
through mail, telephone or through the internet (Grimsley, 2003). For the primary data, a
survey approach will be utilized where structured questionnaires will be designed and
distributed to the respondents through their emails. This data collection approach will be
suitable because it is inexpensive, less time involved, large of population, and the interviewer
is not directly involved which prevent bias. Nonetheless, there are a few setbacks with this
approach of data collection but will not affect the result of the research outcome in the
strongest. These include the identity of the respondents not known, delays in returning filled
questionnaire and few other more.
Population can be described as every member of the group under investigation, that is each
single member combined making up the entire group which is being researched on. Polit and
Hunger (1999) assert that population is a combined whole of all the subjects, objects or
members that fit to a specification set. Generally, the exercise of collecting data from every
single member of the population under research will be too laborious and time consuming,
therefore a population subset known as sample is utilized for the data collection. In this
instance, a sizeable number of respondents from the population whose size can be used to
generalize the research findings to the whole population are chosen for the collection of the
research data. The process of choosing a portion within the population and using it to
represent the population as a whole is termed sampling (Polit & Hungler 1999)

26
The population for the research will be students from the tertiary institutions in the Sekondi-
Takoradi metropolitan area. Sekondi-Takoradi is the provincial capital of the western
province of Ghana. The city has three tertiary institutions. The intention behind the chosen
population is that this group of people are literates and are well informed about the daily
lifestyle in the society. Their thoughts and perceptions about lifestyle also influence the other
groups in the society because of their educational level. 500 students will be chosen as
sample from the population. The intention is to randomly select a sample of 166 students
from each of the three institutions for the survey. The questionnaire will be distributed to
students via their emails from the institutions’ registry database. The data will be obtained
from questionnaires drafted from standard questions from relevant literature.
Data analysis consist of a process where data is illustrated and described in a systematic
manner using logical and or statistical technique. (Shamoo & Resnik, 2003). The research
will utilize excel spreadsheet and SPSS statistical software to analyse the data that will be
collected.
1.8 Structure of the thesis
The research comprises of two main parts, which include theoretical analysis and empirical
analysis. The theoretical part comprises of three chapters and the empirical part comprises
of three chapters.
The first chapter comprises of the research introduction, which includes the research
background followed by the literature review and research gap, which is proceeded by the
research objectives, questions and delimitation. In continuation, it is followed by the
definition of key concepts; the theoretical framework; research methodology; and the
research structure.
The second chapter writes on the first part of the theoretical part of the research. In this
chapter, theoretical discussion on packaging relevant to the research is elaborated.

27
The third chapter continues with the theoretical discussion by presenting the second part of
the theoretical aspect. This includes the discussion on the consumer perception.
The fourth chapter follows with the research methodology discussion. This is followed by
the fifth chapter which comprises of the empirical analysis followed by the research results.
The sixth chapter follows with the final discussion and conclusion of the research.
2 Packaging
This chapter discusses the theories on packaging perspectives which comprises of: the
theoretical definitions of packaging; the types of packaging; the packaging characteristics
elements; the functions of packaging; the characteristics of a good packaging design; and the
models of good packaging design.
In the past, packaging was traditionally defined as the processes which include preservation
and drying, and materials which include plastic, paper cardboard, glass and metal used to
contain and store, protect, handle and transport a product (Business dictionary 2006).
Presently, the discovery of other functions packaging serves has added to the definition of
packaging. Hence packaging, according to Dileep (2006), is now defined as the processes,
wrapping material and its designs that are employed to contain and store, protect, handle,
transport, identify, display, describe, promote, and otherwise attract attention of products on
display. Kotler & Armstrong (2005) in their study also defined packaging as every aspect
that concern the designing and manufacturing of the container for a product or also the
product wrapper.
2.1 Types of packaging
Generally, a search of literature exhibit that there exist different categories and types of
packaging that are used for holding and containing variety of different products. The types
comprise of the primary, the secondary and the tertiary. However, for the sake of this
research, the primary packaging will be focused on.

28
2.1.1 Primary packaging
Deufol (2002) argues that primary packaging is used to represent the packaging layer that is
first in contact with the product. Normally, it represents the immediate layer the product is
contained. Generally, the primary packaging is designed which includes the product and any
other available packaging secondary layers in mind. The product properties (dimensions,
consistency and form) provenly exhibit the primary packaging main priority. Some known
common types of primary packing are clamshell packaging, blister packs, paperboard
packaging, shrink-wrapping, dose packs unit, and many more.
There can be different functions and applications for primary packaging, and this depend on
the product, and transit and storage aspect. The most key function consists of protecting and
preserving the product against interference externally, damage or contamination, chemical
imbalances and spoiling (Simms & Trott, 2010). Primary packaging also functions by
keeping a product in storage, mostly for long time periods. In view of this, it is necessary
that the product is kept sealed by the primary packaging from its surroundings. In other
words, easy to shelve and handle is other function of primary packaging relevant in ensuring
that the product can be easily handled by consumers (Juma, 2012)
In conclusion, primary packing is the design that cover the product initially, keep it in place
and the layer that has immediate contact with the product. Furthermore, the primary
objective of primary packing is offering protection for the product against damage during
the storage and transportation system.

29
Figure 2.1 Typical example of a primary packaging of liquid soap
Source: www.google.com/images/wordpress.
2.1.2 Secondary packaging
Secondary packaging is regarded as the package that holds together many pre-packed
products together (Deufol, 2002). Since secondary packaging does not have immediate
contact with the main product, it differs in its use and application, and exclusively varies
from the use and application of primary packaging, although both type’s function could in
certain instances be the same. Secondary packaging is seen to offer two key functions:
• Display and branding: Secondary packaging offers a key function during strategizing
in the market for the product. This aspect is seen as relevant when it concerns display
packaging.
• Logistics: Secondary packaging helps during grouping of many products into one
entity to make transportation, handling and storage easier. This implies that
secondary packaging must have the ability to:
i. Hold together huge volumes of package primary products.
ii. Move the product to the consumer reach safely.
iii. Maintain the initial condition during the storage of the primary packaging.

30
Secondary packaging is purposed to offer protection not for the product alone, but also for
the primary product, which is seen as offering visibility to consumers in the store outlet
display. The most available examples of secondary packaging are cardboards formed into
boxes, cartons and, plastic and cardboard crates.
Generally, secondary packaging is mostly outside the primary packaging and made up of
pre-packaged entities that are grouped and enclosed in the primary packaging. This packing
is mostly external and the visible face of the product. Just as primary packing protects the
products from environmental situations, secondary packing offer protection to the primary
packaging and may offer grouping of many items to aid easy handling. The secondary
packaging offer safety and original shape retaining of the primary packaging when moving
product to the consumer outreach locations.
Figure 2.2 A typical example of a secondary packaging of liquid soap
Source: packaging digest: www.google.com/images

31
2.1.3 Tertiary packaging
Tertiary or transport packaging consist of an entity used to carry together many secondary
packaged products to help protect it from damage during handling and transportation
(Deufol, 2002). According to Simms and Trott (2010), tertiary packaging major role relates
to the distribution of the product while Deufol (2002), explained that this tertiary packaging
is mostly in the form of stretch-wrap plastic film, pallets or shrink-wrapped plastic hoods.
This type of packaging may also involve other items that includes layer pads, pallet caps or
cardboard corner guard.
Figure 2.3 A typical example of a tertiary packaging of liquid soap
Source: bas brilman: www.google.com/images
2.2 Elements of packaging characteristics
In this current era where global competition is increasing, there is the necessity for effective
and rapid promotion while product packaging has brought about brand communication of
products. Currently all goods that are processed or manufactured require some kind of
packaging in some stage of their manufacturing or distribution; decisions concerning
Packaging are required during the initial marketing plans which becomes integral part of the
overall decisions are to be considered in the overall marketing strategy (Panwar, 2004).

32
Silayoi and Speece (2007) indicate that there exist four core-packaging elements that impact
buying decision of consumers. These elements are divided into two categories: visual and
informational elements. The visual elements are made up of size, shape or graphics of
packaging while the informational elements is made up of product the technologies used on
the package and information about the product.
2.2.1 Visual elements
Underwood (2003) argues that visual elements exhibit emotional attahment to the consumers
while building brand identity for the brand of the products. According to Dobson and Yadav
(2012), the visual elements of a product package includes the colours, fonts, logo of the
brand, packaging materials, pictures, descriptions of product, shapes and others establishing
associations of rich brand. Generally, while there are differences in the marketing literature
in relation to the classification of the elements of packaging, there is also a broadly common
consensus on the element including:
Material
The material refers to the texture of the material for packaging commodity. It mostly impacts
the commodity packaging visual effect. Materials according to Smith and Taylor (2004)
symbolises the perceived quality of the product, meaning that the perception of consumers
about some materials could be translated to the product’s perceived quality. Applying varied
material surface changes or surface shape can produce commodity packaging at the best
effect. The material for packaging, whether, plastic, paper, metal, glass, bamboo, ceramic
and wood, and other materials combined, exhibit a different material texture quality effect
(Adam & Kamran, 2014). In other words, using varied materials and proper combination
can provide customers with cold, luxurious or novel feeling.
Adam and Kamran (2014) arguments explain why Shah, Ahmed, and Ahmad, (2013) argue
that material of high quality has the tendency to offer attractions to customers much than a
low quality material will do. Relating material packaging to consumer perception of product,
Smith and Taylor (2004) argues that materials also interact while there is some association
of some intrinsic values consumers perceive for the product material. For example, in
relation to card board packaging material, Hollywood et al. (2013) argue that there exist

33
some disadvantage views in the consumers’ mind about it and packaging of such a type does
not preserve the freshness of the product and also the product cannot be seen.
The material is an essential component of the packaging design, it has a direct relation to the
packaging function and the economic cost burden, processing of production and recycling
of waste packaging and other areas of problems (Package Technology Company Limited,
2013).
Product size and shape
There is a surge in the consumption of a product when there is the availability of redisgned
packages or available of packages in larger sizes (Kotler & Keller, 2008). The features of a
products and the market targeted determines the size of the packaging. High quality is
associated with larger pack sizes (Smith & Taylor, 2004) while Keller (2009) argues that
larger pack size increases impulse consumption among consumers. Contrarily to Smith &
Taylor (2004), and Keller (2009), Ahmadi, Bahrami and Ahani (2013) argues that the
willingness of consumers to purchase a product become high if products are contained in
packages of smaller sizes other than larger sizes and length of the expiry is short.
The shape of a product package is associated with the differentiation of the product’s brand.
This is because the design of a package has the tendency to influence consumers’ purchasing
decision (Sherwood, 1999). This Finding has made companies devote much attention to
shape design of a product package. Moreover, it is argued that some small changes in the
shape of a product package can affect the sales and profitability of the product (Prince, 1994).
Research reveals that angular shape is associated with properties that exhibit strength,
toughness and energy, and rounded shape is associated with properties that exhibit
approachability, harmony and friendliness (Berlyne, 1976). Furthermore, angular shapes
relate with masculinity, whereas rounded shapes relate with femininity (Schmitt &
Simonson, 1997).
Colour
According to Keller (2009), colour constitutes an important part of packaging visual
elements to a level that number of designers view consumers possessing vocabulary of

34
colours and perceive certain colours for some products. Colours could provide a brand
differentiation whereby a brand could be strongly associated with a certain colour to the
extent of claiming ownership of that colour and competitors may not be able to possess that
colour. (Keller, 2009). Thus, colour remains a vital visual design element of packaging and
the meaning and information it represents should be seen repeatedly with what some
marketing programs are representing. Gofman et al. (2010) further argues that the correct
colour selection is a vital factor to create impression necessary to enhance the selection of
product and brand.
However, Singh (2006) argues that consumers’ perception about colour differs among
cultures and many religions are perceived to possess their own colours sacred to them.
Consumers possesses colour memory, which they associate to some brands whereby when
they remember a colour, they would remember a particular brand.
With regards to effect of package colour, Madden et al. (2000) argues brand identification is
done by means of the package colour and those colours becomes the major element to attract
consumers and affect product evaluation. However, there is a restriction to colours on
packages accepted, meaning that few colours might be accepted by consumers on a package.
Madden et al. (2000) notes that some international brands are strongly related to colours.
Graphics
Underwood, Klein & Burke (2001) argue that consumers are likely to anticipate the tastes,
feel or smell of a product while they look at the graphics on a product package. In essence,
graphics that produces attractive looks could highly attract consumers to a product and
therefore influence consumers to buy the product. Furthermore, Rundh (2009) argues that
an eye-catching graphics would make a product stand unique on the retail shelves, which
will attract consumers’ attention. In a research work carried out by Rettie & Brewer (2000),
they argue that the attractiveness of pictorial elements is likely influenced by the lateral
position on the package of the product. Again, their research revealed that, consumers are
highly attracted to visual stimuli when placed at the left side of the package. Therefore, this
may imply that visual elements should be positioned at the left side of packages to produce
higher attention.

35
2.2.2 Informational elements
Informational elements generate effect, which affect the cognitive orientation of consumers
(Silayoi & Speece, 2004). Informational elements consist of all the product information on
the package.
Product information
One of the main functions of packaging is the Communication of information. This aid
customers during the buying process to make the correct decisions. Coulson (2000) reveals
some examples of information importance through a research on food labelling: the
emphasis placed on labelling importance has aided healthy food consumption trend, which
provide the consumer the space to consider optional products and to make an informed
choice of a product (Silayoi et al., 2007). Packaging information can misinform, leading to
information that is incorrect and misleading because of small fonts size and plenty writings
which are placed on the package. Pride & Ferrell (2013) further argues that people want to
have idea of the purchase they make. They want to have idea about product origin and the
ingredient included in it. Consumers with allergy and health issues would want to have idea
concerning the nutritional information, warnings on side effects and other warnings. They
also would want to have idea about the ethical sources and whether the product is made of
natural ingredients.
2.3 Functions of packaging
Oostendorp et al (2006) pointed out that the packaging main functions include protecting the
product inside, making it suitable for distribution of the product and also telling stakeholders
within the packaging process about the product inside the package. Additionally, a vital
function of packaging includes its fitness for use. The four major functions of packaging
include containment and protection for the products, products promotion, and the storage
facilitation, convenience and usage of products. Ryan (2004) further expanded on
Oostendorp et al (2006) arguments of the packaging functions by summarising the major
functions of packaging as follows:

36
• Protection of a product against contamination caused by air, moisture, toxins and
micro-organisms.
• Containing and holding together of product so that it would not spill.
• To offer product identification.
• Protection for the easy transportation.
• Stacking products and Storing them
• Printed Information.
Additional vital function of packaging that is gaining popularity is recycle facilitation
environmental damage reduction (Lamb et al., 2004).
2.3.1 Product differentiation
From the consumer purchasing perspective, Rundh (2005) reveals that packaging catches
the attention of consumer to a brand, improves its image, and impact the perception of
consumer about the product. Wells, Farley and Arsmtrong (2007) further supported the
arguments of Rundh by indicating that packaging stimulates consumer buying behaviour.
This meant that generally, packaging is a strategic marketing tool to enhancing product
differentiation. Therefore, packaging plays a vital role in marketing communications and
could be regarded as a major factor that affect consumers decision to make purchase. This is
explained by Vila and Ampuero (2007) assertion that packaging is seen as a crucial variable
in product position within the product differential matrix.
2.3.2 Protection against transportation damage
The traditional function of packaging is to offer protection to the product from possible
damage while moving, keeping, selling and exploiting a product (Gonzalez & Twede, 2007;
Wells et al., 2007; Kuvykaite, 2001) and to guarantee the convenience in the cause of these
activities. In other words, packaging protects a product during transit from the manufacturing
phase to the retailer as well as preventing damage while the product is put on the shelves.
This is a more logistic function of packaging. According to Silayoi and Speece (2004), the

37
logistical role of packaging consists of protecting the product from possible damage,
stealing, spoilage or wrong placement of goods during transportation among distribution
channel. In summary, packing from a more logistical perspective has the following
functions:
i. Protecting and conserving: Product better protection; consumers better protection
and environment better protection; shelf life prolonging; risk of voluntary reduction
accidental tampering; harmful materials reduction; quality certified materials usage.
ii. Handling, transportation, manipulation and storing: reduction of weight; supply
enhancement; re-use enhancement and recycling; stacking together for space saving.
The traditional logistical functions of packaging are made up of protecting and conserving;
handling, manipulating, transporting and storing. Regarding performance, these functions
can work together same moment to create better efficiency, regarding the reduction of cost
and saving time, and the quality of service improvement.
2.3.3 Attraction and promotion
Lorette (2015) argued that how a product is packaged may be a critical factor that could
attract the consumer to first have a glance on the product as it is shelved. Furthermore,
packaging could also serve as a source of promotion by communicating critical information
about the product to the consumer. Similarly, to Lorette, Dobson and Yadav (2012) also
noted that packaging produces a method that is attractive for communicating and conveying
information concerning attributes of product to consumers. This Chen (2005) indicates that
quality design of packaging rightly contains messages of a product, which brings
understanding to consumers. Generally, product packaging is a crucial factor that impact the
decision-making process involved in decision-making of customers as it can serve as a form
of attraction through communication to consumers. According to Silayo and Speece (2004),
a good packaging should promote the product on the shelve of a supermarket to ensure that
consumers respond favourably.
In conclusion, it can be stated that the basic functions of packaging can be argued both from
the marketing and logistical perspective. The four marketing matrix can be the basis for
packaging from a marketing perspective while the packaging logistical role is to protect the

38
product during transportation and movement to prevent damage and spoilage during
movement from manufacturing to retailing in the supply chain. Thus, the literature on the
functions of packaging suggests that effective product packaging protect, preserve and
promote products from the manufacturer to the consumer. In other words, the major function
of product packaging is to hold product and the information exhibition on what is it holds
inside. However, generally, the most immediate importance of product packaging is to
prevent the product from being damaged while maintaining its quality. Additionally, it is
concluded that product packaging has become a productive tool for communication,
differentiation and focus on consumers in a market that is highly competitive from marketing
mix perspective. On the other hand, from a logistical perspective, while offering protection
for goods being transported, packaging also maintains the product quality and increase the
life of products.
2.4 Characteristics of a good packaging design
In today’s market, every product is packaged. As many products are competing in the
market, what makes one product unique and stands out among packaged products is the
adoption of characteristics a good packaging design.
A good packaging design must make good use of imagery; insights action and emotion; have
a clear branding and logo; easy to open and convenience of use; and be environment friendly.
2.4.1 Use of good imagery
Good imagery is inevitable in good packaging. According to Pankrantz (2012), consumers
are passionate about images that help associate them to the product. An example can be seen
in exercise making equipment purchase, whereby consumers see images of well-built person
on the equipment, and consumers wish they were in such form. In addition, it is more likely
to find pictures of cute babies on the package of baby products. Placing the correct images
on a package to link up with the consumer is one of the most vital elements in a product
packaging of a good standard (Court et al, 2009).

39
2.4.2 Insights action and emotion
The most important reason for packaging a product for marketing purposes is that the design
of a package should influence the purchase of a product by the consumer. In addition, if the
design is unique, the packaging brings an emotional feeling to the consumer. The emotional
feelings such as passion, intrigue, desire excitement, intrigue, or maybe the consumer may
desire to come back for more due to those feelings. (Silver, 2011).
2.4.3 Clear branding and logo
According to Harrington College of Design (2013), packaging that do not convey the
message of its brand is not complete. The brand message Expression includes the brand
language, its positioning and the placement of the logo. The language of the brand can be
fun-loving or serious. The positioning, however, expresses how the product is advertised on
the packaging. Know the positioning of your product before designing it because it's helpful
for ensuring the packaging is in line with the positioning (Harrington College of Design,
2013).
2.4.4 Easy to open and convenience of use
Packaging developers must look for a good balance between secure packaging and easy to
open packaging. To offer much better consumer experience, consumers must be able to find
their package secured and also able to open the package easily. Packaging technologies are
now being utilized to inculcate these features into a package.
2.4.5 Environmentally friendly
In recent times, the protection of the environment has seen greater attention from all
stakeholders. Governments of many countries have given priority to conserving and
preventing the environment from destruction. For example, the European Union has
instituted a directive on packaging regarding the reduction of waste and instituted measures
on the requirements concerning the amount of packaging material to be recycled (Dobson &
Yadav, 2012). Most importantly consumers are keen on patronizing environmentally
friendly products whiles keeping a distance from non-environmentally friendly products.

40
This situation has created a path where environmental concerns have become a major issue
during packaging design.
2.5 Models of good packaging design
This section introduces and elaborates some of the relevant models that help in designing a
good package.
2.5.1 Kano model
The Kano Model was discovered in the 1970s and 1980s by Kano when he was studying
quality control and customer satisfaction. It is basically a theory on product development.
Verduyn (2014) argues that the success of a product will depend on how effective it is able
to solve consumers’ problems. Every problem of a customer can be regarded as a need. The
Kano Model shows an in-depth representation of need’s three main categories that all
product must exhibit to be able to bring satisfaction to consumers. Again, according to
MacDonald et.al (2006), the Kano Model continues to be a critical element found in the front
end of product and service development. The model classifies five categories of customer
preference that have different effects on customer satisfaction. They include the following:
Must-be quality
The must-be quality features of Kano model are given recognition when fulfilled, however,
when these features are absent, customers are not satisfied (Kano, 1984). A typical example
would be the when there are leakages in a fruit juice package, consumers are not satisfied,
however, if the package does not leak, consumers do not become highly satisfied. As
indicated in the figure below, these are the expectations the customer requires to receive
which are often taken for granted. Put into consideration these tasks as obvious expectations
your customers possess in mind. When execution is poor, satisfaction is low, and when
execution is perfect, satisfaction remains neutral. The likelihood of every one of your
competitors providing this expectation is high. Typically, the sources to find these
expectations include government regulations, industry standard, corporate experience and
customer complaints.

41
Figure 2.4 Basic requirement
Source: www.kanomodel.com/discovering-the-kano-model/
One-dimensional quality
The attributes of one-dimensional quality bring about satisfaction when present, and exhibit
dissatisfaction when not present (Kano, 1984). A typical example is seen in a juice new
package that is perceived to hold five percent more juice being sold at the same price has the
tendency to exhibit customer satisfaction, but in reality, if it holds two percent more juice,
there is the tendency that consumers will feel deceived which can bring about dissatisfaction.
Generally, customers have these requirements in mind during purchase decision making.
Among the Kano requirements, these are the highly visible and are easier to get because
customers make it known freely (Verduyn, 2014). As indicated in the figure below, when
performed better, the satisfaction is high, but when performed poorly, the satisfaction is low.
Kano call this “one-dimensional” because of its linear character, the better the execution, the
higher the satisfaction the customers receive.

42
Figure 2.5 Performance requirements
Source: www.kanomodel.com/discovering-the-kano-model/
Attractive quality
The attributes of the attractive quality bring about satisfaction when they are achieved fully,
but do not bring about dissatisfaction when not present (Kano, 1984). These attributes are
mostly not expected. Popularly, these are among the most important of all the categories.
They are the requirements customers do not expert, but often get to them as a surprise which
delight and keep them in an excitement mode (Verduyn, 2014). These are known to be the
unique innovation companies bring into their products. As indicated in the figure below, they
cause excitement when present, but does not cause dissatisfaction when absent because the
customer does not expect them.

43
Figure 2.6 Excitement requirement
Source: www.kanomodel.com/discovering-the-kano-model/
Indifferent quality
The attributes of the indifferent quality are regarded as not being good or not being bad and
will not bring about satisfaction or dissatisfaction (Kano, 1984). As the name suggest, they
do not cause any difference. For example, the amount of wax coatings applied to a juice
package box will not cause any satisfaction or dissatisfaction among customers.

44
Figure 2.7 Zone of indifference
Source: www.kanomodel.com/discovering-the-kano-model/.
Regardless of their presence or absence, customers do not care about these requirements
because on either circumstance, customers’ requirements are neutral (Verduyn, 2014). A
typical example is the most advanced feature included in a handset where many people do
not even desire to use them.
Reverse quality
The reverse quality attributes are regarded as the achievement to a higher level, which could
cause dissatisfaction among customers because of preferential differences among consumers
(Kano, 1984). For example, some products may have too many extra features which may not
produce dissatisfaction among consumers who are not feature savvy. Some consumers have
preference for high-tech products, whereas others have preference for the basic model of a
product and will not be satisfied if a product possesses too many extra features. Interestingly
regardless of requirements categories developed by Kano, customers’ preferences could be
unpredictable in some cases. What some customers perceive as an excitement quality, some
may perceive it as a basic quality, and a third group may even perceive it as a performance
quality (Verduyn 2014). These differences are due to the segmentation of customers.

45
Figure 2.8 Reverse requirements
Source: www.kanomodel.com/discovering-the-kano-model/.
Figure 2.9 Logical framework on Kano model, 1984

46
Source: www.kanomodel.com/discovering-the-kano-model/
The horizontal axis involves how well the product package fulfils customer requirement
while the vertical axis focuses on how the packaging of the product impacts on customer
satisfaction. Generally, the Kano model deduce that joining together of the functional
fulfilment level and emotional satisfaction that is received by a customer receives from a
product have a relationship with the assessment of the product quality by the customer.
According to Kano Model, the levels needed, both emotional and functional, differs across
attributes of a product, and that product packing designers should look for the better
combinations of functional fulfilment and emotional satisfaction during the design of
attributes of product (MacDonald et al., 2006).
With the application of the Kano model in this study, market managers into product
development and design would be able to:
i. Conceptualise the basic expectation that consumers of a product simply expect from
the packaging design of the product.
ii. The model would also help to map the product and its associated features against
meeting basic expectations.
iii. Focus on delighters that can be dependable and create a truly different product and
continues to deliver customer satisfaction.
Generally, the basic role of the Kano model is to offer support to discussion and specification
of product bringing about better packaging and development.
2.5.2 Haberma’s theory of communicative competence
The Habermas’ theory of communicative competence was propounded by Jürgen Habermas
in the 1980s. The basic proponent of this theory is that it is from the communication activities
that society operates and goes on. That is, Habermas emphasizes on communication among
people, interaction by means of communication, and the results of this which brings about
operation of the social world.

47
The theory of communicative competence according to Habermas (1976) is a move to make
good this claim by means of reconstructing the speech normative basis as a form of universal
and necessary validity assertion. The reason that lie in the need to look out for and
reconstruct the conditions that are universal of probable understanding is that language
cannot be disseminated unless an understanding is achieved in it. McCarthy (1978) argues
that comprehension occurs when speech is made, nonetheless this does not indicate that all
speech necessarily produces comprehension. However, when claims of validity are curtailed
due to some kind of deceit, there comes a parasitic communication upon speech made
towards understanding.
In relation to product packaging, Habermas communicative competence theory, perceive
that a group of norms which include sincerity norm, truthfulness norm, legitimacy norm, and
comprehensibility norm can serve as guide the complex assignment of producing good
product packaging. By being guided by these effective directives, marketers can strongly
carve a niche for their package to impress and promote, while at the same time preventing
the communication of package that may be regarded as duplicitous. The theory establishes
a prominent directive against which makers of public policy and producers can assess the
distortion level in labelling and packaging. Consumers should enjoy some benefit when it
comes to a clearer representation of the product that are available in the market-place
(Underwood & Ozanne, 1998).
Habermas (1984) originally set a benchmark against which all communication forms can be
compared to each other as indicated earlier. However, recently, Vernuccio et al. (2010) have
further added an additional norm which is the norm completeness. Generally, to assist
consumers develop an objective perception about a product package; the theory of
communicative competence also specifies that the information produced through packaging
would uniquely have the following five attributes and norms:
i. Honesty: Thus, the package represents the product by means of honestly
representing the product value
ii. Truthful: the package does not leave out any necessary fact that is vital to the safe
and proper use of the product

48
iii. Sincere: The level at which true intention of producers are communicated. Thus,
the extent to which the package does not bring confusion to the issue in a
deliberate manner
iv. Comprehensible: The avoidance of using words that are vague and specialised
v. Complete: This signifies all issues consumers would recognise as helpful to
performance and evaluation of the product.
The application of Habermas’ theory of communicative competence is relevant in this study
in studying how packaging influences consumers’ perception of liquid soap as adopting this
theory should profit from a degree of package-produced consumer cynicism and a higher
potential for enhanced customer relationships that will be long term.
3 consumer perception
This section reviews related literature on consumer perception by analysing and discussing
the relevant concepts and theories related to consumer perception. The section is important
in enhancing a unified conceptual, empirical and theoretical framework suitable for use in
addressing the consumer perception aspect of the study. In other words, the literature on
consumer perception is reviewed from the theoretical, conceptual and empirical
perspectives. The following major themes are discussed in this chapter: the theoretical
impetus; conceptualisation of consumer perception; elements of the perceptual process;
factors that influence consumer perception; and product packaging and consumer perception
3.1 Theoretical impetus
This section reviews the analysis of the theories which are critical to addressing consumer
perception. Thus, this section discusses the theoretical assumptions and proponents under
which the consumer perception aspect of this study is being conducted. The section carefully
reviews the basic ideas and assumptions of the theoretical foundations under which the
consumer perception aspect of the study is conducted. The major conceptual and
methodological limitations of these theories are also discussed in this section.

49
The theory of perceptual filters and the Gestalt theory of visual perception are the two main
theories critical for understanding the concept of consumer perception in the study.
3.1.1 The theory of perceptual filters
The theory of perceptual filters was formulated by Broadbent in 1958 as one of the most
known theories among the information processing framework of human for understanding
the perceptual process. The basic principle of the theory of perceptual filters is that the
perceptual process is a group of filters, that is deployed to sort and modify a stimulus. The
set of filtering, sorting and modifying a stimulus according to Crane and Klarke (1994) leads
to stored memory of consumers.
In understanding the theory of perceptual filters, it is necessary to explain what a perceptual
filter is. Generally, the makeup of our mind occurs from information that has been filtered
consciously or subconsciously. This goes through the process of a perceptual filter.
Therefore, Pam (2009) argues that perceptual filtering is the process with regards to focusing
attention upon a selected subset of many sensory stimulants which is present at any particular
time. Perceptual filtering is important mainly because the physical and mental ability of a
person to deal with many sources of data is restricted. Brignall (2012: p.4) defines a stimulus
as anything that cause sense organs which include the eyes, nose, ears, tongue and skin to
respond, function or become active.
In this regard, Starbuck and Millikens (1988) argues that perceptual filtering that is effective
keep hold of relevant information and dismisses irrelevant information. This process is
essential to ensure that the relevant information goes into the perceptual foreground while
the irrelevant information moves into the background.
Fundamentally, the theory shows the relevance of recognition and evaluation of the
perceptual process elements, wanting to affect and activate the consumer’s perception.
According to the theory, every phase of the perceptual process enables the consumer feels
differently as the strength of his/her response and the vital of external influence changes
(Chibok, Msheliza & Ndubuisi, 2013).

50
Relating the theory to product packaging and consumer perception, the theory tries to explain
why consumer attention to a product through its package is necessary. The basic idea is that
attention to a product package is needed because the main mechanisms cannot stand the
intensity of sensory stimulation available at any given time. This therefore meant that for a
product package to attract positive attention, its design, features and characteristics are
essential.
Despite the application of the theory of perceptual filters in understanding consumer
perception, just like any other theory, the theory of perceptual filters has been critiqued on
several grounds. As noted, the theory assumed that its assumptions occur among those who
perceive, not their surroundings, and that the stimuli that are unfiltered are facts. However,
Ittetson, Karen and Timothy (1976) argue that those who perceive are not separated from
their environments because they are inter-dependent, while validation or invalidation of
perceptions can occur when there are some activities on the environment.
3.1.2 Gestalt theory of visual perception
The people who discovered Gestalt theory include Wolfgang Kohler, Kurt Koffka and Max
Wertheimer. For this study, the Gestalt principle is limited to the aspect of the Gestalf that
explain human perception. Gestalt principles determines to bring to bear the regularities by
which the input of the perception is arranged into single forms.
The key idea behind Gestalt theory of visual perception is the whole being other than the
sum of the parts. Thus, when human beings see a group of objects, they perceive the objects
in their entirely whole before they see the individual objects. This, Bradley (2014) argues
that human being sees the whole as more than the sum of the parts. Philosophically, the
Gestalt school of thought proposes that our perception is the result of the relationship
between stimuli, rather than the existence of the stimuli themselves. Again Bradley (2014)
argues that visual perception is a function of our eyes and brain and that we see things as a
whole rather than in parts. The parts of things usually constitute visual images including line,
shape, texture and colour.
Fundamentally, the Gestalt theory of visual perception put in effort to comprehend the laws
of our ability to achieve and keep intact meaningful perceptions in an apparently dynamic

51
world (Carlson et al, 2010). In the perception environment, Gestalt psychologists posits that
the products of complicated interactions among all stimuli is perception.
In relation to product packaging in marketing, the philosophical assumption of the Gestalt
theory of visual perception implies that the all combined into one entity (a picture of a
package) produces a varied and strong meaning than its individual components (colour,
shape etc, respectively). Escher and Water (1938) argues that, in viewing the "whole," a
process of cognition occurs where there is a leap of the mind from understanding the parts
to seeing the whole. This study applies the Gestalts theory based on Schiffman & Kanuk
(2000) argument that the theory is very essential in understanding the visual environment.
In concluding the ideas behind the Gestalt theory of visual perception, the theory presents
how and why objects are grouped together. Fundamentally, the basic tenet of the theory is
that humans can only perceive stimuli in groups rather than individual or isolated elements.
3.2 Conceptualization of consumer perception
This section explores the definition of consumer perception by drawing on the key contracts
in operationalizing consumer perception. In defining consumer perception, the chapter tries
to review what constitutes perception. According to Aspfors (2010, p.13), perception is
viewed as the process whereby someone selects, arrange and eventually interpret stimuli,
and these stimuli are manipulated and translated to be someone’s personal view of the world.
Aggarwal (2004) expanded the definition of perception by Aspfors (2010), by arguing that
consumer perception is related to how information is collected and categorised by the
consumer and that consumer perception is altered by the number of exposures to a stimulus
and by the interpretation offered by the consumer.
Similarly, Schacter et al. (2011) supports that perception is the process of selecting,
organising, and interpreting sensational information into a meaning that is whole in order to
represent and understand the environment. However, Boundless (2015) argues that selecting,
organizing and interpreting perceptions can vary among different consumers. Therefore,
when consumers have varied behaviour in a situation, some of their behaviour can be

52
interpreted by assessing the process of their perceptions and how their perceptions are
translating into their feedback.
Blank (2015) also defined consumer perception as the sensory perception concept to
marketing and advertising. Fundamentally, consumer perception has a relationship with how
consumers create opinions about the products and services offered by companies, which they
are engaged in purchasing. Aspfor (2010) argues that the idea of consumer perception is
generated by customer experiences, their perception about the service they receive and
importantly by whether they receive satisfaction with their experiences or not.
Generally, the perceptual process is important in the marketing decision of marketers based
on Chibok, Msheliza and Ndubuisi (2013) assertion that an understanding of perceptual
processes is important. This could be explained by the assertion that the decision of
consumer to buy a product is strongly motivated by the manner or way the consumer uses
the information of the product to creates positive meaning.
From the definitions presented above, it can be deduced that perception is said to be the
process by which a consumer develops an opinion about all the stimuli he or she gets from
the sensory organs. Generally, perception is highly subjective and could easily be distorted
hence the need to properly define it. In other words, the process of perception is primarily a
conscious act as well as an approximation of reality. Fundamentally, whatever customers
see, hears and experiences is connected and forms their overall perception.
3.3 Stages of developing a perception
Classically, the method of studying stimuli and measuring response has been limited to the
five senses. However, in contemporary times, the view that merely hearing, sight, touch,
smell, and taste to understand the environment according to Murphy and Kovach (1972) is
inadequate.
Against this background, Connors (2012) indicates that the perceptual process as a whole
consist of three stages; the stage of exposure, the stage of attention, and the stage of
interpretation. In other words, these stages form the whole perceptual process. However,
Cross (2015) and Branyte et al. (2007) argue on the stages to perception formation by adding

53
retention as the fourth stage in the perception formation process. According to Branyte et al.
(2007), exposure, attention, interpretation and retention are the popular perceptual process.
Therefore, the perceptual process can be defined as steps in sequential arrangement, which
involves selection of stimuli, organization of that information, and interpretation of those
stimuli. This process is mostly an unconscious occurrence and it occurs many times a day.
For example, the brain does not need to interpret the object the eyes see when you open your
eyes. Unconsciously, the eyes see the object when light falls on the retina of the eyes. The
eyes then unconsciously identify the exposed object (Boundless, 2016). A review of each of
these stages is discussed below:
3.3.1 Exposure
Exposure involves the extent to which humans interact with a stimulus of which the
information from the stimulus is received through their senses and the immediate response
by means of sensation. Therefore, sensation could be defined with reference to this study, as
the immediate reaction of the sensory receptor (the eye) to basic stimuli such as light, colour,
shape, size and texture (Solomon, 2011). Cross (2015) further explains by noting that
sensation is realised when senses first receive external stimulus of a product and that the
receptors of the sensory of a consumer are received by brand or product cues by means of
sound, smell, sight, texture and taste. For this study, focus is placed much on perception
through vision. Consumers concentrate on some stimuli, may not be aware of others and
sometimes even may go as far as not pay attention to some messages (Solomon, 2011).
Consumers should be capable of perceiving when being exposed to stimuli. This condition
can be achieved through a mechanism called the sensory absolute threshold. Solomon (2011)
argues that the sensory absolute threshold is the small amount of stimulation that can be seen
on any available sensory receptors. For example, an advertisement post may contain
persuasive and enticing messages, but this post may fail to achieve its marketing goal if the
prints are too small or even too many to gain consumers attention.
However, Perner (2010) argues that exposure is inadequate to significantly impact the
individual. This could be explained by the ideologies of selective exposure. According to
Rooks and Willson (2000), stimulation includes selective exposure and that consumers can
actively choose whether or not to expose themselves to information. This involves zipping

54
and zapping. Zipping refers to the fast forwarding or skipping of advertisements or
commercials in a recorded tape, whereas zapping refers to using a remote control to change
a channel just to avoid particular advertisements (Kitchen, 1986).
Relating exposure to packaging, Burke and Edell (1989: p.254) argues that when packaging
is being exposed to, it triggers an action towards it (attitude towards packaging) which
translate into specific judgements or perception and emotions or feelings (affective
reactions) that produces an all-inclusive reaction towards the featured product (attitude
towards product) which at the end cause effect on behaviour.
Chibok, Msheliza and Ndubuisi (2013) argues that consumers develop impressed perception
of a brand through their packaging and grow preferences for a brand on the bases of their
exposure or attraction to the package design. However, Crane and Klarke (1994) argues that
it will be difficult for a consumer to perceive or anticipate aa stimuli through sensation.
Sensation and perception are difficult to stay apart because they inclusively form one
continuous process.
3.3.2 Attention
According to Devito (2009), the environment is full of stimuli that can attract attention
through various senses. In consumer information processing, Cross (2015) argues that
attention happens when an individual ponders and register the capacity of mental procession
to the outer stimulus from a brand of a product. At this level, the brain accepts the attention
stage stimuli and translates the stimuli, based on our desires and experiences in the past,
which is in the interpretation stage. Solomon (2011) argues that in our society, we are
exposed to too much of good and interesting information, which creates a situation where
consumers are mostly in a sensory overload condition. In this situation, consumers are
exposed to too many information than they can cope. This explains Crane and Klarke (1994)
argument that not all attention stage stimuli cause consumers’ reaction. This means it is not
every stimulus that a consumer allocates part of his or her mental activity to. The fact that
the brain’s capacity to process information is limited, consumers are selective concerning
the information they give attention to (Solomon, 2011). In their perceptual selection process,
consumers pay attention to only a small part of the stimuli that is available to them. Solomon

55
(2011) further argues that consumers engage in a form of picking and choosing “psychic
economy” among stimuli to desist from being overwhelmed. This practice of picking and
choosing is carried out through personal and stimulus selection factors.
Personal selection factors
There are three factors under this section. They include experience, perceptual vigilance, and
adaptation. Experience occurs as a result of acquiring and processing stimulation over time.
Based on previous experience, consumers decide how much of a certain stimulus they can
accept and process. Perceptual vigilance occurs when there is a probability for consumers to
give attention to stimuli that has a relationship with their needs. For example, a consumer
who is in need of a personal computer laptop will likely pay much attention to advertisements
on computers. Lastly, adaptation occurs when consumers experience stimuli for quite too
long and becomes familiar with it. In this situation, consumers no longer give much attention
to those stimuli. However, consumers can become habitual and would require heavy dose of
a stimuli before he or she can notice it. For example, traders may notice an advertisement
poster in their market vicinity the very first time it was posted. But after some time, they
become familiar with it and may not pay much attention to it again. Solomon (2011) argues
that there are many factors that can create adaptation. They include duration, relevance,
exposure, discrimination, and intensity. Intensity: less-intense stimuli such as low sound
and dim colour create habituation simply due to the fact that they create less sensory impact.
Discrimination: Stimuli that are simple cause habituation in that they do not require attention
to detail.
Exposure: Stimuli with frequent encounter cause habituation as the exposure rate increases.
Relevance: Stimuli that are not relevant or not important cause habituation simply because
they are unable to attract attention.
Stimulus selection factors
Coupled with the mind-make-up of the receiver, certain stimulus characteristics also
contribute to the determination of what receivers notice and what they ignore. Solomon

56
(2011) argues that these factors are relevant to marketers to develop messages and packages
that will be meaningful to their marketing campaign. Generally, consumers are more likely
to be attracted to stimuli that are different from the ones around them. Weber’s law supports
this argument. It states that the degree of change that is essential to be seen is strongly related
to intensity of the original stimulus. In other words, the strength of the initial stimulus
influences greatly the change that needs to occur for it to be noticed. These stimulus
characteristics include size, colour, position, and novelty (Solomon, 2011).
Size: the stimulus size different from the competition influences the determination of the
attention to the stimulus itself.
Colour: it is arguable that colour is an essential character for drawing consumer’s attention
to a product or even to give the product a unique appearance.
Positioning: generally, stimuli that are strategically positioned tend to be noticed by
consumers. When a stimulus is placed in a position where consumers are most likely to look,
then it has a better chance of attracting consumers. For example, consumers in a super market
are more likely to get attracted to stimuli that are placed at eye level.
Novelty: stimuli that are placed in unusual places or ways tend to attract consumers attention.
Placing stimuli in unconventional places such as walls of tunnel, street floors, swimming
pools, and even tangled phone lines on the street influence consumers’ attention greatly
because competition is less in such places.
The arguments raised support Brignall (2012) assertion that a change in stimuli will catch
one’s attention. In relating sensation to the attention stage, Rooks and Willson (2000) argue
that stimulation includes selective attention, which involves initial, involuntary and parallel
processing of the physical characteristics of the stimuli. According to Benoni and Tsal
(2013), the result of the initial analysis at the attention stage, attention can choose a stimulus
for another processing to identify its meaning at the interpretation stage. However, Devito
(2009) argues that since generally, consumers are unable to perceive everything that occurs
around them concurrently, they tend to occupy in selective perception; thus, anticipate
positive things only.

57
3.3.3 Interpretation
Interpretation in the perceptual process involves the attachment of meaning to the stimulus;
thus, making sense out of the stimulus. At this stage, the perceiver forms the perception of
whether the stimulus is an object like and of what value the object would be to the perceiver.
However, Crane and Klarke (1994) argues that consumers are unable to comprehend the
correct meaning of a stimulus during interpretion. Just as people have varied views about a
particular issue, their perceptions about a particular stimulus differ as well. For example,
after a class lecture, and some selected students are asked to give their opinion about the
lecture topic, it could emerge that majority of them would give different opinion about the
topic. Generally, consumers employ schema to establish their interpretation of a stimulus.
Schema is a cognitive entity in memory that represents a person’s knowledge of a stimulus
(Flaherty, K. E. and Mowen, J. C., 2010). In explaining further, consumers visit the stored
memory of knowledge of previous stimuli encountered and relate them to the present stimuli
to pass judgement.
Relating the interpretation stage to product packaging, advertisers recognize that consumers
would many times relate an advert to already existing schema in order to interpret it
(Solomon, 2011). This indicates that advertisers create marketing strategy by utilizing the
identification and evocation of the right schema, which has become a vital criterion for
evaluating a product via its package (Solomon, 2011).
Organization of stimulus
Solomon (2011) argues that a stimulus interpretation occurs with the assistance of the
relationship consumers imagine it has with other events, sensations, or images in memory.
Some basic organizational principles serve as the guidelines with which the brain associates
incoming sensation to pre-existing ones in memory. These principles are the products of
Gestalt theory. Gestalt theory from previous discussion, maintains that people’s
interpretation of meaning is based on the whole stimuli rather than from any individual
stimulus. Solomon (2011) supported this argument by noting that when each item of a
stimulus is analysed separately, its total effect cannot be realized. The manner the brain
organize stimuli is influenced by the many principles derived from Gestalt theory. Some of

58
the key principles relevant to this research include: the principle of closure; the principle of
similarity; and the principle of figure-ground.
The closure principle establishes that individuals try to create their own complete picture
from an incomplete picture. They tend to use previous experience to fill in the blanks.
Marketers use the closure principle strategy to entice consumers to attend to their advertising
messages because it invites consumer participation (Solomon, 2011)
The similarity principle is based on grouping elements with physical characteristics
resemblance. The principle of figure-ground establishes that one element of the stimulus will
become dominant while another element will retreat into the background. When marketers
use the figure-ground principle, the establish advertising message deploying a stimulus as
the point of focus, or may also deploy this stimulus as a mere context around the point of
focus (Solomon, 2011)
Interpretational bias of the beholder’s eyes
People are different in all aspect of life including how they perceive and view issues, objects,
and all other things around them. This makes it difficult to have distinct and single
interpretation of any objects and issues. This assertion applies also to stimuli. The stimuli
that consumers perceive are not susceptible to just one distinct and single interpretation.
Consumers’ interpretation is subject to their past experience, needs and expectations. For
example, expectations of football pundits would make them offer bias interpretations of a
football match between rival teams A and B. Supporters of team A will interpret the playing
performance to favour their team while supporters of team B will also interpret the playing
performance to their team’s favour.
Semiotics
Semiotics involves the learning of symbols and signs correspondence and the meaning these
elements signify. The use of products to show the social identity of consumers makes
semiotics an important tool to consumer behaviour. Learned meanings are posited in
products, and consumers mostly depend on marketers to figure out what these meaning are.

59
In the field of semiotic, there are three aspects of marketing messages which include a sign
(symbol), an interpretant, and an object (Solomon, 2011). The object represents the product
which is regarded as the main purpose for the message. The sign represents the sensory tool
that indicates the intended meanings of the object. Finally, the interpretant represents the
meaning our perception helps us to make out of the sign (Solomon, 2011). Below is a figure
that shows this relationship.
Charles Sanders Peirce, a semiotician posits that there is a relationship between signs and
objects in one of three ways. Signs can look like objects, have connection to them, or bonded
to them in a conventional manner (Solomon, 2011).
Figure 3.1 The semiotics of Charles Sanders Pierce perceptual positioning
Source: Solomon (2011)
Interpretant
Pedestrians must wait or cross according to the
sign
Sign
Pedestrians traffic signal
Object
Wait or cross the road

60
Solomon (2011) argues that Consumers by and large give interpretation to stimulus of a
product based on the knowledge about the category of a product and the existing brand
characteristics. In support of his argument, he posits that perception of consumers depends
on both functional and symbolic attributes. Functional attributes comprise of features,
package, price, colours and so forth, whereas symbolic attributes comprise of the class and
value consumers place on themselves when they use such product. The meaning of a
products rather than its function influences the product evaluation given by consumers. This
meaning is made up of the market position of a product as being achieved by the performance
of a product through its packaging, colour, or styling rather than anything with the product
itself (Solomon, 2011).
3.3.4 Retention
Citeman (2006) argues that there will be failure by people to keep many information to which
they are shown in memory, however, they tend to keep information that brings to bear their
beliefs and attitudes. Generally, with retention, consumers are likely to remember nice
experience on a product they like and forget the nice experience on a competing product.
Figure 7 shows a typology of the steps involved in the perceptual process.
Attention
An effort to recognize the
nature of stimuli
Exposure
Sensing stimuli
Perception
Interpretation
Assigning meaning to
stimuli
Retention
Selecting some stimuli and
ignoring others

61
Figure 3.2 Typology of perceptual process
Source: Solomon (2011)
In effect, this section on the stages of perceptual development coupled with the theoretical
insights, the perceptual filter’s presence indicates that being at the retention stage is not an
easy achievement. Generally, bringing consumers close to a product can be very difficult
due to huge competing product packages that also try to communicate and bring to bear the
same objective. Therefore, designing product packages interest enough to capture
consumers’ attention is essential although attending to the package is inadequate. Also, it is
important that consumers accurately interpret the facts about the package to give positive
meaning to the package. A positive interpretation could retain the consumers to the product.
Influence of packaging on consumer perception
According to Ampuero and Villa (2006), consumer perceptions are vital in order to produce
the correct product packaging and gain the right position in consumers’ minds. Several
empirical studies seem to exist on how packaging influence consumer purchasing
perception.
Bertoluci et al. (2014) contend that food packaging is essential in enticing consumers'
attention and expectations. This Bertoluci et al. (2014) argues in turn affect consumer
product perception. Similarly, Hess et al. (2014) concludes that packaging design has an
influence on the perception of consumers about the product and the brand, which highly
affect their purchasing behaviour.
According to Breetz (2013), most of these empirical findings have generally shown that the
selection of word, images and colours on packaging of product engineer sensory and other
expectations for the product.

62
In understanding how images in product packaging impact on consumer perception,
Mizutani et al. (2010) empirically studied whether the imaging on orange juice cartons
influence consumer perceptions. Their study affirms that the choice of images influenced
the assessment of consumers’ sensory. Ultimately, the study affirms that package imagery
can trigger consumer perceptions of the sensory experience of the product.
According to Becker et al. (2011), packaging can result in the differences in sensory
perception, although these differences could be adjusted by individual’s sensitivity to design.
Specifically, Becker and his colleagues studied the perception of ‘tough’ yogurt containers
and its influence on perception of taste of the consumer. They identified that the bolder
designs resulted in a difference in expectations of taste and consumers’ experience.
Similarly, to Becker et al. (2011), Erlenkamp (2004) also indicates that when examining
perception through vision, colour is an extremely important factor.
In effect, consumers develop perceptions about varied products through their understanding
of the visual stimuli on packaging that trigger attention of the consumer. Generally, this
study indicates that perception involves the process by which stimuli activate one of the five
sense organs. However, consumer perception towards packaging is perceived through vision
and that packaging imaginary including size, shape and colour influence consumer
perceptions towards product packaging.
In relation to product packaging and consumer perception, conceptualisation of the tenets of
perception is essential in analysing motivations for consumers buying behaviour towards
some products. Thus, the concept of perception is essential for companies to determine how
consumers perceived their products within the concept of packaging.
4 Research methodology
This chapter influences the empirical data analysis section of the research. In other words,
the empirical analysis outcome depends on the research method and design used. Under this
chapter, elements of the research onion designed by Saunders et al. was adapted as the main
discussion elements. This includes the research design: (research strategies, research

63
choices, and time horizons); philosophies and approaches; and data collection and analysis.
Below is a diagram demonstration of the research onion.
Source: Saunders et al. (2009)
4.1 Research philosophies and approaches
There are four elements in the research philosophies layer of the research onion. This
includes positivism, realism, interpretivism, and pragmatism. For the research, positivism
was adapted because the research focused on generalization of the outcome. Also, the
researcher is independent of the data collected, and the data collected was highly structured
from large samples. Again, the research focused on the effect of independent variables on
dependent variable. Furthermore, a quantitative approach was adapted with the development
of a hypotheses and testing the hypotheses accepting it in part or whole, or rejecting it. These
characteristics enumerated above are typical characteristics of positivism.
Figure 4.1 The research onion

64
There are two elements of the research approaches which include the deductive and inductive
approaches. The deductive approach concentrates on designing hypotheses from theory and
creating a research strategy to test it whereas inductive approach focuses on collecting data
and developing a theory from the data analysis. Again, the deductive is connected to
positivism and the inductive connected to interpretivism (Saunders et al, 2009). For the
research, deductive approach was adapted since the research focuses on those characteristics
of deductive approach.
4.2 Research design
Research design is the map concerning how a researcher will strategize to answer the
research question (Saunders et al, 2009). It includes some three layers of the research onion
namely research choices, research strategies, and time horizons.
There are seven elements in the research strategies layer of the research onion. They include
experiment, survey, action theory, grounded theory, ethnography theory, and archival
theory. The research adapted the survey strategy since its strategy was same as the survey
strategy. The survey strategy according to Saunders et al (2009), has a relationship with the
deductive approach. Furthermore, survey makes it possible to collect large amount of data
from a sizeable sample in an economical way. Survey also makes it possible to generate
quantitative data which can be analysed in a quantitative path using inferential or descriptive
statistics. In the research, deductive approach was adapted. Moreover, large quantitative data
from a sizeable sample of population was collected and analysed with the descriptive
statistical instrument of SPSS software.
Mono method choice was adapted among the three elements of the research choices since
mono method focuses on a single data collection technique and analysis process in answering
the research question. The research also focused on only quantitative research technique in
the collection of data and its analysis.
The research focused on the cross-sectional studies of the time horizon as against the
longitudinal studies of the time horizon. This is because the cross-sectional studies have a

65
relationship with the survey strategy (Easterby-Smith et al. 2008). Moreover, cross-sectional
studies are organised over a limited time period. Also, the cross-sectional studies are done
with a given time frame. These characteristics are associated with the research.
4.3 Sampling and Data collection
The sample was chosen from a population of tertiary institutions in a certain province in
Ghana. This population was chosen because of their educational level, they have a better
understanding of every action they take concerning their response to the questionnaire of the
research. Moreover, because of their educational level, they have huge influence on other
members of society. The duration of data distribution and collection was one month.
Demographic balance of the sample was checked via the email database so that there were
gender, age, and educational level balance among respondents. Furthermore, the
questionnaire was delivered to the respondents through their emails by means of online
google survey tool. Again, to analyse the data generated, a SPSS software tool was used.
4.4 Data analysis
First, the data was checked for any duplication which might have occurred possibly because
of the online system failure. With the aid of the SPSS software, no duplicated data were
found. Second, frequencies of demographic data were established. This established the
number of male and female respondents as well as their age brackets and their educational
levels. Second, Kaiser-Meyer-Olkin (KMO) measure and Bartlett’s test were carried out to
ascertain whether it was appropriate to do a factor analysis test on the data. The factor
analysis was carried out using principal axis factoring as the extraction method, and varimax
as the rotation method. Six (6) factors were extracted for further analysis. A validity and
reliability test were carried out on the six (6) factors extracted. These six (6) factors represent
the independent variables. Third, an ordinal regression analysis was carried out using the
six (6) independent variables generated from the factors and the dependent variable
consumers’ perception. The results of the ordinal regression analysis were used to analyze
and test the hypothesis.

66
5 Empirical analysis and Results
This chapter discusses the demographic statistics of the respondents. It further discusses the
factor analysis, and the regression analysis of the data.
5.1 Demographic statistics
This section discusses the demographic distribution of the respondents which includes
gender, age, and educational level.
5.1.1 Gender distribution
Questionnaire was distributed to a sample size of 500. However, 413 individuals responded
representing 82.6% of the 500
sample size chosen. From the table 1 below, it can be observed that 209 were male
representing 50.6% of all the 413 respondents whereas 204 were women representing 49.4%
of all the 413 respondents. This indicates that gender was fairly distributed among
respondents and will impact positively on result generalization.
Table 5.1 Gender distribution
Frequency Percent Valid Percent
Cumulative
Percent
Valid Male 209 50.6 50.6 50.6
Female 204 49.4 49.4 100.0
Total 413 100.0 100.0
Source: Online survey (2018)
5.1.2 Age distribution
The ages of respondents were grouped into four brackets which includes 18-25years, 26-
33years, 34-41years and, 42years and above. According to the generated data table 2 below,
the largest number of respondents came from 18-25years age bracket followed by the 26-

67
33years age bracket. However, the lowest number of respondents were from 42years and
above bracket. This result indicates that majority of the respondents is made up of the youth.
This is a true reflection of the population studied since the youth makes up the highest
number of students in tertiary institutions in Ghana.
Table 5.2 Age distribution
Frequency Percent Valid Percent
Cumulative
Percent
Valid 18-25yrs 162 39.2 39.2 39.2
26-33yrs 144 34.9 34.9 74.1
34-41yrs 70 16.9 16.9 91.0
42yrs and more 37 9.0 9.0 100.0
Total 413 100.0 100.0
Source: online survey (2018)
5.1.3 Educational level distribution
There are three educational levels of the population studied. These include degree, diploma,
and certificate programmes. Respondents were grouped into these categories. According to
the generated data table 3 below, the highest number of respondents was 186 diploma
respondents representing 45% of the total respondents followed by 129 degree respondents
representing 31.2%. Certificate respondents was the lowest which was 98 representing
23.7%. The result indicates that majority of the programmes offered by the population
studied includes diploma and degree programmes.
Table 5.3 Educational level distribution
Frequency Percent Valid Percent
Cumulative
Percent
Valid Degree 129 31.2 31.2 31.2
Diploma 186 45.0 45.0 76.3
Certificate 98 23.7 23.7 100.0
Total 413 100.0 100.0
Source: online survey (2018)

68
5.2 Factor analysis
Factor analysis is carried out to reduce the large data to make analysis and interpretations of
data easier, but before that, a reliability test is done to determine the appropriateness of
carrying out the factor analysis on the data.
5.2.1 Kaiser-Meyer-Olkin (KMO) measure and Bartlett’s test
The accepted minimum KMO value for the appropriateness of the factor analysis is 0.6.
Also, the Bartlett’s test must have a significance of p-value less than 0.001 (p<0.001). As
shown in table 4 below, the KMO value generated from the analysis is 0.612 and the
Bartlett’s test significance value p is 0.00. Therefore, these values which are within the
acceptable range indicate that it is appropriate to carry out the factor analysis.
Table 5.4 Kaiser-Meyer-Olkin measure/Bart's test
KMO and Bartlett's Test
Kaiser-Meyer-Olkin Measure of Sampling
Adequacy. .612
Bartlett's Test of
Sphericity
Approx. Chi-Square 1798.038
df 528
Sig. .000
Source: Online survey (2018)
There are many outputs from running the factor analysis. This includes the descriptive
statistics of the variables; correlation matrix of variables; communalities; total variance
explained; scree plot; factor matrix; and rotated factor matrix. However, for interpretation
purpose, the research considers only few of the outputs. This includes the total variance
explained; scree plot; and rotated factor matrix.

69
5.2.2 The total variance explained
The total variance explained is made up of the variance explained by the primary solution
(Eigenvalues), the extracted factor loading and the rotated factor loadings.
As shown in table 5 below, the initial eigenvalue cut off was twelve (12) factors, however
after extraction, the final cut off was six (6) factors which represents 54.733% of the variance
of the variables. This indicates that the number of factors for the research is 6 which
represents all the six multi-item variables relevant to the research.
To check the dimensionality of the scale from table 5 below, the Eigenvalue of the first factor
is larger than the second factor. This is reflected in their percentage variances. Factor 1 has
a 29.451% and factor 2 has just 6.973%. This implies that factor 1 accounts for 29.451% of
the total variance. This therefore implies that the scale items are unidimensional
Table 5.5 Total variance explained

70
Total Variance Explained
Fac
tor
Initial Eigenvalues Extraction Sums of Squared Loadings Rotation Sums of Squared Loadings
Total
% of
Variance
Cumulative
% Total
% of
Variance
Cumulative
% Total
% of
Variance
Cumulative
%
1 3.031 29.451 29.451 2.579 28.976 28.579 2.552 27.508 27.508
2 2.084 6.973 36.424 1.497 5.671 34.647 1.430 6.668 34.176
3 1.608 5.393 41.817 .952 5.038 39.685 1.004 5.379 39.555
4 1.557 4.707 46.524 .869 4.384 44.069 .827 4.726 44.281
5 1.422 4.326 50.850 .773 4.400 48.469 .794 4.282 48.563
6 1.349 3.883 54.733 .726 3.425 51.894 .707 3.331 51.894
7 1.322 3.679 58.412
8 1.287 3.525 61.937
9 1.178 3.380 65.317
10 1.154 3.273 68.590
11 1.063 2.941 71.531
12 1.012 2.786 74.317
13 .989 2.545 76.862
14 .942 2.339 79.201
15 .912 2.274 81.475
16 .885 2.141 83.616
17 .844 2.046 85.662
18 .808 1.999 87.661
19 .799 1.686 89.347
20 .775 1.653 91.000
21 .789 1.483 92.483
22 .713 1.430 93.913
23 .685 1.342 95.255
24 .604 1.237 96.492
25 .588 .928 97.420
26 .538 .726 98.146
27 .436 .631 98.777
28 .388 .482 99.259
29 .356 .443 99.702
30 .187 .298 100.000
Extraction Method: Principal Axis Factoring.
Source: online survey (2018)

71
The scree plot graph below also confirms a six (6) factor solution for the research.
Figure 5.1 The scree plot
Source: Field survey 2018
5.2.3 The rotated factor matrix
This is made up of the factor loadings showing how items are weighted on each factor and
the correlation among the items and the factors. After initial running of the factor analysis
model, item brand name loaded on a wrong factor. Item black colour also did not load on
any factor. Again, item yellow colour double-loaded, in other words, it loaded on two
different factors. First item black colour was eliminated, and the model was rerun, and the
result interpreted. Second, item yellow colour was eliminated, and the model was rerun
again. Last, item brand name was eliminated, and the model rerun for the third time. The
result interpreted into a well acceptable outcome as can be seen in table 7 below. As shown
in table 7 below, size items loaded on factor one (1). Colour items loaded on factor two (2).
Furthermore, graphics items loaded on factor three (3). Also, information items loaded on
factor four (4). Again, shape items loaded on factor five (5). Lastly, material items loaded
on factor six (6). The SPSS tool was instructed to exclude any value less than 0.4 from the

72
rotated factor matrix table. The summary of the six factors with their loaded item values are
as follows.
Factor 1 = size (500ml: 0.719, 400ml: 0.640, 300ml: 0.553, 200ml: 0.582, 100ml: 0.460)
Factor 2 = colour (red: 0.645, pink: 0.602, green: 0.554, blue: 0.512, purple: 0.497, white:
0.453, orange: 0.411)
Factor 3 = graphics (small text: 0.574, bold text: 0.491, multicolours: 0.465, uniform colours:
0.439)
Factor 4 = information (place of origin: 0.755, ingredient: 0.689, environmental concerns:
0.604, manufacture/expiry date: 0.577, regulatory body approval: 0.533)
Factor 5 = shape (rounded: 0.453, angular: 0.417).
Factor 6 = Material (plastic: 0.501, glass: 0.448, paper: 0.424, Metal: 0.413). The factor
analysis result indicates that the items grouped to form constructs such as size, colour,
graphics, information, shape and material. These constructs however, constitute the
independent variables. The dependent variable, consumer perception is a multi-item variable
which is made up of five items. This includes convenience, appropriateness, appealing, eco-
friendliness, and importance.
Table 5.6 Factor correlation matrix
Factor Correlation Matrix
Factor 1 2 3 4 5 6
1 1.000 .627 .774 .635 .612 .650
2 .627 1.000 .818 .762 .639 .732
3 .774 .818 1.000 .711 .703 .751
4 .635 .762 .711 1.000 .607 .668
5 .612 .639 .703 .607 1.000 .636
6 .650 .732 .751 .668 .636 1.000
Extraction Method: Principal Axis Factoring.
Rotation Method: Varimax with Kaiser Normalization.
Source: online survey (2018)

73
Table 5.7Rotated factor matrix
Rotated Factor Matrixa
Factor
1 2 3 4 5 6
500ml/8cm of liquid soap package .719
400ml/6cm of liquid soap package .640
300ml/10cm of liquid soap
package .582
200ml/4cm of liquid soap package .552
100ml/2cm of liquid soap package .460
red .645
pink .602
green .554
blue .512
purple .497
white .453
orange .411
small text .574
bold text .491
multi-colours .465
uniform colours .439
Place of origin .755
ingredient .689
Environmental concerns .604
Manufacture/expiry date .577
regulatory body approval .533
Rounded shape .453
Angular shape .417
Plastic material .501
Glass material .448
paper material .424
Metal material .413
Extraction Method: Principal Axis Factoring.
Rotation Method: Varimax with Kaiser Normalization.a
a. Rotation converged in 12 iterations.

74
5.2.4 The internal consistency and reliability test
The Cronbach’s Alpha coefficient is used to determine the internal consistency and
reliability in measurement. The coefficient is expressed as a number between 0.00 and 1.00.
However, the rule of thumb is that the acceptable range for social science research is 0.7 to
0.9 (George & Mallery, 2003). The Cronbach’s alpha is calculated for each of the six
identified constructs to determine their internal consistency and reliability. The results are
tabulated below
Table 5.8 Reliability statistics for independent variables
Cronbach’s
Alpha
N of items
Size .785 5
Colour .763 7
Graphics .724 4 Information .801 5
Shape .702 2
Material .706 4
Table 5.9 Reliability statistics for dependent variable, consumer perception
Cronbach’s
Alpha
N of items
.822 5

75
Table 5.10 Descriptive statistics of independent variables
Descriptive statistics
Mean Std. Deviation N
Size .591 .0968 5
Colour .525 .0835 7
Graphics .492 .0585 4
Information .632 .0888 5
Shape .435 .0255 2
Material .447 .0392 4
5.3 Ordinal regression analysis
Before the ordinal regression was carried out, certain assumption tests that are key to the
validity of the ordinal regression analysis result were first carried out. These assumption tests
include the model fitting information test, Goodness of fit test, Pseudo R-square test, and
parallel lines test.
5.3.1 The assumption tests
Model fitting information
This test was carried out to determine how well the regression model fits the primary data.
In this test, p value must be less or equal to 0.05 (p</=0.05), that is p must be statistically
significant for the model to fit the data well. From table 11 below, the result shows that p =
0.001 which is statistically significant, therefore the regression model fits the primary data
well.
Table 5.11 Model fitting information
Model Fitting Information
Model
-2 Log
Likelihood Chi-Square df Sig.
Intercept Only 326.734
Final 242.209 84.525 6 .001

76
Link function: Logit.
Source: online survey (2018)
Goodness-of-fit
For the Goodness-of-fit test result, it needs to fail so that the null hypothesis can be rejected,
therefore p value must be greater or equal to 0.05 (p>/=0.05) which shows that p is
statistically insignificant. From table 12 below, the p value for Pearson is 0.172 which is
greater than 0.05, therefore the null hypothesis is rejected.
Table 5.12 Goodness-of-fit
Goodness-of-Fit
Chi-Square df Sig.
Pearson 123.412 52 .172
Deviance 206.342 52 .001
Source: online survey (2018)
Pseudo R-square
The result from this test identifies the percentage of variance in the dependent variable. From
table 13 below, the result shows that the model explains 57.4% of the variance in the
dependent variable.
Table 5.13 Pseudo R-Square
Pseudo R-Square
Cox and Snell .286
Nagelkerke .574
McFadden .365
Source: online survey (2018)
Test of parallel lines
In order not to violate the assumption, the p value of this test must be greater or equal to
0.05. From table 14 below, p value is 0.079 which is greater than 0.05, therefore the
assumption is not violated.

77
Table 5.14 Test of parallel lines
Test of parallel lines
Model
-2 Log
Likelihood Chi-Square df Sig.
Null hypothesis 242.209
General 207.324 34.885 6 .079
The null hypothesis states that the location parameters (slope coefficients) are the same
across response categories.
Link function: logit.
5.3.2 Ordinal regression output
The ordinal regression output includes the model summary table, ANOVA table, and
coefficient table. The six (6) constructs generated from the factor analysis were used as the
independent variables and consumer perception as the dependent variable in the regression
analysis. The six constructs which includes size, colour, graphics, information, shape, and
material are represented by the mean of their items as shown in table 10 above.
Model summary
From table 15 below, the R value is the coefficient of correlation between the independent
variables and the dependent variable, consumer perception. It can be deduced from R = 0.765
that there is a positive correlation between the independent variables in combination and the
dependent variable. The coefficient of determination (R2) shows that 58.5% of consumer
perception was predicted for by the combination of all the independent variables.
Table 5.15 Model summary
a. Predictors: (Constant), size, colour, graphics, information, shape, material
b. Dependent Variable: Consumer perception
Model Summary
Model R R Square
Adjusted R
Square
Std. Error of the
Estimate
1 .765a .585 .526 .702

78
Source: online survey, 2018
Anova
From table 16 below, the p value 0.000 which is statistically significant (p<0.001) shows
that the combination of the independent variables can significantly predict the dependent
variable. The ANOVA is used to determine whether the model predicts the dependent
variable significantly better than the alternative, the mean. The F value is the ratio of
prediction improvement because of using independent variables that fit the model. Since the
F value 26.713 is significant which shows that there is less than 0.1% probability that the F
value will be larger. Therefore, it can be concluded that the regression model is better at
predicting the dependent variable than the mean.
Table 5.16 ANOVA
ANOVAa
Model
Sum of
Squares df Mean Square F Sig.
1 Regression 69.874 6 14.658 26.713 .000b
Residual 121.308 208 .475
Total 191.182 214
a. Predictors: (Constant), size, colour, graphics, information, shape, material
b. dependent variable: consumer perception
Coefficient table
The coefficient table determines the type of effect that the independent variables have on the
dependent variable, and the strength of that effect. Furthermore, it also determines the
significance of the effect the independent variables have on the dependent variable.
From table 17 below, all the six (6) independent variables namely size, colour, graphics,
information, shape, and material have standardized and unstandardized coefficients that are
positive at significant level less than 0.05. Size has a standardized coefficient of 0.282 which
is significant at p = 0.001 and t-value = 3.574. Colour has a standardized coefficient of 0.243
which is significant at p = 0.004 and t-value = 2.877. Graphics has a standardized coefficient
of 0.211 which is significant at p = 0.021 and t-value = 2.361. Information has a standardized

79
coefficient of 0.401 which is significant at p = 0.000 and t-value = 5.886. Shape has a
standardized coefficient of 0.172 which is significant at p = 0.062 and t-value = 1.686.
Material has a standardized coefficient of 0.186 which is significant at p = 0.040 and t-value
= 2.174. These results clearly show that all the independent variables which include size,
colour, graphics, information, shape, and material have positive effects on the dependent
variable consumer perception at a significant level. The result further shows that packaging
information has the highest effect on consumers’ perception with an unstandardized
coefficient value (Beta) of 0.392, and packaging shape has the lowest effect on consumers’
perception with an unstandardized coefficient value (Beta) of 0.155.
Table 5.17 Standardized and unstandardized coefficient
Coefficientsa
Model
Unstandardized
Coefficients
Standardized
Coefficients
t Sig. B Std. Error Beta
1 (Constant) 1.925 .035 55.538 .000
size .269 .034 .282 3.574 .001
colour .248 .041 .243 2.877 .004
graphics .208 .026 .211 2.361 .021
information .392 .055 .401 5.886 .000
Shape
Material
.155
.197
.048
.053
.172
.186
1.686
2.174
.062
.040
a. Dependent variable: Consumer perception
Source: online survey (2018)

80
Packaging information
From table 16 below, manufacture/expiry date information has the highest mean value of
4.43. This result clearly shows that manufacture/expiry date information is the most
important packaging information consumers perceive about liquid soap. However, place of
origin of the product is the least important packaging information consumers perceive about
liquid soap.
Table 5.18 Packaging information
Descriptive Statistics
Mean Std. Deviation N
Consumer perception 1.49 .501 413
place of origin 2.97 1.315 413
ingredient 3.08 1.237 413
brand name 3.47 1.257 413
environmental
concern 4.19 .922 413
manufacture/expiry
date 4.43 .626 413
regulatory body
approval 3.60 1.154 413
Source: online survey (2018)
Hypothesis testing
Size
H1: The more consumers perceive the size of a liquid soap package as being convenience to
carry, the higher their perceived preference for the product.
packaging size has a positive standardized coefficient value (Beta) of 0.282 which is
significant at p = 0.001. It shows that packaging size has a significant positive effect on
consumers’ perception about liquid soap. Therefore, hypothesis 0ne (H1) is accepted.

81
Colour
H2: The more consumers perceive the colour of a liquid soap package as appropriate for the
product category, the higher their perceived preference for the product.
packaging colour has a positive standardized coefficient value (Beta) of 0.243 which is
significant at p = 0.004. It shows that packaging colour has a significant positive effect on
consumers’ perception about liquid soap. Therefore, hypothesis two (H2) is accepted.
Graphics
H3: The more consumers perceive the graphics of a liquid soap package as appealing, the
more their perceived preference for the liquid soap product.
packaging graphics has a positive standardized coefficient value (Beta) of 0.211 which is
significant at p = 0.021. It shows that packaging graphics has a significant positive effect on
consumers’ perception about liquid soap. Therefore, hypothesis three (H3) is accepted.
Product information
H4: The more consumers perceive the product information of a liquid soap package as being
important, the more the perceived preference for the liquid soap product.
Packaging information has a positive standardized coefficient value (Beta) of 0.401 which
is significant at p = 0.000. It shows that packaging information has a significant positive
effect on consumers’ perception about liquid soap. Therefore, hypothesis four (H4) is
accepted.
Shape
H5: The more consumers perceive the shape of a liquid soap package as being appealing for
the product category, the higher their perceived preference for the product.

82
Packaging shape has a positive standardized coefficient value (Beta) of 0.172 which is
significant at p = 0.062. It shows that packaging shape has a significant positive effect on
consumers’ perception about liquid soap. Therefore, hypothesis five (H5) is accepted
Material
H6: The more consumers perceive the material of a liquid soap package as being eco-
friendly for the product category, the higher their perceived preference for the product.
Packaging material has a positive standardized coefficient value (Beta) of 0.186 which is
significant at p = 0.040. Therefore, hypothesis six (H6) is accepted.
The hypothesis summary result
Table 5.19 Hypotheses result summary
The more consumers perceive the size of a liquid soap
package as being convenience to carry, the higher their
perceived preference for the product
H1
Accepted
The more consumers perceive the colour of a liquid soap
package as appropriate, the higher their perceived preference
for the product
H2
Accepted
The more consumers perceive the graphics of a liquid soap
package as appealing, the more their perceived preference for
the liquid soap product
H3
Accepted
The more consumers perceive the product information of a
liquid soap package as being important, the more the
perceived preference for the liquid soap product
H4
Accepted
The more consumers perceive the shape of a liquid soap
package as being appealing, the higher their perceived
preference for the product
H5
Accepted

83
The more consumers perceive the material of a liquid soap
package as being eco-friendly, the more their perceived
preference for the product
H6
Accepted
Source: online survey (2018)
6 Discussion and conclusion
This chapter discusses the results and theoretical contribution, the reliability and validity,
the managerial implications, and limitation and further research.
6.1 Results and theoretical contribution
The objectives of the research were to find the packaging characteristics elements that have
influence on consumers’ perception about liquid soap package. Furthermore, the research
was to identify the most attractive visual and most important informational elements of
packaging characteristics that influences consumers’ perception about liquid soap. To
achieve these objectives, a research question was designed, and the research was carried out
to find answers to the research question. The main research question was: how does
packaging influences consumers’ perception about liquid soap? The sub-questions to the
main question were: what are the elements of packaging characteristics that influences
consumers’ perception about liquid soap? What visual elements of packaging characteristics
do consumers perceive as most attractive to selecting liquid soap? And what informational
elements of packaging characteristics do consumers perceive as most important to selecting
liquid soap?
To find solution to the main research question, the sub questions were answered first in the
research. Sub-question one (1): what are the elements of packaging characteristics that
influences consumers’ perception about liquid soap?
Available literature in this research area reveal that numerous researches have been carried
out in this area where many elements of packaging characteristics that influences consumers’
perception have been established. Nonetheless most of the research were carried out with

84
reference to food products. Kuvykaite (2009) resorted to the examination of packaging
elements and their effects on consumers’ purchasing decision to bring out empirically the
elements that have significant influence on consumers’ choice of product. She deduced from
the research that there are six elements of packaging that must be given priority when
designing a package to creating effective packaging. These elements include material, form,
size, colour, and graphics. Similar to Kuvykaite (2009) result, Kotler (2003) reveals that six
elements that must be given attention during decision making on packaging include brand,
colour, material, form, text, and size. By using these literatures as a guide, the research
established similar result to these literatures. The results of the research established that the
elements of packaging characteristics that influences consumers’ perception about liquid
soap include size, colour, graphics, information, shape, and material. This result implies that
when designing a package for a liquid soap in a certain context, size, colour, graphics,
information, shape, and material must be considered.
Sub-question two (2): what visual elements of packaging characteristics do consumers
perceive as most attractive to selecting liquid soap?
Available literatures reveal visual elements of packaging that are most attractive to
consumers depending on the research context and the research product. In their research,
Kuvykaite, Dovaliene & Navickiene (2009) reveal that material is the most important visual
element for influencing consumers’ purchase decision with reference to milk product and
washing powder. On the contrary, Imram (1999) reveals that colour is the most attractive
element of a package consumers look out for when choosing food product. He further reveals
that with reference to food product, the effect of colour of a package on consumers’
perception is the obvious most studied. Furthermore, Underwood et al. (2001) in their
research reveal that picture on a package influence the attention of consumers, especially
when consumers are not used to the brand. In contrast to these findings, the research reveals
that the most attractive visual element of packaging characteristics was the packaging size.
From the results, packaging size has the highest unstandardized coefficient of 0.269 at a very
high significant p-value of 0.001 among visual elements of packaging. This was followed
by packaging colour with an unstandardized coefficient of 0.248 at a significant p-value of
0.004. However, packaging shape has the lowest unstandardized coefficient of 0.155 at a
significant value of 0.062. It implies that packaging shape is the least attractive element of

85
packaging characteristics that influence consumers’ perception about liquid soap. Possibly,
the differing of results among previous researches and this research is because researches
were carried out in different context and on different products. So, it can be concluded that
with reference to liquid soap product, the most attractive element of packaging
characteristics that influence consumers’ perception is the packaging size.
Sub-question three (3) what informational elements of packaging characteristics do
consumers perceive as the most important to selecting liquid soap?
Available literature reveals informational elements that are most important to consumers
depending on the context and the research product. In their research, Prathiraja &
Ariyawardana (2003) reveals that nutritional labelling impacted greatly on consumers’
purchase intension when buying food product because of health concern. They concluded
that majority of consumers are even willing to offer extra amount for the provision of
nutritional information on a package. In a different research, Gersen (2000) reveals that
majority of consumers in Denmark are attracted by the environmentally-friendly information
on a package in a shopping outlet. Furthermore, Kuvykaite, Dovaliene & Navickiene (2009)
in their research work on the packaging elements’ impact on purchase decision of consumers
economics and management, they analyse the importance of verbal elements of packaging
and they reveal that product information and country of origin are the most important
element when purchasing milk and washing powder. In this research, manufacture/expiry
date and environmental concern are the most important packaging information elements that
influence consumers’ perception about liquid soap. From the results obtained,
manufacture/expiry date has the highest mean of 4.43 followed by environmental concern
with a mean of 4.19. However, place of origin has the lowest mean of 2.97. This result shows
that consumers consider manufacture/expiry date and environmental concern as the most
important information elements of packaging that influence their perception about liquid
soap. On the opposite, consumers consider country of origin as least important element that
influence their perception about liquid soap. This contrasts with the results of the research
carried out by Kuvykaite, Dovaliene & Navickiene (2009) where they reveal country of
origin as the most important element.

86
Main research question: How does packaging influences consumers’ perception about
liquid soap?
Available literature reveals that packaging influences consumers to purchase a product.
Mostly, packaging influences consumers through its attractiveness caused by individual
elements or the elements as a whole. Packaging elements are classified into visual and
informal. In the research by Kuvykaite (2009), he reveals that packaging draws consumers
towards a brand, enhances its reputation and influences perception of consumers about a
product. In support of this result, Rundh (2005) reveals that packaging grabs the attention of
consumers towards a brand, boost its reputation and heighten the perception of consumers
about a product. Key visual elements of packaging in available literature that are known to
influence consumers’ perception about products include size, shape, colour, material,
graphics, flavour and technological design. On the other hand, key informational elements
of packaging that are known to influence consumers’ perception about a product include
country of origin, manufacture/expiry date, ingredient, regulatory body approval,
environmental concern, and brand name. These assertions are supported by literatures stated
in sub-question one (1). In effect, the research establishes results that are similar to these
available literatures. The research results show that packaging influences consumers’
perception about liquid soap. Packaging does so through its visual and informational
elements. The research shows that packaging visual elements that influences consumers’
perception about liquid soap include size, colour, graphics, information, shape, and material.
Again, it shows that size is the most attractive visual element of packaging that influences
consumers’ perception about liquid soap. On the other hand, the research shows that
packaging informational elements that influence consumers’ perception about liquid soap
include manufacture/expiry date, environmental concern, brand name, regulatory body
approval, ingredients, and place of origin. It went on to reveal that manufacture/expiry date,
and environmental concern are the most important informational elements of packaging that
influences consumers’ perception about liquid soap.
Theoretically, the research results add to the numerous researches about the influence of
packaging on consumers attraction to products. Available literatures show that many
researches have been conducted in this area with reference to food products. However, little

87
is done in this area with reference to liquid soap and in a developing country context.
Therefore, this result will fill this gap and add to the numerous literatures in this area.
6.2 The reliability and validity
For the quality of a research, its credibility must be tested. In an academic research, the
popular and common instruments that are utilized to verify the credibility of the research
include reliability and validity test. These tests are key to establishing the quality of the
research and its results.
Reliability refers to how well the technique used for collecting data and analysis procedure
will generate results that are consistent. Typical characteristics of Reliability are that the
research measure generates the same result on different times; similar result is generated by
different researchers; and transparency in the sense of raw data gathering and analysis
(Easterby-smith et al., 2008). Cronbach’s alpha test is the popular instrument used to
measure the internal reliability of academic research. Its generated value is between 0 and 1.
It shows a strong reliability when the value is close to 1 and a weak reliability when the value
is close to 0. However, an acceptable reliable value is 0.7 to 0.9 (Goforth, 2015).
For the research, the reliability of the independent variables as well as the dependent variable
were tested. From table 8 above, it shows that the independent variables have Cronbach’s
alpha maximum and minimum value of 0.801 and 0.702 respectively. This result clearly
indicates that the independent variable data is reliable. Again, from table 9 above, it shows
that the dependent variable has a Cronbach’s alpha value of 0.822, which also indicates that
the dependent variable data is reliable.
Validity refers to how well the research results establish what they intend to establish. There
are three types of validity. They include content, predictive and construct validity (Sauro,
2014). Construct validity measure how well the designed questionnaire generates data that
measure what the research intends to measure (Sauro, 2014). Construct validity is assessed
by the correlation between the measures. This correlation indicates how well the measures
correlate with one another which measure the same construct. As shown in table 6 above,
the research indicates higher correlation between the factors with a minimum value of 0.607
and a maximum value of 1.000. Again, the questionnaire was developed from previous

88
research of similar subject and was carefully assessed for any possible measure errors and
setback that could have affected the correct data generated for the analysis. These results
indicate that the research is valid.
6.3 Managerial implications
For effective packaging and marketing of liquid soap products, managers must adhere to
certain elements of packaging. According to the results from the research, managers must
carefully consider certain key elements of packaging identified by the research which have
significant influence on consumers’ perception about liquid soap. These elements are in two
categories, which include visual and informational. The research reveals that visual elements
that influence consumers’ perception include size, colour, graphics, shape, and material. This
implies that during the design of a package for liquid soap, managers must carefully consider
the size, colour, graphics, shape, and material of the package. As shown in the result, the
size of the liquid soap package is the most attractive visual element that influences
consumers perception about liquid soap. This shows that managers must give a higher
consideration to the size when designing the package for liquid soap. Obviously, the smaller
sizes are convenient to carry, and consumers find them more convenient than the bigger sizes
when selecting a liquid soap. Furthermore, colour is the second most attractive visual
element of liquid soap packaging, therefore managers must consider the appropriate colour
when designing a package for liquid soap. Again, certain shapes, graphics, and materials
must carefully be considered for the design of liquid soap package in order that the package
would appeal to and attract consumers, which in turn would translate into successful
marketing campaign.
Again, managers must consider the informational elements of packaging during the design
of a package for liquid soap. According to the research, information was the most considered
element of packaging of liquid soap. This includes manufacture/expiry date, environmental
concern, brand name, ingredients, regulatory body approval, and place of origin. Therefore,
managers must place much emphasis on the informational element during package design
for liquid soap. The research shows that the manufacture/expiry date, and the environmental

89
concern are the most important informational elements. Managers must place much
emphasis on manufacture/expiry date, and environmental concern during the design of a
liquid soap package to boost marketing campaign to improve sales.
6.4 Limitation and future research
Regardless of the outcome of the research, perception is one social behavioural attitude
which is difficult to measure accurately. Due to social and attitudinal changes, perception
may change with time. It is a dynamic phenomenon which is not permanent. This may affect
how consumers may react to the packaging of the liquid soap in the future. However, in the
midst of this setback, these packing elements have proven to impact positively on product
purchase in the past and current times. Results of previous researches in this area have stood
the test of time and have been relevant to both the academia and the business community.
Therefore, the results of the research could still be relevant in a long time. Even though, the
result for the research can be generalized among the population of the research, it may not
be generalized to the culture of the population since some of the respondents may come from
different parts of the country with different cultural background.
Since the result of the research is applicable to liquid soap, in the future, the research can be
extended to both washing powder and solid soap. Furthermore, future research can also be
done to include tertiary institutions in other regions in the country. Again, future research
can be done to include the working class in different regions across the country.

References
Adam, M. A. & Kamran, A. (2014). How packaging elements impact consumers’ buying
decisions. Lambert publishing.
Adelina, B. & Morgan, H. (2007). Consumer buying behavior and perception toward retail
brand baby products. European journal of scientific research 120(2), 145-157.
Aggarwal, P. (2004). The effects of brand relationship norms on consumer attitudes and
behavior. Journal of consumer research. The Oxford University press.
Ahmadi, G., Bahrami, H. R. & Ahani, M. (2013). An investigation of visual components of
packaging on food consumer behaviour. Business and economics research, 3(2), pp. 1-11.
Ampuero, O. and Villa, N. (2006). Consumer perceptions of product packaging. Journal of
consumer marketing 23.
Armstrong, G. & Kotler, P. (2005). Marketing: an introduction. 7th ed. Cornell University:
Pearson/Prentice hall.
Aspfors, E. (2010). Customer perception of service, store image and product assortment –
from an interior store perspective. [Accessed 12 August 2017]. Available
https://www.theseus.fi/bitstream/handle/10024/16719/Aspfors_Emma.pdf.
Babbie, E. R. (2010). The practice of social research. 12th ed. Belmont, CA.
Becker, L., Rompay, T. V., Schifferstein, R. and Galetzka, M. (2011). Tough package,
strong taste: the influence of packaging design on taste impressions and product
evaluations. Assessed: [19.09.2016]. Available:
https://www.researchgate.net/publication/229402843_Tough_package_strong_taste_The_i
nfluence_of_packaging_design_on_taste_impressions_and_product_evaluations.
Benoni, H. and Tsal, Y. (2013). Conceptual and methodological concerns in the theory of
perceptual load.
Berlyne, D. E. (1976). Psychological aesthetics. International journal of psychology, 11,
43-55.
Bertoluci, G., Leroy, Y. & Olsson, A. (2014). Exploring the environmental impacts of
olive packaging solutions for the European food market. Journal of cleaner production,
Elsevier.
Blank, C. (2015). Consumer perception theory. Assessed: 23.11.2016. Available: http://smallbusiness.chron.com/consumer-perception-theory-40176.html.
Boundless (2016). Sensory adaptation. Boundless psychology. Assessed: 19.07.2016.
Available: https://www.boundless.com/psychology/textbooks/boundless-psychology-
textbook/sensation-and-perception-5/introduction-to-sensation-37/sensory-adaptation-160-
12695/.
Bradley, S. (2014). Design principles: visual perception and the principles of Gestalt.
Assessed: 17.09.2016. Available:
Branyte, T., Paunksniene, Z., and Rutelione, A. (2007). Peculiarities of consumer
perception in the aspect of marketing to women: commerce of engineering decisions.
Breetz, C. (2013). The impact of product packaging on consumers’ value perception.
Assessed: 17.08.2016. Available: http://www.grin.com/en/e-book/266639/the-impact-of-
product-packaging-on-consumers-value-perception.
Brignall, R. (2012). Grid classes and partial well order. Journal of combinatorial theory.
Volume 119.

Broadbent, D. (1958). Perception and communication. London: Pergamon press.
Burke, M. C. and Edell, J. A. (1989). The impact of feelings on ad-based affect and
cognition.
Business dictionary. (2006). Packaging definitions. Assessed: 14.09.2016. Available:
http://www.businessdictionary.com/definition/packaging.html. Calves, P. G. & Ricardo, B. P. G. (2008). Product characteristics and quality perception. University at Aut’ onoma de Barcelona. Carlson, N. R., Miller, H., Heth, C. D., Donahoe, J. W., & Martin, G. N. (2010).
Psychology: the science of behaviour. 7th ed. Boston, MA: Allyn & Bacon.
Chen, Y. C. (2005). A study on comprehensibility and interestingness of design from
visual trope. Journal of National Taiwan college of arts. Vol 77.
Chibok, B. M., Msheliza, S. K. and Ndubuisi, W. C. (2013). An analysis of consumer
perceptions and usage of mobile telecommunications brand in the Maiduguri township in
Nigeria. University of Maiduguri: Borno State.
Citeman. (2006). Selective attention, distortion and retention. Assessed: 29.08.2016.
Available: http://www.citeman.com/696-selective-attention-distortion-and-retention.html.
Clement, J. (2007). Visual influence on in-store buying decisions: An eye-tracking
experiment on the visual influence of packaging design. Journal of Marketing
Management, 23 (9), pp. 917-928.
Connors, C. (2012). Consumer behavior part two: consumer perception in social media.
Assessed: 07.10.2015. Available: https://www.boomtownig.com/blog/consumer-
perception-in-social-media/.
Coulson, N. S. (2000). An application of the stages of change model to consumer use of
food labels. British food journal, 102(9).
Court, D., Elzinga, D., Mulder, S. & Vetvik, J. (2009). The consumers decision journey.
Crane, F. and Clarke, T. (1994). Consumer behaviour in Canada: theory and practice: 2nd
ed. Dryden, Canada.
Cross, V. (2015). The stages of perception in marketing. Assessed: 02.10.2015. Available:
http://smallbusiness.chron.com/stages-perception-marketing-22161.html.
Deufol (2002). Types of packaging. Assessed: 13.07.2015. Available: https// www.deufol.com/en/glossary/primary-packaging.html.
Devito, J. A. (2009). Human communication: the basic course. 11th ed. Boston,
Massachusetts: Allyn & Bacon.
Dickson, P. R. (1994). Marketing management. Fort Worth, TX: The Dryden Press.
Dileep, K. M. (2006). Role of packaging in marketing product and organization. Assessed:
05.08.2016. Available: https//www.indianmba.com/faculty-column/Fc337/fc337.html.
Dobson, P. & Yadav, A. (2012). Packaging in a market economy: the economic and
commercial role of packaging communication. University of East Anglia.
Easterby-Smith, M., Thorpe, R. J. P & Lowe, A. (2008). Management research (3rd ed).
Sage: London.
Erlenkamp, M. (2004). The role of perception in consumer behaviour. Munich.
Escher, M. C. & Water, I. (1938). The Gestalt principles. Assessed: 02.10.2016. Available:
http://facweb.cs.depaul.edu/sgrais/gestalt_principles.htm.
Ferrer, A., Hidalgo, C. & Kougoulis, J. S. (2012). Market analysis: Revison of European
ecolabel Criteria for soaps, shampoos and hair conditioners. [online] [Accessed 3th
November 2014]. Available:
http://susproc.jrc.ec.europa.eu/soaps_and_shampoos/docs/Market%20Analysis_Draft%20
Repor.pdf.

Flaherty, K. I. and Mowen, J. C. (2010). The role of schemas in consumer behaviour
research.
Garber, L. L., Burke, R. R. & Jones, J. M. (2000). The role of packaging colour in
consumer purchase consideration and choice. Cambridge, MA: Marketing science institute.
George, D. & Mallery, P. (2003). SPSS for windows step by step: a simple guide and
reference (4th ed). Boston: Allyn & Bacon.
Gersen, J. T. H. (2000). The ethical consumer moral norms and packaging choice. Journal
of consumer policy. Rotterdam: Kluwer academic publishers.
Gofman, A., Moskowitz, H. R. & Mets, T. (2010). Accelerating structured consumer-
driven package design. Journal of consumer marketing, 27 (2).
Goforth, C. (2015). Using and interpreting Cronbach’s alpha. University of Virginia library.
Available: https://data.library.virginia.edu/using-and-interpreting-cronbachs-alpha/.
Goldberg, M. E., Liefield, J., Madill, J. & Vredenburg, H. (1999). The effect of plain
packaging on response to health warnings. American Journal of Public Health, 89 (9), pp.
143-145.
Gonzalez, M. T. & Twede, S. D. (2007). Packaging as a tool for product development:
communicating value to consumers. Journal of food distribution research. Vol. 38.
Grimsley, S. (2003). What is primary data in marketing research? Assessed: 20.12.2016.
Available: http://study.com/academy/lesson/what-is-primary-data-in-marketing-research-
definition-sources-collection.html.
Grossman, R. P. & Wisenblit, J. Z. (1999). What we know about consumers’ colour
choices. Journal of Marketing Practice: Applied Marketing Science, Vol. 5 No. 3, pp. 78-
88.
Habermas, J. (1976). Legitimation crisis. London: Heinemann.
Habermas, J. (1984). The theory of communicative action: Reason and the rationalization
of society. London: Heinemann.
Hanna, N. & Wozniak, R. (2012). Consumer behavior: An applied approach. Kendall hunt
publishing.
Harrington College of Design, (2013). Graphic Design: How to design the perfect package.
Assessed: 27.12.2016. Available: https:// http://www.harrington.edu/student-
life/blog/august-2013/graphic-design-how-to-design-the-perfect-package
Hess, S. J., Singh, J., Metcalf, L. E. & Danes, J. (2014). The impact of consumer product
packaging quality on consumption satisfaction, brand perceptions, consumer investment
and behaviour. Journal of applied packaging research. Vol. 6.
Hollywood, L., Wells, L., Armstrong, G. & Farley, H. (2013). Thinking outside the carton:
attitude towards milk packaging. British food journal. Vol. 115.
https://www.smashingmagazine.com/2014/03/design-principles-visual-perception-and-the-
principles-of-gestalt/.
Hysen, B. & Mensur, V. (2008). Analysis of consumer behaviour in regard to dairy
products in Kosovo: Agricultural research. p.46 (3).
Imram, N. (1999). The role of visual cues in consumer perception and acceptance of a food
product. Nutrition and Food Services, Vol. 5, 9/10, pp. 224-8.
Ittetson, W. H., Karen, A. F. and Timothy, J. O. (1976). The nature of environmental
experience. In Seymour Wapner, Saul Cohen, & Bernard Kaplan (eds). Experriencing the
environment.
Juma, K. (2012). The impact of package on sale and sales volume in G.B.K Dairy Products
Company Uganda Limited.
Kano, N. (1984). The principles of Kano Model. Tokyo Rika University.

Keller, K. L. (2009). Choosing brand elements to build brand equity in strategic brand
management. 3rd ed. Delhi: Dorling Kindersley.
Kitchen, P. J. (1986). Zipping, zapping, and Nipping. International journal of advertising:
the review of marketing communications.
Kotler, P. & Armstrong, G. (2005). Principles of marketing. 11th ed. Upper saddle river,
NJ.
Kotler, P. & Keller, K. L. (2008). Marketing management. 13th ed. New Jersey: Prentice
Hall.
Kotler, P. (2003). Marketing management. (9th edition). Upper Saddle River: Prentice-
Hall.
Kuvykaite, R. (2001). Marketing of the products. London: Technology.
Kuvykaite, R. (2009). Impact of package elements on consumer purchase. Kauno
Technologijos Universitetas, Lietuva, Economika ir Vadyba.
Kuvykaite, R., Dovaliene, A. & Navickiene, L. (2009). Impact of packaging elements on
the consumer purchase decision. Economics and Management, pp. 441-47.
Lamb, C. W., Hair, J. F., & Carl, M, (2004). Marketing (7th edition). South-western,
Canada: Thomson.
Leedy, P. and Ormrod, J. (2001). Practical research: planning and design. 7th ed. Upper
saddle river, NJ: Merrill prentice hall.
Lorette, K. (2015). Importance of factor analysis in marketing. Assessed: 07.01.2017.
Available: http//www.smallbusiness.chron.com.
Louw, A. (2006). The power of packaging. USA. pp. 186-216.
Madden, T. J., Hewett, K. and Roth, M. S. (2000). Managing images in different cultures:
a cross-national study of colour meanings and preference. Journal of international
marketing, 8(4).
Mba-lectures. (2011). Primary data collection method. Assessed: 08.02.2017. Available:
http://mba-lectures.com/advance-research-methods/1377/primary-data-collection-
methods.html.
McCarthy, T. (1978). The critical theory of Jurgen Habermas. Cambridge, MA.
McDonald, E., Backsell, M., Gonzalez, R., & Papalambros, P. (2006). The Kano method’s
imperfections, and implications in product design theory. International design research
symposium, 1-12.
McNeal, J. U. & Ji, M. F. (2003). Children’s visual memory of packaging. Journal of
consumer marketing, 20.
McWilliam, G. (1997). Low involvement brands: Is the brand manager to blame?
Marketing Inteligence & Planning, 8 (4), pp. 90-107.
Mizutani, N., Okamoto, M., Yamaguchi, Y. and Yamanaka, T. (2010). Package images
modulate flavor perception for orange juice. Article in food quality and preference 21(7).
Murphy, G. & Kovach, J. K. (1972). Historical introduction to modern psychology.
Harcourt, Brace and Jovanovich, New York.
Murphy, G., and Kovach, J. K. (1972). Historical introduction to modern psychology. 3rd
ed. New York: Harcourt.
Orth, U. R. (2009). Holistic package design and consumer brand. Journal of marketing.
Ostendorp, J. A., Bode, J. M., Lutters, E., Van Houten, F. J. A. M. (2006). The
development life cycle for packaging and the relation to product design. 13th international
conference on life cycle engineering.
Pam, M. S. (2009). What is perceptual filtering? Assessed: 02.08.2016. Available: http:// http://psychologydictionary.org/perceptual-filtering/.

Pankrantz, B. (2012). Designing simple packaging features that sell: product development.
Panwar, J. S. (2004). Beyond consumer marketing: sectoral marketing and emerging
trends. New Delhi.
Perner, L. (2010). Consumer behaviour: the psychology of marketing. [Assessed:
21.08.2016]. Available: https://marketography.com/2010/10/17/understanding-consumer-
attitudes/.
Polit, D. F. & Hungler, B. P. (1999). Nursing research: Principles and methods. 6th ed.
Philadelphia: Lippincott.
Prathiraja, P. H. K. & Ariyawardana, A. (2003). Impact of nutritional labelling on
consumer buying behaviour. Sri lankan Journal of agricultural economics, 5 (1).
Pride, W. M. & Ferrell, O. C. (2013). 17th ed. Marketing. Mason, Oh. South-Western
cengage learning.
Prince, G. W. (1994). The contour: a packaging vision seen through coke bottle lenses.
Beverage world.
Renaud, L. (2007). The influence of label on wine consumption: its effects on young
consumers’ perception of authenticity and purchasing behavior. Bologna, Italy.
Rettie, R. and Brewer, C. (2000). The verbal and visual components packaging design.
Journal of product and brand management, 9(1).
Rooks, P. and Wilson, J. (2000). Perception: Theory, development, and organization.
Psychology press. 25-26.
Rundh, B. (2005). The multi-faceted dimension of packaging. British Food Journal, 107
(9), pp. 670-684.
Rundh, B. (2009). Packaging design: creating competitive advantage with product
packaging. British food journal, 111(9).
Ryan, V. (2004). Functions of packaging.
Saghir, M. (2002). Packaging logistics evaluation in the Swedish retail supply chain. Lund
University, Lund.
Sauro, J. (2014). Assessing the validity of your research. [Assessed: 07.04.2018]. Available:
https//measuring.com/validity-research/.
Schacter, D. L., Gilbert, D. T., & Wegner, D. M. (2011). Psychology. 2nd ed. New York:
Worth Publishers.
Schiffman, L. G., & Kanuk, L. L. (2000). Consumer behavior. 7th ed. Wisconsin: Prentice
hall.
Schmitt, B. H. and Simonson, A. (1997). Marketing aesthetics: the strategic management
of brands, identity and image. New York: the free press.
Schoormans, J. P .L., & Robben, H. S. J. (1997). The effect of new package design on
product attention, categorization & evaluation. Journal of Economic Psychology, 18, pp.
271-287.
Shah, S., Ahmed, A., & Ahmad, N. (2013). Role of packaging in consumer buying
behaviour. International review of basic and applied sciences.
Shamoo, A. E. and Resnik, B. R. (2003). Responsible conduct of research. Oxford
University Press.
Sherwood, M. (1999). Winning the shelf wars. Global cosmetic industry, 164. 64-67.
Shiffman, L. & Kanuk, L. (2007). Consumer behavior. 9th ed.
Silayo, P. & Speece, M. (2004). Packaging and purchase decisions: A focused group study
on the impact of involvement level and time pressure. British Food Journal, Vol. 106 No.
8, pp. 607-28.

Silayo, P. & Speece, M. (2007). The importance of packaging attributes: a conjoint
analysis approach. European journal of marketing, 41.
Silver, S. (2011). Five key elements to great package design. [Assessed: 04.10.2016].
Available: https://www.envision-creative.com/5-key-elements-to-great-package-design/.
Simms, T. & Trott, P. (2010). Packaging development: a conceptual framework for
identifying new product opportunities. Marketing theory,10.
Singh, S. (2006). Impact of colour on marketing management decision, 44(6).
Smith, P. R. & Taylor, J. (2004). Packaging in marketing communications. London: Kogan
press limited.
Solomon, M. R. (1996). Consumer behaviour. 5th ed. Englewood Cliffs, NJ: Prentice Hall. Solomon, M. R. (2011). Consumer behaviour: buying, having, and being. 9th ed. Pearson
education limited. England: Edinburgh gate.
Starbuck, W. H. & Milliken, F. J. (1988). Executives perceptual filters: What they notice
and how they make sense.
Underwood, R. L. & Ozanne, J. L. (1998). Is your package an effective communicator? A
normative framework for increasing the communicative competence of packaging. Journal
of marketing communications.
Underwood, R. L. (2003). The communicative power of product packaging: creating brand
identity via lived and mediated experience. Journal of marketing theory and practice, 11.
Underwood, R. L., Klein, N. M., & Burke, R. R. (2001). Packaging communication:
attentional effect of product imagery. Journal of product and brand management, 10(7),
403-422.
Vakratsas, D. & Ambler, T. (1999). How advertising works: What do we really know?
Journal of Marketing, 63, pp. 26-43.
Verduyn, D. (2014). Discovering the Kano Model. Assessed: [5 February 2017].
Available: www.kanomodel.com/discovering-the-kano-model/.
Vernucio, M., Cozzolino, A. & Michelini, L. (2010). An exploratory study of marketing,
logistics and ethics in packaging innovation. European journal of innovation management.
Vila, N., & Ampuero, O. (2007). The role of packaging in positioning an orange juice,
Journal of Food Products Marketing, 13 (3), 21-48, 2007.
Vyas, M. (2015). Packaging design elements and users’ perception: a context in fashion
branding and communication. Journal of applied packaging research.
Warde, A. (1999). Convenience food: space and timing. British food journal, 101. Weinberg, P. & Gottwald, W. (1982). Impulsive consumer behaviour as a result of emotions. Journal of Business Research 10, pp. 43 – 87. Wells, L.E., Farley, H., & Armstrong, G.A. (2007). The importance of packaging design for
own-label food brands. International Journal of Retail & Distribution Management, 35(9),
pp. 677-690.
Schloss, B., Strauss, E. D., and Palmer, S. E. (2012) object colour preference.
Vladic, G., Keeman, M., Kasikovic, N., Pal, M. & Stancic, M. (2015). Influence of the shape
on the consumers perception of the packaging attributes. University of Novi Sad.
Yan, D., Sengupta, J. and Wyerdr, R. S. (2013). Package size and perceived quality: the
intervening role of unit price perceptions. Journal of consumer psychology.
Sogari, G., Carbo, C., Macconi, M., Menozzi, D. & Mora, C. (2015). Consumer attitude
towards sustainable-labelled wine.
Westerman, S. J., Sutherland, E. J., Gardner, P. H., Baig, N., Chritchley, C., Hickey, C.,
Mehigan, S., Solway, A. & Zervos, Z. (2012). the design of consumer packaging: the effects

of manipulations of shapes, orientation, and alignment of graphical forms on consumer
assessments. UK.
Kraus, A. (2015). Factors influencing the decisions to buy and consume functional food.
British food journal, 117.
Carpenter, G. S. & Nakamoto, K. (1989). Consumer preference formation and pioneering
advantage. Journal of marketing research.
Saunders, M., Lewis, P. & Thornhill, A. (2009). Research methods for business students. 5th
ed. England: London.
Appendix: The questionnaire