Embed Size (px)
Citation preview

THE EFFECTS OF MARKET REFORMS ON IRISH POTATO PRICE
VOLATILITY IN NYANDARUA DISTRICT, KENYA
By
SAMUEL CHEGE MWANGI
A THESIS SUBMITTED IN PARTIAL FULFILLMENT FOR THE DEGREE OF
MASTER OF SCIENCE IN AGRICULTURAL AND APPLIED ECONOMICS IN THE
DEPARTMENT OF AGRICULTURAL ECONOMICS IN UNIVERSITY OF NAIROBI
.
AUGUST, 2010

ii
DECLARATION
This thesis is my original work and has not been presented for a degree in any other university.
Sign: -------------------------------------- Date: -------------------------------------
Samuel Chege Mwangi
(Candidate)
This thesis has been submitted for examination with our approval as University supervisors.
Signed: -------------------------------------- Date: -------------------------------------
Professor O.L.E. Mbatia
Signed: -------------------------------------- Date: -------------------------------------
Dr. J.M. Nzuma

iii
COPYRIGHT
No part of this thesis may be reproduced, stored in any retrieval system or transmitted in any
form or by any means, electronic, mechanical, photocopying, and recording without prior written
permission of the author or University of Nairobi on that behalf.
Copy©2010 Samuel Chege Mwangi
All rights reserved

iv
DEDICATION
This work is dedicated to my wife Lucy and children Ann, Ken, Daniel and Ruth for their never
ending support, prayers and encouragement.

v
ACKNOWLEDGEMENT
First and foremost, I extend special thanks to my supervisors, Professor O. L. E. Mbatia and Dr.
J. M. Nzuma, for their advice and guidance over the entire research period. Equally important to
this thesis is the invaluable support I was given by Dr. J. T. Karugia in shaping up the research
project. I extend my appreciation to Dr. J. J. Okello for his invaluable input regarding the
literature search and other important aspects of research. Recognition is also given to Dr. P.
Irungu for assisting me to make this research my own. A special thank you to Dr. R. Nyikal for
making sure that I got my research funding on time. I also gratefully acknowledge the support
that I got from all the members of staff at the Department of Agricultural Economics in the
University of Nairobi.
I feel deeply indebted to all the staff of the Ministry of Agriculture in Nyandarua District, for
their untiring assistance with the data collection. I thank Dr. J. Kabira from Kenya Agricultural
Research Institute (KARI) for all the invaluable information on Irish potatoes. I also
acknowledge the financial support granted by the Collaborative Masters Program in Agricultural
and Applied Economics (CMAAE). I thank my employer, the Government of Kenya for granting
me study leave to pursue this post graduate program.
I extend special thanks to my family and friends for their support not just during the years of my
study, but throughout my life. I would also like to thank my fellow graduate students in the 2006
Msc. cohort in the Department of Agricultural Economics for their friendship as well as
academic assistance. All in all, I thank the Almighty God for his steadfast love during the good
and hard times in all my life.

vi
TABLE OF CONTENTS
ContentsDECLARATION........................................................................................................................... ii
ACKNOWLEDGEMENT............................................................................................................ v
LIST OF APPENDICES .............................................................................................................. x
ACRONYMS AND ABBREVIATIONS.................................................................................... xi
ABSTRACT................................................................................................................................. xii
CHAPTER 1 .................................................................................................................................. 1
INTRODUCTION......................................................................................................................... 1
1.1. Background Information ...........................................................................................1
1.2. Problem Statement .....................................................................................................7
1.3. Purpose and Objectives ..............................................................................................8
1.4. Hypothesis to be tested ...............................................................................................9
1.5. Justification of the Study............................................................................................9
1.6. Organization of the Thesis .......................................................................................10
CHAPTER 2 ................................................................................................................................ 11
LITERATURE REVIEW .......................................................................................................... 11
2.1. Introduction...............................................................................................................11
2.2. Approaches used to Analyze Price Volatility .........................................................11
2.3. Market Reforms, Price Volatility and Irish Potato Economic Studies................18
CHAPTER 3 ................................................................................................................................ 33
METHODOLOGY ..................................................................................................................... 33
3.1. Introduction...............................................................................................................33
3.2. Analytical Framework..............................................................................................33
3.3. Empirical Model .......................................................................................................38

vii
3.4. Data Sources..............................................................................................................44
3.5. Unit Root Test ...........................................................................................................48
3.6. Structural Break Test...............................................................................................51
3.7. Chapter Summary ....................................................................................................52
CHAPTER 4 ................................................................................................................................ 54
RESULTS AND DISCUSSION ................................................................................................. 54
4.1. Introduction...............................................................................................................54
4.2. Descriptive Statistics.................................................................................................54
4.3. Unit Root Test Results..............................................................................................65
4.4. Structural Break Test Results .................................................................................67
4.5. Factors Influencing Irish Potato Prices ..................................................................68
4.6. Conditional Variance of Irish Potato Prices ..........................................................72
4.7. Chapter Summary ....................................................................................................76
CHAPTER 5 ................................................................................................................................ 78
CONCLUSIONS AND POLICY RECOMMENDATIONS ................................................... 78
5.1. Introduction...............................................................................................................78
5.2. Summary of Major Conclusions..............................................................................78
5.3. Policy Recommendations .........................................................................................85
5.4. Contribution of this Study .......................................................................................87
5.5. Direction for Future Research.................................................................................88
References .................................................................................................................................... 89

viii
LIST OF TABLES
Table 3.1. Description of Variables and their Measurement…………………………………….39
Table 4.1. Descriptive Statistics of the Variables used in the Volatility Model…………………51
Table 4.2. Two Way t Test on the Mean Prices……. ………………...........................................51
Table 4.3. Unit Root Tests for Mean Prices, Value of production and Sales……………….......61
Table 4.4. ARCH-M Estimates of Mean Irish Potato Prices…………………………………….64
Table 4.5. ARCH-M Estimates of Irish Potato Price Volatility…………………………………68

ix
LIST OF FIGURES
Figure 3.1. Map of Nyandarua District, Kenya………………………………………………….44
Figure 4.1. Monthly Irish Potato Prices Trend for Nyahururu Market (1986-2005) ……………54
Figure 4.2. Irish Potato Value of production Trend for Nyandarua District (1986-2005)….........57
Figure 4.3. Monthly Rainfall Trend for Nyandarua District (1986-2005)……………………….58
Figure 4.4. Irish Potato Sales Trend in Nyahururu Market (1986-2005)………………………...60

x
LIST OF APPENDICES
Appendix 1: Correlation Matrix for the Explanatory Variables....................................................88
Appendix 2: Irish Potato Main Producing Districts in Kenya (1986-2005)……………………. 89
Appendix 3: Average Monthly Rainfall (Mm) for Nyandarua District (1986-2005) …………...90
Appendix 4: Monthly Irish Potato Production for Nyandarua District (1986-2005) ……………91
Appendix 5: Market Data Entry Form…………………………………………………………...92
Appendix 6: National Markets Data Entry Form………………………………………………...93
Appendix 7: Average Monthly Irish Potato Prices for Nyahururu Market 1985-2005.................94

xi
ACRONYMS AND ABBREVIATIONS
ADC Agricultural Development Corporation
AIC Akaike Information Criterion
ADF Augmented Dickey-Fuller
AIRC Agricultural Information Resource Centre
AR Autoregressive Process
ARCH-M Autoregressive Conditional Heteroscedasticity in Mean
BIC Bayesian Information Criterion
CMAAE Collaborative Masters in Agricultural and Applied Economics
CPI Consumer Price Index
DAO District Agricultural Officer
DFID Department of International Development of the United Kingdom
FAO United Nations Food and Agricultural Organization
FAOSTAT United Nations Food and Agriculture Organization Statistical Database
GARCH Generalized Autoregressive Conditional Heteroscedasticity
GARCH-M Generalized Autoregressive Conditional Heteroscedasticity in Mean
GDP Gross Domestic Product
GED Generalized Error Distribution
GoK Government of Kenya
GTZ German Development Cooperation
Ha Hectare
HCDA Horticultural Crops Development Authority
IFPRI International Food Policy Research Institute
xii
IMF International Monetary Fund
KARI Kenya Agricultural Research Institute
KEPHIS Kenya Plant Health Inspectorate Service
KFA Kenya Farmers Association
Kg Kilogram
Km Kilometres
KNBS Kenya National Bureau of Statistics
Ksh Kenya Shilling
Mm Millimeters
MoA Ministry of Agriculture
Msc Master of Science
PhD Doctor of Philosophy
PP Phillips-Perron
PSDA Promotion of Private Sector Development in Agriculture
SAP Structural Adjustment Programs
T/ha Tons per Hectare
US United States of America

xiii
ABSTRACT
In the early 1990’s, the Kenyan government implemented reforms in the agricultural sector that
affected the volatility of agricultural product prices. However, there is lack of empirical evidence
on the effects of these reforms on the level and volatility of Irish potato prices. This study
evaluates the effects of market reform policies involving the decontrol of input and output prices
on the evolution and volatility of Irish potato prices in Nyandarua district. The purpose of this
study is to examine the effect of market reforms on Irish potato price variability. By using an
Autoregressive Conditional Heteroscedasticity in Mean model, a monthly time series data set for
the period 1986-2005 was utilized to identify the effects of the market reforms on the volatility
of Irish potato prices.
Results indicate that the implementation of market reform policies led to higher prices and
reduction of price volatility. An increase in price level coupled with a decrease in price volatility
after the implementation of market reform policies implies that with the reforms the Irish potato
producers were better off than without the reforms. The high prices and low price volatility
served as an incentive for the Irish potato farmers to boost production during the post reforms
period. The study recommends development of storage and communication infrastructure, use of
commodity exchange markets, improvement in productivity, and provision of an efficient market
information system as necessary measures to enable the farmers to realize maximum benefits
from the effects of the implementation of market reform policies.

1
CHAPTER 1
INTRODUCTION
1.1. Background Information
Irish potatoes are an important source of food, income and employment in Kenya. They contribute
approximately 1.9 percent of Kenya’s agricultural Gross Domestic Product (GDP), which is about
0.5 percent of the nation’s GDP (Gitu, 2004). The crop directly employs about 500,000 farmers and
indirectly supports over 2.5 million citizens (GoK, 2009). National annual output is approximately
one million metric tons worth about Ksh. 5 billion at producer prices, which represents 11 percent of
the national fruit and vegetable value (GoK, 2005).
The area under Irish potatoes in Kenya is estimated at about 130,000 hectares producing
approximately 1 million metric tons per year (GoK, 2009). Kenya’s Irish potato production accounts
for about 6.5 percent of the 18.5 million metric tons produced in Africa (FAO, 2008a). This
amounts to approximately 0.3 percent of the global output of 320 million metric tons (FAO, 2008a).
In Kenya, national Irish potato average yields are low at 7.5 tons per hectare, compared with a
potential yield of 30 tons per hectare (FAO, 2006). On the other hand, the national demand is 1.2
million metric tons with the average annual per capita consumption being 28.5 kilograms (FAO,
2006). Therefore, the production gap is estimated at 200,000 metric tons. Furthermore, urban
demand is increasing due to rapid urbanization leading to a rise in demand for fast cooking foods
(Lawrence, 2004). The crop is mainly grown in high altitude areas of the country in Central, Rift
Valley and Eastern provinces of Kenya. Central province leads in terms of area and production and

2
accounts for about 40-60 percent of the national potato production (GoK, 2009). Some of the key
producing districts in the country include Nyandarua, Meru, Molo, Bomet, Uashin Gishu and Narok
(Appendix 2). Despite the important role that Irish potato production plays in Kenya’s agricultural
sector, the crop is faced with several economic constraints including cost of production, credit
availability, price volatility and market access (Lawrence, 2004). Consequently, the national
production, yield and area under the crop have been fluctuating over the years (Figure 1.1).
Figure 1.1: National Irish Potato Production, Yields and Area Trends (1961-2005)
Source: International Potato Center: World Potato Atlas, 2008

3
Market reforms were a major aspect of the structural economic policy reforms implemented by most
developing countries. The market reform policy allows the forces of demand and supply to
determine what to produce, how to produce, and for whom to produce it. (Barrett, 1997). The
market policy reforms were implemented in Kenya in 1996 as a major component of Structural
Adjustment Program (SAP) prescribed by the International Monetary Fund and the World Bank
(Karanja et al, 2003). These reforms were meant to enhance efficiency in price formation and to
stabilize prices fluctuation. The prices of inputs were decontrolled making the sector very
competitive.
However, despite the market policy reforms, fluctuations in Irish potato prices have been observed
(Ng’ang’a, 2002). The observed price fluctuations affect production and incomes to the Irish potato
producers which may result in the farmers not being able to produce enough potatoes for their
domestic needs, generate adequate income to purchase enough food and meet other basic needs
(Höffler and Maingi, 2006).
In the year 2005 farm gate prices in Nyandarua district which is a major producing zone ranged
from Ksh.150 to Ksh.1500 per 110 kilogram bag while consumer prices in Kenyan urban markets
ranged from Ksh. 600 to Ksh. 3,000 per 110 kilogram bag (GoK, 2009). These wide price variations
in producer and consumer prices over the cropping period are an indicator of price volatility. Price
volatility is defined as variation from the average value over a measurement period. If a price varies
a great deal from month to month, the price volatility will be high, and conversely, if the month to
month variation is low, the value of volatility will be low as well (Wolf, 2004). The price volatility
measures price fluctuations over time and indicates the degree of spread of the prices. On the other

4
hand, price stability, is a situation where prices do not change much over time. This depicts an
absence of volatility and is usually desirable.
The volatility may be measured through the standard deviation or variance of a sample and can
either be measured as an absolute number (Ksh. 5) or a fraction of the mean. As such volatility
reflects the degree of risk faced by someone with exposure to that variable. In most cases, price
volatility for market players is often viewed as negative in that it represents uncertainty and risk.
However, price volatility can be good if one sells on the peaks and buys on lows and one can make
money, with greater money coming with greater volatility.
Price volatility is as a result of the effects on supply and demand of a commodity price. Some of the
factors identified to cause price volatility include policy reforms, changes in production as a result
of weather changes and crop diseases, changes in consumption patterns, exchange rate fluctuation
and crude oil prices (Wolf, 2004). An increase or reduction in trading volumes like it can occur due
to speculative activities can lead to price volatility. Similarly, an increase in the crude oil prices
push the cost of producing agricultural commodities upwards through increases in the prices of
inputs such as fertilizer and diesel but with a significant lag. The prices of oil and the consequent
change in production and transportation costs affect the prices of agricultural products and can lead
to price volatility (Wolf, 2004).
The negative effects of price volatility are an increase in price and market risks. These increase in
risks lead to fluctuation in production and consequently incomes especially to the households with
low asset base (Harwood et al., 1999). The income shocks lead to liquidity constraints which force

5
farmers to sell cheaply immediately after harvest and buy expensively later in the season. Further,
price volatility results to uncertainty which makes planning difficult leading to negative impacts on
supply response (Harwood et al., 1999). However, the positive aspect of price volatility is that
farmers realize high incomes when prices are high.
The basic premise of the agricultural market reforms implemented in most developing countries in
the last two and a half decades was that of improving the incentive structure for the farmers to
generate a positive supply response and increase both agricultural output plus income levels (Barrett
et al., 2003). This was in the form of higher prices and well functioning markets. In Kenya, these
reforms lead to liberalization of input and output markets by eliminating subsidies on agricultural
inputs such as fertilizer and credit. These inputs were supplied to the farmers by the government at
subsidized prices and sometimes on credit before the market reforms were undertaken (Karingi et
al., 2005). Since, farm inputs like fertilizer, fungicides, insecticides, farm implements and credit are
important to the production of Irish potatoes, the market reforms involving the removal of
government’s monopoly in the importation and distribution of these inputs affected the sector.
The major objective of the implementation of market policy reforms was to provide incentives for
increased production through higher and stable prices to the farmers through open market
operations. However, despite the implementation of these reforms, agricultural production, and food
production in particular has been on the decline (Nyangito et al., 2005). Fluctuations in volumes of
the major food commodities marketed through formal outlets have also been observed while price
volatility is a common feature in the markets (Nyangito et al., 2005). The observed price volatility
has serious implications for poverty, risk and vulnerability in the rural areas. They may result in the

6
poor not being able to produce enough to meet their domestic needs, generate income to purchase
food and meet other basic needs, or have means of dealing with natural calamities such as drought
(Nyangito et al., 2005). The implementation of market policy reforms therefore do not seem to have
worked to the benefit of the producers.
The price volatility of agricultural products is a major determinant of farmers’ income variability
and is important for individual investment decisions in farming and agricultural produce marketing.
In addition, negative price shocks have a greater negative impact on the economic growth of
developing countries like Kenya (Jordaan et al., 2007). A right assessment of price volatility
contributes to a decision maker being able to make more informed production and marketing
decisions. It also helps in the assessment of the effect of implementation of policies aimed at
boosting the economic growth through stable and favorable commodity prices.
The effect of market reforms on the level and volatility of Irish potato prices is important due to the
pivotal role that the crop plays in terms of food security, income generation and creation of
employment to a large proportion of the Kenyan population (GoK, 2009). The level and volatility of
some agricultural product prices thus affected the level of economic growth and poverty reduction
(Karanja et al., 2003).
From the foregoing, it is pertinent to understand how successful were agricultural market reforms in
Kenya in terms of improving agricultural production and market performance through their effect
on the level and volatility of food prices. However, available empirical evidence shows mixed
results on how market reforms have affected the level and volatility of food prices in Kenya

7
(Karanja et al., 2003). In fact there is lack of empirical evidence on the effects of agricultural market
reforms on Irish potato price volatility in Kenya. Given the contribution of Irish potato sector to
Kenya’s economic development, understanding how market reforms affected Irish potato price
volatility is important. Thus this study assesses the effects of market reforms on Irish potato price
volatility in Nyandarua district, which is one of the major producing regions in Kenya.
Understanding the effects of market reforms on Irish potato price volatility is of critical importance
to researchers, farmers, consumers, processers and policy makers.
1.2. Problem Statement
The main rationale of the agricultural market reforms implemented in the majority of the developing
countries in the last two and a half decades was that of improving prices for the farmers in order to
increase output and income levels (Barrett et al., 2003). This was in the form of higher prices and
well functioning markets. In Kenya, these reforms lead to liberalization of input and output markets
by decontrolling prices of inputs and outputs. This lead to elimination of subsidies on agricultural
inputs such as fertilizer and credit. These inputs were supplied to the farmers by the government at
subsidized prices and at times on credit prior to the undertaking of the market reforms (Karingi et
al., 2005). Since farm inputs like fertilizer, fungicides, insecticides, farm implements and credit are
important to the production of Irish potatoes, the market reforms involving the removal of
government’s control in the import and distribution of these inputs affected the sub-sector.
These market reforms lead to direct and indirect effects on the level and volatility of agricultural
produce prices. From current literature, the effect of market reforms on the level and volatility of

8
food prices in the Kenya is ambiguous. While some authors argue that the reforms lead to an
increase in real prices (De Groote et al., 2006; Karugia et al., 2003), others report that the market
reforms lead to a decline in food prices (Karingi and Nyangito, 2005; Nzuma, 2007). Moreover,
many of the studies on the effect of market reforms on the level and volatility of agricultural food
prices in Kenya have concentrated on maize (De Groote et al., 2006; Karugia et al., 2003; Karingi
and Nyangito, 2005).
In the Kenyan potato sector there is lack of empirical evidence on the effects of market reforms on
price volatility. It will be of use to potato farmers, policy makers and international development
agencies working in the potato sector.
1.3. Purpose and Objectives
The purpose of this study is to examine the effect of market reforms on Irish potato price variability
in Nyandarua district, Kenya. This study therefore attempts to analyze the effects of market reforms
on Irish potato price volatility in Nyandarua district through a comparative analysis of the pre
liberalization and post liberalization periods.
The specific objectives of this study are:
1. To evaluate the trends in Irish potato prices in Nyandarua district; both before and after the
implementation of market reforms policies that took place in the year 1996 in Kenya.
2. To assess the effects of market reforms on Irish potato price volatility in Nyandarua district.

9
1.4. Hypothesis to be tested
The following hypotheses are tested:
1. That there is no relationship between Irish potato price volatility and seasons.
2. That market reforms have no effect on Irish potato price volatility.
1.5. Justification of the Study
The choice of Irish potatoes in this study can be justified based on its economic importance in
Kenya. It contributes approximately 1.9 percent of the agricultural GDP which is about 0.5 percent
of total GDP (Gitu, 2004). The crop ranks second after maize as a source of food security.
Nyandarua district is selected for this study because it is the main Irish potato producing district in
Central province, leading in area and production nationally. Of the approximately 130,000 hectares of
land under Irish potato cultivation in Kenya, 22,750 hectares which is 17.5 percent of the national area is
in Nyandarua district (MoA, 2009). Further, the district contributes 17.2 percent of the national Irish
potato annual output of 1 million metric tons by producing 172,260 metric tons (MoA, 2009).
Understanding the effects of market reforms on Irish potato price volatility is of interest to
researchers, farmers, policy makers and all stakeholders in the Irish potato sector. However, the
extent to which the market policy reforms affected the level and volatility of Irish potato prices is
not known. Overall, this study will contribute to the existing body of knowledge on effects of
market reforms and Irish potato marketing.

10
1.6. Organization of the Thesis
This thesis is presented in five chapters. Chapter one contains the background information on the
Irish potato sector in Kenya. The chapter also highlights the research problem, purpose, objectives,
and hypotheses to be tested and further underscores the justification of this study. Chapter two
provides a literature review on the approaches used to analyze price volatility and of empirical
studies on Irish potatoes and price volatility. It provides a guide in the identification of the
knowledge gap and the choice of model used in the analysis of the effects of market reforms on Irish
potato price volatility.
Chapter three provides the methodology used in this study. The chapter derives the theoretical basis
on the autoregressive conditional heteroscedasticity in mean (ARCH-M) model. This chapter
describes the data sources, data analysis, area of study, and specifies the empirical model that was
estimated. Chapter four provides the results of this study and the discussion. In this chapter the
descriptive statistics and the ARCH-M model estimation results are discussed. Finally, chapter five
gives the conclusions and recommendations.

11
CHAPTER 2
LITERATURE REVIEW
2.1. Introduction
This chapter explores the literature on price volatility. It assists in the identification of the empirical
gap that this study is meant to bridge and guides on the choice of the right analytical method to use
in the analysis of the effects of market reforms on Irish potato price volatility. The chapter begins
by exploring the main empirical econometric modeling approaches applied in price volatility
studies. The review of the models for assessing price volatility is important in the identification of
the suitable model to adopt in this study. Next, a review of past economic evaluations on Irish
potatoes and price volatility is provided. Lastly, the chapter provides a review of market reforms
literature in the agricultural sector.
2.2. Approaches used to Analyze Price Volatility
The main approaches employed in the analysis of price volatility are mainly econometric
approaches that use the autoregressive conditional heteroscedasticity (ARCH) models, the variants
of ARCH models and integration of the ARCH models with other models. The variants of the
ARCH models include the generalized autoregressive conditional heteroscedasticity (GARCH) and
autoregressive conditional heteroscedasticity in mean (ARCH-M); while structural
heteroscedasticity in mean (SHM) is one of the integrated models.

12
The traditional econometric models assume a constant one period forecast variance which is not
conceivable in a stochastic process. Therefore, the ARCH model was introduced to describe how the
conditional mean and variance of a time series evolves over time. The univariate ARCH model was
originally applied by Engle (1982) in the estimation of inflation in the United Kingdom to assess the
validity of Friedman’s hypothesis that the unpredictability of inflation was the primary cause of
business cycles (Engle, 1982). Friedman hypothesized that the level of inflation was not a problem;
but it was the uncertainty about future costs and prices that would prevent the entrepreneurs from
investing and lead to a recession (Engle, 2003). This is possible if the uncertainty was changing over
time and this is econometrically termed as heteroscedasticity.
An ARCH process produces dynamic, mean reverting patterns in volatility that can be forecast
(Engle, 2003). The ARCH random variables have non-zero mean, which can be expressed as a
linear combination of exogenous and lagged dependent variables (Engle, 1982). The ARCH method
allows a conventional regression specification for the mean function, with a variance which is
permitted to change over the sample period (Engle, 1982) and is therefore an improvement of the
performance of a least squares model in order to obtain more realistic forecast variances.
The specifications of the ARCH model provides for the conditional mean equation, conditional
variance and conditional error distribution (Engel, 1982). The completion of the basic ARCH model
requires assumptions about the conditional distribution of the error term t . The assumptions are
normal distribution, student’s t-distribution and Generalized Error Distribution (GED). Given the
distributional assumptions, the ARCH model is estimated using the method of maximum likelihood.

13
The ARCH models and their extensions are based on the theory of dynamic volatility (Engle, 1982).
The ARCH is a dynamic model of time varying volatility and can be used to measure the volatility
at any time and to forecast it into the near and distant future. Inserting the relevant variables into the
model can test economic models that seek to determine the causes of volatility. Also, by
incorporating additional endogenous variables and equations can similarly test economic models
about the consequences of volatility (Engle, 2003). One of the principal assumptions underlying
ARCH models is that there is an intrinsic non-linear trend in the price process that could lead to
price volatility (Engle, 1982). This assumption is mainly fulfilled in instances where hedging and
stockholding play a key role in price determination in any two successive times.
The advantages of the ARCH model lie in the fact that it accounts for both the predictable and
unpredictable components of the price process. The focus is on the assumption of homoscedasticity
and instead of considering heteroscedasticity as a problem to be solved; the model treats it as a
variance to be modeled. This results in the correction of the deficiencies of least squares and
computation of a prediction for variance of the error term (Engle, 2001). The model is used to
evaluate volatility which is constant over an entire period and can be presented by a single value.
The limitation of the ARCH model is in the fact that a relatively long lag in the conditional variance
is often required and to avoid problems with negative variance parameter estimates, a fixed lag
structure is typically imposed (Bollerslev, 1986).
The ARCH models have many empirical applications in economics with time series data but are
largely used in financial time series such as stock prices, interest rates and exchange rates (Engle,
2003). They have a wide applicability in finance due to the importance in the trade-off between risk

14
and return in financial markets, a parameter which these models are able to forecast (Engle, 1982).
In agricultural produce markets, the model is to a large extent used for assessing price volatility in
tradable commodities such as cereals in situations where stockholding is important (Karanja et al.,
2003).
This model is designed to capture unpredictability, fat tails and volatility clustering, the three
pervasive characteristics of financial returns (Engle, 1982). The characteristics imply that the returns
are almost unpredictable, have surprisingly large numbers of extreme values and both the extreme
and quiet periods are clustered in time. When volatility is high, it is likely to remain high, and when
it is low it is likely to remain low. In financial markets the volatility has been found to be higher
when the asset prices are falling. However, these periods are time limited so that the forecast is sure
to revert to less extreme volatility (Engle, 2003).
Engle models time-varying risk premia in the term structure of bond yields using the ARCH-in-
mean model, which allows the conditional variance of a yield also to affect its conditional mean
(Engle et al., 1987). When the conditional variance or standard deviation is included in the mean
equation of a basic ARCH econometric model, we get the ARCH-in-Mean (ARCH-M) model
(Engle et al., 1987). The advantages of the ARCH-M model is due to the fact that it can be applied
to non-tradable and tradable commodities and is applicable to tradable commodities, such as cereals
in an environment where stockholding is important. This model is commonly applicable to storable
agricultural commodities where stockholding play an important role in price determination in any
two successive periods. Theoretically, the storable commodities have an ARCH process because
current price volatility transmits itself into future period by creating volatility in the inventory

15
carryover (Kilima et al., 2004). The model is also applicable to most agricultural commodity prices
especially traded ones which tend to show persistence of price shocks and high first order auto-
correlation (Engle et al., 1987). The shortcoming of the model is that since there is no real
consensus on the economic reasons why uncertainty tends to cluster, the model tends to perform
better in some periods and worse in other periods.
The ARCH-M is used in financial applications where the expected return on an asset is related to
the expected asset risk (Engle et al., 1987). The estimated coefficient on the expected risk is a
measure of the risk-return trade-off. A high coefficient implies the more favorable the compensation
for risk taking (Engle et al., 1987). Thus a salient feature of the ARCH-M model is that it allows for
an explicit modeling of the risk-return trade-off (Beach et al., 2006).
The ARCH models were later generalized into generalized autoregressive conditional
heteroscedasticity (GARCH) technique by Bollerslev, (1986), one of the most widely used
extensions of the ARCH model. This essentially generalizes the purely autoregressive ARCH model
to an autoregressive moving average model, in which the weights on past squared residuals are
assumed to decline geometrically at the rate estimated from the data (Engle, 2001). The GARCH
model is applied in exchange rates, bond returns and commodity returns (Engle, 2001).
The GARCH model is used in estimating time-varying volatility, or heteroscedasticity (Engle,
2001). The model is also suitable for estimating conditional volatility where the current observations
depend on the observations of the immediate past, a simple description of adaptive expectation.

16
According to Bollerslev, (1986), the GARCH model can be specified by providing for conditional
mean equation, conditional variance and conditional error distribution.
The advantages of the GARCH model are that the conditional standard deviation is the measure of
volatility and distinguishes between the predictable and unpredictable elements of the price process.
This leaves only the unpredictable component and is hence a more accurate measure of the actual
risk associated with the price of a crop and in addition, the model allows for a more flexible lag
structure (Bollerslev, 1986). The disadvantage of the GARCH model is the requirement for a long
memory.
The GARCH models allow for a precise modeling of the relationship between future variances and
past variances, as well as past variance forecast (Engle, 2001). It gives parsimonious models that are
easy to estimate and is particularly successful in predicting conditional variances. A GARCH
model also takes into account of time series variables that exhibit excess kurtosis, where their
probability distributions have fat tails (Engle, 2001). Finally, GARCH Models takes into
consideration of volatility clustering or persistence which occurs when large changes in returns are
followed by large changes, and small changes are followed by small changes (Engle, 2001).
The innovative structural heteroscedasticity in mean (SHM) estimator model is used to find the
determinants of price as reflected by the mean conditional on various regressors (Barett et al.,
2003). At the same time the model is used to assess factors like policy reforms, changes in
consumption patterns, exchange rate fluctuations, changes in production patterns, crude oil price
fluctuations that determine price volatility. The volatility is reflected in the time series conditional

17
variance and the interaction between the mean and variance of the time series (Barett et al., 2003).
This econometric model is an integration of the structural heteroscedasticity model, where the
conditional variance of the dependant variable is modeled as a function of the regressors and the
GARCH model (Barett et al., 2003).
In the structural heteroscedasticity in mean model (SHM) the conditional variance of the dependent
variable is modeled as a function of the regressors. The SHM model simultaneously estimates the
mean and standard deviation of the observed transaction price conditional on a set of exogenous
regresssors, inclusive of the estimated conditional standard deviation of price among the regressors
in the conditional mean equation (Barett et al., 2003). This model is suitable for data that is cross-
sectional in nature, where it involves sales of individual commodities at different points in time and
is estimated using the full information maximum likelihood criterion (Barett et al., 2003). Thus, the
SHM model is inappropriate for this study because it is suited for use in price volatility analysis in
cross-sectional data while this study utilizes time series data.
The ARCH models are simple, generate volatility clustering and have heavy tails (Engle, 2003).
Heavy tails mean that the models can be applied to time series probability distributions that assign
relatively high probabilities to regions far from the mean or median as a result of clustered
volatility. Heavy tails and clustered volatility are commonly observed in price fluctuations which
do not display the independent and normally distributed properties (Engle, 2003).
The strengths of ARCH models is that they are applicable to both non-tradable and tradable
commodities, can be applied to both perishable and non-perishable commodities and are applicable
18
to most agricultural commodity prices (Engle et al., 1987). Further, the model allows conditional
volatility to directly influence the conditional mean. Thus the conditional mean and variance are
simultaneously estimated (Kilima et al., 2004).
On the other hand, the weaknesses are that they are not sufficiently adaptive in prediction, are
asymmetric between positive and negative, restrictive and provide no explanation of volatility
(Engle, 2003). The shortcoming of the SHM model is the fact that it can only estimate volatility in
cross-sectional data. When the strengths and weaknesses of the ARCH, variants of the ARCH and
integrated models for assessing volatility are evaluated, the ARCH-M model turns out to be
appropriate for this study. This is so because the model is suited for volatility modeling for a
commodity like Irish potato which can be stored in anticipation to benefit from price movements.
Theoretically storable commodities like Irish potatoes have an ARCH process because current
volatility transmits itself into future volatility in the inventory carryover (Kilima et al., 2004). In
addition the suitability of the model can be justified by the fact that Irish potato is a tradable
commodity and the data utilized is a time series with varying mean and variance best estimated
using the ARCH-M model.
2.3. Market Reforms, Price Volatility and Irish Potato Economic Studies
This section presents past studies in modeling of the effects of implementation of market reform
policies on price volatility. Further, the section provides a review of previous economic studies on
Irish potatoes in Kenya. It summarizes the major findings of these studies, indicates what

19
approaches have been used in the past and is useful in identifying the empirical gap that the current
study intends to bridge and gives a guide on the right analytical approach to adopt.
A number of economic evaluations have been undertaken in the past on production, marketing and
post harvest handling and storage technologies of Irish potatoes in Kenya. However, these studies
(Mbogo, 1976; Mugambi, 1977; Nyangito, 1986) did not evaluate the effect of market reforms on
Irish potato price volatility. The studies identified price volatility as a major problem in Irish potato
marketing and recommended that this issue be further investigated.
Mbogo (1976) undertook a study on the economics of production and marketing of Irish potatoes in
Meru district, Kenya using the conventional structure, conduct and performance method. The author
used the regression and correlation models. He found that Irish potato prices in Meru district differ
by transfer costs and was correlated to the prices in Nairobi. The local markets in Meru district were
found to be weakly integrated and linked to the interregional markets like Nairobi through trade.
The local traders were found to receive Irish potato price information from main consumer points
like Nairobi via telephone from their agents in such centers. The Irish potato price differential
between Nairobi and Meru was found to be at the maximum during the period when Meru farmers
were harvesting their crop.
The author observed that Meru Irish potato growers do not store their produce after harvesting, for
sale later into the Nairobi markets. The author recommends implementation of a strategy for
planned marketing of Irish potatoes in Kenya. The strategy is to involve purchasing of buffer stocks
from the key producing regions during the period of glut and release of these stocks during the

20
scarce periods when the supply declines leading to price increase. The approach recommended by
the author is meant to stabilize the high fluctuations in supply and prices.
Another recommendation by the author is the formation of a national potato marketing organization
to take the responsibility of holding potatoes in storage in order to control supply to the market so as
to reduce price fluctuations. This organization could buy potatoes from producers at fixed floor
prices based on production costs. To ensure continuity in the supply of Irish potatoes to the market
he recommends coordination of growers in various regions. He argues that growers need to be
encouraged to grow potatoes when production is cheapest in comparison to other farm enterprises.
Lastly, he recommends the need to have proper storage facilities by the farmers and the national
potato marketing organization to enable storage of potatoes during the peak harvesting periods and
release to the market during the time of scarcity. This would ensure that Irish potato farmers get
adequate returns to enable them cover the cost of production and make profit. Nevertheless, the
author was not able to empirically demonstrate the relationship between Irish potato price variability
and season nor did he evaluate the trends in Irish potato prices. The author recommended further
investigations on the pattern of potato yields and price variability. The similarity between this study
and Mbogo (1976) study is that both studies examined the issue of price variability, though in
different districts. However, the current study goes further and fills the empirical gap, on what
effects did the market policy reforms have on the level of price volatility in Nyandarua district? This
is realized by analyzing the Irish potato price volatility during the pre and post market liberalization
periods. The current study contributes to the existing body of knowledge by presenting the effects

21
the market policy reforms have on Irish potato price level and volatility which is missing in the
current literature.
Mugambi (1977) undertook a study on the economics of Irish potato storage in Kenya. The author
used data from a survey and an Irish potato storage trial he carried out in Kibirichia location of
Meru district and from similar trials set up in Ngecha and Molo in Kiambu and Nakuru districts
respectively. The survey involved interviewing a random sample of 71 farmers while the Irish
potato storage trials were set by the German Agricultural Team, International Potato Centre (CIP)
and the author using house-stores, pits and improved granaries as storage structures.
The author concluded that price fluctuation in the potato market is a commonly observed
phenomenon. Further, the author observed that some farmers store their potatoes to reap the benefits
of shortage in later periods. However, he concluded that the number of those who practice storage is
either too few or they store small quantities so that they are not able to stabilize prices.
Mugambi (1977) recommended an improvement in storage methods and techniques. To reduce
dehydration of potatoes experienced during storage he recommended that traders, companies and
other institutions need to be encouraged to construct cold stores for potatoes in production areas. As
an effort to improve the Irish potato marketing system in Kenya, he recommends cooperative
marketing be the main channel for distribution of Irish potatoes to the consumers. He argues that
this would curtail the high profit margins received by traders to the detriment of both the producer
and the consumer. He further observes that it will be more cost effective for a cooperative society to
build the Irish potato cold stores.

22
Another recommendation by this author is the supply of Irish potatoes to the non-producing regions
of the country like Coast province, Machakos and Kitui to cater for the local demand before
exporting. To achieve this he recommended that the Irish potato cooperative society to organize for
the transportation of potatoes to the deficit regions of the country. The similarity between the
current study and Mugambi (1977) is the fact that both studies evaluate how to stabilize the
variability in the Irish potato prices. However, the difference is that Mugambi’s (1977) study
concentrated on how storage can play a part in price stabilization while this study looks into the
effect of market policy reforms on price variability. This study consequently contributes to literature
on what role policy reforms had on Irish potato price stabilization.
Nyangito (1986) undertook a socio-economic analysis of the factors affecting Irish potato post-
harvest practices and storage technologies in Kinangop, Nyandarua district using a Planning Stage
of Farming Systems Approach. The study reported that price uncertainty, storage losses and limited
market outlets as the main problems limiting farmers from storing potatoes for sale. He reports that
farmers can benefit by storing the Irish potatoes and selling when the prices rise. According to the
study, the producers were unable to withhold supplies from the market to wait for better prices
which results to wide price variability in the potato market. The potato marketing system in
Kinangop was found to be characterized by limited market outlets and price uncertainty which
retards increased potato production. However, the study did not evaluate the trends in Irish potato
supply and price patterns in Nyandarua district which is assessed in the current study.
The study by Nyangito (1986) reports the presence of price fluctuations in the potato markets in
Nyandarua district. Further, the author reports that the prices that the farmers receive in Kinangop

23
vary according to the time of selling in relation to the harvesting periods. The prices were lowest
during the harvest periods in July to August and highest during off-peak harvest periods in March to
May. The author concluded that farmers find it difficult to predict future prices because potato
prices fluctuate according to change in supply in the local and national markets. The author however
did not empirically demonstrate the trends and magnitude of these price fluctuations.
The current study is different from Nyangito (1986) study in several aspects. First, the study by
Nyangito (1986) was restricted to only one of the six divisions in Nyandarua district while the
current study focuses on the whole of Nyandarua district. Second, the current study evaluates the
trends in Irish potato prices and supply patterns which Nyangito (1986) failed to address. Further,
the model he used did not take into consideration price volatility while a model for assessing price
volatility is used in the current study. In addition, Nyangito’s 1986 study was done before the
implementation of market policy reforms while the current study encompasses both the period
before and after these reforms. The current study will thus add to the literature on the effects of
policy reforms on Irish potato supply, price level and volatility.
Barrett et al., (2003) undertook a study to determine the volatility of livestock producer prices in
Northern Kenya rangelands. The authors used detailed transaction level data from a project by the
German technical assistance program GTZ in Marsabit and Moyale for the period 1994 – 1997. The
data was analyzed using the structural heteroscedasticity in mean (SHM) econometric model.
This model is an integration of the structural heteroscedasticity model and the generalized
autoregressive conditional heteroscedasticity in mean models. In this model, the conditional
24
variance of the dependent variable is modeled as a function of the regressors. The SHM model
estimates the mean and standard deviation of the observed transaction price conditional on a set of
exogenous variables including the estimated conditional standard deviation of price among the
regressors in the conditional mean equation.
The authors used the sinusoidal terms to control for rainfall and seasonality in prices. They also
included a dummy variable to account for the end of Ramadan to cater for the importance of
religious festivals on small ruminant prices, a dummy variable for April and December, the
customary months for circumcisions and weddings in the region, as well as the Christian holidays of
Easter and Christmas and for the months of January, May and September when school fees are paid
in Northern Kenya. The other variables included in the study by Barrett et al., (2003), are
characteristics of the animals sold that affect the price livestock fetch in the market which include
attributes such as body condition, breed, age, size and castration. Since animals trekked rather than
ferried using a truck from the market by buyers are expected to fetch lower prices, a variable
representing trekking of animals to the market is included in the model.
The livestock prices were found to exhibit large variability across space, time and animal
characteristics. Further, the prices were found to strongly respond to rainfall, reflecting the direct
reliance of animal health and productivity on climate. The demand and supply shifts associated with
ceremonial events and periodic demand for cash to pay school fees and demand shocks due to
quarantines also affect prices significantly. The authors found out that market prices depend on age,
gender and physical condition of the animal sold. Further, policy related shocks such as the
imposition of quarantines and poor market infrastructure limit integration with the major terminal

25
market in Nairobi thus leading to price volatility and a negative impact on the livestock producer
prices. The price risk premia was found to be negative.
The authors used data over a short period of time and were not able to establish the trends in
livestock prices. This limits the conclusions drawn on risk premia, and the evolution and volatility
of prices. Conversely, the current study uses data over a longer period of twenty years and assesses
the Irish potato price trends. Further, the study utilized the SHM model that is only suitable for
cross-sectional data unlike the current study which uses the ARCH-M model suitable for time series
data. Another difference between the current study and the study by Barrett et al., (2003) is the fact
that the current study evaluates price volatility on Irish potato prices in central Kenyan highlands
while Barrett et al., (2003) assessed price volatility on livestock prices in northern Kenyan
rangelands, regions of different agro ecological zones.
Höffler and Maingi (2006) carried out a value chain analysis of the Irish potato sub sector in Kenya.
The authors reported an increasing demand for Irish potatoes in the last decade which they linked to
changes in consumption habits mainly in the urban centers where chips have become an
increasingly popular part of the diet. Production of chips has become the major form of value
addition for potatoes. In urban centers, the Irish potato industry employs thousands as marketing
agents, transporters, chips and crisp processors plus vendors like Nandos, Galitos and the Creamy
Inn.
The analysis by Höffler and Maingi (2006) reveals that demand is not always met, quality of
produce is sometimes poor and prices seem higher than production costs. According to the authors’

26
analysis, Irish potatoes are marketed through a fragmented chain characterized by many handlers,
hardly any cooperation, no integration, and market failure, which result in high supply risks, high
transaction costs, price inefficiencies and quality losses.
The results from the analysis of the value chain show several factors contributing to weak rural-
urban linkages. Firstly, the predominant smallholder production is faced with failing input markets
and production is adversely affected by poor quality and unreliable availability of seed potatoes.
Secondly, scattered farms, limited storage facilities, poor road network, and insufficient transport
facilities damage the potatoes and affect the post-harvest quality. Thirdly, there are challenges in the
logistics of marketing, the physical infrastructure of markets and on market information.
The potato marketing was found to be struggling between the basic functions of a market and
market failure and the study indicates the need for high public investment in rural marketing
infrastructure by reallocation of resources from urban to rural areas. The analysis of the value chain
is useful in identification of the factors leading to price volatility. The study identifies market
integration, demand and supply disequilibrium, price inefficiencies, fragmented chain and market
failure as the factors which lead to price volatility. Overall, the study by Höffler and Maingi (2006)
underscored the importance of Irish potatoes as a food crop in Kenya and elicits the constraints
experienced in the marketing of the produce which the current study attempts to appraise.
The authors use the value chain analysis as an analytical framework to describe the productive
processes from input provision to production, transportation, processing, marketing, to final
consumption. The approach concentrates on the descriptive analysis of the institutional

27
arrangements that link the various economic players and also highlights the importance of private
sector development. Thus, Höffler and Maingi (2006) used a descriptive approach to draw their
conclusions as compared with the current study which uses both descriptive and econometric
approaches.
Ng'ang'a (2002) undertook a study on the marketing channels for Irish potato from Njabini location,
South Kinangop division, Nyandarua district to Nairobi and its environs. The author used survey
data collected using structured questionnaires administered to farmers and traders from December
2000 to April 2002. The weekly and monthly wholesale price data for other wholesale markets in
Kenya from the Ministry of Agriculture for the period January-December 2000 and January-
December 2001 was also utilized. The study by Ng'ang'a (2002) employed descriptive statistics to
analyze the data.
The authors concluded that there is need for government interventions to reduce market risks
through control of prices, bag size and potato supply into the fresh produce market. The desired
interventions according to the study were: setting up of a minimum price (29 percent of the
farmers), setting a minimum bag size of 110 kilograms (20 percent), setting up of a nearby
processing plant (8 percent), setting up of a central market and store to control produce into the
market (8 percent), provision of loans and inputs (8 percent) and improvement of roads (8 percent).
The study by Ng'ang'a (2002) is similar to the current study in that both were done in Nyandarua
district in the Central province of Kenya and wholesale monthly Irish potato prices were analyzed.
However, the contrast is that Ng'ang'a (2002) study concentrated in one location of Nyandarua

28
district while the current study utilizes data from the entire Nyandarua district. Also weekly and
monthly wholesale Irish potato prices were analyzed from several markets in Kenya in Ng'ang'a
(2002) study while the current study considers data from the Nyahururu wholesale market. The
study by Ng’ang’a (2002) considered spatial Irish potato price variability using a two years survey
data unlike the current study which analyses the temporal price variations using a twenty years time
series data which is better in illustrating the actual seasonality in price trends.
Barrett (1997) analyzed the effects of liberalization measures on prices of rice, beans, manioc,
maize and potatoes in Madagascar. The author estimated the effects of liberalization measures on
the level and volatility of prices of these food commodities, using retail level nominal commodity
prices from seventeen agricultural markets. The Consumer Price Index (CPI) was used to deflate the
nominal prices to come up with real price series for rice from January 1983 to December 1991 and
for beans, manioc, maize and potatoes from January 1984 to December 1991.
The author employed the ARCH-M model which permits the conditional variance to influence the
level of the conditional mean, risk, and price level. A key assumption underlying ARCH-M model is
that there is an inherent non-linear phenomenon in the price process that could lead to price
volatility. The model is appropriate for time series data and allows for price modeling with time
varying risk premia. In the ARCH-M econometric model the author used, the dummy variables
included as independent variables were for the June-December 1991 period of nationwide pro
democracy strikes, the second for the fourth quarters of the year and also for each of the regions.
The 1-month lagged price level was included in the conditional variance equation to take care of the
positive relationship between prices and inventory depletion in one period and price volatility in the

29
next. The study therefore guides on the dependent and independent variables included in the current
study.
The ARCH-M potato price model indicated that short term mean prices fell and volatility increased
sharply with liberalization while the long term mean prices increased. The exchange rate effect was
positive and had a statistically significant correlation with mean price and insignificant relationship
to price volatility, thus indicating linkage with world markets. Further, the short term mean seasonal
and spatial price distribution generally decreased with liberalization. Conversely, the long term
regional mean price differences increased reflecting increased intermediation costs arising out of
increase in real cost of fuel, spare parts and vehicles over the previous ten years. Also, liberalization
led to higher long term regional differences in potato price volatility in Madagascar.
The author concluded that reforms can ignite private trading and arbitrage and recommended that,
for the food price distributions to stimulate production and growth there is need for improvement of
market institutions, infrastructure, production and processing technologies. The similarities between
Barrett, (1997) study and the current study is that both studies empirically analyze the effects of
liberalization on potato price volatility using time series data using the ARCH-M econometric
model. Further, potatoes were neither subject to parastatal marketing nor price control in both
studies. In contrast the current study done in Kenya concentrates on Irish potatoes in one market
while the previous study was carried out in Madagascar on five crops in 17 markets. All the potatoes
were aggregated in the previous study, and some of the independent variables used were different in
the two studies.

30
Barrett(1997) used real exchange rate, border parity price, rice buffer stock release volumes and a
dummy variable for June-December 1991 period of nationwide pro democracy strikes and regional
dummies as independent variables which are not used in the current study. On the other hand, the
current study uses value of production, sales and reforms which were not used by Barrett (1997).
The two studies have different sets of independent variables since they were focusing on different
commodities, diverse regions and varying economic environments.
In addition, potatoes were exportable in Madagascar during the period of the study while in Kenya
the potatoes were not generally exported. Aggregation of Irish potatoes and sweet potatoes makes it
difficult to determine the specific effects of liberalization on price volatility on the particular potato
type in Barrett (1997) study, an ambiguity which the current study attempts to clear. In addition,
the current study uses data for a period of 20 years to evaluate the effects of market policy reforms
on price volatility, which provides better results as compared to the study by Barrett, (1997) which
uses a shorter period of 6 years.
The effects of market reforms on the evolution and volatility of producer prices of coffee, maize, tea
and milk in Kenya was analyzed using an ARCH-M model in a study by Karanja et al., (2003). The
authors used milk and maize to represent food items while coffee and tea represented traded non-
food commodities. A database of a 15 year period on monthly producer prices obtained from the
marketing bodies concerned with the marketing and the regulation of the commodities was used.
The periods 1985 to 1991 and 1992 to 1999 represented the pre reform and reform periods
respectively.

31
The results from the study indicate that real producer prices for coffee, tea and maize significantly
declined during the reform period while milk prices increased in the same period. Further, the
results show that the market reforms were generally associated with higher volatility of commodity
prices, although there were inter-commodity differences. The authors attributed these results to
sequencing problems and the inconsistent nature of the implementation of market reforms and also
due to limited private sector participation in agricultural markets. In addition, for traded products the
authors associated the results to the international trends in agricultural commodity prices.
The authors conclude that market reforms do not always create the necessary conditions for
increasing the level of real commodity prices. Another conclusion from this study is that there is
need to employ caution in generalizing the effects of market reforms on prices, since the evolution
of commodity prices tend to be commodity specific. The study recommends specific price policies
aimed at addressing declining prices for food and for export crops. In view of the fact that the
majority of rural households are net food buyers, the authors recommend a review of price support
policies. According to the authors, these policies are assumed to contribute to growth in incomes in
the rural areas but mainly benefit commercial food crop producers, who are mainly the medium and
large scale farmers.
The similarity of Karanja et al., (2003) and this study is that both empirically analyze the effects of
market policy reforms on price volatility using time series data by use of an ARCH-M econometric
model approach. The authors used a 15 years time series dataset in the study while the current study
uses a 20 year period database which gives a better assessment of price volatility. Additionally, the
study by Karanja et al., (2003) was essential in identifying the dependent and independent variables

32
to consider in the current study. However, the study dealt with maize, milk, coffee and tea products
which were subject to control by parastatal marketing and price control during the pre market
reforms period while the current study focuses on Irish potatoes, a commodity that did not have
price controls and was not under parastatal marketing arrangements.
2.4. Chapter Summary
In this chapter the literature review presented summarizes the approaches used in the analysis of
price volatility, studies on price volatility and Irish potato economic evaluations in Kenya and the
effects of market reforms on price volatility. This review is useful in the identification of the
literature and empirical gap addressed in this study and the appropriate analytical approach to adopt
in price volatility analysis.
In the past ARCH, ARCH-M, GARCH and the SHM econometric models have been used to study
price volatility. When the conditional variance or standard deviation is included in the mean
equation of a basic ARCH econometric model, we get the ARCH-M which allows for the existence
of a direct correlation between price levels and also permits simultaneous estimation of time
varying risk premia.
The chapter shows the lack of consensus on effects of market reforms on price volatility and an
existence of an empirical gap on Irish potato price volatility in Kenya. The next chapter gives the
theoretical framework and the analytical model used to assess the effects of market reforms on Irish
potato price volatility in Nyandarua district. It also presents the specification of the empirical model
used in this study.

33
CHAPTER 3
METHODOLOGY
3.1. Introduction
The main purpose of this chapter is to evaluate the alternative empirical models for analyzing price
volatility and present the appropriate model to adopt in this study. The chapter is divided into four
main sections. Firstly, the analytical framework for analyzing price volatility is presented. Secondly,
the empirical model used to estimate the effect of market reforms on Irish potato price volatility in
Nyandarua district is specified. Thirdly, the data types and sources are described. Lastly, the method
used in data analysis is illustrated.
3.2. Analytical Framework
The autoregressive conditional heteroscedasticity (ARCH) model was originally developed by
Engle (1982) to describe the inflationary uncertainty in the United Kingdom. However, the ARCH
class of models has subsequently found wide use in characterizing time-varying financial market
volatility (Bollerslev, 1986). The model allows for simultaneous estimation of conditional means
and variances of a dependent variable over time (Engle 1982; Bollerslev, 1986). An autoregressive
conditional heteroscedasticity (ARCH) econometric model is used in this study to calculate Irish
potato price volatility which cannot be directly observed.
The selection of this model was motivated by three reasons. The first reason is a theoretical belief
that storable commodities have an ARCH process because current price volatility transmits itself

34
into future period by creating volatility in the inventory carryover (Kilima et al, 2004). Secondly,
the model allows conditional volatility to directly influence the conditional mean. (Kilima et al,
2004). The model is not just interested in the determinants of prices as reflected in the conditional
mean and various regressors but also in the factors that explain price risk as revealed in the series
conditional variance and the interaction between the mean and variance of the prices, that is, the
price risk premium prevailing in the market (Gujarati, 2006). Third, data limitations and modeling
difficulties disqualify the adoption of alternative models.
The conditional variance means that variance at any given period is dependent on time and previous
variance (Green, 2003). This indicates that the variance is conditional on time and previous
variance. It is used in studying prices which go through periods of high volatility and periods of low
volatility, to model them econometrically as having the variance at time t as coming from an
autoregressive (AR) process. This is the basis of the ARCH model. In this model, the unconditional
variance is the variance of the whole process, whereas the conditional variance can be better
estimated since it is assumed that we can estimate the previous values of the variance (Green, 2003).
In this study price volatility is modeled as the conditional variance of Irish potato mean prices.
The ARCH model assumes an error structure in which the sign of the disturbance is not predictable,
but in which the size of the forecast error is. Thus the conditional variance is homoscedastic but the
variance at any time t conditional on preceding period information, is heteroscedastic. An important
assumption underlying ARCH model is that there is an inherent non-linear phenomenon that could
lead to price volatility (Deaton and Laroque, 1992; Bera and Higgins, 1995; Shiverly 1996, 2001).
This assumption is mainly satisfied in situations where stockholding play an important role in price
35
determination in any two successive periods. In agriculture the model is used to measure price
volatility mainly for tradable commodities like cereals (Karanja et al., 2003).
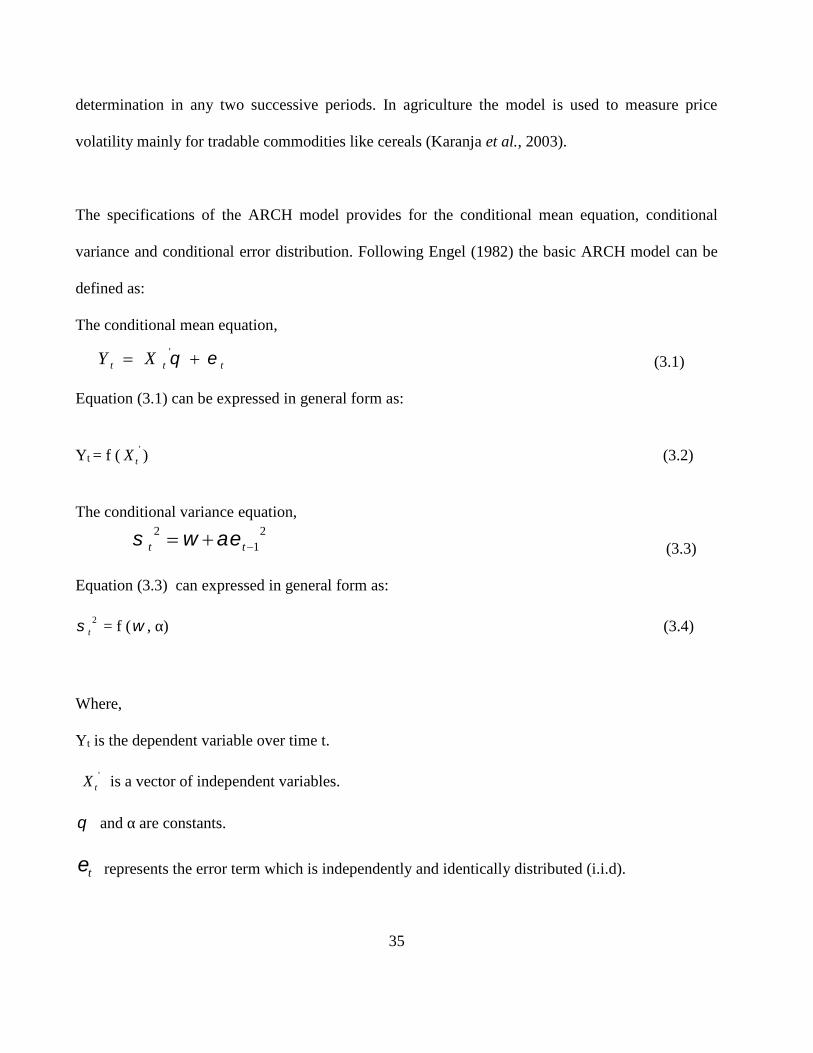
The specifications of the ARCH model provides for the conditional mean equation, conditional
variance and conditional error distribution. Following Engel (1982) the basic ARCH model can be
defined as:
The conditional mean equation,
(3.1)
Equation (3.1) can be expressed in general form as:
Yt = f ( 'tX ) (3.2)
The conditional variance equation,
(3.3)
Equation (3.3) can expressed in general form as:
2t = f ( , α) (3.4)
Where,
Yt is the dependent variable over time t.
'tX is a vector of independent variables.
and α are constants.
t represents the error term which is independently and identically distributed (i.i.d).
ttt XY '
21
2 tt

36
The mean equation (3.1) is expressed as a function of exogenous variables with an error term.
'tX refers to exogenous or predetermined variables that are included in the mean equation while σ t
2
is the one period ahead forecast variance based on past information and is therefore the conditional
variance over time t. This allows for the existence of a direct correlation between price levels and
volatility. Equation (3.3) of the conditional variance is a function of a constant term and news
about the previous period volatility measured as the lag of the squared residual from the mean
equation 21t . The 2
1t refers to the presence of a first-order moving average and is called the
ARCH term. Equations 3.1 and 3.3 are based on the macroeconomic theory of the trade-off between
risk and volatility (Engle, 2003).
The ARCH fits regression models in which the volatility of a series varies through time. Usually,
periods of high and low volatility are grouped together. ARCH models estimate future volatility as a
function of prior volatility. To accomplish this, ARCH fits models of autoregressive conditional
heteroscedasticity using conditional maximum likelihood method. The variance of the dependent
variable is modeled as a function of past values of the dependent variable and independent or
exogenous variables.
The completion of the basic ARCH model requires assumptions about the conditional distribution of
the error term t . The assumptions are: normal distribution, student’s t-distribution and Generalized
Error Distribution (GED). Given the distributional assumptions, the ARCH model is estimated
using the method of maximum likelihood (MLE) which assumes that data is normally distributed.

37
The equations (3.1) and (3.2) are estimated simultaneously by method of maximum likelihood
yielding consistent, and efficient estimates of , and α parameters of interest.
The autoregressive conditional heteroscedasticity in mean (ARCH-M) model suggested by Engle,
Lilien, and Robins (1986) is an extension of the ARCH model. The ARCH-M model was first used
for modeling risk-return tradeoffs in the term structure of United States interest rates. The model
extends the ARCH regression model in Engle (1982) by allowing the conditional mean to depend
directly on the conditional variance and thus risk thereby influencing equilibrium price levels. The
conditional mean implies that the mean price is conditional on time and previous price (Gujarati,
2005). In the ARCH-M regression model the conditional variance is interpreted to represent
volatility. The bounds of the conditional variance is from zero to one, with zero indicating no
volatility at time t while the value one represents maximum volatility at time t.
The ARCH-M allows price modeling with time varying risk premium, that is, the increase in the
expected rate of return (mean price) is associated with the increased risk in rate of return (variance).
In the model, the risk term included as one of the vectors of independent variables, estimates the
relative risk premia. The estimate reflects a risk premium with respect to the conditional standard
deviation (Engle, Liliens and Robins, 1986). This risk premia is that portion of observed price
attributable to a risk premium. The short-term risk premia is the necessary mark-up by an existing
firm to cover its price risk exposure (Barrett, 1997). The long- term risk premia captures general
equilibrium effects on industry structure as risks impacts on entry, exit and investment levels. Long-
term risk premia thus add to the short-term effects of risk.

38
The literature on risk and agricultural marketing in high-income countries indicates the risk
premium to be positive (Barrett, 1997). This implies that equilibrium prices compensate suppliers
for bearing price risk. In low income countries however, it is quite possible that consumers will
require compensation for bearing food security risk induced by price variability thereby leading to a
negative risk premia (Barrett, 1997). There are several advantages of using the ARCH-M model.
First, the ARCH-M model addresses the potential problems with heteroscedasticity that would lead
to inefficient estimators and possibly incorrect inferences (Brewer et al., 2005). This model is
appropriate to use when the variance of the residuals fluctuates significantly during the sample
period. Further, the model allows for simultaneous estimation of the conditional mean and price
volatility of a dependent variable over time. The model is more applicable to tradable agricultural
commodities in an environment where stockholding is important (Karanja et al., 2003). The ARCH-
M model was applied in this study due to its suitability in modeling price volatility in commodities
such as Irish potatoes where stockholding by farmers and traders is important in regulating supply in
the hope of benefitting from price movements.
3.3. Empirical Model
An autoregressive conditional heteroscedasticity in mean (ARCH-M) model was used to model the
effects of market reforms on Irish potato price volatility. The choice of the independent variables is
based on Karanja et al (2003) and Barret (1997). Following Karanja et al., 2003 the ARCH-M
model is specified as;
The general model of the mean equation can be expressed as:
),,,,,,( 1 itt hSSDPRRPTfP (3.5)

39
Equation (3.5) can be expressed as a specific model as:
tttt ehSSDPRRPTP 2
1
65431210 (3.6)
The general model of the variance equation can be expressed as:
(th ),,,,,, 112 SSDPRRPTe tt (3.7)
Equation (3.7) can be expressed as a specific model as:
0th SSDPRRPTe tt 765413212
1 (3.8)
Where P stands for the real monthly Irish potato price in constant terms at Nyahururu market, T is
the time trend in months while PR is the monthly Irish potato value of production in Nyandarua
district. The SD represents a seasonal dummy, S is the monthly Irish potato sales in Nyahururu
market and R is the market reforms dummy. The Pt-1 is the lagged real mean monthly Irish potato
prices and ht stands for conditional variance over time (t), which is the variance of the residuals of
the regression. 0 and β0 are constants, while βt and λi are estimation coefficients. The et is the
random error term which is independently and identically distributed, while λ1 is the ARCH term.
The risk premia in this study was estimated as a coefficient, with respect to the conditional
standard deviation in the ARCH-M model. To address the problem of multicollinearity the
functional relationship of the explanatory variables was computed and the results show that it is not
a problem as indicated by the low values of the correlation coefficients in Appendix 1.
The ARCH-M model allows for simultaneous estimation of the conditional means and variances of
the dependent variable over time (Engle, 1982). A two equation ARCH-M model comprising of a
mean and variance equation, is estimated for the Irish potato twenty year price series, inclusive of
the pre reforms and the post reforms periods. Therefore, equation (3.6) gives the ARCH-M

40
estimates for the mean equation which determine the level of the wholesale Irish potato prices. In
this case, the dependent variable is the mean monthly Irish potato price.
In equation (3.6) the estimation coefficients explain how the respective independent variables affect
the Irish potato wholesale prices in the post reforms period. A positive estimation coefficient in this
equation indicates that the respective independent variable leads to an increase in Irish potato prices.
The equation also estimates the risk term. A risk term coefficient indicates the risk premia which is
the mark up to cater for Irish potato price risk. If the coefficient is positive, the implication is that
the mark up to cater for price risk increased during the post reforms era. Conversely, a negative risk
term coefficient implies that the mark up decreased in the post reform era.
The equation (3.8) estimates the Irish potato price variance which depicts the price volatility. The
dependent variable is thus the conditional variance and the estimation coefficients show how the
independent variables affect the price volatility. A positive estimation coefficient in equation (3.8)
indicates that the respective independent variable lead to an increase in price volatility during the
post reforms period. On the other hand, a negative estimation coefficient shows that the independent
variable resulted in a decline in price volatility in the post reforms period.
In this study the Irish potato conditional mean price is dependent on time and the previous price.
The conditional variance or volatility of the Irish potato price is dependent on a monthly time trend t
and the immediate value of the variance at time t-1. Both the conditional mean and variance were
estimated by the univariate ARCH-M regression model using STATA computer software using the
maximum likelihood estimation (MLE) approach.

41
The description, units of measurement and based on the economic theory of price, the hypothesized
directions of the regression variables P, T, PR, SD, S, R, Pt-1 and ht are as indicated in Table 3.1.
Table 3.1. Description of Variables and their Measurement
Variable Symbol Description Unit Coefficient Expected
Sign
Dependent
Variable
Price P Irish potato real prices in
Nyahururu market
Ksh/Metric
tone
Independent
Variable
Time T Time trend in months - ß1 +
Value of
production
PR Irish potato monthly value of
production in Nyandarua district
Ksh ß4 -
Season SD Seasonal dummy Dummy ß5 -
Sales S Monthly Irish potato sales in
Nyahururu market
Metric tones ß6 -
Reforms R Market reforms dummy Dummy ß3 +
Lagged Price Pt-1 Lagged Irish potato prices in
Nyahururu market
Ksh/Metric
tone
ß2 +
Conditional
Variance
ht Risk premia - -

42
Notes: SD = 1 in January, May, June, August, September, November and December which are the Irish potato
harvesting months and SD = 0 elsewhere. R = 0 for period January 1986 to December1995 and R = 1 for period January
1996 to December 2005.
The endogenous variable used in this model is the real monthly wholesale Irish potato price (P) in
Nyahururu market (Table 3.1). On the other hand, the exogenous variables are the time trend in
months (T), monthly values of Irish potato production in Nyandarua district (PR), sales (S), lagged
mean monthly Irish potato real prices in Nyahururu market (Pt-1) plus the seasonal (SD) and reforms
(R) dummies. The hypothesized directions of the coefficients of SD and R are positive. The
estimation coefficient representing risk premia is expected to be negative as is the case in most
developing countries (Barrett, 1997).
The real monthly wholesale Irish potato prices (P) were obtained by deflating the nominal prices
obtained from Nyahururu market using the monthly Consumer Price Index (CPI) from the Kenya
National Bureau of Statistics (KNBS). The base year of analysis was 1997, such that October 1997
= 100.
The time trend in months (T) is included as an exogenous variable to serve as proxy for the slow
moving process of technological change because it affects the Irish potato prices but is not directly
observable though it is highly correlated with time (Table 3.1). The inclusion of the time trend in the
ARCH-M econometric model helps to avoid spurious regression. In this study, value of production
(PR) comprises of monthly Irish potato value of production in Nyandarua district given in Ksh.
(Table 3.1). The value of production is expected to be one of the main factors that determine the

43
mean price and volatility of Irish potato prices. The value of production is hypothesized to have a
negative effect on price volatility due to the fact that with increased value of production, the supply
increases and with a stable demand for Irish potatoes the mean price is expected to decrease.
A seasonal dummy (SD) is included in this model (Table 3.1). The seasonal dummy accounts for the
potential seasonality in the mean monthly Irish potato wholesale price data. This seasonal dummy is
specified such that SD = 1 during the Irish potato harvesting months while SD = 0, otherwise. The
seasonal dummy is expected to have a negative impact on the mean price since during the Irish
potato harvesting months the quantity of Irish potatoes supplied in the market increase leading to the
depression of the mean price since the demand for this food commodity in the Kenyan markets is
inelastic.
Sales (S) represent the monthly values of Irish potato sales in Nyahururu market expressed in Kenya
shillings per metric tone (Table 3.1). Since the Nyahururu market handles only a small proportion of
the Irish potatoes produced in Nyandarua district, the sales volume are expected to have a minimal
effect on the mean Irish potato prices. The hypothesized direction for the sales is negative since high
sales volumes imply that the supply is high with the consequent lowering of the monthly mean
price.
The lagged mean monthly Irish potato real (Pt-1) prices in Nyahururu market is measured by lagging
the monthly price by one month and is an indicator of whether the prevailing price at any one time
depends on the price in the previous period (Table 3.1). In the model, the prevailing time is
represented by t while the previous time is denoted as t-1. This variable is included as an exogenous
variable in this model, since most agricultural commodity prices show a high degree of dependency,

44
such that the price in the current time (Pt) highly depends on the price prevailing in the previous
period (Pt-1). The variable is hypothesized to have a positive sign due to the fact that the prevailing
Irish potato mean price at any one month is highly dependent on the price in the preceding period.
To account for the period before and after market reforms, a market reforms variable (R) is
specified (Table 3.1). In this model, R is a dummy variable, where R = 0 represents the period from
January 1986 to December 1995. This period is referred to as the pre reform period. On the other
hand, R=1 represents the period from January1996 to December 2005, otherwise referred to as the
post reforms period. The coefficient of market reforms dummy shows the effect of market reforms
on Irish potato price volatility that is the thesis of this study.
A positive coefficient for the market reforms dummy variable (R) in both the mean and variance of
the ARCH-M regression is taken to indicate a higher mean price and higher price volatility during
the market reforms period. On the other hand, a negative coefficient of this variable indicates lower
mean price and volatility during the reforms period. The market reforms variable is expected to
have a positive effect on the mean price since the reforms were anticipated to improve the producer
prices in the agricultural sector as a means of stimulating production and growth. On the other hand,
the market reforms dummy is expected to be negative in the conditional variance model, since the
market reforms were targeted to offer stable prices to farmers for increased production.
3.4. Data Sources
This study used monthly time series secondary data on Irish potato prices, value of production and
sales from the Ministry of Agriculture in Nyandarua for the period 1986-2005. This dataset

45
comprises 240 observations. The data was collected from Nyandarua District Agricultural Office
(DAO). The monthly time series Irish potato price data (Appendix 7) was collected by the Ministry
of Agriculture market enumerators using standard questionnaires (Appendix 5 and 6) on a weekly
basis and the monthly average prices aggregated from the weekly prices. The enumerators were
trained through a project supported by German Technical Support (GTZ) and were supervised by
the Nyandarua District Farm Management Officer. The data was screened to identify outliers,
miscoded, missing or any other anomalies to improve performance of the analytical method. A spot
check was done to evaluate whether the enumerators were collecting the data correctly was done.
Other sources of data included institutions involved in production, marketing, research and data
collection of Irish potatoes in Kenya. These were the Kenya Agricultural Research Institute (KARI),
Horticultural Crops Development Authority (HCDA) and German Technical Support (GTZ). The
national Consumer Price Index (CPI) statistics were obtained from the Kenya National Bureau of
Statistics (KNBS). However, rural CPI would have been preferred for this study but was not
available for the period under consideration.
3.4.1 Data Analysis
To evaluate the trends in Irish potato prices in Nyandarua district; both before and after the
implementation of market reforms policies in Kenya is achieved by computing descriptive statistics.
The mean and coefficient of variation (CV) for real Irish potato prices in Nyahururu market are
compared for the pre market reform and the post market reform periods. To assess the effects of
market reforms on Irish potato price volatility in Nyandarua district is achieved by estimating an
autoregressive conditional heteroscedasticity in mean (ARCH-M) regression for the monthly real

46
Irish potato prices from Nyahururu market over a 20 year period. The monthly data series were not
adjusted since the long term effects are assessed in this study in contrast to the short term effects
which would require adjustment. The data was analyzed using Stata computer package.
3.4.2. Area of study
This study was undertaken in Nyandarua district in the Central Province of Kenya (Figure 3.1).
The district covers an area of 3,528 square kilometers with an arable land of 2,011 square
kilometers. The district lies between 0008’N and 0050’S latitude and between 360 13’E and 360 24’ E
longitude (Jaetzold, 2006). The district is composed of six administrative divisions comprising of
North Kinangop, Kipipiri, Oljolorok, Olkalou, Ndaragua and South Kinangop divisions. It has an
oblong shape form that is quite long (Figure 3.1). To the North the district borders Laikipia, Nyeri
and Murang’a districts, while to the East it borders Maragua, Kiambu to the South and Nakuru to
the West (MoA, 2007).

47
Figure 3.1.Map of Nyandarua District, Kenya
Source: Kenya National Bureau of Statistics, 1999

48
Based on rainfall patterns, soils, temperatures and altitudes, the district is categorized into three
major land use areas. These comprise of high potential, low potential and medium potential areas.
The main food crops grown in the district include Irish potatoes, cabbages, carrots, peas and maize.
On the other hand, cash crops are cut-flowers, wheat and pyrethrum while the main livestock
enterprises are dairy, sheep, beef and poultry. However, Irish potato doubles up as the main staple
food and cash crop in Nyandarua district which is also leading in supply to the Nairobi markets
(MoA, 2007).
3.5. Unit Root Test
A common feature in time series variables is that their mean and variances may change over time.
This is in view of the fact that estimation of a standard regression model is based on the assumption
that the means and variances of the variables being tested are constant over time (Gujarati, 2005).
All variables whose means and variances change over time are known as nonstationary or unit root
variables (Dickey and Fuller, 1979). This implies that the current shocks have permanent effects on
the time series variables and thus the fluctuations are not transitory. The unit root test is used to
determine whether time series variables are affected by transitory or permanent shocks (Engle,
2003).
The test for stationarity is carried out because the stationarity or nonstationarity of a time series can
strongly influence its behaviour and properties. For example, persistence of shocks will be infinite
for nonstationary series. In addition, stationarity is useful to avoid spurious regression in variables
whose R2 in their regression is high despite the fact that the two variables are totally unrelated. If

49
variables in the regression model are nonstationary, then it can be proved that the standard
assumptions for asymptotic analysis will not be valid. Hence the ‘‘t-ratios’’ will not follow the t-
distribution, thus hypothesis tests about the regression parameters cannot be validly undertaken.
Unit root tests enable us to determine which model to be use in evaluating volatility because visual
methods are not adequate to ascertain this. When the time series is found to be non-stationary, an
ARCH model is suitable to assess volatility in the time series data base since it can model varying
mean and variance (Gujarati, 2005).
Stationarity implies that the mean, variance and covariance of a series are time invariant (Green,
2004). Alternatively, a variable is said to be nonstationary if it has no clear tendency to return to a
constant value or linear trend (Gujarati, 2005). A nonstationary data has a mean and variance that
are not constant (Green, 2004). Use of nonstationary or unit root variables in estimating regression
equations yields misleading inferences (Green, 2004). In effect, statistical inference associated with
stationary processes is no longer valid if the time series are indeed realizations of nonstationary
processes. When a unit root is identified, the data is differenced to determine the order of
integration. This is the number of times a nonstationary series has to be differenced to transform it
into a stationary series. A nonstationary series ‘‘Yt’’ is integrated of order ‘‘d’’ denoted ‘‘I (d)’’ if it
becomes stationary after being differenced ‘‘d’’ times (Gujarati, 2005). Where ‘‘Yt’’ is a
nonstationary time series dataset, ‘‘I’’ is the order of integration and ‘‘d’’ is the number of times
‘‘Yt’’ is differenced to make it stationary.

50
Several tests for unit roots have been proposed in the literature. The commonly used ones are the
Dickey-Fuller (DF) (1979) and Philips-Perron (PP) (1988) unit root tests. The Philips-Perron (1988)
is a more powerful test for unit roots than the Dickey-Fuller (1979) test in small samples and
follows a first order autoregression. In large samples the results of the PP and DF test statistic are
similar in most empirical evaluations. In this study both tests are used for comparison purposes in
testing for unit roots in the regression variables. The null hypothesis in the unit root test is that the
time series under consideration has a unit root, that is it is nonstationary while the alternative
hypothesis is that the time series is stationary (Green, 2004).
Following Dickey and Fuller (1979) the Augmented Dickey-Fuller (ADF) test is specified as:
tt
k
iittt eycyuy
1
11 (3.7)
Where yt is a random variable with non zero mean, u is a constant, t is time trend variable, et is the
error term with mean zero and a constant variance and the coefficient a is the test statistic. The ADF
test involves the estimation of α, which is referred to as the Dickey-Fuller or the tau test statistic. In
equation (3.7), we test the null hypothesis of α = 0 against the alternative hypothesis of α < 0.
Where Δ denotes the first difference, yt is the time series being tested, u, ß and c are constants while
k is the number of lags which are included in the model to ensure that the residuals et have zero
mean and constant variance (Dickey and Fuller, 1979). Schwartz Bayesian Criterion (SBC) and
Akaike Information Criterion (AIC) are used to determine the optimal lag length, k. If the null
hypothesis cannot be rejected, it implies that the time series is nonstationary at the level series and
therefore it requires taking first or higher order differencing of the level data to establish
stationarity.

51
The ADF test rejects the null hypothesis in favor of the alternative hypothesis when the estimated
tau test statistic is less than the critical value from the ADF table (Gujarati, 2005), implying that the
series are stationary. Alternatively, if the estimated tau test statistic is greater than the critical value
we do not reject the null hypothesis of a unit root thus showing that the series are nonstationary.
Phillips-Perron (PP) test is used to test for a unit root hypothesis on a data series. The PP test rejects
the null hypothesis in favor of the alternative hypothesis when the estimated PP statistic is less than
the critical value (Gujarati, 2005). Conversely, if the estimated PP statistic is greater than the critical
value we do not reject the null hypothesis of a unit root. A rejection of the null hypothesis in the PP
test implies that there is no unit root in the data series and hence the data is stationary and does not
need to be differenced.
3.6. Structural Break Test
When we use a regression model involving a time series data set, it may happen that there is a
structural change in the relationship between the regressand and the regressors. By structural
change, we mean that the coefficients in a regression model do not remain the same in separate
subsamples of data (Gujarati, 2005). A test for structural change is an econometric test to determine
whether the coefficients in a model are the same in separate subsamples. Often the subsamples come
from different time periods (Hansen, 2001). The structural change may be due to political and
economic factors like policy changes or to a variety of other causes. These factors can cause
relationships among economic variables to change over time.

52
A significant structural change that impacts on a commodities supply and demand invalidates the
use of a single set of time series data for planning purposes; such as mean price. Furthermore, the
results of standard test of stationarity such as Augmented Dickey-Fuller (ADF) test can be
influenced by structural breaks. When structural breaks are not properly accounted for in testing for
unit roots, incorrect conclusions regarding the stationarity of the data will likely be drawn (Green,
2004). The Chow test procedure splits the data into two sub periods and then estimates the
parameters for each sub period. The equality of the two sets of parameters is tested using the F
statistic (Hansen, 2001). In this study the Chow test is used to test for a structural break that is
assumed apriori to have occurred with the onset of the implementation of market reforms.
3.7. Chapter Summary
The chapter provides the analytical framework for analyzing price volatility used in this study. This
is followed by the specification of the ARCH-M empirical model used to estimate the effect of
market policy reforms on Irish potato price volatility in Nyandarua district. Then data types and
their sources and the study area which is Nyandarua district are described. Next the model
diagnostic unit root tests of the Augmented Dickey-Fuller (ADF) and Phillips-Peron (PP) are
described as a guide in determining the appropriateness of the autoregressive model for assessing
the Irish potato price volatility. Lastly, the structural change test is illustrated to determine whether
there was a structural change occurring at the onset of the implementation of the market reform
policies.

53
When the strengths and weaknesses of the various approaches for analyzing price volatility are
considered the ARCH-M model turns out to be the appropriate choice. This is further demonstrated
by the performance of this model in past studies in yielding robust estimates of the regression
coefficients for assessing volatility and its ability in the estimation of time varying risk premia. The
next chapter presents the empirical results realized from the statistical plus econometric estimation
of the variables under this study and discusses their economic implications for the Irish potato sub-
sector in Nyandarua district.

54
CHAPTER 4
RESULTS AND DISCUSSION
4.1. Introduction
This chapter presents the empirical results of the effect of market reforms on Irish potato price
volatility in Nyandarua district. First, the descriptive statistics for the variables used in the volatility
model are given. The discussion of the descriptive statistics is followed by the presentation of the
econometric results. The two equation ARCH-M estimates of real Irish potato prices and variance
are reported. The mean equation estimates the effect of value of production, sales and lagged prices
on the Irish potato prices during the post-reforms period. This equation also estimates the risk
premia over the same period. The variance equation estimates the effect of value of production,
sales and lagged prices on Irish potato price volatility during the post reforms period.
4.2. Descriptive Statistics
The pre-reform period represent the time from January 1986 to December 1995 which is the era
before the reforms. On the other hand the post-reform period correspond to the period from January
1996 to December 2005, the period after the reforms. The entire period stand for the time from
January 1986 to December 2005, the period spanning from the time before the reforms to the period
after the reforms. The two periods were selected because they mark the era before and after the
implementation of Structural Adjustment Programs (SAPs) which were initiated in Kenya in the
mid 1980’s.

55
The descriptive statistics of the variables used in the model to estimate Irish potato price volatility
are presented in Table 4.1.
Table 4.1. Descriptive Statistics of Variables used to Estimate Price Volatility
Pre-reform period Post-reform period Entire period
Variable Units Mean CVa (%) Mean CVa (%) Mean CVa (%)
Dependent variablePrice Ksh/t. 1010.13 64.04 5996.16 50.21 3503.15 94.51Independent variableValue of prodn. Milln. Ksh.12.76 70.78 89.38 62.66 13.20 66.78Sales Mt. 31.13 60.71 48.96 53.37 40.05 61.05Lagged price Ksh/t. 999.00 62.98 5949.14 50.36 3474.07 94.67
Note:a
The Coefficient of Variation (CV) is a ratio of the standard deviation to the mean.
Source: Author’s Computations
The ten year mean monthly wholesale real Irish potato price paid to farmers increased from an
average of 1010 Ksh/tone in the pre reform period (January 1986 to December 1995) to 5996
Ksh/tone in the post reform period (January 1996 to December 2005). This represents a 494 percent
increase in the wholesale price (Table 4.1). In order to determine whether the mean prices were
significantly different between the two periods, a two way t- test is done and the results are as
reported in Table 4.2.

56
Table 4.2.Two Way t Test on the Mean Prices
Period No. of observs. Mean Standard error Standard deviation
Pre reforms 120 1010.13 59.33 3010.54Post reforms 120 5996.16 274.82 649.91Entire period 240 3048.65 236.71 3667.04Difference -5895.03 281.15 -6451.23 -5338.81t value -20.97α 0.05Rejection region t < -1.96 or t > 1.96
Notes: α represents the level of significance and t is the test statistic.
Source: Author’s Computations
The test statistic falls in the rejection region and the null hypothesis is rejected at the 95 percent
level of significance. The implication is that Irish potatoes mean price before the implementation of
the market reform policies was significantly different from the mean price after the implementation
of the market reforms.
The increase in mean real Irish potato prices during the post-reforms period was as a result of low
supply growth as compared with the increase in demand. A rise in demand is attributed to an
increase in population, rapid urbanization and change in tastes and preferences in favor of an
increase in the consumption of Irish potatoes. The increased wholesale prices benefited the farmers
in Nyandarua district whose net returns increase with increasing prices. However, the rise in Irish
potato prices would hurt the consumers.
The variability of Irish potato prices as represented by the coefficient of variation (CV) declined
during the post reforms period from 64 percent to 50 percent (Table 4.1). The reduction of the
variability of the mean Irish potato wholesale price implies that Nyandarua farmers received more

57
stable prices and returns from their Irish potato sales during the post reform period in comparison
with the pre reform period. However, this does not rule out volatility during the post-reforms period
as indicated by the marked difference in the mean price during the two periods. The variability of
the mean wholesale price was higher during the pre reforms period than in the post reforms period
as shown by the coefficient of variation.
The increase in Irish potato prices and decline in the price variability show that Nyandarua farmers
received higher and stable revenues from Irish potatoes during the post-reforms period as compared
with the pre- reforms period. Hence, the Irish potato farmers were better off during the post market
reforms period in comparison with the pre market reform period. The implication is that the high
and relatively stable Irish potato prices during the reforms period served as an incentive for
Nyandarua district farmers to increase production. However, the high and stable prices were not
favorable to the consumers in the post reforms period as compared to the pre market reforms period.
Thus the Irish potato consumers were better of during the pre market reforms period as compared to
the post market reforms era as indicated by the increase in the mean price by 494 percent and
reduction in the coefficient of variation from 64 percent to 50 percent (Tables 4.1).
The decline in the variability of the mean monthly Irish potato price from 64 percent to 50 percent
(Table 4.1) during the post reforms period can be explained by the reduced variability in the value
of production from 70 percent to 62 percent (Table 4.1). Thus since the fluctuations in demand for
Irish potatoes in the Kenyan markets is low, the source of price variability lies in fluctuation in
value of production. In essence, value of production fluctuations arose out of variation in weather,
pest and diseases and farm management practices.

58
Figure 4.1.Monthly Real Irish Potato Prices (Ksh/Tone) Trend (1986-2005)
Source: Author’s Computations
Figure 4.1 shows the mean real monthly wholesale Irish potato prices from January 1986 to
December 2005. The Irish potato prices are highly variable in Nyandarua district and they fluctuate
in up and down fashion with an increasing trend (Figure 4.1). The up and down fluctuations are due
0
4500
9000
13500
18000
22500
PriceKsh/Ton.
Jan.1986 Jan.1991 Jan.1996 Jan. 2001Dec.2005
Time (Month/Year)

59
to fluctuations of supply occasioned by changes in weather conditions, pest and disease incidences;
and husbandry practices against a relatively stable demand for Irish potatoes in the district. Irish
potato has a stable demand since it is a food item which according to economic theory has an
inelastic demand. There are differences in the price fluctuations between the months and the years
with less variability observed in the period after the reforms. This can be depicted the value of
standard deviation of the mean Irish potato prices of 3010.54 during the pre reforms period and
646.91 in the post reforms period (Table 4.2). The movements in real Irish potato prices show an
increase in the mean price during the post liberalization period. A likely cause of these price
fluctuations is due to the fact that demand for Irish potatoes in Nyandarua district is relatively
stable, whereas supply fluctuates due to weather conditions, pests, diseases and farm management
practices.
The strong seasonality of supply is aggravated by the fact that there are only a few storage facilities
available to the farmers and traders. This leaves the supply dependent on the natural growth pattern.
A notable feature is the remarkable price increase during 1999, when potato prices more than tripled
(Figure 4.1). This was because of a poor harvest due to heavy El Ni n~ o rains which resulted to a
increase in Irish potato Blight and also resulted to rotting of the potatoes leading to a shortage and
hence a sharp increase in prices.
There was also a price increase in the years 1994 and 2004 when Nyandarua district received low
rainfall levels leading to a decline in Irish potato value of production due to water stress and high
incidence of pests especially the tuber moth as illustrated later in Figures 4.3 and 4.2 respectively.
The marked fluctuations around an upward trend as shown in Figure 4.1 are an indicator of

60
nonstationarity of the mean real monthly wholesale Irish potato prices. However, to confirm the
existence of nonstationarity trends, a unit root test is performed.
The results show that the mean monthly Irish potato value of production increased by 600 percent
from 12.76 Million Ksh. per month during the pre reforms period to 89.38 Million Ksh.per month in
the post reforms period (Table 4.1). However, the variability of Irish potato value of production
reduced from 71 percent to 63 percent over the same period (Table 4.1).
As stated above the decline in value of production variability during the post- reform period lead to
a reduction of price variability during the same period. The monthly mean Irish potato value of
production for the pre- reforms period was lower than for the post reforms period. As depicted by
the CV (Table 4.1), variability of value of production for the pre reforms was higher than during the
post reforms. The high mean Irish potato value of production and low variability during the reforms
period imply that the reforms lead to an increase in the overall potato value of production in
Nyandarua district.

61
0
45
20000
405
Value ofProduction
720
1125
(Milln.Ksh) 180
180
Jan.1986 Jan.1991 Jan.1996 Jan.2001 Dec.2005
Time (Month/ Year)
Figure 4.2. Irish Potato Value of production (Milln. Ksh.) Trend for Nyandarua District
(1986-2005
Source: Author’s Computations
The mean monthly Irish potato value of production increased during the post reforms period due to
high and less variable prices (Figure 4.2). The farmers thus realized high and stable incomes from
their Irish potato enterprises in this period. Consequently, this served as an incentive for farmers to
increase production of Irish potato during the post reforms era (Appendix 4). Comparing figure 4.2

62
and 4.3 shows that the Irish potato value of production follows the rainfall pattern, with the value
being high during the years when the rainfall levels are high. On the other hand, the value of
production declines during the years when the district receives low rainfall levels. The increase in
Irish potato value of production after the market reforms can also be attributed to favorable weather
conditions as a result of good rains received during this period as illustrated in Appendix 3 and Fig.
4.3.
Figure 4.3. Monthly Rainfall Trend (Mm) for Nyandarua District (1986-2005)
Source: Author’s Computations
0
200
400
600
800
Rainfall (Mm/Month)
Jan.1986 Jan.1991 Jan.1996 Jan.2001 Dec.2005
Time (Month/ Year)

63
The Nyandarua district’s monthly Irish potato value of production pattern for the last twenty years is
as depicted by Figure 4.2. The potato value of production shows high variability between months
and years. The value of production figures exhibit up and down trends with no visually distinct
pattern. The variability arise out of availability of rainfall (Figure 4.3) and the season, since most of
the farmers grow the crop using rain fed conditions since they have not invested in irrigation
infrastructure and they also sell their produce immediately after harvest due to lack of proper
storage structures and immediate cash needs. The rainfall is highly variable in Nyandarua district as
evident in Figure 4.3. When the amount of rainfall is favorable (Figure 4.3) and also during the
harvesting season, the value of production is recorded to be high (Figure 4.2).
Another key factor explaining the fluctuation of the potato value of production is the price, with the
farmers responding to low prices by reducing production and high prices by increasing production.
The value of production trends lead to a high degree of variability in supply which leads to price
volatility. In addition, high variability in Irish potato value of production is associated with
problems of adverse weather conditions, incidence of pests and diseases, low soil fertility and lack
of funds to acquire farm inputs especially fertilizers and certified seed potato.
The mean monthly Irish potato sales volumes in Nyahururu market were higher during the post
reforms period than in the pre reforms period (Table 4.1). The mean sales volumes increased from
31 metric tones during the pre reforms period to 49 metric tones during the post reforms period, an
increase of 57 percent. This increase in the sales volume can be explained by an increase in the
supply and demand of Irish potatoes to the market. However, variability of the sales volume as

64
represented by the CV, was lower during the post reforms period compared to the pre reforms
period (Table 4.1).
Figure 4.4.Monthly Irish Potato Sales (Metric tones) Trend in Nyahururu Market (1986-2005)
Source: Author’s Computations
The trend of monthly Irish potato sales in Nyahururu market for the twenty year period is as
depicted in Figure 4.4. The sales volumes show high variability between months and can be
explained by a variability in value of production. In Nyandarua district, the Irish potato value of
0
500
1000
1500
Sales
(Metric tones)
Jan.1986 Jan. 1991 Jan. 1996 Jan. 2001 Dec.2005
Time (Month/Year)

65
production follows the rainfall pattern which leads to the seasonality of supply. However, Irish
potatoes are sold throughout the year in Nyahururu market (Figure 4.4). In view of the fact that the
crop has a fairly stable demand in the Kenyan markets, seasonality of supply may lead to price
volatility due to demand and supply disequilibrium. This variability in sales volume was as a result
of variability in the quantities of Irish potato supplied and demanded in the market. The decreased
variability of the sales volumes during the post reforms period implies a reduction in the supply and
demand variability over this period as compared to the pre reforms period.
In summary, the mean prices, value of production and sales volume increased but their variability
declined. These findings imply that the implementation of market reform policies by the Kenyan
government lead to the realization of high and stable incomes by the Irish potato farmers. This leads
to the conclusion that the potato farmers in Nyandarua district are better off with the implementation
of market reform policies than without them.
4.3. Unit Root Test Results
The Augmented Dickey-Duller (ADF) and Phillips-Perron (PP) methods were used to test for the
existence or non-existence of unit roots in the variables used in estimating the Irish potato price
volatility model and the results of the tests are as presented in Table 4.3.

66
Table 4.3. Unit Root Tests for Irish Potato Mean Prices (Ksh/Tone), Value of production
(Milln. Ksh) and Sales (Metric tones)
Series Level series First differences I (d)
ADF PP Lags ADF PP
Dependent variableReal price (Ksh/tone) -2 .416 -2 .416 1 -6.236 c -7.574c I (1)Independent variablesValue of prodn. (Milln.Ksh)-2.538 -2. 538 1 -4.521 c -5.613 c I (1)Sales (Metric tones) -2.574 -2.574 1 -5.487 c -4.569 c I (1)5% Critical values -2.60 -2.60 -3.50 -3.50
Note:c
Denotes rejection of the null hypothesis of a unit root at 5 percent level of significance (MacKinnon, 1991).
Source: Author’s Computations
The null hypothesis of nonstationaity or unit root is accepted if the absolute values of the computed
ADF and PP statistics exceed the absolute critical values at 5 percent level of significance. The ADF
and PP test critical values at 5 percent level of significance are given as -2.6 and -3.5 (Gujarati,
2005) at the level and first difference series (Table 4.3). As can be seen from Table 4.3 the absolute
value of the computed test statistic for the real Irish potato price was -2.416 for the level series. In
the first difference of the price series the ADF and PP statistics were calculated as -6.236 and -7.574
respectively (Table 4.3). The absolute value of the computed test statistic for the real price level
series |-2.416| is less than the critical absolute value |-2.6 | at 5 percent level of significance in both
the ADF and PP test. However, the absolute values of the computed test statistics for the real price
first difference series (| -6.236| and |-7.574|) are greater than the critical absolute value |-3.50| at 5
percent level of significance in both the ADF and PP test.
These results reveal that the price series are nonstationary and are integrated of order one, that is,
they are I (1). When similar comparisons of the computed and the given ADF and PP test statistics

67
are done for value of production and sales data series, the results show that these series are also
nonstationary (Table 4.2 ). From the results of the unit root tests, the conclusion is that the data
series used in the volatility model in this study are I (1) in the level series and the first differences
series are I (0).
The nonstationarity of the level series of the real Irish potato prices, value of production and sales
imply that the means and variances of these variables change over time. These nonstationary
variables can separate from each other over time and lose their relationship. Regressions carried out
on nonstationary variables often yield false results implying that the estimates are invalid and have
no economic value meaning; hence the need to test for unit roots to determine the right choice of
model to apply (Gujarati, 2005). Hence given that the level series are I (1) and the first difference
are I (0), justifies the use the ARCH-M econometric model which is used to model varying mean
and variance, in the evaluation of Irish potato price volatility in this study.
4.4. Structural Break Test Results
A regression using the entire period assumes there is no difference between the two time periods
and therefore estimates the relationship between Irish potato real prices and time, value of
production, sales, season, and lagged real price for the entire time period consisting of 240
observations. This implies that, this regression assumes that the intercept as well as the slope
coefficient remains the same over the entire period; that is there is no structural break.

68
Regressions using the pre-reform and post-reform periods assume that the two periods are different;
that is the intercept and the slope coefficients are different. This assumes the presence of a structural
break occurring at the onset of the reforms. We apply the Chow test to ascertain whether there is a
structural break and hence the same regression model would not apply to both pre-reform and post-
reform periods. The null hypothesis is that there is no structural change and the alternative
hypothesis is that there is a structural change occurring at the onset of market policies.
Thus using the Chow test, the calculated F is 0.380 while the critical F is 2.21 at 5 percent level of
significance (Gujarati, 2005).The computed F value does not exceed the critical F value at 5 percent
level of significance. Therefore we fail to reject the null hypothesis of no structural change. The
conclusion is that there is no structural change in the relationship between the mean Irish potato
monthly wholesale prices and the time trend, sales, value of production and season. The values of
the parameter of the model remain the same throughout the entire twenty year period. Therefore
using the data for entire period to estimate volatility of the Irish potato mean monthly wholesale
prices is justified.
4.5. Factors Influencing Irish Potato Prices
In Table 4.4 the autoregressive conditional heteroscedasticity in mean regression estimates for the
mean equation are presented.

69
Table 4.4. Autoregressive Conditional Heteroscedasticity in Mean Estimates of Mean Irish
Potato Prices
Dependent Variable: Monthly Mean Irish Potato Prices (Ksh/Tone) from January 1986-
December 2005(Pt)
Independent variable Estimation coefficient Standard error ρ
Constant ( 0 ) -122.71 93.11 0.19
Lagged Price (Pt-1) 0.96a 0.01 0.00Value of production (PR) -0.01a 0.00 0.00Time (T) 4.15 a 0.67 0.00Reforms(R) 164.31b 65.93 0.01Season (SD) -186.21a 33.68 0.00Sales (S) -3.91 1.75 0.32Risk term ( ) -0.00005a 7.60e-06 0.00n 240AIC 3933.04BIC 3964.36Durbin Watson d statistic 1.71
Notes: a Significance at 1percent level, b significance at 5 percent level while n, AIC, BIC denotes the number ofobservations, Akaike Information Criterion and Bayesian Criterion.
Source: Author’s Computations
The lagged price of Irish potatoes (Pt-1) coefficient is positive and significant at 1 percent level of
significance (Table 4.4). This implies that the lagged price of Irish potatoes (Pt-1) has a positive and
significant influence on price at the 1 percent level of significance. The positive and significant Irish
potato lagged price coefficient indicates that the lagged price is a significant factor that influences
the mean price. Thus, the current mean price at any one given time period highly depends on the
price in the preceding period. This finding shows that the preceding period price contributes 96 per
cent in the prediction of the prevailing price at any given time.

70
The value of production (PR) of Irish potatoes coefficient is negative and significant at 1 percent
level of significance (Table 4.4). This result reveals that the value of production of Irish potatoes has
a negative and significant effect on prices at 1 percent level of significance. This finding indicates
that a 1 percent increase in value of production leads to a 0.01 percent reduction in Irish potato
price. Thus low equilibrium prices clear the market when production is high and high prices clear
the market when production is low. Economically, the implication is that Nyandarua Irish potato
farmers receive low prices during peak production periods. In order to stabilize the prices received
between the glut and scarcity periods there is need to have strategies to manage Irish potato supplies
to the market to reduce the demand and supply disequilibrium. This will enable the farmers realize
more stable incomes from their Irish potato enterprises.
The reforms (R) coefficient is positive and significant at 5 percent level of significance (Table 4.4).
This result reveals that the reforms had a positive and significant effect on prices at 5 percent level
of significance. A positive and significant coefficient for the market reforms dummy variable (R),
imply a higher mean price during the reforms period. This finding indicates that the implementation
of market reform policies leads to a 164 percent increase in the mean Irish potato price. This result
confirms the preliminary indication from descriptive statistics that during the reforms period there
was a rise in the mean real Irish potato prices.
The season coefficient (SD) was negative and significant at the 1 percent level (Table 4.4). This
indicates that mean Irish potato prices are depressed during the harvesting season. The mean Irish
potato prices are low during the harvesting months of January, May, June, August, September,
November and December. The large season coefficient of -186 indicates that the mean Irish potato

71
prices are highly dependent on the season. The major factor influencing Irish potato prices in
Nyandarua district is the season. This occurs because Irish potato supply follows the seasons while
the demand is inelastic. Thus during the harvesting months the supply is high leading to lowering of
prices while in the other periods the supply is low leading to price increase because few farmers
store their Irish potatoes.
The sales volume (S) has the expected negative sign but is insignificant in determining the mean
monthly Irish potato price in Nyahururu market (Table 4.4). A negative sign of the sales volume is
an implication that an increase in supply results in a decrease in price. From Table 4.4, it can be
observed that I percent increase in the Irish potato sales volume lead to a 4 percent reduction in the
mean price. The sales volume is insignificant in determining the mean price because of the fact that
most of the Irish potatoes produced in Nyandarua district are collected from the farm gate by traders
and marketed through major towns such as Nairobi, Murang’a, Machakos, Nakuru, Nyeri and
Mombasa. The reason for this is because Nyahururu market is not easily accessible from most parts
of the district due to poor infrastructure and is also not centrally located but is situated at the
Northern end of the district neighboring Laikipia district as shown in the map of the district (Figure
3.1). The market is also limited in space and lacks in modern infrastructure facilities like storage.
The risk term denoted as estimates the relative risk premia (Table 4.4). The estimate reflects a
risk premium with respect to the conditional standard deviation. As expected apriori, the estimation
coefficient of the risk term ( ) is negative and significant at 1 percent level of significance (Table
4.4). A negative and significant risk term ( )coefficient means that the mark up for an existing Irish
potato firm to cover price risks decreased as a result of reforms. The reforms lead to a decline of

72
investments and market involvement costs for the traders. A negative risk premia found in this study
implies that the cost of carrying out Irish potato business declined during the post reforms period in
comparison with the pre reforms period.
4.6. Conditional Variance of Irish Potato Prices
The Table 4.5 presents the results of the econometric model estimates for the Irish potato price
variance, which represents price volatility.
Table 4.5. Autoregressive Conditional Heteroscedasticity in Mean Estimates of the Irish
Potato Price Volatility
Dependent Variable: Conditional Variance (ht)
Independent variable Estimation coefficient Standard error ρ
Constant ( 0 ) 374.14a 80.07 0.00
Lagged Price (Pt-1) 0.91a 0.01 0.00Value of production (PR) -0.01a 0.001 0.00Time (T) 3.62a 0.581 0.00Reforms(R) -241.55a 63.18 0.00Season (SD) -165.09a 36.59 0.00Sales (S) -2.88 2.05 0. 61ARCH term ( 1 ) 3.31a 0.40 0.00n 240AIC 3910.21BIC 3945.01Durbin Watson statistic 1.81
Notes: a significance at 1percent level while n, AIC, BIC denotes the number of observations, Akaike InformationCriterion and Bayesian Criterion..Source: Author’s Computation
73
The coefficient of the lagged Irish potato price (Pt-1) is positive and significant at 1 percent level
(Table 4.5). This result reveals that the lagged Irish potato price (Pt-1) positively and significantly
influenced the conditional variance (ht) of Irish potato prices at 1 percent level. A 1 percent increase
in lagged price results to a 0.91 percent rise in Irish potato price volatility. This implies that the
volatility of Irish potato prices in one given month is related to the prices prevailing in the preceding
period.
The positive and significant lagged Irish potato price coefficient implies that the price volatility
show a high level of autoregression. This means that the mean Irish potato price in the current
month depends, among other things, on the mean Irish potato price of the previous month. This
occurs due to market conditions which are slow in creating supply and demand equilibrium. It is
therefore necessary to improve the Irish potato markets to make them more responsive in correcting
supply and demand equilibrium with the view of reducing the level of price volatility.
The coefficient of market reforms (R) is negative and significant at 1 percent level of significance
(Table 4.5). According to this result, the market reforms negatively and significantly influenced the
conditional variance (ht) of Irish potato prices at 1 percent level. This means that the mean Irish
potato wholesale prices indicated lower volatility during the reforms period. Therefore, the
implementation of the market reform policies by the government resulted to a 241 percent reduction
in Irish potato price volatility.
The implementation of market reform policies by the Kenya government thus lead to a stabilization
of Irish potato prices in Nyandarua district. Subsequently, the second hypothesis set out in chapter 1

74
of this study is therefore rejected; that is reforms have no effect on Irish potato price volatility. The
conclusion is that, reforms lead to a decrease in Irish potato price volatility in Nyandarua district.
Indeed, the results portray the volatility of Irish potato prices tend to continue over an extended
period as shown by the positive and significant lagged variance ARCH term ( 1 ) at 1 percent level
of significance.
The lower Irish potato price volatility during the reforms period implies that the reforms lead to an
improvement of household welfare for the Irish potato farmers through stable incomes. The
implication is that with the implementation of market policy reforms, producers required less
compensation for bearing Irish potato production risk induced by price volatility. Subsequently,
reduced price volatility during the market reforms period served as an incentive for the farmers to
increase Irish potato production.
The coefficient of the seasonal dummy (SD) is negative and significant at 1 percent level of
significance (Table 4.5). This result reveals that seasonality of Irish potato production negatively
and significantly influenced the conditional variance (ht) of Irish potato prices at 1 percent level.
The economic implication is that the Irish potato price volatility declined by 165 percent during the
harvesting season when the rainfall levels are low. This indicates that seasonality of Irish potato
production is a key factor influencing price volatility.
The volatility of Irish potato prices is thus weather related with the volatility of prices declining
during the main harvesting period when prices are low. This is an indication that Nyandarua district
Irish potato farmers rarely store their produce after harvest for the purposes of selling during the
75
short supply season. With these results the first hypothesis set out in this study is rejected, that is
there is no relationship between Irish potato price volatility and the season. This leads to the
conclusion that seasonality affects the Irish potato price volatility, with the level of volatility
becoming low during the harvesting season. Further, it implies that there is poor market information
dissemination between Nyahururu market and other Irish potato urban and rural markets.
If there was good market information flow between Nyahururu market and other markets, the
observed price volatility could not have occurred due to efficient price transmission mechanism.
This would be so in view of the fact that Irish potato production patterns vary between various
producing regions within the country. Therefore an Irish potato regulation system needs to be put in
place in order to reduce the Irish potato price volatility in Nyandarua district. This would be to the
benefit of producers, traders and ultimately the consumers as it would enable them manage the risk
associated with price volatility.
The sales volume (S) coefficient was negative and insignificant in the conditional variance equation
model (Table 4.5). This implies that the Irish potato sales volume in Nyahururu market did not
significantly affect the price volatility in Nyandarua district. The explanation for this insignificant
effect of sales volume on price volatility is the fact that Nyahururu market handles only a limited
quantity of the Irish potatoes produced in Nyandarua district since most of the potatoes are sold at
the farm level to wholesale traders who deliver the produce to markets for sale in rural and urban
market outlets outside the district.

76
The coefficient of value of production (PR) is negative and significant at 1 percent level (Table 4.5).
This result reveals that value of production negatively and significantly influenced the conditional
variance (ht) of Irish potato prices at 1 percent level. This implies that Irish potato value of
production significantly influences price volatility with a 1 percent increase in value of production
leading to a 0.01 reduction in Irish potato price volatility. This occurs because an increase in
production leads to an improvement of supply and demand equilibrium thereby stabilizing the
prices. The implication here is that Irish potato producers receive relatively stable prices and
consequently incomes during the period when production is high. Conversely, the farmers receive
relatively unstable prices and hence incomes during the period when production is low.
4.7. Chapter Summary
This chapter reports on the descriptive statistics of estimates of the mean and the variability of the
Irish potato prices, value of production, sales and lagged prices in Nyandarua district during the pre
and post reforms periods. For each of the variables, a twenty year time series trend is constructed
and discussed. Then, the diagnostic test to confirm model adequacy is performed. This is followed
by a report on the two-equation ARCH-M model estimation of the conditional means and variances
of the monthly real Irish potato prices over a twenty year period.
The first equation ARCH-M estimation coefficients show how Irish potato lagged price, value of
production, time, reforms, season and sales influence the mean wholesale real prices over the post
reforms era. This equation also estimates the risk premia which represents a mark up to cater for
Irish potato price risk during the post reforms period. Lastly, the second ARCH-M estimation

77
coefficients which represent the Irish potato price variance or volatility are reported. From the
findings in this chapter, the conclusion is that the implementations of market reform policies lead to
a realization of high and less volatile Irish potato prices in Nyandarua district. The next chapter
presents the main conclusions and policy recommendations drawn from the results reported in the
current chapter.

78
CHAPTER 5
CONCLUSIONS AND POLICY RECOMMENDATIONS
5.1. Introduction
The purpose of this study was to examine the effects of the implementation of market reform
policies by the Kenyan government from the early 1990’s on Irish potato price volatility in
Nyandarua district. The reform policies were designed to reduce or eliminate the bias against
agriculture and open the sector to market forces. The study had two specific objectives. The first one
was to evaluate the trends in Irish potato prices in Nyandarua district while the second was to assess
the effects of market policy reforms on Irish potato price volatility in the district.
In order to evaluate the trends in Irish potato prices, descriptive statistics comprising of the mean
and the coefficient of variation were computed. The results of the descriptive statistics were
compared for the pre reform and post reform periods. The period 1986-1995 and 1996-2005
represented the pre reform and post reform periods respectively. The effects of reforms on Irish
potato price volatility in Nyandarua district were assessed by estimating an autoregressive
conditional heteroscedasticity in mean model for the monthly real Irish potato prices from
Nyahururu market over a twenty year period. The results were then compared for the periods before
and after the market policy reforms.
5.2. Summary of Major Conclusions
The results from the descriptive statistics show that the mean monthly wholesale Irish potato price
in Nyandarua district increased after the implementation of market policy reforms. In the same

79
period, the variability of the mean wholesale Irish potato price declined. The increase in the mean
monthly wholesale Irish potato price coupled with a decrease in the price variability imply that
Nyandarua district farmers received higher and stable incomes from their Irish potato sales during
the post reforms period as compared with the pre reforms period.
The mean monthly Irish potato value of production increased while the variability of value of
production declined during the post reforms period. This was as a result of high and less variable
prices which served as an incentive for the farmers to increase production. The economic
implication is that the increase in Irish potato value of production during the post market reforms
period had a positive effect on producer prices leading to the farmers’ realization of high and stable
incomes from their Irish potato enterprises. A reduction in variability of value of production
occurred as a result of stable Irish potato prices as indicated by a reduction of the coefficient of
variation (CV) of the prices during the reforms period. The implementations of the reforms lead to
an increase in Irish potato value of production of 76.62 Million Ksh. from the pre market policy
reforms period to the post market reforms period and an 8 percent reduction in price variability.
The mean monthly Irish potato sales volumes were higher by 57 percent during the post reforms
period as compared to the pre reforms period. The increase in the sales volume during the post
liberalization period was due to an increase in supply as a result of increased production to meet the
shortfall in demand. On the other hand, variability in the sales volume reduced during the post
reforms period in comparison with the pre reforms period. The lowering of variability in sales
volumes was due to more stable supply and demand conditions during the post reforms era as a
result of boost in production thus reducing the supply and demand disequilibrium.

80
The trend of the Irish potato sales volumes show that a relatively high supply is realized during the
main harvesting months. In addition, this trend indicates that the produce is sold throughout the year
with monthly variability in sales volumes depending on supply. Since this food crop has a relatively
stable demand in the domestic market, the monthly variability in supply lead to price volatility due
to supply and demand disequilibrium.
To surmise, the results from the descriptive statistics show that Irish potato prices, value of
production and sales increased by 494 percent, 18 percent and 57 percent respectively in the post
reforms period. On the other hand, the variability of the prices, value of production and sales
decreased by 14 percent, 8 percent and 7 percent respectively during the post market reforms period.
This implies that the Irish potato farmers realized higher and stable incomes from their Irish potato
enterprises during the post reforms era. Therefore the implementations of market reform policies
made the Irish potato farmers in Nyandarua district better off than they were before these reforms.
The results of the econometric model estimates of the mean equation indicate that the lagged price
and the market reforms dummy were positive and significant at 1 percent level while value of
production, seasonal dummy and the risk premia were negative and significant at 1 percent level.
However, the sales volume was negative and not significant. This implies that the lagged price,
implementation of market reforms, value of production and seasonality were significant in
determining the Irish potato mean price while the sales volumes did not significantly influence the
mean price.

81
The lagged price variable had the expected positive sign in the mean equation model implying that
the Irish potato price in the current period is highly dependent on the price in the previous period.
Thus the price this season determines the quantity to be produced in the next season since farmers
respond to previous price in making their production decisions. In effect, at any point in time the
farmers’ expectation of the future price is a function of past realizations. Also, the market reforms
dummy had a positive sign as expected indicating that market reforms lead to higher mean Irish
potato prices as a result of increased demand arising out of increase in population, urbanization and
change of tastes and preferences in favor of Irish potato consumption. The empirical evidence
suggests that the Irish potato mean price increased by 164 percent due to the implementation of
market policy reforms.
The Irish potato value of production had the expected negative sign indicating that increase in
production led to a rise in supply leading to a price decline. The results show that a 1 percent
increase in value of production is associated with a 0.01 percent reduction in the mean Irish potato
price. This occurs because Irish potato demand is relatively stable and thus an increase in supply
leads to price decline when the supply exceeds the demand. As expected, the risk premia had a
negative sign implying that market reforms led to a decline in the cost of carrying out Irish potato
business. The implementation market reform policies lead to a reduction of the cost of transacting
Irish potato business by 10-5. Thus, the Irish potato traders were better off with the implementation
of the market reforms policies than before.
The sales volume in Nyahururu market had the expected negative sign but had no significant effect
in the determination of the mean Irish potato price. This was the case because the market handles

82
only a small proportion of the Irish potatoes produced in Nyandarua district due to its limited space
and non-strategic location. A big proportion of Irish potatoes produced in Nyandarua district is
traded in markets outside the district after it is sold to the transporters by the farmers at the farm
gate level.
On the other hand, the econometric model estimates of the conditional variance equation show that
the lagged price was positive and significant at 1 percent level while value of production, the
seasonal and market reforms dummies were negative and significant. Nevertheless, the sales volume
was positive and not significant. The lagged price had the expected positive sign showing that the
Irish potato price volatility in a given month is related to the prices in the previous period. A
negative coefficient in the value of production variable as expected implies that an increase in value
of production led to a reduction of Irish potato price volatility. Thus Irish potato producers realized
more stable prices and therefore incomes when value of production increased during the post market
reforms period as compared to the period before these reforms.
The seasonal dummy variable had the expected negative sign in the conditional variance equation
model indicating that seasonality of Irish potato production influences the price volatility with the
volatility declining during the harvesting period when prices are depressed. These Irish potato prices
decline in the harvesting season due to distress sales by the producers to meet their cash liquidity
needs, lack of appropriate storage facilities and poor market arbitrage between Nyahururu and other
urban and rural markets.
83
The sales volume had the expected positive sign but was not significant in the conditional variance
equation model implying that the Irish potato sales volume did not significantly affect the price
volatility. This was the scenario because Nyahururu market handles only a limited quantity of the
Irish potatoes produced in Nyandarua district since most of it is marketed through other rural and
urban market outlets outside the district.
The market reforms dummy was significant and had the expected negative sign in the conditional
variance econometric model. The economic implication of this is that the market policy reforms
implemented by the Kenyan government led to a decline in Irish potato price volatility. The
hypothesis tested in this study, that market reforms had no effect on Irish potato price volatility is
therefore rejected. Thus the implementation of agricultural market policy reforms was favorable to
the Irish potato producers.
There are five conclusions that can be drawn from this study. First, the mean Irish potato price at
any one given month is dependent on the previous month price. Therefore the farmers, traders,
processors and consumers can use the expected prices for decision making in their operations.
Secondly, the mean prices are negatively correlated with value of production. This result implies
that the Irish potato farmers receive low prices when the production is high. Thus, for the farmers to
realize stable prices and hence incomes strategies to manage Irish potato supplies to the market are
needed.
Thirdly, the Irish potato monthly real prices were high after the reforms. The increase in the mean
price was as a result of the slow growth in supply as compared to the increase in demand. The

84
supply increased as a result of increased production while the demand rose due to increase in
population, rapid urbanization and change in tastes and preferences. Fourth, the mean Irish potato
prices are depressed during the harvesting months when supply is much higher than the demand.
This occurs since there is low on-farm and off-farm storage because liquidity constraints force the
farmers to sell most of their produce after harvest. Lastly, the risk premia is found to be negative
thus implying that the cost of doing Irish potato business decreased after the reforms.
In addition, three conclusions can be drawn from the autoregressive econometric model estimates of
the real Irish potato price variance. Firstly, the mean Irish potato prices indicated lower volatility
during the reforms period. Indeed, reforms lead to a decrease in Irish potato price volatility as a
result of increased production thus bridging the gap between production and demand. The lower
price volatility served as an incentive for the Irish potato farmers to increase production during the
reforms period.
Secondly, the seasonality of Irish potato production is found to be a key factor influencing the
volatility of the mean price. The Irish potato price volatility is weather dependent, with the volatility
decreasing during the harvesting months when the rainfall is low. An Irish potato regulation
mechanism therefore needs to be put in place in order for the traders, producers and consumers to be
able to manage the risk associated with high price volatility.
Lastly, the Irish potato value of production is found to significantly influence the price volatility.
An increase in production results to a reduction of price volatility because of the improvement in
supply and demand equilibrium. The implication is that an increase in value of production lead to a

85
reduction in uncertainty and risk associated with price volatility. The farmers therefore realized
more stable incomes with an increase in value of production.
The Irish potato price volatility is found to decline during the period when value of production is
high. In order to reduce high price volatility there is need to have a sustained increase in value of
production to meet the increase in demand. The value of production can be increased through the
farmers’ adoption of appropriate technical innovations from research that lead to increased output
per unit area. This can be realized through increased investment by the government and the private
sector in research and extension activities. An increased adoption of relevant technological
innovations would lead to a rise in the average yield from the current level of 7.5 tons per hectare.
This increase in yields would ultimately translate into a rise in national output to meet the nation
demand of 1.2 million metric tons per year and export needs. Another way of increasing Irish
potato value of production is through expansion of the area under the crop by opening up of new
land or by replacing other less profitable farm enterprises with Irish potatoes.
5.3. Policy Recommendations
This study found that price volatility in the Irish potato sector is as a result of factors having effects
on supply and demand. Since the demand of Irish potatoes is relatively inelastic, the price volatility
can mainly be stabilized by controlling the supply to the market through storage during periods of
glut. At the farm level the farmers can achieve this by enhancing on-farm storage through use of
improved storage structures to prevent post harvest losses. At the market level, the supply can be
controlled through cold storage that needs to be built by the Local Government. This calls for

86
improvement in the market infrastructure through provision of adequate storage space and
installation of cold stores in the Irish potato markets.
The variability in value of production was found to be a major contributor to Irish potato price
volatility. This is because production follows the natural rainfall pattern. Further, the results indicate
that Irish potato price volatility declined during the reforms period. This implies that during the
reforms era the farmers realized stable incomes which can stimulate production. The variability in
value of production which affects supply of Irish potatoes to the market can be controlled through
improvement in production by utilization of irrigation techniques, since with high value of
production the volatility was observed to decline. Further, if the production is increased it will be
possible to meet the national demand and with storage the supply to the market can be controlled
between the glut and scarcity periods thus leading to price stability.
Another result is that seasonality influences price volatility, with the volatility decreasing during the
harvesting months. This affects the farmers’ decision making since they are uncertain of the price to
expect in the forthcoming period. To reduce this uncertainty Irish potato virtual commodity
exchange markets need to be improved. By use of the exchange markets producers and traders will
be brought together thereby ensuring efficient price information transmission to all the market
participants thus reducing uncertainty in prices.
Overall, this study indicates that the implementation of market reform policies favored the Irish
potato producers but made the consumers worse off. Thus market reform policies need to be
considered together with complimentary measures to cushion consumers from price shocks. To

87
achieve this, the Kenyan government and other stakeholders in the Irish potato sub sector need to
institute measures to improve production, storage and marketing.
5.4. Contribution of this Study
This study utilizes the autoregressive conditional heteroscedasticity in mean econometric model to
analyze the effects of reforms on the mean and volatility of agricultural commodity prices, which
can be applied for price volatility analysis in other crops and countries. The empirical contribution
of the current study is that it provides robust estimates of the mean and volatility of Irish potato
prices both before and after the implementation of the market reform policies in Kenya that are
useful for policy analysts.
This is the first study in Kenya that assesses the effects of market policy reforms on Irish potato
price volatility. Further, the study is the first of its kind to employ recent developments in time
series econometrics analysis and specifically the autoregressive conditional heteroscedasticity in
mean model to analyze price volatility in the Irish potato sector in Kenya. The most important
finding from the descriptive statistics is that the implementation of the market reform policies
provided the Irish potato producers with higher and stable prices and thus incomes. The regression
results indicate that the implementation of market policy reforms lead to a decrease in the Irish
potato price volatility. This suggests that the reforms lead to a reduced price risk for Nyandarua
Irish potato farmers.

88
Overall, the empirical results from the descriptive statistics and regression analysis show that the
implementation of market policy reforms was associated with a higher price level and lower price
volatility for the Irish potato farmers in Nyandarua district. This suggests that the implementation of
market policy reforms led to higher prices and a reduction in price volatility for Nyandarua Irish
potato growers. Therefore, these reforms left the Irish potato producers better off and this served as
an incentive for the farmers to increase production. In conclusion, the market policy reforms were
successful in accomplishing their goals and benefited the Irish potato growers.
5.5. Direction for Future Research
The body of knowledge in the Irish potato sector can be improved by understanding the effects of
market policy reforms on both producers and consumers. This study analyzed the effects of market
policy reforms on producer price level and volatility. There still remains an empirical gap on what
effects the implementation of these policy reforms had on retail price level and volatility. Given that
developing countries like Kenya are faced with the dual challenge of providing stimulative prices to
producers and affordable food prices to the consumers, future studies should evaluate the effects of
agricultural policy reforms on the level and volatility of agricultural commodity prices to both
producers and consumers. The results from such studies will better inform on the appropriate policy
options for the Kenyan agricultural sector.

89
References
Barret, C.B. (1997), “Liberalization and Food Price Distributions: ARCH-M Evidence fromMadagascar”. Food Policy, Vol. 22, No. 2 pp. 155-73.
Barrett, C., Chabari, F., Bailey, D., Little, P., and Coppock, D., (2003).”Livestock Pricing in theNorthern Kenya Rangelands.” Journal of African Economies, Volume 12, Number 2,
Pp.127-155.
Beach, S. L., and Orlov, A. G., (2006). An Application of the Black-Litterman Model withEGARCH-M-Derived Views for International Portfolio Management, Radford University.
Bera, A.K. and Higgins M.L., (1995). On ARCH Models: Properties, Estimation and Testing, inOxley et al. (eds.), Surveys in Econometrics. Blackwell Publishers, Oxford.
Bollerslev, T., (1986), “Generalized Autoregressive Conditional Heteroscedasticity,” Journalof Econometrics, 31, 307–327.
Brewer, E., Carson, J., Elyasiani, E., Mansur, I., and Scott, W., (2005). Interest Rate Risk andEquity Values of Life Insurance Companies: A GARCH-M Approach.
De Groote, H., Kimenju, S., Owour, G., and Wanyama, J., (2006). Market Liberalization andAgricultural Intensification in Kenya. Contributed Paper Presented on the 26th
Conference of the International Association of Agricultural Economics (IAAE), GoldCoast, Australia, August 2006.
Deaton, A. and Laroque G., (1992). On the Behavior of Commodity Prices, Review of EconomicStudies, Vol. 59, pp. 1-23.
Dickey, D.A., and Fuller, W. A., (1979). “Distribution of the Estimators for Autoregressive TimeSeries with a Unit Root.’’ Journal of the American Statistician Association 74(366):427-431.
ECAPAPA, (2005). The Potato and Sweet Potato Sub-Sector Analysis: A Review of Sub-SectorStatus, Constraints, Opportunities and Investment Priorities.
Engle, R.F., (1982).”Autoregressive Conditional Heteroscedasticity with Estimates of theVariance of United Kingdom Inflation.” Econometrica 50:987-1008.
Engle, R.F., (2001). “GARCH 101: The Use of ARCH/GARCH Models in AppliedEconometrics”. Journal of Economic Perspectives, Volume 15, Number 4, Pp 157-168.

90
Engle, R. F., (2003). Risk and Volatility: Econometric Models and Financial Practice. In NobelLecture, December 8, 2003, New York University.
Engle, R.F., and Granger, C.W.J., (1987).”Cointegration and Error Correction Representation,Estimation and Testing.” Econometrica 55:251-276.
Engle, R.F., Lilien, D.M., and Robins, R.P., (1986).”Estimating Time Varying Risk Premia inthe Term Structure. The ARCH-M Model.” Econometrica 55:557-567.
FAO, (2004). Irish potato Post-Harvest System.
FAO, (2008a). FAOSTAT Online Database. Food and Agriculture Organization of the UnitedNations, Available online: http:// faostat.fao.org/.
FAO, (2008b). FAOSTAT Online Database. Food and Agriculture Organization of the UnitedNations, Available online: http:// www.potato2008.org/en/potato/.
Gitu, K.W., (2004). Agricultural Development and Food Security in Kenya: Building a Case forMore Support. A Paper Presented for FAO.
GoK, (1986). Sessional Paper No.1 of 1986 on Economic Management for Renewed Growth.Government Printer, Nairobi. Government of Kenya, Nairobi.
GoK, (2005). Kenya Gazette Supplement No.38 (Legislative Supplement No.22). Government ofKenya, 2006. National Policy on Irish Potato Industry Policy Document, Ministry of
Agriculture. Government of Kenya, Nairobi.
GoK, (2007).Ministry of Agriculture Annual Report, 2007. Government of Kenya, Nairobi.
GoK, (2008). Economic Review of Agriculture. Government of Kenya, Nairobi.
GoK, (2009). National Policy on Potato Industry. Ministry of Agriculture. Government ofKenya, Nairobi.
Green, W.H., (2004). Econometric Analysis. Pearson Education, New York University.
Gujarati, D.N., (2005). Basic Econometrics. Tata McGraw-Hill, New Delhi.
Gujarati, D.N., (2006). Essentials of Econometrics. Tata McGraw-Hill, New York.
Hansen, E., Bruce., (2001). “The New Economics of Structural Change: Dating Breaks in theU.S. Labor Productivity”. Journal of Economic Perspectives, Volume 15, Number 4,Pps.117-128.
Harwood, J., Heifner, R., Coble, K., Perry, J., and Somwaru, A., (1999).”Managing Risk in

91
Farming: Concepts, Research and Analysis.” Agricultural Economic Report No.774Washington DC 20036-5831 March1999.
Höffler, H., and Maingi, G., (2006). Rural-Urban Linkages in Practice: Promoting AgriculturalValue Chains. Promotion of Private Sector Development in Agriculture/ Ministry ofAgriculture, Nairobi, Kenya.
Jaetzold, R., (2006). Natural Conditions and Farm Management Information. Farm ManagementHandbook of Kenya. Central Kenya. Vol. II, 2nd Ed., Nairobi: Ministry of Agriculture.
Jordaan, H., Groove, B., and Alemu, Z. G., (2007). “Measuring the Price Volatility of CertainField Crops in South Africa using the ARCH/GARCH Approach”. Agrecon, Vol. 46,No.3.
Kabira, J.N., (1990). Feasibility of Small Scale production of Solar Dried Irish PotatoFlour and its Potential Food Uses in Kenya, PhD thesis, University of Nairobi.
Kabira, J.N., Walingo, A.M., and Ewell, P.T., (1998). Status of the Irish Potato ProcessingIndustry in Kenya: In proceedings of the 6th KARI Scientific Conference 9-13Nov.1998.
Karanja, A.M., Kuyvenhoven, A., and Moll, H.A.J., (2003). “Economic Reforms and Evolutionof Producer Prices in Kenya: An ARCH-M approach”, African DevelopmentBank, Blackwell, Oxford, pp. 271-96.
Karingi, S. N., and Nyangito, H. O., (2005). Market Liberalization and Agriculture in Kenya. AResearch Report Submitted to the International Food Policy Research Institute (IFPRI)
Eastern Africa Food Policy Network.
Karugia, J.T., Wambugu, S.K., and Kosura, W.O., (2003). The Role of Infrastructure andGovernment Policies in Determining the Efficiency of Kenya’s Maize MarketingSystem in the Post- Liberalization Era. A Research Report Submitted to theInternational Food Policy Research Institute (IFPRI) 2020 Vision Network for EastAfrica.
Karugia, J., Wambugu, S., and Oluoch-Kosura, W., (2005). Post-Liberalization Maize Marketingin Kenya. A Paper Presented for the IFPRI Eastern Africa Food Policy Network,May 2005.
Kilima, F.T. M., Chung, C., Kenkel, P., and Mbiha, E., (2004). The Impact of Market Reformson Spatial Volatility of Maize Price in Tanzania. Selected Paper Prepared forPresentation at the American Agricultural Economics Association Annual Meetings,Denver, Colorado, August 1-4, 2004.
Kirumba, W., Kinyae, P., and Muchara, M., (2004).Promotion of Private Sector Development in
92
Agriculture, Irish Potato Market Survey. GTZ/MoA PSDA 2004.
KNBS, (2006). Kenya Integrated Household and Budget Survey: Ministry of Planning andNational Development.
Lawrence, F., (2004).World Irish Potato Congress, 2004. Regional Report of Irish potatoes inAfrica, World Irish Potato Congress.
MacKinnon, J.G., (1991). Critical Values for Cointegration Tests in R.F. Engle and C.W.Granger (eds.), Long-run Economic Relationships: Readings in Cointegration, OxfordUniversity Press.
Mbogo, S.G., (1976). The Economics of Production and Marketing of Irish Potatoes inMeru District, MSc. Thesis, University of Nairobi.
Mugambi, I.I.M., (1977). The Economics of Potato Storage in Kenya, MSc. Thesis, University ofNairobi.
Ng’ang’a, N.M., (2002). A Marketing Survey of Njabini Location, South Kinangop Division,Nyandarua District. Final Report December 2000-April 2002. FOODNET Project 9.
Nyangito, H.Z.O., (1976). A Socioeconomic Analysis of the Factors that Determine and AffectIrish Potato Post Harvest Practices and Storage Technologies in Kinangop, Kenya.A Case Study, MSc. Thesis, University of Nairobi.
Nyangito, H., Odhiambo, W., and Mwakubo S., (2005). Effects of Market Price Volatility onProduction Patterns and Apparent Retreat into Subsistence Farming by KenyanSmallholders. A Project Policy Brief under the Strategies and Analysis for Growth and
Access (SAGA).
Nzuma, J.M., (2007). An Economic Analysis of the Impacts of Trade Liberalization on Kenya’sMaize Sector, PhD. Thesis, University of Guelph.
Phillips, P.C.B., and Perron, P., (1988). “Testing for a Unit Root in Time Series Regression”.Biomerika, 75:335-346.
Shiverly, E. G., (1986). “Food Price Variability and Economic Reform: An ARCH Approach forGhana”. American Journal of Agricultural Economics, Vol. 78, pp. 126-136.
Shiverly, E. G., (2001). “Price Thresholds, Price Volatility, and the Private Cost of Investment ina Developing Country Grain Market”. Economic Modeling, Vol. 18, pp. 399-414.
Wanzala, M., Jane, T.S., Staatz, J.M., Mugera, A., Kirimi, J., and Owuor, J., (2001).Agricultural Production Incentives: Fertilizer Markets and Insights fromKenya. Tegemeo Institute of Agricultural Policy and Development. Rockefeller

93
Foundation, Nairobi, Kenya.
Wolf, H., (2004). Managing Volatility and Crises: A Practitioner’s Guide: Volatility: Definitionsand Consequences.

94
APPENDIX
Appendix 1: Correlation Matrix for the Explanatory Variables
Time Value of production Season Reforms Lagged Price Sales
Time 1.00
Value of production 0.13 1.00
Season 0.02 0.07 1.00
Reforms -0.78 -0.12 -0.01 1.00
Lagged Price 0.79 0.08 0.01 -0.75 1.00
Sales 0.21 0.21 0.03 -0.37 0.24 1.00
Source: Author’s computation.

95
Appendix 2: Irish Potato Area (Ha) and production (Tones) for the Main Producing Districts in Kenya (1986-2005)
Year Nyandarua Narok Nyeri Molo Meru
Area Prod Area Prod. Area Prod. Area Prod. Area Prod.
1986 12,690 191,760 1,855 60,561 106,092 106,092 8,217 82,170 11,625 107,462
1987 12843 194072 3,000 190,034 106,092 106,092 10,372 107,320 408 4,600
1988 13,000 186,000 2,980 131,150 106,092 106,092 40,396 155,940 14,440 96,240
1989 12,000 156,000 4,300 53,480 106,092 106,092 4,430 35,440 10,260 129,276
1990 11,520 115,200 5,500 108,336 106,092 106,092 5,663 50,967 17,143 143,778
1991 11,800 154,440 4,000 783,900 106,092 106,092 4150 37350 16,075 144,975
1992 1,050 121,550 4,200 623,524 106,092 106,092 4,313 37,955 7840 6272
1993 12,077 99,770 2,500 79,847 106,092 106,092 5,940 48,320 9,921 80,290
1994 12,821 160,263 2815 89907 106,092 106,092 6120 49784 15,072 150,720
1995 15,128 184,850 2287 19,058 106,092 106,092 5487 69505 16,069 160,890
1996 15,093 156,510 2100 26,460 106,092 106,092 7,001 88,684 639 5692
1997 15,139 223,149 3,000 82,342 106,092 106,092 7,843 62,117 861 7,671
1998 13278 195718 2,700 22,710 106,092 106,092 7,864 60,195 760 3,570
1999 14,840 148,400 2,650 92,235 106,092 106,092 10,770 71,028 657 5853
2000 10,160 92,538 3,144 35,050 106,092 106,092 7,845 43,750 19,910 134,340
2001 12,400 925,382 3,620 44,093 106,092 106,092 11,453 93,922 15,730 143,840
2002 13,140 925,382 6,500 42,120
46,980
106,092 106,092 10,030 88,500 16,574 151557
2003 14,120 925,382 7,250 106,092 106,092 12,390 108,250 20,050 190,800
2004 18,000 925,382 9,000 78,840 106,092 106,092 12,310 105,264 19,850 148,550
2005 13,000 925,382 7,569 49,047 106,092 106,092 14,894 125,426 20,150 148,550
Source: Ministry of Agriculture Statistics, 2008

96
Appendix 3: Average Monthly Rainfall (Mm) for Nyandarua District (1986-2005)
YearMonth
January February March April May June July August Sept. October Nov. December
1986 48.1 26.7 103.1 230.8 160.6 47.9 18.3 24.3 20.7 286.4 280 170
1987 154 120.7 192.8 261.6 226 153.5 85.4 70.8 189.7 103.8 407.3 52.7
1988 199.8 73.1 281.1 810.2 181.8 43 155.8 126.5 90 65.8 53.3 80.9
1989 137.6 54.5 89.4 189.5 144.6 87.9 80.8 54.7 137.1 114 105.8 84.7
1990 85.2 47.1 172.2 306.9 156.9 44.4 35.3 39.5 55.5 92.9 98.2 75.4
1991 15.3 10.8 116.5 131.9 220.7 63.1 23.4 60.6 51.1 95.4 59.7 53.2
1992 0 86.3 20.5 269 270.8 105 57.8 47.2 40.2 116 85.5 148.1
1993 127.4 109.1 63.2 55 173.2 110.2 12.1 87.9 50.6 48.5 108.2 52.8
1994 25.8 135.9 173.6 246.1 206 170.2 47.5 27.7 64.5 69.9 218.5 11.7
1995 0 52.9 168 53.6 251.5 91.2 46.5 41.4 47.2 192.7 70.3 74.7
1996 37.7 138.2 140 118.2 132 0 39.2 108.4 52.2 18.9 92 84.6
1997 88.2 0 74 393 79.6 58.6 47 102.8 6.6 244.6 276.6 214.8
1998 79.8 156 67.6 189.3 215.3 31.5 27.8 27.8 51.3 59.5 96.7 13.2
1999 47.2 2.1 170.2 188.1 80.4 30.3 19.7 54.4 101 41.5 167 81.3
2000 0 19.8 46.5 76.9 87.7 21.4 55.3 12.5 48.9 51.2 149.2 90.9
2001 212 34.7 98.8 393 840 21.2 57.3 48.1 43.7 76.6 85.6 14.2
2002 106.3 12.4 171 138.7 202.4 62.8 47.8 23.1 16.7 114.3 188.7 208.5
2003 41 12.8 50.5 302.2 383.3 72.5 38.1 139.2 51.1 118.3 94.4 40.7
2004 103 139.5 77 235.1 148 9.9 21 51.2 100.5 128.5 181.6 91.2
2005 82.9 32.4 141.7 95.5 187.8 61.7 43 50.9 53.2 36.6 71.1 14.2
Source: Ministry of Agriculture, Nyandarua District, 2008

97
Appendix 4: Monthly Irish Potato production (Tones) for Nyandarua District (1986-2005)
January February March April May June July August Sept October Nov. Dec.
1986 10766 12784 10496 7335 18840 14264 24492 15206 14668 19647 22877 20185
1987 7302 4960 7173 3944 14628 18587 21812 17022 16846 23465 7397 12126
1988 8035 4274 5472 9915 15215 23933 22908 16583 18463 25985 24960 10257
1989 4251 6402 7368 3513 9187 14615 21277 23648 28523 31703 2038 3475
1990 3139 4728 5441 2594 6784 10793 15712 17464 21064 23412 1503 2566
1991 4208 6338 7294 3478 9095 14469 21064 23412 28238 31386 2018 3440
1992 12177 10332 10727 1337 2368 4692 6570 5695 14895 14667 19964 18126
1993 2746 4178 3850 2925 4357 8983 17130 19488 21368 11162 1820 1763
1994 5908 7170 6108 4647 10224 13477 28215 29011 33858 15070 2855 3720
1995 6176 3069 8126 1884 16684 22644 44962 33803 11484 8993 7042 10618
1996 10584 8985 9328 1145 2055 4074 5710 4949 12945 12754 17360 15762
1997 27388 19205 16366 12692 14205 23046 32064 14205 14362 16199 26887 6530
1998 23429 16400 13902 6873 13589 23742 22180 17181 10934 12965 18119 4376
1999 5906 3692 4430 7383 18458 32486 13290 22149 22149 7383 5906 5168
2000 9261 14961 12253 13535 9831 17383 13538 9118 7978 5557 9689 8976
2001 25185 16425 18615 6163 7528 6844 16425 22585 19163 12319 12592 20806
2002 43259 10383 8651 5191 7786 15574 10382 15575 24225 15573 19034 34607
2003 21830 21528 15716 21829 48389 19646 39292 19209 6112 4306 4365 7858
2004 3810 12124 17112 2148 5057 19606 46209 32076 16281 9630 7967 14618
2005 7061 2118 3530 8476 12145 22595 36717 14122 21183 25419 19488 11297
Source: MoA, 2008

98
Appendix 5: Market Data Entry Form
Source: MoA, 2008

99
Appendix 6: National Markets Data Entry Form
Source: MoA, 2008

100
Appendix 7: Average Monthly Irish Potato Prices (Ksh/110Kg Bag) for Nyahururu Market 1985-2005
MonthYear Jan Feb Mar April May June July Aug Sept Oct Nov Dec1986 215 130 139 224 245 158 162 124 140 269 165 2291987 155 130 137 150 155 155 165 153 160 217 291 2841988 266 306 324 372 403 400 405 333 396 377 382 2261989 230 150 150 500 240 310 276 158 110 120 130 1501990 220 250 243 236 316 296 289 273 314 346 389 3421991 260 246 326 384 470 220 180 210 228 237 281 2781992 394 399 511 813 658 396 366 384 376 446 603 6351993 571 415 448 534 603 605 676 668 636 722 965 11151994 950 888 1400 1600 1125 450 387 294 516 900 950 9001995 891 809 725 700 500 500 400 400 462 393 400 4901996 553 500 730 750 1033 900 600 550 600 1000 1167 9001997 817 900 1150 2500 2333 1300 550 475 494 725 825 8501998 1000 1200 1288 1400 1400 1450 1250 1097 960 750 735 9251999 900 883 900 973 1021 532 418 432 539 894 856 8922000 557 1246 1089 1104 1515 1556 974 672 463 430 450 6482001 683 558 442 409 684 626 711 763 700 682 1124 5852002 1042 1143 1178 1172 1367 1235 897 897 1008 1083 1086 11282003 933 919 950 950 1517 1300 1010 956 900 1192 1246 12382004 1505 1618 1590 1674 1633 1250 1460 1346 1510 1638 1713 15752005 1340 1279 1456 2018 2266 1259 1035 944 953 1135 1525 1665
Source: Ministry of Agriculture Nyandarua District, 2008


![Interviewee: Lillian Washington 4700.2597 Tape 4549 Interviewer: … · 2017-04-19 · WASHINGTON: [12:20] We had . . . We raised potato, sweet potato, Irish potato, and we didn't](https://img.dokumen.tips/doc/110x75/5f43c4e7cc59596e9652d6d8/interviewee-lillian-washington-47002597-tape-4549-interviewer-2017-04-19-washington.jpg)